


Service Manual
RSA3408B
8 GHz Real-Time Spectrum Analyzer
071-2366-01
This document applies to firmware version 4.0
and above.
Warnin g
The servicing instructions are for use by qualified
personnel only. To avoid personal injury, do not
perform any servicing unless you are qualified to
do so. Refer to all safety summaries prior to
performing service.
www.tektronix.com

Copyright © Tektronix. All rights reserved. L icensed software products are owned by Tektronix or its subsidiaries or
suppliers, and are protected by national copyright laws and i nternational treaty provisions.
Tektronix products are covered by U.S. and foreign patents, issued and pending. Information in this publication supercedes
that in all previously published material. Specifications and price change privileges reserved.
TEKTRONIX and TEK are registered trademarks of Tektronix, Inc.
Contacting Tektronix
Tektronix, Inc.
14200 SW Karl Braun Drive
P.O. Box 500
Beaverton, OR 97077
USA
For product information, sales, service, and technical support:
H In North America, call 1-800-833-9200.
H Worldwide, visit www.tektronix.com to find contacts in your are a.

Warranty 2
Tektronix warrants that this product will be free from defects in materials and workmanship for a period of one (1) year
from the date of shipment. If any such product proves defective during this warranty period, Tektronix, at its option, e ither
will repair the defective product without charge for parts and labor, or will provide a replacement in exchange for the
defective product. Parts, modules and replacement products used by Tektronix for warranty work may be new or
reconditioned to like new performance. All replaced parts, modules and products become the property of Tektronix.
In order to obtain service under this warranty, Customer must notify Tektronix of the defect before the expiration of the
warranty period and make suita ble arrangements for the performance of servic e. Customer shal l be responsible for
packaging and shipping the defective product to the service center designated by Tektronix, with shipping charges prepaid.
Tektronix shall pay for the return of the product to Customer if the shipme nt is to a location within the country in which the
Tektronix service center is located. Customer shall be responsible for paying all shipping charges, duties, taxes, and any
other charges for products returned to any other locations.
This warranty shall not apply to any defect, failure or damage caused by improper use or improper or inadequate
maintenance and care. Tektronix shall not be obligated to furnish service under this warranty a) to repair damage resulting
from attempts by personnel othe r than Tektronix representatives to install, repair or service the product; b) to repair
damage resulting from improper use or c onnection to incompatible equipment; c) to repair any damage or malfunction
caused by the use of non-Tektronix supplies; or d) to service a product that has been modified or integrat ed with other
products when the effect of such modification or integration increases the time or difficulty of servicing the product.
THIS WARRANTY IS GIVEN BY TEKTRONIX WITH RESPECT TO THE PRODUCT IN LIEU OF ANY OTHER
WARRANTIES, EXPRESS OR IMPLIED. TEKTRONIX AND ITS VENDORS DISCLAIM ANY IMPLIED
WARRANTIES OF MERCHANTABILITY OR FITNESS FOR A PARTICULAR PURPOSE. TEKTRONIX’
RESPONSIBILITY TO REPAIR OR REPLACE DEFECTIVE PRODUCTS IS THE SOLE AND EXCLUSIVE REMEDY
PROVIDED TO THE CUSTOMER FOR BREACH OF THIS WARRANTY. TEKTRONIX AND ITS VENDORS WILL
NOT BE LIABLE FOR ANY INDIRECT, SPECIAL, INCIDENTAL, OR CONSEQUENTIAL DAMAGES
IRRESPECTIVE OF WHETHER TEKTRONIX OR THE VENDOR HAS ADV ANCE NOTICE OF THE POSSIBILITY
OF SUCH DAMAGES.


Table of Contents
General Safety Summary vii...................................
Service Safety Summary ix....................................
Preface xi...................................................
Manual Structure xi................................................
Manual Conventions xii..............................................
Related Documentation xii...........................................
Introduction xiii..............................................
Performance Check Interval xiii........................................
Strategy for Servic ing xiii.............................................
Specifications
Theory of Operation
RF Input 2--1.......................................................
Down Converter 2--1.................................................
Digital Signal Processing 2--3..........................................
Power Supply 2--4...................................................
External Interface 2--5................................................
Performance Verification
Adjustment Procedures
Performance Verification Procedures 3--1.........................
Conventions 3--2....................................................
Brief Procedures 3--3...........................................
Functional Tests 3--4.................................................
Diagnostics 3--8.....................................................
Performance Tests 3--9.........................................
Prerequisites 3--10....................................................
Equipment Required 3--10..............................................
Auto Tests 3--12......................................................
Frequency Checks 3--21................................................
Noise Sideband Checks 3--25...........................................
Amplitude Checks 3--28...............................................
Spurious Response Checks 3--40.........................................
Test Record 3--52.....................................................
Requirements for Performance 4--1......................................
Equipment Required 4--2..............................................
Preparation 4--3.....................................................
Self Calibration 4--16..................................................
Auto Calibration 4--20.................................................
Reconfiguration of RF Modules 4--33.....................................
RSA3408B Analyzer Service Manual
i

Table of Contents
Maintenance
Related Maintenance Procedures 5 --1....................................
Preparation 5--2.....................................................
Inspection and Cleaning 5--4...........................................
Removal and Installation Procedures 5--7.........................
Preparation 5--7.....................................................
Access Procedure 5--21................................................
Procedures for External Modules 5--22....................................
Procedures for RF Modules 5--27........................................
Procedures for CPU Board and Disk Modules 5--31..........................
Procedures for Motherboard and Daughterboards 5--41.......................
Procedures for Power Supply Modules on the Instrument Bottom 5--46..........
Procedures for RF1 Modules on the Instrument Bottom 5--51..................
Procedures for Front Panel Modules 5--56.................................
Procedures for Chassis Modules 5--62.....................................
Troubleshooting 5--67...........................................
Troubleshooting Procedure 5--67.........................................
Symptoms and Faulty Modules 5--78.....................................
Required Adjustments After Replacing Modules 5--80.......................
Diagrams
Replaceable Parts List
Parts Ordering Information 7--1.........................................
Using the Replaceable Parts List 7--3....................................
ii
RSA3408B Analyzer Service Manual

List of Figures
Table of Contents
Figure 3--1: Spectrum of the calibration signal (100 MHz, --20 dBm) 3--5
Figure 3--2: Setup display 3--6...................................
Figure 3--3: Reference level setting and Overrange indicator 3--7......
Figure 3--4: Spectrogram display 3--7.............................
Figure 3--5: Diagnostic screen 3--8................................
Figure 3--6: Auto test initial screen 3--12............................
Figure 3--7: Performance test result display 3--16....................
Figure 3--8: Hookup for calibrating the power sensor 3--29............
Figure 3--9: Hookup for setting the signal generator output 3--29.......
Figure 3-- 10: Hookup for checking the absolute amplitude accuracy 3-- 30
Figure 4--1: Hookup for storing the cal factors in the power meter 4--5.
Figure 4--2: Initial test hookup 4--7...............................
Figure 4--3: Hookup for calibrating the power sensor 4--9............
Figure 4--4: Initial test hookup 4--10...............................
Figure 4--5: Hookup for calibrating the power sensor 4--12............
Figure 4--6: UNCAL display 4--16.................................
Figure 4-- 7: Calibration menu 4-- 17...............................
Figure 4--8: Center offset 4--18....................................
Figure 4--9: DC offset 4--19.......................................
Figure 4--10: Auto calibration initial screen 4--20....................
Figure 4--11: Test hookup 4--34...................................
Figure 4--12: Test hookup 4--35...................................
Figure 5-- 1: Analyzer orientation 5-- 11.............................
Figure 5--2: External modules 5--12................................
Figure 5--3: RF modules 5--13....................................
Figure 5--4: CPU board and disk modules 5--14.....................
Figure 5-- 5: Removable hard disk modules (Option 06) 5-- 15..........
Figure 5--6: Motherboard and daughterboards 5--16.................
Figure 5--7: Bottom modules -- Power supply 5--17...................
Figure 5--8: Bottom modules -- RF1 5--18...........................
Figure 5--9: Front panel modules 5--19.............................
Figure 5--10: Chassis modules 5--20...............................
Figure 5-- 11: Guide to removal procedures 5-- 21.....................
Figure 5--12: Line cord and cabinet removal 5--23...................
RSA3408B Analyzer Service Manual
iii

Table of Contents
Figure 5--13: Front cushion removal 5--24..........................
Figure 5--14: Cabinet modules removal 5--26........................
Figure 5--15: RF modules removal 5--29............................
Figure 5--16: CPU board removal 5--32............................
Figure 5--17: Disk module removal 5--34...........................
Figure 5--18: Hard drive cartridge removal 5--37....................
Figure 5--19: Hard disk drive removal 5--38.........................
Figure 5--20: Outside HDD bracket assembly removal 5-- 39...........
Figure 5--21: Disk unit removal 5--40..............................
Figure 5--22: Daughter boards removal 5--43........................
Figure 5--23: Motherboard removal 5--45...........................
Figure 5--24: Power supply 1 and 2 removal 5--47....................
Figure 5 --25: Power supply modules removal 5--49...................
Figure 5--26: RF1 modules removal -- 1 5--52........................
Figure 5--27: RF1 modules removal -- 2 5--54........................
Figure 5--28: Front panel assembly removal 5--57....................
Figure 5--29: Front panel modules removal 5--58....................
Figure 5--30: LCD display removal 5--61...........................
Figure 5--31: Fan and sid e panel removal 5--63......................
Figure 5--32: Board guide bracket removal 5--64.....................
Figure 5--33: Rear panel removal 5--65.............................
Figure 5-- 34: Troubleshooting procedure 1 — Power supply system 5--68
Figure 5--35: Troubleshooting procedure 2 — Display and CPU
system 5--69................................................
Figure 5--36: Troubleshooting procedure 3 — Signal path 5--70........
Figure 5-- 37: Top view of the instrument for cable interconnection 5--75.
Figure 5-- 38: Bottom view the instrument for cable interconnection 5--76
Figure 5--39: A70 DC power supply board 5--78.....................
Figure 6--1: Block diagram 6--3..................................
Figure 6--2: Interconnect diagram 6--5............................
Figure 7--1: External modules 7--5................................
Figure 7-- 2: Front-panel assembly -- 1 7-- 7.........................
Figure 7-- 3: Front-panel assembly -- 2 7-- 9.........................
Figure 7--4: RF modules 7--11....................................
Figure 7--5: Motherboard and daughterboards 7--13.................
Figure 7--6: Disk modules 7--15...................................
Figure 7--7: Disk modules (Option 06) -- 1 7--17......................
iv
RSA3408B Analyzer Service Manual

Table of Contents
Figure 7--8: Disk modules (Option 06) -- 2 7--19......................
Figure 7--9: Bottom modules -- Power supply 7--21...................
Figure 7--10: Bottom modules -- RF1 7--23..........................
Figure 7--11: Chassis modules -- 1 7--25.............................
Figure 7--12: Chassis modules -- 2 7--27............................
Figure 7--13: Rackmount 7--29....................................
RSA3408B Analyzer Service Manual
v

Table of Contents
List of Tables
Table 3--1: Span and RBW 3--6..................................
Table 3--2: Internal diagnostic program 3--8.......................
Table 3--3: Test equipment 3--10..................................
Table 3--4: Test item selection 3--13...............................
Table 3--5: Procedure for failed test item 3--19......................
Table 3--6: Level linearity test result 3--39..........................
Table 3--7: Spurious measurement 3--51...........................
Table 4--1: Test equipment 4-- 2..................................
Table 4--2: Compatibility of the spurious correction file 4--15.........
Table 4--3: Calibration items 4--21................................
Table 5-- 1: Relative susceptibility to static-discharge damage 5--3.....
Table 5--2: External inspection check list 5--5......................
Table 5--3: Internal inspection check list 5--6......................
Table 5--4: Summary of procedures 5--9..........................
Table 5--5: Tools required for module removal 5--10.................
Table 5--6: Normal supply voltages 5--77...........................
Table 5--7: Test point voltages on A70 5-- 78.........................
Table 5--8: Symptoms and faulty modules 5--79.....................
vi
RSA3408B Analyzer Service Manual

General Safety Summary
Review the following safety precautions to avoid injury and prevent damage to
this product or any products connected to it. To avoid potential hazards, use this
product only as specified.
Only qualified personnel should perform service procedures.
To Avoid Fire or
Personal Injury
Use Proper Power Cord. Use only the power cord specified for this product and
certified for the country of use.
Connect and Disconnect Properly. Do not connect or disconnect probes or test
leads while they are connected to a voltage source.
Ground the Product. This product is grounded through the grounding conductor
of the power cord. To avoid electric shock, the grounding conductor must be
connected to earth ground. Before making connections to the input or output
terminals of the product, ensure that the product is properly grounded.
Observe All Terminal Ratings. To avoid fire or shock hazard, observe all ratings
and markings on the product. Consult the product manual for further ratings
information before making connections to the product.
Power Disconnect. The power switch disconnects the product from the power
source. See instructions for the location. Do not block the power switch; it must
remain accessible to the user at all times.
Do Not Operate Without Covers. Do not operate this product with covers or panels
removed.
Avoid Exposed Circuitry. Do not touch exposed connections and components
when power is present.
Do Not Operate With Suspected Failures. If you suspect there is damage to this
product, have it inspected by qualified service personnel.
Do Not Operate in Wet/Damp Conditions.
Do Not Operate in an Explosive Atmosphere.
Keep Product Surfaces Clean and Dry.
Provide Proper Ventilation. Refer to the manual’s installation instructions for
details on installing the product so it has proper ventilation.
RSA3408B Analyzer Service Manual
vii

General Safety Summary
Symbols and Terms
Terms in this Manual. These terms may appear in this manual:
WARNING. Warning statements identify conditions or practices that could result
in injury or loss of life.
CAUTION. Caution statements identify conditions or practices that could result in
damage to this product or other property.
Terms on the Product. These terms may appear on the product:
DANGER indicates an injury hazard immediately accessible as you read the
marking.
WARNING indicates an injury hazard not immediately accessible as you read the
marking.
CAUTION indicates a hazard to property including the product.
Symbols on the Product. The following symbols may appear on the product:
Protective Ground
(Earth) Terminal
CAUTION
Refer to Manual
Mains Disconnected
OFF (Power)
Mains Connected
ON (Power)
viii
RSA3408B Analyzer Service Manual

Service Safety Summary
Only qualified personnel should perform service procedures. Read this Service
Safety Summary and the General Safety Summary before performing any service
procedures.
Do Not Service Alone. Do not perform internal service or adjustments of this
product unless another person capable of rendering first aid and resuscitation is
present.
Disconnect Power. To avoid electric shock, switch off the instrument power, and
then disconnect the power cord from the mains power.
Use Care When Servicing With Power On. Dangerous voltages or currents may
exist in this product. Disconnect power, remove battery (if applicable), and
disconnect test leads before removing protective panels, soldering, or replacing
components.
To avoid electric shock, do not touch exposed connections.
RSA3408B Analyzer Service Manual
ix

Service Safety Summary
x
RSA3408B Analyzer Service Manual

Preface
Manual Structure
This is the service manual for the RSA3408B 8 GHz Real-Time Spectrum
Analyzer. This manual contains information needed to service the analyzer to the
module level.
This manual is divided into sections, such as Specifications and Theory of
Operation. Further, some sections are divided into subsections, such as
Product Description and Removal and Installation Procedures.
Sections containing procedures also contain introductions to those procedures.
Be sure to read these introductions because they provide information needed to
do the service correctly and efficiently. The manual section name and a brief
description of each is given below.
H Specifications contains a statement referring you to the RSA3408B Technical
Reference.
H Theory of Operation contains circuit descriptions that support service to the
module level.
H Performance Verification contains procedures for confirming that the
analyzer functions properly and meets warranted limits.
H Adjustment Procedures contains procedures for adjusting the analyzer to
meet warranted limits.
H Maintenance contains information and procedures for performing preventive
and corrective maintenance of the analyzer. These instructions include
cleaning, module removal and installation, and fault isolation to the module.
H Diagrams contains a block diagram and an interconnection diagram.
H Replaceable Parts List includes a table of all replaceable modules, their
descriptions, and their Tektronix part numbers.
RSA3408B Analyzer Service Manual
xi

Preface
Manual Conventions
This manual uses certain conventions that you should become familiar with.
Some sections of the manual contain procedures for you to perform. To keep
those instructions clear and consistent, this manual uses the following conventions:
H Names of front panel controls and menus appear in the same case (initial
capital) in the manual as is used on the analyzer front panel and menus;
for example, Span, Trig, and Select.
H Instruction steps are numbered unless there is only one step.
Modules
Safety
Related Documentation
Throughout this manual, any replaceable component, assembly, or part of the
analyzer is referred to generically as a module. In general, a module is an
assembly (like a circuit board), rather than a component (like a resistor or an
integrated circuit). Sometimes a single component is a m odule; for example, the
chassis of the analyzer is a module.
Symbols and terms related to safety appear in the Safety Summary near the
beginning of this manual.
Other documentation for the RSA3408B analyzer includes:
H The RSA3408B User Manual contains a tutorial to quickly describe how to
operate the analyzer. It also includes an in-depth discussion on how to more
completely use the analyzer features.
H The RSA3000B Series Programmer Manual explains how to use the GPIB
interface to remotely control the analyzer.
xii
RSA3408B Analyzer Service Manual

Introduction
This manual contains information needed to properly service the RSA3408B
8 GHz Real-Time Spectrum Analyzer as well as general information critical to
safe and effective servicing.
To prevent personal injury or damage to the analyzer, consider the following
before attempting service:
H The procedures in this manual should be performed only by a qualified
service person.
H Read the General Safety Summary and the Service Safety Summary,
beginning on page vii.
H Read the RSA3408B User Manual (Tektronix part number 071-2364-xx) for
operating information.
When using this manual for servicing, be sure to follow all warnings, cautions,
and notes.
Performance Check Interval
Strategy for Servicing
Generally, the performance check described in section 3, Performance Verification, should be done every 12 months. In addition, performance check is
recommended after module replacement.
If the analyzer does not meet performance criteria, repair is necessary.
Throughout this manual, the term “module” refers to any field-replaceable
component, assembly, or part of the analyzer.
This manual contains all the information needed for periodic maintenance of the
analyzer. (Examples of such information are procedures for checking performance.)
Further, it contains all i nformation for corrective maintenance down to the
module level. To isolate a failure to a module, use the fault isolation procedures
found in Troubleshooting, part of section 5, Maintenance. To remove and replace
any failed module, follow the instructions in Removal and Installation Proce-
dures, also part of section 5. After isolating a faulty module, replace it with a
fully-tested module obtained from the factory. Section 7, Replaceable Parts List,
contains part number and ordering information for all replaceable modules.
RSA3408B Analyzer Service Manual
xiii

Introduction
xiv
RSA3408B Analyzer Service Manual

Specifications
The specifications for this instrument are available on the Documents CD
(Tektronix part number 063-4089-xx) that shipped with your product.
Look for the RSA3408B 8 GHz Real-Time Spectrum Analyzer Specifications and
Performance Verification Technical Reference PDF (Tektronix part number
071-2480-xx), available on this disk. F or the most current documentation, refer
to the Tektronix Web site (www.tektronix.com).
RSA3408B Analyzer Service Manual
1- 1

Specifications
1- 2
RSA3408B Analyzer Service Manual

Theory of Operation
This section describes the electrical operation of the RSA3408B analyzer using
the major circuit blocks or modules shown in Figure 6--1 on page 6--3.
RF Input
The RF input circuit block consists of a relay for signal switching (Input Relay),
Step Attenuator, P rogrammable Bandpass F ilter, and a control circuit for these
components. This block adjusts the level of input signal as appropriate in
accordance with reference level settings, and sends the signal to the 1
Input Relay located just after the RF INPUT connector is for calibration signal
switching. It switches t o pass the internal calibration signal when self gain-calibration or IF flatness calibration is selected. The step attenuator that follows is a
programmable attenuator of 5 dB/step. It attenuates an input signal up to 55 dB .
Band Relay switches signal paths between the RF1 band and the RF2/RF3 band.
In the RF2 and RF3 bands, bandwidth of the signal is limited by the Programmable Bandpass Filter (BPF) to avoid occurrence of images and/or spurious
signals. This Programmable BPF is able to adjust its center frequency in the
range of 3.5 GHz to 8 GHz, and adjustment to the center frequency is achieved
with the current output from the A100 Cal Generator board. In a same way, the
attenuator and relays are controlled with currents from the A100 board.
st
converter.
On the A100 Cal Generator board, various components are installed, such as: a
group of registers to save the setup data from Hardware Controller, driver
circuits for attenuator and relays, D/A converter circuit for generation of tuning
current to Programmable BPF, ALC circuit to maintain the amplitude of the
calibration signal at a constant level, IQ modulator for IF flatness calibration,
and other components.
Down Converter
RF3 Module
RSA3408B Analyzer Service Manual
The RF3 module contains the 1stConverter, 1stLocal Oscillator, 1stIF Amplifier, and other components. After level adjustment in the RF input circuit, the
input signal is applied to the 1
signal is frequency-converted into 1
Oscillation frequency of 1
(RF4 module) in this case, so that 1
mately 4231 MHz. After this, the 1
Amplifier that has a gain of approximately 17 dB, and is sent to the 2
Converter (RF2 module).
st
Converter. Mixed with 1stLO signal, the input
st
st
Local Oscillator is controlled with a synthesizer
IF signal of approximately 4231 MHz.
st
IF signal is always maintained at approxi-
st
IF signal passes through the 1stIF
nd
2- 1

Theory of Operation
st
In the baseband, an input signal enters the 1
Converter. Then the signal path i s
switched with a relay and the signal is sent directly to the A10 A/D board for
A/D conversion. In the RF1 band, an input signal goes through all converters
st,2nd
(1
frequency-converted by the 1
421 MHz, then sent directly to the 3
, and 3rd). In the RF2 and RF3 bands, an input signal is directly
st
Converter into the 2ndIF signal of approximately
rd
Converter, bypassing the 2ndConverter.
RF2 Module
RF5 Module
The RF2 module consists of the 2
st
Oscillator (LO). The 1
IF signal sent from the 1stConverter passes through a
nd
Converter, 2ndIF Filter, and 2ndLocal
Bandpass Filter and a Lowpass Filter for removal of unnecessary frequency
bands. After this, the 1
st
the 1
the 2
IF signal is mixed with the 2ndLO signal and frequency-converted into
nd
IF signal of approximately 421 MHz.
st
IF signal enters the 2ndConverter. In the 2ndConverter,
Thesameistrueof1stLO; the 2ndLO frequency is controlled by a synthesizer
nd
circuit (RF4 module) to stabilize the LO output frequency. The 2
nd
sent to the 2
IF Filter, which has two filters with the pass bandwidth of
IF signal is
40 MHz and 4 MHz, respectively.
The RF5 module consists of the 3
rd
converter, the signal is mixed with the 3rdLO signal and then frequency-con-
3
verted into the 3
rd
IF signal of 76 MHz normally, which is changed to 39 MHz in
rd
Converter and the 3rdIF Gain block. In the
an ACLR measurement with the sweep mode. In the RF2 and RF3 bands, the 2
IF signal from the RF2 module enters the band switching relay i n the input
rd
section of the 3
Converter.
The 3rdIF Gain block consists of a Step Amplifier of 12 dB/step with the
maximum gain of 60 dB and a Step Attenuator with the maximum attenuation of
rd
31 dB. This block maintains t he 3
IF signal to be sent to A/D Converter at an
appropriate level, and adjusts the accuracy of conversion gain.
nd
2- 2
RF6 Module
The RF6 module consists of the 3
10 MHz Reference Oscillator. The 3
rd
IF Filter block, Oscillator block, and
rd
IF signal enters the 3rdIF Filter containing
two filters with the pass bandwidth of 40 MHz for 76 MHz IF and 1.2 MHz for
38 MHz IF, respectively, which are software-selectable.
The Oscillator block contains the 3
rd
local oscillator with the local frequency of
345 MHz for 76 MHz IF or 383 MHz for 38 MHz IF, and A/D clock with the
rd
clock frequency of 102.4 MHz. Both the 3
LO signal and A/D clock signal
generated in the Oscillator block are highly stabilized signals locked with a
rd
10 MHz reference signal, and are output to the 3
Converter and A10 A/D
board, respectively.
RSA3408B Analyzer Service Manual

Theory of Operation
The 10 MHz Reference Oscillator is configured around an OCXO (Oven
Controlled Crystal Oscillator) with extremely high frequency stability. It is used
as the reference clock source for all the oscillators including the frequency
synthesizer circuits. Circuits such as the input circuit of external 10 MHz
reference signal, internal/external reference switching circuit, and 10 MHz
reference output circuit are also contained in the RF6 module.
RF4 Module
The RF4 module is comprised of synthesizer circuits. The synthesizer consists of
multiple PLL Oscillator units of low noise type locked with the 10 MHz
reference signal. By changing the oscillation frequency of these PLL Oscillator
in fine steps, 1
while maintaining a good level of C/N.
The synthesizer also contains a circuit for generation of a 400 MHz signal to be
used as the reference for the calibration signal, PLL circuitry of the 2
Oscillator, a circuit for generation of DDS signal to be used as the reference
signal for the 3
Digital Signal Processing
A10 A/D Board
Analog signals such as the IF signal sent from the Down Converter block are
converted into digital format with a high-speed, high-accuracy A/D converter,
and sent to the A42 DIFP board via the A50 Mother board. The A/D board
contains input circuits for three analog signals: IF signal, baseband signal, and
external IQ signal (optional). Each input circuit is equipped with a B uffer
Amplifier, a Step Amplifier, and a Step Attenuator to maintain the signal level as
appropriate, as well as a Lowpass Filter for removal of signal components within
unnecessary frequency bands.
st
LO frequency can be tuned in the range of 4 GHz to 8 GHz
nd
rd
Local Oscillator, and other components.
Local
A42 DIFP Board
RSA3408B Analyzer Service Manual
The A42 DIFP (Digital Intermediate Frequency Processor) board consists of an
IQ Splitter, Digital Filters, Trigger Detector, Acquisition Memory, DPX (Digital
Phosphor) Processor, and Pixel Buffer Memory. After being converted into
digital format in the A10 A/D board, the input signal is split into I and Q signals
by the IQ Splitter. At the same time, I/Q signals are frequency-shifted so that
each of them occupies a frequency band centered at frequency zero point (DC).
I/Q signals output from IQ Splitter are sent to the Digital Filters. In these filters,
bandwidth of these signals is limited corresponding with span settings. In
addition, re-sampling is performed to achieve the higher frequency resolution.
I/Q signals output from the Digital Filters are sent t o the Trigger Detector and
Acquisition Memory.
2- 3

Theory of Operation
The Trigger Detector achieves real-time frequency trigger function. When the
Frequency Mask Trigger function is activated, window function operation is
executed to the input signal first. To accelerate the operation, data are divided
into two groups: the odd frame data and the even frame data. With pipeline-connected FFT processors, real-time FFT is applied t o these groups of data. After
being converted into frequency domain, the data are further converted into the
power domain with a pipeline-connected quadrature-to-polar coordinates
converter. After comparison with the reference data, the trigger board outputs the
trigger detect signal. When the Power Trigger function is activated, window
function operation and FF T operation mentioned above are bypassed. The data of
the time domain are converted into the power domain and sent to Trigger
Comparator .
The Acquisition Memory saves time domain data separated into I and Q signals.
The A42 DIFP board also interfaces between the data block and Microsoft
Windows system. I/Q data output from the digital filter is saved to the dual port
SRAM, and then transferred to SDRAM as a block of data. The memory block
of SDRAM is also connected to the PCI local bus via a different dual port
SRAM. This allows the Windows system to refer to the contents copied to this
dual port SRAM as the data on the PCI memory space. The TRIG IN and OUT
connectors located on the rear panel are connected with this board. An external
trigger signal input is used, in addition, as the timing reference signal for the
address controller. The A42 board also contains a microprocessor that controls
various software settings and various types of hardware as well as peripheral
devices such as ROM/RAM.
Power Supply
Power Supply 1 and 2
In the DPX spectrum mode, time-domain data from the digital down converter
goes to the proprietary DPX processor that performs real-time FFT over 50,000
times per second. The spectrum traces are accumulated in the pixel buffer
memory, where a counter is incremented each time a trace writes to a point on
the display. A color is assigned to each display point based on the value of its
counter. Thus, as acquisitions occur over time, a color-graded waveform, the
Bitmap, develops on the display that shows the frequency of data occurrence
(signal density).
The power supply circuit consists of two units of AC/DC Converter (Power
Supply 1 and 2) energized from AC power line, and A70 DC power board,
which regulates the output voltages of AC/DC converter units and distributes the
regulated outputs to each of the boards and fans.
Note that P ower Supply 1 and 2 units have different output voltage specifications. The Power Supply 1 output voltages are +5 V / +15 V / --15 V / +24 V; the
Power Supply 2 output voltages are +5 V / +12 V / --12 V / +3.3 V.
2- 4
RSA3408B Analyzer Service Manual

Theory of Operation
A70 DC Power Board
Standby Power and
On/Standby Switch
A50 Mother Board
The A70 DC Power board is equipped with multiple DC/DC converters, and
based upon the output voltages supplied by the Power Supply 1 and 2 units,
power voltages other than above are generated on this board. On the A70 DC
Power board, LED indicators and test points are provided to facilitate checking
that all the power supply voltages are output normally.
Power Supply 3 is the standby power supply unit which continuously supplies
power to some areas of the CPU board and the 10 MHz Reference Oscillator
even if the Power Switch on the main unit is turned off (standby mode). Unless
the Principal Power Switch (located on the rear panel) is turned off, Power
Supply 3 continues to output power voltages. Because of this, remove AC power
before opening the enclosure to service inside the unit.
The Standby Power Supply always maintains the ACP I (power control) function
for the CPU board to be active. With this function, the CPU board recognizes the
On status of the On/Standby Switch even in t he power-off condition and is able
to output the power-on signal to Power Supply 1 and 2 units. To enable accurate
high frequency measurements just after power-on, power is also supplied to the
10 MHz Oscillator (OCXO) from Standby Power Supply unit.
The A50 Mother board distributes power to all boards and modules, as well as
interfacing of control signals and data with the CPU. Other devices such as the
PCI Bridge, Local Bus Controller, GPIB Control Circuit, and Bus Buffer for
CPU bus expansion are also on the A50 Mother board.
External Interface
A60 Front Key Board
A62 Front Connection
Board
RSA3408B Analyzer Service Manual
A microprocessor for key control is installed on the A60 Front Key board.
Various processes such as serial conversion of key scan, key code, and signal
transmission to the CPU board are performed on this board.
The A62 Front Connection board interfaces with peripheral devices such as hard
disk drive, floppy disk drive, LCD (Liquid Crystal Display), USB, and keys with
the CPU board.
2- 5

Theory of Operation
2- 6
RSA3408B Analyzer Service Manual

Performance Verification Procedures
Two types of Performance Verification procedures can be performed on this
product; Brief Procedures and Performance Tests. You may not need to perform
all of these procedures, depending on what you want to accomplish.
H To rapidly confirm that the analyzer functions properly and was adjusted
properly, do the brief procedures under Functional Tests and Diagnostics,
which begin on page 3--3.
Advantages: These procedures are quick to do, require no external
equipment or signal sources, and perform functional and accuracy testing to
provide high confidence that the analyzer will perform properly. They can be
used as a quick check before making a series of important measurements.
H If more extensive confirmation of performance is desired, do the Perfor-
mance Tests, beginning on page 3--9, after doing the Functional Tests and
Diagnostics just referenced.
Advantages: These procedures add direct checking of warranted specifications.
Disadvantages: They require more time to perform and suitable test
equipment is required. (Refer to Equipment Required on page 3--10.)
RSA3408B Analyzer Service Manual
3- 1

Performance Verification Procedures
Conventions
Throughout these procedures, the following conventions apply:
H Each test procedure uses the following general format:
H Each procedure consists of as many steps, substeps, and subparts as required
1. First Step
Title of Test
Equipment Required
Prerequisites
Procedure
to do the test. S t eps, substeps, and subparts are sequenced as follows:
a. First Substep
H First Subpart
H Second Subpart
b. Second Substep
2. Second Step
H Instructions for menu selection follow this format:
Front Panel Key > Side Menu Key > Submenu Key.
For example, “Press Mode: Demod > Digital Demod > Constellation”.
“Mode: Demod” indicates the Demod key in the Mode menu area on the
front panel.
H In steps and substeps, the lead-in statement in italics tells you what to do,
and the instructions that follow tell you how to do it.
The example step below i s telling you to set the analyzer controls by
pressing the specified key sequence.
Set the RSA3408B analyzer controls:
Press Mode: Demod > Digital Demod > Constellation.
STOP. “STOP” is accompanied by information you must read to do the
procedure properly.
3- 2
RSA3408B Analyzer Service Manual

Brief Procedures
The Functional Tests use the internal calibration signal as a test-signal source for
further verifying that the analyzer functions properly.
The Diagnostics use internal routines to verify that the instrument functions
properly and passes the internal circuit tests.
The Functional Tests begin on page 3--4 and the Diagnostics procedures are on
page 3--8.
RSA3408B Analyzer Service Manual
3- 3

Brief Procedures
Functional Tests
The analyzer has a built-in calibration signal source with an amplitude of
approximately --20 dBm and frequency of 100 MHz. Using this source, perform
this quick functional check to verify that your instrument is operating correctly.
Equipment
Required
Prerequisites Power on the analyzer and allow a 20 minute warm-up before doing
1. Initialize the analyzer:
a. Press the System key on the front panel.
b. Press the Reset All to Factory Defaults side key.
2. Check the system version and options:
a. Press the System key on the front panel.
b. Press the Versions and Installed Options... side key.
c. Check the version in the “Main System” field and the options in the
option table.
3. Check the display brightness:
a. Press the Cancel--Back (top) side key.
b. Press the Display Brightness side key.
None
this procedure.
3- 4
c. Change the value from 0 to 100% using the general purpose knob to
check that the brightness changes normally.
4. Display spectrum of the calibration signal:
a. Press S/A > Spectrum Analyzer.
b. Press the Preset key on the front panel to reset the analyzer.
c. Press Input > Signal Input Port... > Cal100M.
The spectrum of the calibration signal appears.
d. Check that “INPUT: CAL” and “FREE RUN” are displayed in the status
indicator at the upper right of the screen (see Figure 3--1).
RSA3408B Analyzer Service Manual

Status indicator
Brief Procedures
Marker readout
Marker
Figure 3- 1: Spectrum of the calibration signal (100 MHz, - 20 dBm)
5. Check the center frequency and peak amplitude using the marker:
a. Press the Peak key on the front panel to place the marker on the peak
(see Figure 3--1).
6. Check the RBW (Resolution Bandwidth) while changing the span setting.
RSA3408B Analyzer Service Manual
b. Check the marker readouts on screen. The frequency should be 100 MHz
and the amplitude should be approximately --20 dBm.
c. Press Marker Setup > Markers > Off.
Check that the marker disappears.
a. Press the Span key on the front panel.
b. Confirm that the span is 36 MHz and the RBW is 100 kHz in the setup
display on t he upper part of the screen (see Figure 3--2).
3- 5

Brief Procedures
Setup display
Span RBW
Span setting
Figure 3- 2: Setup display
c. Using the general purpose knob, change the span setting as listed in
Table 3-- 1 and check that the RBW is displayed correctly.
Table 3- 1: Span and RBW
Span RBW
36 MHz 100 kHz
15 MHz 80 kHz
5MHz 20 kHz
100 kHz 500 Hz
1kHz 20 Hz
d. Using the numeric keypad, set the span back to 36 MHz.
(Press 3 > 6 > MHz, in that order, on the keypad.)
7. Check the reference level:
a. Press the Amplitude key on the front panel.
b. Make sure that the reference level is set to 0 dBm with the Ref Level
side key. C heck that 0 dBm is displayed on the upper left side of the
graticule (see Figure 3--3).
c. Use the general purpose knob to set the reference level to --30 dBm.
d. Confirm that “Overrange -- increase RefLev or Atten” is indicated in the
red box at the top center of the screen. Make sure that --30 dBm is
displayed on the upper left side of the graticule and that the spectrum
waveform is distorted as shown in Figure 3--3.
e. Using the numeric keypad, set the reference level back to 0 dBm.
(Press 0 > Enter, in that order, on the keypad.)
3- 6
RSA3408B Analyzer Service Manual

Reference level
Brief Procedures
Overrange indicator Reference level setting
Figure 3- 3: Reference level setting and Overrange indicator
Spectrogram
8. Check the spectrogram display:
a. Press S/A > S/A with Spectrogram. Check that the spectrogram is
displayed on the lower side of the screen (see Figure 3--4).
Figure 3- 4: Spectrogram display
RSA3408B Analyzer Service Manual
b. Press the Run/Stop key on the front panel to stop data acquisition.
Confirm that the trace display freezes and PAUSE is displayed in the
status indicator at the top right of the screen.
3- 7

Brief Procedures
Diagnostics
You can run the internal diagnostic program to check hardware states.
Table 3--2 shows the test items and their descriptions.
Table 3- 2: Internal diagnostic program
Menu item Description Possible failure
Temp Sensor Checks that the temperature sensor works correctly. RF5 module
Data Memory Checks that the acquisition memory works correctly . A40 board
DPX SRAM Checks that the DPX SRAM works correctly. A42 board
The process is
graphically displayed
on the upper views.
Equipment
Required
Prerequisites Power on the analyzer and allow a 20 minute warm-up before doing
None
this procedure.
1. Press Cal > Service... > Password.
2. Enter 270833 andthenpresstheEnter key on the numeric keypad.
3. Press the DIAG side key.
4. Select the diagnostic menu item to be executed.
You can press the All side key to run all the tests.
5. Check the result shown in the lower left view (“Pass” or “Fail”).
3- 8
Figure 3- 5: Diagnostic screen
RSA3408B Analyzer Service Manual

Performance Tests
This section contains procedures for checking that the RSA3408B 8 GHz
Real-Time Spectrum Analyzer performs as warranted.
The procedures are arranged in five logical groupings:
H Auto Tests
H Frequency Checks
H Noise Sideband Checks
H Amplitude Checks
H Spurious Response Checks
They check all the characteristics that are designated as checked in Chapter 1,
Specifications. (The characteristics that are checked appear with the n symbol in
the Characteristics column in Chapter 1.) You can use the form at the end of this
section as a test record.
Read Performance Verification Procedures on page 3 --1 and 4--2. Also, if you are
not familiar with operating this analyzer, read the RSA3408B User Manual
before doing any of these procedures.
NOTE. These procedures extend the confidence level provided by the brief
procedures described on page 3--3. Perform the brief procedures first and then
perform the following procedures if desired.
RSA3408B Analyzer Service Manual
3- 9

Performance Tests
Prerequisites
The tests in this section make up an extensive, valid confirmation of performance
and functionality when the following requirements are met:
H The cabinet must be installed on the analyzer.
H The instrument must have passed the procedures under Brief Procedures
found on page 3--3.
H A signal-path compensation must have been done within the recommended
calibration interval and at a temperature within ±3 _C of the present
operating temperature. (If at the time you did the prerequisite Brief Proce-
dures, the temperature was within the limits just stated, consider this
prerequisite met.)
H The analyzer must have been last adjusted at an ambient temperature
between +20 _C and +30 _C, must have been operating for a warm-up
period of at least 20 minutes, and must be operating at an ambient temperature of between +10 _C and +40 _C.
H The SG flatness/spurious floppy disk(s) (Item 16 in Table 3--3) must be
prepared. For the procedure to create or update the flatness and spurious
correction files, refer to Making Flatness Correction Files on page 4--6 and
Making Spurious Correction Files on page 4--13.
Equipment Required
These procedures use external, traceable signal sources to directly check
warranted characteristics. Table 3--3 shows the required equipment.
Table 3- 3: Test equipment
Item number and
description
1. Signal generator Frequency range: 10 kHz to 3.5 GHz;
2. Signal generator Frequency range: 10 MHz to 8 GHz;
3. Signal generator Frequency range: 1 MHz to 8 GHz;
Minimum requirements Example Purpose
V ariable amplitude from --70 dBm to
+13 dBm into 50 Ω;
Accuracy: <±1 dB; Function: FM
Output level: --30 dBm to +10 dBm;
Accuracy: <±1dB
Output level: --30 dBm to +10 dBm;
Accuracy: <±1dB
Agilent 8648D Checking flatness in
baseband and RF1
Agilent 83712B with
option 1E1
Agilent E8257D with
option 1E1 (option UNX
recommended)
Checking flatness in
RF2 and RF3
Checking flatness in all bands
3- 10
RSA3408B Analyzer Service Manual

Table 3- 3: Test equipment (Cont.)
Item number and
description
Performance Tests
PurposeExampleMinimum requirements
4. Signal generator Frequency: 2 GHz; Output:
≥--10 dBm; Digital modulation: QPSK;
Symbol rate: 4.096 MS/s
5. Spectrum analyzer Frequency: >8 GHz;
Display scale fidelity: <±0.13 dB
6. Frequency counter Frequency range: 10 MHz;
Aging rate: <5×10
Accuracy: <0.01 ppm at 10 MHz
7. RF power meter 1MHzto8GHz Agilent E4418B Adjusting the signal generator
8. RF power sensor 10 MHz to 8 GHz; RF Flatness: <3%;
Uncertainty of calibration factor data:
<2% (RSS)
9. Power combiner Range: 500 MHz to 2 GHz; Isolation:
>18 dB; Insertion loss: <1.0 dB
10. BNC cable 50 Ω, 36 in, male-to-male BNC
connectors
11. N-N cable 50 Ω, 36 in, male-to-male N
connectors
12. N-SMA cable
(Three required)
13. GPIB cable
(Two required)
14. RF attenuator Ratio: 10 dB; impedance 50 Ω;
15. Terminator Impedance: 50 Ω; connectors: female
16. SG flatness/spurious
floppy disk (for each
signal generator used)
17. Mouse USB Standard accessary File operation
18. Keyboard USB Standard accessary File operation
50 Ω, 36 in, male N-to-male SMA
connectors
2m, double-shielded Tektronix part number
Bandwidth: >8 GHz
BNC input, male BNC output
Created or updated with the
procedures described on pages 4--6
and 4--13
-- 1 0
/day;
Rohde & Schwarz SMIQ03B
Agilent E4438C
Agilent E4440A Checking level linearity
Agilent 53132A with
option 010
Agilent E4412A Adjusting the signal generator
Mini-Circuits ZAPD-21 Checking intermodulation
Tektronix part number
012-1341-XX
012-0991-XX
Inmet 18N--10
Mini-Circuits BW--S10W2
Tektronix part number
011-0049-01
3.5 inch, 720 K or 1.44 MB,
DOS-compatible floppy disk
Checking intermodulation
distortion
Checking the reference output frequency accuracy
output level
output level
distortion
Signal interconnection
Signal interconnection
Signal interconnection
Software-based tests
Checking flatness
Signal termination for checking frequency accuracy
Storing flatness and spurious
correction data for the signal
generators (Items 1, 2, and 3)
RSA3408B Analyzer Service Manual
3- 11

Performance Tests
Auto Tests
The auto tests use internal routines to verify specifications for the following
characteristics:
H Baseband flatness
H IF flatness
H RF flatness
H Spurious response
Use the service PV menu and procedure described below to set parameters and
perform the tests.
Service PV Menu
Selects the PV (performance verification) test items and bands. Access this menu
by pressing Cal > Service... > Password (270833) > PV (see Figure 3--6).
3- 12
Figure 3- 6: Auto test initial screen
The PV menu has the following controls:
PV Select. Selects the test items as shown in Table 3--4.
RSA3408B Analyzer Service Manual

Performance Tests
Table 3- 4: Test item selection
PV Select
Test item All Spurious Other
Baseband flatness ✓ ✓
IF flatness ✓ ✓
RF flatness ✓ ✓
Spurious response ✓ ✓
NOTE. It takes several hours to perform the spurious test.
All Band. Performs the tests in all bands (Baseband, RF1, RF2, and RF3).
Measurement bandwidth: 1 MHz to 8 GHz
BB. Performs the tests in the baseband.
Measurement bandwidth: 1 MHz to 40 MHz
RF1. P erforms t he tests in the RF1 band.
Measurement bandwidth: 40 MHz to 3.5 GHz
BB+RF1. P erforms the tests in the baseband and RF1 band.
Measurement bandwidth: 1 MHz to 3.5 GHz
RF2+RF3. Performs the tests i n the RF 2 and RF3 band.
Measurement bandwidth: 3.5 GHz to 8 GHz
RF1+RF2+RF3. Performs the tests in the RF1, RF 2, and R F3 band.
Measurement bandwidth: 40 MHz to 8 GHz
Config... Sets the signal generator manufacturer and the GPIB address.
H SG Type. Selects the manufacturer of the generator for the GPIB command
system: HP or Anritsu.
NOTE. The HP setting also supports Agilent and Rohde & Schwarz products.
H GPIB Address. Sets the GPIB address of the generator.
RSA3408B Analyzer Service Manual
3- 13

Performance Tests
STOP. Select either of these two procedures, depending on the signal generator(s) you use:
H Procedure 1 below:
Uses one signal generator, Item 3 that covers all measurement bands
(Baseband, RF1, RF2, and RF3).
H Procedure 2 on page 3--16:
Uses two signal generators: Item 1 that covers the baseband and RF1 band
and Item 2 that covers the RF2 and RF3 bands.
Procedure 1
Performs the auto tests using one signal generator (Item 3) that covers all
measurement bands (Baseband, RF1, RF2, and RF3).
Equipment
Required
Prerequisites Refer to page 3--10
One signal generator (Item 3)
One 50 Ω N-N coaxial cable (Item 11)
One 10 dB attenuator (Item 14)
One GPIB cable (Item 13)
One SG flatness floppy disk (Item 16)
1. Prepare for the test: See the following figure for the hookup.
RSA3408B
Signal generator
GPIB cable
3- 14
Output
10 dB attenuator
50 Ω N-N coaxial cable
RSA3408B Analyzer Service Manual

Performance Tests
a. Power off the RSA3408B analyzer and the signal generator.
b. Connect the analyzer and the generator with a GPIB cable.
c. Connect the analyzer Input through a 10 dB attenuator followed by a
50 Ω N-N coaxial cable to the generator output.
d. Power on the analyzer and the generator.
e. Set the GPIB address of the generator, ranging from 1 to 30.
f. Insert the SG flatness floppy disk (Item 16) for the generator to the
floppy disk drive of the analyzer.
2. Perform the self calibration: Press Cal > Calibrate All.
3. Enter the PV menu:
a. Press Service... > Password in the CAL menu.
b. Enter 270833 andthenpressEnter using the numeric keypad.
c. Press the PV side key.
d. Set the GPIB address of the generator:
H Press the Config... side key.
H Press the SG Type side key to select the manufacturer of the
generator for the GPIB command system: HP or Anritsu.
H Press the SG Address side key and set the generator address.
H Press the Cancel--Back side key.
4. Perform the tests in all bands:
Press the All Band side key to perform the tests.
NOTE. You can select the test items and bands as described in Service PV Menu
on page 3--12.
5. Check the test results:
Check the Pass/Fail results displayed on the lower left of the screen
(see Figure 3--7).
If any tests fail, go to When the Auto Tests Fail on page 3--19.
RSA3408B Analyzer Service Manual
3- 15

Performance Tests
Procedure 2
Figure 3- 7: Performance test result display
6. Disconnect the test equipment:
a. Disconnect the cable from the analyzer input.
b. Turn off the analyzer and generators.
c. Disconnect the GPIB cables from all the ports.
Performs the auto tests using two signal generators, Item 1 that covers the
baseband and RF1 band and Item 2 that covers the RF2 and RF3 bands.
Equipment
Required
Prerequisites Refer to page 3--10
Two signal generators (Items 1 and 2)
One 50 Ω N-N coaxial cable (Item 11)
One 10 dB attenuator (Item 14)
One GPIB cable (Item 13, two required)
One SG flatness floppy disk (Item 16, two required)
3- 16
RSA3408B Analyzer Service Manual

1. Prepare for the test:
Hook up the equipment as shown in the following figure.
Signal generator (Item 1)Signal generator (Item 2)
GPIB cable
GPIB cable
Performance Tests
RSA3408B
Output
50 Ω N-N coaxial cable
10 dB attenuator
a. Power off the analyzer and the signal generators.
b. Connect the analyzer and the generators with GPIB cables.
c. Connect the analyzer Input through a 10 dB attenuator followed by a
50 Ω N-N coaxial cable to the generator (Item 1) output.
d. Power on the analyzer and the generators.
e. Set the GPIB address of the generators, ranging from 1 to 30.
Assign a unique address to each instrument.
f. Insert the SG flatness floppy disk (Item 16) for the generator (Item 1) to
the floppy disk drive of the analyzer.
2. Perform the self calibration: Press Cal > Calibrate All.
3. Enter the PV menu:
a. Press Service... > Password in the CAL menu.
RSA3408B Analyzer Service Manual
b. Enter 270833 andthenpressEnter using the numeric keypad.
c. Press the PV side key.
d. Set the GPIB address of the generator:
H Press the Config... side key.
H Press the SG Type side key to select the manufacturer of the
generator (Item 1) for the GPIB command system: HP or Anritsu.
H Press the SG Address side key and set the generator address.
H Press the Cancel--Back (top) side key.
3- 17

Performance Tests
4. Perform the tests in the baseband and RF1 band:
Press the BB+RF1 side key to perform the tests.
5. Check the test results:
Check the pass/fail results displayed on the lower left of the screen
(see Figure 3--7 on page 3--16).
If the instrument fails any tests, go to When the Auto Tests Fail on
page 3--19.
6. Change the signal generator:
a. Disconnect the N--N cable from the signal generator (Item 1) output.
b. Connect the N--N cable to the signal generator (Item 2) output.
c. Set the GPIB address of the generator:
H Press the Config... side key.
H Press the SG Type side key to select the manufacturer of the
generator (Item 2) for the GPIB command system: HP or Anritsu.
H Press the GPIB Address side key and set the generator address.
H Press the Cancel--Back (top) side key.
7. Perform the tests in the RF2 and RF3 bands:
Press the RF2+RF3 side key to perform the tests.
8. Check the test results:
Check the pass/fail results displayed on the lower left of the screen
(see Figure 3--7 on page 3--16).
If the instrument fails any tests, go to When the Auto Tests Fail on
page 3--19.
9. Disconnect the test equipment:
a. Disconnect the N-N cable from the analyzer input.
b. Turn off the analyzer and generators.
c. Disconnect the GPIB cables from all the ports.
3- 18
RSA3408B Analyzer Service Manual

Performance Tests
When the Auto Tests Fail
If any test results in Fail (see Figure 3--7 on page 3--16), perform calibration,
referring to Auto Calibration on page 4--20, and then perform the auto tests
again.
1. Perform the auto calibration for the failed test item as shown in Table 3--5.
Table 3- 5: Procedure for failed test item
Failed test item Procedure
BB Flatness Perform the baseband flatness calibration.
Use the All Band Calibration on page 4--25, but select BB in
the service Cal menu.
IF Flatness, RF1@400M
IF Flatness, RF1@1G
IF Flatness, RF1@2G
IF Flatness, RF1@3G
IF Flatness, RF2@5G
IF Flatness, RF3@6G
RF Flatness, RF1
RF Flatness, RF2
RF Flatness, RF3
Perform the IF flatness (wide/IQ) calibration.
Refer to IF Flatness (Wide/Iq) Calibration on page 4--29 for the
procedure.
Perform the RF flatness calibration.
Refer to All Band Calibration on page 4--25 for the procedure.
You can select RF1, RF2+RF3,orRF1+RF2+RF3 with
Cal Select in the service Cal menu for the band in which the
error occurred.
Spurious, RF1
Spurious, RF2
Spurious, RF3
Perform the spurious calibration.
Use the All Band Calibration on page 4--25, but select
Spurious wit h Cal Select in the service Cal menu.
You can select RF1, RF2+RF3,orRF1+RF2+RF3 in the
service Cal menu for the band in which the error occurred.
2. Perform the auto tests again to check that the instrument passes.
If the instrument fails the spurious test again, go to the next section, Further
Spurious Test.
Further Spurious Test. Performs spurious test at the specified frequency.
1. Connect a USB mouse (Item 17) and keyboard (Item 18) to the USB ports
on the side panel of the analyzer.
2. Press Measure (front panel) > Spurious PV.
3. Set the GPIB address of the signal generator:
a. Press the SG side key to select the manufacturer of the generator for the
GPIB command system: HP or Anritsu.
b. Press the GPIB Address side key and set the generator address.
RSA3408B Analyzer Service Manual
3- 19

Performance Tests
4. Check the error log:
View the error log in the following location using the mouse and keyboard:
NOTE. For accessing Microsoft Windows XP on the analyzer, refer to the
RSA3408B User Manual.
H Directory: C:\Program Files\Tektronix\wca200a\log
H File: spurious_RFxPV.log
(RFx = RF1, RF2, or RF3, depending on the test frequency)
Below is an example of the spurious_RF1PV.log file:
Spurious PV, RF1
Begin 2005/04/28 16:34:03
1000MHz: 67.5kHz, --73.065dB
2000MHz: 55.3kHz, --76.142dB
End 2005/04/28 17:02:05
Center frequency
Spurious offset frequency
from the center frequency
Difference in level between carrier
at the center frequency and
spurious at the offset frequency
5. Set test frequency:
a. Press the Band side key to select the band in which the error occurred.
For example, if an error occurred at 1000 MHz, select RF1.
b. Press the Start side key and set the frequency at which the error
occurred. For example, if an error occurred at 1000 MHz, enter 1000.
c. Press the Stop side key and set the same frequency as in Start (in this
example, 1000) to perform the measurement at the error frequency.
6. Perform the test: Press the Measurement side key to run the test.
Check that the test passes on the right bottom of the screen.
7. Repeat steps 5 and 6 for all the frequencies listed in the log file.
3- 20
RSA3408B Analyzer Service Manual

Frequency Checks
Performance Tests
These procedures check the frequency-related characteristics and are listed as
checked in Specifications of the RSA3408B Technical Reference.
Check Frequency Readout
Accuracy
Equipment
Required
Prerequisites Refer to page 3--10.
One signal generator (Item 2 or 3)
One 50 Ω N-N coaxial cable (Item 11)
1. Prepare for the test:
a. Initialize the analyzer:
H Press the System key on the front panel.
H Press the Reset All to Factory Defaults side key.
b. Set the generator controls:
Frequency 10 MHz................
Level --10 dBm....................
c. Hook up the signal generator:
Connect the generator output through a 50 Ω N-N coaxial cable to the
analyzer Input. See the following figure.
RSA3408B
RSA3408B Analyzer Service Manual
Signal generator
Output
50 Ω N-N coaxial cable
3- 21

Performance Tests
2. Check frequency accuracy in the baseband:
a. Modify the analyzer default settings:
H Press the Frequency/Channel key on the front panel.
H The Center Freq menu item is selected by default.
Set the frequency to 10 MHz using the numeric keypad.
H Press the Span key on the front panel.
H The Span menu item is selected by default.
Set the span to 1 MHz using the general purpose knob.
b. Measure peak frequency:
H Press the Peak key to place the marker on the signal peak.
H Read the marker readout. Confirm that the value is
10 MHz 1kHz.
3. Check frequency accuracy in the RF1 band:
a. Modify the generator control:
Frequency 2 GHz................
b. Modify the analyzer controls:
H Press the Frequency/Channel key on the front panel.
H The Center Freq menu item is selected by default.
Set the frequency to 2 GHz using the numeric keypad.
c. Measure peak frequency:
H Press the Peak key to place the marker on the signal peak.
H Read the marker readout. Confirm that the value is
2 GHz 1.4 kHz.
3- 22
RSA3408B Analyzer Service Manual

4. Check frequency accuracy in the RF2 band:
a. Modify the generator control:
Frequency 5 GHz................
b. Modify the analyzer controls:
H Press the Frequency/Channel key on the front panel.
H The Center Freq menu item is selected by default.
Set the frequency to 5 GHz using the numeric keypad.
c. Measure peak frequency:
H Press the Peak key to place the marker on the signal peak.
H Read the marker readout. Confirm that the value is
5 GHz 2.0 kHz.
5. Check frequency accuracy in the RF3 band:
Performance Tests
a. Modify the generator control:
Frequency 7 GHz................
b. Modify the analyzer controls:
H Press the Frequency/Channel key on the front panel.
H The Center Freq menu item is selected by default.
Set the frequency to 7 GHz using the numeric keypad.
c. Measure peak frequency:
H Press the Peak key to place the marker on the signal peak.
H Read the marker readout. Confirm that the value is
7 GHz 2.4 kHz.
6. Disconnect the test equipment:
Disconnect the cable at the analyzer input.
RSA3408B Analyzer Service Manual
3- 23

Performance Tests
Check 10 MHz Reference
Output Accuracy
Equipment
Required
Prerequisites Refer to page 3--10.
One frequency counter (Item 6)
One 50 Ω BNC coaxial cable (Item 10)
One 50 Ω terminator (Item 15)
The frequency counter must have been operating for a warm-up period
of at least 24 hours.
1. Prepare for the test:
a. Hook up the frequency counter:
Connect REF OUT on the rear panel of the analyzer through a 50 Ω
precision coaxial cable and a 50 Ω precision terminator to Channel 1 of
the counter. See the following figure.
Frequency counter
RSA3408B (rear)
REF OUT
CH1 input
50 Ω terminator
50 Ω BNC coaxial cable
b. Set the counter controls:
Function Frequency 1.................
Gate time 2 s................
2. Check the frequency:
Check that the frequency counter reads 10 MHz 2.0 Hz.
3. Disconnect the hookup:
Disconnect the cable at REF OUT.
3- 24
RSA3408B Analyzer Service Manual

Noise Sideband Checks
Performance Tests
These procedures check the noise sideband-related characteristics and are listed
as checked in Specifications of the RSA3408B Technical Reference.
Check Noise Sideband
Equipment
Required
Prerequisites Refer to page 3--10.
1. Prepare for the test:
a. Initialize the analyzer:
H Press the System key on the front panel.
H Press the Reset All to Factory Defaults side key.
b. Modify the default settings:
H Press the Frequency/Channel key on the front panel.
H The Center Freq menu item is selected by default.
Set the frequency to 1 GHz using the numeric keypad.
H Press the Amplitude key on the front panel.
H Press the RF Atten/Mixer side key to select Mixer.
H The Mixer Level menu item is selected by default.
Set the level to --10 dBm.
One signal generator (Item 4)
One 50 Ω N-N coaxial cable (Item 11)
RSA3408B Analyzer Service Manual
H Press Trace/Avg > Trace 1 Type... > Average.
H Press the Number Of Averages side key and set the value to 50
using the general purpose knob.
c. Set the generator controls:
Frequency 1000 MHz................
Amplitude 0 dBm................
RF output On................
d. Hook up the signal generator:
Connect the generator output through a 50 Ω N-N coaxial cable to the
analyzer Input. See the following figure.
3- 25

Performance Tests
Signal generator
Output
50 Ω N --N coaxial cable
RSA3408B
2. Check phase noise for a span of 50 kHz:
a. Modify the analyzer controls:
H Press the Span key on the front panel.
H The Span menu item is selected by default. Set t he span to 50 kHz
using the general purpose knob or the numeric keypad.
b. Perform the C/N (Carrier-to-Noise ratio) measurement:
H Press Measure > C/N > Meas Setup.
H Press the Offset Frequency side key and set the value to 10 kHz
using the numeric keypad.
H Press the Carrier Bandwidth side key and set the value to 5 kHz
using the numeric keypad.
H Press the Noise Bandwidth side key and set the value to 1 kHz
using the numeric keypad.
c. Check against limits:
Read the phase noise (C/No) at the bottom of the screen.
Confirm that the value is 110 dB/Hz or more.
3- 26
RSA3408B Analyzer Service Manual

3. Check phase noise for a span of 500 kHz:
a. Modify the analyzer controls:
H Press the Span key on the front panel.
H The Span menu item is selected by default. Set t he span to 500 kHz
using the general purpose knob or the numeric keypad.
b. Perform the C/N measurement:
H Select Measure > C/N > Meas Setup.
H Press the Offset Frequency side key and set the value to 100 kHz
using the numeric keypad.
H Press the Carrier Bandwidth side key and set the value to 50 kHz
using the numeric keypad.
H Press the Noise Bandwidth side key and set the value to 10 kHz
using the numeric keypad.
Performance Tests
c. Check against limits:
Read the phase noise (C/No) at the bottom of the screen.
Confirm that the value is 112 dB/Hz or more.
4. Check phase noise for a span of 5 MHz:
a. Modify the analyzer controls:
H Press the Span key on the front panel.
H The Span menu item is selected by default. Set t he span to 5 MHz
using the general purpose knob or the numeric keypad.
b. Perform the C/N measurement:
H Select Measure > C/N > Meas Setup.
H Press the Offset Frequency side key and set the value to 1 MHz
using the numeric keypad.
H Press the Carrier Bandwidth side key and set the value to 300 kHz
using the numeric keypad.
H Press the Noise Bandwidth side key and set the value to 100 kHz
using the numeric keypad.
5. Disconnect the test equipment: Disconnect the cable at the analyzer input.
RSA3408B Analyzer Service Manual
c. Check against limits:
Read the phase noise (C/No) at the bottom of the screen.
Confirm that the value is 132 dB/Hz or more.
3- 27

Performance Tests
Amplitude Checks
These procedures check the amplitude-related characteristics and are listed as
checked in Specifications of the RSA3408B Technical Reference.
Check Absolute
Amplitude Accuracy
Equipment
Required
Prerequisites Refer to page 3--10.
One signal generator (Item 1)
One power meter (Item 7)
One power sensor (Item 8)
One 50 Ω N-N coaxial cables (Item 11)
1. Set up the power meter and sensor:
NOTE. Store the power sensor correction factors in the power meter, if you have
not yet done so.
a. Connect the power meter and the power sensor. See the following figure.
Power meter
Power sensor
Sensor input
3- 28
b. Warm up the power meter and sensor for more than 20 minutes.
c. Press ZERO on the power meter.
d. Connect the RF input of the power sensor to the power reference output
of the power meter. See Figure 3--8 on page 3--29.
e. Turn on POWER REF and execute the calibration.
f. Disconnect the RF input of the power sensor from the reference output
of the power meter.
RSA3408B Analyzer Service Manual

Power meter
Power reference output
Figure 3- 8: Hookup for calibrating the power sensor
Baseband Test.
2. Set the signal generator output:
a. Hook up the instruments:
Connect the signal generator (Item 1) output through a 50 Ω N-N coaxial
cable to the power sensor input. See Figure 3--9.
Performance Tests
Signal generator
Power meter
Output
Power sensor
Figure 3- 9: Hookup for setting the signal generator output
b. Set the signal generator controls:
Frequency 25 MHz................
Level --10 dBm....................
c. Set the power meter control:
Frequency 25 MHz................
d. Adjust the output level of the signal generator so that the power meter
reads --10 dBm 0.05 dBm.
RSA3408B Analyzer Service Manual
e. Disconnect the cable from t he power sensor input.
3- 29

Performance Tests
3. Prepare for the test:
a. Hook up the instruments:
Connect the signal generator output through a 50 Ω N-N coaxial cable to
the RSA3408B Input. See Figure 3--10.
RSA3408B
Signal generator
Output
50 Ω N-N coaxial cable
Figure 3- 10: Hookup for checking the a bsolute amplitude accuracy
b. Initialize the analyzer:
H Press the System key on the front panel.
H Press the Reset All to Factory Defaults side key.
c. Modify the default settings:
H Press the Frequency/Channel key on the front panel.
H The Center Freq menu item is selected by default.
Set the frequency to 25 MHz using the numeric keypad.
H Press the Span key on the front panel.
H The Span menu item is selected by default.
Set the span to 10 MHz using the general purpose knob.
d. Calibrate the analyzer gain:
H Press Cal > Calibrate Gain.
H Press Amplitude > Auto Level.
3- 30
RSA3408B Analyzer Service Manual

4. Check the amplitude:
a. Press the Peak key on the front panel to place the marker on the
signal peak.
b. Check that the marker readout is within --10 dBm 0.3 dB.
5. Disconnect the hookup:
Disconnect the cable at the analyzer input.
RF Test.
6. Modify the signal generator output:
a. Hook up the test equipment:
Connect the signal generator output through a 50 Ω N-N coaxial cable to
the power sensor input. See Figure 3--9 on page 3--29.
b. Modify the signal generator controls:
Performance Tests
Frequency 100 MHz................
Level --20 dBm....................
c. Modify the power meter control:
Frequency 100 MHz................
d. Adjust the output level of the signal generator so that the power meter
reads --20 dBm 0.05 dBm.
e. Disconnect the cable from t he power sensor input.
7. Modify the test hookup and preset the i nstrument controls:
a. Hook up the instruments:
Connect the signal generator output through a 50 Ω N-N coaxial cable to
the RSA3408B Input. See Figure 3--10 on page 3--30.
b. Modify the analyzer controls:
H Press the Frequency/Channel key on the front panel.
H The Center Freq menu item is selected by default.
Set the frequency to 100 MHz using the numeric keypad.
H Press the Amplitude key on the front panel.
RSA3408B Analyzer Service Manual
H Press the RF Atten/Mixer side key to select RF Att.
H The RF Att menu item is selected by default.
Set the attenuation to 0 dB.
3- 31

Performance Tests
c. Calibrate the analyzer gain:
H Press Cal > Calibrate Gain.
H Press Amplitude > Auto Level.
8. Check the amplitude:
a. Press the Peak key on the front panel to place the marker on the
signal peak.
b. Check that the marker readout is within --20 dBm 0.5 dB.
9. Disconnect the test equipment:
Disconnect the cable at the analyzer input.
3- 32
RSA3408B Analyzer Service Manual

Performance Tests
Check Input Attenuator
Setting Uncertainty
Equipment
Required
Prerequisites Refer to page 3--10.
One signal generator (Item 1)
One 50 Ω N-N coaxial cables (Item 11)
1. Prepare for the test:
a. Set the generator controls:
Frequency 100 MHz................
Amplitude --25 dBm................
RF output On................
b. Hook up the generator:
Connect the generator output through a 50 Ω N-N coaxial cable to the
analyzer Input. See the following figure.
Signal generator
RSA3408B
Output
50 Ω N-N coaxial cable
c. Initialize the analyzer:
H Press the System key on the front panel.
H Press the Reset All to Factory Defaults side key.
RSA3408B Analyzer Service Manual
3- 33

Performance Tests
d. Modify the default settings:
H Press the Frequency/Channel key on the front panel.
H The Center Freq menu item is selected by default.
Set the frequency to 100 MHz using the numeric keypad.
H Press the Span key on the front panel.
H The Span menu item is selected by default.
Set the span to 10 MHz using the general purpose knob.
H Press the Amplitude key on the front panel.
H The Ref Level menu item is selected by default.
Set the reference level to --20 dBm using the general purpose knob.
H Press the RF Atten/Mixer side key to select RF Att.
H The RF Att menu item is selected by default. Set the attenuation to
0 dB using the numeric keypad or the general purpose knob.
2. Measure the reference amplitude at 0 dB attenuation:
a. Press the Peak key on the front panel to place the marker on the
signal peak.
b. Record the peak amplitude at the marker readout as the reference value.
(Let the value be P
)
0.
3. Check the amplitude for the attenuation from 5 to 30 dB:
a. Press the Amplitude key on the front panel.
b. Press the RF Att side key and set the attenuation (initially 5 dB).
c. Press the Peak key on the front panel to place the marker on the
signal peak.
d. Record the peak amplitude at the marker readout. (Let the value be P
e. Check that the error (P
-- P0) is within 0.2 dB .
X
f. Repeat substeps 3a through e for attenuation from 5 to 30 dB in 5 dB
steps.
4. Modify the generator controls:
.)
X
3- 34
Amplitude --5 dBm................
RSA3408B Analyzer Service Manual

Performance Tests
5. Modify the analyzer controls:
a. Press the Amplitude key on the front panel.
b. The Ref Level menu item is selected by default.
Set the reference level to 0 dBm using the general purpose knob.
c. Make sure that RF Att is set to 30 dB.
6. Measure the reference amplitude at 30 dB attenuation:
a. Press the Peak key on the front panel to place the marker on the
signal peak.
b. Record the peak amplitude at the marker readout as the reference value.
(Let the value be P
)
1.
7. Check the amplitude for attenuation from 35 to 55 dB:
a. Press the Amplitude key on the front panel.
b. Press the RF Att side key and set the attenuation (initially 35 dB).
c. Press the Peak key on the front panel to place the marker on the
signal peak.
d. Record the peak amplitude at the marker readout. (Let the value be P
e. Check that the error (P
-- P1) is within 0.2 dB .
X
f. Repeat substeps 7a through e forattenuationfrom35to55dBin5dB
steps.
8. Disconnect the test equipment:
Disconnect the cable at the analyzer input.
.)
X
RSA3408B Analyzer Service Manual
3- 35

Performance Tests
Check Level Linearity
Equipment
Required
Prerequisites Refer to page 3--10.
One signal generator (Item 1)
One spectrum analyzer (Item 5)
One power meter (Item 7)
One power sensor (Item 8)
One 50 Ω N-N coaxial cable (Item 11)
1. Set up the power meter and sensor:
Do step 1 on page 3--28 to set up the power meter and sensor.
2. Set the signal generator output:
a. Hook up the instruments:
Connect the signal generator (Item 1) output through a 50 Ω N-N coaxial
cable to the power sensor input. See the figure below.
Signal generator
Power meter
Output
Power sensor
b. Set the signal generator controls:
Frequency 100 MHz................
Level +10 dBm....................
c. Set the power meter control:
Frequency 100 MHz................
3- 36
RSA3408B Analyzer Service Manual

Performance Tests
3. Determine the reference power in +10 to --30 dBm:
a. Measure the power and record it as Pr0.
b. Set the signal generator amplitude from 0 to --30 dBm in 10 dB steps and
measure the power as Pr1 to 4, respectively.
Signal generator amplitude Reference power
+10 dBm Pr0
0dBm Pr1
--10 dBm Pr2
--20 dBm Pr3
--30 dBm Pr4
c. Disconnect the power sensor input from t he generator.
4. Modify the hookup:
a. Connect the generator output through a 50 Ω N-N coaxial cable to the
spectrum analyzer (Item 5) input. See the following figure.
Spectrum analyzer
Signal generator
Output
50 Ω N-N coaxial cable
b. Set the signal generator control:
Amplitude --30 dBm................
c. Set the spectrum analyzer controls:
Measurement mode SA mode........
Reference level --20 dBm............
Center frequency 100 MHz..........
Span 1 MHz....................
RF attenuation 10 dB............
RBW Auto....................
RSA3408B Analyzer Service Manual
3- 37
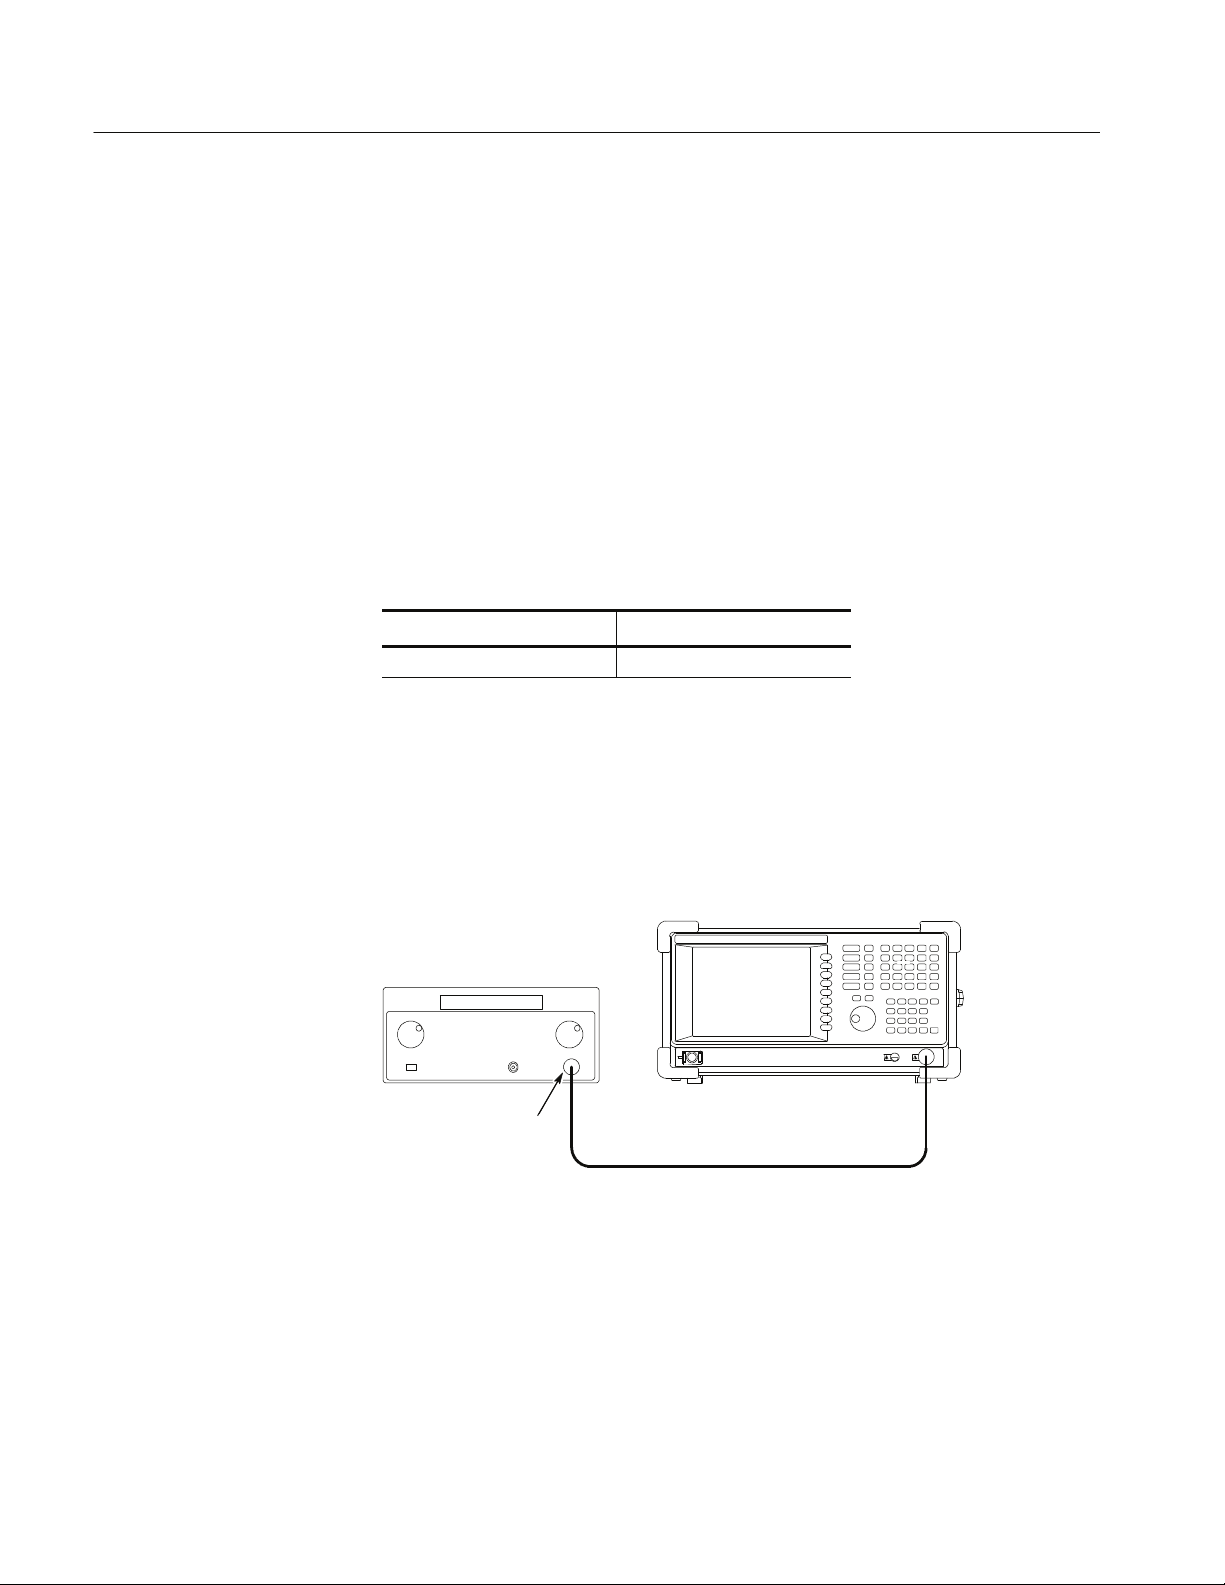
Performance Tests
5. Set the reference offset:
a. Set the spectrum analyzer control:
A verage 10..................
b. Measure the peak power Ppr using the maker peak.
c. Modify the spectrum analyzer control:
Reference offset Pr4 -- Ppr...........
6. Determine the reference power in --40 dBm:
a. Set the signal generator amplitude to -- 40 dBm to measure the power
as Pr5.
Signal generator amplitude Reference power
--40 dBm Pr5
b. Disconnect the cable from the spectrum analyzer.
7. Modify the hookup:
a. Connect the signal generator output to the RSA3408B analyzer input.
See the following figure.
RSA3408B
Signal generator
Output
50 Ω N-N coaxial cable
b. Set the signal generator control:
Amplitude +10 dBm................
3- 38
RSA3408B Analyzer Service Manual

Performance Tests
c. Modify the RSA3408B analyzer controls:
Center frequency 100 MHz..........
Span 5 MHz....................
Reference level 10 dBm............
RF attenuation 20dB............
A verage 50..................
8. Measure the power:
a. Using the Peak key , measure the power and record it as Pm0.
b. Set the signal generator amplitude to 0 to --40 dBm in 10 dB steps to
measure the power as Pm1 to 5.
c. Get the level linearity Pfx (x = 1 to 5) as:
Pfx = (Pmx -- Pm0) -- (Prx -- Pr0)
Table 3- 6: Level linearity test result
Signal generator
amplitude
+10 dBm Pr0 Pm0 --
0dBm Pr1 Pm1 Pf1 = (Pm1 -- Pm0) -- (Pr1 -- Pr0)
--10 dBm Pr2 Pm2 Pf2 = (Pm2 -- Pm0) -- (Pr2 -- Pr0)
--20 dBm Pr3 Pm3 Pf3 = (Pm3 -- Pm0) -- (Pr3 -- Pr0)
--30 dBm Pr4 Pm4 Pf4 = (Pm4 -- Pm0) -- (Pr4 -- Pr0)
--40 dBm Pr5 Pm5 Pf5 = (Pm5 -- Pm0) -- (Pr5 -- Pr0)
Reference
power
Measured
power
Level linearity
9. Disconnect the test equipment:
Disconnect the cable at the analyzer input.
RSA3408B Analyzer Service Manual
3- 39

Performance Tests
Spurious Response Checks
These procedures check the spurious-related characteristics and are listed as
checked in Specifications of the RSA3408B Technical Reference.
Check 3rdOrder
Intermodulation Distortion
Equipment
Required
Prerequisites Refer to page 3--10.
Two signal generators (Item 2 (or 3) and Item 4)
One power combiner (Item 9)
Three 50 Ω N-SMA coaxial cables (Item 12)
1. Prepare for the test:
a. Connect each generator output through a 50 Ω N-SMA coaxial cable to a
power combiner input. See the following figure.
RSA3408B
Signal generator
Output
N-SMA cable
Signal generator
3- 40
Power
combiner
N-SMA cable
Output
b. Connect the power combiner output through a 50 Ω N-SMA coaxial
cable to the analyzer Input.
RSA3408B Analyzer Service Manual

c. Set the signal generator (Item 2) controls:
Frequency 1999.85 MHz................
Level 0 dBm....................
ALC BW 100 Hz................
d. Set the signal generator (Item 4) controls:
Frequency 2000.15 MHz................
Level 0 dBm....................
ALC BW 100 Hz................
e. Initialize the analyzer:
H Press the System key on the front panel.
H Press the Reset All to Factory Defaults side key.
f. Modify the default controls:
H Press the Frequency/Channel key on the front panel.
Performance Tests
H The Center Freq menu item is selected by default.
Set the frequency to 2 GHz using the numeric keypad.
H Press the Span key on the front panel.
H The Span menu item is selected by default.
Set the span to 1 MHz using the general purpose knob.
H Press the Amplitude key on the front panel.
H The Ref Level menu item is selected by default.
Set the level to 5 dBm using the general purpose knob.
H Press the RF Atten/Mixer side key to select Rf Att.
H Press the RBW/FFT key on the front panel.
H Press the RBW/FFT side key to select Man.
H Press the Extended Resolution side key to select On.
H Press the RBW side key and set the RBW to 2 kHz.
H Press Trace/Avg > Trace 1 Type... > Average.
H Press the Number Of Averages side key and set the value to 50
using the general purpose knob.
RSA3408B Analyzer Service Manual
H Press the Marker Setup key.
H Press the Ma
rkers side key to select Delta.
3- 41

Performance Tests
g. Modify the generator output level:
H Press Markers: A or " to place the marker on the signal of
1999.85 MHz.
H Adjust the generator (Item 2) output level so that the signal level is
--10 dBm.
H Press Markers: A or " to place the marker on the signal of
2000.15 MHz.
H Adjust the generator (Item 4) output level so that the signal level is
--10 dBm.
2. Check the amplitude for the attenuation of 10 to 20 dB:
a. Modify the analyzer controls:
H Press the Amplitude key on the front panel.
H Press the RF Att menu item and set the attenuation using the general
purpose knob (initially 10 dB).
b. Measure the amplitude for the signals of 1999.55 MHz and
2000.45 MHz:
H Press the Marker Setup key.
H Press the Select Marker side key to select 1.
H Place the first marker at the signal of 1999.55 MHz using the
Markers: A or " key.
H Press the Select Marker side key to select 2.
H Place the second marker at the signal of 2000.45 MHz using the
Markers: A or " key.
c. Check against limits: Read the first and the second marker readouts.
Write down t he larger value.
d. Repeat substeps 2a through c forattenuationfrom10to20dBin5dB
steps to find the lowest distortion value.
3. Check against limits:
Confirm that the lowest value meets the requirement of --78 dBc.
4. Disconnect the test equipment:
Disconnect the cable at the analyzer input.
3- 42
RSA3408B Analyzer Service Manual

Performance Tests
Check Displayed Average
Noise Level
Equipment
Required
Prerequisites Refer to page 3--10.
None
1. Prepare for the test:
a. Initialize the analyzer:
H Press the System key on the front panel.
H Press the Reset All to Factory Defaults side key.
RSA3408B
b. Modify the analyzer controls:
H Press the Frequency/Channel key on the front panel.
H The Center Freq menu item is selected by default.
Set the frequency to 10 MHz using the general purpose knob.
H Press the Span key on the front panel.
H The Span menu item is selected by default.
Set the span to 1 MHz using the general purpose knob.
H Press the Amplitude key on the front panel.
H The Ref Level menu item is selected by default.
Set the level to --30 dBm using the general purpose knob.
H Press the RBW/FFT key on the front panel.
H Press the RBW/FFT side key to select Man.
H The RBW menu item is selected by default.
Set the value to 10 kHz using the general purpose knob.
RSA3408B Analyzer Service Manual
3- 43

Performance Tests
H Press Trace/Avg > Trace 1 Type... > Average.
H Press the Number Of Averages side key and set the value to 50.
H Press Measure > Channel Power > Meas Setup.
H Press the Channel Bandwidth side key and set the value to 1 MHz
using the general purpose knob.
2. Check noise in the baseband:
Read the measurement result of Density at the bottom of the screen.
Check that the value is --151 dBm/Hz or less.
3. Check noise at 2 GHz in the RF1 band:
a. Modify the analyzer control:
H Press the Frequency/Channel key on the front panel.
H The Center Freq menu item is selected by default.
Set the frequency to 2 GHz using the general purpose knob.
H Press the Amplitude key on the front panel.
H The Ref Level menu item is selected by default.
Set the level to --50 dBm using the general purpose knob.
H Press the RF Atten/Mixer side key to select RF Att.
H The RF Att menu item is selected by default.
Set the attenuation to 0 dB using the general purpose knob.
b. Check against limits:
Read the measurement result of Density at the bottom of the screen.
Check that the value is --150 dBm/Hz or less.
4. Check noise at 3 GHz in the RF1 band:
a. Modify the analyzer control:
H Press the Frequency/Channel key on the front panel.
H The Center Freq menu item is selected by default.
Set the frequency to 3 GHz using the general purpose knob.
b. Check against limits:
Read the measurement result of Density at the bottom of the screen.
Check that the value is --150 dBm/Hz or less.
3- 44
RSA3408B Analyzer Service Manual

5. Check noise at 7 GHz in the RF3 band:
a. Modify the analyzer control:
H Press the Frequency/Channel key on the front panel.
H The Center Freq menu item is selected by default.
Set the frequency to 7 GHz using the general purpose knob.
b. Check against limits:
Read the measurement result of Density at the bottom of the screen.
Check that the value is --142 dBm/Hz or less.
Performance Tests
RSA3408B Analyzer Service Manual
3- 45

Performance Tests
Check Residual Response
Equipment
Required
Prerequisites Refer to page 3--10.
None
1. Prepare for the test:
a. Initialize the analyzer:
H Press the System key on the front panel.
H Press the Reset All to Factory Defaults side key.
RSA3408B
b. Modify the default settings:
H Press the Frequency/Channel key on the front panel.
H The Center Freq menu item is selected by default.
Set the frequency to 20 MHz using the general purpose knob.
H Press the Span key on the front panel.
H The Span menu item is selected by default.
Set the span to 40 MHz using the general purpose knob.
H Press the Amplitude key on the front panel.
H The Ref Level menu item is selected by default.
Set the level to --30 dBm using the general purpose knob.
H Press the RBW/FFT key on the front panel.
H Press the RBW/FFT side key to select Man.
H The RBW menu item is selected by default.
Set the RBW to 100 kHz using the general purpose knob.
H Press Trace/Avg > Trace 1 Type... > Average.
H Press the Number Of Averages side key and set the value to 50
using the general purpose knob.
3- 46
RSA3408B Analyzer Service Manual

2. Check residual response in the baseband:
a. Measure residual response:
H Press Scale/Lines (front panel) > View Lines...
H Press the Show Line side key to select Vertical.
H Press the Number Of Line key to select 1.
H The Line1 menu item is selected by default.
Set the value to 1 MHz using the numeric keypad.
H Press the Show Line side key to select Horizontal.
H Press the Number Of Line key to select 1.
H The Line1 menu item is selected by default.
Set the value to --93 dBm using the numeric keypad.
b. Check against limits:
Confirm that the residual signal level is --93 dBm or less at 1 MHz or
more.
Performance Tests
3. Check residual response in the RF1 band:
a. Modify the analyzer controls:
H Press the Frequency/Channel key on the front panel.
H The Center Freq menu item is selected by default.
Set the frequency to 2 GHz using the numeric keypad.
H Press the Span key on the front panel.
H The Span menu item is selected by default.
Set the span to 3 GHz using the numeric keypad.
b. Measure residual response:
H Press Scale/Lines (front panel) > View Lines...
H Press the Show Line side key to select Horizontal.
H Press the Number Of Line key to select 1.
H The Line1 menu item is selected by default.
Set the value to --90 dBm using the numeric keypad.
c. Check against limits:
Confirm that the residual signal level is --90 dBm or l ess.
RSA3408B Analyzer Service Manual
3- 47

Performance Tests
4. Check residual response in the RF2 band:
a. Modify the analyzer controls:
H Press the Frequency/Channel key on the front panel.
H The Center Freq menu item is selected by default.
Set the frequency to 5 GHz using the numeric keypad.
b. Measure residual response:
Press the Peak key to place the marker at the peak on the noise floor.
c. Check against limits:
Read the marker readout. Confirm that the residual signal level is
--85 dBm or less within the whole bandwidth.
5. Check residual response in the RF3 band:
a. Modify the analyzer controls:
H Press the Frequency/Channel key on the front panel.
H The Center Freq menu item is selected by default.
Set the frequency to 6.5 GHz using the numeric keypad.
b. Measure residual response:
Press the Peak key to place the marker at the peak on the noise floor.
c. Check against limits:
Read the marker readout. Confirm that the residual signal level is
--85 dBm or less within the whole bandwidth.
3- 48
RSA3408B Analyzer Service Manual

Performance Tests
Check Spurious Response
Equipment
Required
Prerequisites Refer to page 3--10.
One signal generator (Item 2 or 3)
One 50 Ω N-N coaxial cable (Item 11)
1. Prepare for the test:
a. Initialize the analyzer:
H Press the System key on the front panel.
H Press the Reset All to Factory Defaults side key.
b. Modify the default controls:
H Press the Span key on the front panel.
H The Span menu item is selected by default.
Set the span to 10 MHz using the general purpose knob.
H Press the RBW/FFT key on the front panel.
H Press the RBW/FFT side key to select Man.
H The RBW menu item is selected by default.
Set the value to 50 kHz using the general purpose knob.
H Press Trace/Avg > Trace 1 Type... > Average.
H Press the Number Of Averages side key and set the value to 50.
H Press the Marker Setup key.
H Press the Markers side key to select Delta.
c. Set the generator controls:
Level --5 dBm....................
d. Hook up the signal generator:
Connect the generator output through a 50 Ω N-N coaxial cable to the
analyzer Input. See the following figure.
RSA3408B Analyzer Service Manual
3- 49

Performance Tests
RSA3408B
Signal generator
Output
50 Ω N-N coaxial cable
2. Check spurious response:
a. Modify the generator controls:
Set the generator output frequency to the value as shown in Table 3--7
(initially 25 MHz).
b. Modify the analyzer controls:
H Press the Frequency/Channel key on the front panel.
H The Center Freq menu item is selected by default. Set the frequency
to the same value as the generator output using the numeric keypad.
c. Measure the amplitude:
H Press the Marker Setup key on the front panel.
H Press the Select Marker side key to select 1.
H Press the Peak key and then the Markers: B (marker down) key
once to place the first marker at the peak on the noise floor.
H Press the Select Marker side key to select 2.
H Press the Peak keytoplaceMarker2onthesignalpeak.
H R ead the delta marker readout (Δ1--2) on the screen. Check that the
components other than the carrier meet the requirements shown in
Table 3--7 (initially --73 dBc).
3- 50
RSA3408B Analyzer Service Manual

Performance Tests
d. Repeat substeps a through c until all frequency settings listed in
Table 3--7 are checked.
Table 3- 7: Spurious measurement
Band Frequency Spurious response
Baseband 25 MHz --73 dBc
RF1 2GHz --73 dBc
RF2 5GHz --70 dBc
RF3 7GHz --70 dBc
3. Disconnect the test equipment:
Disconnect the cable at the analyzer input.
RSA3408B Analyzer Service Manual
3- 51

Performance Tests
Test Record
Photocopy the following test record pages and use them to record the performance test results for your analyzer.
3- 52
RSA3408B Analyzer Service Manual

Performance Tests
RSA3408B Test Record
Serial Number: Certificate Number:
Calibration Date:
Frequency readout test
Frequency Measurement Low limit Test result High limit
10 MHz Marker 9,999 kHz 10,001 kHz
2GHz Marker 1,999,998.6 kHz 2,000,001.4 kHz
5GHz Marker 4,999,998.0 kHz 5,000,002.0 kHz
7GHz Marker 6,999,997.6 kHz 7,000,002.4 kHz
10 MHz reference output test Low limit Test result High limit
Accuracy 9,999,998.0 Hz 10,000,002.0 Hz
Technician:
Noise sideband test
Span Offset Low limit Test result High limit
50 kHz 10 kHz 110 d B / Hz
500 kHz 100 kHz 11 2 dB/ H z
5MHz 1MHz 132 dB/Hz
Absolute amplitude accuracy test
Frequency Test level Low limit Test result High limit
25 MHz --10 dBm --10.3 dBm -- 9 . 7 d B m
100 MHz --20 dBm --20.5 dBm --19.5 dBm
RSA3408B Analyzer Service Manual
3- 53

Performance Tests
Input attenuator setting uncertainty test
Attenuation Measurement (PX) Low limit Test result (PX-P
0dB P0: -- -- --
5dB -- 0 . 2 d B +0.2 dB
10 dB -- 0 . 2 d B +0.2 dB
15 dB -- 0 . 2 d B +0.2 dB
20 dB -- 0 . 2 d B +0.2 dB
25 dB -- 0 . 2 d B +0.2 dB
30 dB -- 0 . 2 d B +0.2 dB
30 dB P1: -- -- --
35 dB -- 0 . 2 d B +0.2 dB
40 dB -- 0 . 2 d B +0.2 dB
45 dB -- 0 . 2 d B +0.2 dB
50 dB -- 0 . 2 d B +0.2 dB
) High limit
0/1
55 dB -- 0 . 2 d B +0.2 dB
Level linearity test
Amplitude Low limit Test result High limit
0dBm -- 0 . 2 d B +0.2 dB
--10 dBm -- 0 . 2 d B +0.2 dB
--20 dBm -- 0 . 2 d B +0.2 dB
--30 dBm -- 0 . 2 d B +0.2 dB
--40 dBm -- 0 . 2 d B +0.2 dB
3rdorder intermodulation distortion test Low limit Test result High limit
3rdorder intermodulation distortion
+5 dBm reference level, 2 GHz center frequency
--78 dBc
3- 54
RSA3408B Analyzer Service Manual

Performance Tests
Displayed average noise level test
Frequency Low limit Test result High limit
10 MHz --151 dBm/Hz
2GHz --150 dBm/Hz
3GHz --150 dBm/Hz
7GHz --142 dBm/Hz
Residual response test
Band Frequency range Low limit Test result High limit
Baseband 1to40MHz --93 dBm
RF1 0.5to3.5GHz --90 dBm
RF2 3.5to6.5GHz --85 dBm
RF3 5to8GHz --85 dBm
Spurious response test
Frequency Low limit Test result High limit
25 MHz --73 dBc
2GHz --73 dBc
5GHz --70 dBc
7GHz --70 dBc
RSA3408B Analyzer Service Manual
3- 55

Performance Tests
3- 56
RSA3408B Analyzer Service Manual

Adjustment Procedures
This section contains information needed to manually adjust the RSA3408B
8 GHz Real-Time Spectrum Analyzer.
The section is divided into three subsections:
H General information about adjusting the analyzer
H A list of equipment required to perform the adjustments
H The procedures for adjusting the analyzer
Purpose
Adjustment Interval
Adjustment After Repair
This procedure returns the analyzer to conformance with its Warranted Characteristics as listed in Section 1, Specification. It can also be used to optimize t he
performance of the analyzer. For performance verification procedures, refer to
Section 4, Performance Verification.
Generally, these adjustments should be done every 12 months.
After the removal and replacement of a module due to electrical failure, perform
the adjustment procedures in this section.
Requirements for Performance
Before doing the adjustments, note the following requirements.
Personnel
Warm-Up Period
This procedure is only to be performed by trained service technicians.
This analyzer requires a 20 minute warm-up time in a 20 _Cto30_C environment before it is adjusted. Adjustments done before the operating temperature
has stabilized may cause errors in performance.
Test Equipment
RSA3408B Analyzer Service Manual
Table 4--1 lists all test equipment required to adjust the analyzer.
4- 1

Adjustment Procedures
Equipment Required
Table 4- 1: Test equipment
Item number and
description
Table 4--1 lists the test equipment required to adjust the RSA3408B analyzer.
Minimum requirements Example Purpose
1. Signal generator Frequency range: 10 kHz to 3.5 GHz;
V ariable amplitude from --70 dBm to
Agilent 8648D Adjusting flatness in
baseband and RF1
+13 dBm into 50 Ω;
Accuracy: <±1 dB; Function: FM
2. Signal generator Frequency range: 10 MHz to 8 GHz;
Output level: --30 dBm to +10 dBm;
Agilent 83712B with
option 1E1
Adjusting flatness in
RF2 and RF3
Accuracy: <±1dB
3. Signal generator Frequency range: 1 MHz to 8 GHz;
Output level: --30 dBm to +10 dBm;
Accuracy: <±1dB
4. Signal generator Frequency: 6 GHz; Output: ≥0dBm;
Digital modulation: QPSK
5. Waveform generator Arbitrary waveform; Function generator; Two output channels; Sampling
Agilent E8257D with
option 1E1
(option UNX recommended)
Agilent E4438C with
Options 506, UNJ, and 602
Tektronix AWG520
1
Adjusting flatness in all bands
Adjusting wide/IQ flatness
Adjusting IQ gain
(Option 03 only)
frequency: 50 kHz to 1 GHz; Amplitude range: 20 mV to 2 V
6. Frequency counter Frequency range: 10 MHz;
Aging rate: <5×10
-- 1 0
/day;
Agilent 53132A with
option 010
Checking the reference output frequency accuracy
Accuracy: <0.01 ppm at 10 MHz
7. RF power meter
8. RF power sensor
2
1MHzto8GHz Agilent 437B
Agilent E4418B
2
10 MHz to 8 GHz; RF Flatness: <3%;
Uncertainty of calibration factor data:
Agilent 8481A
Agilent E4412A
3
3
Adjusting the signal generator
output level
Adjusting the signal generator
output level
<2% (RSS)
9. BNC cable
(five required)
10. N-N cable 50 Ω, 36 in, male-to-male N
50 Ω, 36 in, male-to-male BNC
connectors
Tektronix part number
012-1341-XX
Signal interconnection
Signal interconnection
connectors
11. GPIB cable
(three required)
12. Terminator
(two required)
2m, double-shielded Tektronix part number
012-0991-XX
Impedance: 50 Ω; connectors: female
BNC input, male BNC output
Tektronix part number
011-0049-01
Software-based tests
Signal termination for checking frequency accuracy
13. RF attenuator Ratio: 10 dB; impedance 50 Ω Checking flatness
14. N adapter
2
Female-to-female N connectors Signal interconnection
4- 2
RSA3408B Analyzer Service Manual

Adjustment Procedures
Table 4- 1: Test equipment (Cont.)
Item number and
description
15. Mouse
16. Keyboard
17. SG flatness/spurious
18. AWG520 setup disk 3.5 inch DOS-compatible floppy disk,
1
2
3
2
2
floppy disk (for each
signal generator used)
Use this instrument only. The adjustment procedures specify that the analyzer controls this instrument over the GPIB.
Required only when creating a flatness correction files for the signal generators (Item 1, 2, and 3).
To make an SG flatness/spurious floppy disk (Item 17), use Agilent 437B or compatible.
If you use another instrument, for example Agilent E4418B, select HP437B for the GPIB command set.
To select the programming language, refer to the User’s Guide of the instrument.
USB Standard accessary File operation
USB Standard accessary File operation
Created or updated using the
procedures described on pages 4--6
and 4--13
containing the AWG520 setting and
waveform files
3.5 inch, 720 K or 1.44 MB,
DOS-compatible floppy disk
Tektronix part number
063--3680--00
PurposeExampleMinimum requirements
Storing flatness and spurious
correction data for the signal
generators (Items 1, 2, and 3)
Setting up the AWG520
waveform generator (Item 5)
Preparation
Do the following procedures before executing the auto calibration:
H Store calibration factors in the power meter.
H Prepare the flatness correction file for the signal generators.
H Prepare the spurious correction file for the signal generators.
H Option 03 only. Install the setup files on the AWG520 waveform generator.
RSA3408B Analyzer Service Manual
4- 3

Adjustment Procedures
Storing Cal Factors in the
Power Meter
If you use an Agilent 437B power meter to create flatness correction files for the
signal generators (Items 1, 2, and 3), you have to store the calibration factors for
a power sensor in the power meter. There are two ways to store calibration
factors:
H Storing calibration factors manually
H Storing calibration factors through the analyzer
For information on storing calibration factors m anually in the power meter, refer
to the power meter user’s guide. When you store calibration factors t hrough the
analyzer, use the following procedure.
Equipment
Required
One power meter (Item 7)
One GPIB cable (Item 11)
One 720 K or 1.44 MB, 3.5 inch DOS-compatible disk,
if you load calibration factors from a floppy disk.
1. Make a text file on the PC with the following format for a power sensor:
# NO=(sensor ID number: 0 to 9)
# SENSOR=(type of the sensor)
# SERIAL=(serial number of the sensor)
# REFCF=(ref cal factor)
(frequency)=(cal factor)
...
4- 4
These information is described on the surface of the power sensor, except the
sensor ID number which you specify. Enter the calibration factors for the test
or adjustment frequency range.
An example is shown below (frequency range: 0.1 to 9 GHz).
# NO=2
# SENSOR=HP8485A
# SERIAL=3318A16046
# REFCF=99.0
0.1e9=99.1
2e9=98.1
4e9=97.1
6e9=96.5
7e9=96.2
8e9=96.0
9e9=95.8
Save the file with the extension of .cal (for example, sensor2.cal). You can
load the file to the power meter using a floppy disk or through the network.
RSA3408B Analyzer Service Manual

Adjustment Procedures
2. Install the hookup and preset the instrument controls:
a. Turn off the power meter and the analyzer.
b. Connect the GPIB cables on the power meter and the analyzer rear panel.
c. Connect a mouse and a keyboard to the analyzer.
d. Turn on the power meter and the analyzer.
e. Set the GPIB address of the power meter to 13 (fixed).
RSA3408B
Power meter
GPIB cable
Figure 4- 1: Hookup for storing the cal factors in the power meter
3. Store the calibration factors:
a. If you use a floppy disk, insert it to the disk drive on the analyzer.
b. Press Cal > Service... > Password.
c. Enter 270833 andthenpressEnter using the numeric keypad.
d. Press the Cal side key.
e. Press Measure > SG Flatness.
f. Press the Read Cal Factor side key.
The file selection dialog box appears.
g. Enter the file name and then press the Open button.
The calibration factors are stored in the power meter.
RSA3408B Analyzer Service Manual
4- 5

Adjustment Procedures
Making Flatness
Correction Files
The auto performance verification and calibration need flatness floppy disks for
the signal generators (Items 1, 2, and 3). The following procedure measures
flatness correction data for the specified signal generator and saves the data to a
floppy disk.
You must create or update the flatness correction file when one of these
conditions is met:
H When you calibrate the analyzer initially
H When you calibrate the signal generator
H When you change the signal generator
H When you change the N-N cable
H When you change the RF attenuator
H When one year has elapsed from the last update of the file for the generator
STOP. Select either of these two procedures, depending on the signal generator(s) you use:
H Procedure 1 on page 4--7:
Uses one signal generator, Item 3, which covers all measurement bands:
Baseband, RF1, RF2, and RF3.
H Procedure 2 on page 4--10:
Uses two signal generators: Item 1, which covers the baseband and
RF1 band, and Item 2, which covers the RF2 and RF3 bands.
4- 6
RSA3408B Analyzer Service Manual

Adjustment Procedures
Procedure 1
Creates or updates the flatness correction file for one signal generator (Item 3),
which covers all measurement bands: Baseband, RF1, RF2, and RF3.
Equipment
Required
Prerequisites When using the power meter other than Agilent 437B, select HP437B
One signal generator (Item 3)
One power meter (Item 7)
One power sensor (Item 8)
One N-N cable (Item 10)
Two GPIB cables (Item 11)
One 10 dB attenuator (Item 13)
One N adapter (Item 14)
One floppy disk (Item 17)
for the GPIB command set. For selecting the programming language,
refer to the operation manual of the instrument.
1. Prepare for the adjustment:
NOTE. Store the power sensor correction factors in the power meter, if not
already stored. When you use the Agilent 437B power meter, refer to Storing
Cal Factors in the Power Meter on page 4--4.
Signal generator
Output
N-N coaxial cable
Figure 4- 2: Initial test hookup
a. Turn off the signal generator, power meter, and analyzer.
b. Connect the power sensor output to the power meter i nput.
See Figure 4--2.
RSA3408B
Power meter
GPIB cableGPIB cable
10 dB attenuator
N adapter
Power sensor
RSA3408B Analyzer Service Manual
4- 7

Adjustment Procedures
c. Connect the signal generator output through a 50 Ω N-N coaxial cable
followed by a 10 dB attenuator and an N adapter to the power sensor
input.
d. Connect the GPIB cables on the signal generator, the power meter, and
the analyzer rear panel.
e. Turn on the signal generator, the power meter, and the analyzer.
f. Set the GPIB address as follows:
Power meter 13 (fixed)..............
Signal generator 1 to 30 except 13...........
g. Initialize the analyzer:
H Press the System key on the front panel.
H Press the Reset All to Factory Defaults side key.
2. Modify the default settings:
a. Press Cal > Service... > Password.
b. Input 270833 andthenpressEnter using the numeric keypad.
c. Press the Cal side key.
d. Press Measure > SG Flatness.
e. Press the Power Sensor side key and select the sensor number that you
specified when storing calibration factors, with the general purpose
knob.
f. Press the SG side key to select the manufacturer of the generator for the
GPIB command system: HP or Anritsu.
NOTE. The HP setting also supports Agilent and Rohde & Schwarz products.
g. Press the GPIB Address side key and set the address of the generator.
3. Let the instruments warm up: Allow a 20 minute warm-up period before you
go to the next step.
4. Calibrate the power sensor:
4- 8
a. Modify the hookup: C onnect the power sensor input to the power
reference output of the power meter (see Figure 4--3).
RSA3408B Analyzer Service Manual

Adjustment Procedures
Power meter
Power reference output
Figure 4- 3: Hookup for calibrating the power sensor
b. Press the Sensor Cal side key to perform zero adjustment and calibra-
tion for the sensor.
5. Perform the flatness measurement for the generator:
a. Modify the hookup: C onnect the signal generator output through an N-N
coaxial cable followed by a 10 dB attenuator and an N adapter to the
power sensor input. See Figure 4--2 on page 4-- 7 again.
b. Insert a floppy disk to the disk drive of the analyzer for storing the
flatness data.
c. Press the Macro Setup key on the front panel.
d. Press Go to page 2 > Create SG Flatness... > All using the side key.
When the measurement has been completed, the flatness data is saved to the
file(s) on the floppy disk:
sgrf1flatness.cal (for the baseband and RF1 band)
sgrf2flatness.cal (for the RF2 band)
sgrf3flatness.cal (for the RF3 band)
6. Disconnect the hookup:
a. Remove the floppy disk by pressing the eject button.
b. Turn off the signal generator, power meter, and analyzer.
c. Disconnect the GPIB cables.
d. Disconnect the power sensor and the N-N cable.
RSA3408B Analyzer Service Manual
4- 9

Adjustment Procedures
Procedure 2
Creates or updates the flatness correction file for two signal generators: Item 1,
which covers the baseband and RF1 band, and Item 2, which covers the RF2 and
RF3 bands.
Equipment
Required
Prerequisites When using the power meter other than Agilent 437B, select HP437B
One signal generator (Item 1 or 2)
One power meter (Item 7)
One power sensor (Item 8)
One N-N cable (Item 10)
Two GPIB cables (Item 11)
One 10 dB attenuator (Item 13)
One N adapter (Item 14)
One floppy disk (Item 17)
for the GPIB command set. For selecting the programming language,
refer to the operation manual of the instrument.
1. Prepare for the adjustment:
Signal generator
Output
N-N coaxial cable
NOTE. Store the power sensor correction factors in the power meter, if not
already stored. When you use the Agilent 437B power meter, refer to Storing
Cal Factors in the Power Meter on page 4--4.
a. Turn off the signal generator, power meter, and analyzer.
b. Connect the power sensor output to the power meter i nput.
See Figure 4--4.
RSA3408B
Power meter
GPIB cableGPIB cable
10 dB attenuator
N adapter
Power sensor
Figure 4- 4: Initial test hookup
4- 10
RSA3408B Analyzer Service Manual

Adjustment Procedures
c. Connect the signal generator output through a 50 Ω N-N coaxial cable
followed by a 10 dB attenuator and an N adapter to the power sensor
input.
d. Connect the GPIB cables on the signal generator, the power meter, and
the analyzer rear panel.
e. Turn on the signal generator, the power meter, and the analyzer.
f. Set the GPIB address as follows:
Power meter 13 (fixed)..............
Signal generator 1 to 30 except 13...........
g. Initialize the analyzer:
H Press the System key on the front panel.
H Press the Reset All to Factory Defaults side key.
2. Modify the default settings:
a. Press Cal > Service... > Password.
b. Enter 270833 andthenpressEnter using the numeric keypad.
c. Press the Cal side key.
d. Press Measure > SG Flatness.
e. Press the Power Sensor side key and select the sensor number that you
specified when storing calibration factors, with the general purpose
knob.
f. Press the Band side key to select the measurement frequency band.
H Low. Measures from 1 MHz to 3.5 GHz (Baseband and RF1 band)
H High. Measures from 3.5 GHz to 8 GHz (RF2 and RF3 bands)
g. Press the SG side key to select the manufacturer of the generator for the
GPIB command system: HP or Anritsu.
NOTE. The HP setting also supports Agilent and Rohde & Schwarz products.
h. Press the GPIB Address side key and set the address of the generator.
3. Let the instruments warm up: Allow a 20 minute warm-up period before you
RSA3408B Analyzer Service Manual
go to the next step.
4- 11

Adjustment Procedures
4. Calibrate the power sensor:
a. Modify the hookup: C onnect the power sensor input to the power
reference output of the power meter (see Figure 4--5).
Power meter
Power reference output
Figure 4- 5: Hookup for calibrating the power sensor
b. Press the Sensor Cal side key to perform zero adjustment and calibra-
tion for the sensor.
5. Perform the flatness measurement for the generator:
a. Modify the hookup: C onnect the signal generator output through an N-N
coaxial cable followed by a 10 dB attenuator and an N adapter to the
power sensor input. See Figure 4--4 on page 4--10 again.
b. Insert a floppy disk to the disk drive of the analyzer for storing the
flatness data.
c. Press the Measurement side key to perform the flatness measurement.
When the measurement has been completed, the flatness data is saved to the
file(s) on the floppy disk:
sgrf1flatness.cal (for the Band setting of 230 and Low)
sgrf2flatness.cal (for the Band setting of High)
sgrf3flatness.cal (for the Band setting of High)
6. Disconnect the hookup:
a. Remove the floppy disk by pressing the eject button.
b. Turn off the signal generator, power meter, and analyzer.
c. Disconnect the GPIB cables.
4- 12
d. Disconnect the power sensor and the N-N cable.
RSA3408B Analyzer Service Manual

Adjustment Procedures
Making Spurious
Correction Files
The auto performance verification and calibration need the spurious floppy disks
for the signal generators (Items 1, 2, and 3). The following procedures measure
the spurious correction data for the specified signal generator and saves the data
to a floppy disk.
You must create or update the spurious correction file when one of these
conditions is met:
H When you calibrate the analyzer initially
H When you calibrate the signal generator
H When you change the signal generator
H When one year has elapsed from the last update of the file for the generator
NOTE. Store the spurious correction file on the same floppy disk (Item 17) as the
flatness correction file for the signal generator.
Equipment
Required
One signal generator (Item 1, 2, or 3)
One 50 Ω N-N coaxial cable (Item 10)
One GPIB cable (Item 11)
One RF attenuator (Item 13)
One floppy disk (Item 17)
Prerequisites Refer to page 4--1
1. Prepare for the calibration: See the following figure for the hookup.
RSA3408B
Signal generator
GPIB cable
Output
50 Ω N-N coaxial cable
10 dB attenuator
RSA3408B Analyzer Service Manual
4- 13

Adjustment Procedures
a. Power off the RSA3408B analyzer and the signal generator.
b. Connect the analyzer and the generator with a GPIB cable.
c. Connect the analyzer Input through a 10 dB attenuator followed by a
50 Ω N-N coaxial cable to the generator output.
d. Power on the analyzer and the generator.
e. Set the GPIB address of the generator, ranging from 1 to 30.
2. Enter the calibration menu:
a. Press Service... > Password in the Cal menu.
b. Enter 270833 andthenpressEnter using the numeric keypad.
3. Perform the spurious measurement for the generator:
a. Press the Create SG Spur File... side key.
b. Insert the SG flatness/spurious floppy disk (Item 16) for the generator to
the floppy disk drive of the analyzer.
c. Press one of the following side keys:
H All. Performs the measurement for all bands: RF1, RF2, and RF3.
H RF1. Performs the measurement for the RF1 band.
H RF2+RF3. Performs the measurement for the RF2 and RF3 bands.
NOTE. All takes more than 30 hours f or the measurement, depending on the
signal generator.
The spurious correction file is created on the floppy disk. Refer to Table 3--3
on page 3--10 for the file name and compatibility with other models.
4. Disconnect the test equipment:
a. Disconnect the cable from the analyzer input.
b. Turn off the analyzer and generators.
c. Disconnect the GPIB cable from the generator.
4- 14
RSA3408B Analyzer Service Manual

Adjustment Procedures
File Compatibility. The SG spurious file created in your analyzer can be used in
the other RSA and WCA models. Table 4--2 shows the file compatibility among
the products.
Table 4- 2: Compatibility of the spurious correction file
Product Created file name Frequency range File-compatible product
RSA3303B spurious_ignore3303.lst 15MHzto3GHz RSA2203A, RSA3303A, RSA3303B, WCA230A
RSA3308B spurious_ignore3308.lst 15MHzto8GHz RSA2203A, RSA3303A, RSA3303B, WCA230A,
RSA2208A, RSA3308A, RSA3308B, WCA280A
RSA3408B spurious_ignore.lst 40MHzto8GHz RSA3408A, RSA3408B
Setting Up
Waveform Generator
(Option 03 Only)
The auto calibration for the analyzer with Option 03 (IQ input) needs the
AWG520 waveform generator (Item 5). The waveform files must be installed
from the AWG520 Setup Disk (floppy disk, Item 18, Tektronix part number
063-3680-00) onto the AWG520 hard disk before executing the calibration.
The following two setup files (total about 10 KB) are contained in the setup
floppy disk.
iqgain_i.wfm
iqgain_q.wfm
Copy all the files from the setup disk directory /wca200 to the AWG520
directory /wca200. For copying files from a floppy disk to AWG520, refer to the
AWG500 Series User Manual.
NOTE. When you copy the setup files on AWG520, use lowercase letters to enter
the file names.
RSA3408B Analyzer Service Manual
4- 15

Adjustment Procedures
Self Calibration
Perform these routines to optimize the analyzer performance:
H Gain calibration
H Center offset calibration
H DC offset calibration
Each item is explained in this section.
Gain Calibration
Equipment
Required
Prerequisites Power on the analyzer and allow a 20 minute warm-up before doing
None
this procedure.
The gain calibration calibrates the analyzer’s amplifier gain using the internal
signal generator. Run this internal calibration routine as required when you boot
the analyzer or when UNCAL (uncalibrated) is displayed during operation.
Allow the analyzer to warm up for 20 minutes before you begin the calibration.
The warm-up period allows the electrical performance of the analyzer to
stabilize.
During normal operation, when the ambient temperature changes by more than
5 °C from the temperature at the last calibration, UNCAL is displayed in the
yellow box at the top of the screen (see Figure 4--6). If this happens, run the gain
calibration.
When UNCAL is displayed,
run the gain calibration
UNCAL FREE RUN
4- 16
Frequency
Span
Input Att
Figure 4- 6: UNCAL display
RSA3408B Analyzer Service Manual

Adjustment Procedures
To run the gain calibration, do the following:
NOTE. When you run the gain calibration during signal acquisition, the
calibration begins after the acquisition is completed.
1. Press the Cal key on the front panel (see Figure 4--7).
2. Press the Calibrate Gain side key.
The calibration runs. It takes several seconds to complete the process.
When you want to perform the gain, center offset, and DC offset calibration
together, press the Calibrate All side key.
3. If you press the Auto Calibration side key to select Yes , the calibration will
run automatically any time the analyzer gain drifts to an uncal state.
Cal menu
Calibrate all
Gain calibration
Center offset calibration
DC offset calibration
Auto Calibration
(Select Yes or No)
Cal key
Figure 4- 7: Calibration menu
RSA3408B Analyzer Service Manual
4- 17

Adjustment Procedures
Center Offset Calibration
When you display a spectrum and no input signal is present, a spurious emission
at the center frequency may appear regardless of frequency settings. The center
offset calibration cancels those spurious emissions. If the spurious emission is
too obvious when you narrow t he span, run the calibration.
NOTE. Option 03 only. When you input I and Q signals from the rear panel
connectors, set the IQ input signal level to zero externally.
When the spurious emission appears at
the center of the screen with no input
signal, run the center offset calibration.
Figure 4- 8: Center offset
1. Press the Cal key on the front panel (see Figure 4--7).
2. Press the Calibrate Center Offset side key.
The calibration runs. It takes several seconds to complete the process.
When you want to perform the gain, center offset, and DC offset calibration
together, press the Calibrate All side key.
NOTE. Enabling Auto Calibration (see Figure 4 --7) allows the analyzer to run
the center offset calibration automatically when analyzer settings change.
4- 18
RSA3408B Analyzer Service Manual
 Loading...