

Page 1

User Manual
RSA3408A Option 29
WLAN 802.11a/b/g/n Analysis Software
071-1648-01
This document supports firmware version 3.31 and above.
www.tektronix.com
Page 2

Copyright © Tektronix. All rights reserved. Licensed software products are owned by Tektronix or its subsidiaries or
suppliers, and are protected by national copyright laws and international treaty provisions.
Tektronix products are covered by U.S. and foreign patents, issued and pending. Information in this publication
supercedes that in all previously published material. Specifications and price change privileges reserved.
TEKTRONIX and TEK are registered trademarks of Tektronix, Inc.
Contacting Tektronix
Tektronix, Inc.
14200 SW Karl Braun Drive
P.O . B o x 5 0 0
Beaverton, OR 97077
USA
For product information, sales, service, and technical support:
In North America, call 1-800-833-9200.
Worldwide, visit www.tektronix.com to find contacts in your area.
Page 3

Warranty 2
Tektronix warrants that this product will be free from defects in materials and workmanship for a period of one (1) year
from the date of shipment. If any such product proves defective during this warranty period, Tektronix, at its option,
either will repair the defective product without charge for parts and labor, or will provide a replacement in exchange
for the defective product. Parts, modules and replacement products used by Tektronix for warranty work may be new
or reconditioned to like new performance. All replaced parts, modules and products become the property of Tektronix.
In order to obtain service under this warranty, Customer must notify Tektronix of the defect before the expiration of
the warranty period and make suitable arrangements for the performance of service. Customer shall be responsible for
packaging and shipping the defective product to the service center designated by Tektronix, with shipping charges
prepaid. Tektronix shall pay for the return of the product to Customer if the shipment is to a location within the country
in which the Tektronix service center is located. Customer shall be responsible for paying all shipping charges, duties,
taxes, and any other charges for products returned to any other locations.
This warranty shall not apply to any defect, failure or damage caused by improper use or improper or inadequate
maintenance and care. Tektronix shall not be obligated to furnish service under this warranty a) to repair damage
resulting from attempts by personnel other than Tektronix representatives to install, repair or service the product; b) to
repair damage resulting from improper use or connection to incompatible equipment; c) to repair any damage or
malfunction caused by the use of non-Tektronix supplies; or d) to service a product that has been modified or integrated
with other products when the effect of such modification or integration increases the time or difficulty of servicing the
product.
THIS WARRANTY IS GIVEN BY TEKTRONIX WITH RESPECT TO THE PRODUCT IN LIEU OF ANY OTHER
WARRANTIES, EXPRESS OR IMPLIED. TEKTRONIX AND ITS VENDORS DISCLAIM ANY IMPLIED
WARRANTIES OF MERCHANTABILITY OR FITNESS FOR A PARTICULAR PURPOSE. TEKTRONIX’
RESPONSIBILITY TO REPAIR OR REPLACE DEFECTIVE PRODUCTS IS THE SOLE AND EXCLUSIVE
REMEDY PROVIDED TO THE CUSTOMER FOR BREACH OF THIS WARRANTY. TEKTRONIX AND ITS
VENDORS WILL NOT BE LIABLE FOR ANY INDIRECT, SPECIAL, INCIDENTAL, OR CONSEQUENTIAL
DAMAGES IRRESPECTIVE OF WHETHER TEKTRONIX OR THE VENDOR HAS ADVANCE NOTICE OF
THE POSSIBILITY OF SUCH DAMAGES.
Page 4

Page 5

Table of Contents
Preface . . . . . . . . . . . . . . . . . . . . . . . . . . . . . . . . . . . . . . . . . . . . . . . . . . . . . . . . . . . . . vii
About This Manual . . . . . . . . . . . . . . . . . . . . . . . . . . . . . . . . . . . . . . . . . . . . . . . . . . . . vii
Related Manuals. . . . . . . . . . . . . . . . . . . . . . . . . . . . . . . . . . . . . . . . . . . . . . . . . . . . . . . vii
Getting Started
Getting Started . . . . . . . . . . . . . . . . . . . . . . . . . . . . . . . . . . . . . . . . . . . . . . . . . . . . . 1-1
Measurement Items . . . . . . . . . . . . . . . . . . . . . . . . . . . . . . . . . . . . . . . . . . . . . . . . . . . 1-2
Accessing the Measurements. . . . . . . . . . . . . . . . . . . . . . . . . . . . . . . . . . . . . . . . . . . . 1-4
Operating Basics
Operating Basics . . . . . . . . . . . . . . . . . . . . . . . . . . . . . . . . . . . . . . . . . . . . . . . . . . . . 2-1
Screen Elements. . . . . . . . . . . . . . . . . . . . . . . . . . . . . . . . . . . . . . . . . . . . . . . . . . . . . . 2-2
Setting Frequency and Span. . . . . . . . . . . . . . . . . . . . . . . . . . . . . . . . . . . . . . . . . . . . . 2-3
Setting Timing Parameters. . . . . . . . . . . . . . . . . . . . . . . . . . . . . . . . . . . . . . . . . . . . . . 2-6
View Operation . . . . . . . . . . . . . . . . . . . . . . . . . . . . . . . . . . . . . . . . . . . . . . . . . . . . . . 2-7
Saving Measurement Results. . . . . . . . . . . . . . . . . . . . . . . . . . . . . . . . . . . . . . . . . . . . 2-9
Reference
IEEE802.11a/b/g Analysis . . . . . . . . . . . . . . . . . . . . . . . . . . . . . . . . . . . . . . . . . . . . 3-1
Basic Measurement Procedure. . . . . . . . . . . . . . . . . . . . . . . . . . . . . . . . . . . . . . . . . . . 3-2
Meas Setup Menu. . . . . . . . . . . . . . . . . . . . . . . . . . . . . . . . . . . . . . . . . . . . . . . . . . . . . 3-4
Measurement Setup for Modulation Measurements . . . . . . . . . . . . . . . . . . . . . . . . . . 3-5
Measurement Setup for Spectrum Mask . . . . . . . . . . . . . . . . . . . . . . . . . . . . . . . . . . . 3-9
Measurement Setup for Transmit Power . . . . . . . . . . . . . . . . . . . . . . . . . . . . . . . . . . 3-10
View Format. . . . . . . . . . . . . . . . . . . . . . . . . . . . . . . . . . . . . . . . . . . . . . . . . . . . . . . . 3-11
View Format for Modulation Measurements . . . . . . . . . . . . . . . . . . . . . . . . . . . . . . . 3-12
View Format for Power Measurement . . . . . . . . . . . . . . . . . . . . . . . . . . . . . . . . . . . . 3-37
802.11n (nx1) Analysis . . . . . . . . . . . . . . . . . . . . . . . . . . . . . . . . . . . . . . . . . . . . . . 3-43
Data Process Flow for MISO (2x1) . . . . . . . . . . . . . . . . . . . . . . . . . . . . . . . . . . . . . . 3-44
Basic Measurement Procedure. . . . . . . . . . . . . . . . . . . . . . . . . . . . . . . . . . . . . . . . . . 3-45
Meas Setup Menu. . . . . . . . . . . . . . . . . . . . . . . . . . . . . . . . . . . . . . . . . . . . . . . . . . . . 3-46
Measurement Setup for Modulation Measurements . . . . . . . . . . . . . . . . . . . . . . . . . 3-47
Measurement Setup for Spectrum Mask . . . . . . . . . . . . . . . . . . . . . . . . . . . . . . . . . . 3-52
View Format. . . . . . . . . . . . . . . . . . . . . . . . . . . . . . . . . . . . . . . . . . . . . . . . . . . . . . . . 3-55
View Format for Modulation Measurements . . . . . . . . . . . . . . . . . . . . . . . . . . . . . . . 3-57
View Format for Power Measurement . . . . . . . . . . . . . . . . . . . . . . . . . . . . . . . . . . . . 3-90
802.11n MIMO Analysis . . . . . . . . . . . . . . . . . . . . . . . . . . . . . . . . . . . . . . . . . . . . . 3-93
Data Process Flow . . . . . . . . . . . . . . . . . . . . . . . . . . . . . . . . . . . . . . . . . . . . . . . . . . . 3-93
Basic Measurement Procedure. . . . . . . . . . . . . . . . . . . . . . . . . . . . . . . . . . . . . . . . . . 3-95
Meas Setup Menu. . . . . . . . . . . . . . . . . . . . . . . . . . . . . . . . . . . . . . . . . . . . . . . . . . . . 3-98
View Format. . . . . . . . . . . . . . . . . . . . . . . . . . . . . . . . . . . . . . . . . . . . . . . . . . . . . . . 3-102
RSA3408A Option 29 User Manual
i
Page 6

Table of Contents
Appendices
Glossary and Index
Appendix A: Scale Setting Range . . . . . . . . . . . . . . . . . . . . . . . . . . . . . . . . . . . . . . A-1
Appendix B: Save File Format . . . . . . . . . . . . . . . . . . . . . . . . . . . . . . . . . . . . . . . . B-1
Transfer Function (Amplitude and Phase) and Delay Profile . . . . . . . . . . . . . . . . . . . B-2
EVM vs Time, Power vs Time, and Frequency Error. . . . . . . . . . . . . . . . . . . . . . . . . B-4
EVM vs SC, Power vs SC, and OFDM Flatness. . . . . . . . . . . . . . . . . . . . . . . . . . . . . B-6
Symbol Table. . . . . . . . . . . . . . . . . . . . . . . . . . . . . . . . . . . . . . . . . . . . . . . . . . . . . . . . B-8
ii
RSA3408A Option 29 User Manual
Page 7

List of Figures
List of Figures
Figure 1-1: WLAN analysis display . . . . . . . . . . . . . . . . . . . . . . . . . . . . . . . . . . . . 1-1
Figure 1-2: Signal format in IEEE802.11n analysis . . . . . . . . . . . . . . . . . . . . . . . . 1-3
Figure 1-3: Measure menu in the WLAN analysis . . . . . . . . . . . . . . . . . . . . . . . . . 1-4
Figure 2-1: Screen elements . . . . . . . . . . . . . . . . . . . . . . . . . . . . . . . . . . . . . . . . . . . 2-2
Figure 2-2: Timing parameters . . . . . . . . . . . . . . . . . . . . . . . . . . . . . . . . . . . . . . . . 2-6
Figure 2-3: Definition of the View Scale menu items . . . . . . . . . . . . . . . . . . . . . . . 2-8
Figure 2-4: Setting packets to be saved . . . . . . . . . . . . . . . . . . . . . . . . . . . . . . . . . 2-10
Figure 3-1: IEEE802.11a/b/g measurement menu . . . . . . . . . . . . . . . . . . . . . . . . . 3-1
Figure 3-2: Modulation Type Display Filter setting . . . . . . . . . . . . . . . . . . . . . . . 3-8
Figure 3-3: IEEE802.11a/b spectrum mask . . . . . . . . . . . . . . . . . . . . . . . . . . . . . . 3-9
Figure 3-4: Burst indicator on the overview . . . . . . . . . . . . . . . . . . . . . . . . . . . . . 3-10
Figure 3-5: EVM versus Time (main view) . . . . . . . . . . . . . . . . . . . . . . . . . . . . . 3-12
Figure 3-6: MagErr versus Time (main view) . . . . . . . . . . . . . . . . . . . . . . . . . . . 3-14
Figure 3-7: PhaseErr versus Time (main view) . . . . . . . . . . . . . . . . . . . . . . . . . . 3-15
Figure 3-8: Power versus Time (main view) . . . . . . . . . . . . . . . . . . . . . . . . . . . . . 3-16
Figure 3-9: Constellation (main view) . . . . . . . . . . . . . . . . . . . . . . . . . . . . . . . . . . 3-18
Figure 3-10: EVM versus SC (main view) . . . . . . . . . . . . . . . . . . . . . . . . . . . . . . 3-19
Figure 3-11: EVM versus Time (main view) . . . . . . . . . . . . . . . . . . . . . . . . . . . . 3-21
Figure 3-12: MagErr versus SC (main view) . . . . . . . . . . . . . . . . . . . . . . . . . . . . 3-22
Figure 3-13: MagErr versus Time (main view) . . . . . . . . . . . . . . . . . . . . . . . . . . 3-23
Figure 3-14: PhaseErr versus SC (main view) . . . . . . . . . . . . . . . . . . . . . . . . . . . 3-24
Figure 3-15: PhaseErr versus Time (main view) . . . . . . . . . . . . . . . . . . . . . . . . . 3-25
Figure 3-16: Power versus SC (main view) . . . . . . . . . . . . . . . . . . . . . . . . . . . . . . 3-26
Figure 3-17: Power versus Time (main view) . . . . . . . . . . . . . . . . . . . . . . . . . . . . 3-28
Figure 3-18: Symbol Constellation (main view) . . . . . . . . . . . . . . . . . . . . . . . . . . 3-29
Figure 3-19: Symbol Constellation (main view) . . . . . . . . . . . . . . . . . . . . . . . . . . 3-30
Figure 3-20: Frequency error (main view) . . . . . . . . . . . . . . . . . . . . . . . . . . . . . . 3-31
Figure 3-21: OFDM flatness (main view) . . . . . . . . . . . . . . . . . . . . . . . . . . . . . . . 3-33
Figure 3-22: OFDM linearity (main view) . . . . . . . . . . . . . . . . . . . . . . . . . . . . . . 3-35
Figure 3-23: Symbol table (main view) . . . . . . . . . . . . . . . . . . . . . . . . . . . . . . . . . 3-36
Figure 3-24: Spectrum mask (OFDM) . . . . . . . . . . . . . . . . . . . . . . . . . . . . . . . . . 3-37
Figure 3-25: Spectrum mask (DSSS) . . . . . . . . . . . . . . . . . . . . . . . . . . . . . . . . . . . 3-39
Figure 3-26: Transmit power on (main view) . . . . . . . . . . . . . . . . . . . . . . . . . . . . 3-40
Figure 3-27: IEEE802.11b Transmit power-on ramp . . . . . . . . . . . . . . . . . . . . . 3-41
Figure 3-28: Transmit power down (main view) . . . . . . . . . . . . . . . . . . . . . . . . . 3-42
Figure 3-29: IEEE802.11b Transmit power-down ramp . . . . . . . . . . . . . . . . . . 3-42
Figure 3-30: IEEE802.11n (nx1) measurement menu . . . . . . . . . . . . . . . . . . . . . 3-43
Figure 3-31: Data process flow for MISO (2x1) . . . . . . . . . . . . . . . . . . . . . . . . . . 3-44
Figure 3-32: Modulation Type Display Filter setting in the nx1 analysis . . . . . 3-50
Figure 3-33: 802.11n (nx1) spectrum mask . . . . . . . . . . . . . . . . . . . . . . . . . . . . . 3-52
Figure 3-34: Editing the spectral mask . . . . . . . . . . . . . . . . . . . . . . . . . . . . . . . . . 3-53
Figure 3-35: List display . . . . . . . . . . . . . . . . . . . . . . . . . . . . . . . . . . . . . . . . . . . . . 3-56
Figure 3-36: Measurement result display (an example of EVM versus Time) . 3-57
Figure 3-37: Transfer function, amplitude (main view) . . . . . . . . . . . . . . . . . . . 3-59
RSA3408A Option 29 User Manual
iii
Page 8

List of Figures
Figure 3-38: Transogram, amplitude (subview) . . . . . . . . . . . . . . . . . . . . . . . . . . 3-60
Figure 3-39: Transfer function, phase (main view) . . . . . . . . . . . . . . . . . . . . . . . . 3-61
Figure 3-40: Transfogram, phase (subview) . . . . . . . . . . . . . . . . . . . . . . . . . . . . . 3-62
Figure 3-41: Delay profile (main view) . . . . . . . . . . . . . . . . . . . . . . . . . . . . . . . . . . 3-63
Figure 3-42: Delayogram (subview) . . . . . . . . . . . . . . . . . . . . . . . . . . . . . . . . . . . . 3-64
Figure 3-43: EVM versus Time (main view) . . . . . . . . . . . . . . . . . . . . . . . . . . . . . 3-65
Figure 3-44: MagErr versus Time (main view) . . . . . . . . . . . . . . . . . . . . . . . . . . . 3-67
Figure 3-45: PhaseErr versus Time (main view) . . . . . . . . . . . . . . . . . . . . . . . . . . 3-68
Figure 3-46: Power versus Time (main view) . . . . . . . . . . . . . . . . . . . . . . . . . . . . 3-69
Figure 3-47: Constellation (main view) . . . . . . . . . . . . . . . . . . . . . . . . . . . . . . . . . 3-71
Figure 3-48: EVM versus SC (main view) . . . . . . . . . . . . . . . . . . . . . . . . . . . . . . . 3-72
Figure 3-49: EVM versus Time (main view) . . . . . . . . . . . . . . . . . . . . . . . . . . . . . 3-74
Figure 3-50: MagErr versus SC (main view) . . . . . . . . . . . . . . . . . . . . . . . . . . . . . 3-75
Figure 3-51: MagErr versus Time (main view) . . . . . . . . . . . . . . . . . . . . . . . . . . . 3-76
Figure 3-52: PhaseErr versus SC (main view) . . . . . . . . . . . . . . . . . . . . . . . . . . . . 3-77
Figure 3-53: PhaseErr versus Time (main view) . . . . . . . . . . . . . . . . . . . . . . . . . . 3-78
Figure 3-54: Power versus SC (main view) . . . . . . . . . . . . . . . . . . . . . . . . . . . . . . 3-79
Figure 3-55: Power versus Time (main view) . . . . . . . . . . . . . . . . . . . . . . . . . . . . 3-81
Figure 3-56: Symbol Constellation (main view) . . . . . . . . . . . . . . . . . . . . . . . . . . 3-82
Figure 3-57: Symbol Constellation (main view) . . . . . . . . . . . . . . . . . . . . . . . . . . 3-83
Figure 3-58: Frequency error (main view) . . . . . . . . . . . . . . . . . . . . . . . . . . . . . . 3-84
Figure 3-59: OFDM flatness (main view) . . . . . . . . . . . . . . . . . . . . . . . . . . . . . . . . 3-86
Figure 3-60: OFDM linearity (main view) . . . . . . . . . . . . . . . . . . . . . . . . . . . . . . . 3-88
Figure 3-61: Symbol table (main view) . . . . . . . . . . . . . . . . . . . . . . . . . . . . . . . . . 3-89
Figure 3-62: Spectrum mask (OFDM) . . . . . . . . . . . . . . . . . . . . . . . . . . . . . . . . . . 3-90
Figure 3-63: IEEE802.11n MIMO 2x2 measurement menu . . . . . . . . . . . . . . . . 3-93
Figure 3-64: MIMO (2x2) data process flow . . . . . . . . . . . . . . . . . . . . . . . . . . . . . 3-94
Figure 3-65: Connecting the rear panel connectors . . . . . . . . . . . . . . . . . . . . . . . 3-95
Figure 3-66: Transferring captured data . . . . . . . . . . . . . . . . . . . . . . . . . . . . . . . . 3-96
Figure 3-67: Modulation Type Display Filter setting in the MIMO analysis . . 3-100
Figure 3-68: List display . . . . . . . . . . . . . . . . . . . . . . . . . . . . . . . . . . . . . . . . . . . . 3-103
Figure 3-69: Waveform Rx1/2 (subview) . . . . . . . . . . . . . . . . . . . . . . . . . . . . . . . 3-104
Figure 3-70: Transfer function, amplitude (main view) . . . . . . . . . . . . . . . . . . . 3-105
Figure 3-71: Transfogram, amplitude (subview) . . . . . . . . . . . . . . . . . . . . . . . . 3-106
Figure 3-72: Transfer function, phase (main view) . . . . . . . . . . . . . . . . . . . . . . . 3-107
Figure 3-73: Transfogram, phase (subview) . . . . . . . . . . . . . . . . . . . . . . . . . . . . 3-108
Figure 3-74: Delay profile (main view) . . . . . . . . . . . . . . . . . . . . . . . . . . . . . . . . . 3-109
Figure 3-75: Delayogram (subview) . . . . . . . . . . . . . . . . . . . . . . . . . . . . . . . . . . . 3-110
iv
Figure B-1: Measurement results file (an example of amplitude
transfer function) . . . . . . . . . . . . . . . . . . . . . . . . . . . . . . . . . . . . . . . . . . . . . . . B-1
RSA3408A Option 29 User Manual
Page 9

List of Tables
List of Tables
Table 1-1: IEEE802.11 standards . . . . . . . . . . . . . . . . . . . . . . . . . . . . . . . . . . . . . . 1-1
Table 1-2: Option 29 WLAN measurement items . . . . . . . . . . . . . . . . . . . . . . . . . 1-2
Table 2-1: Channel table for the WLAN analysis . . . . . . . . . . . . . . . . . . . . . . . . . 2-3
Table 2-2: Span setting . . . . . . . . . . . . . . . . . . . . . . . . . . . . . . . . . . . . . . . . . . . . . . . 2-5
Table 3-1: Measurement setup reference for the 802.11a/b/g analysis . . . . . . . . 3-4
Table 3-2: Modulation detection . . . . . . . . . . . . . . . . . . . . . . . . . . . . . . . . . . . . . . . 3-5
Table 3-3: Submenu availability . . . . . . . . . . . . . . . . . . . . . . . . . . . . . . . . . . . . . . . 3-6
Table 3-4: Length of an analysis symbol, IEEE802.11a/g . . . . . . . . . . . . . . . . . . . 3-7
Table 3-5: View content selection, IEEE802.11a/b/g . . . . . . . . . . . . . . . . . . . . . . 3-11
Table 3-6: Vertical setting range . . . . . . . . . . . . . . . . . . . . . . . . . . . . . . . . . . . . . . 3-13
Table 3-7: Vertical setting range . . . . . . . . . . . . . . . . . . . . . . . . . . . . . . . . . . . . . . 3-20
Table 3-8: Measurement setup reference for the 802.11n (nx1) analysis . . . . . 3-46
Table 3-9: Submenu availability . . . . . . . . . . . . . . . . . . . . . . . . . . . . . . . . . . . . . . 3-48
Table 3-10: Length of an analysis symbol, IEEE802.11n . . . . . . . . . . . . . . . . . . 3-49
Table 3-11: View content selection, 802.11n (nx1) . . . . . . . . . . . . . . . . . . . . . . . . 3-55
Table 3-12: Vertical setting range . . . . . . . . . . . . . . . . . . . . . . . . . . . . . . . . . . . . . 3-66
Table 3-13: Vertical setting range . . . . . . . . . . . . . . . . . . . . . . . . . . . . . . . . . . . . . 3-73
Table 3-14: Submenu availability . . . . . . . . . . . . . . . . . . . . . . . . . . . . . . . . . . . . . 3-99
Table 3-15: View content selection, 802.11n MIMO (2x2) . . . . . . . . . . . . . . . . 3-102
Table A-1: Scale setting range . . . . . . . . . . . . . . . . . . . . . . . . . . . . . . . . . . . . . . . . . A-1
RSA3408A Option 29 User Manual
v
Page 10

List of Tables
vi
RSA3408A Option 29 User Manual
Page 11

Preface
About This Manual
This manual provides operating instructions for the RSA3408A Real-Time
Spectrum Analyzer Option 29 WLAN 802.11a/b/g/n Analysis Software.
This manual is composed of the following sections:
Getting Started provides overviews of the product and its functions.
Operating Basics provides information needed for routine operation.
Reference describes the measurement procedure, setup menu, and view format
specific to Option 29 in detail.
Appendices provides additional information, including the scale setting range
and save file format.
The analyzer uses Microsoft Windows XP as the operating system. This manual
does not describe common usage of Windows XP. Refer to your Windows manuals
as necessary.
Related Manuals
PDF Manual
The following related documents are also available:
RSA3408A User Manual
(Standard accessory; Tektronix part number 071-1617-XX)
Describes how to install the analyzer and how to work with the menus, and
details the standard functions. Also shows the specifications.
RSA3408A Programmer Manual
(Standard accessory; PDF, Tektronix part number 077-0003-XX)
Contains an alphabetical listing of the programming commands and other
information related to controlling the analyzer over the GPIB interface.
The programmer manual described above is a PDF document (the file size is about
3 MB). The file is stored in this directory on the analyzer hard disk:
C:\Program Files\Tektronix\wca200a\Manuals
Use the USB or LAN interface to copy the file onto your PC. Refer to the
RSA3408A User Manual for information about using the interface.
RSA3408A Option 29 User Manual
vii
Page 12

Preface
viii
RSA3408A Option 29 User Manual
Page 13

Getting Started
Page 14

Page 15

Getting Started
RSA3408A Option 29 is the WLAN 802.11a/b/g/n analysis software that performs
signal measurements for high-speed wireless LAN transmitters in 5 GHz and
2.4 GHz bands complying with the IEEE802.11 a, b, g, and n standards. Table 1-1
summarizes the IEEE802.11 standards.
Table 1-1: IEEE802.11 standards
WLAN standard Frequency band Modulation method Tx rate (max)
IEEE802.11a 5 GHz OFDM BPSK, QPSK, 16QAM 54Mbps
IEEE802.11b 2.4 GHz DSSS DBPSK, DQPSK, CCK 11Mbps
IEEE802.11g 2.4 GHz OFDM-CCK DBPSK, DQPSK, CCK, BPSK, QPSK, 16QAM 54Mbps
PBCC DBPSK, DQPSK, CCK, PBCC 33Mbps
OFDM BPSK, QPSK, 16QAM 54Mbps
IEEE802.11n 2.4 GHz / 5 GHz OFDM BPSK, QPSK, 16QAM, 64QAM >100Mbps
1.
This software is compliant with Draft 11n as of December 2006.
Figure 1-1 shows a typical display example of WLAN analysis.
Figure 1-1: WLAN analysis display
RSA3408A Option 29 User Manual
1-1
Page 16

Getting Started
Measurement Items
Table 1-2 shows all the measurement and display items available in Option 29
WLAN analysis software and the supported standards. The measurement items are
classified into Modulation measurement and Power measurement.
Table 1-2: Option 29 WLAN measurement items
Measurement
Measure menu item
Modulation measurement
Transfer Function
(Amplitude and Phase)
Delay Profile EVM versus Time EVM
Power versus Time Constellation EVM versus SC EVM
Power versus SC SC Constellation Frequency Error OFDM Flatness OFDM Linearity Symbol Table -
Power measurement
Spectrum Mask Transmit Power -
Abbreviation. Err: Error; Mag: Magnitude; SC: Subcarrier. Refer to
contents
-
Mag Err
Phase Err
Mag Err
Phase Err
1
802.11a 802.11b 802.11g
✓ ✓ ✓ ✓ ✓
✓ ✓ ✓ ✓ ✓
✓ ✓ ✓ ✓ ✓
✓ ✓ ✓ ✓ ✓
✓ ✓ ✓ ✓ ✓
✓ ✓ ✓ ✓ ✓
✓ ✓ ✓ ✓ ✓
✓ ✓ ✓ ✓ ✓
✓ ✓ ✓ ✓ ✓
✓ ✓ ✓ ✓ ✓
✓ ✓ ✓ ✓ ✓
✓ ✓ ✓
✓ ✓ ✓
✓ ✓ ✓ ✓ ✓
✓ ✓ ✓
✓ ✓
Glossary
802.11n
(
nx1
)
✓ ✓
✓ ✓
for acronyms.
802.11n
(MIMO)
1-2
1.
Selectable in the View Scale menu.
NOTE.
For the 802.11n standard, this software is compliant with Draft 11n as of
December 2006.
RSA3408A Option 29 User Manual
Page 17

Getting Started
Signal Format in
IEEE802.11n Analysis
IEEE802.11n analysis consists of 802.11n (nx1) and MIMO (2x2) analyses,
supporting three signal formats as shown in Figure 1-2.
802.11n (nx1) analysis
SISO 1x1 (one Tx antenna and one Rx antenna)
Transmission
Antenna
MISO 2x1 (two Tx antennas and one Rx antenna)
Transmission
802.11n MIMO (2x2) analysis
MIMO 2x2 (two Tx antennas and two Rx antennas)
Reception
Reception
Transmission
OutputPropagation pathInput
Reception
Figure 1-2: Signal format in IEEE802.11n analysis
MIMO (Multi-Input Multi-Output) uses more than one antennas for both
transmitting and receiving to transfer data at the same time. Radio signals input
from the transmitter go through multiple propagation paths and output to the
receiver. Multiple antennas send and receive different data streams simultaneously
over multiple paths as independent channels, resulting in a higher transmission rate
along with the number of antennas. Special, degenerated cases of MIMO are
MISO (Multi-Input Single-Output) when the receive antenna is single, and
SISO (Single-Input Single-Output) when both transmit and receive antennas
are traditionally single. The Option 29 WLAN analysis software supports three
signal formats: SISO 1x1, MISO 2x1, and MIMO 2x2.
RSA3408A Option 29 User Manual
1-3
Page 18

Getting Started
Accessing the Measurements
The Option 29 WLAN measurement functions are contained in the Demod mode
as shown in Figure 1-3. The analysis is categorized into three groups: IEEE
802.11a/b/g, 802.11n (nx1, Multi-Input Single-Output), and 802.11n MIMO
(Multi-Input Multi-Output, 2x2).
MODE
S/A
DEMOD
TIME
Measure menu items
Standard... IEEE802.11a/b/g EVM versus Time
Power ve r sus Time
Constellation
EVM versus SC
Power ve r sus SC
SC Constellation
Frequency Error
OFDM Flatness
OFDM Linearity
Symbol Table
Spectrum Mask
Tra n s m i t Po w e r
802.11n (nx1) Transfer Function (Amp)
802.11n MIMO (2x2) Transfer Function (Amp)
Transfer Function (Phase)
Delay Profile
EVM versus Time
Power ve r sus Time
Constellation
EVM versus SC
Power ve r sus SC
SC Constellation
Frequency Error
OFDM Flatness
OFDM Linearity
Symbol Table
Spectrum Mask
Transfer Function (Phase)
Delay Profile
EVM versus Time
Power ve r sus Time
Constellation
EVM versus SC
Power ve r sus SC
SC Constellation
Frequency Error
Symbol Table
1-4
Figure 1-3: Measure menu in the WLAN analysis
RSA3408A Option 29 User Manual
Page 19

Operating Basics
Page 20

Page 21

Operating Basics
This section describes the basic operation specific to the WLAN analysis with the
following topics:
Screen Elements
Setting Frequency and Span
Setting Timing Parameters
View Operation
Saving Measurement Results
NOTE.
User Manual.
For complete details on operating the analyzer, refer to the RSA3408A
RSA3408A Option 29 User Manual
2-1
Page 22

Operating Basics
Screen Elements
Figure 2-1 shows the screen elements of the WLAN analysis. The analysis runs in
the Demod (modulation analysis) mode and displays the following three views on
the screen. The spectrum mask measurement is an exception; it uses a single view
like the S/A (Spectrum Analyzer) mode.
Overview. Displays all data in one acquisition block. Use this overview to set
the timing parameters such as acquisition length and analysis length (refer to
Setting Timing Parameters on page 2-6).
Main view. Displays the measurement results and waveform for the range
specified in the overview.
Subview. Displays the spectrum (by default) for the range specified in the
overview. You can select the view content with the View Define menu.
For details on setting the views, refer to View O pe rati o n on page 2-7.
Hardware setting
Main view
Trigger status
SubviewOverview
Side menu
2-2
Current setting
Figure 2-1: Screen elements
RSA3408A Option 29 User Manual
Page 23

Setting Frequency and Span
Use the FREQUENCY/CHANNEL and the SPAN keys on the front panel to set
frequency and span. For WLAN analysis, you can use the channel tables shown in
Table 2-1.
Table 2-1: Channel table for the WLAN analysis
Channel Table Channel Center frequency (GHz)
IEEE 802.11a 34 5.170
Operating Basics
36 5.180
38 5.190
40 5.200
42 5.210
44 5.220
46 5.230
48 5.240
52 5.260
56 5.280
60 5.300
64 5.320
100 5.500
104 5.520
108 5.540
112 5.560
116 5.580
120 5.600
124 5.620
128 5.640
132 5.660
136 5.680
140 5.700
149 5.745
153 5.765
157 5.785
161 5.805
RSA3408A Option 29 User Manual
2-3
Page 24

Operating Basics
Table 2-1: Channel table for the WLAN analysis (cont.)
Channel Table Channel Center frequency (GHz)
IEEE 802.11b/g 1 2.412
2 2.417
3 2.422
4 2.427
5 2.432
6 2.437
7 2.442
8 2.447
9 2.452
10 2.457
11 2.462
12 2.467
13 2.472
14 2.484
IEEE 802.11n
(2.4 GHz)
IEEE 802.11n
(5 GHz)
1 2.422
2 2.427
3 2.432
4 2.437
5 2.442
6 2.447
7 2.452
1 5.190
2 5.230
3 5.270
4 5.310
5 5.510
6 5.550
7 5.590
8 5.630
9 5.670
10 5.755
11 5.795
2-4
RSA3408A Option 29 User Manual
Page 25

Operating Basics
The span setting depends on the measurement item as shown in Table 2-2.
Table 2-2: Span setting
Analysis type Measurement item Span
Modulation analysis Transfer Function 20 or 36 MHz
Delay Profile
EVM versus Time
Power versus Time
Constellation
EVM versus SC
Power versus SC
SC Constellation
Frequency Error
OFDM Flatness
OFDM Linearity
Symbol Table
Power analysis Spectrum Mask 100 MHz to 3 GHz
Transmit Power 20 or 36 MHz
(The default is 36 MHz)
(The default is 36 MHz)
RSA3408A Option 29 User Manual
2-5
Page 26

Operating Basics
Setting Timing Parameters
Press the TIMING key to set the timing parameters described below on the
overview (see Figure 2-2).
Acquisition Length.
Acquisition History.
Spectrum Length.
Spectrum Offset.
Analysis Length.
Analysis Offset.
Output Trigger Indicator.
Sets the time to acquire one block.
Specifies the number of the block to analyze and display.
Shows time for FFT to display spectrum in the subview.
Sets the beginning of Spectrum Length.
Sets the analysis range in time units (max. 100 ms).
Sets the beginning of Analysis Length.
Turns on or off the output trigger indicator.
For details on setting the timing and trigger, refer to the RSA3408A User Manual.
Analysis Offset
Spectrum Offset
Acquisition History
Analysis Length
2-6
Overview
The data in the analysis range
(indicated by the green lines) is
analyzed and the result is
displayed in the main view.
Output Trigger Indicator
Acquisition Length
Figure 2-2: Timing parameters
NOTE.
Only Acquisition Length is available in the Transmit Power measurement.
The Timing menu is not available in the Spectrum Mask measurement.
RSA3408A Option 29 User Manual
Page 27

View Operation
Operating Basics
This section provides view operating basics, addressing the following topics:
Changing the View Content
Selecting the Phase Unit
Scaling the Graph
Changing the View Content
Selecting the Phase Unit
You can change the view content with the VIEW: DEFINE key on the front panel.
The View Define menu has the following controls.
Show Views.
Single. Displays one view on screen.
Selects the single or multi view.
Select the view with the VIEW: SELECT key.
Multi. Displays the overview, the main view, and the subview on screen.
Overview Content...
Subview Content...
Selects the overview content.
Selects the subview content.
The view contents depend on the measurement items. Refer to each
The phase unit in the EVM measurement defaults to degrees. You can select
degrees or radians using the following steps:
1. Press the SYSTEM key.
2. Press the Instrument Setup... side key.
3. Press the Angular Units side key to select Degrees or Radians.
RSA3408A Option 29 User Manual
2-7
Page 28

Operating Basics
Scaling the Graph
You can expand a waveform horizontally and vertically using the VIEW: SCALE
key on the front panel (you cannot compress the original waveform). The scale
setting affects only the display; it does not change the acquisition parameters such
as span, center frequency, and reference level. Although the View Scale menu
varies with the measurement items, it has commonly the following controls as
shown in Figure 2-3.
Horizontal Scale.
Horizontal Start.
Vertical Scale.
Vertical Start.
Vertical Offset.
Vertical Stop.
Ver t i ca l S t o p
Sets the range of the horizontal axis.
Sets the minimum value (left edge) of the horizontal axis.
Sets the range of the vertical axis.
Sets the minimum value (bottom edge) of the vertical axis.
Sets the center value of the vertical axis.
Sets the maximum value (top edge) of the vertical axis.
Vertical Offset
Vertical Start
Horizontal Scale
Horizontal Start
Ver tica l S c ale
Figure 2-3: Definition of the View Scale menu items
Press the VIEW: SELECT key to select a view before scaling the graph using the
SCALE key. Chapter 3, Reference, describes the View Scale menu for each
measurement item. Refer to the following sections:
IEEE802.11a/b/g Analysis: View Format on page 3-11
IEEE802.11n (nx1) Analysis: View Format on page 3-55
IEEE802.11n MIMO (2x2) Analysis: View Format on page 3-102
2-8
RSA3408A Option 29 User Manual
Page 29

Saving Measurement Results
You can save measurement results to files using the SAVE key on the front panel.
Operating Basics
Save Menu
NOTE.
This section provides information about file save specific to Option 29
WLAN analysis. For details on standard file operations, refer to the RSA3408A
User Manual.
The Save menu for the modulation measurements has the following controls.
Save State.
Save Data...
Saves the instrument settings.
Saves the input waveform (IQ data in the time domain) to a file in the
IQT format.
All Blocks. Saves all the acquired blocks.
Current Block. Saves the block currently displayed in the overview.
Current Area. Saves the data in the analysis range.
Save Mainview Results.
802.11n nx1 and MIMO (2x2) analyses only. Saves the
measurement results to a file in the CSV (Comma Separated Values) format.
You can import the file into Microsoft Excel or other database systems. Refer to
Appendix B for the save format.
Submenu items for the transfer function and delay profile measurements:
Trace 1. Saves Trace 1 to a specified file.
Trace 2. Saves Trace 2 to a specified file.
Trace 1 and 2. Saves Trace 1 and 2 to two files with the file names of “1” and
“2” added respectively to a specified name.
All Data. MIMO (2x2) analysis only. Saves Trace 1 and 2 to a specified file in
all combinations of the Tx and Rx antennas.
Packets Offset. Specifies the first packet to save. (See Figure 2-4.)
Range: −[(the number of packets in the analysis range) − 1] to 0.
Zero (0) represents the latest packet.
Number of Packets. Sets the number of packets to save. (See Figure 2-4.)
Range: 1 to [−(Packet Offset) + 1].
RSA3408A Option 29 User Manual
2-9
Page 30

Operating Basics
Packets Offset
Packet
−
n
……
Saved to a file
Number of Packets
−
−
1
2
0
Figure 2-4: Setting packets to be saved
Submenu items for other than transfer function and delay profile measurements
(MIMO (2x2) analysis only):
Trace Data . Saves the displayed trace data to a specified file.
All Data. Saves the trace data to a specified file in all combinations of the Tx
and Rx antennas.
2-10
RSA3408A Option 29 User Manual
Page 31

Reference
Page 32

Page 33

IEEE802.11a/b/g Analysis
This section describes the basic operation of the IEEE802.11a/b/g analysis.
You can access the measurement items by pressing DEMOD → Standard... →
IEEE802.11a/b/g as shown in Figure 3-1.
MODE
S/A
DEMOD
TIME
Standard... IEEE802.11a/b/g
Figure 3-1: IEEE802.11a/b/g measurement menu
Measure menu items
Modulation measurement
EVM versus Time
Power versus Time
Constellation
EVM versus SC
Power versus SC
SC Constellation
Frequency Error
OFDM Flatness
OFDM Linearity
Symbol Table
Power measurement
Spectrum Mask
Transmit Power
RSA3408A Option 29 User Manual
3-1
Page 34

IEEE802.11a/b/g Analysis
Basic Measurement Procedure
The basic measurement procedures are described for the modulation analysis and
the power analysis.
Modulation Measurement
Follow these steps to perform the modulation measurement.
1. Press DEMOD → Standard... → IEEE 802.11a/b/g.
2. Set frequency and span appropriately using the FREQUENCY/CHANNEL
and the SPAN keys. Refer to Setting Frequency and Span on page 2-3.
3. Set the amplitude appropriately using the AMPLITUDE key.
NOTE.
the red box at the center top of the screen. In this case, raise the reference level.
4. Press the TIMING key and set the timing parameters.
5. After acquiring measurement data, stop the data acquisition using the
6. Press the MEASURE key and select the measurement item.
7. Press MEAS SETUP → Analysis Parameter... to preset the parameters.
If the input signal level is too high, A/D OVERFLOW will be displayed in
Refer to Setting Timing Parameters on page 2-6.
RUN/STOP key.
For example, press the Power vs Time side key to observe power variance.
a. Press the Modulation Detection... side key and select the modulation type
(data rate). The default setting is AUTO.
b. Select the Synchronization and Equalization options as necessary.
3-2
For details on setting the Measurement Setup menu, refer to page 3-5.
8. Press MEAS SETUP → Analyze to start the analysis for the acquired data
with the specified parameters.
If you cancel the analysis, press the Cancel-Back (top) side key.
9. Use the View menu to modify the displayed graph.
For details on setting the views, refer to View Format on page 3-11.
RSA3408A Option 29 User Manual
Page 35

IEEE802.11a/b/g Analysis
Power Measurement
The power analysis consists of Spectrum Mask and Transmit Power.
Follow these steps to perform the power analysis.
1. Press DEMOD → Standard... → IEEE 802.11a/b/g.
2. Set frequency and span appropriately using the FREQUENCY/CHANNEL
and the SPAN keys. Refer to Setting Frequency and Span on page 2-3.
3. Set the amplitude appropriately using the AMPLITUDE key.
NOTE.
the red box at the center top of the screen. In this case, raise the reference level.
4. Transmit Power only. Press the TIMING key and set the timing parameters.
5. Press the MEASURE key and select the measurement item. For example,
6. Press the MEAS SETUP key and set the measurement parameters.
7. Use the View menu to modify the displayed graph.
If the input signal level is too high, A/D OVERFLOW will be displayed in
Refer to Setting Timing Parameters on page 2-6.
press the Spectrum Mask side key to observe the spectrum mask.
For details on setting the Measurement Setup menu, refer to page 3-4.
For details on setting the views, refer to View Format on page 3-11.
RSA3408A Option 29 User Manual
3-3
Page 36

IEEE802.11a/b/g Analysis
Meas Setup Menu
Press the MEAS SETUP key to set the measurement parameters. The Meas Setup
menu varies among the measurement items. Refer to the section shown in
Tab le 3-1 .
Table 3-1: Measurement setup reference for the 802.11a/b/g analysis
Measurement item Reference section
Modulation measurements
EVM versus Time
Power versus Time
Constellation
EVM versus SC
Power versus SC
SC Constellation
Frequency Error
OFDM Flatness
OFDM Linearity
Symbol Table
Power measurements
Spectrum Mask Measurement Setup for Spectrum Mask on page 3-9
Transmit Power Measurement Setup for Transmit Power on page 3-10
Measurement Setup for Modulation Measurements
on page 3-5
3-4
RSA3408A Option 29 User Manual
Page 37

Measurement Setup for Modulation Measurements
The Meas Setup menu for the modulation measurements has the following
controls:
IEEE802.11a/b/g Analysis
Analyze
Analysis Parameter...
Performs the analysis for the input data in the range specified on the overview.
You need to set the analysis parameters before pressing the Analyze side key.
Modulation Detection...
Selects the demodulation type. If you select Auto, the
demodulation type will be determined dynamically by decoding the preamble.
Table 3-2: Modulation detection
Parameter Data rate Modulation 1st/2
AUTO (default) Auto Auto
OFDM,64QAM(54Mbps) 54 Mbps 64QAM/OFDM 3/4
OFDM,64QAM(48Mbps) 48 Mbps 64QAM/OFDM 2/3
OFDM,16QAM(36Mbps) 36 Mbps 16QAM/OFDM 3/4
OFDM,16QAM(24Mbps) 24 Mbps 16QAM/OFDM 1/2
OFDM,QPSK(18Mbps) 18 Mbps QPSK/OFDM 3/4
OFDM,QPSK(12Mbps) 12 Mbps QPSK/OFDM 1/2
OFDM,BPSK(9Mbps) 9 Mbps BPSK/OFDM 3/4
OFDM,BPSK(6Mbps) 6 Mbps BPSK/OFDM 1/2
CCK(11Mbps) 11 Mbps CCK
CCK(5.5Mbps) 5.5 Mbps CCK
DSSS,DQPSK(2Mbps) 2 Mbps BPSK/PBCC
DSSS,DBPSK(1Mbps) 1 Mbps QPSK/PBCC
PBCC,8PSK(33Mbps) 33 Mbps DBPSK/DSSS
PBCC,8PSK(22Mbps) 22 Mbps DQPSK/DSSS
PBCC,QPSK(11Mbps) 11 Mbps DBPSK/DSSS
PBCC,BPSK(5.5Mbps) 5.5 Mbps DQPSK/DSSS
nd
Encoding rate
Synchronization.
LT S. Default. Synchronizes with Long Training Symbol.
GI. Synchronizes with Guard Interval.
Equalization.
long training symbol during the analysis.
On. Default. Enables the data correction.
Off. Disables the data correction.
RSA3408A Option 29 User Manual
Selects the synchronization method.
Determines whether to apply the data correction using the
3-5
Page 38

IEEE802.11a/b/g Analysis
Select Subcarrier...
Subcarrier #
Symbol #
Selects subcarrier for a displayed line graph.
Data + Pilot. Default. Displays the measurement results for data and pilot.
Data. Displays the measurement results for data only.
Pilot. Displays the measurement results for pilot only.
Single Subcarrier. Displays the measurement results for the subcarrier
specified using the Subcarrier # side key below. This menu item is available
when you specify one of the following formats for a measurement display.
EVM versus Time
Power versus Time
Constellation
Specifies the subcarrier number when you select Single Subcarrier with the
Select Subcarrier... side key above. Range:
−32 to +31.
Specifies the analysis symbol number for a measurement display when you select
one of the following formats:
EVM versus SC
Power versus SC
SC Constellation
Symbol Table
NOTE.
For definition of the analysis symbol, refer to page 3-7.
The Select Subcarrier..., Subcarrier #, and Symbol # menu items are effective
only in the measurements shown in Table 3-3.
Table 3-3: Submenu availability
Measure menu item Select Subcarrier... Subcarrier # Symbol #
EVM versus Time
Power versus Time
Constellation
EVM versus SC
Power versus SC
SC Constellation
Frequency Error
OFDM Flatness
OFDM Linearity
Symbol Table
✓ ✓
✓ ✓
✓ ✓
✓
✓
✓
✓
3-6
RSA3408A Option 29 User Manual
Page 39

IEEE802.11a/b/g Analysis
Definition of the Analysis Symbol.
In the modulation analysis, it is important to
calculate average values of RMS voltage or center frequency error for enough time
to get good analysis results. The length of a signal to calculate the RMS voltage or
center frequency error is called “analysis symbol” in the WLAN analysis software.
For example, frequency error by the analysis symbol is displayed on the center
frequency error view. Although “symbol” is defined for OFDM in the 802.11a/g
standard, “analysis symbol” is used in the WLAN analysis software taking the
other modulation types into account.
The following views display the averaged values by analysis symbol for power,
EVM, magnitude error, and phase error, respectively.
Power versus Time
EVM versus Time
MagErr versus Time
PhaseErr versus Time
The following views display analysis results of power, EVM, magnitude error, and
phase error, respectively for each data point, chip, or subcarrier contained in one
analysis symbol.
Power versus SC
EVM versus SC
MagErr versus SC
PhaseErr versus SC
The length of an analysis symbol depends on the modulation type as follows:
Table 3-4: Length of an analysis symbol, IEEE802.11a/g
Part of a signal Type of the signal Length of an analysis symbol
Data part OFDM 80 sample points
DSSS 88 chips
CCK 80 chips
PBCC 80 data points
Preamble/Header part Short OFDM training symbol 16 sample points
Long OFDM training symbol 160 sample points
PLCP preamble 1584 chips
Short PLCP preamble 792 chips
PLCP header 528 chips
Short PLCP header 264 chips
RSA3408A Option 29 User Manual
3-7
Page 40

IEEE802.11a/b/g Analysis
Preamble
Modulation Type
Display Filter...
Selects the modulation type(s) to display the measurement results on the screen.
The results and graph are shown only for the types set to On.
Select cell to edit.
Selects an item to change the on/off setting in the table on screen.
The table consists of six blocks as shown in Figure 3-2. The selected item appears
on the second side key where you can turn it on or off.
All Preambles On/Off.
All Data On/Off.
Turns on or off all the preambles.
Turns on or off all the data.
Select an item to change
the on/off setting.
Turn on or off the
selected item.
Turn on or off all the
preambles.
Turn on or off all the data.
Data
IEEE 802.11a IEEE 802.11b IEEE 802.11g
Figure 3-2: Modulation Type Display Filter setting
3-8
RSA3408A Option 29 User Manual
Page 41

Measurement Setup for Spectrum Mask
The Meas Setup menu for the Spectrum Mask has the following controls:
IEEE802.11a/b/g Analysis
Spectrum Mask
Selects the spectrum mask specified in the IEEE802.11a/b standard.
(See Figure 3-3.)
DSSS (default)
OFDM
DSSS (IEEE802.11b)
-22
Power spectral density
-11 0 11 22
0 dB
Transmit spectrum mask
-30 dB
-50 dB
Frequency (MHz)
Unfiltered Sinx/x
OFDM (IEEE802.11a)
Figure 3-3: IEEE802.11a/b spectrum mask
RSA3408A Option 29 User Manual
Power spectral density
-30 -20 -11
0 dB
Transmit spectrum mask
-20 dB
-28 dB
-45 dB
0
-9
9
Typical signal spectrum
302011
Frequency (MHz)
3-9
Page 42

IEEE802.11a/b/g Analysis
Measurement Setup for Transmit Power
The Meas Setup menu for the Transmit Power has the following controls:
Transmit Power
Burst Select
Selects the measurement: Transmit Power On or Down.
The measurement results for the selected item are displayed on the screen.
On. Selects the Transmit Power On measurement.
Down. Selects the Transmit Power Down measurement.
Specifies the index of a burst to display the measurement results.
Range: from (the number of all bursts in one acquisition block) −1 to 0.
0 (zero) indicates the latest burst.
The specified burst is indicated with the green bar in the Timing field on the
overview as shown in Figure 3-4.
Overview
The burst specified with Burst Select
is indicated with the green bar.
3-10
Figure 3-4: Burst indicator on the overview
RSA3408A Option 29 User Manual
Page 43

View Format
IEEE802.11a/b/g Analysis
This section provides information about the view formats of the IEEE802.11a/b/g
analysis. It consists of two parts:
View Format for Modulation Measurements
View Format for Power Measurements
Selecting View Content
You can change the view content with the VIEW: DEFINE key on the front panel.
The view contents depend on the measurement items as shown in Table 3-5.
In the EVM measurement, you can change the measurement content using the
VIEW: SCALE key.
Table 3-5: View content selection, IEEE802.11a/b/g
→
VIEW: DEFINE
Measurement item
Modulation analysis
EVM versus Time
Power versus Time Constellation Vector / Constellation
EVM versus SC EVM
Power versus SC SC Constellation Vector / Constellation
Frequency Error OFDM Flatness OFDM Linearity Vector / Dot
Symbol Table -
Power analysis
Spectrum Mask - - Transmit Power Waveform (default)
Overview content
Waveform (default)
Spectrogram
Spectrogram
VIEW: DEFINE →
Subview content
Spectrum (default)
Constellation
EVM versus Time
Power versus Time
SC Constellation
EVM versus SC
Power versus SC
Frequency Error
OFDM Flatness
OFDM Linearity
Symbol Table
Spectrum (default)
Power On / Down
VIEW: SCALE →
Measurement content
EVM
Mag Err
Phase Err
Mag Err
Phase Err
-
NOTE.
(Spectrum Analysis) mode. Refer to the RSA3408A User Manual.
RSA3408A Option 29 User Manual
The View Define menu for Spectrum Mask is the same as in the S/A
3-11
Page 44

IEEE802.11a/b/g Analysis
View Format for Modulation Measurements
EVM versus Time
Measurement readout
The main view shows the EVM of carriers, or one or all subcarriers in a line graph,
as shown in Figure 3-5. The vertical axis represents EVM in percent and the
horizontal axis represents time in seconds.
Marker readout
• Horizontal value: Time (s)
• Vertical value: EVM (%)
Modulation type
The Select Subcarrier setting
in the Meas Setup menu
Subcarrier number setting
in the Meas Setup menu
(displayed when Select Subcarrier
is set to Single Subcarrier)
Preamble indicator: “Preamble On” is
displayed when one or more preambles are
enabled in Modulation Type Display Filter of
the Meas Setup menu.
Figure 3-5: EVM versus Time (main view)
3-12
The following table shows the measurement readout that is displayed on the left in
the main view:
Measurement readout Unit Description
Total Symbol - Total number of analysis symbols
EVM (rms) %, dB RMS value of EVM
(Peak) %, dB Peak value of EVM
(@Time) s The peak time relative to the last data point
Mag Error (rms) %, dB RMS value of Mag Error
(Peak) %, dB Peak value of Mag Error
(@Time) s The peak time relative to the last data point
degrees or
Phase Error (rms)
(Peak)
(@Time) s The peak time relative to the last data point
radians RMS value of Phase Error
degrees or
radians Peak value of Phase Error
RSA3408A Option 29 User Manual
Page 45

IEEE802.11a/b/g Analysis
View Scale Menu.
The View Scale menu for EVM versus Time has the following
controls:
Aut o Scale. Sets the start value and the scale of the vertical axis automatically
to fit the waveform to the screen.
Horizontal Scale. Sets the range of the horizontal axis (time).
Horizontal Start. Sets the minimum value (left edge) of the horizontal axis.
NOTE.
The horizontal display range must be within the analysis range specified
using the Timing menu (refer to page 2-6).
Ver t ic al S c a l e . Sets the range of the vertical axis.
Refer to Table 3-6 for the setting range.
Vertical Start. When the measurement content is EVM, sets the minimum value
(bottom edge) of the vertical axis. Refer to Table 3-6 for the setting range.
Vertical Offset. When the measurement content is Mag Error or Phase Error, sets
the center value ((maximum + minimum) / 2) of the vertical axis.
Refer to Table 3-6 for the setting range.
Table 3-6: Vertical setting range
Measurement Vertical Scale Vertical Start Vertical Offset
EVM 100
Magnitude error 200
Phase error 450
µ
to 100%
µ
to 200% -
µ
to 450
°
−
100 to 100% -
-
−
200 to 200%
−
450 to 450
°
Full Scale. Sets the scale of vertical axis to the default full-scale value.
Measurement Content... Selects how to display the vertical axis:
EVM. Represents the vertical axis with EVM (Error Vector Magnitude).
Mag Error. Represents the vertical axis with magnitude error.
Phase Error. Represents the vertical axis with phase error.
RSA3408A Option 29 User Manual
3-13
Page 46

IEEE802.11a/b/g Analysis
MagErr versus Time
Measurement readout
The main view shows the magnitude error of carriers, or one or all subcarriers in a
line graph, as shown in Figure 3-6. The vertical axis represents magnitude error in
percent and the horizontal axis represents time in seconds.
Marker readout
• Horizontal value: Time (s)
• Vertical value: Magnitude error (%)
Modulation type
The Select Subcarrier setting
in the Meas Setup menu
Subcarrier number setting
in the Meas Setup menu
(displayed when Select Subcarrier
is set to Single Subcarrier)
Preamble indicator: “Preamble On” is
displayed when one or more preambles are
enabled in Modulation Type Display Filter of
the Meas Setup menu.
Figure 3-6: MagErr versus Time (main view)
The measurement readout is the same as in EVM versus Time, shown in the table
on page 3-12.
View Scale Menu.
Refer to the View Scale menu of EVM versus Time on page 3-13.
3-14
RSA3408A Option 29 User Manual
Page 47

IEEE802.11a/b/g Analysis
PhaseErr versus Time
Measurement readout
The main view shows the Phase Error of carriers, or one or all subcarriers in a
line graph, as shown in Figure 3-7. The vertical axis represents phase error in
degrees or radians and the horizontal axis represents time in s.
Marker readout
• Horizontal value: Time (s)
• Vertical value: Phase error (degrees / radians)
Modulation type
The Select Subcarrier setting
in the Meas Setup menu
Subcarrier number setting
in the Meas Setup menu
(displayed when Select Subcarrier
is set to Single Subcarrier)
Preamble indicator: “Preamble On” is
displayed when one or more preambles are
enabled in Modulation Type Display Filter of
the Meas Setup menu.
Figure 3-7: PhaseErr versus Time (main view)
The measurement readout is the same as in EVM versus Time, shown in the table
on page 3-12.
View Scale Menu.
Refer to the View Scale menu of EVM versus Time on page 3-13.
RSA3408A Option 29 User Manual
3-15
Page 48

IEEE802.11a/b/g Analysis
Power versus Time
Measurement readout
The main view shows the power of carriers, or one or all subcarriers in a line graph,
as shown in Figure 3-8. The vertical axis represents power in dBm and the
horizontal axis represents time in seconds.
Marker readout
• Horizontal value: Time (s)
• Vertical value: Power (dBm)
Modulation type
The Select Subcarrier setting
in the Meas Setup menu
Subcarrier number setting
in the Meas Setup menu
(displayed when Select Subcarrier
is set to Single Subcarrier)
Preamble indicator: “Preamble On” is
displayed when one or more preambles are
enabled in Modulation Type Display Filter of
the Meas Setup menu.
Figure 3-8: Power versus Time (main view)
The following table shows the measurement readout that is displayed on the left in
the main view:
Measurement readout Unit Description
Total Symbol - Total number of analysis symbols
Power (rms) dBm, W RMS power of one or all subcarriers
(Peak) dBm, W Peak power of one or all subcarriers
(@Time) s The peak time relative to the last data point
3-16
RSA3408A Option 29 User Manual
Page 49

IEEE802.11a/b/g Analysis
View Scale Menu.
The View Scale menu for Power versus Time has the following
controls:
Aut o Scale. Sets the start value and the scale of the vertical axis automatically
to fit the waveform to the screen.
Horizontal Scale. Sets the range of the horizontal axis (time).
Horizontal Start. Sets the minimum value (left edge) of the horizontal axis.
NOTE.
The horizontal display range must be within the analysis range specified
using the Timing menu (refer to page 2-6).
Ver t ic al S c a l e . Sets the range of the vertical axis.
Range: 50 µ to 50 dB.
Ver t ic al S t o p . Sets the maximum value (top edge) of the vertical axis.
Range: −50 to 50 dB.
Full Scale. Sets the scale of the vertical axis to the default full-scale value.
RSA3408A Option 29 User Manual
3-17
Page 50

IEEE802.11a/b/g Analysis
Constellation
Measurement readout
The main view displays the constellation of one or all subcarriers in a rectangular
coordinates graph, as shown in Figure 3-9. The horizontal axis represents I and the
vertical axis represents Q.
Marker readout
• Time (s)
• Magnitude
• Phase (degrees / radians)
Modulation type
The Select Subcarrier setting
in the Meas Setup menu
Subcarrier number setting
in the Meas Setup menu
(displayed when Select Subcarrier
is set to Single Subcarrier)
Preamble indicator: “Preamble On” is
displayed when one or more preambles are
enabled in Modulation Type Display Filter of
the Meas Setup menu.
Figure 3-9: Constellation (main view)
The measurement readout is the same as in EVM versus Time, shown in the table
on page 3-12.
View Scale Menu.
The View Scale menu for the constellation has the following
controls:
Measurement Content... Selects vector or constellation display.
Vec tor. Selects vector display. A signal represented by phase and amplitude is
displayed in polar coordinate or IQ diagram. The red point indicates the
symbol position of the measured signal, and the yellow trace indicates the
locus of the signal between symbols.
Constellation. Selects constellation display. It is the same as the vector
display, except that only symbols of the measured signal are indicated in red,
and the locus between symbols is not shown. The cross marks indicate the
symbol positions of an ideal signal.
3-18
RSA3408A Option 29 User Manual
Page 51

IEEE802.11a/b/g Analysis
EVM versus SC
Measurement readout
The displayed graph automatically toggles depending on the modulation format
(OFDM or Non-OFDM).
OFDM.
The bar graph in the main view shows the EVM of each subcarrier for one
analysis symbol specified using the Symbol # side key in the Meas Setup menu, as
shown in Figure 3-10. The vertical axis represents EVM in percent and the
horizontal axis represents subcarrier number ranging from − 32 to +31.
Marker readout
• Horizontal value: Subcarrier number
• Vertical value: EVM (%)
Modulation type
Symbol number setting
in the Meas Setup menu
Figure 3-10: EVM versus SC (main view)
The following table shows the measurement readout that is displayed on the left in
the main view:
Measurement readout Unit Description
Total Symbol - Total number of analysis symbols
EVM (rms) %, dB RMS value of EVM
(Peak) %, dB Peak value of EVM
(@SC_No.) - The subcarrier number at the peak
Mag Error (rms) %, dB RMS value of Mag Error
(Peak) %, dB Peak value of Mag Error
(@SC_No.) - The subcarrier number at the peak
degrees or
Phase Error (rms)
(Peak)
(@SC_No.) - The subcarrier number at the peak
radians RMS value of Phase Error
degrees or
radians Peak value of Phase Error
RSA3408A Option 29 User Manual
3-19
Page 52

IEEE802.11a/b/g Analysis
View Scale Menu.
The View Scale menu in EVM versus SC for OFDM has the
following controls:
Aut o Scale. Sets the start value and the scale of the vertical axis automatically
to fit the waveform to the screen.
Horizontal Scale. Sets the range of the horizontal axis (subcarrier number).
Range: 8 to 64.
Horizontal Start. Sets the minimum value (left edge) of the horizontal axis.
Range: −32 to 24.
Ver t ic al S c a l e . Sets the range of the vertical axis.
Refer to Table 3-7 for the setting range.
Vertical Start. When the measurement content is EVM, sets the minimum value
(bottom edge) of the vertical axis. Refer to Table 3-7 for the setting range.
Vertical Offset. When the measurement content is Mag Error or Phase Error, sets
the center value ((maximum + minimum) / 2) of the vertical axis. Refer to Table 3-7
for the setting range.
Table 3-7: Vertical setting range
Measurement Vertical Scale Vertical Start Vertical Offset
µ
EVM 100
Magnitude error 200
Phase error 450
to 100%
µ
to 200% -
µ
to 450
°
−
100 to 100% -
-
−
200 to 200%
−
450 to 450
°
Full Scale. Sets the scale of vertical axis to the default full-scale value.
Measurement Content... Selects how to display the vertical axis:
EVM. Represents the vertical axis with EVM (Error Vector Magnitude).
Mag Error. Represents the vertical axis with magnitude error.
Phase Error. Represents the vertical axis with phase error.
3-20
RSA3408A Option 29 User Manual
Page 53

IEEE802.11a/b/g Analysis
Non-OFDM.
bar graph, as shown in Figure 3-11. The vertical axis represents EVM in percent
and the horizontal axis represents time in s.
Measurement readout
Figure 3-11: EVM versus Time (main view)
The measurement readout is the same as in EVM versus Time, shown in the table
on page 3-12.
The main view displays the EVM of carriers by analysis symbol in a
Marker readout
• Horizontal value: Time (s)
• Vertical value: EVM (%)
Modulation type
Symbol number setting
in the Meas Setup menu
View Scale Menu.
The View Scale menu in EVM versus SC for Non-OFDM has the
same controls as in EVM versus Time. Refer to page 3-13.
RSA3408A Option 29 User Manual
3-21
Page 54

IEEE802.11a/b/g Analysis
MagErr versus SC
Measurement readout
The displayed graph automatically toggles depending on the modulation format
(OFDM or Non-OFDM).
OFDM.
The bar graph in the main view shows the magnitude error of each
subcarrier for one analysis symbol specified using the Symbol # side key in the
Meas Setup menu, as shown in Figure 3-12.
The vertical axis represents magnitude error in percent and the horizontal axis
represents the subcarrier wave number ranging from −32 to +31.
Marker readout
• Horizontal value: Subcarrier number
• Vertical value: Magnitude error (%)
Modulation type
Symbol number setting
in the Meas Setup menu
Figure 3-12: MagErr versus SC (main view)
The measurement readout is the same as in EVM versus SC, shown in the table on
page 3-19.
View Scale Menu.
Refer to the View Scale menu of EVM versus SC on page 3-20.
3-22
RSA3408A Option 29 User Manual
Page 55

IEEE802.11a/b/g Analysis
Non-OFDM.
symbol in a bar graph, as shown in Figure 3-13. The vertical axis represents the
magnitude error in percent and the horizontal axis represents time in seconds.
Measurement readout
Figure 3-13: MagErr versus Time (main view)
The measurement readout is the same as in EVM versus Time, shown in the table
on page 3-12.
The main view displays the magnitude error of carriers by analysis
Marker readout
• Horizontal value: Time (s)
• Vertical value: Magnitude error (%)
Modulation type
Symbol number setting
in the Meas Setup menu
View Scale Menu.
The View Scale menu in MagErr versus SC for Non-OFDM has
the same controls as in EVM versus Time. Refer to page 3-13.
RSA3408A Option 29 User Manual
3-23
Page 56

IEEE802.11a/b/g Analysis
PhaseErr versus SC
Measurement readout
The displayed graph automatically toggles depending on the modulation format
(OFDM or Non-OFDM).
OFDM.
The bar graph in the main view shows the phase error of each subcarrier for
one analysis symbol specified using the Symbol # side key in the Meas Setup
menu, as shown in Figure 3-14.
The vertical axis represents phase error in degrees or radians and the horizontal axis
represents the subcarrier wave number ranging from −32 to +31.
Marker readout
• Horizontal value: Subcarrier number
• Vertical value: Phase error (
degrees / radians
Modulation type
Symbol number setting
in the Meas Setup menu
)
Figure 3-14: PhaseErr versus SC (main view)
The measurement readout is the same as in EVM versus SC, shown in the table on
page 3-19.
View Scale Menu.
Refer to the View Scale menu of EVM versus SC on page 3-20.
3-24
RSA3408A Option 29 User Manual
Page 57

IEEE802.11a/b/g Analysis
Non-OFDM.
in a bar graph, as shown in Figure 3-15. The vertical axis represents the phase error
in degrees or radians and the horizontal axis represents time in s.
Measurement readout
Figure 3-15: PhaseErr versus Time (main view)
The measurement readout is the same as in EVM versus Time, shown in the table
on page 3-12.
The main view displays the phase error of carriers by analysis symbol
Marker readout
• Horizontal value: Time (s)
• Ver tical value: Phase error (degrees / radians)
Modulation type
Symbol number setting
in the Meas Setup menu
View Scale Menu.
The View Scale menu in PhaseErr versus SC for Non-OFDM has
the same controls as in EVM versus Time. Refer to page 3-13.
RSA3408A Option 29 User Manual
3-25
Page 58

IEEE802.11a/b/g Analysis
Power versus SC
Measurement readout
The displayed graph automatically toggles depending on the modulation format
(OFDM or Non-OFDM).
OFDM.
The bar graph in the main view displays the power of each subcarrier for
one analysis symbol specified using the Symbol # side key in the Meas Setup
menu, as shown in Figure 3-16. The vertical axis represents power in dBm and the
horizontal axis represents the subcarrier number ranging from −32 to +31.
Marker readout
• Horizontal value: Subcarrier number
• Vertical value: Power (dBm)
Modulation type
Symbol number setting
in the Meas Setup menu
Figure 3-16: Power versus SC (main view)
The following table shows the measurement readout that is displayed on the left in
the main view:
Measurement readout Unit Description
Total Symbol - Total number of analysis symbols
Power (rms) dBm, W RMS power of one or all subcarriers
(Peak) dBm, W Peak power of one or all subcarriers
(@SC_No.) - Subcarrier number at the peak
3-26
RSA3408A Option 29 User Manual
Page 59

IEEE802.11a/b/g Analysis
View Scale Menu.
following controls:
Aut o Scale. Sets the start value and the scale of the vertical axis automatically
to fit the waveform to the screen.
Horizontal Scale. Sets the range of the horizontal axis (subcarrier number).
Range: 8 to 64.
Horizontal Start. Sets the minimum value (left edge) of the horizontal axis.
Range: −32 to 24.
Ver t ic al S c a l e . Sets the range of the vertical axis.
Range: 50 µ to 50 dB.
Ver t ic al S t o p . Sets the maximum value (top edge) of the vertical axis.
Range: −50 to 50 dBm.
Full Scale. Sets the scale of the vertical axis to the default full-scale value.
The View Scale menu in Power versus SC for OFDM has the
RSA3408A Option 29 User Manual
3-27
Page 60

IEEE802.11a/b/g Analysis
Non-OFDM.
bar graph, as shown in Figure 3-17. The vertical axis represents power in dBm and
the horizontal axis represents time in seconds.
Measurement readout
Figure 3-17: Power versus Time (main view)
The following table shows the measurement readout that is displayed on the left in
the main view:
The main view displays the power of carriers by analysis symbol in a
Marker readout
• Horizontal value: Time (s)
• Vertical value: Power (dBm)
Modulation type
Symbol number setting
in the Meas Setup menu
Measurement readout Unit Description
Total Symbol - Total number of analysis symbols
Power (rms) dBm, W RMS power of one or all subcarriers
(Peak) dBm, W Peak power of one or all subcarriers
(@Time) s The peak time relative to the last data point
View Scale Menu.
The View Scale menu in Power versus SC for Non-OFDM has
the same controls as in Power versus Time. Refer to page 3-17.
3-28
RSA3408A Option 29 User Manual
Page 61

IEEE802.11a/b/g Analysis
SC Constellation
Measurement readout
The displayed graph automatically toggles depending on the modulation format
(OFDM or Non-OFDM).
OFDM.
The main view displays the constellation of subcarriers in a
rectangular coordinate graph for an analysis symbol, as shown in Figure 3-18.
The horizontal axis represents I and the vertical axis represents Q.
Marker readout
• Symbol number
• Magnitude
• Phase (degrees / radians)
Modulation type
Symbol number setting
in the Meas Setup menu
Figure 3-18: Symbol Constellation (main view)
The measurement readout is the same as in EVM versus SC, shown in the table on
page 3-19.
View Scale Menu.
Same as in Constellation. Refer to page 3-18.
RSA3408A Option 29 User Manual
3-29
Page 62

IEEE802.11a/b/g Analysis
Non-OFDM.
rectangular coordinate graph for an analysis symbol, as shown in Figure 3-19.
The horizontal axis represents I, and the vertical axis represents Q.
Measurement readout
Figure 3-19: Symbol Constellation (main view)
The measurement readout is the same as in EVM versus Time, shown in the table
on page 3-12.
The main view displays the constellation of carriers in a
Marker readout
• Symbol number
• Magnitude
• Phase (degrees / radians)
Modulation type
Symbol number setting
in the Meas Setup menu
View Scale Menu.
Same as in Constellation. Refer to page 3-18.
3-30
RSA3408A Option 29 User Manual
Page 63

IEEE802.11a/b/g Analysis
Frequency Error
The main view displays the center frequency deviation over time in a line graph, as
shown in Figure 3-20. The vertical axis represents frequency error in kHz, and the
horizontal axis represents time in seconds.
Marker readout
Measurement readout
• Horizontal value: Time (s)
• Vertical value: Frequency error (Hz)
Modulation type
Figure 3-20: Frequency error (main view)
The following table shows the measurement readout that is displayed on the left in
the main view:
Measurement readout Unit Description
Total Symbol - Total number of analysis symbols
Center Frequency Error (rms) kHz RMS frequency error
(Peak) kHz Peak frequency error
(@Time) s The peak time relative to the last data point
RSA3408A Option 29 User Manual
3-31
Page 64

IEEE802.11a/b/g Analysis
View Scale Menu.
The View Scale menu for Frequency Error has the following
controls:
Aut o Scale. Sets the start value and the scale of the vertical axis automatically
to fit the waveform to the screen.
Horizontal Scale. Sets the range of the horizontal axis (time).
Horizontal Start. Sets the minimum value (left edge) of the horizontal axis.
NOTE.
The horizontal display range must be within the analysis range specified
using the Timing menu (refer to page 2-6).
Ver t ic al S c a l e . Sets the range of the vertical axis (frequency).
Range: 500 m to 500 kHz.
Ver t ic al O f f s e t. Sets the maximum value (top edge) of the vertical axis.
Range: −500 k to 500 kHz.
Full Scale. Sets the scale of the vertical axis to the default full-scale value.
3-32
RSA3408A Option 29 User Manual
Page 65

IEEE802.11a/b/g Analysis
OFDM Flatness
The main view displays each subcarrier wave flatness in a bar graph, as shown in
Figure 3-21. The vertical axis represents the deviation power of average energy
in dB, and the horizontal axis represents subcarrier wave number ranging from
−32 to +31.
Marker readout
Measurement readout
• Horizontal value: Subcarrier number
• Vertical value: Power (dBm)
Figure 3-21: OFDM flatness (main view)
Verify that the measurement results of the bar graph fall within the threshold level
displayed with two red lines.
The following table shows the measurement readout that is displayed on the left in
the main view:
Measurement readout Unit Description
Total Symbol - Total number of analysis symbols
Center Frequency Leakage dB Carrier leakage power (<2 dB in IEEE802.11a standard)
RSA3408A Option 29 User Manual
3-33
Page 66

IEEE802.11a/b/g Analysis
View Scale Menu.
controls:
Aut o Scale. Sets the start value and the scale of the vertical axis automatically
to fit the waveform to the screen.
Horizontal Scale. Sets the range of the horizontal axis (subcarrier number).
Range: 8 to 64.
Horizontal Start. Sets the minimum value (left edge) of the horizontal axis.
Range: −32 to 24.
Ver t ic al S c a l e . Sets the range of the vertical axis.
Range: 100 µ to 100 dB.
Ver t ic al S t o p . Sets the maximum value (top edge) of the vertical axis.
Range: −150 to 50 dB.
Full Scale. Sets the scale of the vertical axis to the default full-scale value.
The View Scale menu for OFDM Flatness has the following
3-34
RSA3408A Option 29 User Manual
Page 67

IEEE802.11a/b/g Analysis
OFDM Linearity
The main view displays the linearity of OFDM modulation in a line graph, as
shown in Figure 3-22. The vertical axis represents actual measurement values
in mW, and the horizontal axis represents the ideal values in mW.
Marker readout
• Marker position (set with Marker Setup → Marker X Position)
Measurement readout
• Horizontal value: Reference power (mW)
• Vertical value: Measurement power (mW)
The blue line represents the ideal line.
Figure 3-22: OFDM linearity (main view)
The measurement readout shows only the total number of analysis symbols.
View Scale Menu.
The View Scale menu for OFDM Linearity has the following
controls:
Measurement Content... Selects vector or dot display.
Vec tor. Displays yellow lines between the dots (default).
Dot. Displays the calculated result as a series of red dots.
The measurement results are displayed with the horizontal and vertical axes scaled
automatically to fit the graph to the screen.
RSA3408A Option 29 User Manual
3-35
Page 68

IEEE802.11a/b/g Analysis
Symbol Table
The main view displays the symbol table, as shown in Figure 3-23.
The table can be displayed with binary, octal, or hexadecimal digits.
Marker readout
Measurement readout
• Symbol number
• Symbol value
Figure 3-23: Symbol table (main view)
The measurement readout shows only the total number of analysis symbols.
View Scale Menu.
The View Scale menu for Symbol Table has the following
controls:
Radix. Selects the radix for displaying the table:
Hex. Hexadecimal digit
Oct. Octal digit
Bin. Default. Binary digit
Hex and Oct indicate values of binary data string in units of modulation symbol.
3-36
RSA3408A Option 29 User Manual
Page 69

View Format for Power Measurement
This subsection describes all view formats for power analysis.
IEEE802.11a/b/g Analysis
Spectrum Mask
The spectrum mask measurement verifies that the base station is not transmitting
excessive power outside of its designated channel.
OFDM.
shown in Figure 3-24. The vertical axis represents power in dBm and the
horizontal axis represents frequency in Hz.
The screen displays the spectrum waveform and mask in a line graph, as
Marker readout
• Frequency (Hz)
• Power (dBm)
Figure 3-24: Spectrum mask (OFDM)
Verify that the measurement results (line graph) fall within the threshold level.
This view does not display the measurement readouts.
RSA3408A Option 29 User Manual
3-37
Page 70

IEEE802.11a/b/g Analysis
View Scale Menu.
following controls:
Aut o Scale. Sets the start value and the scale of the vertical axis automatically
to fit the waveform to the screen.
Horizontal Scale. Sets the scale of the horizontal axis (frequency).
Horizontal Start. Sets the minimum value (left edge) of the horizontal axis.
Ver t ic al S c a l e . Sets the scale of the vertical axis (power).
Range: 100 µ to 100 dB.
Ver t ic al S t o p . Sets the maximum value (top edge) of the vertical axis.
Range: −100 to 100 dBm.
Full Scale. Sets the scale of the vertical axis to the default full-scale value.
The View Scale menu in Spectrum Mask for OFDM has the
3-38
RSA3408A Option 29 User Manual
Page 71

IEEE802.11a/b/g Analysis
Non-OFDM.
The screen displays the spectrum waveform and mask in a line graph,
as shown in Figure 3-25. The vertical axis represents power in dBm and the
horizontal axis represents frequency in Hz.
Marker readout
• Frequency (Hz)
• Power (dBm)
Figure 3-25: Spectrum mask (DSSS)
Verify that the measurement results of the line graph fall within the threshold level.
This view does not display the measurement readouts.
View Scale Menu.
The View Scale menu in Spectrum Mask for Non-OFDM has the
same controls as for OFDM. Refer to page 3-38.
RSA3408A Option 29 User Manual
3-39
Page 72

IEEE802.11a/b/g Analysis
Transmit Power
Displays the transmit power on/down ramp in a line graph with the standard mask.
NOTE.
On.
The transmit power measurement handles non-OFDM signals.
The main view displays the transmit power-on ramp in a line graph.
The vertical axis represents power in watts and the horizontal axis represents time
in seconds.
Marker readout
• Horizontal value: Time (µs)
Measurement readout
• Vertical value: Power (mW)
Figure 3-26: Transmit power on (main view)
Verify that the measurement results (line graph) fall within the threshold level.
The following table shows the measurement readout that is displayed on the left in
the main view:
Measurement readout Unit Description
Power On s Transmit power-on ramp from 10 to 90%
Power Down s Transmit power-down ramp from 90 to 10%
3-40
RSA3408A Option 29 User Manual
Page 73

IEEE802.11a/b/g Analysis
Figure 3-27 shows the IEEE802.11b standard for the transmit power-on ramp.
Transmit
power
output
Max Tx power
90% max
10% max
01234 Time (
µ
s)
Figure 3-27: IEEE802.11b Transmit power-on ramp
View Scale Menu.
The View Scale menu for Transmit Power On has the following
controls:
Aut o Scale. Sets the start value and the scale of the vertical axis automatically
to fit the waveform to the screen.
Horizontal Scale. Sets the range of the horizontal axis (time).
Horizontal Start. Sets the minimum value (left edge) of the horizontal axis.
NOTE.
The horizontal display range must be within the analysis range specified
using the Timing menu (refer to page 2-6).
Ver t ic al S c a l e . Sets the range of the vertical axis (power).
Range: 800 p to 800 µW.
Ver t ic al S t o p . Sets the maximum value (top edge) of the vertical axis.
Range: 0 to 1.6 mW.
Full Scale. Sets the scale of the vertical axis to the default full-scale value.
RSA3408A Option 29 User Manual
3-41
Page 74

IEEE802.11a/b/g Analysis
Down.
The main view displays the transmit power-down ramp in a line graph. The
vertical axis represents power in watts and the horizontal axis represents time
in seconds.
Marker readout
• Horizontal value: Time (µs)
Measurement readout
• Vertical value: Power (mW)
Figure 3-28: Transmit power down (main view)
Verify that the measurement results (line graph) fall within the threshold level.
The readout is the same as Transmit Power-On. Refer to page 3-40.
Figure 3-29 shows the IEEE802.11b standard for the transmit power-down ramp.
Transmit
power
output
01234 Time (
Max Tx power
90% max
10% max
µ
s)
Figure 3-29: IEEE802.11b Transmit power-down ramp
3-42
View Scale Menu.
The View Scale menu for Transmit Power Down has the same
controls as for Transmit Power On. Refer to page 3-41.
RSA3408A Option 29 User Manual
Page 75

802.11n (nx1) Analysis
This section describes the basic operation of the IEEE802.11n (nx1, Multi-Input
Single-Output) analysis. You can access the measurement items by pressing
DEMOD → Standard... → 802.11n (nx1) as shown in Figure 3-30.
NOTE.
The 802.11n (nx1) analysis includes the 1x1 (SISO: Single-Input
Single-Output) and the 2x1 (MISO: Multi-Input Single-Output) measurements.
The measurements other than Transfer Function and Delay Profile are for
SISO only.
MODE
S/A
DEMOD
TIME
Standard... 802.11n (nx1)
Measure menu items
Modulation measurement
Transfer Function (Amp)
Transfer Function (Phase)
Delay Profile
EVM versus Time
Power ver sus T ime
Constellation
EVM versus SC
Power ver sus S C
SC Constellation
Frequency Error
OFDM Flatness
OFDM Linearity
Symbol Table
Power measurement
Spectrum Mask
SISO (1x1) only
Figure 3-30: IEEE
While SISO is a traditional one-to-one communication method, MISO is a
many-to-one system for improving the communication speed. The next section
explains how the analyzer processes data in MISO (2x1).
RSA3408A Option 29 User Manual
802.11
n (nx1) measurement menu
3-43
Page 76

802.11n (nx1) Analysis
Data Process Flow for MISO (2x1)
Figure 3-31 shows the data process flow in MISO (2x1). Packet 1 and 2 transmitted
from Tx antenna 1 and 2 respectively are received by an Rx antenna. Packet 1 and 2
acquired by the analyzer are processed to extract LTF (Long Training Field). Then,
the transfer function is calculated using the LTF parts. For MISO (2x1), two
transfer functions are obtained according to the combination of the Tx and Rx
antennas so the delay profile as well as the amplitude and phase transfer functions
can be observed on the screen.
Tx Antenna 1 Tx Antenna 2
Tx1 Packet Tx2 Packet
LT FData 1 LT FData 2
Rx Antenna
RSA3408A
Acquired packets
LT F
Processed in the analyzer
Measurement and display
• Transfer function (Amplitude / Phase)
• Delay profile
Figure 3-31: Data process flow for MISO (2x1)
* Abbr.
LTF: Long Training Field.
TFm: Transfer Function from Tx antenna m to Rx antenna.
Transfer Functions (TF) calculation
TF1
TF2
3-44
RSA3408A Option 29 User Manual
Page 77

Basic Measurement Procedure
The basic measurement procedures are described for the modulation analysis and
the power analysis.
802.11n (nx1) Analysis
Modulation Measurement
Do the following steps to perform the modulation measurement.
1. Press DEMOD → Standard... → 802.11n (nx1).
2. Set frequency and span appropriately using the FREQUENCY/CHANNEL
and the SPAN keys. Refer to Setting Frequency and Span on page 2-3.
3. Set the amplitude appropriately using the AMPLITUDE key.
NOTE.
the red box at the center top of the screen. In this case, raise the reference level.
4. Press the TIMING key and set the timing parameters.
5. After acquiring measurement data, stop the data acquisition using the
6. Press the MEASURE key and select a measurement item.
7. Press MEAS SETUP to set the measurement parameters.
8. Press MEAS SETUP → Analyze to start the analysis for the acquired data
If the input signal level is too high, A/D OVERFLOW will be displayed in
Refer to Setting Timing Parameters on page 2-6.
RUN/STOP key.
For example, press the Transfer Function (Amp) side key to observe the
amplitude transfer function.
For details on setting the Measurement Setup menu, refer to page 3-47.
with the specified parameters.
9. Use the View menu to modify the displayed graph.
RSA3408A Option 29 User Manual
If you cancel the analysis, press the Cancel-Back (top) side key.
For details on setting the views, refer to View Format on page 3-55.
3-45
Page 78

802.11n (nx1) Analysis
Power Measurement
Meas Setup Menu
The power analysis includes only the Spectrum Mask measurement.
Do the following steps to perform the measurement.
1. Press DEMOD → Standard... → 802.11n (nx1).
2. Set frequency and span appropriately using the FREQUENCY/CHANNEL
and the SPAN keys. Refer to Setting Frequency and Span on page 2-3.
3. Set the amplitude appropriately using the AMPLITUDE key.
NOTE.
If the input signal level is too high, A/D OVERFLOW will be displayed in
the red box at the center top of the screen. In this case, raise the reference level.
4. Press the MEASURE → Spectrum Mask to observe the spectrum mask.
5. Press the MEAS SETUP key and set the measurement parameters.
For details on setting the Measurement Setup menu, refer to page 3-52.
6. Use the View menu to modify the displayed graph.
For details on setting the views, refer to View Format on page 3-55.
Press the MEAS SETUP key to set the measurement parameters. The Meas Setup
menu varies among the measurement items. Refer to the section shown in
Tab le 3-8 .
Table 3-8: Measurement setup reference for the 802.11n (nx1) analysis
Measurement item Reference section
Modulation measurements
Transfer Function
Delay Profile
EVM versus Time
Power versus Time
Constellation
EVM versus SC
Power versus SC
SC Constellation
Frequency Error
OFDM Flatness
OFDM Linearity
Symbol Table
Power measurements
Spectrum Mask Measurement Setup for Spectrum Mask on page 3-52
* SC: Subcarrier
Measurement Setup for Modulation Measurements
on page 3-47
3-46
RSA3408A Option 29 User Manual
Page 79

Measurement Setup for Modulation Measurements
The Meas Setup menu for the modulation analysis has the following controls:
802.11n (nx1) Analysis
Analyze
Analysis Parameter...
Performs measurements for packets in the analysis range.
NOTE.
When you change settings in the Meas Setup menu described below, press
the Analyze side key to perform the measurement for the modified settings.
You need to set the analysis parameters before pressing the Analyze side key.
Synchronization.
LT F. Default. Synchronizes with the Long Training Field.
Pilot. Synchronizes with the pilot signals.
Equalization.
Selects the synchronization method.
Determines whether to apply the data correction using the
long training symbol during the analysis.
On. Default. Enables the data correction.
Off. Disables the data correction.
Signal Format.
1x1. Default. Selects the communication by one Tx and one Rx antenna.
Selects the signal format.
2x1. Selects the communication by two Tx antennas and one Rx antenna.
Select Tx Antenna...
For Transfogram (Amplitude/Phase) or Delayogram in the subview only.
Selects the transmission antenna.
Tx Antenna 1. Displays the measurement results for signals transmitted by
Tx Antenna 2. Displays the measurement results for signals transmitted by
Packet #
Selects a packet to analyze.
Range: −[(the number of packets in the analysis range) − 1] to 0.
Zero (0) represents the latest packet.
RSA3408A Option 29 User Manual
Tx Antenna 1.
Tx Antenna 2.
3-47
Page 80

802.11n (nx1) Analysis
Select Subcarrier...
Subcarrier #
Symbol #
Selects the subcarrier type for displaying the graph.
Data + Pilot. Default. Displays the measurement results for data and pilot.
Data. Displays the measurement results for data only.
Pilot. Displays the measurement results for pilot only.
Single Subcarrier. Displays the measurement results for the subcarrier
specified using the Subcarrier # side key below.
Specifies the subcarrier number for the measurement.Range: −64 to +63.
Specifies the analysis symbol number for the measurement.
Range: −[(the number of symbols in the analysis range) − 1] to 0.
Zero (0) represents the latest analysis symbol.
NOTE.
For definition of the analysis symbol, refer to page 3-50.
The Select Subcarrier..., Subcarrier #, and Symbol # menu items are effective
only in the measurements shown in Table 3-9.
Table 3-9: Submenu availability
Measure menu item Select Subcarrier... Subcarrier # Symbol #
Transfer Function
Delay Profile
EVM versus Time
Power versus Time
Constellation
EVM versus SC
Power versus SC
SC Constellation
Frequency Error
OFDM Flatness
OFDM Linearity
Symbol Table
* SC: Subcarrier
✓ ✓
✓ ✓
✓ ✓
✓ ✓
✓
✓
✓
✓
✓
3-48
RSA3408A Option 29 User Manual
Page 81

802.11n (nx1) Analysis
Definition of the Analysis Symbol.
In the modulation analysis, it is important to
calculate average values of RMS voltage or center frequency error for enough time
to get good analysis results. The length of a signal to calculate the RMS voltage or
center frequency error is called “analysis symbol” in the WLAN analysis software.
For example, frequency error by the analysis symbol is displayed on the center
frequency error view. Although “symbol” is defined for OFDM in the 802.11n
standard, “analysis symbol” is used in the WLAN analysis software taking the
other modulation types into account.
The following views display the averaged values by analysis symbol for power,
EVM, magnitude error, and phase error, respectively.
Power versus Time
EVM versus Time
MagErr versus Time
PhaseErr versus Time
The following views display analysis results of power, EVM, magnitude error, and
phase error, respectively for each data point, chip, or subcarrier contained in one
analysis symbol.
Power versus SC
EVM versus SC
MagErr versus SC
PhaseErr versus SC
The length of an analysis symbol depends on the modulation type as follows:
Table 3-10: Length of an analysis symbol, IEEE802.11n
Part of a signal Type of the signal Length of an analysis symbol
Data part OFDM 80 (20 MHz) / 160 (40 MHz)
sample points
DSSS 88 chips
CCK 80 chips
PBCC 80 data points
Preamble/Header part Short OFDM training field 16 (20 MHz) / 32 (40 MHz)
sample points
Long OFDM training field 160 (20 MHz) / 320 (40 MHz)
sample points
PLCP preamble 1584 chips
Short PLCP preamble 792 chips
PLCP header 528 chips
Short PLCP header 264 chips
RSA3408A Option 29 User Manual
3-49
Page 82

802.11n (nx1) Analysis
Modulation Type
Display Filter...
Selects the modulation type(s) to display the measurement results on the screen.
The results and graph are shown only for the types set to On. See Figure 3-32.
Select cell to edit.
Selects an item to change the on/off setting in the table on screen.
The table consists of five blocks as shown in Figure 3-32. The selected item appears
on the second side key where you can turn on or off.
11bg. Turns on or off the 802.11b and g formats.
All PLCP Packet format On/Off.
Turns on or off all of the following PLCP (Physical
Layer Convergence Protocol) packet formats.
Legacy. Packets are transmitted in the legacy 802.11a/g format.
Mixed Mode. Packets are transmitted with a preamble compatible with the
legacy 802.11a/g. The rest of the packet has a new format.
Green Field. High throughput packets are transmitted without a
legacy compatible part.
All Preambles On/Off.
Signal (HT-SIG)
Turns on or off all of the following preambles.
Standard
PLCP Packet
format
Preamble
Data
Short Training Field (HT-STF)
Long Training Field (HT-LTF)
Select an item and
turn it on or off.
GI
(Guard Interval)
Operation of PHY
(Physical Layer)
Figure 3-32: Modulation Type Display Filter setting in the nx1 analysis
3-50
RSA3408A Option 29 User Manual
Page 83

802.11n (nx1) Analysis
All Data On/Off.
OFDM 64QAM
OFDM 16QAM
OFDM QPSK
OFDM BPSK
All GI On/Off.
Normal (800 ns)
Short (400 ns)
All Operation of PHY On/Off.
Turns on or off all of the following data.
Turns on or off all of the following GI (Guard Interval).
Turns on or off all of the following operations of PHY
(physical layer).
20MHz. 20 MHz bandwidth HT (High Throughput) mode.
40MHz. 40 MHz bandwidth HT (High Throughput) mode.
Duplicate. Duplicate Legacy Mode in which the device operates in a 40 MHz
channel composed of two adjacent 20 MHz channels.
Upper. 40 MHz Upper Mode used to transmit a legacy or HT packet in the
upper 20 MHz channel of a 40 MHz channel.
Lower. 40 MHz Lower Mode used to transmit a legacy or HT packet in the
lower 20 MHz channel of a 40 MHz channel.
RSA3408A Option 29 User Manual
3-51
Page 84

802.11n (nx1) Analysis
Measurement Setup for Spectrum Mask
The Meas Setup menu for the Spectrum Mask has the following controls:
20 MHz
Span = 100 MHz
−
Spectrum Mask
Power spectral density
30
−
20
Selects the transmit spectral mask specified in the IEEE802.11n standard.
(See Figure 3-33.)
20MHz. Default. Selects the mask for 20 MHz transmission.
40MHz. Selects the mask for 40 MHz transmission.
0 dB
−
20 dB
−
28 dB
−
45 dB
−
11
−
9
0
9
Transmit spectrum mask
Typical signal spectrum
302011
Frequency (MHz)
40 MHz
Span = 150 MHz
−
60
−
40
Power spectral density
−
21
Figure 3-33: 802.11n (nx1) spectrum mask
3-52
0 dB
−
20 dB
−
28 dB
−
45 dB
0
−
19
19
Transmit spectrum mask
Typical signal spectrum
604021
Frequency (MHz)
RSA3408A Option 29 User Manual
Page 85

802.11n (nx1) Analysis
Limits...
You can edit the spectral mask. Modify the offset frequency and limit level for the
points A to D shown in Figure 3-34. The setting values are indicated for each point
in the limits table on the bottom of the screen. Use the following controls:
Select column to edit.
Lower Offset Frequency.
Selects the column (A to D) to edit in the limits table.
Sets the frequency offset from the center frequency for the
selected point in the lower side.
Range: −75 MHz to −20 MHz (20 MHz mask) / −40 MHz (40 MHz mask).
Lower Limit.
Sets the limit level for the selected point in the lower side.
Range: −200 to 200 dBr.
Upper Offset Frequency.
Sets the frequency offset from the center frequency for the
selected point in the upper side.
Range: 20 MHz (20 MHz mask) / 40 MHz (40 MHz mask) to 75 MHz.
Upper Limit.
Sets the limit level for the selected point in the upper side.
Range: −200 to 200 dBr.
Lower side Upper side
D
C
B
A
Figure 3-34: Editing the spectral mask
D
C
B
A
RSA3408A Option 29 User Manual
3-53
Page 86

802.11n (nx1) Analysis
Symmetric Mask.
On. Creates a symmetrical mask. Set the frequency offset and limit values for
Determines whether the mask is symmetrical or not.
the lower side only.
Off. Allows you to set the frequency offset and limit values for the lower and
the upper side separately.
Default Limits.
Returns the offset and limit settings to the default values.
3-54
RSA3408A Option 29 User Manual
Page 87

View Format
802.11n (nx1) Analysis
This section provides information about the view formats specific to the 802.11n
(nx1) analysis. It consists of two parts:
View Format for Modulation Measurements
View Format for Power Measurements
Selecting View Content
You can change the view content with the VIEW: DEFINE key on the front panel.
The view contents depend on the measurement items as shown in Table 3-11.
In the EVM measurement, you can change the measurement content using the
VIEW: SCALE key.
Table 3-11: View content selection, 802.11n (nx1)
→
VIEW: DEFINE
Measurement item
Modulation measurement
Transfer Function (Amplitude)
Transfer Function (Phase)
Delay Profile
EVM versus Time
Power versus Time Constellation Vector / Constellation
EVM versus SC EVM
Power versus SC SC Constellation Vector / Constellation
Frequency Error OFDM Flatness OFDM Linearity Vector / Dot
Symbol Table -
Power measurement
Spectrum Mask - - -
* SC: Subcarrier
Overview content
Waveform (default)
Spectrogram
VIEW: DEFINE →
Subview content
Spectrum (default)
Transogram (Amplitude / Phase)
Transfer Function (Amplitude / Phase)
Delayogram
Delay Profile
Spectrum (default)
Constellation
EVM versus Time
Power versus Time
SC Constellation
EVM versus SC
Power versus SC
Frequency Error
OFDM Flatness
OFDM Linearity
Symbol Table
VIEW: SCALE →
Measurement content
-
-
EVM
Mag Err
Phase Err
Mag Err
Phase Err
NOTE.
(Spectrum Analysis) mode. Refer to the RSA3408A User Manual.
RSA3408A Option 29 User Manual
The View menu for Spectrum Mask is the same as in the S/A
3-55
Page 88

802.11n (nx1) Analysis
List Display
Available for the modulation measurements other than Transfer Function and
Delay Profile. The measurement results are represented in graph form by default.
You can select the list display as shown in Figure 3-35. Press VIEW: DEFINE →
Display → List. .
Figure 3-35: List display
3-56
RSA3408A Option 29 User Manual
Page 89

View Format for Modulation Measurements
The modulation measurement result is displayed in the main view, showing the
packet information and measured values on the left side and the measurement
graph on the right side (see Figure 3-36).
Packet information
(common to all modulation
measurements)
Measured values
(vary by measurements)
Figure 3-36: Measurement result display (an example of EVM versus Time)
802.11n (nx1) Analysis
Measurement graph
Packet Information
The packet information displayed on the left side of the main view is common to
all modulation measurements, containing the following fields:
Format.
Legacy. Packets are transmitted in the legacy 802.11a/b/g format.
Mixed Mode. Packets are transmitted with a preamble compatible with the
indicates the signal format.
legacy 802.11a/b/g and the rest of the packet has a new format.
Green Field. HT packets are transmitted without a legacy compatible part.
Mode.
Indicates the operating mode. There are two major modes:
Legacy. The legacy mode equivalent to 802.11a/b/g.
HT. The HT (High Throughput) mode specified in 802.11n.
Each mode is further divided to the following modes by the frequency band used:
20 MHz. Uses 20 MHz bandwidth.
40 MHz. Uses 40 MHz bandwidth (HT mode only).
Duplicate. Uses a 40 MHz channel composed of two adjacent 20 MHz
channel.
Upper. Uses the upper 20 MHz channel of a 40 MHz channel.
Lower. Uses the lower 20 MHz channel of a 40 MHz channel.
RSA3408A Option 29 User Manual
3-57
Page 90

802.11n (nx1) Analysis
Symbol.
Long or Short Preamble
L-STF (Legacy Short Training Field)
L-LTF (Legacy Long Training Field)
Long or Short Header
L-SIG (Legacy Signal Field)
DSSS 1M or 2M
CCK 5.5M or 11M
PBCC 5.5M, 11M, 22M, or 33M
OFDM BPSK, QPSK, 16QAM, or 64QAM
HT-STF (High Throughput Short Training Field)
HT-LTF (High Throughput Long Training Field)
HT-SIG (High Throughput Signal Field)
Indicates the type of preamble, header, or data of the analysis symbol.
If the type cannot be determined, “Unknown” is indicated.
GI.
Indicates the guard interval.
Normal (800 ns)
Short (400 ns)
MCS.
Indicates the MCS (Modulation and Coding Scheme) index (0 to 76)
specified in 802.11n. For the details on MCS, refer to the 802.11n specification.
Total Packet / Symbol.
Indicates the total number of packets and analysis symbols
in the analysis range, respectively.
3-58
RSA3408A Option 29 User Manual
Page 91

802.11n (nx1) Analysis
Transfer Function
(Amplitude)
The main view displays the amplitude transfer function as shown in Figure 3-37.
This graph indicates an amplitude variation for each subcarrier during the signal
propagation from Tx system to Rx system. The horizontal axis represents
subcarrier number and the vertical axis represents amplitude variation in dBm.
Packet information
(refer to page 3-57)
Figure 3-37: Transfer function, amplitude (main view)
View Scale Menu.
following controls:
Aut o Scale. Sets the start value and the scale of the vertical axis automatically
to fit the waveform to the screen.
Marker readout
• Horizontal value: Subcarrier number
• Vertical value: Amplitude variation (dBm)
Transmitting and receiving antennas
for Trace 1 (yellow) and Trace2 (green)
(Displayed when selecting 2x1 in MEAS SETUP
→
Analysis Parameter → Signal Format)
The View Scale menu for Transfer Function (Amplitude) has the
Horizontal Scale. Sets the range of the horizontal axis.
Range: 16 to 128 subcarriers.
Horizontal Start. Sets the minimum value (left edge) of the horizontal axis.
Range: −64 to 8.
Ver t ic al S c a l e . Sets the range of the vertical axis.
Range: 100 µ to 100 dB.
Vertical Start. Sets the minimum value (bottom edge) of the vertical axis.
Range: −200 to 0 dBm.
Full Scale. Sets the scale of the vertical axis to the default full-scale value.
RSA3408A Option 29 User Manual
3-59
Page 92

802.11n (nx1) Analysis
Transfogram (Amplitude)
Marker readout
• Horizontal value: Subcarrier number
• Color value: Amplitude (dBm)
• Vertical value: Time (packet number)
Subview only. It displays the time series of amplitude transfer function.
The amplitude at a given subcarrier and time (packet number) is displayed as a
color map in a two dimensional diagram as shown in Figure 3-38.
Transmitting and receiving antennas.
Transmitting antenna can be selected by
MEAS SETUP → Select Tx Antenna...
Figure 3-38: Transogram, amplitude (subview)
View Scale Menu.
The View Scale menu for Transogram (Amplitude) has the
following controls:
Aut o Scale. Sets the start value and the scale of the vertical axis automatically to
fit the waveform to the screen.
Horizontal Scale. Sets the scale of the horizontal axis.
Range: 16 to 128 subcarriers.
Horizontal Start. Sets the start subcarrier number of the horizontal axis.
Range: −64 to 8.
Ver t ic al S i z e. Sets the full scale of the vertical axis.
Range: 58 to 59392 packets.
Vertical Start. Sets the start packet number of the vertical axis.
Range: − [(the number of packets in the analysis range) − 1] to 0.
Zero (0) represents the latest packet.
Color Scale. Sets the range of the color axis.
Range: 10 to 100 dB in a 1-2-5 sequence.
The transfogram is displayed in 100 steps (100 colors) from the minimum value
(blue) to the maximum value (red) in the default state.
Color Stop. Sets the maximum value (top edge) of the color axis.
Range: −100 to 100 [dB].
Full Scale. Sets Color Stop to 0 (zero) and Color Scale to 100 dBm.
3-60
RSA3408A Option 29 User Manual
Page 93

802.11n (nx1) Analysis
Transfer Function
(Phase)
The main view displays the phase transfer function as shown in Figure 3-39. This
graph indicates a phase lead or lag for each subcarrier during the signal propagation
from Tx system to Rx system. The horizontal axis represents subcarrier number
and the vertical axis represents phase lead or lag in degrees or radians.
Packet information
(refer to page 3-57)
Figure 3-39: Transfer function, phase (main view)
View Scale Menu.
following controls:
Aut o Scale. Sets the start value and the scale of the vertical axis automatically
to fit the waveform to the screen.
Marker readout
• Horizontal value: Subcarrier number
• Vertical value: Phase lead/lag (degrees)
Transmitting and receiving antennas
for Trace 1 (yellow) and Trace2 (green)
(Displayed when selecting 2x1 in MEAS SETUP
→
Analysis Parameter → Signal Format)
The View Scale menu for Transfer Function (Amplitude) has the
Horizontal Scale. Sets the range of the horizontal axis.
Range: 16 to 128 subcarriers.
Horizontal Start. Sets the minimum value (left edge) of the horizontal axis.
Range: −64 to 8.
Ver t ic al S c a l e . Sets the range of the vertical axis.
Range: 800 µ to 800 degrees.
Ver t ic al S t a r. Sets the minimum value (bottom edge) of the vertical axis.
Range: −1200 to 400 degrees.
Full Scale. Sets the scale of the vertical axis to the default full-scale value.
RSA3408A Option 29 User Manual
3-61
Page 94

802.11n (nx1) Analysis
Transfogram (Phase)
Marker readout
• Horizontal value: Subcarrier number
• Color value: Phase (degrees)
• Vertical value: Time (packet number)
Subview only. It displays the time series of phase transfer function.
The phase at a given subcarrier and time (packet number) is displayed as a
color map in a two dimensional diagram as shown in Figure 3-40.
Transmitting and receiving antennas.
Transmitting antenna can be selected by
MEAS SETUP → Select Tx Antenna...
Figure 3-40: Transfogram, phase (subview)
View Scale Menu.
The View Scale menu for Transogram (Phase) has the following
controls:
Aut o Scale. Sets the start value and the scale of the vertical axis automatically to
fit the waveform to the screen.
Horizontal Scale. Sets the scale of the horizontal axis.
Range: 16 to 128 subcarriers.
Horizontal Start. Sets the start channel number of the horizontal axis.
Range: −64 to 8.
Ver t ic al S i z e. Sets the full scale of the vertical axis.
Range: 58 to 59392 packets.
Vertical Start. Sets the start packet number of the vertical axis.
Range: − [(the number of packets in the analysis range) − 1] to 0.
Zero (0) represents the latest packet.
Color Scale. Sets the range of the color axis:
Range: 10 to 100 dB in 1-2-5 sequence.
The transogram is displayed in 100 steps (100 colors) from the minimum value
(blue) to the maximum value (red) in the default state.
Color Stop. Sets the maximum value (top edge) of the color axis.
Range: −100 to +100 dB.
Full Scale. Sets Color Stop to 0 (zero) and Color Scale to 100 dBm.
3-62
RSA3408A Option 29 User Manual
Page 95
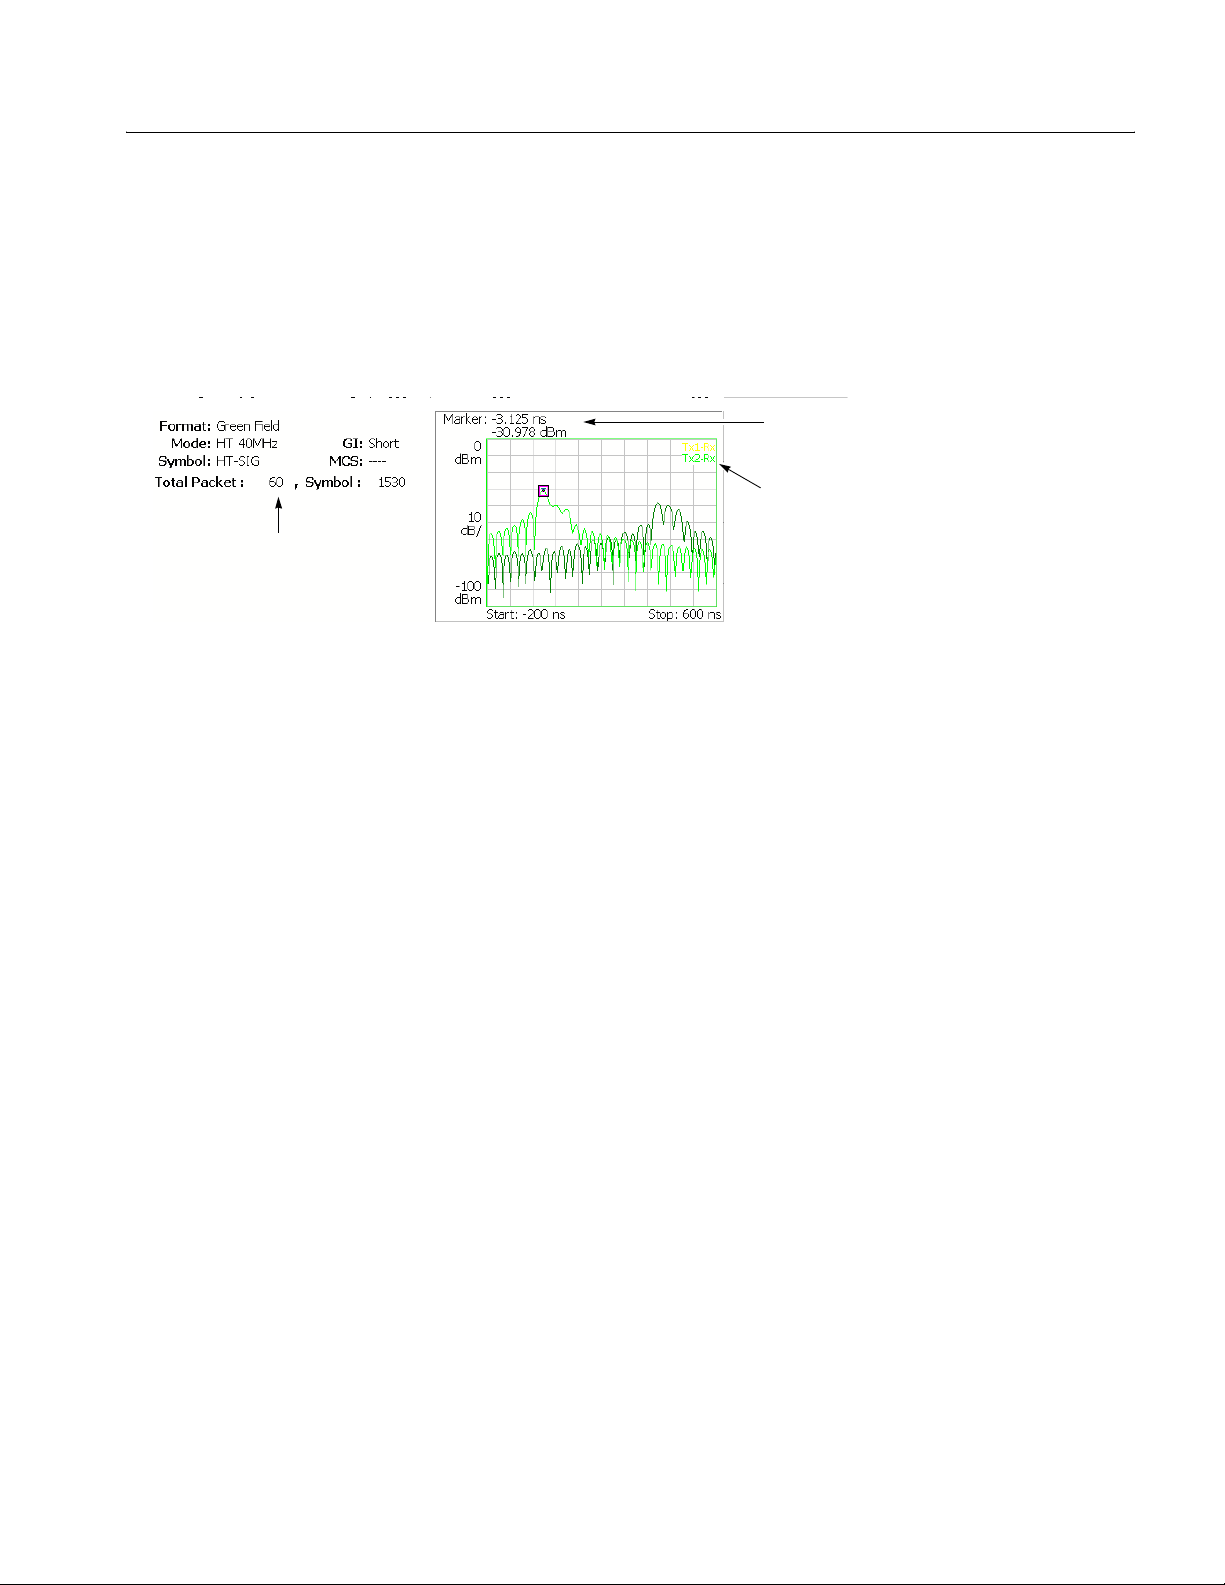
802.11n (nx1) Analysis
Delay Profile
The main view shows the delay profile as shown in Figure 3-41. In the n× 1
communication method, transmitted signals propagate through multipath with
different distance to reach a receiving antenna. The path difference causes the
received signals some temporal dispersion. The delay profile shows the power
distribution to the delay time. The vertical axis represents amplitude in dBm and
the horizontal axis represents delay time in seconds.
Packet information
(refer to page 3-57)
Figure 3-41: Delay profile (main view)
View Scale Menu.
controls:
Marker readout
• Horizontal value: Delay time (s)
• Vertical value: Amplitude (dBm)
Transmitting and receiving antennas
for Trace 1 (yellow) and Trace2 (green)
(Displayed when selecting 2x1 in MEAS SETUP
→
Analysis Parameter → Signal Format)
The View Scale menu for Delay Profile has the following
Aut o Scale. Sets the start value and the scale of the vertical axis automatically
to fit the waveform to the screen.
Horizontal Scale. Sets the range of the horizontal axis.
Range: S
/16 to S0 (sec) where S0 is the initial horizontal scale.
0
Horizontal Start. Sets the minimum value (left edge) of the horizontal axis.
Range: −S
/2 to [S0/2 − (Horizontal Scale)] (sec).
0
Ver t ic al S c a l e . Sets the range of the vertical axis.
Range: 100 µ to 100 dB.
Ver t ic al S t a r. Sets the minimum value (bottom edge) of the vertical axis.
Range: −200 to 0 dBm.
Full Scale. Sets the scale of the vertical axis to the default full-scale value.
RSA3408A Option 29 User Manual
3-63
Page 96

802.11n (nx1) Analysis
Delayogram
Subview only. It displays the time series of delay profile.
The power at a given delay time and packet number is displayed as a color map in
a two dimensional diagram as shown in Figure 3-42.
Marker readout
• Horizontal value: Delay time (s)
• Color value: Amplitude (dBm)
• Vertical value: Time, packet number
Figure 3-42: Delayogram (subview)
View Scale Menu.
controls:
Aut o Scale. Sets the start value and the scale of the vertical axis automatically to
fit the waveform to the screen.
Transmitting and receiving antennas.
Transmitting antenna can be selected by
MEAS SETUP → Select Tx Antenna...
The View Scale menu for Delayogram has the following
Horizontal Scale. Sets the range of the horizontal axis.
Range: S
/16 to S0 (sec) where S0 is the initial horizontal scale.
0
Horizontal Start. Sets the minimum value (left edge) of the horizontal axis.
Range: −S
/2 to [S0/2 − (Horizontal Scale)] (sec).
0
Ver t ic al S i z e. Sets the full scale of the vertical axis in frames.
Range: 58 to 59392.
Vertical Start. Sets the start packet number of the vertical axis.
Range: − [(the number of packets in the analysis range) − 1] to 0.
Zero (0) represents the latest packet.
Color Scale. Sets the range of the color axis:
Range: 10 to 100 dB in 1-2-5 sequence.
The delayogram is displayed in 100 steps (100 colors) from the minimum value
(blue) to the maximum value (red) in the default state.
Color Stop. Sets the maximum value (top edge) of the color axis.
Range: −100 to +100 dB.
Full Scale. Sets Color Stop to 0 (zero) and Color Scale to 100 dBm.
3-64
RSA3408A Option 29 User Manual
Page 97

802.11n (nx1) Analysis
EVM versus Time
Packet information
(refer to page 3-57)
Measurement readout
(refer to the table below)
The main view shows the EVM of carriers, or one or all subcarriers in a line graph,
as shown in Figure 3-43. The vertical axis represents EVM in percent and the
horizontal axis represents time in seconds.
Marker readout
• Horizontal value: Time (s)
• Vertical value: EVM (%)
Modulation type
The Select Subcarrier setting
in the Meas Setup menu
Subcarrier number setting
in the Meas Setup menu
(displayed when Select Subcarrier
is set to Single Subcarrier)
Preamble indicator: “Preamble On” is
displayed when one or more preambles are
enabled in Modulation Type Display Filter of
the Meas Setup menu.
Figure 3-43: EVM versus Time (main view)
The following table shows the measurement readout that is displayed on the left in
the main view:
Measurement readout Unit Description
EVM (rms) %, dB RMS value of EVM
(Peak @ time) %, dB Peak value of EVM at the time
Mag Error (rms) %, dB RMS value of Mag Error
(Peak @ time) %, dB Peak value of Mag Error at the time
Phase Error (rms) degrees or radians RMS value of Phase Error
(Peak @ time) degrees or radians Peak value of Phase Error at the time
Origin Offset dB Origin offset (IQ feedthrough)
1.
The time is relative to the last data point.
1
1
1
RSA3408A Option 29 User Manual
3-65
Page 98

802.11n (nx1) Analysis
View Scale Menu.
The View Scale menu for EVM versus Time has the following
controls:
Aut o Scale. Sets the start value and the scale of the vertical axis automatically
to fit the waveform to the screen.
Horizontal Scale. Sets the range of the horizontal axis (time).
Horizontal Start. Sets the minimum value (left edge) of the horizontal axis.
NOTE.
The horizontal display range must be within the analysis range specified
using the Timing menu (refer to page 2-6).
Ver t ic al S c a l e . Sets the range of the vertical axis.
Refer to Table 3-12 for the setting range.
Vertical Start. When the measurement content is EVM, sets the minimum value
(bottom edge) of the vertical axis. Refer to Table 3-12 for the setting range.
Vertical Offset. When the measurement content is Mag Error or Phase Error, sets
the center value ((maximum + minimum) / 2) of the vertical axis.
Refer to Table 3-12 for the setting range.
Table 3-12: Vertical setting range
Measurement Vertical Scale Vertical Start Vertical Offset
EVM 100
Magnitude error 200
Phase error 450
µ
to 100%
µ
to 200% -
µ
to 450
°
−
100 to 100% -
-
−
200 to 200%
−
450 to 450
°
Full Scale. Sets the scale of vertical axis to the default full-scale value.
Measurement Content... Selects how to display the vertical axis:
EVM. Represents the vertical axis with EVM (Error Vector Magnitude).
Mag Error. Represents the vertical axis with magnitude error.
Phase Error. Represents the vertical axis with phase error.
3-66
RSA3408A Option 29 User Manual
Page 99

802.11n (nx1) Analysis
MagErr versus Time
Packet information
(refer to page 3-57)
Measurement readout
(refer to page 3-65)
The main view shows the magnitude error of carriers, or one or all subcarriers in a
line graph, as shown in Figure 3-44. The vertical axis represents magnitude error
in percent and the horizontal axis represents time in seconds.
Marker readout
• Horizontal value: Time (s)
• Vertical value: Magnitude error (%)
Modulation type
The Select Subcarrier setting
in the Meas Setup menu
Subcarrier number setting
in the Meas Setup menu
(displayed when Select Subcarrier
is set to Single Subcarrier)
Preamble indicator: “Preamble On” is
displayed when one or more preambles are
enabled in Modulation Type Display Filter of
the Meas Setup menu.
Figure 3-44: MagErr versus Time (main view)
The measurement readout is the same as in EVM versus Time, shown in the table
on page 3-65.
View Scale Menu.
Refer to the View Scale menu of EVM versus Time on page 3-66.
RSA3408A Option 29 User Manual
3-67
Page 100

802.11n (nx1) Analysis
PhaseErr versus Time
Packet information
(refer to page 3-57)
Measurement readout
(refer to page 3-65)
The main view shows the phase error of carriers, or one or all subcarriers in a
line graph, as shown in Figure 3-45. The vertical axis represents phase error in
degrees or radians and the horizontal axis represents time in seconds.
Marker readout
• Horizontal value: Time (s)
• Vertical value: Phase error (degrees or radians)
Modulation type
The Select Subcarrier setting
in the Meas Setup menu
Subcarrier number setting
in the Meas Setup menu
(displayed when Select Subcarrier
is set to Single Subcarrier)
Preamble indicator: “Preamble On” is
displayed when one or more preambles are
enabled in Modulation Type Display Filter of
the Meas Setup menu.
Figure 3-45: PhaseErr versus Time (main view)
The measurement readout is the same as in EVM versus Time, shown in the table
on page 3-65.
View Scale Menu.
Refer to the View Scale menu of EVM versus Time on page 3-66.
3-68
RSA3408A Option 29 User Manual
 Loading...