

Page 1

User Manual
RSA3408A Option 28
TD-SCDMA Analysis Software
071-1683-00
This document applies to firmware version 1.0
and above.
www.tektronix.com
Page 2

Copyright © Tektronix, Inc. All rights reserved. Licensed software products are owned by Tektronix or its suppliers and
are protected by United States copyright laws and international treaty provisions.
Use, duplication, or disclosure by the Government is subject to restrictions as set forth in subparagraph (c)(1)(ii) of the
Rights in Technical Data and Computer Software clause at DFARS 252.227-7013, or subparagraphs (c)(1) and (2) of the
Commercial Computer Software -- Restricted Rights clause at FAR 52.227-19, as applicable.
Tektronix products are covere d by U.S. and foreign patents, issued and pending. Information in this publication supercedes
that in all previously published material. Specifications and price change privileges reserved.
Tektronix, Inc., P.O. Box 500, Beaverton, OR 97077
TEKTRONIX and TEK are registered trademarks of Tektronix, Inc.
Page 3

Software WARRANTY
Tektronix warrants that the me dia on which this software product is furnished and the encoding of the programs on
the media will be free from defects in materials and workmanship for a period of three (3) months from the date of
shipment. If a medium or encoding proves defective during the warranty period, Tektronix will provide a
replacement in exchange for the defective medium. Except as to the media on which this software product is
furnished, this software product is provided “as is” without warranty of any kind, either express or implied.
Tektronix does not warrant that the functions contained in this software product will meet Customer’s
requirements or that the operation of the programs will be uninterrupted or error-free.
In order to obtain service under this warranty, Customer must notify Tektronix of the defect before the expiration
of the warranty period. If Tektronix is unable to provide a replacement that is free from defects in materials and
workmanship within a reasonable time thereafter, Customer may terminate the license for this software product
and return this software product and any associated materials for credit or refund.
THIS WARRANTY IS GIVEN BY TEKTRONIX IN LIEU OF ANY OTHER WARRANTIES, EXPRESS
OR IMPLIED. TEKTRONIX AND ITS VENDORS DISCLAIM ANY IMPLIED WARRANTIES OF
MERCHANTABILITY OR FITNESS FOR A PARTICULAR PURPOSE. TEKTRONIX’
RESPONSIBILITY TO REPLACE DEFECTIVE MEDIA OR REFUND CUSTOMER’S PAYMENT IS
THE SOLE AND EXCLUSIVE REMEDY PROVIDED TO THE CUSTOMER FOR BREACH OF THIS
WARRANTY. TEKTRONIX AND ITS VENDORS WILL NOT BE LIABLE FOR ANY INDIRECT,
SPECIAL, INCIDENTAL, OR CONSEQUENTIAL DAMAGES IRRESPECTIVE OF WHETHER
TEKTRONIX OR THE VENDOR HAS ADVANCE NOTICE OF THE POSSIBILITY OF SUCH
DAMAGES.
Page 4

Page 5

Table of Contents
Getting Started
Operating Basics
Product Description 1--1..............................................
Functional Overview 2--1.......................................
Accessing a Measurement Function 2--2..................................
Versatile Display Capability 2--2........................................
TD-SCDMA Measurements 2--5.................................
Subframe Summary 2--6..............................................
Modulation Accuracy Measurement 2--9.................................
Code Domain Power Measurement 2--23..................................
Channel Power Measurement 2--33.......................................
OBW Measurement 2--36..............................................
ACLR Measurement 2--39..............................................
Spectrum Emission Mask Measurement 2--43..............................
Timeslot Summary 2--47...............................................
Transmit On/Off Mask 2--51............................................
Symbol Table Display 2--55............................................
Intermodulation Measurement 2--58......................................
Timing Parameters for Demodulation Measurements 2--61....................
Measurement Parameters for Demodulation Measurements 2--62...............
Editing the Measurement Limits 2--65.............................
Using the Measurement Limits Editor 2--65................................
Saving and Loading Measurement Limits 2--71.............................
Measurement Limit Defaults 2--72.......................................
Appendices
Appendix A: Setting Range A-- 1.................................
Index
RSA3408A Option 28 User Manual
i
Page 6

Table of Contents
List of Figures
Figure 2--1: Menu diagram showing measurement functions
available in Option 28 2--1...................................
Figure 2--2: Measurements of same domain interact 2--3.............
Figure 2--3: In strument capable of displaying multiple domains 2--4...
Figure 2--4: Subframe summary 2--6..............................
Figure 2--5: Modulation accuracy measurement 2--9................
Figure 2--6: Comp. constellation display 2--12.......................
Figure 2--7: Symbol constellation display 2--14......................
Figure 2--8: Symbol EVM display 2--16............................
Figure 2--9: MagErr display 2--18.................................
Figure 2--10: PhaseErr display 2--20...............................
Figure 2--11: Code domain power measurement 2--23.................
Figure 2--12: Code domain power display 2--26......................
Figure 2--13: CDP by subframe display 2--28........................
Figure 2--14: CDP by symbol display 2--29..........................
Figure 2--15: CDP codogram display 2--31..........................
Figure 2--16: Channel power measurement 2--33.....................
Figure 2--17: OBW measurement 2--36.............................
Figure 2--18: ACLR measurement 2--39............................
Figure 2--19: Spectrum emission mask (offset from channel)
measurement 2--43..........................................
Figure 2-- 20: Spectrum emission mask (inband spurious)
measurement 2--44..........................................
Figure 2--21: Timeslot summary 2--47..............................
Figure 2--22: Timeslot summary, display zoomed 2--50................
Figure 2--23: Transmit on/off mask 2--51...........................
Figure 2--24: Zoom to Max Mid-Ramp Power selected 2--54...........
Figure 2--25: Symbol table display 2--55............................
Figure 2--26: Intermodulation measurement 2--58....................
Figure 2--27: Measurement limits editor 2--66.......................
Figure 2--28: Spectrum emission mask measurement limits editor 2--69.
ii
RSA3408A Option 28 User Manual
Page 7

List of Tables
Table of Contents
Table 2--1: Global demodulation timing parameter settings 2--61......
Table 2--2: Global demodulation measurement parameter settings 2--62
Table 2--3: Measurement limits items 2--66.........................
Table 2--4: Measurement limit items for the spectrum emission
mask measurements 2--69....................................
Table 2--5: Downlink main table default limits 2--72.................
Table 2--6: Uplink main table default limits 2--72....................
Table 2--7: Downlink SEM offset from channel default limits 2--73.....
Table 2--8: Uplink S EM offset from channel default limits 2--73.......
Table 2--9: Downlink SEM inband spurious default limits 2-- 74.......
Table 2--10: Uplink SEM inband spurious default limits 2--74.........
Table A--1: Display format and scale A--1.........................
RSA3408A Option 28 User Manual
iii
Page 8

Table of Contents
iv
RSA3408A Option 28 User Manual
Page 9

Preface
About This Manual
This manual provides operating instructions for the RSA3408A Real-Time
Spectrum Analyzer Option 28 TD-SCDMA (Time Division Synchronous Code
Division Multiple Access) analysis software.
Option 28 supports TD-SCDMA as described in the 3GPP Release 4 LCR
Uplink/Downlink (3GPP TS25.142, TS25.102) standard.
This manual is composed of the following chapters:
H Getting Started provides a product description.
H Operating Basics describes the measurement functions added by the option
and explains how to set up the analyzer for each measurement mode.
H Appendices provides additional information about default settings.
The analyzer uses Microsoft Windows XP as the operating system. This manual
does not describe common usage of Windows XP. Refer to your Windows
manuals as necessary.
Related Manuals
PDF Manual
The following related documents are also available:
H RSA3408A User Manual
(Standard accessory; Tektronix part number 071--1617--XX)
Describes how to install the analyzer and how to work with the menus, and
details the standard functions. Also shows the specifications.
H RSA3408A Programmer Manual
(Standard accessory; PDF, Tektronix part number 077--0003--XX)
Contains an alphabetical listing of the programming commands and other
information related to controlling the analyzer over the GPIB interface.
The programmer manual described above is a PDF document (the file size is
about 5 MB). The file is stored in this directory on the analyzer hard disk:
C:\Program Files\Tektronix\wca200a\Manuals
Use the USB or LAN interface to copy the file onto your PC. Refer to the
RSA3408A User Manual for using the interface.
RSA3408A Option 28 User Manual
v
Page 10

Preface
Contacting Tektronix
Phone 1-800-833-9200*
Address Tektronix, Inc.
Department or name (if known)
14200 SW Karl Braun Drive
P.O. Box 500
Beaverton, OR 97077
USA
Web site www.tektronix.com
Sales support 1-800-833-9200, select option 1*
Service support 1-800-833-9200, select option 2*
Technical support www.tektronix.com/support
1-800-833-9200, select option 3*
6:00 a.m. -- 5:00 p.m. Pacific Standard Time
* This phone number is toll free in North America. After office hours, please leave a voice mail
message.
Outside North America, contact a Tektronix sales office or distributor; see the Tektronix web
site for a list of offices.
vi
RSA3408A Option 28 User Manual
Page 11

Getting Started
Page 12

Getting Started
Product Description
This chapter provides an overview of the capabilities added to the RSA3408A
with Option 28.
The TD-SCDMA standard contains elements of frequency division, time
division, and code division multiple access technologies. Combining these
technologies allows the reuse of frequency channels for uplink and downlink
communication. A single frequency channel is shared between uplink and
downlink, and among users. The use of a single channel is accomplished by
allocating timeslots to each transmit direction and to each user.
The RSA3408A Real-Time Spectrum Analyzer Option 28 is an analysis software
option that adds transmitter measurement capability for TD-SCDMA uplink and
downlink (3GPP TDD LCR) to the analyzer.
You can perform the following TD-SCDMA measurements:
H Demodulation measurements
H Subframe summary
H Modulation accuracy
H Code domain power
H Timeslot summary
H Transmit on/off mask
H Symbol table
H RF measurements
H Channel power
H OBW (occupied bandwidth)
H ACLR (adjacent channel leakage ratio)
H Spectrum emission mask
H Intermodulation
In addition, the option provides user-defined measurement limits for many
measurement results. Using these measurement limits, you can easily check that
the input signal meets the specification.
RSA3408A Option 28 User Manual
1- 1
Page 13

Getting Started
1- 2
RSA3408A Option 28 User Manual
Page 14

Operating Basics
Page 15

Functional Overview
This chapter provides an overview of the Option 28 measurement functions.
Figure 2--1 shows the measurement functions and how to access each measurement function from the front-panel menu key.
Other option name
(if installed)
MODE
S/A
DEMOD
TIME
DEMOD
menu
Analog Demod
Digital Demod
Standard...
Standard
menu
TD-SCDMA
Figure 2- 1: Menu diagram showing measurement functions available in Option 28
MEASURE
menu
Measurement functions
added by Option 28
Subframe Summary
Modulation Accuracy
Code Domain Power
Channel Power
OBW
ACLR
Spectrum Emission Mask
Timeslot Summary
Transmit On/Off Mask
Symbol Table
Intermodulation
RSA3408A Option 28 User Manual
2- 1
Page 16

Functional Overview
Accessing a Measurement Function
All of the measurement functions available in Option 28 can be selected from the
DEMOD (demodulation) mode.
Perform the following procedure to access any of the measurement functions:
1. Press the DEMOD menu key to open the DEMOD menu.
2. Press the Standard... side key to open the Standard menu.
3. Press the TD-SCDMA side key to select the TD-SCDMA standard and open
the MEASURE menu for the standard.
4. Press a side key to select the measurement that you want to perform. If the
desired measurement i s not displayed on the current MEASURE menu, press
the Go to page side key to go to the next MEASURE menu page.
5. If needed, set the frequency, span, and amplitude of the input signal. Refer to
the RSA3408A Real-Time Spectrum Analyzers User Manual for information
on how to set frequency, span, and amplitude.
NOTE. Most TD-SCDMA measurements are optimized for a 2 MHz or 5 MHz
span.
Versatile Display Capability
The display of the RSA3408A analyzer with Option 28 provide you with a
versatile tool for viewing different aspects of a measurement domain or viewing
two different measurement domains.
When two measurements of the same domain are displayed in the subview and
mainview (such as two views from the modulation accuracy domain), the
measurement markers are linked together.
Placing a measurement view of one domain in t he subview and a measurement
display of another domain in the mainview gives you the ability to monitor both
at the same time.
2- 2
RSA3408A Option 28 User Manual
Page 17

Functional Overview
Measurements within
same domain interact.
Moving the marker in the
subview moves the marker in
the other two views.
Figure 2- 2: Measurements of same domain interact
RSA3408A Option 28 User Manual
2- 3
Page 18

Functional Overview
Measurement from code
domain displayed in
subview
Measurement from
modulation accuracy
domain displayed in
mainview
Figure 2- 3: Instrument capable of displaying multiple domains
2- 4
RSA3408A Option 28 User Manual
Page 19

TD-SCDMA Measurements
This section describes the functions and features of the TD-SCDMA measurements. Each measurement description contains general information about the
measurement, descriptions of the measurement displays, and functions available
through menu selections.
The information is divided into the following subsections:
H Subframe summary
H Modulation accuracy
H Code domain power
H Channel power
H OBW (occupied bandwidth)
H ACLR (adjacent channel leakage ratio)
H Spectrum emission mask (SEM)
H Timeslot summary
H Transmit on/off mask
H Symbol table
H Intermodulation
NOTE. If you are not familiar with the operation of the RSA3408A, refer to the
RSA3408A Real-Time Spectrum Analyzer User Manual before reading this
section.
RSA3408A Option 28 User Manual
2- 5
Page 20

TD-SCDMA Measurements
Subframe Summary
The subframe summary measurement displays a power versus time graph of the
selected subframe, along with all general parameters discovered while analyzing
the subframe. The subframe summary waveform is available whenever subframe
timing can be determined using either DwPts or an external subframe trigger as a
time reference. Figure 2--4 shows an example of the subframe summary.
The measured values for subframe are described the section Subframe Measure-
ment Readouts beginning on page 2--8.
Green bar
represents the
analysis area
Current
timeslot and
link direction
Subframe numerical
readout
NOTE: The subframe marker is linked to overview window. Turn on the overview
marker to see position of the subframe within overall acquisition.
Figure 2- 4: Subframe summary
Display Elements
Marker readout
corresponds to the
marker position
Marker
Blue area represents
the selected timeslot
The following information is shown in t he subframe summary measurement
display:
2- 6
H Overview: The overview display area can contain the power versus time or
spectrogram measurement displays.
RSA3408A Option 28 User Manual
Page 21

TD-SCDMA Measurements
H Subview: The subview display area can contain any of the TD-SCDMA
demodulation measurements or the spectrum display.
H Mainview: The mainview display area displays only the power versus time
graph.
To change the contents in each of the views, use the VIEW DEFINE menu. Refer
to Changing the View Contents on page 2--7 for more information.
Setting the Timing
Parameters
Setting the Measurement
Parameters
You can set timing parameters for the subframe summary acquisition by using
the TIMING menu. Press the TIMING key to open the menu. Refer to Timing
Parameters for Demodulation Measurements, beginning on page 2--61, for a
description of the timing parameter settings.
NOTE. The timing parameters for demodulation measurements are global
settings for all TD-SCDMA demodulation measurements.
You can set the measurement parameters for the subframe summary measurements by using the MEAS SETUP menu. Press the MEAS SETUP key to open
the menu. Refer to Measurement Parameters for Demodulation Measurements,
beginning on page 2--62, for a description of the measurement parameters.
NOTE. The measurement parameters for demodulation measurements are global
settings for all TD-SCDMA demodulation measurements. Most of the modulation
parameters and analysis control settings do not take effect until the next run or
analysis cycle.
Changing the View
Contents
RSA3408A Option 28 User Manual
You can change the view contents in the overview and subview using the VIEW
DEFINE menu. Press the VIEW DEFINE key to open the menu.
H Show Views: Selects the view style on the screen. You can select Single or
H Overview Content...: The overview content display can be changed to
H Subview Content...: The subview content display can be changed to display
Multi. Multi shows all three views and Single expands the display to only
show the view currently selected. Press the SELECT key to change the
selected view.
display either the Spectrogram or Waveform (power versus time).
any of the TD-SCDMA demodulation measurements or the spectrum
display.
2- 7
Page 22

TD-SCDMA Measurements
H Mainview Content...: The mainview content display can not be changed
from Subframe summary.
H Menu Off: Hides the side menu. To display the menu again, press t he
MENU side key or VIEW DEFINE key.
Scale and Format in the
Mainview
You can set the scale for the display using the VIEW SCALE menu. Press the
VIEW SCALE key to open the menu.
H Auto Scale (Amplitude): Sets the start value and the scale of the vertical
axis to display the entire waveform.
H Horizontal Scale (s): Sets the scale of the horizontal axis (number of chips
or symbols).
H Horizontal Start (s): Sets the chip number or symbol number of the first
(left) value of the horizontal axis.
H Vertical Scale (dB): Sets the scale of the vertical axis.
H Vertical Stop (dBm): Sets the maximum (top) value of the vertical axis.
H Full Scale: Sets all scale values to their default full-scale value.
H Step Size (Horizontal Start / Vertical Stop): Sets the step size (amount per
click of the general purpose knob) for changes to the Horizontal Start or
Vertical Stop settings.
The step size menu choices only display when selecting the Horizontal Start
or Vertical Stop menus.
Subframe Measurement
Readouts
2- 8
This section describes the measurement readouts displayed in the mainview of
the subframe measurement.
Readout Description
Downlink Pilot (Sync-DL) The code number of the downlink pilot pattern.
Uplink Pilot (Sync-UL) The code number of the uplink pilot pattern.
Scrambling Code The scrambling code.
Switching Point The timeslot switching point.
DwPts Pattern The rotation pattern (None, S1, S2) of the downlink pilot.
Multiframe Position The subframe position (1 to 4) within a multiframe.
DwPts RMS power The RMS power of the downlink pilot.
UpPts RMS power The RMS power of the uplink pilot.
GP RMS power The RMS power in the subframe guard period.
RSA3408A Option 28 User Manual
Page 23

Modulation Accuracy Measurement
The modulation accuracy measurement measures EVM (Error Vector Magnitude), Rho, magnitude error, phase error, frequency error, I/Q imbalance, and I/Q
offset. Figure 2--5 shows an example of the modulation accuracy measurement.
TD-SCDMA Measurements
Figure 2- 5: Modulation accuracy measurement
Display Elements
The following elements are shown in the modulation accuracy measurement
display:
H Overview: The overview display area can contain the power versus time or
H Subview: The subview display area can contain any of the TD-SCDMA
H Mainview: The mainview display area can contain one of the modulation
RSA3408A Option 28 User Manual
Condensed measurement
results displayed when
mainview is not selected
spectrogram measurement displays.
demodulation measurements or the spectrum display. Measurement results
typically associated with a measurement are not displayed when the
measurement is displayed in the subview.
accuracy related measurements along with a condensed set of numerical
2- 9
Page 24

TD-SCDMA Measurements
measurement results with a Pass or Fail message (determined by the Limits
settings) for each measurement result. If all measurements pass, PASS is
displayed at the top of the screen. If any measurement fails, FAIL is
displayed at the top of the screen.
To change the contents in each of the views, use the VIEW DEFINE menu. Refer
to Changing the View Contents on page 2--10 for more information.
Setting the Timing
Parameters
Setting the Measurement
Parameters
You can set timing parameters for the modulation accuracy acquisition by using
the TIMING menu. Press the TIMING key to open the menu. Refer to Timing
Parameters for Demodulation Measurements, beginning on page 2--61, for a
description of the timing parameter settings.
NOTE. The timing parameters for demodulation measurements are global
settings for all TD-SCDMA demodulation measurements.
You can set the measurement parameters for the modulation accuracy measurements by using the MEAS SETUP menu. Press the MEAS SETUP key to open
the menu. Refer to Measurement Parameters for Demodulation Measurements,
beginning on page 2--62, for a description of the measurement parameters.
NOTE. The measurement parameters for demodulation measurements are global
settings for all TD-SCDMA demodulation measurements. Most of the modulation
parameters and analysis control settings do not take effect until the next run or
analysis cycle.
2- 10
Changing the View
Contents
You can change the view contents in the overview, subview, and mainview using
the VIEW DEFINE menu. Press the VIEW DEFINE key to open the menu.
H Show Views: Selects the view style on the screen. You can select Single or
Multi. Multi shows all three views and Single expands the display to only
show the view currently selected. Press the VIEW SELECT key to change
the selected view.
H Overview Content...: The overview content display can be changed to
display either the Spectrogram or Waveform (power versus time).
H Subview Content...: The subview content display can be changed to display
any of the TD-SCDMA demodulation measurements or the spectrum
display.
RSA3408A Option 28 User Manual
Page 25

TD-SCDMA Measurements
H Mainview Content...: The mainview content display can be changed to
display one of the modulation accuracy related measurements with its
numerical measurement results. You can select Composite Constellation,
Symbol Constellation, Symbol Error Vector Magnitude, Magnitude Error, or
Phase Error.
When selecting the mainview , the expanded numerical measurement results
are displayed. (The overview content display is removed.)
A Pass or Fail message for each measurement is displayed if limit testing is
turned on in the Limits menu. If all measurements pass, PASS is displayed at
the top of the screen. If any measurement fails, FAIL is displayed at the top
of the screen.
Refer to Scale and Format in the Mainview, beginning on page 2--12, for
more information about the mainview content selections.
H Menu Off: Hides the side menu. To display the menu again, press t he
MENU side key or VIEW DEFINE key.
RSA3408A Option 28 User Manual
2- 11
Page 26

TD-SCDMA Measurements
Scale and Format in the
Mainview
This section describes the scale settings and display format in the mainview.
Comp. Constellation Display. When you select Mainview Content from the VIEW
DEFINE menu and then select Comp. Constellation from the Mainview Content
submenu, an IQ rectangular graph is displayed showing the I/Q values for all
chips in the current timeslot, including midamble. See Figure 2--6.
The measured values for modulation accuracy are described the section
Modulation Accuracy Measurement Readouts beginning on page 2--21.
Expanded measurement
results displayed when
mainview is selected
Figure 2- 6: Comp. constellation display
Chip number
I/Q values
I/Q rectangular graph
(vector display)
2- 12
RSA3408A Option 28 User Manual
Page 27

TD-SCDMA Measurements
You can set the scale of the display using the VIEW SCALE menu. Press the
VIEW SCALE key to open the menu.
H Measurement Content...: Selects vector or constellation display.
Vector: Selects vector display. A signal represented with phase and
amplitude is displayed in rectangular (I and Q) coordinates. Each red point
indicates a symbol position on the measured signal and the yellow trace
indicates the locus of the signal between symbols.
Constellation: Selects constellation display. It is the same as the vector
display, except that only symbols of the measured signal are indicated in red,
and the locus between symbols is not shown.
NOTE. I and Q signals are normalized to prevent the scale from changing when
signal attenuation changes.
RSA3408A Option 28 User Manual
2- 13
Page 28

TD-SCDMA Measurements
Symbol Constellation Display. When you select Mainview Content from the
VIEW DEFINE menu and then select Symbol Constellation from the Mainview
Content submenu, an IQ rectangular graph is displayed showing the constellation
for Data1 and Data2 symbols selected by the currently selected code (set in the
Meas Setup menu). See Figure 2--7.
The measured values for modulation accuracy are described the section
Modulation Accuracy Measurement Readouts beginning on page 2--21.
Expanded measurement
results displayed when
mainview is selected
Figure 2- 7: Symbol constellation display
You can set the scale of the display using the VIEW SCALE menu. Press the
VIEW SCALE key to open the menu.
Symbol number
Selected code
OVSF code
Spreading factor
Modulation type
Vertical scale
Vertical start
Horizontal scale
Horizontal start
2- 14
RSA3408A Option 28 User Manual
Page 29

TD-SCDMA Measurements
H Measurement Content...: Selects vector or constellation display.
Vector: Selects vector display. A signal represented with phase and
amplitude is displayed in rectangular (I and Q) coordinates. Each red point
indicates a symbol position on the measured signal and the yellow trace
indicates the locus of the signal between symbols.
Constellation: Selects constellation display. It is the same as the vector
display, except that only symbols of the measured signal are indicated in red,
and the locus between symbols is not shown. The cross marks indicate
symbol positions of an ideal signal.
NOTE. I and Q signals are normalized to prevent the scale from changing when
signal attenuation changes.
RSA3408A Option 28 User Manual
2- 15
Page 30

TD-SCDMA Measurements
Symbol EVM Display. When you select Mainview Content from the VIEW
DEFINE menu and then select Symbol EVM from the Mainview Content
submenu, changes of Symbol EVM (Error Vector Magnitude) over time are
displayed for each symbol (calculated on a single code channel). See Figure 2--8.
The measured values for modulation accuracy are described the section
Modulation Accuracy Measurement Readouts beginning on page 2--21.
Expanded measurement
results displayed when
mainview is selected
Figure 2- 8: Symbol EVM display
Symbol number
EVM value
Selected code
OVSF code
Spreading factor
Modulation type
Vertical scale
Vertical start
Horizontal scale
Horizontal start
You can set the scale of the display using the VIEW SCALE menu. Press the
VIEW SCALE key to open the menu.
2- 16
H Auto Scale (Amplitude): Sets the start value and the scale of the vertical
axis to display the entire waveform.
H Horizontal Scale: Sets the scale of the horizontal axis (number of symbols).
RSA3408A Option 28 User Manual
Page 31

TD-SCDMA Measurements
H Horizontal Start: Sets the symbol number of the first (left) value of the
horizontal axis.
H Vertical Scale (%): Sets the scale of the vertical axis.
H Vertical Start (%): Sets the minimum (bottom) value of the vertical axis.
H Full Scale (default scaling): Sets all scale values to their default full-scale
value.
H Step Size (Horizontal Start / Vertical Start): Sets the step size of the up
and down keys when changing the Horizontal Start or Vertical Stop settings.
A step size menu only displays if the Horizontal Start or Vertical Start menu
is selected.
RSA3408A Option 28 User Manual
2- 17
Page 32

TD-SCDMA Measurements
MagErr Display. When you select Mainview Content from the VIEW DEFINE
menu and then select MagErr from the Mainview Content submenu, changes of
magnitude error over time for a single code channel are displayed for each
symbol. See Figure 2--9.
The measured values for modulation accuracy are described the section
Modulation Accuracy Measurement Readouts beginning on page 2--21.
Expanded measurement
results displayed when
mainview is selected
Figure 2- 9: MagErr display
Symbol number
Error value
Selected code
OVSF code
Spreading factor
Modulation type
Vertical scale
Vertical start
Horizontal scale
Horizontal start
You can set the scale of the display using the VIEW SCALE menu. Press the
VIEW SCALE key to open the menu.
H Auto Scale: Sets the start value and the scale of the vertical axis automati-
cally to display the entire waveform.
2- 18
H Horizontal Scale: Sets the scale of the horizontal axis (number of symbols).
RSA3408A Option 28 User Manual
Page 33

TD-SCDMA Measurements
H Horizontal Start: Sets the symbol number of the first (left) value of the
horizontal axis.
H Vertical Scale (%): Sets the scale of the vertical axis.
H Vertical Start (%): Sets the start value of the vertical axis. You can set the
value from --200% to 200%.
H Full Scale (default scaling): Sets all scale values to their default full-scale
value.
H Step Size (Horizontal Start / Vertical Offset): Sets the step size of the up
and down keys when changing the Horizontal St art or Vertical Offset
settings.
A step size menu only displays if the Horizontal Start or Vertical Offset
menu is selected.
RSA3408A Option 28 User Manual
2- 19
Page 34

TD-SCDMA Measurements
PhaseErr Display. When you select Mainview Content from the VIEW DEFINE
menu and then select PhaseErr from the Mainview Content submenu, changes of
phase error over time for a single code channel are displayed for each symbol.
See Figure 2--10.
The measured values for modulation accuracy are described the section
Modulation Accuracy Measurement Readouts beginning on page 2--21.
Expanded measurement
results displayed when
mainview is selected
Figure 2- 10: PhaseErr display
Symbol number
Error value
Selected code
OVSF code
Spreading factor
Modulation type
Vertical scale
Vertical start
Horizontal scale
Horizontal start
You can set the scale of the display using the VIEW SCALE menu. Press the
VIEW SCALE key to open the menu.
H Auto Scale: Sets the start value and the scale of the vertical axis automati-
cally to display the entire waveform.
2- 20
H Horizontal Scale: Sets the scale of the horizontal axis (number of symbols).
RSA3408A Option 28 User Manual
Page 35

TD-SCDMA Measurements
H Horizontal Start: Sets the symbol number of the first (left) value of the
horizontal axis.
H Vertical Scale: Sets the scale of the vertical axis.
H Vertical Offset: Sets the offset value of the vertical axis. You can set the
value from --450 to 450 degrees.
H Full Scale: Sets all scale values to their default full-scale value.
H Step Size (Horizontal Start / Vertical Offset): Sets the step size of the up
and down keys when changing the Horizontal St art or Vertical Offset
settings.
A step size menu only displays if the Horizontal Start or Vertical Offset
menu is selected.
Modulation Accuracy
Measurement Readouts
This section describes the measurement readouts displayed in the mainview of
the modulation accuracy measurements. The numerical measurement results
reported are identical for each of the modulation accuracy measurement displays.
Readout Description
Midamble EVM (rms): The RMS error vector magnitude calculated over the midamble
of the signal. The result is optimized for the midamble and
expressed as a percentage. EVM measures the noise in the
input signal relative to a reference signal.
Midamble EVM (peak): The maximum value of the instantaneous error vector magnitude
calculated over the midamble of the signal and expressed as a
percentage.
Comp. EVM (rms): The RMS error vector magnitude calculated on the composite
signal over the entire timeslot (both data bursts and the
midamble) and expressed as a percentage.
Comp. EVM (peak): The maximum value of the instantaneous error vector magnitude
calculated on the composite signal over the entire timeslot (both
data bursts and the midamble) and expressed as a percentage.
Rho: A measure of the desired part of the signal relative to a
reference signal.
Comp. Mag Error (rms): The RMS error of the composite signal due to magnitude errors
in the signal.
Comp. Mag Error (peak): The maximum value of the instantaneous magnitude error of the
composite signal.
RSA3408A Option 28 User Manual
2- 21
Page 36

TD-SCDMA Measurements
Readout Description
Comp. Phase Error (rms): The RMS phase error of the composite signal.
This measurement is most useful with a constant amplitude
signal like a phase-shift keyed signal like QPSK when a single
channel is active in a timeslot.
Large phase errors can occur if more than one channel is active
since the constellation can have a symbol at or near the origin
(0,0).
Comp. Phase Error (peak): The maximum of the instantaneous phase error of the composite
signal.
Frequency Error: The error between the center frequency and the estimated
frequency that is derived from the input signal. The estimated
frequency is based either on the downlink pilot (DwPTS) or the
midamble of the timeslot, selected with the Freq. & Phase
Reference... setting in the measurement setup menu.
I/Q Imbal.: The imbalance between the level of the I channel to the level of
the Q channel. A value of 0.0 dB means that there is no
imbalance (the I and Q channels have the same level).
I/Q Offset: This measures how far the origin of the constellation of the
composite signal is from the true origin (0,0).
The I/Q offset is included in the EVM calculations unless it is
turned off in the measurement setup menu.
2- 22
RSA3408A Option 28 User Manual
Page 37

Code Domain Power Measurement
The code domain power measurement measures the distribution of signal power
across the set of code channels. The display can be in absolute power or
normalized to the total timeslot power (defined by the Y Axis... setting in the
V iew Scale menu). A bar graph is displayed that represents the power of each
channel. This measurement allows you to verify that each code channel is
operating at its proper level. Figure 2--11 shows an example of the code domain
power measurement.
TD-SCDMA Measurements
Measurement results
Horizontal start
Figure 2- 11: Code domain power measurement
Display Elements
The following information is shown in the code domain power measurement
display:
H Overview: The overview display area can contain the power versus time or
spectrogram measurement displays.
Selected code
Power level
OVSF code
Spreading factor
Modulation type
Vertical scale
Vertical start
Horizontal scale
RSA3408A Option 28 User Manual
2- 23
Page 38

TD-SCDMA Measurements
H Subview: The subview display area can contain any of the TD-SCDMA
demodulation measurements or the spectrum display.
H Mainview: The mainview display area can contain one of the code domain
power related measurements.
The mainview also displays the numerical measurement results of the
selected display. A Pass or Fail message (determined by the Limits settings)
for each measurement is displayed. If all measurements pass, PASS is
displayed at the top of the screen. If any measurement fails, FAIL is
displayed at the top of the screen.
To change the contents in each of the views, use the VIEW DEFINE menu. Refer
to Changing the View Contents on page 2--24 for more information.
Setting the Timing
Parameters
Setting the Measurement
Parameters
You can set timing parameters for the code domain power acquisition by using
the TIMING menu. Press the TIMING key to open the menu. Refer to Timing
Parameters for Demodulation Measurements, beginning on page 2--61, for a
description of the timing parameter settings.
NOTE. The timing parameters for demodulation measurements are global
settings for all TD-SCDMA demodulation measurements.
You can set the measurement parameters for the code domain power measurements by using the MEAS SETUP menu. Press the MEAS SETUP key to open
the menu. Refer to Measurement Parameters for Demodulation Measurements,
beginning on page 2--62, for a description of the measurement parameters.
NOTE. The measurement parameters for demodulation measurements are global
settings for all TD-SCDMA demodulation measurements. Most of the modulation
parameters and analysis control settings do not take effect until the next run or
analysis cycle.
2- 24
Changing the View
Contents
You can change the view contents in the overview, subview, and mainview using
the VIEW DEFINE menu. Press the VIEW DEFINE key to open the menu.
H Show Views: Selects the view style on the screen. You can select Single or
Multi. Multi shows all three views and Single expands the display to only
show the view currently selected. Press the VIEW SELECT key to change
the selected view.
RSA3408A Option 28 User Manual
Page 39

TD-SCDMA Measurements
H Overview Content...: The overview content display can be changed to
display either the Spectrogram or Waveform (power versus time).
H Subview Content...: The subview content display can be changed to display
any of the TD-SCDMA demodulation measurements or the spectrum
display.
H Mainview Content...: The mainview content display can be changed to
display one of the code domain related measurements. You can select Code
Domain Power, Code Domain Power by Subframe, Code Domain Power by
Symbol, or Power Codogram. The mainview also displays the numerical
measurement results of the selected display. A Pass or Fail message
(determined by the Limits settings) for each measurement is displayed. If all
measurements pass, PASS is displayed at the top of the screen. If any
measurement fails, FAIL is displayed at the top of the screen.
Refer to Scale and Format in the Mainview, beginning on page 2--25, for
more information about the mainview content selections.
H Menu Off: Hides the side menu. To display the menu again, press t he
MENU side key or VIEW DEFINE key.
Scale and Format in the
Mainview
This subsection describes the scale settings and display format in the mainview.
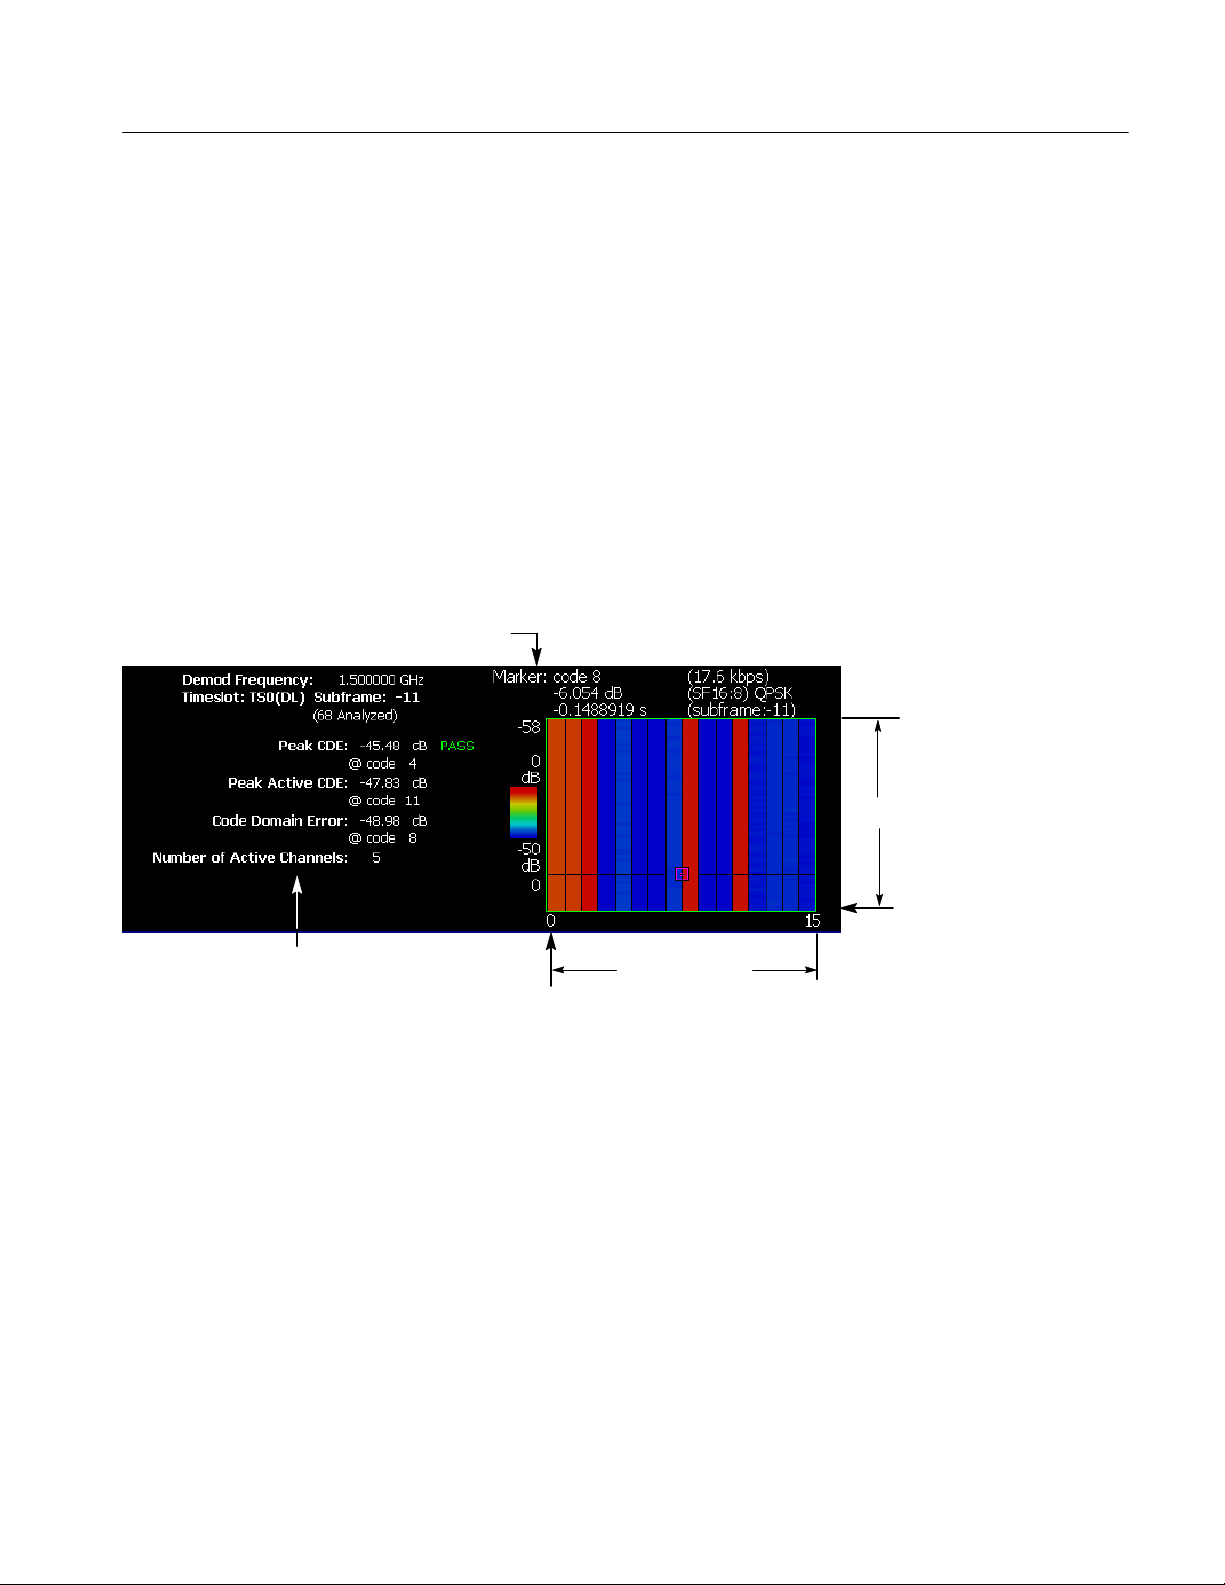
Code Domain Power Display. When you select Mainview Content from the VIEW
DEFINE menu and then select Code Domain Power from the Mainview Content
submenu, the code domain power for code channels is displayed (see
Figure 2--12). The code domain power display shows the power in all code
channels in the two-data bursts of the selected timeslot and subframe.
The measured values for code domain power are described the section Code
Domain Power Measurement Readouts beginning on page 2--32.
RSA3408A Option 28 User Manual
2- 25
Page 40

TD-SCDMA Measurements
Measurement results
Marker readout
Vertical scale
Vertical start
Horizontal scale
Horizontal start
A horizontal bar over a group of
codes indicate a wider code.
Figure 2- 12: Code domain power display
The power bars use colors t o distinguish between active channels and inactive
channels. Red indicates active, yellow indicates inactive.
A yellow horizontal bar above a set of active codes indicates that these codes
have been detected as belonging to a single code channel at a spreading factor
lower than 16. For example, a yellow bar over 2 codes m eans that this code is
actually a single code channel with a spreading factor of 8.
NOTE. Whether a channel is active or inactive is determined by the ACTIVE
CHANNEL THRESHOLD setting in the MEAS SETUP menu.
You can set the scale of the display using the VIEW SCALE menu. Press the
VIEW SCALE key to open the menu.
H Auto Scale (Amplitude): Sets the start value and the scale of the vertical
axis to display the entire waveform.
2- 26
RSA3408A Option 28 User Manual
Page 41

TD-SCDMA Measurements
H Horizontal Scale: Sets the scale of the horizontal axis (number of codes).
H Horizontal Start: Sets the code number of the first (left) value of the
horizontal axis.
H Vertical Scale (dB): Sets the scale of the vertical axis.
H Vertical Stop (dB): Sets the maximum (top) value of the vertical axis.
H Step Size (Horizontal Start / Vertical Stop): Sets the step size of the up
and down keys when changing the Horizontal Start or Vertical Stop settings.
A step size menu only displays if the Horizontal Start or Vertical Stop menu
is selected.
H Full Scale (default scaling): Sets all scale values to their default full-scale
value.
H Y Axis...: Selects whether to represent the Y axis with relative values or
absolute values. When you select Relative, the Y axis represents the power
relative to the total power of all channels. When you select Absolute, the Y
axis represents the absolute power of each channel.
RSA3408A Option 28 User Manual
2- 27
Page 42

TD-SCDMA Measurements
CDP by Subframe Display. When you select Mainview Content from the VIEW
DEFINE menu and then select CDP by Subframe from the Mainview Content
submenu, the code domain power in a single code channel is displayed for each
subframe that has been analyzed (see Figure 2--13). The code domain power by
subframe display s hows the power in a single code channel in the selected
timeslot for each subframe.
CDP by subframe is useful for tracking the changes in the power of an active
channel over time due to power control.
For the number of subframes analyzed (N), subframe 0 is the most recent and
subframe N--1 is the oldest.
The measured values for code domain power are described the section Code
Domain Power Measurement Readouts beginning on page 2--32.
Marker readout
Measurement results
Figure 2- 13: CDP by subframe display
You can set the scale of the display using the VIEW SCALE menu. Press the
VIEW SCALE key to open the menu.
H Auto Scale (Amplitude): Sets the start value and the scale of the vertical
H Horizontal Scale: Sets the scale of the horizontal axis (number of sub-
H Horizontal Start: Sets the subframe number of the first (left) value of the
Vertical scale
Vertical start
Horizontal scale
Horizontal start
axis to display the entire waveform.
frames).
horizontal axis.
2- 28
H Vertical Scale (dB): Sets the scale of the vertical axis.
RSA3408A Option 28 User Manual
Page 43

TD-SCDMA Measurements
H Vertical Stop (dB): Sets the maximum (top) value of the vertical axis.
H Full Scale (default scaling): Sets all scale values to their default full-scale
value.
H Step Size (Horizontal Start / Vertical Stop): Sets the step size of the up
and down keys when changing the Horizontal Start or Vertical Stop settings.
A step size menu only displays if the Horizontal Start or Vertical Stop menu
is selected.
H Y Axis...: Selects whether to represent the Y axis with relative values or
absolute values. When you select Relative, the Y axis represents the power
relative to the total power of all channels. When you select Absolute, the Y
axis represents the absolute power of each channel.
CDP by Symbol Display. When you select Mainview Content from the VIEW
DEFINE menu and then select CDP by Symbol from the Mainview Content
submenu, the code domain power for the symbols is displayed (see Figure 2--14).
The code domain power by symbol shows the despread power for each symbol
period of the selected code, subframe, and timeslot.
The measured values for code domain power are described the section Code
Domain Power Measurement Readouts beginning on page 2--32.
Marker readout
Measurement results
Figure 2- 14: CDP by symbol display
You can set the scale of the display using the VIEW SCALE menu. Press the
VIEW SCALE key to open the menu.
Vertical scale
Vertical start
Horizontal scale
Horizontal start
H Auto Scale (Amplitude): Sets the start value and the scale of the vertical
RSA3408A Option 28 User Manual
axis to display the entire waveform.
2- 29
Page 44

TD-SCDMA Measurements
H Horizontal Scale: Sets the scale of the horizontal axis (number of symbols).
H Horizontal Start: Sets the symbol number of the first (left) value of the
horizontal axis.
H Vertical Scale (dB): Sets the scale of the vertical axis.
H Vertical Stop (dB): Sets the maximum (top) value of the vertical axis.
H Full Scale (default scaling): Sets all scale values to their default full-scale
value.
H Step Size (Horizontal Start / Vertical Stop): Sets the step size of the up
and down keys when changing the Horizontal Start or Vertical Stop settings.
A step size menu only displays if the Horizontal Start or Vertical Stop menu
is selected.
H Y Axis...: Selects whether to represent the Y axis with relative values or
absolute values. When you select Relative, the Y axis represents the power
relative to the total power of all channels. When you select Absolute, the Y
axis represents the absolute power of each channel.
2- 30
RSA3408A Option 28 User Manual
Page 45
TD-SCDMA Measurements
CDP Codogram Display. When you select Mainview Content from the VIEW
DEFINE menu and then select CDP Codogram from the Mainview Content
submenu, the code domain power is displayed as a codogram (see Figure 2--15).
The codogram displays the code domain power for all codes in the selected
timeslot over all analyzed subframes. The power in each code is represented by a
color, with red indicating the highest power and blue representing the lowest
power. The codes for a single subframe are displayed on the horizontal axis, with
the vertical axis representing the subframe indices.
The CDP codogram provides an overview of the selected timeslot over time,
allowing the user to quickly see changes in the code domain due to spreading
factor changes, calls coming and going, and power control.
The measured values for code domain power are described the section Code
Domain Power Measurement Readouts beginning on page 2--32.
Marker readout
Measurement results
Figure 2- 15: CDP codogram display
You can set the scale of the display using the VIEW SCALE menu. Press the
VIEW SCALE key to open the menu.
H Auto Scale: Sets the start value and the scale of the vertical axis to display
H Horizontal Scale: Sets the scale of the horizontal axis.
H Horizontal Start: Sets the channel number of the first (left) value of the
H Vertical Size: Sets the scale of the vertical axis.
Vertical scale
Vertical start
Horizontal scale
Horizontal start
the entire waveform.
horizontal axis.
RSA3408A Option 28 User Manual
2- 31
Page 46

TD-SCDMA Measurements
H Vertical Start: Sets the subframe value at the bottom of the vertical axis.
H Color Scale: Sets the scale (the value separating the minimum power value
from the maximum power value) of the color axis. The choices are 5, 10, 20,
and50dB.
H Color Stop: Sets the stop value of the color axis.
H Full Scale: Sets the maximum value of the color axis to the reference level.
H Y Axis...: Selects whether to represent the Y axis with relative values or
absolute values. When you select Relative, the Y axis represents the power
relative to the total power of all channels. When you select Absolute, the Y
axis represents the absolute power of each channel.
Code Domain Power
Measurement Readouts
This section describes the measurement readouts displayed in the mainview of
the code domain power measurements. The numerical measurement results
reported are identical for each of the code domain power measurement displays.
Readout Description
Peak CDE: The peak code domain error is a measure of the power in the
residual error of each code. The residual error is calculated by
subtracting a reference signal from the input signal. The peak
code domain error is the maximum code domain error of all the
codes (including both active and inactive channels). The Peak
CDE readout shows the Peak CDE measurement and which
code contained the peak error.
Peak Active CDE: The peak active code domain error is similar to the Peak CDE
measurement but is the maximum of the code domain error of
just the active channels, excluding the inactive channels from
the calculation.
Code Domain Error: The code domain error shows the error of the currently selected
code. The readout shows the code domain error and the
selected code.
The code is selected with the Select Code setting in the
measurement menu.
Number of Active Channels: This is the number of active channels that have been detected in
the current timeslot.
2- 32
RSA3408A Option 28 User Manual
Page 47

Channel Power Measurement
The channel power measurement measures the channel power within a specified
bandwidth and the power spectral density in dBm/Hz.
The channel power measurement is a single view display, unlike t he demodulation measurements such as modulation accuracy or code domain power. The
channel power measurement cannot be displayed in the subviews of the
demodulation measurements.
Figure 2--16 shows an example of the channel power measurement.
TD-SCDMA Measurements
Measurement
results
Figure 2- 16: Channel power measurement
Setting the Timing
Parameters
RSA3408A Option 28 User Manual
The channel power measurement only operates in freerun mode and therefore
does not display timing settings when pressing the TIMING menu.
Timeslot alignment (from the start of a subframe) for the channel power
measurement is determined by analyzing a sufficiently long IQ capture.
2- 33
Page 48

TD-SCDMA Measurements
Setting the Measurement
Parameters
Once you’ve selected the channel power measurement, you can set the measurement parameters for the channel power using the MEAS SETUP menu. Most of
the channel power measurement parameters are not shared with other measurements. Press the MEAS SETUP key to open the menu.
H Switching Point (timeslot): Sets the point where the timeslots switch from
uplink to downlink timeslots. You can set the value from 1 to 6. The timeslot
switching point selection is a global setting for all TD-SCDMA demodulation and RF measurements.
H Select Timeslot: Sets the timeslot for the measurement. The control cycles
through TS0, DP (downlink pilot), UP (uplink pilot), TS1, TS2, TS3, TS 4,
TS5, and TS6. The timeslot selection is a global selection for all TDSCDMA demodulation and RF measurements.
H Channel Bandwidth (Hz): Sets the channel bandwidth for the measure-
ment.
H Measurement Filter Shape...: Sets the filter to be used for the measure-
ment. You can select None, RootRaisedCosine, or RaisedCosine. The filters
only affect the numerical measurement readouts, not the waveform display.
H Time Reference: Selects the timing reference. This setting is global to all
RF measurements.
H DwPts: Sets the downlink pilot as a time reference for each subframe.
This setting should only be used when the downlink pilot is present in
the signal under test.
H UplinkTSPattern:Sets the timeslots indicated in the Uplink TS
Pattern setting as the time reference for each subframe. Specifying the
timeslot pattern allows the instrument to determine proper timeslot
identification in the absence of the downlink pilot time reference.
H UplinkTSPattern:Specifies which timeslots are the active uplink
timeslots. The uplink timeslot pattern is a concatenation of the uplink
timeslots. For example, an uplink TS pattern of 13 indicates TS1 and TS3
are active uplink timeslots. The default pattern of 123 indicates TS1, TS2,
and TS3 are active uplink timeslots. Integer patterns between 1 and 123456
are valid. This setting is used when the Time Reference is set to Uplink TS
Pattern.
NOTE. UpPts can also be active, but does not need to be explicitly listed.
Downlink signals can not be active when using the pattern method to
determine subframe timing.
2- 34
RSA3408A Option 28 User Manual
Page 49

TD-SCDMA Measurements
H Active Timeslot Threshold (dB): Sets the threshold that determines if a
timeslot is active or inactive. A timeslot that is transmitting above this level
is considered active.
H Limits...: Displays the limits editor to set the pass/fail limits for measure-
ments. The limits editor that displays is either the uplink or downlink editor,
determined by whether the selected timeslot is an uplink or downlink
timeslot. Refer to Editing the Measurement Limits, on page 2--65, for more
information.
NOTE. Refer to the RSA3408A Real-Time Spectrum Analyzer User Manual for
information about the scale settings for the display.
Changing the View
Contents
You can change the contents in the view using the VIEW DEFINE menu. Press
the VIEW DEFINE key to open the menu.
H Grid Style: Sets the grid style in the view. You can select Off, Fix, or Flex.
For Flex, the grid is changed depending on frequency or span setting.
H Menu Off: Hides the side menu. To display the menu again, press t he
MENU side key or VIEW: DEFINE key.
You can set the scale of the display using the VIEW SCALE menu. Press the
VIEW SCALE key to open the menu.
H Auto Scale (Amplitude): Sets the start value and the scale of the vertical
axis to display the entire waveform.
H Horizontal Scale (Hz): Sets the scale of the horizontal axis.
H Horizontal Start (Hz): Sets the first (left) value of the horizontal axis.
H Vertical Scale (dB): Sets the scale of the vertical axis.
H Vertical Stop (dBm): Sets the maximum (top) value of the vertical axis.
H Full Scale (default scaling): Sets all scale values to their default full-scale
value.
H Step Size (Horizontal Start / Vertical Stop): Sets the step size of the up
RSA3408A Option 28 User Manual
and down keys when changing the Horizontal Start or Vertical Stop settings.
A step size menu only displays when the Horizontal Start or Vertical Stop
menu is selected.
2- 35
Page 50

TD-SCDMA Measurements
OBW Measurement
The OBW (Occupied Bandwidth) measurement measures the bandwidth that
contains a certain percentage of the total integrated power of one timeslot using
the percentage and timeslot you specify. The measured bandwidth is centered at
the center frequency.
Figure 2--17 shows an example of the OBW measurement.
Measurement
results
Figure 2- 17: OBW measurement
Setting the Timing
Parameters
The TD-SCDMA OBW measurement only operates in freerun mode and
therefore does not display timing settings when pressing the TIMING menu.
Timeslot alignment (from the start of a subframe) for the channel power
measurement is determined by analyzing a sufficiently long IQ capture.
2- 36
RSA3408A Option 28 User Manual
Page 51

TD-SCDMA Measurements
Setting the Measurement
Parameters
Once you’ve selected the OBW measurement, you can set the measurement
parameters for OBW using the MEAS SETUP menu. Most of the OBW
measurement parameters are not shared with other measurements. Press the
MEAS SETUP key t o open the menu.
H Switching Point (timeslot): Sets the point where the timeslots switch from
uplink to downlink timeslots. You can set the value from 1 to 6. The timeslot
switching point selection is a global setting for all TD-SCDMA demodulation and RF measurements.
H Select Timeslot: Sets the timeslot for the measurement. The control cycles
through timeslots 0, DP (downlink pilot), UP (uplink pilot), TS1, TS2, TS3,
TS4, TS5, and TS6. The timeslot selection is a global selection for all
TD-SCDMA demodulation and RF measurements.
H Power Ratio: Specifies the power ratio of the carrier and span regions for
calculating OBW. You can set the value from 80 to 99.99%. The default
value is 99%.
H Channel Bandwidth (Hz): Sets the channel bandwidth for the measure-
ment.
H Measurement Filter Shape...: Filters are not implemented for the OBW
measurement.
H Time Reference: Selects the timing reference. This setting is global to all
RF measurements.
H DwPts: Sets the downlink pilot as a time reference for each subframe.
This setting should only be used when the downlink pilot is present in
the signal under test.
H UplinkTSPattern:Sets the timeslots indicated in the Uplink TS
Pattern setting as the time reference for each subframe. Specifying the
timeslot pattern allows the instrument to determine proper timeslot
identification in the absence of the downlink pilot time reference.
H UplinkTSPattern:Specifies which timeslots are the active uplink
timeslots. The uplink timeslot pattern is a concatenation of the uplink
timeslots. For example, an uplink TS pattern of 13 indicates TS1 and TS3
are active uplink timeslots. The default pattern of 123 indicates TS1, TS2,
and TS3 are active uplink timeslots. Integer patterns between 1 and 123456
are valid. This setting is used when the Time Reference is set to Uplink TS
Pattern.
NOTE. UpPts can also be active, but does not need to be explicitly listed.
Downlink signals can not be active when using the pattern method to
determine subframe timing.
RSA3408A Option 28 User Manual
2- 37
Page 52

TD-SCDMA Measurements
H Active Timeslot Threshold (dB): Sets the threshold that determines if a
timeslot is active or inactive. A timeslot that is transmitting above this level
is considered active.
H Limits...: Displays the limits editor to set the pass/fail limits for measure-
ments. The limits editor that displays is either the uplink or downlink editor,
determined by whether the selected timeslot is an uplink or downlink
timeslot. Refer to Editing the Measurement Limits, on page 2--65, for more
information.
NOTE. Refer to the RSA3408A Real-Time Spectrum Analyzer User Manual for
information about the scale settings for the display.
Changing the View
Contents
You can change the contents in the view using the VIEW DEFINE menu. Press
the VIEW DEFINE key to open the menu.
H Grid Style: Sets the grid style in the view. You can select Off, Fix, or Flex.
For Flex, the grid is changed depending on frequency or span setting.
H Menu Off: Hides the side menu. To display the menu again, press t he
MENU side key or VIEW DEFINE key.
You can set the scale of the display using the VIEW SCALE menu. Press the
VIEW SCALE key to open the menu.
H Auto Scale (Amplitude): Sets the start value and the scale of the vertical
axis to display the entire waveform.
H Horizontal Scale (Hz): Sets the scale of the horizontal axis.
H Horizontal Start (Hz): Sets the first (left) value of the horizontal axis.
H Vertical Scale (dB): Sets the scale of the vertical axis.
H Vertical Stop (dBm): Sets the maximum (top) value of the vertical axis.
H Full Scale: Sets all scale values to their default full-scale value.
H Step Size (Horizontal Start / Vertical Stop): Sets the step size of the up
and down keys when changing the Horizontal Start or Vertical Stop settings.
2- 38
A step size menu only displays when the Horizontal Start or Vertical Stop
menu is selected.
RSA3408A Option 28 User Manual
Page 53

ACLR Measurement
TD-SCDMA Measurements
The Adjacent Channel Leakage Ratio (ACLR) measurement measures the
amount of power leakage from the desired channel (active channel signal) to a
nearby inactive channel by computing the ratio of the power in the active
channel to the power in the inactive channel. The nearby channels can be one of
the channels to the immediate left or right (adjacent channels) of the active
channel or one channel further away (the alternate channels).
Since the ACLR measurement is made on multiple channels, it’s recommended
that you set the analyzer to at least a 10 MHz span to allow the ACLR to be
measured on the two adjacent and two alternate channels. A span of 5 MHz
reduces the ACLR measurement to just the immediate adjacent channels. If the
span setting is not wide enough for at least three channels, ACLR cannot be
measured.
Figure 2--18 shows an example of the ACLR measurement.
Measurement
results
Figure 2- 18: ACLR measurement
RSA3408A Option 28 User Manual
2- 39
Page 54

TD-SCDMA Measurements
Setting the Timing
Parameters
Setting the Measurement
Parameters
The ACLR measurement only operates i n freerun mode and therefore does not
display timing settings when pressing the TIMING menu.
Timeslot alignment (from the start of a subframe) for the channel power
measurement is determined by analyzing a sufficiently long IQ capture.
Once you’ve selected the ACLR measurement, you can set the measurement
parameters for ACLR using the MEAS SETUP menu. Most of the ACLR
measurement parameters are not shared with other measurements. Press the
MEAS SETUP key t o open the menu.
H Switching Point (timeslot): Sets the point where the timeslots switch from
uplink to downlink timeslots. You can set the value from 1 to 6. The timeslot
switching point selection is a global setting for all TD-SCDMA demodulation and RF measurements.
H Select Timeslot: Sets the timeslot for the measurement. The control cycles
through timeslots 0, DP (downlink pilot), UP (uplink pilot), TS1, TS2, TS3,
TS4, TS5, and TS6. The timeslot selection is a global selection for all
TD-SCDMA demodulation and RF measurements.
H Measurement Filter Shape...: Sets the filter to be used for the measure-
ment. You can select None, RootRaisedCosine, or RaisedCosine. The filters
only affect the numerical measurement readouts, not the waveform display.
H Time Reference: Selects the timing reference. This setting is global to all
RF measurements.
H DwPts: Sets the downlink pilot as a time reference for each subframe.
This setting should only be used when the downlink pilot is present in
the signal under test.
H UplinkTSPattern:Sets the timeslots indicated in the Uplink TS
Pattern setting as the time reference for each subframe. Specifying the
timeslot pattern allows the instrument to determine proper timeslot
identification in the absence of the downlink pilot time reference.
H UplinkTSPattern:Specifies which timeslots are the active uplink
timeslots. The uplink timeslot pattern is a concatenation of the uplink
timeslots. For example, an uplink TS pattern of 13 indicates TS1 and TS3
are active uplink timeslots. The default pattern of 123 indicates TS1, TS2,
and TS3 are active uplink timeslots. Integer patterns between 1 and 123456
are valid. This setting is used when the Time Reference is set to Uplink TS
Pattern.
2- 40
RSA3408A Option 28 User Manual
Page 55

TD-SCDMA Measurements
NOTE. UpPts can also be active, but does not need to be explicitly listed.
Downlink signals can not be active when using the pattern method to
determine subframe timing.
H Active Timeslot Threshold (dB): Sets the threshold that determines if a
timeslot is active or inactive. A timeslot that is transmitting above this level
is considered active.
H Limits...: Displays the limits editor to set the pass/fail limits for measure-
ments. The limits editor that displays is either the uplink or downlink editor,
determined by whether the selected timeslot is an uplink or downlink
timeslot. Refer to Editing the Measurement Limits, on page 2--65, for more
information.
NOTE. Refer to the RSA3408A Real-Time Spectrum Analyzer User Manual for
information about the scale settings for the display.
Setting the Span
Parameters
Changing the View
Contents
You can set the following measurement parameters using the SP AN menu. Press
the SPAN key to open the menu.
H Span (Hz): Sets frequency range to be analyzed. This affects the number of
channels that are analyzed.
H Start Freq (Hz): Sets the minimum value of the frequency axis. The stop
frequency automatically adjusts according to the span setting.
H Stop Freq (Hz): Sets the maximum value of the frequency axis. The start
frequency automatically adjusts according to the span setting.
NOTE. Refer to the RSA3408A Real-Time Spectrum Analyzer User Manual for
information about the span settings for the display.
You can change the contents in the view using the VIEW DEFINE menu. Press
the VIEW DEFINE key to open the menu.
H Grid Style: Sets the grid style in the view. You can select Off, Fix, or Flex.
For Flex, the grid is changed depending on frequency or span setting.
H Menu Off: Hides the side menu. To display the menu again, press t he
MENU side key or VIEW DEFINE key.
RSA3408A Option 28 User Manual
2- 41
Page 56

TD-SCDMA Measurements
You can set the scale of the display using the VIEW SCALE menu. Press the
VIEW SCALE key to open the menu.
H Auto Scale (Amplitude): Sets the start value and the scale of the vertical
axis to display the entire waveform.
H Horizontal Scale (Hz): Sets the scale of the horizontal axis.
H Horizontal Start (Hz): Sets the first (left) value of the horizontal axis.
H Vertical Scale (dB): Sets the scale of the vertical axis.
H Vertical Stop (dBm): Sets the maximum (top) value of the vertical axis.
H Full Scale: Sets all scale values to their default full-scale value.
H Step Size (Horizontal Start / Vertical Stop): Sets the step size of the up
and down keys when changing the Horizontal Start or Vertical Stop settings.
A step size menu only displays when the Horizontal Start or Vertical Stop
menu is selected.
2- 42
RSA3408A Option 28 User Manual
Page 57

Spectrum Emission Mask Measurement
The spectrum emission mask (SEM) measurement verifies that the base station is
not transmitting excessive power outside of its designated channel. The SEM
measurement is not gated so it does not operate on any particular timeslot.
There are two SEM measurements available (selected from the measurement
setup menu) based on different sets of limits: Offset From Channel and Inband
Spurious. Figures 2--19 and 2-- 20 show examples of the spectrum emission mask
measurements.
TD-SCDMA Measurements
Measurement
results
Figure 2- 19: Spectrum emission mask (offset from channel) measurement
RSA3408A Option 28 User Manual
2- 43
Page 58

TD-SCDMA Measurements
Measurement
results
Figure 2- 20: Spectrum emission mask (inband spurious) measurement
Setting the Timing
Parameters
The TD-SCDMA spectrum emission mask measurement only operates in freerun
mode and therefore does not display timing settings when pressing the TIMING
menu.
Setting the Measurement
Parameters
Once you’ve selected the spectrum emission mask measurement, you can set the
measurement parameters for SEM using the MEAS SETUP menu. Most of the
SEM measurement parameters are not shared with other measurements. Press the
MEAS SETUP key t o open the menu.
H Transmit Direction: Selects which limits table (uplink or downlink) is used
for limit checking. Changing the transmit direction for the SEM measurement may change the timeslot selection for other measurements depending
on how the timeslots are defined for uplink and downlink.
H Measurement...: Selects the SEM measurement and limits table.
H Offset From Channel: The Offset From Channel limits are used where
the frequency zones are specified by the difference from the center
frequency.
H Inband Spurious: The Inband Spurious limits are used where the
frequency zones are specified by the absolute frequency values.
2- 44
RSA3408A Option 28 User Manual
Page 59

TD-SCDMA Measurements
H Ref. Channel Select: Selects the reference mode used to measure the
spectrum emission level. You can select Auto or Man (manual). For Auto,
the reference level is measured from the input signal for the specified
channel bandwidth. For Man, you can set the reference level in the Ref.
Channel Level menu item.
H Ref. Channel Level (dBm): Sets or displays the reference level used to
measure the spectrum emission level. You can only set the reference level
when the Ref. Channel Select is set to Man (manual) with a range from
--150 dBm to 30 dBm.
H Channel Bandwidth (Hz): Sets the channel bandwidth for the measure-
ment.
H Measurement Filter Shape: Sets the filter to be used for the measurement.
You can select None, RootRaisedCosine, or RaisedCosine. This setting is
only available when Ref. Channel Select is set to Auto. The filters only
affect the numerical measurement readouts, not the waveform display.
H Limits...: Displays the limits editor to set the pass/fail limits for measure-
ments. The limits editor that displays is either the uplink or downlink editor,
determined by whether the selected timeslot is an uplink or downlink
timeslot. Refer to Editing the Measurement Limits, on page 2--65, for more
information.
Changing the View
Contents
H Scroll Table: Scrolls the table displayed in the view.
You can change the contents in the view using the VIEW DEFINE menu. Press
the VIEW DEFINE key to open the menu.
H Grid Style: Sets the grid style in the view. You can select Off, Fix, or Flex.
For Flex, the grid is changed depending on frequency or span setting.
H Menu Off: Hides the side menu. To display the menu again, press t he
MENU side key or VIEW DEFINE key.
You can set the scale of the display using the VIEW SCALE menu. Press the
VIEW SCALE key to open the menu.
H Auto Scale (Amplitude): Sets the start value and the scale of the vertical
axis to display the entire waveform.
H Horizontal Scale (Hz): Sets the scale of the horizontal axis.
H Horizontal Start (Hz): Sets the first (left) value of the horizontal axis.
H Vertical Scale (dB): Sets the scale of the vertical axis.
H Vertical Stop (dBm): Sets the maximum (top) value of the vertical axis.
H Full Scale: Sets all scale values to their default full-scale value.
RSA3408A Option 28 User Manual
2- 45
Page 60

TD-SCDMA Measurements
H Step Size (Horizontal Start / Vertical Stop): Sets the step size of the up
and down keys when changing the Horizontal Start or Vertical Stop settings.
A step size menu only displays when the Horizontal Start or Vertical Stop
menu is selected.
2- 46
RSA3408A Option 28 User Manual
Page 61

Timeslot Summary
TD-SCDMA Measurements
The timeslot summary measurement displays a power versus time graph of the
selected timeslot within the selected subframe, and displays several timeslot-related statistics. The timeslot summary includes eight chips before timeslot, and
eight chips after timeslot for visual reference. Figure 2-- 21 shows an example of
the timeslot summary.
The measured values are described in Timeslot Summary Measurement Readouts
on page 2--50.
Figure 2- 21: Timeslot summary
Display Elements
The following information is shown in the timeslot summary measurement
display:
RSA3408A Option 28 User Manual
Measurement results
Blue vertical line indicates
Ideal timeslot start chip
2- 47
Page 62

TD-SCDMA Measurements
H Overview: The overview display area can contain the power versus time or
spectrogram measurement displays.
H Subview: The subview display area can contain any of the TD-SCDMA
demodulation measurements or the spectrum display.
H Mainview: The mainview display area is fixed to display only the timeslot
summary measurement.
To change the contents in each of the views, use the VIEW DEFINE menu. Refer
to Changing the View Contents on page 2--48 for more information.
Setting the Timing
Parameters
Setting the Measurement
Parameters
You can set timing parameters for the timeslot summary acquisition by using the
TIMING menu. Press the TIMING key to open the menu. Refer to Timing
Parameters for Demodulation Measurements, beginning on page 2--61, for a
description of the timing parameter settings.
NOTE. The timing parameters for demodulation measurements are global
settings for all TD-SCDMA demodulation measurements.
You can set the measurement parameters for the timeslot summary measurement
by using the MEAS SETUP menu. Press the MEAS SETUP key to open the
MEAS SETUP menu. Refer to Measurement Parameters for Demodulation
Measurements, beginning on page 2--62, for a description of the measurement
parameters.
NOTE. The measurement parameters for demodulation measurements are global
settings for all TD-SCDMA demodulation measurements. Most of the modulation
parameters and analysis control settings do not take effect until the next run or
analysis cycle.
2- 48
Changing the View
Contents
You can change the view contents in the overview, subview using the VIEW
DEFINE menu. Press the VIEW DEFINE key to open the menu.
H Show Views: Selects the view style on the screen. You can select Single or
Multi. Multi shows all three views and Single expands the display to only
show the view currently selected. Press the VIEW SELECT key to change
the selected view.
H Overview Content...: The overview content display can be changed to
display either the Spectrogram or Waveform (power versus time).
RSA3408A Option 28 User Manual
Page 63

TD-SCDMA Measurements
H Subview Content...: The subview content display can be changed to display
any of the TD-SCDMA demodulation measurements or the spectrum
display.
H Mainview Content...: The mainview content display can not be changed
from timeslot summary but the mainview can be zoomed to the region tested
for timeslot error.
H Menu Off: Hides the side menu. To display the menu again, press t he
MENU side key or VIEW DEFINE key.
Scale and Format in the
Mainview
You can set the scale for the display using the VIEW SCALE menu. Press the
VIEW SCALE key to open the menu.
H Auto Scale (Amplitude): Sets the start value and the scale of the vertical
axis to display the entire waveform.
H Horizontal Scale (s): Sets the scale of the horizontal axis (number of chips
or symbols).
H Horizontal Start (s): Sets the chip number or symbol number of the first
(left) value of the horizontal axis.
H Vertical Scale (dB): Sets the scale of the vertical axis.
H Vertical Stop (dBm): Sets the maximum (top) value of the vertical axis.
H Full Scale: Sets all scale values to their default full-scale value.
H Step Size (Horizontal Start / Vertical Stop): Sets the step size (amount per
click of the general purpose knob) for changes to the Horizontal Start or
Vertical Stop settings.
The step size menus only display when selecting the Horizontal Start or
Vertical Stop menus.
H Zoom to Timeslot Start: Zooms the display into the region tested for the
timing error. Eight chips are shown before the timeslot and 60 chips after. A
blue line is drawn to indicate the ideal timeslot start chip. The default scale
for the timeslots is based on the width (number of chips) of the timeslot.
RSA3408A Option 28 User Manual
2- 49
Page 64

TD-SCDMA Measurements
Blue vertical line indicates
Ideal timeslot start chip
Timeslot Summary
Measurement Readouts
Figure 2- 22: Timeslot summary, display zoomed
This section describes the measurement readouts displayed in the mainview of
the timeslot summary measurement.
Readout Description
Timing Error The measured difference between the measured start of a
timeslot and the ideal start of the timeslot (relative to the
selected subframe time reference).
Data1 power The RMS power in the data1 burst.
Data2 power The RMS power in the data2 burst.
Midamble power The RMS power in the midamble burst.
K The value of K for this timeslot. K is the maximum number of
midamble codes that can be used in the midamble of the
current timeslot. See the 3GPP TDD LCR standard for detailed
information.
Average burst power The RMS power over the entire timeslot.
2- 50
RSA3408A Option 28 User Manual
Page 65

Transmit On/Off Mask
TD-SCDMA Measurements
The Transmit On/Off Mask measurement verifies that the Node--B or UE turns
off its transmitter when it is not supposed to be emitting power. A power versus
time graph of the selected subframe is overlaid on a limit mask. The instantaneous power is compared against the mask and a PASS/FAIL determination is
made. Figure 2--23 shows an example of the transmit on/off mask.
The measured values are described in Transmit On/Off Mask Measurement
Readouts on page 2--54.
Measurement results Downlink mask shown Uplink mask shown
Figure 2- 23: Transmit on/off mask
Display Elements
RSA3408A Option 28 User Manual
The following information is shown in the timeslot summary measurement
display:
H Overview: The overview display area can contain the power versus time or
H Subview: The subview display area can contain any of the TD-SCDMA
spectrogram measurement displays.
demodulation measurements or the spectrum display.
2- 51
Page 66

TD-SCDMA Measurements
H Mainview: The mainview display area is fixed to display only the transmit
on/off mask measurement.
To change the contents in each of the views, use the VIEW DEFINE menu. Refer
to Changing the View Contents on page 2--52 for more information.
Setting the Timing
Parameters
Setting the Measurement
Parameters
You can set timing parameters for the transmit on/off mask acquisition by using
the TIMING menu. Press the TIMING key to open the menu. Refer to Timing
Parameters for Demodulation Measurements, beginning on page 2--61, for a
description of the timing parameter settings.
NOTE. The timing parameters for demodulation measurements are global
settings for all TD-SCDMA demodulation measurements.
You can set the measurement parameters for the transmit on/off mask measurements by using the MEAS SETUP menu. Press the MEAS SETUP key to open
the menu. Refer to Measurement Parameters for Demodulation Measurements,
beginning on page 2--62, for a description of the measurement parameters.
NOTE. The measurement parameters for demodulation measurements are global
settings for all TD-SCDMA demodulation measurements. Most of the modulation
parameters and analysis control settings do not take effect until the next run or
analysis cycle.
2- 52
Changing the View
Contents
You can change the view contents in the overview, subview using the VIEW
DEFINE menu. Press the DEFINE key to display the VIEW DEFINE menu.
H Show Views: Selects the view style on the screen. You can select Single or
Multi. Multi shows all three views and Single expands the display to only
show the view currently selected. Press the SELECT key to change the
selected view.
H Overview Content...: The overview content display can be changed to
display either the Spectrogram or Waveform (power versus time).
H Subview Content...: The subview content display can be changed to display
any of the TD-SCDMA demodulation measurements or the spectrum
display.
H Mainview Content...: The mainview content display can not be changed
from timeslot summary.
RSA3408A Option 28 User Manual
Page 67

TD-SCDMA Measurements
H Menu Off: Hides the side menu. To display the menu again, press t he
MENU side key or VIEW:DEFINE key.
Scale and Format in the
Mainview
You can set the scale for the display using the VIEW SCALE menu. Press the
VIEW SCALE key to open the menu.
H Auto Scale (Amplitude): Sets the start value and the scale of the vertical
axis to display the entire waveform.
H Horizontal Scale (s): Sets the scale of t he horizontal axis. This affects both
the normal and zoomed displays.
H Horizontal Start (s): Sets the chip number or symbol number of the first
(left) value of the horizontal axis.
H Vertical Scale (dB): Sets the scale of the vertical axis.
H Vertical Stop (dBm): Sets the maximum (top) value of the vertical axis.
H Full Scale: Sets all scale values to their default full-scale value. This affects
both the normal and zoomed displays.
H Mask Zoom Controls...: The zoom controls let you display a narrow region
of the mask, allowing you to quickly zoom in and analyze important parts of
the mask. Figure 2--24 shows an example of a zoomed display.
H Zoom to Tx Mask Start: Zooms in to the beginning of the mask.
H Zoom to Tx Mask End: Zooms in to the end of the mask.
H Step Size (Horizontal Start / Vertical Stop): Sets the step size (amount per
RSA3408A Option 28 User Manual
H Zoom to Max Mid-Ramp Power: Zooms to the part of the mask that is
above the OFF power level but below the average ON power. For the
downlink, it is near the ON to OFF transition and for the uplink, it is
near the OFF to ON transition.
H Zoom to Max Tx OFF Power: Zooms to the location of the maximum
power of the input signal in the OFF portion of the mask.
H Horizontal Scale (s): Sets the scale of t he horizontal axis. This affects
both the zoomed and normal displays.
H Full Scale: Sets all scale values to their default full-scale value. This
affects both the zoomed and normal displays.
click of the general purpose knob) for changes to the Horizontal Start or
Vertical Stop settings.
The step size menu choices only display when selecting the Horizontal Start
or Vertical Stop menus.
2- 53
Page 68

TD-SCDMA Measurements
Figure 2- 24: Zoom to Max Mid-Ramp Power selected
Transmit On/Off Mask
Measurement Readouts
This section describes the measurement readouts displayed in the mainview of
the transmit on/off mask measurement.
Readout Description
Tx OFF Mid-Ramp Region
Max Power
@Chip
Tx OFF Region
Max Power
@Chip
The maximum mid-ramp power (in dBm) within the mid-ramp
region. The chip value is the location where it occurs.
The maximum power (in dBm) within the mask region that is not
part of the mid-ramp region. The chip value is the location where it
occurs.
2- 54
RSA3408A Option 28 User Manual
Page 69

Symbol Table Display
TD-SCDMA Measurements
The symbol table display shows the received data symbols in a code channel
after descrambling and despreading. Figure 2--25 shows an example of the
symbol table display.
Figure 2- 25: Symbol table display
Display Elements
RSA3408A Option 28 User Manual
The following information is shown in the symbol table measurement display:
H Overview: The overview display area can contain the power versus time or
H Subview: The subview display area can contain any of the TD-SCDMA
H Mainview: The mainview display area is fixed to display only the symbol
To change the contents in each of the views, use the VIEW DEFINE menu. Refer
to Changing the View Contents on page 2--56 for more information.
spectrogram measurement displays.
demodulation measurements or the spectrum display.
table.
2- 55
Page 70

TD-SCDMA Measurements
Setting the Timing
Parameters
Setting the Measurement
Parameters
You can set timing parameters for the symbol table acquisition by using the
TIMING menu. Press the TIMING key to open the TIMING menu. Refer to
Timing Parameters for Demodulation Measurements, beginning on page 2--61,
for a description of the timing parameter settings.
NOTE. The timing parameters for demodulation measurements are global
settings for all TD-SCDMA demodulation measurements.
You can set the measurement parameters for the symbol table measurement by
using the MEAS SETUP menu. Press the MEAS SETUP key to open the menu.
Refer to Measurement Parameters for Demodulation Measurements, beginning
on page 2--62, for a description of the measurement parameters.
NOTE. The measurement parameters for demodulation measurements are global
settings for all TD-SCDMA demodulation measurements. Most of the modulation
parameters and analysis control settings do not take effect until the next run or
analysis cycle.
Changing the View
Contents
You can change the view contents in the overview, subview using the VIEW
DEFINE menu. Press the DEFINE key to display the VIEW DEFINE menu.
H Show Views: Selects the view style on the screen. You can select Single or
Multi. Multi shows all three views and Single expands the display to only
show the view currently selected. Press the SELECT key to change the
selected view.
H Overview Content...: The overview content display can be changed to
display either the Spectrogram or Waveform (power versus time).
H Subview Content...: The subview content display can be changed to display
any of the TD-SCDMA demodulation measurements or the spectrum
display.
H Mainview Content...: The mainview content display can not be changed
from Timeslot summary.
H Menu Off: Hides the side menu. To display the menu again, press t he
MENU side key or VIEW:DEFINE key.
2- 56
RSA3408A Option 28 User Manual
Page 71

TD-SCDMA Measurements
Scale and Format in the
Mainview
You can set the radix for the display using the VIEW SCALE menu. Press the
VIEW SCALE key to open the menu.
H Radix...: Sets the radix for displaying the table. You can select Hex
(hexadecimal), Oct (octal), or Bin (binary).
RSA3408A Option 28 User Manual
2- 57
Page 72

TD-SCDMA Measurements
Intermodulation Measurement
The intermodulation measurement measures the distortion the base station
generates when both the desired signal and an interfering signal are present. For
this measurement, an interfering signal is defined as being synchronized with the
desired signal and is 30 dB lower.
Figure 2--26 shows an example of the intermodulation measurement.
Measurement
results
Setting the Timing
Parameters
Setting the Span
Parameters
Figure 2- 26: Intermodulation measurement
The intermodulation measurement only operates in freerun mode and therefore
does not display timing settings when pressing the TIMING menu.
Timeslot alignment (from the start of a subframe) for the channel power
measurement is determined by analyzing a sufficiently long IQ capture.
You can set the following measurement parameters using the SP AN menu. Press
the SPAN key to open the SPAN menu.
H Span (Hz): Sets frequency range to be analyzed. This affects the number of
channels that are analyzed.
2- 58
RSA3408A Option 28 User Manual
Page 73

TD-SCDMA Measurements
H Start Freq (Hz): Sets the minimum value of the frequency axis. The stop
frequency automatically adjusts according to the span setting.
H Stop Freq (Hz): Sets the maximum value of the frequency axis. The start
frequency automatically adjusts according to the span setting.
NOTE. Refer to the RSA3408A Real-Time Spectrum Analyzer User Manual for
information about the span settings for the display.
Setting the Measurement
Parameters
Once you’ve selected the intermodulation measurement, you can set the
measurement parameters for intermodulation using the MEAS SETUP menu.
Most of the intermodulation measurement parameters are not shared with other
measurements. Press the MEAS SETUP key to open the menu.
H Switching Point (timeslot): Sets the point where the timeslots switch from
uplink to downlink timeslots. You can set the value from 1 to 6. The timeslot
switching point selection is a global setting for all TD-SCDMA demodulation and RF measurements.
H Select Timeslot: Sets the timeslot for the measurement. The control cycles
through timeslots 0, DP (downlink pilot), UP (uplink pilot), TS1, TS2, TS3,
TS4, TS5, and TS6. The timeslot selection is a global selection for all
TD-SCDMA demodulation and RF measurements.
H 2nd Channel Offset: Sets the center frequency of the second channel. Use
this menu item when the interfering carrier may be outside of the analysis
span.
H Main Channel Integration BW: Sets the integration bandwidth. You can
set the value from 500 kHz to 5 MHz.
H Measurement Filter Shape...: Sets the filter to be used for the measure-
ment. You can select None, RootRaisedCosine, or RaisedCosine. The filters
only affect the numerical measurement readouts, not the waveform display.
H Time Reference: Selects the timing reference. This setting is global to all
RSA3408A Option 28 User Manual
RF measurements.
H DwPts: Sets the downlink pilot as a time reference for each subframe.
This setting should only be used when the downlink pilot is present in
the signal under test.
H UplinkTSPattern:Sets the timeslots indicated in the Uplink TS
Pattern setting as the time reference for each subframe. Specifying the
timeslot pattern allows the instrument to determine proper timeslot
identification in the absence of the downlink pilot time reference.
2- 59
Page 74

TD-SCDMA Measurements
H UplinkTSPattern:Specifies which timeslots are the active uplink
timeslots. The uplink timeslot pattern is a concatenation of the uplink
timeslots. For example, an uplink TS pattern of 13 indicates TS1 and TS3
are active uplink timeslots. The default pattern of 123 indicates TS1, TS2,
and TS3 are active uplink timeslots. Integer patterns between 1 and 123456
are valid. This setting is used when the Time Reference is set to Uplink TS
Pattern.
NOTE. UpPts can also be active, but does not need to be explicitly listed.
Downlink signals can not be active when using the pattern method to
determine subframe timing.
H Limits...: Displays the limits editor to set the pass/fail limits for measure-
ments. The limits editor that displays is either the uplink or downlink editor,
determined by whether the selected timeslot is an uplink or downlink
timeslot. Refer to Editing the Measurement Limits, on page 2--65, for more
information.
Changing the View
Contents
NOTE. Refer to the RSA3408A Real-Time Spectrum Analyzer User Manual for
information about the scale settings for the display.
You can change the contents in the view using the VIEW DEFINE menu. Press
the DEFINE key to display the VIEW DEFINE menu.
H Grid Style: Sets the grid style in the view. You can select Off, Fix, or Flex.
For Flex, the grid is changed depending on frequency or span setting.
H Menu Off: Hides the side menu. To display the menu again, press t he
MENU side key or VIEW:DEFINE key.
You can set the scale of the display using the VIEW SCALE menu. Press the
SCALE key to open the menu.
H Auto Scale (Amplitude): Sets the start value and the scale of the vertical
axis to display the entire waveform.
H Horizontal Scale: Sets the scale of the horizontal axis (number of chips or
symbols).
H Horizontal Start: Sets the chip number or symbol number of the first (left)
value of the horizontal axis.
2- 60
H Vertical Scale: Sets the scale of the vertical axis.
H Vertical Stop: Sets the maximum (top) value of the vertical axis.
H Full Scale: Sets all scale values to their default full-scale value.
RSA3408A Option 28 User Manual
Page 75

Timing Parameters for Demodulation Measurements
The timing parameters for the measurements requiring demodulation are global
settings; all demodulation measurements use the same parameters. The parameters listed in Table 2--1 affect the following measurements:
TD-SCDMA Measurements
Subframe Summary
Modulation Accuracy
Code Domain Power
Timeslot Summary
Transmit On/Off Mask
Symbol Table
You can set the following timing parameters using the TIMING menu when a
demodulation measurement is selected. Press the TIMING key to open the
TIMING menu.
Table 2- 1: Global demodulation timing parameter settings
Parameter Description
Acquisition Subframes: Sets the acquisition length in subframes. The range depends on the acquisition memory size
and the span setting. A minimum of three subframes is required when phase reference is set
to midamble. Seven subframes are required when phase reference is set to pilot.
Acquisition Length (s): Displays the acquisition length in seconds.
Acquisition History: Specifies the number of the block to display and analyze. The latest block is number zero.
Older blocks have larger negative numbers.
Analysis Interval (chips): Sets the analysis interval in chips. The range depends on the acquisition length. A minimum
of three subframes are required when phase reference is set to midamble. Seven subframes
are required when phase reference is set to pilot.
Analysis Offset (chips): Sets the start point of the analysis with respect to the trigger position. In free run, the trigger
position is at the left edge of the display. When triggered, the trigger position is set by the
trigger position control.
Spectrum Length: Displays the time length for spectrum processing displayed in the subview. This value is
equivalent to one frame acquisition length.
Spectrum Offset (s): Sets the beginning of the Spectrum Length with respect to the trigger position.
NOTE. Refer to the RSA3408A Real-Time Spectrum Analyzer User Manual for
detailed information about the timing parameters.
RSA3408A Option 28 User Manual
2- 61
Page 76

TD-SCDMA Measurements
Measurement Parameters for Demodulation Measurements
The measurement parameters for the measurements requiring demodulation are
global settings; all demodulation measurements use the same parameters. The
parameters listed in Table 2-- 2 affect the following measurements:
Subframe Summary
Modulation Accuracy
Code Domain Power
Timeslot Summary
Transmit On/Off Mask
Symbol Table
You can set the following measurement parameters using the MEAS SETUP
menu when a demodulation measurement is selected. Press the MEAS SETUP
key to open the MEAS SETUP menu.
Table 2- 2: Global demodulation measurement parameter settings
Parameter Description
Analyze Performs analysis for the time slots in the analysis range. The acquisition must be paused
and an acquisition record must be present before an analysis can be made.
Analysis Control... NOTE: Most analysis control changes do not take effect until the next Run cycle or analysis
cycle.
Demod Frequency Offset (Hz) Specifies the location of the carrier signal to be analyzed relative to the center frequency. This
value is used as a starting point for the demodulation analysis.
Active Channel Threshold (dB) Sets the active channel threshold level (in dB from the pilot) used for deciding whether a code
channel is active or inactive. You can set the value from --50 dB to 50 dB.
Time Reference...
DwPts Sets the downlink pilot as the time reference for each subframe. This setting should only be
used when the downlink pilot is present in the signal under test.
Trigger Selects the external trigger input connector as the source for the timing reference. An external
subframe trigger signal must be supplied to mark the beginning of the subframe.
Freq. & Phase Reference...
Midamble Selects the detected midamble of each timeslot as the frequency and phase reference for
DwPts Selects the downlink pilot as the frequency and phase reference for the timeslot.
2- 62
The trigger source setting in the Trigger menu should be set to External.
The trigger time reference is useful if the signal under test does not contain a downlink pilot or
if the signal level is very low.
demodulation of the remainder of each timeslot.
This setting is useful if the signal under test does not contain a downlink pilot.
Because there is only one DwPTS per subframe, when the DwPTS is used as a reference, a
single phase and frequency estimate is used for every timeslot in the subframe. This
reference method should only be used if the DwPTS is active and the timeslots to be
analyzed are modulated at the same source as the DwPTS.
RSA3408A Option 28 User Manual
Page 77

TD-SCDMA Measurements
Table 2- 2: Global demodulation measurement parameter settings (cont.)
Parameter Description
Timeslot(s) to be Analyzed... Determines which timeslots to analyze.
All Active TS Measurement results are calculated for all active timeslots. Inactive timeslots are ignored.
Active timeslots are determined by the Active Timeslot Threshold Level setting.
Current TS Only Only the currently selected timeslot is analyzed in each subframe. All other timeslots are
ignored, even if active. This setting may decrease measurement calculation times.
With this selection, measurement results are only available for the selected timeslot.
Active Timeslot Threshold (dB) Sets the threshold that determines if a timeslot is active or inactive. A timeslot that is
transmitting above this level is considered active, relative to the maximum power level.
EVM includes I/Q Offset... Yes or No. Use this setting to include (or exclude) the I/Q offsets in the error vector magnitude
results.
Modulation Parameters... NOTE: Most modulation parameter changes do not take effect until the next Run cycle or
analysis cycle.
Parameter Control... Selects the method used to set the parameters in this menu.
Auto The settings are automatically determined without requiring the user to set parameters for the
following: Sync-DL, Sync-UL, and Scrambling Code.
Manual All settings can be individually set without affecting other settings in the menu.
Sync--DL Sets the code number of the downlink pilot pattern. You can set the value from 0 to 31.
Sync--UL Sets the code number of the uplink pilot pattern. You can set the value from 0 to 255.
Scrambling Code Selects the scrambling code. This value is also used for the basic midamble code. You can
set the value from 0 to 127.
K for Timeslots 1 through 6 Sets “K” for all timeslots except 0. You can set the value from 2 to 16.
K for Timeslot 0 Sets “K” for timeslot 0. You can set the value from 2 to 16.
Switching Point (timeslot) Sets the Switching Point between Uplink and Downlink timeslots. You can set the value from
1to6.
Measurement Filter Shape Sets the filter to be used for the measurement. You can select RootRaisedCosine,
RaisedCosine, or None. Select the filter based on the filter used for transmission of the signal
being tested for accurate measurement results.
For RF measurements, the filters only affect the numerical measurement readouts, not the
waveform displays. For demodulation measurements, the filters can affect the numerical
readouts and the waveform displays.
Select Subframe Selects the subframe to be analyzed. The subframe selection is dependent on the number of
subframes that have been analyzed, which is slightly less than the length set as the Analysis
Interval in the Timing menu.
After allowing the instrument to analyze a number of subframes, you can use this control to
view the measurement results for a different subframe.
Limits... Displays the limits editor to set the pass/fail limits for measurements. The limits editor that
displays is either the uplink or downlink editor, determined by whether the selected timeslot is
an uplink or downlink timeslot.
The Spectrum Emission Mask has separate limit tables (accessed through the main table)
and its own uplink/downlink controls.
Refer to Editing the Measurement Limits, on page 2--65, for more information.
RSA3408A Option 28 User Manual
2- 63
Page 78

TD-SCDMA Measurements
Table 2- 2: Global demodulation measurement parameter settings (cont.)
Parameter Description
Select Timeslot Sets the timeslot (TS) for the current measurement. The control cycles through TS0, DP
(downlinkpilot),UP(uplinkpilot),TS1,TS2,TS3,TS4,TS5,andTS6.
The timeslot selection is a global setting for all TD--SCDMA demodulation and RF
measurements.
The timeslot selection (whether it’s an uplink or downlink timeslot) also affects the which limits
editor menu is displayed (uplink or downlink).
After allowing the instrument to analyze a number of subframes, you can use this control to
view the measurement results for a different timeslot.
Select Code Sets the channelization code in the timeslot for the measurement. The channelization codes
in TD-SCDMA are called Orthogonal Variable Spreading Factor (OVSF) codes, and can have
spreading factors from 1 to 16. You can select codes from 0 to 15, based on a spreading
factor of 16. If you want to select a code with a lower spreading factor than 16, you can
choose any of the daughter codes at spreading factor 16 to select the mother code at the
lower spreading factor. For example, to select code 1 at spreading factor 2, you could select
any code from 8 to 15 since these 8 codes are the daughter codes of this mother code.
TPC and SS in Data 2
Yes T u rns the highlighting on for the TPC and SS bits in the Data 2 burst.
No Turns the highlighting off for the TPC and SS bits in the Data 2 burst.
TPC and SS Symbol Count
One Configures the symbol measurement to assume a TPC and SS symbol length of one.
16/SF Configures the symbol measurement to assume a TPC and SS symbol length of 16 divided
by the spreading factor.
2- 64
RSA3408A Option 28 User Manual
Page 79

Editing the Measurement Limits
This section describes how to set measurement limits to perform pass/fail testing
for the TD-SCDMA measurements.
Refer to Measurement Limit Defaults on page 2--72 for information about the
default settings of each measurement limit.
Using the Measurement Limits Editor
All measurement limits are set in the measurement limits editor, which you
access from the Limits... side key on the MEAS SETUP menu.
The Limits editor menu is divided into two groups, uplink and downlink limits.
The limit menu that displays when you press the Limits... side key is dependent
on the currently selected timeslot and the timeslot switching point (except for the
SEM measurements). If the timeslot is an uplink timeslot, the uplink limits
editor displays. If the timeslot is a downlink timeslot, the downlink limits editor
is displayed.
The SEM Limits editor display is dependent on the Uplink or Downlink setting
in the SEM measurement parameters.
NOTE. There are six separate limits editor tables:
Downlink limit editor (main)
Uplink limit editor (main)
SEM Offset From Channel dow nlink editor
SEM Offset From Channel uplink editor
SEM Inband Spurious downlink editor
SEM Inband Spurious uplink editor
Figure 2--27 shows the measurement limits editor (downlink) for the
TD-SCDMA measurements.
When changing limits, the pass/fail status of the measurements do not update
until the next run or analysis cycle (or changing the timeslot, subframe,
switching point, or select code). In the case of the transmit on/off masks
measurement, the masks are update when exiting the limits editor but the mask
region doesn’t change until the next run or analysis cycle.
RSA3408A Option 28 User Manual
2- 65
Page 80

Editing the Measurement Limits
Downlink limit
editor menu
displayed
Figure 2- 27: Measurement limits editor
Table 2 --3 describes all of the measurement limit items available in the measurement limits editor.
Table 2- 3: Measurement limits items
Limit item Description Lower limit range Upper limit range
Channel power Sets the lower and upper limits for the
Channel Power measurement.
ACLR 1st Lower Channel Sets the upper limit for the first lower
adjacent channel in the ACLR measurement.
ACLR 1st Upper Channel Sets the upper limit for the first upper
adjacent channel in the ACLR measurement.
ACLR 2nd Lower Channel Sets the upper limit for the second lower
adjacent channel in the ACLR measurement.
ACLR 2nd Upper Channel Sets the upper limit for the second upper
adjacent channel in the ACLR measurement.
Intermod 3rd Order Sets the upper limit of the third harmonic
distortion component for the Intermodulation
measurement.
--200 to 200 dBm --200 to 200 dBm
Not settable --70 to 70
Not settable --70 to 70
Not settable --70 to 70
Not settable --70 to 70
Not settable --200 to 200 dBc
2- 66
RSA3408A Option 28 User Manual
Page 81

Table 2- 3: Measurement limits items (cont.)
Limit item Upper limit rangeLower limit rangeDescription
Editing the Measurement Limits
Intermod 5th Order Sets the upper limit of the fifth harmonic
distortion component for the Intermodulation
measurement.
SEM Offset From Channel Select this item to access another measure-
ment limits editor to edit SEM offset from
channel limits. Refer to page 2--69.
SEM Inband Spurious Select this item to access another measure-
ment limits editor to edit SEM Inband
spurious limits. Refer to page 2--69.
Composite RMS EVM Sets the upper limit for the RMS EVM
measurement.
Composite Peak EVM Sets the upper limit for the Peak EVM
measurement.
Peak Code Domain Error Sets the upper limit for the Peak code domain
error measurement.
Rho Sets the lower limit of Rho for the modulation
accuracy measurement.
OBW Sets the upper and lower limits for the OBW
measurement.
Tx OFF Level Sets the upper limit of the mask region not
part of the mid-ramp region in the transmit
on/off mask measurement.
Tx OFF Mid-Ramp Level Sets the upper limit of the mid-ramp power
within the mid-ramp region in the transmit
on/off mask measurement.
Not settable --200 to 200 dBc
-- -- -- -- -- -- -- -- -- -- -- -- -- -- -- -- -- -- -- -- -- -- -- -- -- -- -- -- -- -- -- -- -- -- -- --
-- -- -- -- -- -- -- -- -- -- -- -- -- -- -- -- -- -- -- -- -- -- -- -- -- -- -- -- -- -- -- -- -- -- -- --
Not settable 0 to 100%
Not settable 0 to 100%
Not settable --200 to 200 dB
0to1 Not settable
0to30MHz 0to30MHz
Not settable --100 to 100
Not settable --100 to 100
Setting a Measurement
Limit
Perform the following procedure to set measurement limits:
1. Press the MEAS SETUP menu key to open the MEAS SETUP menu.
2. Press the Limits... side key to open the measurement limits menu and editor.
3. Press the Select row to edit side key.
4. Turn the general purpose knob or press the up/down arrow keys to select the
5. Press the Enable Limit side key to enable or disable the pass/fail testing for
6. Press the Lower Limit side key to set the lower limit for the selected
RSA3408A Option 28 User Manual
row that you want to edit.
the specified limit(s).
measurement item, if applicable.
2- 67
Page 82

Editing the Measurement Limits
7. Press the Upper Limit side key to set the upper limit for the selected
measurement item.
NOTE. The Default all limits side key resets the limit settings to their default
values of the currently displayed limits editor table. Other limit editor tables are
not affected.
When you want to set limits for the spectrum emission mask, perform the
following steps to open the SEM measurement limits editor:
1. Press the Select row to edit side key.
2. Turn the general purpose knob or press the up/down arrow keys to select
SEM Offset From Channel or SEM Inband Spurious.
3. Press the Edit SEM Offset Limits... or Edit SEM Inband Limits... side
key. This opens the limits editor to set more complex limits. Refer to Setting
the Spectrum Emission Mask L i mits, on page 2--69, for more information
about the SEM limit tables.
2- 68
RSA3408A Option 28 User Manual
Page 83

Editing the Measurement Limits
Setting the Spectrum
Emission Mask Limits
When you select the SEM Offset From Channel or SEM Inband Spurious row in
the measurement limits editor, another measurement limits editor for the
spectrum emission mask measurement is displayed. Figure 2--28 shows the
measurement limits editor for the Spectrum Emission Offset From Channel
measurement.
Figure 2- 28: Spectrum emission mask measurement limits editor
Table 2 --3 lists the measurement limit items that can be set in the SEM measurement limits editor.
Table 2- 4: Measurement limit items for the spectrum emission mask measurements
Item Description Limit ranges
Enable Enables or disables use of the mask in the specified zone (A, B, C, D,
or E).
Beginning Frequency Sets the beginning frequency for the zone. --8GHzto8GHz
Ending Frequency Sets the ending frequency for the zone. --8GHzto8GHz
Measurement Bandwidth Sets the measurement bandwidth. 1kHz to 10 MHz
Offset from Carrier
1
Specifies which offset side is to be measured You can select Upper
(positive), Lower (negative), or Both.
-- -- -- -- -- -- -- -- -- -- -- -- -- -- -- -- -- -- --
-- -- -- -- -- -- -- -- -- -- -- -- -- -- -- -- -- -- --
RSA3408A Option 28 User Manual
2- 69
Page 84

Editing the Measurement Limits
Table 2- 4: Measurement limit items for the spectrum emission mask measurements (cont.)
Item Limit rangesDescription
Fail if signal exceeds Selects the fail mode to detect fail conditions between the measure-
ment results and the test limits. The choices are:
H Absolute: Fail is detected when one of the absolute measurement
results is larger than the limit for Beginning Absolute Limit and/or
Ending Absolute Limit.
H Relative: Fail is detected when one of the relative measurement
results is larger than the limit for Beginning Relative Limit and/or
Ending Relative Limit.
H Rel OR Abs: Fail is detected when one of the absolute
measurement results is larger than the limit for Beginning
Absolute Limit and Ending Absolute Limit OR one of the relative
measurement results is larger than the limit for Beginning Relative
Limit and Ending Relative Limit.
H Rel AND Abs: Fail is detected when one of the absolute
measurement results is larger than the limit for Beginning
Absolute Limit and Ending Absolute Limit AND one of the relative
measurement results is larger than the limit for Beginning Relative
Limit and Ending Relative Limit.
Beginning Absolute Limit Sets an absolute level limit at Beginning Frequency. --200 dBm to 200 dBm
Ending Absolute Limit Sets an absolute level limit at Ending Frequency. --200 dBm to 200 dBm
Beginning Relative Limit Sets a relative level limit at Beginning Frequency. --200 dBm to 200 dBc
Ending Relative Limit Sets a relative level limit at Ending Frequency. --200 dBm to 200 dBc
1
The Offset from Carrier limit is only available for the SEM Offset From Channel limit editor menu.
-- -- -- -- -- -- -- -- -- -- -- -- -- -- -- -- -- -- --
2- 70
Perform the following steps to set measurement limits in the limits editor:
1. Press the Select column to edit side key.
2. Turn the general purpose knob or press the up/down arrow keys to select the
column that you want to edit.
3. Press the Enable side key to enable or disable use of t he limits for the zone.
4. Press the side key corresponding to the limit item, and then use the general
purpose knob or the up/down arrow keys to set the value.
5. Press the Default limits side key if you want to reset all limits (of the
displayed limits table) to their default values. Refer to Measurement Limit
Defaults, on page 2--72, for the default settings of each measurement limit.
6. Press the Rescale Graph side key to scale the graph to match the new limits.
RSA3408A Option 28 User Manual
Page 85

Saving and Loading Measurement Limits
Measurement limits set in the measurement limits editor can be saved as a file
and loaded from a file. Both the uplink and downlink limits are saved in the
same file. This section describes how to save and load measurement limits.
Refer to the RSA3408A Real-Time Spectrum Analyzer User Manual, for further
information about file operation including how to enter a file name and how to
delete a file.
Editing the Measurement Limits
Saving Measurement
Limits
Loading Measurement
Limits
Perform the following steps to save the current measurement limits to a file:
1. When you open the a spectrum emission mask measurement limits editor,
press the Cancel-Back (MENU) side key to return the measurement limit
editor.
2. Press the Save Limits side key to open the Save to File menu. You can save
the limits by using the preset file name or by entering a new file name.
3. To use the preset file name, press one of the following side keys: Save to
LimitsA, Save to LimitsB,orSave to LimitsC.
4. To enter a new file name, type a file name in the text box at the top of the
menu, and then press the Save File Now side key
The file extension *.lmt is automatically added to the limits file.
Perform the following steps to load measurement limits from a file:
1. When you open the spectrum emission mask measurement limits editor or
gated output power measurement limits editor, press the Cancel-Back
(MENU) side key to return the measurement limit editor.
2. Press the Load Limits side key to open the Load From File menu.
3. To load limits from the preset file, press one of the following side keys:
4. To load limits from an existing file, select the file from the file list, and then
RSA3408A Option 28 User Manual
Load from LimitsA, Load from LimitsB,orLoad from LimitsC.
press the Load File Now side key.
2- 71
Page 86

Editing the Measurement Limits
Measurement Limit Defaults
Tables 2--5 through 2--9 list the default limit settings used to perform the
pass/file testing for the TD-SCDMA measurements. R efer to Using the
Measurement Limits Editor on page 2-- 65 for procedures to edit the measurement
limits.
Tables 2--5 and 2--6 list the default limit settings for the downlink and uplink
measurements (excluding SEM). Tables 2--8 through 2--9 list the default limit
settings for the downlink and uplink SEM measurements.
NOTE. The Default all limits and Default limits side keys reset the limit settings
to their default values of the currently displayed limits editor table. Other limit
editor tables are not affected.
Table 2- 5: Downlink main table default limits
Limit item Enable Lower Upper Units
Channel power No --150 N/A dBm
ACLR 1st Lower Channel Yes 39.2 N/A dB
ACLR 1st Upper Channel Yes 39.2 N/A dB
ACLR 2nd Lower Channel Yes 44.2 N/A dB
ACLR 2nd Upper Channel Yes 44.2 N/A dB
Intermod 3rd Order Yes N/A --39.2 dBc
Intermod 5th Order Yes N/A --44.2 dBc
Composite RMS EVM Yes N/A 12.5 percent
Composite Peak EVM No N/A 31 percent
Peak Code Domain Error Yes N/A -- 2 7 dB
Rho No 0.9846 N/A N/A
OBW Yes N/A 1.6M Hz
Tx OFF Level Yes N/A -- 8 0 dBm
Tx OFF Mid-Ramp Level Yes N/A --41.3 dBm
Table 2- 6: Uplink main table default limits
Limit item Enable Lower Upper Units
Channel power No --150 N/A dBm
ACLR 1st Lower Channel Yes 33 N/A dB
ACLR 1st Upper Channel Yes 33 N/A dB
ACLR 2nd Lower Channel Yes 43 N/A dB
2- 72
RSA3408A Option 28 User Manual
Page 87

Editing the Measurement Limits
Table 2- 6: Uplink main table default limits (cont.)
Limit item UnitsUpperLowerEnable
ACLR 2nd Upper Channel Yes 43 N/A dB
Intermod 3rd Order Yes N/A -- 3 1 dBc
Intermod 5th Order Yes N/A -- 4 1 dBc
Composite RMS EVM Yes N/A 17.5 percent
Composite Peak EVM No N/A 31 percent
Peak Code Domain Error Yes N/A -- 2 1 dB
Rho No 0.9703 N/A N/A
OBW Yes N/A 1.6M Hz
Tx OFF Level Yes N/A -- 6 5 dBm
Tx OFF Mid-Ramp Level Yes N/A --50.0 dBm
Table 2- 7: Downlink SEM offset from channel default limits
Zone A B C D E
Enable Ye s Yes Yes Yes No
Beginning Frequency 815 kHz 1.015 MHz 1.815 MHz 2.3 MHz 4MHz
Ending Frequency 1.015 MHz 1.815 MHz 2.3 MHz 4MHz 7.5 MHz
Measurement Bandwidth 30 kHz 30 kHz 30 KHz 1MHz 1MHz
Offset from Carrier Both Both Both Both Both
Fail if signal exceeds Rel OR Abs Rel OR Abs Rel OR Abs Rel OR Abs Absolute
Beginning Absolute Limit --26.5 dBm --26.5 dBm --34.5 dBm --19.5 dBm --19.5 dBm
Ending Absolute Limit --26.5 dBm --34.5 dBm --34.5 dBm --19.5 dBm --19.5 dBm
Beginning Relative Limit --52.5 dBm --52.5 dBm --60.5 dBc --45.5 dBc 30 dBc
Ending Relative Limit --52.5 dBm --60.5 dBc --60.5 dBc --45.5 dBc 30 dBc
Table 2- 8: Uplink SEM offset from channel default limits
Zone A B C D E
Enable Ye s Yes Yes Yes No
Beginning Frequency 815 kHz 1.815 MHz 2.385 MHz 2.9 MHz 3.5 MHz
Ending Frequency 1.815 MHz 2.385 MHz 2.9 MHz 3.5 MHz 7.5 MHz
Measurement Bandwidth 30 kHz 30 kHz 30 KHz 1MHz 1MHz
Offset from Carrier Both Both Both Both Both
Fail if signal exceeds Rel OR Abs Rel OR Abs Rel OR Abs Rel OR Abs Absolute
RSA3408A Option 28 User Manual
2- 73
Page 88

Editing the Measurement Limits
Table 2- 8: Uplink SEM offset from channel default limits (cont.)
Zone EDCBA
Beginning Absolute Limit --55 dBm --55 dBm --55 dBm --55 dBm --55 dBm
Ending Absolute Limit --55 dBm --55 dBm --55 dBm --55 dBm --55 dBm
Beginning Relative Limit --35 dBm --49 dBc --54 dBc --49 dBc 30 dBc
Ending Relative Limit --49 dBc --54 dBc --54 dBc --49 dBc 30 dBc
Table 2- 9: Downlink SEM inband spurious default limits
Zone A B C D E
Enable Ye s Yes No No No
Beginning Frequency 30 MHz 1GHz 1.84 GHz 2.035 GHz 3GHz
Ending Frequency 1GHz 1.84 GHz 2.035 GHz 3GHz 8GHz
Measurement Bandwidth 100 kHz 1MHz 1MHz 1MHz 1MHz
Fail if signal exceeds Absolute Absolute Absolute Absolute Absolute
Beginning Absolute Limit --36 dBm --30 dBm --15 dBm --30 dBm --30 dBm
Ending Absolute Limit --36 dBm --30 dBm --15 dBm --30 dBm --30 dBm
Beginning Relative Limit 30 dBc 30 dBc 30 dBc 30 dBc 30 dBc
Ending Relative Limit 30 dBc 30 dBc 30 dBc 30 dBc 30 dBc
Table 2- 10: Uplink SEM inband spurious default limits
Zone A B C D E
Enable Ye s Yes No No No
Beginning Frequency 30 MHz 1GHz 925 MHz 935 MHz 1.805 GHz
Ending Frequency 1GHz 3GHz 935 MHz 960 MHz 1.88 GHz
Measurement Bandwidth 100 kHz 100 kHz 100 kHz 100 kHz 100 kHz
Fail if signal exceeds Absolute Absolute Absolute Absolute Absolute
Beginning Absolute Limit --36 dBm --30 dBm --15 dBm --30 dBm --30 dBm
Ending Absolute Limit --36 dBm --30 dBm --15 dBm --30 dBm --30 dBm
Beginning Relative Limit 30 dBc 30 dBc 30 dBc 30 dBc 30 dBc
Ending Relative Limit 30 dBc 30 dBc 30 dBc 30 dBc 30 dBc
2- 74
RSA3408A Option 28 User Manual
Page 89

Appendices
Page 90

Appendix A: Setting Range
This section lists the setting range of the horizontal and vertical scale for the
views.
Table A- 1: Display format and scale
Display format Horizontal range Vertical range
Spectrum 0Hzto8GHz --200 dBm to 100 dBm
Spectrogram 0Hzto8GHz --15999 to 0 frame
Code domain power 16 codes Relative: --200 dB to 100 dB
Absolute: 140 dBm to --160 dBm
CDP versus subframe Variable
Relative: --200 dB to 100 dB
Maximum: 4000 subframes (Standard),
1000 subframes (Opt 02)
CDP versus symbol Data: V ariable, based on spreading factor.
Maximum: 704
CDP codogram 16 codes --1000 to 0 subframes (Standard)
Composite constellation Fixed Fixed
Symbol constellation Fixed Fixed
EVM 704 symbols maximum --100% to 200%
Magnitude error 704 symbols maximum --300% to 300%
Phase error 704 symbols maximum --675 deg to 675 deg
Symbol table Data: 704 maximum --
Power versus time Timeslot Summary (full burst): 0 to
+675 msec and 6.25 msec additional
pre/post timeslot data (and chip position
within subframe)
Subframe Summary: --5.0 msec to 0 msec
(6400 chip)
Transmit On/Off Mask: same as subframe
summary
Absolute: 140 dBm to --160 dBm
Relative: --200 dB to 100 dB
Absolute: 140 dBm to --160 dBm
--2047 to 0 subframes (Option 02)
--200 dBm to 100 dBm
RSA3408A Option 28 User Manual
A-1
Page 91

Appendix A: Setting Range
A-2
RSA3408A Option 28 User Manual
Page 92

Index
Page 93

Index
A
ACLR measurement, 2--39
Acquisition history, 2--61
Acquisition length, 2--61
Acquisition subframes, 2 -- 61
Active channel threshold, 2--62
Active channels, 2--26
CDP display
active channels, 2--26
inactive channels, 2--26
Active timeslot threshold, 2--63
Address, Tektronix, vi
All active TS, 2--63
Analysis area, 2--6
Analysis control, demodulation, 2--62
Analysis interval, 2--61
Analysis offset, 2--61
Analyze, 2 -- 62
Auto, 2--63
Average burst power, 2--50
C
Channel power measurement, 2-- 33
Code domain power by codogram display, 2--31
Code domain power by subframe display, 2--28
Code domain power by symbol display, 2--29
Code domain power display, 2--25
Code domain power measurement, 2--23
code domain power by codogram display, 2--31
code domain power by subframe display, 2--28
code domain power by symbol display, 2--29
code domain power display, 2--25
Composite constellation display, 2--12
Contacting Tektronix, vi
Current TS only, 2--63
D
Data1 power, 2--50
Data2 power, 2--50
Demod frequency offset, 2--62
Downlink mask, transmit on/off measurement, 2--51
Downlink pilot, 2--8
DwPts, 2--62
DwPts pattern, 2--8
DwPts RMS power, 2--8
E
Editing measurement limits, 2--65
EVM includes I/Q offset, 2--63
F
Frequency & phase reference, 2--62
DwPts, 2--62
midamble, 2-- 62
Functional overview, 2--1
G
GP RMS power, 2--8
Guard period, 2--8
I
Ideal timeslot, 2--50
Inactive channels, 2--26
Intermodulation measurement, 2--58
K
K value, 2--50
K for timeslots, 2--63
L
Loading measurement limits, 2-- 71
M
Phase error display, 2--20
Magnitude error display, 2--18
Manual, 2--63
Manuals, related, v
PDF , v
Measurement
ACLR, 2--39
Channel power , 2--33
Code domain power, 2--23
intermodulation , 2--58
Modulation accuracy, 2--9
Spectrum emission mask, 2--43
RSA3408A Option 28 User Manual
Index- 1
Page 94

Index
Subframe summary, 2--6
Symbol table display, 2--55
Timeslot summary, 2--47
Transmit on/off mask, 2--51
Measurement filter shape, 2 -- 63
Measurement limit defaults, 2--72
Measurement limits
editing, 2--65
loading, 2--71
saving, 2--71
setting, 2--67
Measurement parameters
code domain power, 2--62
modulation accuracy, 2-- 62
subframe summary, 2--62
symbol table, 2--62
timeslot summary, 2--62
transmit on/off mask, 2--62
Timing parameters
code domain power, 2--61
modulation accuracy, 2-- 61
subframe summary, 2--61
symbol table, 2--61
timeslot summary, 2--61
transmit on/off mask, 2--61
Midamble, 2 -- 62
Midamble power, 2--50
Modulation accuracy measurement, 2--9
phase error display, 2--20
composite constellation display, 2--12
magnitude error display, 2--18
symbol constellation display, 2--14
symbol EVM display, 2--16
Modulation parameters, 2--63
Multiframe position, 2--8
O
Overview, functional, 2--1
P
Parameter control, 2--63
auto, 2-- 63
manual, 2-- 63
PDF manual, v
Phone number, Tektronix, vi
Product support, contact information, vi
R
Ranges, A--1
Related manuals, v
S
Saving measurement limits, 2--71
Scrambling code, 2--8, 2--63
Select code, 2--64
Select timeslot, 2--64
Selected timeslot, subframe summary, 2 -- 6
Service support, contact information, vi
Setting range, A--1
Spectrum emission mask measurement, 2--43
Spectrum length, 2--61
Spectrum offset, 2-- 61
Subframe summary, 2--6
Switching point, 2--8, 2--63
Symbol constellation display, 2--14
Symbol EVM display, 2--16
Symbol table display, 2--55
Sync--DL, 2--63
Sync--UL, 2--63
T
TD--SCDMA measurements, 2--5
Technical support, contact information, vi
Tektronix, contacting, vi
Time reference, 2--62
DwPts, 2--62
trigger, 2--62
Timeslot summary, 2--47
Timeslot summary measurement
ideal timeslot, 2--50
zoom, 2--49
Timeslot(s) to be analyzed, 2--63
All active TS, 2--63
Current TS only, 2--63
Timing error, 2--50
TPC and SS, 2--64
Transmit on/off mask, 2--51
zoom, 2--53
Trigger, 2--62
Index- 2
RSA3408A Option 28 User Manual
Page 95

Index
U
Uplink mask, transmit on/off measurement, 2--51
Uplink pilot, 2--8
UpPts RMS power, 2--8
URL, Tektronix, vi
W
Web site address, Tektronix, vi
Wide codes, 2--26
Z
Zoom
timeslot summary measurement, 2 -- 49
transmit on/off measurement, 2--53
RSA3408A Option 28 User Manual
Index- 3
Page 96

Index
Index- 4
RSA3408A Option 28 User Manual
 Loading...