

Page 1

x
RSA306B Real-Time
USB Spectrum Analyzer
Specifications and Performance Verification
ZZZ
Technical Reference
*P077124301*
077-1243-01
Page 2

Page 3

xx
RSA306B Real-Time
USB Spectrum Analyzer
Specifications and Performance Verification
ZZZ
Technical Reference
www.tek.com
077-1243-01
Page 4

Copyright © Tektronix. All rights reserved. Licensed software products are owned by Tektronix or its subsidiaries or suppliers, and are
protected by na
tional copyright laws and international treaty provisions.
Tektronix pro
previously published material. Specifications and price change privileges reserved.
TEKTRONIX and TEK are registered trademarks of Tektronix, Inc.
SignalVu-PC is a trademark of Tektronix, Inc.
ducts are covered by U.S. and foreign patents, issued and pending. Information in this publication supersedes that in all
Contacting Tektronix
Tektronix, Inc.
14150 SW Karl Braun Drive
P.O. Box 500
Beaverton, OR 97077
USA
For product information, sales, service, and technical support:
In North America, call 1-800-833-9200.
Worldwide, visit www.tek.com to find contacts in your area.
Page 5

Table of Contents
Important safety information .......................................................................................................... iii
General safety summary......................................................................................................... iii
Service safety summary ......................................................................................................... iv
Terms in this manual ... .... . . ... . . ... . . ... . . ... . . .. . . . ... . . ... . . .. . . . .. . . . .. . . . .. . . . .. . . . .. . . ... . . ... . . . .. . . ... . . ... . . ... . . ... . . . v
Terms and symbols on the product . . . .. . . . .. . . . .. . . . ... . . ... . . ... . . ... . . . .. . . ... . . . .. . . . ... . . .. . . . ... . . ... . . ... . . ... . . ... . . . .. . . v
Preface ................................................................................................................................. vi
Documentation ...................................................................................................................vi
Specifications .......................................................................................................................... 1
Frequency . .. . . . .. . . . ... . . .. . . . ... . . ... . . .. . . . ... . . ... . . .. . . . ... . . ... . . .. . . . ... . . ... . . .. . . . ... . . ... . . ... . . ... . . ... . . ... . . ... . . .. .. 2
Amplitude......................................................................................................................... 2
Trigger . . . ... . . .. . . . .. . . . .. . . ... . . ... . . ... . . ... . . ... . . .. . . . .. . . . .. . . ... . . ... . . .. . . . .. . . . .. . . ... . . ... . . ... . . ... . . ... . . .. . . . .. . . . .... 4
Intermediate frequency and acquisition system . ... . . .. . . . .. . . . .. . . ... . . ... . . . .. . . ... . . ... . . ... . . ... . . ... . . .. . . . .. . . . .. . . ... . . . 4
Noise and distortion..............................................................................................................5
Swept and Real time............................................................................................................. 9
Interfaces, input, output ports... . . ... . . ... . . ... . . .. . . . .. . . . .. . . ... . . ... . . . .. . . ... . . ... . . ... . . ... . . ... . . .. . . . .. . . . .. . . ... . . . .. . . . 10
Power............................................................................................................................ 10
Physical.......................................................................................................................... 10
Regulatory....................................................................................................................... 10
Environmental pe
Performance verification.............................................................................................................. 12
Prerequisites . ... . . .. . . . .. . . ... . . ... . . ... . . ... . . ... . . .. . . . .. . . . .. . . ... . . ... . . .. . . . .. . . . .. . . ... . . ... . . ... . . ... . . ... . . .. . . . .. . . . ... 12
Required equipment .. . . ... . . ... . . . .. . . ... . . . .. . . . .. . . ... . . . .. . . . .. . . ... . . . .. . . . .. . . ... . . . .. . . . .. . . . .. . . . .. . . . .. . . . .. . . . .. . . . .. . 13
Preliminary checks.............................................................................................................. 14
Performance verification procedures .. . . ... . . .. . . . ... . . ... . . .. . . . ... . . ... . . .. . . . .. . . . ... . . .. . . . .. . . . ... . . .. . . . .. . . . .. . . . .. . . . .. 15
Internal reference frequency accuracy .. . . ... . . ... . . ... . . .. . . . ... . . ... . . .. . . . .. . . . .. . . ... . . . .. . . . .. . . ... . . ... . . ... . . ... . . 15
External reference i nput, functional test . . . . .. . . ... . . ... . . ... . . ... . . ... . . .. . . . .. . . . .. . . ... . . ... . . .. . . . .. . . . .. . . ... . . ... . . . 17
Amplitude accuracy at all center frequencies . . ... . . ... . . ... . . ... . . ... . . .. . . . ... . . ... . . .. . . . ... . . ... . . .. . . . .. . . . ... . . .. . . 18
Channel amplitude flatness ............................................................................................... 26
DANL (Displayed Average Noise Level).................................................................................. 31
Phase noise. .. . . ... . . . .. . . . .. . . ... . . ... . . ... . . ... . . ... . . ... . . ... . . ... . . .. . . . .. . . . ... . . .. . . . .. . . . .. . . ... . . . .. . . . .. . . ... . . ... 33
Third-order intermodulation distortion . . . . .. . . .. . . . .. . . .. . . . .. . . ... . . .. . . ... . . .. . . . .. . . .. . . . .. . . .. . . . .. . . ... . . .. . . ... . . .. . 36
Input-related spurious response: A DC . .. . . . .. . . . .. . . ... . . ... . . ... . . ... . . ... . . .. . . . .. . . . .. . . ... . . ... . . ... . . ... . . ... . . .. . . 38
Input-related spurious response: second converter images . . .. . . . ... . . .. . . . ... . . ... . . ... . . ... . . . .. . . . .. . . . .. . . . ... . . ... 41
Input-related spurious response: first converter images . .. . . . .. . . . ... . . .. . . . .. . . . .. . . . .. . . . .. . . . .. . . . .. . . . .. . . . .. . . ... . . 43
Input-related spurious response: IF feedthrough ... . . . .. . . ... . . ... . . .. . . . .. . . . .. . . . .. . . . .. . . . .. . . ... . . ... . . .. . . . .. . . . .. . 45
Input-related spurious response: RF X 2LO... . . . .. . . ... . . ... . . . .. . . ... . . ... . . . .. . . ... . . ... . . . .. . . ... . . . .. . . . .. . . ... . . . .. 47
Input-related spurious response: RF X 3LO... . . . .. . . ... . . ... . . . .. . . ... . . ... . . . .. . . ... . . ... . . . .. . . ... . . . .. . . . .. . . ... . . . .. 49
Input-related spurious response: signal 2RF X 2LO . . . ... . . . ... . . ... . . ... . . . ... . . ... . . . .. . . . ... . . ... . . . .. . . . ... . . ... . . .. 51
Test record....................................................................................................................... 53
rformance .................................................................................................... 11
Table of Content
s
RSA306B Specifications and Performance Verification i
Page 6

Table of Content
s
ii RSA306B Specifications and Performance Verification
Page 7

Important safet
y information
Important saf
This manual contains information and warnings that must be followed by the user for safe operation and to keep the
product in a safe condition.
To safely perform service on this product, additional information is provided at the end of this section. (See page iv,
Service safety summary.)
ety information
General safety summary
Use the product only as specified. Review the following safety precautions to avoid injury and prevent damage to this product
or any products connected to it. Carefully read all instructions. Retain these instructions for future reference.
Comply with local and national safety codes.
For correct and safe operation of the product, it is essential that you follow generally accepted safety procedures in addition
to the safety precautions specified in this manual.
The product is designed to be used by trained personnel only.
Only qualified personnel who are aware of the hazards involved should remove the cover for repair, maintenance, or
adjustment.
This product is not intended for detection of hazardous voltages.
While using this product, you may need to access other parts of a larger system. Read the safety sections of the other
component manuals for warnings and cautions related to operating the system.
When incorporating this equipment into a system, the safety of that system is the responsibility of the assembler of the system.
To avoid fire or personal injury
Connect and disconnect properly. Do not connect or disconnect probes or test leads while they are connected
to a voltage source.
Use only insulated voltage probes, test leads, and adapters supplied with the product, or indicated by Tektronix to be
suitable for the product.
Observe all terminal ratings. To avoid fire or shock hazard, observe all ratings and markings on the product. Consult
the product manual for further ratings information before making connections to the product.
Do not app
The measuring terminals on this product are not rated for connection to mains or Category II, III, or IV circuits.
Do not operate without covers. Do not operate this product with covers or panels removed, or with the case open.
Avoid exposed circuitry. Do not touch exposed connections and components when power is present.
Do not operate with suspected failures. If you suspect that there is damage to this product, have it inspected by
qualified service personnel.
Disable the product if it is damaged. Do not use the product if it is damaged or operates incorrectly. If in doubt about safety of
the product, turn it off and disconnect the power. Clearly mark the product to prevent its further operation.
ly a potential to any terminal, including the common terminal, that exceeds the maximum rating of that terminal.
RSA306B Specifications and Performance Verification iii
Page 8

Important safet
Examine the exterior of the product before y ou use it. Look for cracks or missing pieces.
Use only specified replacement parts.
Do not operate in wet/damp conditions. Be aware that condensation may occur if a unit is moved from a cold to a
warm environment.
Do not operate in an explosive atmosphere.
y information
Keep product surfaces clean and dry.
Provide proper ventilation. Refer to the installation instructions in the manual for details on installing the product
so it has proper ventilation.
Provide a s
Improper or prolonged keyboard or pointer use may result in serious injury.
Be sure your work area meets applicable ergonomic standards. Consult with an ergonomics professional to avoid stress
injuries.
Use only the Tektronix rackmount hardware specified for this product.
Service
The Service safety summary section contains additional information required to safely perform service on the product. Only
qualified personnel should perform service procedures. Read this Service safety summary and the General safety summary
before performing any service procedures.
To avoi
Do not service alone. Do not perform internal service or adjustments of this product unless another person capable of
rendering first a id and resuscitation is present.
afe working environment.
safety summary
d electric shock.
Remove the input signals before you clean the product.
Avoid improper or prolonged use of keyboards, pointers, and button pads.
Do not touch exposed connections.
Disconnect power. To avoid electric shock, disconnect the USB 3.0 cable from the instrument before removing any
covers or panels, or opening the case for servicing.
Use care when servicing with power on. Disconnect power, remove battery (if applicable), and disconnect test leads
before removing protective panels, soldering, or replacing components.
iv RSA306B Specifications and Performance Verification
Page 9
Terms in this manual
These terms may appear in this manual:
WARNING. Warning statements identify conditions or practices that could result in injury or loss of life.
CAUTION. Caution statements identify conditions or practices that could result in damage to this product or other property.
Terms and symbols on the product
These terms may appear on the product:
DANGER indicates an injury hazard immediately accessible as you read the marking.
WARNING indicates an injury hazard not immediately accessible as you read the marking.
CAUTION indicates a hazard to property including the product.
Important safet
y information
When this symbol is marked on the product, be sure to consult the manual to find out the nature of the
potential hazards and any actions which have to be taken to avoid them. (This symbol may also be used to
refer the user to ratings
The following symbol(s) m ay appear on the product:
in the manual.)
RSA306B Specifications and Performance Verification v
Page 10

Preface
Preface
Verify the software version
The SignalVu-PC software version must be version 3.11.0x or greater.
Purpose
This manual lists the electrical, mechanical, and environmental specifications, and the certification and compliance
statements for the Tektronix RSA306B USB Spectrum Analyzer. Also provided are procedures for verifying the performance
of the inst
Documentation
The following table lists some of the documentation that is available for this product.
Product documentation
Document Purpose Location
Installation and Safety Instructions Provides software and hardware
Specifications and Performance
Verification Technical Reference
(this manual)
SignalVu-PC application help
RSA306B API Programmer
manual
SignalVu-PC Programmer manual
rument.
installation instructions and
associated safety warnings
Specifications and performance
verification procedures for
checking instrument performance
Using the application and
interpreting the measurement
results
Details on commands used to
control the instrument through an
API
Details on commands used with
the SignalVu-PC application
Printed manual and also available in electronic
format on the product flash drive and at
www.tektronix.com/manuals
Available at www.tektronix.com/manuals
Application help files located within the
application
Available at www.tektronix.com/manuals
Available at www.tektronix.com/manuals
vi RSA306B Specifications and Performance Verification
Page 11

Specifications
Specification
All specifications are guaranteed unless labeled Typical. Typical specifications are provided for your convenience.
NOTE. Warranted characteristics that are checked in the Performance Verification are marked with a
The performance limits in this specification are valid within the following conditions:
The SignalVu-PC software version is 3.7.0114 or greater.
Operate the instrument in an environment that meets the temperature, altitude, and humidity characteristics listed in
these specifications.
The instrument must have been operating for a warm-up period of at least for 30 minutes (after being connected to the
PC, starting the SignalVu-PC application, and SignalVu-PC is connected to the RSA306B instrument and continuously
acquiring data).
NOTE. The RSA306B does not fully power on until SignalVu-PC has established communication with the RSA306B
and is acquiring data.
The instrument must have had its signal–path–compensation routine last executed after at least a 30 minute warm–up
period at an ambient temperature within ±2 °C of the current ambient temperature.
s
symbol.
RSA306B Specifications and Performance Verification 1
Page 12

Specifications
Frequency
RF input frequency range 9kHzto6.2GHz
Frequency reference accuracy
Over 18 °C to 28 °C ambient
temperature range
Aging, typical
Over operating temperature
range (–10
ambient), typical
External frequency reference
input
Input Frequency Range 10 MHz ± 10 Hz
Input Lev
Impedance
Center
Block I
Strea
°C to +55 °C
el Range
frequency resolution
Q samples
med ADC samples
±3 x 10⁻⁶+ aging (after 20 minute warm up)
–6
±3 x 10
±20 x 10
–10 dBm to
50
1Hz
500 kHz
(first year), ±1 x 10⁻⁶each year thereafter
–6
+ aging
+10 dBm sinusoid
Amplitude
RF input impedance
RF input VSWR, typical 1.8:1 (10 MHz to 6200 MHz, reference level +10 dBm)
Maximum RF input level without
age
dam
DC
Re
R
Maximum RF input operating
evel
l
Center frequency < 22 MHz
Center frequency 22 MHz
voltage
fLevel –10 dBm
ef Level < –10 dBm
50
uivalent Return Loss: 11 dB)
(Eq
The maximum voltage or power that the RF input can withstand without creating
ock hazard or damaging the input.
ash
±40 V
DC
3 dBm (continuous or peak)
+2
15 dBm (continuous or peak)
+
he maximum level at the RF input for which the instrument will meet its
T
measurement specifications.
+15 dBm
+20 dBm
2 RSA306B Specifications and Performance Verification
Page 13
Specifications
Amplitude accuracy at all center
frequencies
Center freque
<3GHz
Center frequency 3GHzto
6.2 GHz
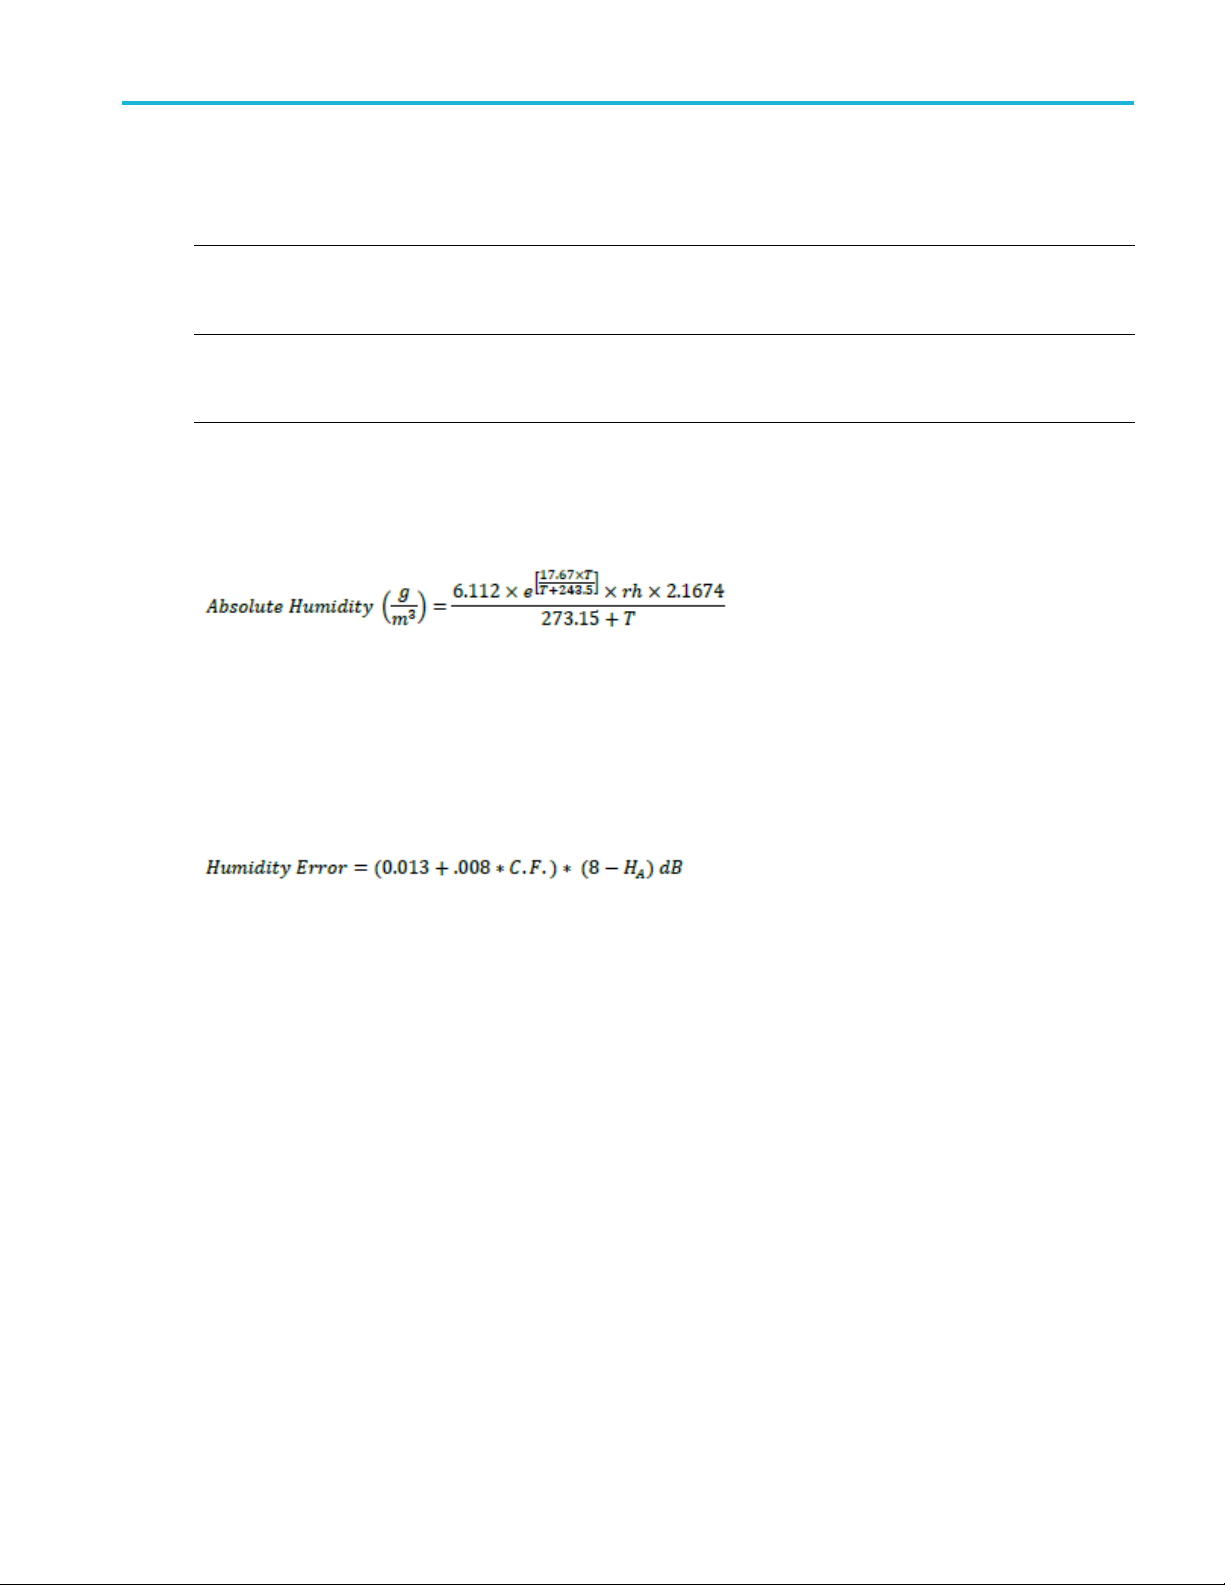
The above Amplitude accuracy at all center frequencies specifications apply when operated and stored at the same ambient
absolute h
Absolute humidity can be estimated from ambient temperature ⁰C and relative humidity rh (%) using readily available online
calculators or the following relation:
Losses in the RF path of the product are proportional to its PCB moisture content which is in turn proportional to the amount
of moisture in the air. PCB moisture responds slowly to ambient conditions and it may take a day or more for an ambient
humidit
original ambient condition. Amplitude errors due to humidity are minimal when the ambient conditions are the same as the
factory calibration conditions, nominally 8 g/m3 and increase proportional to the difference from that value averaged over
time. T
umidity conditions as the average factory calibration environment (8 grams of water per cubic meter of air).
y change to cause a significant amplitude shift, it may require a similar length of time to recover after return to the
he additional amplitude error is given by
ncy9kHzto
Reference leve
Applies to corrected IQ data, with signal to noise ratios > 40 dB
Accuracy may degrade up to ±0.6 dB after storage at maximum storage temperature,
recovers with
±1.2 dB (18 °C t
±0.8 dB (18 °C to 28 °C), typical (95% confidence)
±1.0 dB (–10 °C to 55 °C), typical
±1.65 dB (18 °C to 28 °C)
±1.0 dB (18 °
±0.85 dB (–10 °C to 55 °C), typical
l +20 dBm to –30 dBm, alignment run prior to testing
in 24 hours
o28°C)
C to 28 °C), typical (95% confidence)
(C.F. = center frequency in GHz, HA = Absolute Humidity in g/m^3). Worst case amplitude error is the greater of the error in
the table or the sum of the value in the table combined with the humidity error.
Example:
Center Freq. = 4 GHz, temperature = 28C, R.H. = 80%.
Absolute Humidity= 21.8 g/ m3
Humidity Error (4 GHz, 21.8 g/ m3) = -0.62 dB
P-TYP-S95 error from table = +1, -1 dB
Sum of table plus hum. error= (1-0.62)=0.38 dB, (-1-0.62)= -1.62 dB
Worst case amplitude error = +1 dB, -1.62 dB
RSA306B Specifications and Performance Verification 3
Page 14

Specifications
Trigger
Channel amplitude flatness
At 18 °C to 28 °C
Center frequency 22 MHz to
24 MHz
Center frequency 24 MHz to
6.2 GHz
At –10 ⁰Cto55⁰C
Center frequency 22 MHz to
24 MHz
Center frequency 24 MHz to
6.2 GHz
Trigger/sync input
Voltage range
Trigger level Positive-going threshold voltage: 1.6 V minimum, 2.1 V maximum
Impedance
Power trigger
Threshold range
Type
Trigger re-arm time 100 s
Reference leve
Applies to corrected IQ data, with signal to noise ratios > 40 dB
±1.2 dB
±1.0 dB, typical
±1.0 dB
±0.4 dB, typical
±2.5 dB, typ
±0.5 dB, typical
TTL(0.0V–5.0V)
Negative-going threshold voltage: 1.0 V minimum, 1.35 V maximum
10 k (with Schottky clamps to 0 V, +5 V)
Trigger on RF power level transitions which cross the trigger level, for signals
the IF BW.
0 dB to –50 dB (from reference level, for trigger levels > 30 dB above the noise
floor, 0.1 dB steps)
Rising or falling edge
l +20 dBm to –30 dBm, alignment run prior to testing
ical
within
Intermediate frequency and acquisition system
IF bandwidth 40 MHz
ADC sample rate and bit width 112 Ms/s, 14 bits
Sample rate and bit-width of the Analog/Digital Converter used to digitize the IF signal
Real-time IF acquisition data
(uncorrected)
Block baseband acquisition data
(corrected)
Maximum acquisition time 1 s
Bandwidths
Sample rates 56 / (2N) Ms/s, 32-bit float complex samples, N 0
4 RSA306B Specifications and Performance Verification
112 Ms/s, 16-bit integer samples
40 MHz BW, at digital IF = 28 ±0.25 MHz, uncorrected
Block streaming data at an average rate of 224 MB/sec
N
40 /( 2
) MHz, 0 Hz Digital IF, N 0
Page 15

Noise and distortion
Specifications
Displayed average noise level
(DANL)
Phase noise
Reference level = –50 dBm, input terminated with 50 load, log-average (10 averages)
DANL (dBm/Hz),
DANL (dBm/Hz),
Center frequency Frequency range
< 22 MHz (LF path)
22 MHz (RF path)
Phase Noise (dBc/Hz) measured with 1 GHz CW signal at 0 dBm
100 kHz to
<42MHz
2MHzto<5MHz –145 –148
5 MHz to < 1.0 GHz
1.0 GHz to
<1.5GHz
1.5 GHz to
<2.5GHz
2.5 GHz to
<3.5GHz
3.5 GHz to
<4.5GHz
4.5 GHz to 6.2 GHz
18 ⁰Cto28⁰C
–130 –133
–161 –163
–160 –162
–157 –159
–154 –156
–152 –155
–149 –151
–10 ⁰Cto55⁰C,
typical
Offset: Center frequency, dBc/Hz
1kHz –84 –115 –89 –78 –83
10 kHz –84 –122 –87 –84 –85
100 kHz –88 –126 –93 –92 –95
1MHz –118 –127 –120 –114 –110
Residual spurious response,
typical
Center frequency
9kHzto<1GHz
1to<3GHz
3to6.2GHz
With the following exceptions:
<–80 dBm, Center Frequency 2080-2120
<–80 dBm, Center Frequency 3895 -3945 MHz
<–85 dBm, Center Frequency 4780-4810 MHz
Input related spurious response
(SFDR)
Reference level –50 dBm, RF input terminated with 50
< –100 dBm
< –95 dBm
< –90 dBm
Conditions: 18 °C to 28 °C, auto settings on, reference level -30 dBm, input
amplitude at or below reference level.
1GHz
10 MHz
(typical)
1GHz
(typical)
2.5 GHz
(typical)
6GHz
(typical)
RSA306B Specifications and Performance Verification 5
Page 16

Specifications
Input frequen
Spurious responses due to the following mechanisms: RFx2*LO1, 2RFx2*LO1,
RFx3*LO1, RFx5*LO1, RF to IF feed-through, IF2 Image.
–60 dBc
Spurious responses due to First IF images (RFXLO1):
–60 dBc, < 2700 MHz center frequency
–50 dBc, 270
Exceptions:
IF feedthrough: –45 dBc for 1850 MHz – 2700 MHz center frequency, typical
First IF Image: –55 dBc for 1850 MHz – 1870 MHz center frequency, typical
–35 dBc fo
Second IF I
-50 dBc 4175-4225 MHz
RFx2LO: –50 dBc for 4750 MHz – 4810 MHz center frequency, typical
2RFx2LO: –50 dBc for 3900 MHz – 3940 MHz center frequency, typical
RFx3LO: –45 dBc for 4175 MHz – 4225 MHz center frequency, typical
Spurious responses due to ADC images:
–60 dBc, offset from center frequency > 56 MHz
–50 dBc
Input f
Spurious responses due to the following mechanisms: First IF Image, RFX2LO1,
2RFX2LO1, RFX3LO1, RFX5LO1, IF2 Image.
–60 dB
Exceptions:
cies ≤ 6.2 GHz
0 – 6200 MHz center frequency
–35 dBc for 3700 MHz – 3882 MHz center frequency, typical
r 5350 MHz – 5700 MHz center frequency, typical
mage: -50 dBc 22 - 1850 MHz
,56MHz offset from CF 36 MHz
requencies > 6.2 GHz – 8.0 GHz (typical)
c
First IF Image: –40 dBc for 3800 MHz center frequency, typical
RFx2LO: –25 dBc for 4800 MHz – 5150 MHz center frequency, typical
–40 dBc for 5150 MHz – 5800 MHz center frequency, typical
RFx3LO: –40 dBc for 4150 MHz – 4250 MHz center frequency, typical
6 RSA306B Specifications and Performance Verification
Page 17
Specifications
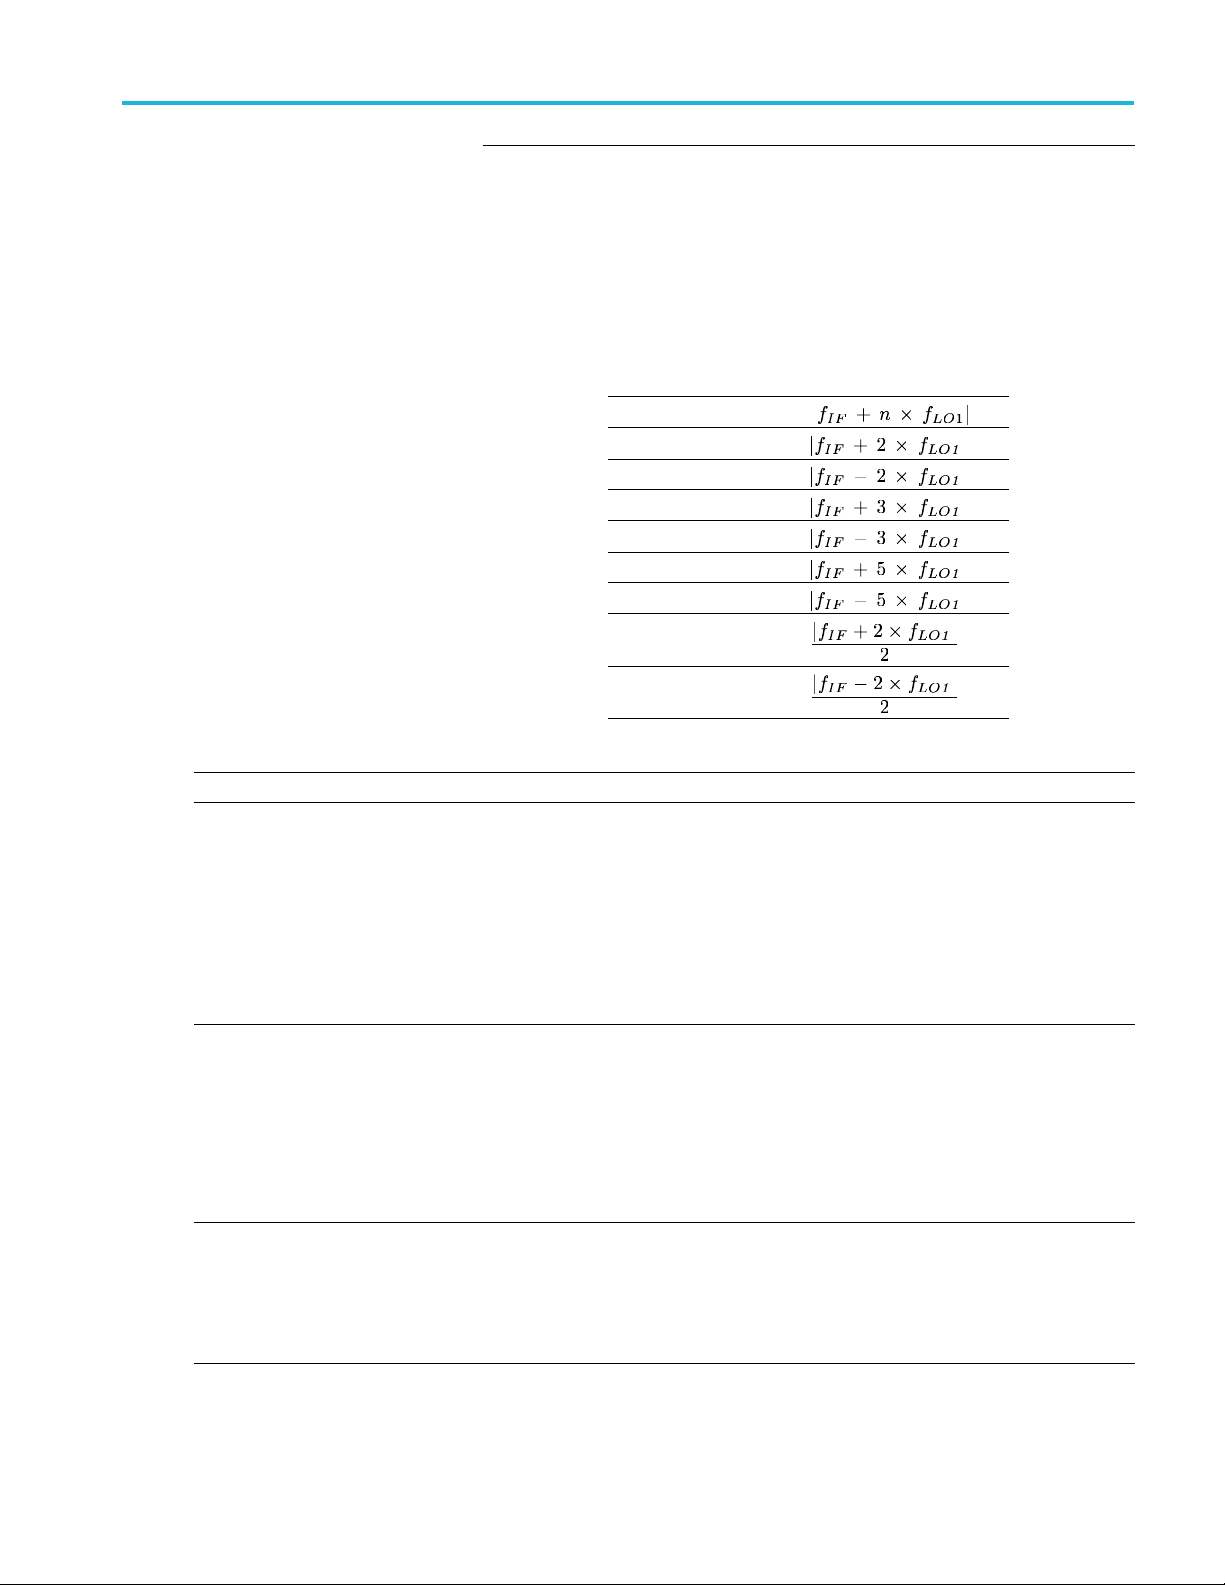
Spurious Resp
spurious signals caused by RF input signals (blockers) mixing with local oscillators
(LO1 or LO2) at a frequency determined by the hardware settings for the IF and
LO1 frequency
For a given center frequency setting, use the Frequency Tuning Table to determine
the corresponding n and the IF and LO1 frequencies. (See Table 1 on page 8.) Use
the formulas
will cause a spur at the center frequency.
Residual FM, typical <10Hz
er IM distortion
3RDord
–63 dBc at center frequency 2130 MHz, reference level = –15 dBm, 18 ⁰Cto28⁰C
–63 dB
55 ⁰C, typical
–63 dBc at center frequency 2130 MHz, reference level = –30 dBm, typical
< –58 d
< –50 dBc, 40 MHz to 6.2 GHz, reference level = –50 dBm, typical
Two CW signals, 1 MHz separation, each input signal level 5 dB below the reference
l setting at the RF input
leve
rder intercept (TOI)
3RDo
dBm at center frequency 2130 MHz, reference level –15 dBm, 18 ⁰Cto28⁰C
+13
+13 dBm at center frequency 2130 MHz, reference level –15 dBm, –10 ⁰Cto
55 ⁰C, typical
dBm at center frequency 2130 MHz, reference level –30 dBm, typical
–2
+14 dBm, 40 MHz to 6.2 GHz, reference level = –10 dBm, typical
–30 dBm, 40 MHz to 6.2 GHz, reference level = –50 dBm, typical
ese are indirectly tested by the 3rd Order IM Distortion test
Th
2NDharmonic distortion, typical
55 dBc, 10 MHz to 300 MHz, reference level = 0 dBm
<–
< –60 dBc, 300 MHz to 3.1 GHz, reference level = 0 dBm
< –50 dBc, 10 MHz to 1850 MHz, and 2330 MHz to 3100 MHz, reference level =
40 dBm
–
< –45 dBc , 1850 MHz to 2330 MHz, reference level = –40 dBm
onse Definitions: For each center frequency setting, any on-screen
.
below to calculate the required input signal (blocker) frequency which
Spur Type
Blocker Fre
quency
(Source Frequency)
|IF1 Image|
|RF+2LO|
|RF-2LO|
|RF+3LO|
|RF-3LO|
|RF+5LO|
|RF-5LO|
|2RF+2LO
|
|2RF-2LO|
RF to IF Feedthrough 1190 MHz or 2440
MHz
p-p
c at center frequency 2130 MHz, reference level = –15 dBm, –10 ⁰Cto
Bc, 40 MHz to 6.2 GHz, reference level = –10 dBm, typical
RSA306B Specifications and Performance Verification 7
Page 18

Specifications
2NDharmonic distortion
intercept (SHI
Local oscillator feedthrough to
input connector, typical
), typical
+55dBm,10MHz
+60 dBm, 300 MHz to 3.1 GHz, reference level = 0 dBm
+10 dBm, 10 MHz to 1850 MHz, and 2330 MHz to 3100 MHz, reference level =
–40 dBm
+5 dBm, 1850 MHz to 2330 MHz, reference level = –40 dBm
< –75 dBm
Reference level = –30 dBm
to 300 MHz, reference level = 0 dBm
Table 1: Frequency Tuning Table
CenPreSelec-
Subband
0 LF 0.009 22 None None
1 1 22 700 2462 3140 2440 1 –1 1 2300
2 2 700 1850 3140 4290 2440 1 –1 1 2300
3 3 1850 2700 3040 3890 1190 1 –1 1 1050
4 4 2700 3100 3890 4290 1190 1 –1 1 1050
5
6
75
8
9
10 6 4960 5100 3770 3910 1190 –1 1 –1 1050
11 6 5100 5695 3910 4505 1190 –1 1 –1 1050
12 6 5695 5700 4505 4510 1190 –1 1 –1 1050
13
14
tor Filter
4 3100 3700 4290 4890 1190 1 –1 1 1050
5
5
5
7
7
ter
Freq.
Min.
(MHz)
3700 4175 4890 5365 1190 1 –1 1 1050
4175 4225 1735 1785 2440 –1 1 –1 2300
4225 4750 5415 5940 1190 1 –1 1 1050
4750 4960 3560 3770 1190 –1 1 –1 1050
570
5900 6220 4710 5030 1190 –1 1 –1 1050
Center
Freq.
Max
(MHz)
0
590
LO1
Min
(MHz)
0
451
LO1
Max
(MHz)
0
471
IF1
(MHz)
DC
0
119
LO1
High
/Low
Side
111None
0
–1 1 –1 105
m
(RF) n (LO)
LO2
(MHz)
0
8 RSA306B Specifications and Performance Verification
Page 19

Swept and Real time
Specifications
RF full band sweep time,typical
mean
DPX bitmap image resolution 201 pixels vertical x 801 pixels horizontal
DPX s pectro
resolution
Audio dem
Types AM, FM
IF bandwidth range Five selections, 8 kHz – 200 kHz
Audio output frequency range
Minimum
POI),typical
gram minimum time
odulation
signal duration (100%
16.5 GHz/sec (RBW = 1 MHz)
16.5 GHz/sec (
13.7 GHz/sec (RBW = 10 kHz)
1.9 GHz/sec (RBW = 1 kHz)
(Measured us
Processor, 8GB RAM, 256GB SSD, Windows®7 Pro.)
(Spectrum display is only measurement on screen.)
1 milliseco
(10,000 spectrums per second)
Due to the non-deterministic execution time of programs running under Microsoft
Windows OS
with other processing tasks
(Audio fil
50Hz–10kHz
Minimum signal
on for 100% POI
durati
27
34
36
35
37
DPX settings: Span = 40 MHz, RBW = 300 kHz (Auto)
10,000 per second (span independent)
Due to the nondeterministic execution time of programs running under Microsoft
indows OS, this specification may not be met when the host PC is heavily loaded
W
with other processing tasks
RBW = 100 kHz)
ing a Panasonic Toughpad FZ-G1, Intel® Core™ i5-5300U 2.3GHz
nd
, this specification may not be met when the host PC is heavily loaded
e output: 16 bits at 32 ksps in .wav format.)
Test controller
sktop (Windows® 10 E nterprise, Intel® Core™
Dell De
i7-4790 CPU, 3.6GHz, 8GB RAM, 256GB SSD)
Dell Desktop (Windows® 7 Enterprise, Intel® Core™
i7-2600 CPU, 3.4GHz, 8GB RAM, 256GB SSD)
Dell Laptop Latitude E6430 (Windows® 10 Enterprise,
l® Core™ i7-3520M CPU, 2.9GHz, 8GB RAM,
Inte
250 GB SSD)
Dell Laptop Precision M4700 (Windows® 8 Enterprise,
Intel® Core™ i7-3520M CPU, 2.9GHz, 8GB RAM,
GB HD)
750
asonic ToughPad SAPL-TP-04 (Windows® 7 Pro,
Pan
Intel® Core™ i5-5300U CPU, 2.3GHz, 8GB RAM,
256GB SSD)
RSA306B Specifications and Performance Verification 9
Page 20

Specifications
Interfaces, input, output ports
RF input
External frequency reference
input
Trigger/syn
Status indi
USB device port USB 3.0 - M icro-B (with thumbscrews)
Power
Power consumption
Physical
Weight
Dimensions
Heigh
Width
Dept
c input
cator
t
h
Type N, female
SMA, female
SMA, female
LED, dual co
LED states:
Steady Red: USB power applied, or resetting
Steady Gre
Flickering Green: Transferring acquired data to host PC
Per USB 3
0.59 kg (1.3 lbs)
30.5 mm (1.2 in)
127 mm (5.0 in)
190.5 mm (7.5 in)
lor red/green
en: Initialized, ready for use
.0 SuperSpeed requirements: 5.0 V, 900 mA, nominal
ulatory
Reg
ety
Saf
gional certifications
Re
Cemissions
EM
MC immunity
E
10 RSA306B Specifications and Performance Verification
1010-1, CAN/CSA-22.2 No.61010-1, EN61010-1, IEC61010-1
UL6
Europe: EN61326
stralia/New Zealand: AS/NZS 2064
Au
EN61000-3-2, EN61000-3-3, EN61326-2-1
N61326–1/2, IEC61000-4-2/3/4/5/6/8/11
E
Page 21

Environmental performance
Tem peratu re
Operating –10 °C to +55 °C (+14 °F to +131 °F)
Nonoperatin
Humidity, op
Altitude
Operating 9144 meters (30,000 feet)
Nonopera
Dynamic
Random vibration:
nonoper
Mechanical shock: operating
ng and transit
Handli
Bench handling, operating
Trans
g
erating
ting
s
ating
it drop, nonoperating
Specifications
–51 °C to +71 °C (–60 °F to +160 °F)
5% to 95 ±5% RH (relative humidity) in the temperature range of +10 °C to 30 °C
(+50°Fto86°F)
5% to 75% ±5%
5% to 45% RH above +40 °C to +55 °C (+86 °F to +131 °F)
<10 °C humidity is uncontrolled; non-condensing
15,240 meters (50,000 feet)
2
0.030 g
Half-s
in each direction of each axis (18 total)
Per MI
on appropriate sides of the equipment
Per MIL-PRF-28800F Class 2 nonoperating: Transit drops onto six faces and four
corners of the equipment, from a height of 30 cm (11.8 in.) for a total of 10 impacts
/Hz, 10 Hz – 500 Hz, 30 minutes per axis, three axes (90 minutes total)
ine mechanical shocks, 30 g peak amplitude, 11 ms duration, three d rops
L-PRF-28800F Class 2 operating: Rotational-edge-drops of appropriate edges
RH from +30 °C to +40 °C (+86 °F to 104 °F)
RSA306B Specifications and Performance Verification 11
Page 22

Performance ver
ification
Performance v
NOTE. The performance verification procedure is not a calibration procedure. The performance verification procedure
only verifies that your instrument meets key specifications. For your instrument to be calibrated, it must be returned to
a Tektronix se
Prerequisi
Thetestsinthissectionmakeupaconfirmation of performance and functionality when the following requirements are met:
The SignalVu-PC application must be version 3.11.0x or greater.
Operate the instrument in an environment that meets the temperature, altitude, and humidity characteristics listed in
the specifications.
The instrument must be completely assembled and covers installed per factory specification.
The instrument must have been operating for a warm-up period of at least for 30 minutes (after being connected to the
PC, starting the SignalVu-PC application, and SignalVu-PC is connected to the RSA306B instrument and continuously
acquiring data).
NOTE. The RSA306B does not fully power on until SignalVu-PC has established communication with the RSA306B
and is acquiring data.
rvice facility.
tes
erification
The instrument must have had its last alignment routine done after at least a 30 minute warm–up period at an ambient
temperature not more than ±2 °C different than the current ambient temperature.
12 RSA306B Specifications and Performance Verification
Page 23

Required equipment
These procedures use external, traceable signal sources to directly check warranted characteristics. The following table lists
the equipment required for this procedure.
Table 2: RSA306B required test equipment
Item Description Qty Model Number Purpose
Performance ver
ification
Desktop or Laptop PC Intel Core i7-4-core with Intel
HD4000 (clock speed 3.6 GHz
or in this proximity),
8.00 GB RAM,
WIN7 64 Bit OS,
Solid State Drive
(SSD) 128 GB with >
300 MBytes/sec sustained
write speed,
USB 3.0
Locking USB3 cable
Signal generator DC – 8 GHz
Signal generator DC – 6 GHz
Power meter
Power sensor
1 meter length, A to Micro
B, with thumbscrews (can be
locked in plac e for units with
mating faceplate)
9 kHz – 18 G Hz (power head
dependent)
9kHz–18GHz
1
1
1
1
1 Keysight E4418B
1 Keysight power head
Dell Optiplex 9020 MT, or
equivalent
L-Com CAVISU3AMICB-1M
174-6796-00 (Tekronix P /N)
Stanford Research Systems
SG386 option 02
Tektronix TSG4106A Second signal generator
E9304A H18
Run SignalVu-PC
Required for the RSA306B
communication and power
Test full frequency range
require to perform
third-order distortion test
Verifies RSA306B input
signal amplitude
Measures RSA306B input
signal amplitude
Power splitter
Power combiner
Attenuator
Termination
Adapter N(male) to
N(male)
Adapter N(male) to
SMA(female)
RSA306B Specifications and Performance Verification 13
DC–18GHz,N
2 –18 GHz, SMA
3 dB, SMA, >8 GHz bandwidth
DC -18 GHz, N-m
DC -18 GHz coaxial adapter
DC -18 GHz adapter
1 Keysight 11667A Amplitude adjustments
and input amplitude setting
in spurious tests
1
2
1 Maury Microwave 2510B6 For DANL tests
1 Pasternack PE91034 or
2-6
(as
needed)
M/A-COM
2089-6208-00
Mini-Circuits Labs
FW-3+
Maury Microwave 8828B
Needed for SG386
generator
Third-order distortion
measurement
For third-order distortion
measurement
Amplitude adjustments
May be needed for signal
generator and filter RF
connections
Page 24

Performance ver
Table 2: RSA306B required test equipment (cont.)
Item Description Qty Model Number Purpose
ification
Band pass filter 2150 MHz, SMA
Low pass filter 5000 MHz cutoff, L250 filter
Tunable filter
Alternative to tunable
filter
Cable, SMA-to-N ST18/SMAm/Nm/36in
Cable, SMA ST18/SMAm/SMAm/36in
Cable, SMA ST18/SMAm/SMAm/8
Cable, BNC-to-SMA BNC(m) to SMA(m) cable -
Torque wrench 12 in-lb - Type N 1
Torque wrench 8 in-lb Torque wrench - 3.5 mm 1
1500 MHz to 3000 MHz, N
connectors
300 MHz lowpass cutoff, L250
filter
1 meter
2
1
1
1
1
2
2
1 Pasternack PE3615-36
Mini-Circuits Labs
ZX75BP-2150+
K&L 5L250-5000/E 15000 –
O/OP
K&L 5BT-1500/3000-5-N/N Spurious test
K&L 5L250-3300/E 10000 O/OP
Huber-Suhner 84004594 Generator output to RF
Huber-Suhner 84002061 TOI and tests requiring
Huber-Suhner 84028563 TOI tests
Maury Microwave 2698C2
Huber-Suhner 74Z-0-0-21 SMA-connector
For third-order distortion
measurement
Spurious test
input
low-pass filters
Generator timebase output
to Ref IN.
(External-timebase to
generator-timebase input
may need a similar cable)
N- connector attachments
attachments
NOTE. Make sure that any adaptor and cable you use is specified to operate at the frequency range of the test you
are performing. Connector frequency ranges:
BNC: DC to 1 GHz typical, up to 3 GHz for certain BNC cable/connectors.
N:DCto18GHztypical
SMA: DC to 18 GHz typical, up to 26.5 GHz for certain SMA cable/connectors.
Preliminary checks
Do these steps before starting the performance verification procedures.
Warm up the instrument
1. Connect the RSA306B USB cable to the host PC. The LED on the RSA306B should initially glow red then turn green
after a few moments.
2. Make sure the SignalVu-PC application is connected to the RSA306B over USB.
14 RSA306B Specifications and Performance Verification
Page 25

3. View hardware status bar in the lower left corner of the SignalVu display. Verify that there are no errors or messages
indicating los
4. Start the application acquiring data and allow the instrument to warm up for at least 30 minutes.
s of o r invalid calibration data. At startup, the application may show the message, “Not Aligned:” this is OK.
Run the alignment process
Align the instrument after the 30 minute warm-up period and before proceeding with the Warranted Characteristics tests:
1. Select Alignments in the Tools menu to open the Alignments dialog box.
2. Select Align Now. The alignment process takes a few seconds.
3. Verify that no alignment failures are reported in the status bar.
Performance verification procedures
Internal reference frequency accuracy
Performance ver
ification
1. Connect a signal generator to the N-connector RF input of the RSA306B.
NOTE. The signal generator accuracy must be better than ±0.05 ppm. If the signal generator accuracy does not meet this
requirement, it must have its frequency reference phase locked to a precision frequency reference.
NOTE. The Stanford Research Systems SG386 signal generator has adequate frequency stability without use of an external
timebase, but only if it has been calibrated/verified within 1 year. If this is not the case, the signal generator must have an
accurate external timebase connected to its timebase input (rear panel, BNC, 10 MHz).
2. Set the signal generator to output a 0 dBm, 1 GHz CW frequency.
3. Reset the RSA 306B to factory defaults: (Presets > Main) (The center frequency will be set to 1 GHz via Preset.)
4. Set the frequency span to 10 kHz.
5. Connect the signal generator output to the RF Input, N-connector input of the RSA306B.
6. Enter the measured marker frequency in the calculations table. (See Table 3.)
7. Calculate the specification based on aging rate. (See Table 4.)
8. Compare the measured value with the specification for Internal Frequency accuracy. Enter the results in the test record.
RSA306B Specifications and Performance Verification 15
Page 26

Performance ver
Table 3: Internal reference frequency instability calculations
Marker frequency Value
Instability measured
[(Marker freq
Instability due to aging
(See Table 4.)
ification
uency – 1x10
9
)/1000] ppm
Instability due to other drift
(18°Cto28°C)
Total specified Instability
(aging plus other drift)
Table 4: In
Time period
0 to 3 months ±1 ppm ±0.5 ppm
3 to 6 months ±2 ppm ±0.8 ppm
6 to 12 months ±3 ppm ±1 ppm
1 year to 2 years ±4 ppm ±2 ppm
stability due to aging
Aging aft
calibration
(same date of
manufacture)
er initial
±3 ppm
Aging after
calibrat
(Calibrated more
than 1 year after
manufacture)
ion
16 RSA306B Specifications and Performance Verification
Page 27

Performance ver
ification
External reference input, functional test
This check is a functional check. It is an important check for customer use, but does not check warranted specification limits.
1. Connect a signal generator RF output to the N-connector Ref input of the RSA306B, as shown. The signal generator
accuracy must be better than ±0.05 ppm. If it does not, it must have its frequency reference phase locked to a precision
frequency reference.
Note: The Stanford Research Systems SG386 signal generator has adequate frequency stability w ithout use of an
external timebase, but only if it has been calibrated/verified within 1 year. If this is not the case, the signal generator must
have an accurate external timebase c onnected to its timebase input (10 MHz).
2. Set the signal generator controls:
a. Frequency = 10 MHz
b. Amplitude =0dBm
3. Set the RSA306B to use the external reference (Setup > Acquire > Frequency Reference).
4. Under the source field, select the External (10 MHz) radio button.
5. Check that the Status Bar shows Ref: Ext. This generally occurs within 5 seconds.
6. Enter pass/fail result in the test record.
RSA306B Specifications and Performance Verification 17
Page 28

Performance ver
Amplitude accuracy at all center frequencies
Amplitude accuracy is tested for four different reference levels which exercises the different RF gain conditions used in
the RSA306B.
1. Connect the signal generator, power splitter, power sensor, power meter, and RSA306B as shown. Connect the power
sensor and RF signal generator directly to the power splitter, which is connected directly to the RSA306B.
ification
2. Reset the RSA306B to factory defaults (Presets > Main).
3. Run the RSA306B alignment procedure (Tools > Alignments > Align Now).
4. Set the RSA306B as follows:
a. Reference Level = +20 dBm
b. Detection = +PEAK (Setup > Settings > Traces > Detection > +PEAK)
c. Filter shape = Flat-Top (Setup > Settings > BW > Filter Shape > Flat-top)
d. Center Frequency: as listed in the amplitude accuracy tabl
Table 8 . )
e. Span:
For CF < 1 MHz, Span = 100 kHz
For 1 MHz CF 30 MHz, Span = 1 MHz
For CF 30 MHz, Span = 10 MHz
d. RBW:
ForCF<1MHz,RBW=1kHz
For 1 MHz CF 30 MHz, RBW = 10 kHz
For CF > 30 MHz, RBW = 100 kHz
es. (See Table 5.) (See Table 6.) (See Table 7.) (See
5. Set the signal generator output amplitude to +12 dBm. The RF amplitude at the power sensor and RSA306B i
= +6 dBm nominal.
6. Set the signal generator frequency to the first frequency in the +20 dBm reference level accuracy table. (See Table 5.)
7. Set the RSA306B center frequency to the same frequency. (See Table 5.)
18 RSA306B Specifications and Performance Verification
nput
Page 29

Performance ver
8. On the RSA306B, peak the marker on the signal at the center frequency; measure and record the amplitude.
9. Measure and record the power meter amplitude.
10. Repeat steps 6 through 8 for all of the +20 dBm reference level frequencies in the table, measuring power meter
amplitude and RS A306B amplitude.
11. Set the signal generator output amplitude to +1 dBm for the 0 dBm reference level tests. RF amplitude at the power
sensor and the RSA306B = –5 dBm nominal.
12. Repeat steps 6 through 8 for all of the +0 dBm reference level frequencies in the table, measuring power meter amplitude
and RSA306B amplitude. Enter the values in the 0 dB m accuracy table. (See Table 6.)
ification
13. Set the signal generator output amplitud
power sensor and the RSA306B = –18 dBm nominal.
14. Repeat steps 6 through 8 for all of the –13 dB m reference level frequencies in the table, measuring power meter
amplitude and RSA306B amplitude. Enter the values in the –13 dBm accuracy table. (See Table 7.)
15. Set the signal generator output amplitude to –29 dBm for the –30 dBm reference level tests. RF amplitude at the
power sensor and the RSA306B = –35 dBm nominal.
16. Repeat steps 6 through 8 for all of the –30 dB m reference level frequencies in the table, measuring power meter
amplitude and RSA306B amplitude. Enter the values in the –30 dBm accuracy table. (See Table 8.)
17. Calculate the amplitude errors for each frequency of each reference level accuracy table. Error = RSA306B measurement
– power meter measurement. Readings are in dBm, error is in dB.
18. Note the largest positive and negative errors in the Error column
19. Enter these values in the Amplitude accuracy results table. (See Table 9.)
20. Compare the +peak and –peak errors against the specifications.
21. Enter pass or fail in the test record.
eto–12 dBm for the –13 dBm reference level tests. RF amplitude at the
in all the reference level measurement tables.
Table 5: Amp litude accuracy, +20 dBm reference level measurements
Center/signal
frequency
9kHz
RSA306B reading,
dBm
Power meter value,
dBm
Error (RSA306B –
Pwr meter), dB
20 kHz
50 kHz
100 kHz
300 kHz
1MHz
3MHz
10 MHz
20 MHz
22 MHz
100 MHz
699 MHz
RSA306B Specifications and Performance Verification 19
Page 30

Performance ver
Table 5: Amplitude accuracy, +20 dBm reference level measurements (cont.)
ification
Center/signal
frequency
701 MHz
1GHz
1.849 GHz
1.851 GHz
2.339 GHz
2.341 GHz
2.419 GHz
2.421 GHz
2.699 GHz
2.701 GHz
3.000 GHz
3.699 GHz
3.701 GHz
4.569 GHz
4.571 GHz
4.629 GHz
RSA306B reading,
dBm
Power meter value,
dBm
Error (RSA306B –
Pwr meter), dB
4.631 GHz
4.749 GHz
4.751 GHz
4.959 GHz
4.961 GHz
5.699 GHz
5.701 GHz
5.804 GHz
5.806 GHz
6.200 GHz
Table 6: Amplitude accuracy, 0 dBm reference level measurements
Center/signal
frequency
9kHz
20 kHz
50 kHz
RSA306B reading,
dBm
Power meter value,
dBm
Error (RSA306B –
Pwr meter), dB
20 RSA306B Specifications and Performance Verification
Page 31

Table 6: Amplitude accuracy, 0 dBm reference level measurements (cont.)
Performance ver
ification
Center/signal
frequency
100 kHz
300 kHz
1MHz
3MHz
10 MHz
20 MHz
22 MHz
100 MHz
699 MHz
701 MHz
1GHz
1.849 GHz
1.851 GHz
2.339 GHz
2.341 GHz
2.419 GHz
RSA306B reading,
dBm
Power meter value,
dBm
Error (RSA306B –
Pwr meter), dB
2.421 GHz
2.699 GHz
2.701 GHz
3.000 GHz
3.699 GHz
3.701 GHz
4.569 GHz
4.571 GHz
4.629 GHz
4.631 GHz
4.749 GHz
4.751 GHz
4.959 GHz
4.961 GHz
5.699 GHz
5.701 GHz
RSA306B Specifications and Performance Verification 21
Page 32

Performance ver
Table 6: Amplitude accuracy, 0 d Bm reference level measurements (cont.)
ification
Center/signal
frequency
5.804 GHz
5.806 GHz
6.200 GHz
RSA306B reading,
dBm
Power meter value,
dBm
Error (RSA306B –
Pwr meter), dB
Table 7: Amplitude accuracy, –13 dBm reference level measurements
Center/signal
frequency
9kHz
20 kHz
50 kHz
100 kHz
300 kHz
1MHz
3MHz
10 MHz
20 MHz
RSA306B reading,
dBm
Power meter value,
dBm
Error (RSA306B –
Pwr meter), dB
22 MHz
100 MHz
699 MHz
701 MHz
1GHz
1.849 GHz
1.851 GHz
2.339 GHz
2.341 GHz
2.419 GHz
2.421 GHz
2.699 GHz
2.701 GHz
3.000 GHz
3.699 GHz
3.701 GHz
4.569 GHz
22 RSA306B Specifications and Performance Verification
Page 33

Table 7: Amplitude accuracy, –13 dBm reference level measurements (cont.)
Performance ver
ification
Center/signal
frequency
4.571 GHz
4.629 GHz
4.631 GHz
4.749 GHz
4.751 GHz
4.959 GHz
4.961 GHz
5.699 GHz
5.701 GHz
5.804 GHz
5.806 GHz
6.200 GHz
RSA306B reading,
dBm
Power meter value,
dBm
Error (RSA306B –
Pwr meter), dB
Table 8: Amplitude accuracy, –30 dBm reference level measurements
Center/signal
frequency
RSA306B reading,
dBm
Power meter value,
dBm
Error (RSA306B –
Pwr meter), dB
9kHz
20 kHz
50 kHz
100 kHz
300 kHz
1MHz
3MHz
10 MHz
20 MHz
22 MHz
100 MHz
699 MHz
701 MHz
1GHz
1.849 GHz
1.851 GHz
2.339 GHz
RSA306B Specifications and Performance Verification 23
Page 34

Performance ver
Table 8: Amplitude accuracy, –30 dBm reference level measurements (cont.)
ification
Center/signal
frequency
2.341 GHz
2.419 GHz
2.421 GHz
2.699 GHz
2.701 GHz
3.000 GHz
3.699 GHz
3.701 GHz
4.569 GHz
4.571 GHz
4.629 GHz
4.631 GHz
4.749 GHz
4.751 GHz
4.959 GHz
4.961 GHz
RSA306B reading,
dBm
Power meter value,
dBm
Error (RSA306B –
Pwr meter), dB
5.699 GHz
5.701 GHz
5.804 GHz
5.806 GHz
6.200 GHz
Table 9: Amplitude accuracy results
Frequency
Reference level
range
9kHzto
2.701 GHz
3GHzto6.2GHz
9kHzto
2.701 GHz
3GHzto6.2GHz
9kHzto
2.701 GHz
3GHzto6.2GHz
Maximum
+error
Maximum
–error Specification
±1.2 dB+20 dBm
±1.65 dB
±1.2 dB0 dBm
±1.65 dB
±1.2 dB-13 dBm
±1.65 dB
24 RSA306B Specifications and Performance Verification
Page 35

Table 9: Amplitude accuracy results (cont.)
Performance ver
ification
Reference level
Frequency
range
9kHzto
2.701 GHz
3GHzto6.2GHz
Maximum
+error
Maximum
–error Specification
±1.2 dB-30 dBm
±1.65 dB
RSA306B Specifications and Performance Verification 25
Page 36

Performance ver
Channel amplitude flatness
The amplitude flatness test verifies amplitude at the two normalized bands and the band most likely to encounter a channel
response problem. The channel flatness is measured for 2 MHz – 42 MHz, 1260 MHz – 1300 MHz, and 2140 MHz
– 2180 MHz.
1. Connect the signal generator, power splitter, power sensor, power meter, and RSA306B as shown in the following figure.
Connect the power splitter outputs directly to the RSA306B RF Input and to the power sensor.
ification
2. Reset the RSA306B to factory defaults (Presets > Main).
3. Run the RSA306B alignment procedure (Tools > Alignments > Align Now).
4. Set the RSA306B as follows:
a. Reference Level = 0dBm.
b. Detection = +PEAK (Setup > Settings > Traces > Detection > +PEAK).
c. Filter shape = Flat-Top (Setup > Settings > BW > Filter Shape > Flat-top).
d. Center Frequency = 22 MHz
e. Span = 40 MHz
f. RBW = Auto (300 kHz)
g. Function = Normal (Setup > Settings > Traces > Function)
5. Set the signal generator frequency to the first frequency in the 2 M Hz – 42 MHz channel flatness table. (See Table 10.)
6. Set the signal generator amplitude for –5 dBm at the power meter and RSA306B.
7. Record the power meter reading in the 2 MHz – 42 MHz channel flatness table. (See Table 10.)
8. On the RSA306B, position the marker on the peak amplitude of the signal; record the amplitude in the channel flatness
table.
9. Repeat steps 5 through 8 to measure and record for all the frequencies in the channel flatness table, 2 MHz through
42 MHz. Do not change the RSA306B center frequency setting.
10. Set the RSA center frequency to 1280 MHz.. Keep other settings the same.
11. Set the signal generator frequency to 1260 MHz.
26 RSA306B Specifications and Performance Verification
Page 37

Performance ver
12. S e t the signal generator amplitude for –5 dBm at the power meter and RSA306B.
13. Repeat steps 5 through 8 to measure and record for all the frequencies in the channel flatness table, 1260 MHz through
1300 MHz. (See
Table 11.) Do not change the RSA306B center frequency setting.
ification
14. Change the RSA
15. Set the signal
16. S et the signa
17. Repeat steps
2180 MHz. (See Table 12.) Do not change the RSA306B center frequency setting. An alternate IF setting is used in
this range. This verifies the alternate setting.
18. Use the recorded values to calculate the amplitude differences for each measured frequency in the three channel
flatness tab
Differenc
The measur
19. Calculate
22 MHz for
1280 MHz f
2160 MHz f
The flatn
Error = (
difference amplitude, each frequency – difference amplitude, center screen frequency)
306B center frequency to 2160 MHz. Keep other settings the same.
generator frequency to 2140 MHz.
l generator amplitude for –5 dBm at the power meter and RSA306B.
5 through 8 to measure and record for all the frequencies in the channel flatness table, 2140 MHz through
les.
e amplitude = (power meter amplitude – RSA306B marker amplitude)
ed amplitudes are dBm. The difference amplitude is dB.
the channel flatness error relative the center screen amplitude. Center screen value:
the 2 – 42 MHz channel
or the 1260 – 1300 MHz channel
or the 2140 – 2180 MHz channel
ess error at each frequency is:
NOTE. All amplitudes are in dB.
At center screen, Error = 0 dB.
Example calculation for 2 MHz frequency, 22 MHz center screen:
22 MHz Center screen difference amplitude = +0.13 dB
2 MHz Frequency difference amplitude = –0.32 dB
Error = (–0.32 dB – (0.13 dB)) = –0.45 dB
RSA306B Specifications and Performance Verification 27
Page 38

Performance ver
Table 10: 22 MHz channel flatness, 2 MHz – 42 MHz
ification
Signal
generator
frequency
2MHz
4MHz
6MHz
8MHz
10 MHz
12 MHz
14 MHz
16 MHz
18 MHz
20 MHz
22 MHz
24 MHz
26 MHz
28 MHz
30 MHz
Power meter
amplitude, dB
RSA306B marker amplitude,dBDifference
amplitude, dB
Channel
flatness error,
m
dB
32 MHz
34 MHz
36 MHz
38 MHz
40 MHz
z
42 MH
Maximum difference amplitude
Minimum difference amplitude
<+1.2dB
.2 dB
>–1
28 RSA306B Specifications and Performance Verification
Page 39

Table 11: 1280 MHz channel flatness, 1260 MHz – 1300 MHz
Performance ver
ification
Signal
generator
frequency
1260 MHz
1262 MHz
1264 MHz
1266 MHz
1268 MHz
1270 MHz
1272 MHz
1274 MHz
1276 MHz
1278 MHz
1280 MHz
1282 MHz
1284 MHz
1286 MHz
1288 MH
RSA306B marPower meter
amplitude, dB
z
ker amplitude,dBDifference
amplitude, dB
Channel
flatness error,
m
dB
1290 MHz
1292 MHz
Hz
1294 M
1296 MHz
1298 MHz
MHz
1300
Maximum difference amplitude
Minimum difference amplitude
<+1dB
dB
>–1
RSA306B Specifications and Performance Verification 29
Page 40

Performance ver
Table 12: 2160 MHz Channel flatness, 2140 MHz – 2180 MHz
ification
Signal
generator
frequency
2140 MHz
2142 MHz
2144 MHz
2146 MHz
2148 MHz
2150 MHz
2152 MHz
2154 MHz
2156 MHz
2158 MHz
2160 MHz
2162 MHz
2164 MHz
2166 MHz
2168 MH
RSA306B marPower meter
amplitude, dB
z
ker amplitude,dBDifference
amplitude, dB
Channel
flatness error,
m
dB
2170 MHz
2172 MHz
Hz
2174 M
2176 MHz
2178 MHz
MHz
2180
Maximum difference amplitude
Minimum difference amplitude
<+1dB
dB
>–1
30 RSA306B Specifications and Performance Verification
Page 41

Performance ver
DANL (Displayed Average Noise Level)
The intent of the DANL test is to measure the average internal noise level of the instrument. The DANL specification does
not cover residual spurs. If the specific measurement frequency results in measuring a residual spur that is visible above
the noise level, the DANL specification applies not to the spur but to the noise level on either side of the spur. Please
refer to the Spurious Response specifications.
ification
1. Connect a 5
2. Reset the R
3. Run the RS
4. Set the RS
a. Referenc
The refe
spurious signals since it is easier to determine the presence of spurious.
b. Set Detection = Avg (Vrms) (Setup > Settings > Traces > Detection > Avg).
c. Set Function = Avg (of logs) (Setup > Settings > Traces > Function)
d. Averaging = 100 (Setup > Settings > Traces > Function: select 100 in field)
e. Filter shape = Flat-Top (Setup > Settings > BW > Filter Shape > Flat-top).
f. Center Frequency = 22 MHz
g. Span = 100 kHz
h. RBW = Auto (100 Hz)
5. Set the marker for POWER measurement:
a. Marker function = Pow er (dBm/Hz) (Markers > Define Markers > Readouts (near bottom of screen) > Power)
0 N termination to the RSA306B RF Input.
SA306B to factory defaults (Presets > Main).
A306B alignment procedure (Tools > Alignments > Align Now).
A306B as follows:
e Level = –50 dBm to –90 dBm.
rence level can be set lower than -50 dBm to display the noise on screen. This helps avoid measuring on
b. Turn on marker (Markers > Define Markers > Add)
6. Set the RSA306B to each of the center frequencies listed in the DANL frequencies of interest table. (See Table 13 on
page 32.) After averaging is completed, move the marker near the center screen to the baseline noise on either side of
center screen spurious. Make sure the marker is not on a coherent spurious signal. Enter the marker noise level
the
amplitude in the DANL frequencies of interest table and the test record and compare with the specification.
RSA306B Specifications and Performance Verification 31
Page 42

Performance ver
Table 13: DANL frequencies of interest
ification
RSA306B center
frequency
100 kHz
1MHz
10 MHz
20 MHz
22 MHz
100 MHz
500 MHz
1GHz –160 dB
1.5 GHz –157 dBm/Hz
2.0 GHz –157 dBm/Hz
z
2.5 GH
3.0 GHz –154 dBm/Hz
3.5 GHz –152 dBm/Hz
GHz
4.0
4.5 GHz –149 dBm/Hz
5.0 GHz –149 dBm/Hz
Marker noise
level Specification
–130 dBm/Hz
–130 dBm/Hz
–130 dBm/Hz
–130 dBm/Hz
–161 dBm/
–161 dBm/Hz
–161 dBm/Hz
m/Hz
dBm/Hz
–154
52 dBm/Hz
–1
Hz
.5 GHz
5
6.0 GHz –149 dBm/Hz
6.2 GHz –149 dBm/Hz
–149 dBm/Hz
32 RSA306B Specifications and Performance Verification
Page 43

Performance ver
ification
Phase noise
The intent of the Phase Noise test is to measure the phase noise level of the instrument. The phase noise specification does
not cover residual spurs. If the specific measurement frequency results in measuring a residual spur that is visible above the
noise level, the phase noise specification applies not to the spur but to the noise level on either side of the spur. Please
refer to the Spurious Response specifications. Also, refer to the Spurious Response section of this procedure to determine
whether or not a residual spur is within the specification.
Connect the signal generator and RSA306B as shown in the following figure.
1. Reset the RSA306B to factory defaults (Presets > Main).
2. Run the RSA306B alignment procedure (Tools > Alignments > Align Now). Note: the Center frequency should be
1GHz.
3. Set the signal generator CW frequency = 1GHz.
4. Set the signal generator CW amplitude = 0dBmat the RS306 input.
5. Select External Reference (Setup > Acquire > Frequency Reference > External)
6. Set trace detection = +PEAK (Setup > Settings > Traces > Detection)
7. Measure the CW amplitude for the following settings:
a. Trace Function = Avg (Vrms), 10 averages (Setup > Settings > Traces > Function: Avg (Vrms
b. Span = 100 kHz
c. RBW = 1kHz
d. Move MR marker to highest amplitude signal after 10 averages, write the marker value as the CW amplitude (for the
1kHzfilter) in the measurement table. (See Table 14.)
8. Measure the CW amplitude for the following settings:
a. Span = 10 kHz
b. RBW = 100 Hz
c. Move MR marker to highest amplitude signal after 10 averages, write marker value as the CW amplitude for the
100 Hz filter and 10 Hz filter in the measurement table. (See Table 14.)
), count = 10)
9. Set Trace detection = Avg (Vrms).
10. Set Marker function = Power (dBm/Hz) (Markers > De fi ne Markers > Readouts (near bottom of window) > Power).
11. Turn on marker (Markers > Define Markers > Add)
RSA306B Specifications and Performance Verification 33
Page 44

Performance ver
12. Measure noise for 1 MHz offset:
a. CF = 1000.95 MHz
b. Span = 1MHz
c. RBW = 1kHz
d. Avg count = 100
e. Marker frequency = 1000.997 MHz (note, this avoids the 1 MHz offset spur)
f. After averaging is completed, enter the raw noise amplit ude in dBm/Hz in the measurement table. (See Table 14.)
g. Calculate and record Phase noise, the difference of CW amplitude in 1 kHz filter and noise measured with the
ification
POWER marke
r. (See Table 14.)
13. Measure noi
a. CF = 1000.0
b. Span = 100 k
c. RBW = 1kHz
d. Avg count
e. Marker fr
f. After ave
and test record.
g. Calculate and record Phase noise, the difference of CW amplitude in 1 kHz filter and noise measured with the
POWER marker. (See Table 14.)
14. Measure noise f or 10 kHz offset:
a. CF = 1000.0095 MHz
b. Span = 10 kHz
c. RBW = 100 Hz
d. Avg count =100
e. Marker frequency = 1000.010 MHz
se for 100 kHz offset:
95 MHz
Hz
= 100
equency = 1000.100 MHz
raging is completed, enter the raw noise amplitude in dBm/Hz in the measurement table (See Table 14.)
f. After averaging is completed, enter the raw noise amplit ude in dBm/Hz in the measurement table. (See Table 14.)
g. Calculate and record Phase noise, the difference of CW amplitude in 100 Hz filter and noise measured with the
R marker.(See Table 14.)
POWE
34 RSA306B Specifications and Performance Verification
Page 45

Performance ver
15. Measure noise for 1 kHz offset:
a. CF = 1000.000950 Hz
b. Span = 1kHz
c. RBW =10 Hz
d. Avg count = 20 (note: If 20 averages does not result in a stable amplitude, more averages can be used.)
e. Marker frequency = 1000.001 MHz
f. After averaging is completed, enter the raw noise amplitude in dBm/Hz in the measurement table. (See Table 14
on page 35.)
ification
g. Calculate a
power marker. (See Table 14.)
16. Record the results in the Test record.
Table 14: P
Phase noise offset
frequenc
1kHz 10Hz
10 kHz 100 Hz
100 kHz 1 kHz
1MHz 1kHz
y
nd record Phase noise, the difference of CW amplitude in 100 Hz filter and noise measured with the
hase noise at 1 GHz center frequency
RBW
CW amplitude,
dBm
Raw noise,
dBm/Hz
Phase noise
(raw noise – CW
amplitud
e), dBc/Hz
Specifica
< –84 dBc/Hz
< –84 dBc/Hz
< –88 dBc
< –118 dBc/Hz
tion
/Hz
RSA306B Specifications and Performance Verification 35
Page 46

Performance ver
Third-order intermodulation distortion
Set up the RF signal generators, band-pass filters, signal combiner, and RSA306B as shown.
ification
1. Reset the RSA306B to factory defaults (Presets > Main).
2. Run the RSA306B alignment procedure (Tools > Alignments > Align Now).
3. Set the RSA306B as follows:
a. Reference Level = –15 dBm
b. Span = 100 kHz
c. RBW = 1kHz
d. Detection mode = +PEAK (Setup > Settings > Traces > Detection > +PEAK)
e. Function = Avg (Vrms) (Setup > Settings > Traces > Function)
f. Averaging = 10 (Setup > S ettings > Traces > Function: set count = 10)
g. Select External Reference (Setup > Acquire > F requency Reference > External)
4. Set one RF signal generator frequency to 2.1295 GHz. Set the second RF signal generator frequency to 2.1305 G Hz .
5. Set each of the RF signal generators to provide a power level of –20 dBm each at the RSA306B. The initial generator
amplitude setting is should be -13 dBm, and the amplitude is fine-tuned as follows:
a. Set the RSA306B center frequency to 2.1295 GHz. Move the marker to the largest amplitude. Adjust the first
generator output level for a marker reading of –20.0 dBm (±0.1 dB) (after averaging).
b. Set the RSA306B center frequency to 2.1305 GHz. Move the marker to the largest amplitude. Adjust the second
generator output level for a marker reading of –
20.0 dBm (± 0.1 dB) (after averaging).
6. Set the RSA306B center frequency to 2.1285 GHz. After averaging has completed, position the marker on the highest
amplitude trace point and read the marker amplitude. Record the IMD #1 amplitude. (See Table 15 on page 37.)
7. Set the RSA306B center frequency to 2.1315 GHz. After averaging has completed, position the marker on the largest
trace point and read the marker amplitude. Record the IMD #2 amplitude.
36 RSA306B Specifications and Performance Verification
Page 47

8. Calculate and record IMD (dBc):
(maximum of IMD #1 or IMD #2) +20 dBm = IMD (dBc)
9. Record the result in the Test record.
Table 15: Third order intermodulation distortion measurements
Performance ver
ification
Item Measurement Specificatio
Carrier #1 amplitude
Carrier #2 amplitude
IMD #1 ampl
IMD #2 amplitude
IMD
(Max IMD – (–20 dBm))
itude
–20 dBm
–20 dBm
< –83 dBm typ.
< –83 dBm typ.
< –63 dBc
n
RSA306B Specifications and Performance Verification 37
Page 48

Performance ver
Input-related spurious response: ADC
Requirements:
An RF signal generator capable of at least 8 GHz (example: Stanford Research Systems SG386 Option 02)
ification
1. Connect the signal generator, power splitter, power sensor, power meter, and RSA306B as shown. Connect the power
sensor and RF signal generator directly to the power splitter, which is connected directly to the
2. Reset the RSA306B to factory defaults (Presets > Main).
3. Run the RSA306B alignment procedure (Tools > Alignments > Align Now).
4. Set the RSA306B as follows:
a. Reference Level = –30 dBm
b. Span = 40 MHz
c. RBW = 1kHz
d. Detection mode = +PEAK (Setup > Settings > Traces > Detection > +PEAK)
e. Function = Avg (Vrms) (Setup > Settings > Traces > Function)
f. Averaging = 10 (Setup > S ettings > Traces > Function: set count = 10)
g. Select External Reference (Setup > Acquire > F requency Reference > External)
RSA306B.
LF ADC image.
5. Set the signal generator frequency to 21 MHz.
6. Set the signal generator output level for –30 dBm on the power meter. This amplitude is also at the RSA306B input (the
signal generator setting will be near –24 dBm).
7. Set the RSA306B center frequency to 21 MHz (40 MHz span).
8. Position the marker on the signal at 21 MHz.
9. Record the value in the ADC measurements table. (See Table 16 on page 40.) The amplitude will be near –30 dBm, but
may have some measurement error.
38 RSA306B Specifications and Performance Verification
Page 49

10. S et the signal generator frequency to 72 MHz.
Performance ver
ification
NOTE. Do not ch
11. Set the signal generator amplitude for –30 dBm on the power meter. This amplitude is also at the RSA306B input. Note:
In this case, the signal generator setting will be near –24 dBm.
12. S et the RSA306B marker on the image spur at 40 MHz, right edge of the span. Note its amplitude in the table.
13. Calculate and record the image amplitude in dBc:
Image (dBc) = Image amplitude at 40 MHz – CW amplitude at 21 MHz
RF ADC imag
14. Set the signal generator frequency to 140 MHz.
15. S e t the signal generator amplitude for –30 dBm at the power meter. This amplitude is also at the RSA306B input. The
signal generator setting will be near -24 dBm.
16. S e t the RSA306B Center Frequency to 140 MHz.
17. P eak the marker on the CW signal at 140 MHz. Record the value in the ADC measurements table. (See Table 16
on page 40.)
18. Set the signal generator frequency to 103.8 MHz.
NOTE. Do not change the center frequency of the RSA306B.
ange the center frequency of the RSA306B.
e.
19. S e t the signal generator amplitude for –30 dBm on the power meter. This amplitude is also at the RSA306B input.
20. S et the RSA306B marker on the image spur seen at 120.2 MHz, at left edge of the s pan. Record the amplitude in the
ADC measurements table.
21. Set the signal generator frequency to 176.2 MHz.
NOTE. Do not change the center frequency of the RSA306B.
22. Set the signal generator amplitude to –30 dBm on the power meter. This amplitude is also at the RSA306B input.
23. S et the RS A306B marker on the image spur seen at 159.8 MHz, at right edge of the span. Record the amplitude in the
ADC measurements table. Mark which image amplitude is larger: 159.8 MHz, or 120.2 MHz.
24. Calculate and record the largest image amplitude in dBc:
Image (dBc) = Largest Image amplitude at (120.2 MHz or 159.8 MHz) - CW amplitude at 140 MHz
25. R ecord results in the Test record.
RSA306B Specifications and Performance Verification 39
Page 50

Performance ver
Table 16: ADC images (LF, RF) measurements
ADC images (LF, RF) Measurement Specification
ification
LF CW amplitud
LF Image amplitude 40 MHz CF
LF ADC Image, dBc
RF CW amplit
RF Image amplitude 159.8 MHz
RF Image amplitude 120.2 MHz
RF ADC Image, dBc
(largest RF image -140 MHz CW)
e21MHz
ude 140 MHz
< –50 dBc
< –50 dBc
40 RSA306B Specifications and Performance Verification
Page 51

Input-related spurious response: second converter images
Performance ver
ification
NOTE. You d o no
response tests in sequence.
1. Connect the signal generator, power splitter, power sensor, power meter, and RSA306B as shown. Connect the power
sensor and RF si
2. Reset the RSA306B to factory defaults (Presets > Main).
t need to do the first three steps (setup, reset, and alignment) when you perform the input-related spurious
gnal generator directly to the power splitter, which is connected directly to the RSA306B.
3. Run the RSA306B alignment procedure (Tools > Alignments > Align Now).
4. Set the RSA306B as follows:
a. Center frequency = 1GHz
b. Reference Level = –30 dBm
c. Span = 1MHz
d. RBW = 1kHz
e. Detection mode = +PEAK (Setup > Settings > Traces > Detection > +PEAK)
f. Function = Avg (Vrms) (Setup > Settings > Traces > Function)
g. Averaging = 10 (Setup > Settings > Traces > Function: count = 10)
h. Select External Reference (Setup > Acquire > Frequency Reference > External)
5. Set the signal generator frequency to 1.0 GHz.
6. Set the signal generator for –30 dBm at the power meter and RSA306B input. Monitor and set the signal generator
amplitude to -30 dBm at the power meter when changing frequency settings during this test.
7. Measure the CW amplitude at 1 GHz and note it in the second converter image measurements table. (See T
8. Set the signal generator frequency to 1280 MHz.
9. Set the signal generator for –30 dBm at the power meter and RSA306B input.
able 17.)
RSA306B Specifications and Performance Verification 41
Page 52

Performance ver
10. Measure the image spur amplitude at 1 GHz center frequency and note it in the second converter image measurements
table. (See Tab
ification
le 17.)
11. Calculate the
12. Set the signal
13. Set the RSA306
14. Measure the C
15. Set the signa
16. Measure the
table. (See Table 17.)
17. Calculate the difference between the image amplitude and the CW amplitude. This is the image spur magnitude in dBc.
18. Record results in the Test record.
Table 17: S
Images Measurement Specification
CW amplitude 1 GHz
Image am
(2440 IF)
Second
Image–1GHzCW
CW ampl
difference between the image amplitude and the CW amplitude. This is the image spur magnitude in dBc.
generator frequency to 2GHz.
B center frequency to 2GHz.
W amplitude at 2 GHz and note it in the second converter image measurements table. (See Table 17.)
l generator frequency to 2280 MHz .
image spur amplitude at 2 GHz center frequency and note it in the second converter image measurements
econd converter image measurements
plitude 1 GHz CF
Converter Image, dBc
itude 2 GHz
< –50 dBc
Image amplitude 2 GHz CF
IF)
(1190
RF Image, dBc
(Image – 2 GHz C W)
< –60 dBc
42 RSA306B Specifications and Performance Verification
Page 53

Input-related spurious response: first converter images
Performance ver
ification
NOTE. You d o no
response tests in sequence.
1. Connect the signal generator, power splitter, power sensor, power meter, and RSA306B as shown. Connect the power
sensor and RF signal generator directly to the power splitter, which is connected directly to the RSA306B.
2. Reset the RSA306B to factory defaults (Presets > Main).
t need to do the first three steps (setup, reset, and alignment) when you perform the input-related spurious
3. Run the RSA306B alignment procedure (Tools > Alignments > Align Now).
4. Set the RSA306B as follows:
a. Reference Level = –30 dBm
b. Span = 1MHz
c. RBW = 1kHz
d. Detection mode = +PEAK (Setup > Settings > Traces > Detection > +PEAK)
e. Function = Avg (Vrms) (Setup > Settings > Traces > Function)
f. Averaging = 10 (Setup > Settings > Traces > Function; count = 10)
g. Select External Reference (Setup > Acquire > Frequency Reference > External)
5. Set the signal generator output for –30 dBm at the power meter and RSA306B input.
6. Set the RS A306B to the Center frequency shown in the First converter images table. (See Table 18 on page 44.)
7. Set the signal generator frequency to the Image frequency value in the
NOTE. Monitor and set the signal generator amplitude to –30 dBm whenever you change frequency settings during this test.
8. Measure and record the Image Amplitude at the RSA306B CF.
table.
RSA306B Specifications and Performance Verification 43
Page 54

Performance ver
9. Calculate and record the Image Spur Amplitude in dBc (Image amplitude (dBm) + 30).
10. Repeat steps 6 through 9 for each center frequency listed in the table.
11. Record results in the Test record.
ification
NOTE. The inte
nt of the image spurious test is to measure spurious responses caused by the injection of an external
signal that would induce an image product on the display. These images can be the same frequencies as residual spurs.
In case of question, slightly change the frequency of the input signal to induce a corresponding change in the displayed
frequency of
Change the in
the image spur.
put frequency in steps that allow the product to stay within the on-screen frequenc y span. If the on-screen
spur does not move in response to the input signal change, it is not an image and is not covered in the image spurious
specification. Some care must be taken in noting the frequency change.
The images specified in the specification are 1:1 images and they will move either –1:1 or +1:1 with changes in input
signal fre
Never disc
quency.
ount the possibility that a spur in question could be coming from the test signal generator. Such spurious
responses can also move with changes in signal generator frequency. In case of question, validate the performance of the
generator with a different Signal Analyzer and/or filter the signal from the test generator to remove unwanted products.
If the spur seen on screen is a residual, it will still be present with the input to the signal analyzer terminated in 50 Ω.
Residual
spurs are subject to separate specification limits.
Table 18: First c onverter images: RSA306B and signal generator settings
ation, dBc
c
Center frequency
(RSA306B)
Image frequency
(signal generator)
22 MHz 4902 MH
Specific
Image Amplitude at
RSA306B CF, dBm
Image S p ur
Amplitude, dBc
1
z
(relative to –30 dBm
input)
< –60 dB
690 MHz 5570 MHz < –60 dBc
700 MHz 5580 MHz < –60 dBc
1320 M
Hz
6200 M
Hz
< –60 d
1850 MHz 4230 MHz < –60 dBc
2690 MHz 5070 MHz < –60 dBc
2700
MHz
5080
MHz
< –50
3690 MHz 6070 MHz < –50 dBc
4200 MHz 680 MHz < –50 dBc
475
0MHz
237
0MHz
<–5
0dBc
4950 MHz 2570 MHz < –50 dBc
4960 MHz 2580 MHz < –50 dBc
00 MHz
57
20 MHz
33
<–
50 dBc
6200 MHz 3820 MHz < –50 dBc
1
Image amplitude + 30.
Bc
dBc
44 RSA306B Specifications and Performance Verification
Page 55

Input-related spurious response: IF feedthrough
Performance ver
ification
NOTE. You d o no
response tests in sequence.
1. Connect the signal generator, power splitter, power sensor, power meter, and RSA306B as shown. Connect the power
sensor and RF signal generator directly to the power splitter, which is connected directly to the RSA306B.
2. Reset the RSA306B to factory defaults (Presets > Main).
t need to do the first three steps (setup, reset, and alignment) when you perform the input-related spurious
3. Run the RSA306B alignment procedure (Tools > Alignments > Align Now).
4. Set the RSA306B:
a. Reference Level = –30 dBm
b. Span =1MHz
c. RBW = 1kHz
d. Detection mode = +PEAK (Setup > Settings > Traces > Detection > +PEAK)
e. Function = Avg (Vrms) (Setup > Settings > Traces > Function)
f. Averaging = 10 (Setup > Settings > Traces > Function: count = 10)
g. Select External Reference (Setup > Acquire > Frequency Reference > External)
1190 MHz IF feedthrough.
5. Set the signal generator to 1190 MHz.
6. Set the signal generator for –30 dBm at the power meter. This is also the amplitude at the input of the RSA306B. The
generator amplitude will be close to –24 dBm.
7. Set the RSA306B to the center frequency shown in the first column of the 1190 MHz IF feedthrough table. (See Table 19
on page 46.)
8. Measure and record the IF feedthrough spur amplitude.
RSA306B Specifications and Performance Verification 45
Page 56

Performance ver
9. Calculate and record the IF feedthrough spur amplitude in dBc (IF amplitude (dBm) +30).
10. Repeat steps 7 through 9 for each center frequency listed in the table. Do not change the signal generator frequency.
11. Record results in the Test record.
Table 19: 1190 MHz IF feedthrough spurious: RSA306B center frequencies
ification
n, dBc
Center frequency, MHz
(RSA306B)
IF feedthrough spur
amplitude, dBm
IF feedthrough spur
amplitude, dBc
1
Specificatio
(relative to –30 dBm
input)
2600 MHz < –45 dBc
3100 MHz < –60 dBc
4000 MHz < –60 dBc
4800 MHz < –60 dBc
5100 MHz < –60 dBc
5900 MHz < –60 dBc
1
rough spur amplitude + 30.
IF feedth
2440 MHz IF feedthrough.
12. Set the signal generator to 2440 MHz.
13. Set the signal generator for -30 dBm at the power meter. This is also the amplitude at the input of the RSA306B. The
generator amplitude will be close to -24 dBm.
14. Set the RSA306B to the center frequency shown in the first column of the 2440 MHz IF feedthrough table. (See Table 20
on page 46.)
15. Measure and record IF feedthrough spur amplitude.
16. Calculate and record the IF feedthrough spur amplitude in dBc (IF amplitude (dBm) + 30).
17. Repeat steps 14 through 16 for each center frequency listed in the table. Do not change the signal generator frequency.
18. Record results in the Test record.
Table 20: 2440 MHz IF feedthrough spurious: RSA306B center frequencies
Specification, dBc
ter frequency, MHz
Cen
(RSA306B)
eedthrough spur
IF f
amplitude, dBm
30 MHz < –60 dBc
0MHz
71
1800 MHz < –60 dBc
4200 MHz < –60 dBc
1
IF feedthrough spur amplitude + 30.
eedthrough spur
IF f
amplitude, dBc
lative to –30 dBm
1
(re
input)
60 dBc
<–
46 RSA306B Specifications and Performance Verification
Page 57

Input-related spurious response: RF X 2LO
Performance ver
ification
NOTE. You d o no
response tests in sequence.
1. Connect the signal generator, power splitter, power sensor, power meter, and RSA306B as shown. Connect the power
sensor and RF si
2. Reset the RSA306B to factory defaults (Presets > Main).
t need to do the first three steps (setup, reset, and alignment) when you perform the input-related spurious
gnal generator directly to the power splitter, which is connected directly to the RSA306B.
3. Run the RSA306B alignment procedure (Tools > Alignments > Align Now).
4. Set the RSA306B as follows:
a. Reference Level = –30 dBm
b. Span = 1MHz
c. RBW = 1kHz
d. Detection mode = +PEAK (Setup > Settings > Traces > Detection > +PEAK)
e. Function = Avg (Vrms) (Setup > Settings > Traces > Function)
f. Averaging = 10 (Setup > Settings > Traces > Function: count = 10)
g. Select External Reference (Setup > Acquire > Frequency Reference > External)
5. Set the signal generator for –30 dBm at the power meter. This is also the amplitude at the input of the RSA306B. The
generator amplitude will be close to –24 dBm.
6. Set the RSA306B to the center frequency shown in the first column of the RF X 2LO table. (See Table 21 on page 48.)
7. Set the signal generator to the frequency shown in the second column of the RF X 2LO table.
8. Set the signal generator for –30 dBm at the power meter.
9. Measure and record the RF X 2LO spur amplitude.
10. Calculate and record the RF X 2LO spur amplitude in dBc (RF X 2LO amplitude (dBm) + 30).
RSA306B Specifications and Performance Verification 47
Page 58

Performance ver
11. Repeat steps 6 through 10 for each center frequency and signal generator frequency listed in the table. Make sure to set
the signal gene
ification
rator for –30 dBm at the power meter for each frequency change.
12. Record result
s in the Test record.
NOTE. This table includes the worst RF X 2LO spurs observed on the RSA306B.
Table 21: RF X 2LO: RSA306B and signal generator frequencies
Specificati
Center frequency, MHz
(RSA306B)
Signal generator
frequency, MHz
RF X 2LO spur
amplitude, dBm
RF X 2LO spur
amplitude, dBc
1190 MHz 4820 MHz < –60 dBc
1890 MHz 4970 MHz < –60 dBc
2330 MHz 5850 MHz < –60 dBc
4840 MHz 6110 MHz < –60 dBc
1
RF X 2LO spur amplitude + 30.
(relative to –30 dBm
1
input)
on, dBc
48 RSA306B Specifications and Performance Verification
Page 59

Input-related spurious response: RF X 3LO
Performance ver
ification
NOTE. You d o no
response tests in sequence.
1. Connect the signal generator, power splitter, power sensor, power meter, and RSA306B as shown. Connect the power
sensor and RF si
2. Reset the RSA306B to factory defaults (Presets > Main).
t need to do the first three steps (setup, reset, and alignment) when you perform the input-related spurious
gnal generator directly to the power splitter, which is connected directly to the RSA306B.
3. Run the RSA306B alignment procedure (Tools > Alignments > Align Now).
4. Set the RSA306B as follows:
a. Reference Level = –30 dBm
b. Span = 1MHz
c. RBW = 1kHz
d. Detection mode = +PEAK (Setup > Settings > Traces > Detection > +PEAK)
e. Function = Avg (Vrms) (Setup > Settings > Traces > Function)
f. Averaging = 10 (Setup > Settings > Traces > Function: count = 10)
g. Select External Reference (Setup > Acquire > Frequency Reference > External)
5. Set the signal generator for -30 dBm at the power meter. This is also the amplitude at the input of the RSA306B. The
generator amplitude will be close to -24 dBm.
6. Set the RSA306B to the center frequency shown in the first column of the RF X 3LO table. (See Table 22 on page 50.)
7. Set the signal generator to the frequency shown in the second column of the RF X 3LO table.
8. Set the signal generator for -30 dBm at the power meter.
9. Measure and record the RF X 3LO spur amplitude.
10. Calculate and record the RF X 3LO spur amplitude in dBc (RF X 3LO amplitude (dBm) +30).
RSA306B Specifications and Performance Verification 49
Page 60

Performance ver
11. Repeat steps 6 through 10 for each center frequency and signal generator frequency listed in the table. Make sure to set
the signal gene
ification
rator for –30 dBm at the power meter for each frequency change.
12. Record result
s in the Test record.
NOTE. This table includes the worst RF X 3LO spurs observed on the RSA306B.
Table 22: RF X 3LO: RSA306B and signal generator frequencies
Specificati
Center frequency, MHz
(RSA306B)
Signal generator
frequency, MHz
RF X 3LO spur
amplitude, dBm
RF X 3LO spur
amplitude, dBc
130 MHz 5270 MHz < –60 dBc
420 MHz 6140 MHz < –60 dBc
1
RF X 3LO spur amplitude + 30.
(relative to –30 dBm
1
input)
on, dBc
50 RSA306B Specifications and Performance Verification
Page 61

Input-related spurious response: signal 2RF X 2LO
Performance ver
ification
NOTE. You d o no
response tests in sequence.
NOTE. The 2RF X 2LO specification applies when the second harmonic distortion of the signal at the input of the RSA306B
is less than -60 dBc. A band pass filter or low pass filter is used to attenuate the second harmonic d istortion of the generator.
t need to do the first three steps (setup, reset, and alignment) when you perform the input-related spurious
1. Connect the signal generator, power splitter, power sensor, power meter, tunable band pass filter (K&L
5BT-1500/3000-5-N/N), and RSA306B as shown. Connect the power sensor and RF signal generator directly to the
power splitter, which is connected directly to the RSA306B.
NOTE. Alternatively, a 3300 MHz lowpass filter, K&L 5L250-3300/E 10000 -O/OP, may be used instead of the tunable filter.
2. Reset the RSA306B to factory defaults (Presets > Main).
3. Run the RSA306B alignment procedure (Tools > Alignments > Align Now).
4. Set the RSA306B as follows:
a. Reference Level = –30 dBm
b. Span = 1MHz
c. RBW = 1kHz
d. Detection mode = +PEAK (Setup > Settings > Traces > Detection > +PEAK)
e. Function = Avg (Vrms) (Setup > Settings > Traces > Function)
f. Averaging = 10 (Setup > Settings > Traces > Function: count = 10)
g. Select External Reference (Setup > Acquire > Frequency Reference > External)
5. Set the RSA306B to 2190 MHz center frequency.
RSA306B Specifications and Performance Verification 51
Page 62

Performance ver
6. Set the signal generator frequency to 2785 MHz.
7. Set the signal generator amplitude to –23 dBm.
8. Set the tunable band pass filter (K&L 5BT-1500/3000-5-N/N) near 2785 MHz. Alternatively, a 3300 MHz lowpass filter,
K&L 5L250-330
ification
0/E 10000 -O/OP, may be used instead of the tunable filter.
9. Adjust the tun
10. Set the signa
able filter for maximum power on the power meter.
l generator output to –30 dBm at the power meter. This is also the amplitude at the input of the RSA306B.
The generator amplitude will be close to –23 dBm.
11. Measure and record the 2RF X 2LO spur amplitude for these settings. (See Table 23 on page 52.)
12. Calculate and record the 2RF X 2LO spur amplitude in dBc (2RF X 2LO spur amplitude (dBm + 30).
13. Set the signal generator output to Off.
14. Disconnect the tunable band pass filter and install the 5000 MHz cutoff, L250 low pass filter in its place (K&L
5L250-5000/E 15000– O/OP).
15. Set the signal generator output to On.
16. Set the RSA306B to 2870 MHz center frequency.
17. Set the signal generator frequency to 4655 MHz.
18. Set the signal generator output to –30 dBm at the power meter. This is also the amplitude at the input of the RSA306B.
The gener
19. Measure
20. Calcula
21. Record r
ator amplitude will be close to –23 dBm.
and record the 2RF X 2LO spur amplitude for these settings. (See Table 23 on page 52.)
te and record the 2RF X 2LO spur amplitude in dBc (2RF X 2LO spur amplitude (dBm + 30).
esults in the Test record.
NOTE. This table includes the worst 2RF X 2LO spurs observed on the RSA306B.
Table 23: 2RF X 2LO: RSA306B and signal generator frequencies
Speci
Center frequency,
MHz (RSA306B)
Signal generator
frequency, MHz
2RF X 2LO spur
amplitude, dBm
2RF X 2LO spur
amplitude, dBc
2190 MHz 2785 MHz < –60 dB c
2870 MHz 4655 MHz < –60 dBc
1
2RF X 2LO spur amplitude + 30.
(relative to –30 dBm
1
input)
fication, dBc
52 RSA306B Specifications and Performance Verification
Page 63

Test record
Print out the following test record pages and use them to record the performance test results for the RSA306B spectrum
analyzer.
Table 24: Test record: RSA306B
Performance ver
ification
Instrument Serial Number:
Temperature:
Date of Calibration:
Frequency accuracy
Instability measured,
ppm [(Marker
Measured Frequency
(1 GHz CF)
External reference
Phaselock to 10 MHz,
0 dBm Pass/Fail
Amplitude accuracy
Reference level Error, dB Specification, dB Pass/Fail
+20 dBm < 3 GHz
+20 dBm > 3 GHz
+0 dBm < 3 GHz
+0 dBm > 3 GHz
Frequency –
1E9)/1000]
Total specified
Instability (aging
plus other drift) Pass/Fail
±1.2 dB
±1.65 dB
±1.2 dB
±1.65 dB
Certificate Number:
RH %:
Technician:
–13 dBm < 3 GHz
–13 dBm > 3 GHz
–30 dBm < 3 GHz
–30 dBm > 3 GHz
Channel amplitude flatness
Center Frequency Peak Error, dB Specification, dB Pass/Fail
22 MHz < ±1.2 dB
1280 MHz < ±1 dB
2160 MHz < ±1 dB
±1.2 dB
±1.65 dB
±1.2 dB
±1.65 dB
RSA306B Specifications and Performance Verification 53
Page 64

Performance ver
DANL
ification
Measurement,
Center freque
100 kHz
1MHz
10 MHz
20 MHz
22 MHz
100 MHz
500 MHz
1GHz –160 dBm/Hz
1.5 GHz –157 d
2.0 GHz –157 dBm/Hz
2.5 GHz –154 dBm/Hz
Hz
3.0 G
3.5 GHz –152 dBm/Hz
4.0 GHz –152 dBm/Hz
5GHz
4.
5.0 GHz –149 dBm/Hz
ncy
dBm/Hz
Specification,
dBm/Hz Pass/Fail
–130 dBm/Hz
–130 dBm/Hz
–130 dBm/H
–130 dBm/Hz
–161 dBm/Hz
–161 dBm
–161 dBm/Hz
–15
149 dBm/Hz
–
/Hz
Bm/Hz
4 dBm/Hz
z
5.5 GHz –149 dBm/Hz
6.0 GHz –149 dBm/Hz
6.2 GHz –149 dBm/Hz
Phase noise at 1 GHz center frequency
Phase noise offset
frequency Phase noise, dBc/Hz
1kHz
10 kHz
100 kHz
1MHz
Third Order intermodulation distortion at 2130 MHz center frequency
Test Measurement Specification, dBc Pass/Fail
IMD < –63 dBc
Specification,
dBc/Hz Pass/Fail
< –84 dBc/Hz
< –84 dBc/Hz
< –88 dBc/Hz
< –118 dBc/Hz
54 RSA306B Specifications and Performance Verification
Page 65

Spurious response: ADC im ages
Performance ver
ification
Test Measurement,
LF ADC Image at
dBc
Specification
< –50 dBc
,dBc
Pass/Fail
40 MHz CF
RF ADC Image at
< –50 dBc
159.8 MHz CF
RF ADC Imag
eat
< –50 dBc
120.2 MHz CF
Spurious response: Second convertor im ages
Test Measure
2440 IF1 Image at
ment, dBc
Specific
< –50 dBc
ation, dBc
Pass/Fa
1 GHz CF
1190 IF
1 Image at
< –60 dB
c
2 GHz CF
ous response: First converter images
Spuri
Image Spur
Cente
r frequency
Image
frequency
Ampli
tude, dBc
Speci
fication
22 MHz 4902 MHz < –60 dBc
690 MHz 5570 MHz < –60 dBc
Notes
Only record the largest
value measu
rement;
see test instructions.
Only recor
d the largest
value measurement;
see test instructions.
il
Fail
Pass/
700 M
Hz
5580
MHz
< –60
dBc
1320 MHz 6200 MHz < –60 dBc
1850 MHz 4230 MHz < –60 dBc
90 MHz
26
70 MHz
50
<–
60 dBc
2700 MHz 5080 MHz < –50 dBc
3690 MHz 6070 MHz < –50 dBc
200 MHz
4
80 MHz
6
–50 dBc
<
4750 MHz 2370 MHz < –50 dBc
4950 MHz 2570 MHz < –50 dBc
4960 MHz 2580 MHz < –50 dBc
5700 MHz 3320 MHz < –50 dBc
6200 MHz 3820 MHz < –50 dBc
RSA306B Specifications and Performance Verification 55
Page 66

Performance ver
Spurious response: IF feedthrough 1190 MHz
ification
IF feedthroug
spurious amplitude,
Center frequency, MHz
2600 MHz < –45 dBc
3100 MHz < –60 dBc
4000 MHz < –60 dBc
4800 MHz < –60 dBc
5100 MHz < –60 dBc
5900 MHz < –60 dBc
Spurious response: IF feedthrough 2440 MHz
Center frequency, MHz
30 MHz < –60 dBc
710 MHz < –60 dBc
1800 MHz < –60 dBc
Hz
4200 M
Spurious response: RF X 2LO
er frequency, MHz
Cent
dBc
IF feedt
spurious amplitude,
dBc
Generator
uency, MHz
freq
h
hrough
Specification
(relative to –30 dBm
input) Pass/Fail
Specific
(relative to –30 dBm
input) Pass/Fail
Bc
< –60 d
RF X 2LO spur
itude, dBc
ampl
,dBc
ation, dBc
Specification, dBc
(relative to –30 dBm
t)
inpu
Pass
/Fail
1190 MHz 4820 MHz < –60 dBc
1890 MHz 4870 < –60 dBc
0MHz
233
4840 MHz 6110 MHz < –60 dBc
urious response: RF X 3LO
Sp
Center frequency, MHz
130 MHz 5270 MHz < –60 dBc
420 MHz 6140 MHz < –60 dBc
0MHz
585
enerator
G
frequency, MHz
FX2LOspur
R
amplitude, dBc
0 dBc
<–6
Specification, dBc
relative to –30 dBm
(
input) Pass/Fail
56 RSA306B Specifications and Performance Verification
Page 67

Spurious response: Half-IF, 2240 MHz
Performance ver
ification
Specification
Half-IF spurious
Center frequency, MHz
30 MHz < –50 dBc
710 MHz < –50 dBc
4200 MHz < –50 dBc
Spurious response: 2RF X 2LO
Center frequency, MHz
2190 MHz 2785 MHz < –60 dBc
2870 MHz 4655 MHz < –60 dBc
amplitude, dBc
Generator
frequency, MHz
(relative to –30 dBm
input) Pass/Fail
2RF X 2LO spur
amplitude, dBc
,dBc
Specificat
(relative to –30 dBm
input) Pass/Fail
ion, dBc
RSA306B Specifications and Performance Verification 57
 Loading...