

Page 1

xx
RF Scout
Interference Hunter
ZZZ
®
Quick Start User Manual
Revision A
www.tektronix.com
071-1901-04
Page 2

Copyright © Tektronix. All rights reserved. Licensed software products are owned by Tektronix or its subsidiaries or suppliers, and are protected by
national copyright laws and international treaty provisions.
Tektronix products are covered by U.S. and foreign patents, issued and pending. Information in this publication supersedes that in all previously
published material. Specifications and price change privileges reserved.
TEKTRONIX and TEK are registered trademarks of Tektronix, Inc.
NetTek and RF Scout are registered trademarks of Tektronix, Inc.
Contacting Tektronix
Tektronix, Inc.
14200 SW Karl Braun Drive
P.O . Bo x 50 0
Beaverton, OR 97077
USA
For product information, sales, service, and technical support:
In North America, call 1-800-833-9200.
Worldwide, visit www.tektronix.com to find contacts in your area.
Page 3

Warranty 2
Tektronix warrants that this product will be free from defects in materials and workmanship for a period of one (1) year from the date of shipment. If
any such product proves defective during this warranty period, Tektronix, at its option, either will repair the defective product without charge for parts
and lab or, or will provide a replacement in exchange for the defective product. Parts, modules an d replacement products used by Tektronix for
warranty work may be new or reconditioned to like new performance. All replaced parts, modules and products become the property of Tektronix.
In order to obtain service under this warranty, Customer must notify Tektronix of the defect before the expiration of the warranty period and make
suitable arrangements for the performance of service. Customer shall be responsible for packaging and shipping the defective product to the service
center designated by Tektronix, with shipping charges prepaid. Tektronix shall pay for the return of the product to Customer if the shipment is to a
location within the country in which the Tektronix service center is located. Customer shall be responsible for paying all shipping charges, duties,
taxes, and any other charges for products returned to any other locations.
This warranty shall not apply to any defect, failure or damage caused by improper use or improper or inadequate maintenance and care. Tektronix
shall not be obligated to furnish service under this warranty a) to repair damage resulting from attempts by personnel other than Tektronix
representatives to install, repair or service the product; b) to repair damage resulting from improper use or connection to incompatible equipment; c) to
repair any damage or malfunction caused by the use of non-Tektronix supplies; or d) to service a product that has been modified or integrated with
other products when the effect of such modification or integration increases the time or difficulty of servicing the product.
THIS WARRANTY IS GIVEN BY TEKTRONIX WITH RESPECT TO THE PRODUCT IN LIEU OF ANY OTHER WARRANTIES, EXPRESS OR
IMPLIED. TEKTRONIX AND ITS VENDORS DISCLAIM ANY IMPLIED WARRANTIES OF MERCHANTABILITY OR FITNESS FOR A PARTICULAR
PURPOSE. TEKTRONIX’ RESPONSIBILITY TO REPAIR OR REPLACE DEFECTIVE PRODUCTS IS THE SOLE A ND EXCLUSIVE REMEDY
PROVIDED TO THE CUSTOMER FOR BREACH OF THIS WARRANTY. TEKTRONIX AND ITS VENDORS WILL NOT BE LIABLE F OR ANY
INDIRECT, SPECIAL, INCIDENTAL, OR CONSEQUENTIAL DAMAGES IRRESPECTIVE OF WHETHER TEKTRONIX OR THE VENDOR H AS
ADVANCE NOTICE OF THE POSSIBILITY OF SUCH DAMAGES.
Page 4

Page 5

Table of Contents
General Safety Summary .. ................................................................................................................ iii
Environmental Considerations ............................................................................................................. vi
Preface..................................................................................................................................... viii
KeyFeatures......................................................................................................................... viii
Documentation........................................................................................................................ ix
Software Upgrades .................................................................................................................... x
Conventions Used in ThisManual.....................................................................................................x
Preventing Personal Injuryfrom Lightning ...........................................................................................xi
Installation .................................................................................................................................. 1
RF Scout Standard Accessories.. .................................................................................................... 1
Operating Considerations ............................................................................................................ 2
Connecting the AC Adapter . . ........................................................................................................ 4
Charging theBatteries................................................................................................................ 5
Powering On and Off the Instrument, and Functional Verification................................................................... 6
Touch Screen Concepts .............................................................................................................. 7
Calibrate the Touch Screen........................................................................................................... 8
Starting theRF Scout Application ...................................................................................................10
Setting Display Colors ............................................................................................................... 11
Enabling Signal Standards .......................................................................................................... 12
Table of Contents
RF Scout Quick Start User Manual i
Page 6

Table of Contents
Getting Acquainted with Your Instrument ................................................................................................. 15
Operating Basics .......................................................................................................................... 26
InstrumentElements................................................................................................................. 15
Power On/Standby and Status Panel ............................................................................................... 16
Input/Output Connectors (NetTek Y400 Platform) . . ................................................................................ 17
NetTek YBT250 Module Signal Connectors. ........................................................................................ 18
Microsoft WindowsCE Elements . .. ................................................................................................. 18
TheUser Interface................................................................................................................... 19
TheCommand Bar...................................................................................................................20
TheTuningControls ................................................................................................................. 21
TheExternal Signal Status Buttons ................................................................................................. 22
TheMeasurement Mode Buttons.................................................................................................... 23
TheParameter Entry Controls.......................................................................................................24
Getting Help.......................................................................................................................... 25
Setting Up to Take a Measurement ................................................................................................. 26
Spectrum Measurements............................................................................................................31
Channel Measurements Mode ...................................................................................................... 49
iMap Measurement Mapping Mode ................................................................................................. 53
Signal Measurements................................................................................................................ 69
Specifications.............................................................................................................................. 71
Certificationsand Compliances .................................................................................................... 100
Index
ii RF Scout Quick Sta rt User M a nual
Page 7

General Safety Summary
Review the following safety precautions to avo id injury and prevent damage to this product or any products connected to it.
To avoid potential hazards, use this product only as specified.
Only qualified personnel sho uld perform service procedures.
While using this product, you may need to access other parts of a larger system. Read the safety sections of the other component
manuals for warnings and cautions related to operating the system.
To Avoid Fire or Personal Injury
Use Proper Power Cord. Use only the power cord specified for this product and certified for the country of use.
Observe All Term inal Ratings. To avoid fire or shock hazard, observe all ratings a nd markings on the product. Consult the
product manual for further ratings information before making connections to the product.
The inputs are not rated for connection to mains or Category II, III, or IV circuits.
Power D isconnect. The power cord disconnects the product from the power source. Do not block the powe r cord; it must remain
accessible to the user at all times.
Do Not Operate Without Covers. Do not operate this product with covers or panels removed.
Do Not Operate With Suspected Failures. If you suspect that there is damage to this product, ha ve it inspected by quali fied
service personnel.
General Safety Summary
Avoid Exposed Circuitry. Do not touch exposed connections and components when power is present.
Replace Batteries Properly. Replace batteries only with the sp ecified type and rating.
RF Scout Quick Start User Manual iii
Page 8
General Safety Summary
Recharge Batteries Properly. Recharge batteries for the recommended charge cycle only.
Use Proper AC Adapter. Use only the AC adapter specified for this product.
Do Not Operate in an Explosive Atmosphere.
TermsinthisManual
These terms may appear in this manual:
WARNING. Warning sta tements identify conditions or practices that could result in injury or loss of life.
CAUTION. Caution statements i dentify conditions or practices that could result in damage to this product or other property.
Symbols and Terms on the Product
These terms may appear on the product:
DANGER indicates an injury hazard immediately accessible as you read the marking.
WARNING indicates an injury hazard not immediately accessible as you read the marking.
CAUTION indicates a hazard to property including the product.
iv RF Scout Quick Sta rt User M a nual
Page 9

The following symbol(s) m ay appear on the product:
General Safety Summary
RF Scout Quick Start User Manual v
Page 10

Environmental Considerations
Environmental Considerations
This section provides information about the environmental impact of the product.
Product End-of-Life Handling
Observe the following guidelines when recycling an instrument or component:
Equipment Recycling. Production of this equipment required the extraction and use of natural resources. The equipment may
contain substances that could be harmful to the environment or human health if improperly handled at the product’s end of life. In
order to avoid release of such substances into the environment and to reduce the use of natural resources, we encourage you to
recycle this product in an appropriate system that will ensure that most of the materials are reused or recycled appropriately.
This symbol indicates that this product complies with the European Union’s requirements according to Directive
2002/96/EC on waste electrical and electronic equipment (WEEE). For information about recycling options, check
the Support/Service section of the Tektronix Web site (www.tektronix.com).
Battery R ecycling. This product may contain a lithium ion (Li-ion) rechargeable battery, which must be recycled or disposed of
properly. Please properly dispose of or recycle the battery according to local government regulations.
Mercury Notification. This product uses an LCD backlight lamp that contains mercury. Disposal may be regulated due
to environmental considerations. Please contact your local authorities or, within the United States, the Electronics Industries
Alliance (www.eiae.org) for disposal or recycling information.
vi RF Scout Quick Start User Manual
Page 11

Environmental Considerations
Perchlorate Materials. This product contains one or more type CR lithium coin cell batteries. According to the
state of California, CR lithium coin cells are classified as perchlorate materials and require special handling. See
www.dtsc.ca.gov/hazardouswaste/perchlorate for additional information.
Transporting Batteries
The lithium ion rechargeable bat tery pack in th is product contains less than 8 grams of equivalent lithium content, with individual
cells containing less than 1.5 grams of equivalent lithium, as measured by International Civil Aviation Organization (ICAO)
standards. Consult your air carrier for applicability and determination of any special lithium ion battery transportation requirements.
Restriction of Hazardous Substances
This product has been classified as M onitoring and Control equipment, and is outside the scope of the 2002/95/EC RoHS Directive.
RF Scout Quick Start User Manual vii
Page 12

Preface
Preface
This manual describes the installation and basic operation of the RF Scout I nterference Hunter. For more detailed information on
individual measurements, tap the underlined link text on measurement screens to open the online help for those topics.
Key Features
The RF Scout Interference Hunter is a rugged, multi-standard spectrum analyzer and interference mapping tool optimized for field
use. Key features include:
Interference hunting functions that help find interference quickly
Spectrogram display for detection and logging of intermittent signa ls
iMap integrated measurement mapping for on-site analysis of interference and coverage problems
Signal strength, AM/FM demodulation, and noise floor measurements
Scanners or code analyzers for GSM/GMSK/EDGE, UMTS/W-CDMA/HSDPA, cdmaOne, cdma2000, 1xEV-DO, TD-SCDMA,
and iDEN signals
Multipath signal analyzer for W-CDMA signals
User-defined channels for taking general measurements and channel scans
Macro ed itor for creating collections of measurements to take in the iMap window
PN Sync function for displaying 1xEV-DO and cdma2000 PN offsets in areas that do not have GPS signal availability
viii RF Scout Quick Sta rt User M a nual
Page 13

Documentation
To read about Use these documents
Installation and operation (overviews) RF Scout Interference Hunter Quick Start User Manual. The quick start u ser manual
Help u sing the application
Preface
contains general information about how to put your instrument into service, guides to
user interface controls, and application examples.
Online Help. The online help is context sensitive, displaying information appropriate
for the active screen or the selected help text. (See page 25, Getting Help.)
RF Scout Quick Start User Manual ix
Page 14
Preface
Software Upgrades
Periodic software upgrades may become available. The software is only operational if you have a valid option key for the specific
application module and serial number.
To check for upgrades:
1. Go to the Tektronix Web site (www.tektronix.com).
2. Click Software Downlo ads on left side of the screen to link to the Software Downloads Web page.
3. Enter the product name or model number in the Search by keyword field and click Go.
4. Scroll through the list and select the appropriate link for your instrument to show more information or to download the software.
The instructions to perform the software upgrade are in the re adme.txt file that is part of the software download.
Conventions Used in This Manual
The following icons are used in this manual:
Sequence
Step
x RF Scout Quick Start User Manual
Front panel
power
Connect
power
Page 15

Preventing Personal Injury from Lightning
WARNING. To prevent personal injury from the effects of lightning, exercise the following precautions when using this product:
Before connecting this product to any source
Check y o ur local weather forecast for the possibility of thunderstorms or lightning.
If weather conditions could allow thunderstorms or lightning to develop, be sure to visually check the sky and weather
conditions in your area frequently.
If you can hear thunder or if you see lightning, do not connect this product to any source which may be exposed to the
effects of lightning.
Use your own good judgement and common sense. You must protect yourself from the effects of lightning.
You must assume that hazardous voltages will be present on exposed surfaces of this product if it is connected to a source
exposed to lightning. The insulation of this product will not protect you from these hazardous voltages.
Preface
RF Scout Quick Start User Manual xi
Page 16

Preface
Do not connect this product to any source which might be subject to the effects of lightning
If thunderstorms or lightning a re in your vicinity:
When weat her conditions that could lead to lightning activity exist in your area, you could be at risk of a lightning strike
before th e cloud is close enough for you to hear thunder or see lightning.
When lightning strikes a structure or facility, current travels through rebar, concrete, pipes, cables, vent stacks, and electrical
system.
Lightning can induce electric and magnetic fields into structures and portions of wiring. The length of a conductor affected by
the magnetic fi eldofalightningstrikemayexceedtwomiles.
Be alert and aware of the effects of lightning
When lightning strikes a cond uctor, which in turn introduces the current into an area some distance from the ground strike point,
equipment can be damaged and personnel injured if they become an indirect path in the completion of the ground circuit.
Conductors such as the braided shields of cables or unshielded wires will have significant transient currents flowing in them
in regions e x posed to the electric field effect of lightning.
Induced voltages may cause breakdown of insulation in wiring at co nnectors and in electrical components or breakdown of air.
xii RF Scout Quick Start User Manual
Page 17

Installation
Carefully unpack your instrument and verify that it includes the standa rd accessories.
RF Scout Standard Accessories
Accessory Tektronix part number
NetTek Y400 Analyzer Platform
NetTek YBT250 Field Transmitter & Interference Tester Application Module
AC Power Adapter
Lithium-Ion Battery 146-0151-xx
NetTek Y400 Analyzer Setup Reference
RF Scout Interference Hunter Quick Start User Manual
Your instrument may also include optional accessories. Verify that the optional accessories you ordered are included with your
instrument. For a current list of accessories, upgrades, and options, including service options, available for your instrument,
visit the Tektronix Web site, www.tektronix.com.
Installation
Y400
YBT250
119-6984-xx
071-1430-xx
071-1901-xx
RF Scout Quick Start User Manual 1
Page 18

Installation
Operating Considerations
AC Adapter Input voltage and current: 100 V - 240 V AC, 1.8 A
Input frequency: 47 Hz to 63 Hz
Output voltage and current: 24 V DC, 3 A
Dimensions
Weight
Temperature Range
Humidity
Altitude
RF Signal Input Input frequency range: 30 MHz to 2500 MHz
Height: 25 cm. (9.75 in)
Width: 33 cm. (13 in)
Depth: 9 cm. (3.5 in)
5.52 kg (12.125 lbs) (with one battery)
Operating: 0 °C to +50 °C specified performance, –10 °C to +50 °C typical
Nonoperating: –40 °C to +60 °C
Operating: 5% to 95% Relative Humidity (RH), noncondensing: up to +30 °C
Nonoperating: 5% to 45% Relative Humidity (RH), noncondensing: +30 °C up to +50 °C
Operating: Up to 4,600 m (15,092 ft.)
Nonoperating: Up to 15,240 m (50,000 ft.)
Coupling: AC
Input impedance: 50 Ω (nominal)
Maximum input power without damaging instrument: 50 W CW or peak envelope power
2 RF Scout Quick Start U ser Manual
Page 19

Installation
Cleaning
Clean the exterior surfaces of the instrument with a dry lint-free cloth or a soft-bristle brush.
Use a cloth or swab moistened with deionized or distilled water, or a 75% isopropyl alcohol solution for more stubborn stains, to
clean the instrument or touch screen; use just e nough moisture to dampen the cloth or swab.
Use a gentle amount of force when cleaning the touch screen.
CAUTION. Do not get moisture inside the instrument during exterior cleaning.
Do not wash the front-panel On/Standby switch. Cover the switch while washing the instrument.
Do not spray liquids directly on the instrument or touch screen.
Do not use abrasive cleaners, or chemical cleaning agents that contain benzene, toluene, xylene, acetone, or similar solvents; they
can damage the instrument or touch screen. Do not use commercial glass cleaners to clean the touch screen.
Do not scrub the touch screen with excessive force while cleaning.
RF Scout Quick Start User Manual 3
Page 20
Installation
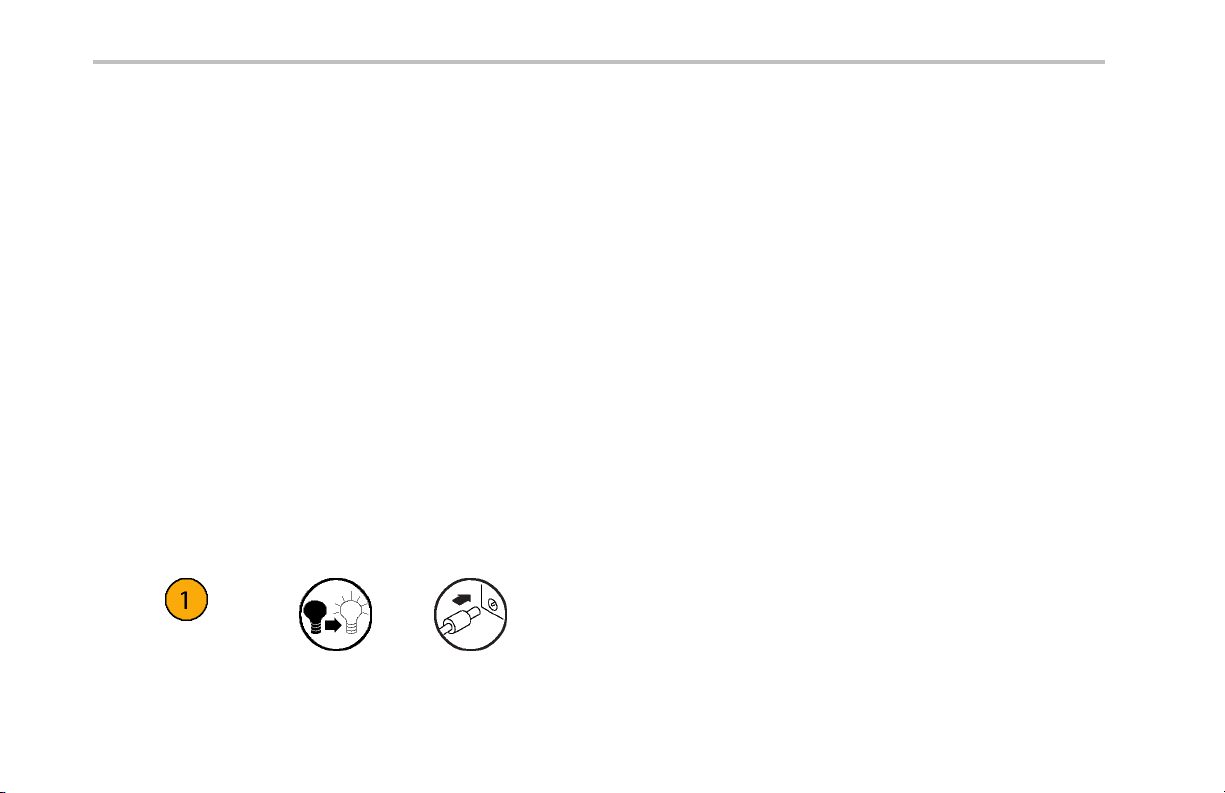
Connecting the AC Adapter
1. Lift the instrument strap to expose the
power adapter connector.
2. Connect the AC power adapter to th e
instrument.
3. Connect the AC adapter to a
properly-grounded AC power source
using the provided power cord.
4. Charge the batteries before using the
instrument on battery power for the first
time. (See page 5, Charging the Batteries.)
4 RF Scout Quick Start U ser Manual
Page 21

Charging the Batteries
Charge the batteries before using the instrument on battery power for the first time. Batteries are partially charged and calibrated
at the factory. A calibrated battery allows the instrument to more accurately estimate how long the application modules can
operate before the instrument automatically powers off. The front-panel BATTERIES charge status indicator turns off when
charging is complete.
Approximate charge time
Number of batteries Instrument powered on Instrument powered off
1 8 hours 3 hours
2 16 hours 6 hours
NOTE. These are typical numbers for batteries that are low but not completely discharged. Newer-model instruments can contain
higher-capacity batteries, resulting in increased run time an d longer charge time.
For more information on battery charging, battery calibration, and instrument power management, see the instrument Online help:
Start > Help > Tektronix B asics > Po w er Management.
Installation
RF Scout Quick Start User Manual 5
Page 22

Installation
Powering On and Off the Instrument, and Functional Verification
1. Tap th e On/Standby button to power on
the instrument.
The instrument WindowsCE Status bar
shows the Battery icon when the instrument
is operating on battery power and the
External Power Connected icon when the
instrument is operating with an external
adapter.
To power off the instrument, tap the
On/Standby button again.
For information on the instrument
on/standby power modes, see the Online
help: Start > Help > Tektronix Basic s >
Shutting Down the Instrument.
2. For functional verification, watch the
screen. Verify that the instrume nt does
not display any power-on diagnostic error
messages.
6 RF Scout Quick Start U ser Manual
Page 23

Touch Screen Concepts
The instrum ent user interface is based on touch-screen technology. Instead of using physical button and knob controls to select
functions, se t values, and ta ke measurements, you tap (touch) virtual controls on the instrument screen. Virtual controls behave
the same way as physical controls.
The following a re touch screen terms used in this manual:
Term Description Equivalent m ouse operation
Stylus
Tap
Drag Press gently on the screen with the stylus, drag the stylus to a
The physical object you use to touch the screen. A stylus is either
your finger or an appropriate plastic-tipped stylus. Do not use an y
metal-tipped objects or pens for a stylus, as they can damage
the touch screen.
Touch the screen briefly with the stylus. Selects the item on the
screen.
new position, and then raise the stylus from the screen. Moves an
item or selects a n area.
Installation
The mouse pointer.
The left mouse button.
Drag (hold down the left mouse
button, move the mouse, and then
release the button).
RF Scout Quick Start User Manual 7
Page 24
Installation
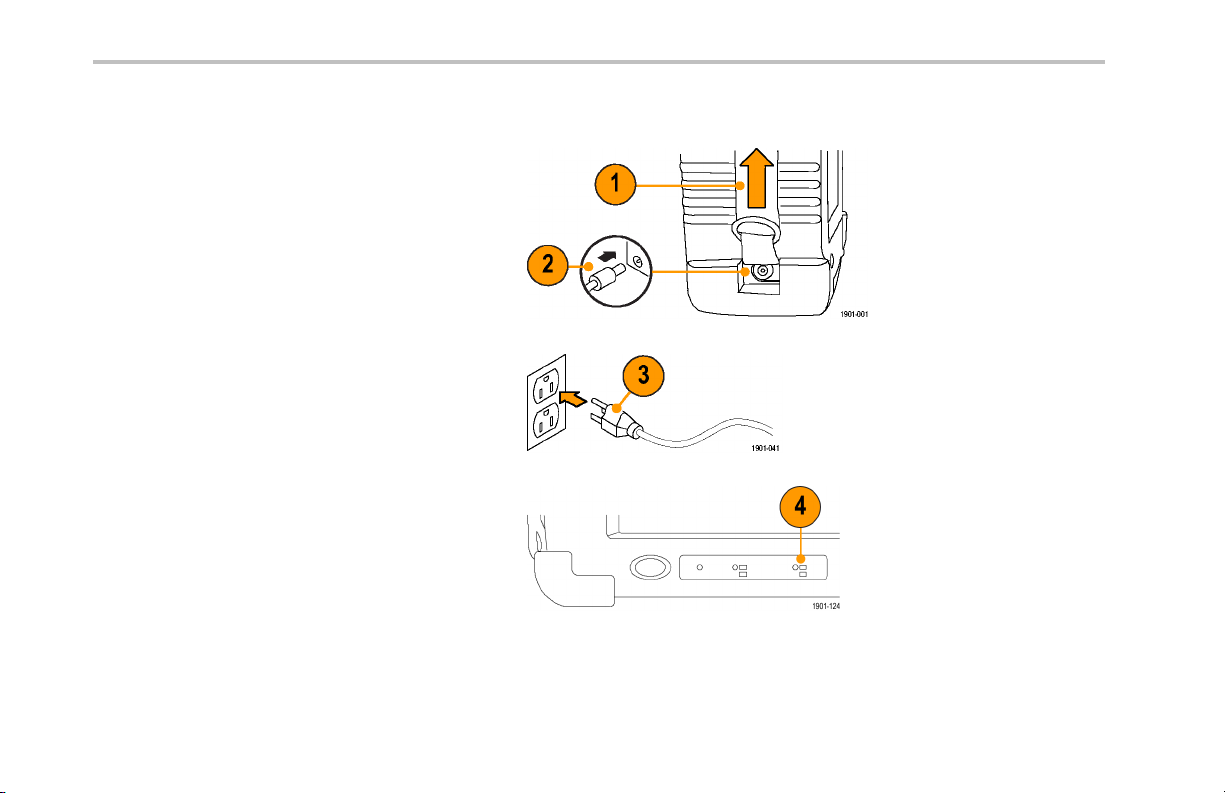
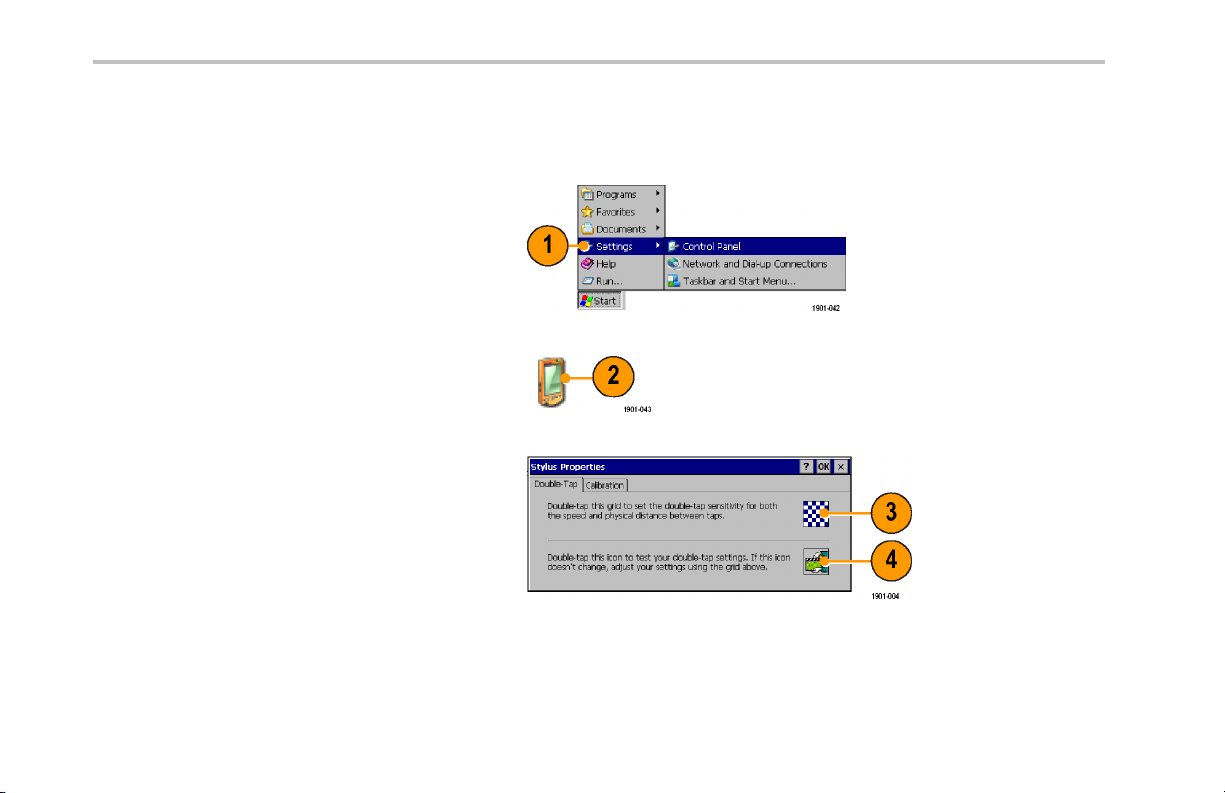
Calibrate the Touch Screen
Before using the instrument for the first time, calibrate the touch screen display to respond correctly to your taps.
1. Tap Start > Settings > Control Panel to
open the Control Panel screen.
2. Double-tap the Stylus icon on the Control
Panel screen.
3. In the Double-Tap tab, d ouble-tap the
checkerboard grid at a comfortable speed
with your stylus or finger to set the tap rate.
4. Double-tap the test icon to verify your
settings.
8 RF Scout Quick Start U ser Manual
Page 25

5. Tap the Calibration tab and read the
instructions.
6. Tap th e Recalib rate button to open the
Cursor Position target screen.
7. Follow the target screen instructions.
When the position target disappears, touch
anywhere on the screen to re turn to the
Calibration tab.
8. Tap OK to save calibration settings.
Installation
RF Scout Quick Start User Manual 9
Page 26
Installation
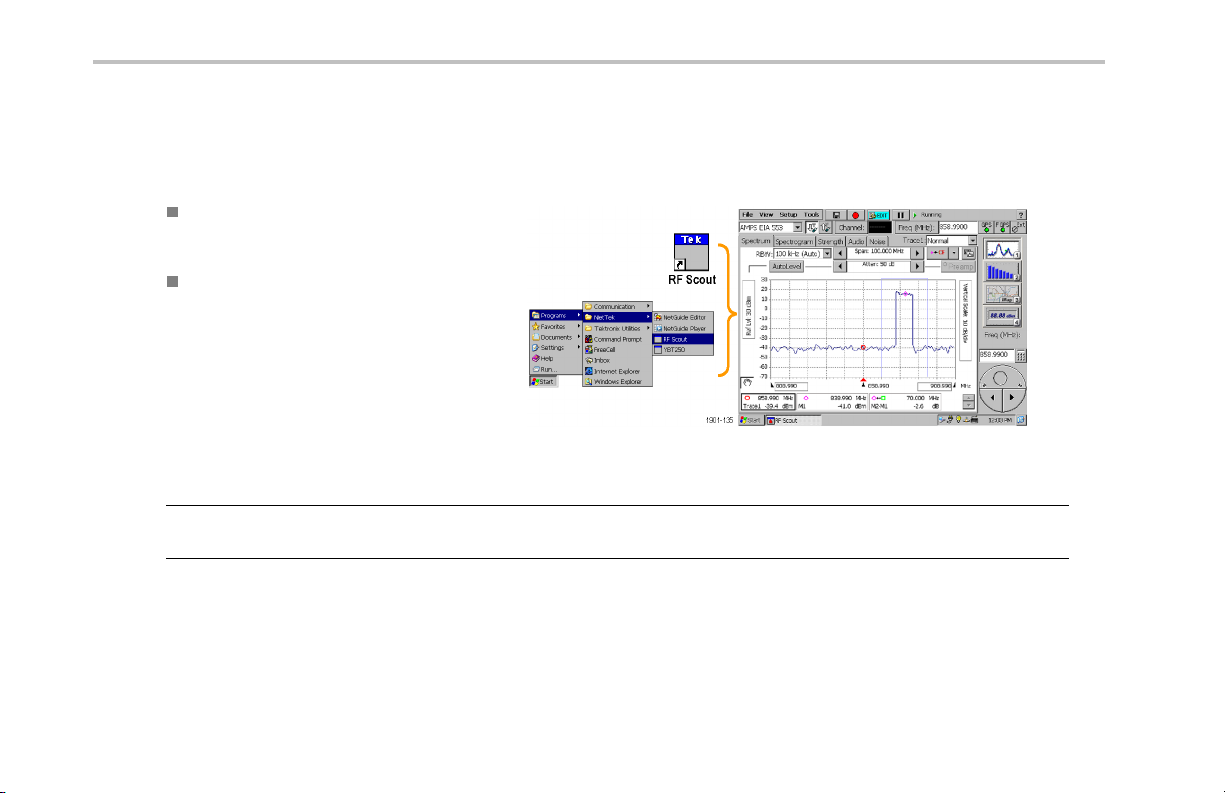
Starting the RF Scout Application
If purchased with preloaded software, RF Scout starts automatically when you power on the instrument. If RF Sco ut does not start
automatically, or you have stopped the application, use either of the following methods to start the application:
Double-tap the RF Scout icon on the
instrument screen
Select Start > Programs > NetTek >
RF Scout
The instrument opens the RF Scout application.
The Microsoft WindowsCE taskbar displays a
button for each running application. To bring
the RF Scout to the front of the screen, tap the
RF Scout button in the taskbar.
NOTE. You cannot run RF Scout application at the same time as the YBT250 application. However, you can run RF Scout a nd the
YBA250 application module measurements at the same time as long as you are not measuring Insertion Gain/Loss.
10 RF Scout Quick Start User Manual
Page 27
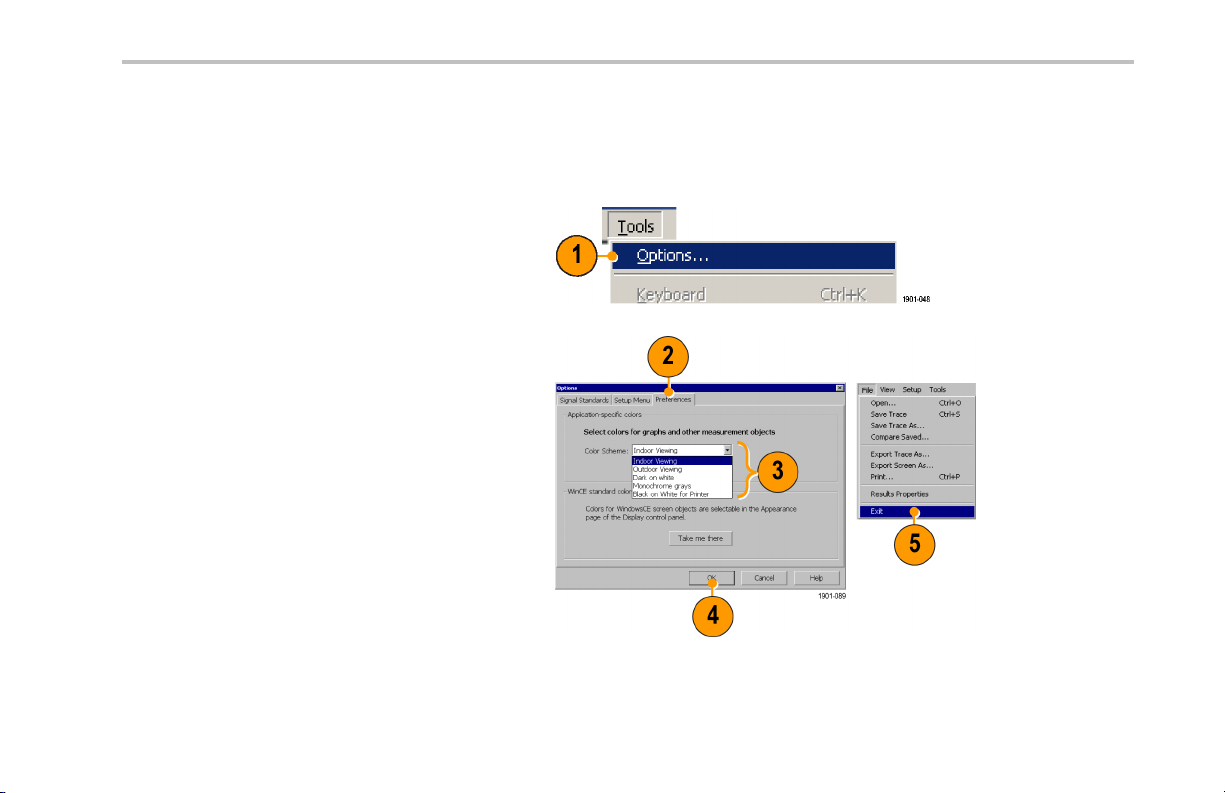
Setting Display Colors
You can change the color scheme used in the instrument display. The color schemes optimize the display colors for use in different
environments (outdoo rs or indoors) and for better printing quality on black and white ( monochrome) printers.
1. Select Tools > Option s.
2. Tap th e Preferences tab.
3. Tap th e Color Scheme list field and select
a display color scheme.
4. Tap OK.
5. Select File > Exit to close the application.
6. Restart the application to enable th e
changed color scheme.
Installation
RF Scout Quick Start User Manual 11
Page 28
Installation
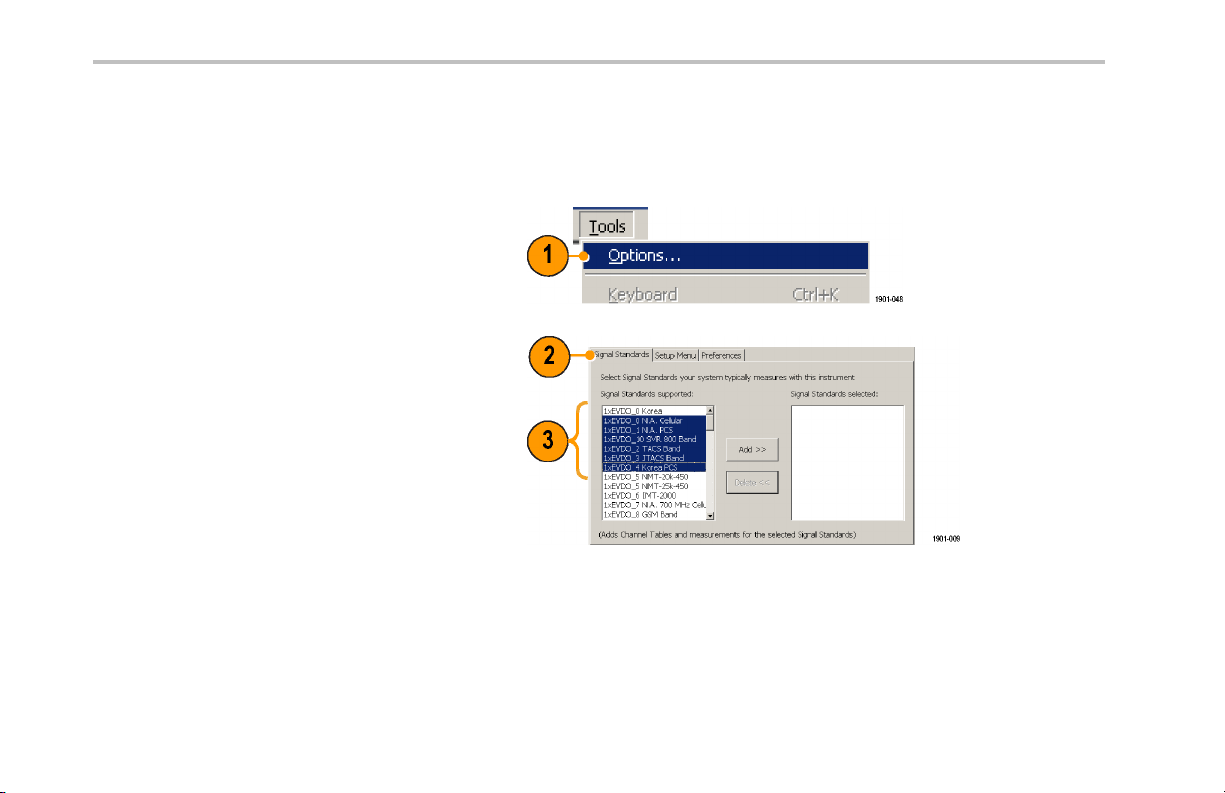
Enabling Signal Standards
Before you begin using the instrument, yo u must enable (select) the signal standards that you want to measure. You can only take
measurements on enabled standards.
1. Select Tools > Options.
2. Tap t he Signal Standard s tab.
3. Tap the name of the standard in the Signal
Standards supported list that you want
to enable. Drag the stylus to select two or
more contiguous standards.
12 RF Scout Quick Start User Manual
Page 29
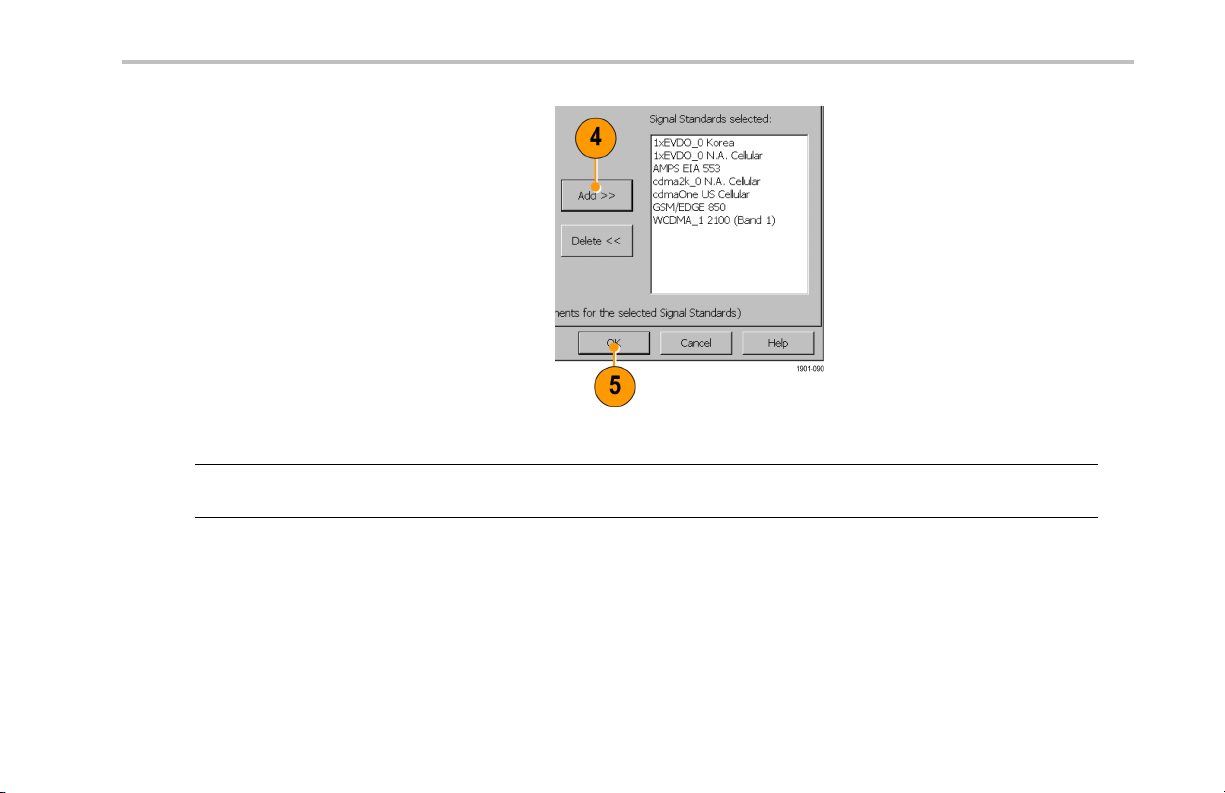
4. Tap th e Add >> button to add the selected
standard(s) to the Signal Standards
selected list.
5. Tap OK. The enabled standards are now
selectable from the main w indow Signal
Standards drop-down list.
NOTE. Limiting the number of enabled standards to just those that you regularly test makes it easier and faster to select a
standard from the Signal Standard drop-down list.
Installation
RF Scout Quick Start User Manual 13
Page 30

Installation
14 RF Scout Quick Start User Manual
Page 31

Getting Acquainted with Your Instrument
Instrument Elements
1. NetTek Y400 Analyzer Platform.
2. Battery compartment.
3. NetTek YBT250 Application Module.
4. Input/Output ports. (See page 17,
Input/Output Connectors (NetTek Y400
Platform).)
5. PCMCIA card ports.
6. Power and Status panel. (See page 16,
Power On/Standby and Status Panel.)
7. External adapter power connector. (See
page 4, Connecting the AC Adapter.)
8. Touch screen.
GettingAcquaintedwithYourInstrument
RF Scout Quick Start User Manual 15
Page 32

Getting Acquainted with Your Instrument
Power On/Standby and Status Panel
1. Power On/Standby button. Push to
power on or off the instrument. For
more information, access the online help:
Start > Help > Tektronix Basi cs >
Shutting Down the Instrument.
2. Reset button. Performs a hardware reset;
all programs and data loaded into volatile
memory are erased. Generally only used
to recover from a system lock-up. Use a
thin probe to push the reset button.
3. Power/Display status. Green indicates
that the instrument is powered on. Amber
indicates that the instrument is powered on
but the display is turned off (to conserve
power).
4. Battery status. Green indicates that the
instrument is connected to an external
power source and is charging installed
batteries. Red indicates a low battery.
No color indicates that the batteries are
charged.
16 RF Scout Quick Start User Manual
Page 33

Input/Output Connectors (NetTek Y400 Platform)
1. Microphone input
2. Headphone jack
3. Ethernet connector (RJ-45)
4. Serial RS-23 2 connector
5. PS/2 keyboard connector
6. USB Host connector
7. USB Slave connector
See the Y400 NetTek Analyzer Setup Reference document (Tektronix part number 071-1430-XX) for m ore information on the
NetTek Y400 Analyzer Platform.
GettingAcquaintedwithYourInstrument
RF Scout Quick Start User Manual 17
Page 34

Getting Acquainted with Your Instrument
NetTek YBT250 Module Signal Connectors
1. Timing Input. Connects to a n external
timing reference signal, such as a BTS
Even Second Clock signal, or the timing
signal from a Tektronix YBGPS1 GPS
Timing Refere nce.
2. Frequency Reference Inpu t. Use an
external frequency reference signal to
improve measurement accuracy.
3. RF Input. The RF Input connects the
RF input signal source or measurement
antenna to the instrument.
Microsoft WindowsCE Elements
The Microsoft WindowsCE user interface is similar to other Microsoft Windows operating systems. You use standard M icrosoft
Windows operations to start (run) applications, select and move objects, and o pen folders or files. For more Microsoft WindowsCE
information, access the online help: Start > Help > Windo wsCE Basics.
The Status area, located at the bottom right of the screen, contains icons that display important information about the instrument
power status. For an explanation of all status area icons, access the online help: Start > Help > WindowsCE Basics >
Understanding Taskbar Icons.
18 RF Scout Quick Start User Manual
Page 35

The User Interface
1. Command bar. (See page 20, The
Command Bar.)
2. Tuning controls. (See page 21, The
Tuning Controls.)
3. Measurement results. Shows the
waveform displays and measurement
results. The appearance of this area
changes depending on the selected
measurement mode and measurement
type.
4. External signal status buttons.(See
page 22, Th e External Signal Status
Buttons.)
5. Measurement mode bu ttons.(See
page 23, The Measurement Mode
Buttons.)
6. Parameter entry controls. (See page 24,
The Parameter Entry Controls.)
GettingAcquaintedwithYourInstrument
RF Scout Quick Start User Manual 19
Page 36

Getting Acquainted with Your Instrument
The Command Bar
Contains the application menus, as well as buttons for saving measurement results, opening the application setup dialog box,
and running/pausing the application.
Element Description
Menus. S ee the Online h elp topic Menus for information about the menu functions.
Save Resu lts button. Saves the current measurement acquisition to a file. See the Online help
topic The Save & Export Tab for how to set file save parameters.
Log Measurements button. Enables automatically taking and saving a measurement at specified
time intervals. See the Online help topic The Logging Dialog Box for how to set the time interval
between measurement acquisitions.
Edit bu tton. Opens the Setup dialog box that contains instrument settings tabs. See the Online
help topic Setup Tabs for information on the setup dialog tabs.
Open button. Shows the Open dialog box that lists saved instrument setup files to load and
configure instrument settings. See the Online help topic The Setup Menu Tab for directions on how
to switch the button between the Edit and Open modes.
Run/Pause button. Runs or Pauses the current measurement acquisition.
Help button. Opens the online help. Online help is context-sensitive and normally displays a
help topic related to the current measurement mode or screen. If the current screen is not
context-sensitive, the instrument opens the Online help at the main help menu. Use the index, or do
a word search, to locate specific information.
20 RF Scout Quick Start User Manual
Page 37

The Tuning Controls
Selects the signal standard, signal direction (uplink or downlink), measurement channel, and measurement frequency.
Element Description
GettingAcquaintedwithYourInstrument
The Signal Standard drop-down list displays the enabled signal standa rds from which you
select a standard to m easure. (See page 12, Enabling Signal Standards.)
The Downlink and Uplink buttons change the Freq (MHz) setting to the forward link (downlink)
or reverse link (uplink) frequency of the current signal standard and channel. For W-CDMA
signals, these buttons set the corresponding forward or reverse channel number.
The Channe l button sets the channel number. The fi eld next to the button s hows the current
channel number. Tapping the button opens the numeric keypad, with which you enter
a channel number.
The current signal standard defines the available channel numbers. Setting the channel
number sets the instrument measurement frequency to the ap propriate value for the selected
signal standard and up or downlink mode setting.
The Freq (MHz) button s e ts the Measurement Frequency. The field next to the button
shows the frequency. Tapping the button opens the numeric keypad, with which you enter
a frequency value.
RF Scout Quick Start User Manual 21
Page 38

Getting Acquainted with Your Instrument
The External Signal Status Buttons
Indicates status and sets GPS, measurement reference frequency source, input signal attenuation or amplification values, and
PN Sync parameters.
Element Description
The GPS status button indicates the GPS signal lock status of an attached GPS receiver. The color indicates
the GPS receiver signal lock status. Tap this button to open the GPS setup tab. See the Online topic The GPS
Tab for more information.
The Measurement Reference Frequency status button indicates the measurement frequency reference source. Tap
this button to open the Inpu ts tab. Use this button if you connect an external measurement reference frequency
source to the instrument.
The available measurement reference freq uency sources are th e internal instrument frequency reference (F INT),
an external reference (F EXT ), or a GPS-derived timing reference from the Tektronix YBGPS1 GPS Timing
Reference (F GPS). See the Online topic The Inputs Tab for more information.
The R F Input Signal Gain/Loss status button shows the external attenuator or amplifier status. Tap this button to
open the Inputs tab where you can set the input signal amplification or attenuation values. Use this button if you
connect an attenuator or amplifier to the input signal. See the Online topic The Inputs Tab for more information.
When PN Sync is enabled, the RF Input Signal Gain/Loss status button is replaced with the PN Sync status button.
The color indicates the PN Sync availability status. Tap this button to open the PN Sync Settings dialog box.
See the Online topic PN Sync for more information.
22 RF Scout Quick Start User Manual
Page 39

The Measurement Mode Buttons
The Measurement Mode buttons select the type of measurement or operation to perform.
Element Description
Select the Spectrum Measurements button to take spectrum, spectrogram, signal strength, audio
demodulation, and noise floor signal measurements.
Select the C hann el Measurements button to take code power, codogram, EMF, and channel
scanner/analyzer measurements.
Select the iMap Mapp ing button to open the Map tool and link instrument measurements to
a location on a map. Use for graphically recording measurements to help analyze signal
characteristics, locate interference, and save measurement/location information.
Select the Signal Measurements button to take signal measure ments including RF power, signal
quality, occupied bandwidth, carrier frequency, power vs. time, and others.
GettingAcquaintedwithYourInstrument
RF Scout Quick Start User Manual 23
Page 40

Getting Acquainted with Your Instrument
The Parameter Entry Controls
The Parameter Entry controls (keypad and knob) let you enter or change numeric values in selected fields. You can use either tool
to enter or change a value.
Element Description
The input control field shows the label for the field and the current value of the selected field
or object.
Tapthekeypadbuttontodisplayakeypadinwhichtoenteravalueintheselectedfield. The
keypad content changes to show the available entry functions for the selected item.
The knob control lets you scroll through and select from all available values.
1. Drag the knob circle left or right to quickly scroll through all available values and select a value.
2. Tap the arrows on the top half of the knob icon to step the value in large increments. The
increment value depends on the value type (channel or freq uency).
3. Tap the arrows on the bottom half of the knob icon to step the value in single unit increments.
24 RF Scout Quick Start User Manual
Page 41

Getting Help
The application includes a comprehensive Online help system. You access Online help using the following methods:
Online help element Description
Contents Index Online help Content and Index links. Every Online help topic includes a Contents and Index link.
GettingAcquaintedwithYourInstrument
Help bu tton. Located at the top right of the screen, this button is available all the time. Tap this
button to display a help topic that is relevant to the current measurement screen.
If the current screen is not context-sensitive, the application opens the Online help at the main help
menu. Use the index link, or do a word search, to locate specific information .
Help link text. On measurement screens, underlined blue text is help link text. Bold help link text at
the top of a measurement scre en opens a topic describing how to take that measurement. Help
link text that is located next to a measurement or setting opens a topic relevant to that particular
measurement or setting.
If the topic does not contain the information you were seeking, use these links to locate specific
information.
Tab or dialog box help button. This button is displayed at the bottom of many setu p tabs or dialog
boxes, and opens an Online help topic relevant to that tab or dialog box.
RF Scout Quick Start User Manual 25
Page 42

Operating Basics
Operating Basics
Setting Up to Take a Measurement
Perform the following steps to set up the instrument to take a measurement. These steps apply for most types of measurements.
1. Connect a signal to the instrument.
2. Tap t h e Signal Standard List arrow button
to ope n the signal standard list.
3. Tap a signal standard to select it. This
signal standard is used for measurements
until you change to a different signal
standard. (See page 12, Enabling Signal
Standards.)
4. Tap the appropriate signal Uplink or
Downlink button for the measurement that
you are taking.
26 RF Scout Quick Start User Manual
Page 43

Entering a Channel:
NOTE. You only need to enter a channel or a frequency; you do not need to enter both values.
5. Tap the Channel button to open the
keypad.
6. Enter a channel number.
7. YoucanalsotaptheList button to display
a list of available channels from which
to select a value. Chann el numbers are
defined by the current signal standard.
If there is a corresponding frequen cy for the
entered channel number, the instrument
displays that frequency in the Freq (MHz)
field.
If you enter a channel num ber outside the
valid range, the instrument sets the channel
number to the closest valid number.
Operating Basics
8. Tap OK to close the keypad or channel list
and set the channel value.
RF Scout Quick Start User Manual 27
Page 44

Operating Basics
Entering a Frequency:
NOTE. You only need to enter a cha nnel or a frequency; you do not need to enter both values.
9. Tap th e Freq (MHz) button to open the
keypad.
10. Use the keypad to enter a frequency value.
This sets the center frequency of the
measurement.
If there is a corresponding chann el number
for the entered frequency, the instrument
displays that channel number in the
Channel field.
11. Tap a frequency unit button (such as GHz
or MHz) to close the keypad and set the
frequency value.
28 RF Scout Quick Start User Manual
Page 45

Selecting a Measurement Mode:
12. Tap a measurement mode button. (See
page 23, The Measurement Mode Buttons.)
13. For Spectrum and Channel measurements,
select the tab of the measurement that you
want to take.
14. For Signal measurements, tap the Select
Measurement button, then tap the
measurement t hat you want to take.
Operating Basics
RF Scout Quick Start User Manual 29
Page 46

Operating Basics
Setting Additional Measurement
Parameters:
15. Tap the Edit button to open the Setup
dialog box.
16. Tap the tab of the measurement parameters
that you w ant to set.
17. Select or enter the measurement parameter
values.
18. Tap OK toclosetheSetupdialogbox
and enable the measurement parameter
settings.
30 RF Scout Quick Start User Manual
Page 47

Spectrum Measurements
Displaying a Spectrum Waveform
1. Set the instrument to measure a signal of
interest.(See page 26, SettingUptoTakea
Measurement.)
2. Tap t he Spectrum Measurement button.
3. Tap th e Spectrum tab.
4. Tap th e AutoLevel button.
Operating Basics
RF Scout Quick Start User Manual 31
Page 48

Operating Basics
5. Set spectrum display parameters.
Available spectrum parameters include
the frequency span, resolution bandwidth
(RBW), signal attenuation value, graph
reference and division values, start and
stop frequencies, and marker positions.
32 RF Scout Quick Start User Manual
Page 49

Operating Basics
6. For example, to change the graph
reference and division values, tap the Ref
Lvl field or the Vertical Scale field to select
it.
7. Use the Parameter Entry co ntrols to enter
or change the scale setting.
8. Use Markers to take measurements on
a waveform. (See page 34, Spectrum
Waveform Markers.)
NOTE. Tap th e Edit buttontoopentheSetup dialog box and set additional measurement parameters. Available parameters
depend on the current signal standard and measurement type. Not all measurements have setup parameters.
RF Scout Quick Start User Manual 33
Page 50

Operating Basics
Spectrum Waveform Markers
Markers are visual icons that you position on a spectrum waveform to measure signal frequency and level values. You use the
markers to measure the value at a particular p oint on a waveform (Absolute Marker Values), or measure the difference between two
markers (Delta Marker Values). The markers follow the waveform level changes.
Each marker icon has an associated marke r readout, displayed at the bottom of the Spectru m display. The marker readout shows
the marker icon symbol, the marker name, and the freque ncy and level values for the marker.
There are a maximum of seven markers available; the Trace marker (Tra), and M1 through M6. The Tra marker changes the
measurement frequency to the location you s elect on the waveform. The M1 through M6 markers read the waveform frequency and
level at the location they are placed. Tra, M1, and M2 markers are shown by default.
TurningMarkersOnandOff.
1. Tap View.
2. Tap Markers to turn marker display on or
off.
34 RF Scout Quick Start User Manual
Page 51

Selecting Which Marker Readouts to Display.
1. Select View > Marker Setup... to display
the Markers dialog box.
2. Tap to enable or disable individual markers
and set the marker mode:
On enables or disables the selected
marker.
Front Trace places the marker on the fron t
trace.
Trace 1 and Trace 2 keep the m arker on
the specified trace regardless of which
trace is in front. Use this mode to compare
two waveform traces.
Operating Basics
RF Scout Quick Start User Manual 35
Page 52

Operating Basics
3. Tap OK. The instrument sho ws the center
frequency readout plus three marker
readouts at a time (in Absolute Marker
Readouts mode) o r the center frequency
readout plus two marker readouts at a time
(in Delta Marker Readouts m ode).
4. Tap the marker readout scroll buttons
to scroll through the enab led marker
readouts.
36 RF Scout Quick Start User Manual
Page 53

Setting the Marker Measurement Mode.
1. Tap View.
2. Tap Delta Marker Read outs to enable
marker readouts to display the difference
(delta) between the freq uency and level
values at marker M1 and the other markers.
While in Delta Marker Readouts mode, all
marker readouts are relative to marker M1.
3. Tap Abso lute Marker Readouts to enable
marker readouts to display the actual
frequency and level values of the signal at
the marker position on the waveform.
Operating Basics
RF Scout Quick Start User Manual 37
Page 54

Operating Basics
Add or Move a Marker on a Waveform.
1. Tap View.
2. Tap Measurem ent Frequency Cursor.
3. Tap the marker readout of the marker that
you w ant to add or move on the spectrum
waveform. The marker readout border
darkens to indicate that it is selected.
4. Tap the waveform where you want to add
or move the marker. The marker is placed
on the wave form and the readout shows
the signal values at the new location.
5. Use the Parameter Entry controls to
fine-tune the position of the marker on the
waveform.
38 RF Scout Quick Start User Manual
Page 55

Operating Basics
Comparing Spectrum Waveforms (Traces)
You can compare two live waveforms (derived from the single RF input signal), the R F input signal waveform and a saved
waveform, or two saved waveforms.
Selecting Waveform Traces.
1. Tap th e Traces button to toggle between
Trace 1 and Trace 2.
RF Scout Quick Start User Manual 39
Page 56

Operating Basics
Comparing Live and Saved Waveform Traces.
1. Set the instrument Spectrum parameters
to display the waveform of interest. (See
page 31, Spectrum Measurements.)
2. Tap t h e Traces button to select Trace 1.
3. Tap th e Trace 1 list button and then tap
a trace type to select it. The instrument
applies the selected operation to the input
signal and displays the results as the trace
1 waveform.
4. Tap t h e Traces button to select Trace 2.
40 RF Scout Quick Start User Manual
Page 57

5. Tap th e Trace 2 list button and then tap
a trace type to select it. The instrument
applies the selected operation to the input
signal and displays the results as the trace
2 waveform.
The figure shows Trace 1 as an Normal
waveform and Trace 2 as a Min Hold
waveform. You can use markers to make
measurements between the waveforms.
6. To compare a saved waveform to a live
waveform, tap the Trace 2 list button and
then Saved. The instrument opens the
Trace 2 & Mask setup tab.
7. Tap Saved Trace.
8. Tap th e Browse button to navigate to and
select the saved waveform to open.
9. Tap OK. The instrument displays the saved
waveform a s the Trace 2 waveform.
Operating Basics
NOTE. The current instrument measurement settings must match the instrument settings used to capture the saved waveform in
order to compare both waveforms.
RF Scout Quick Start User Manual 41
Page 58

Operating Basics
Comparing Two Saved Waveform Traces.
NOTE. Waveform traces are saved with the settings in effect at the time the trace is saved. When a saved trace is displayed, the
stored settings values are shown for reference, though no actual instrument settings change. As soon as you ta p the Run button to
return to making new acquisitions, the display settings are restored to what they were before the saved trace was opened.
1. Select File > Compare Saved.
2. Navigate to and select the first waveform
file to load.
3. Tap OK to open the Select second result
file to compare dialog box (it looks exactly
thesameasthefirst dialog box).
42 RF Scout Quick Start User Manual
Page 59

4. Navigate to and select the second
waveform file to load.
5. Tap OK to enter the second file and close
the dialog box. The instrument displays
both waveforms.
6. After viewin g the waveforms, tap the Run
button to return the instrument to taking
measurements.
Operating Basics
RF Scout Quick Start User Manual 43
Page 60

Operating Basics
Display a Spectrogram
A spectrogra m shows how the signal level changes over time. It can be very useful in identifying intermittent signals.
1. Set the instrument to display the spectrum
waveform of interest.(See page 31,
Displaying a Spectrum Waveform.)
2. Tap the Spectrogram tab.
3. Tap th e Updates bu tton to display a
dialog box where you can change the
spectrogram measurement update rate,
and enable automatic saving of data
when a screen is full (80 data record
acquisitions).
4. The Data Record readout shows the
time and date stamp o f the spectrogram
record located at the record cursor (white
horizontal line). To change the record
cursor position, tap the Data Record field
and use the keypad or knob to move the
record cursor.
44 RF Scout Quick Start User Manual
Page 61

5. TaptheSplitScreenbuttontoswitch
between a full-screen spectrogram display
and a split spectrum and spectrogram
display.
Operating Basics
RF Scout Quick Start User Manual 45
Page 62

Operating Basics
Locating the Direction of a Signal
1. Connect a directional antenna to the
instrument.
2. Set the instrument to display the spectrum
waveform of interest. (See page 31,
Displaying a Spectrum Waveform.)
3. Tap the Strength tab.
4. Tap the trace of the interfering signal to
set the measurement frequency. You
can use the keypad or knob to adjust the
measurement frequency.
5. Point the d irectional antenna in different
directions. As you change the direction of
the antenna, the audible tone and beep
(if selected), a nd the Strength bar graph
change to indicate signal strength. The
signal of interest is located in the direction
that results in the strong est signal.
6. Tap Fast Update to improve audio tone
response, at the expense of a reduced
screen update rate.
46 RF Scout Quick Start User Manual
Page 63

Listening to the Audio Content of a Signal
1. Set the instrument to display the spectru m
waveform of interest. (See page 31,
Displaying a Spectrum Waveform.)
2. Tap th e Audio tab.
3. Tap the trace of the interfering signal to
set the measurement frequency. You
can use the keypad or knob to adjust the
measurement frequency.
4. Tap the different Demodulation types and
listen to the resultant audio (if any). A
station ID can be p articularly helpful when
the interfering signal is a rad io or broadcast
television station. You may also be able
to d iscriminate between possible sources
by listening to the characte ristic sounds
of paging, video, control signals or the
harmonics of other common signals.
Operating Basics
RF Scout Quick Start User Manual 47
Page 64

Operating Basics
Taking a Noise Floor Measurement
Noise floor measures all the RF Power coming into the receive antenna within the frequency band of the selected channel. The
noise floor is the power integrated across the selected chan nel. To make an accurate measurement, you must measure the noise
floor on a disabled channel (a channel that is not carrying live traffic).
1. Connect a signal from a BTS receiver t est
port to the instrument.
2. Set the instrument to display the spectrum
waveform of interest. (See page 31,
Displaying a Spectrum Waveform.)
3. Tap t he Reverse (up) link button.
4. Tap th e Noise tab.
5. Tap the trace of the interfering signal to
set the measurement frequency. You
can use the keypad or knob to adjust the
measurement frequency.
48 RF Scout Quick Start User Manual
Page 65

Channel Measurements Mode
Channel measurements mode includes measurements for Code Power, Codograms, EMF, Channel scanners, and Scrambling/Sync
Code An alyzers. Code Power and Codogram are also available in the Signal measure m ents mode.
Taking a Channel Measurement
The following procedure assumes that you have already set up the measurement. (See page 26, Setting Up to Take a
Measurement.)
1. Tap th e Channel Measurement button.
2. Tap the tab of the measurement that you
want to take. The active signal standard
determines the available measurements.
Operating Basics
RF Scout Quick Start User Manual 49
Page 66

Operating Basics
3. Tap available measurement parameters
and use the Parameter Entry controls to
set measurement parameter values.
4. Tap th e Edit button to open the Setup
dialog box and set additional measurement
parameters in the dialog box tabs.
Available parameters depend on the
current sign al standard and measurement
type. Not all measurements have se tup
parameters.
50 RF Scout Quick Start User Manual
Page 67

Operating Basics
1xEV-DO and cdma2000 PN Scanner Tadd/Tdrop Markers
Tadd and Tdrop are horizontal markers that you can set on 1xEV-DO and cdma2000 PN Scanner measurements to visually
indicate add or drop signal power levels. Using these markers lets you quickly identify PN codes that are within defined add or
drop ranges. The Tadd/Tdrop horizontal markers are visual aids only, and do not cause the instrume nt to display warnings
when signals are above or below the set levels.
1. Select View > PN Scanner Tadd/Trop
Markers to display the markers on the
scanner measurement graph.
2. Tap the Tadd or Tdrop readout and use
the keypad or knob control to change the
marker level value .
See the Online help topic Take a Scan Measurement for information on scanner measurements.
RF Scout Quick Start User Manual 51
Page 68

Operating Basics
Creating Custom Scanner C ode Labels
The Scanner Code Label Editor lets you add unique labels to the graphs of 1xEV-DO/cdma2000 PN offset and W-CDMA scrambling
code scanners. Once you have created labels, tapping a bar graph of a PN offset or scrambling code displays the label assigned to
that PN offset or scrambling c ode, directly below the graph. Using labels lets you quickly identify the source of a particular code.
1. Select View > PN Offset Labels or
View > Scrambling Code Lab els to
enable viewing scanner labels on the
scanner measurement graph.
2. Tap a bar graph plot to display the
custom label assigned to that PN offset or
scrambling code.
See the Online help topic Scanner Code Labels Overview for information on creating, saving and using custom scanner code labels.
52 RF Scout Quick Start User Manual
Page 69

iMap Measurement Mapping Mode
iMap integrates interference mapping, coverage mapping, in-building mapping, outdoor mapping, and provides an integrated
solution for field interference and coverage problems in one instrument.
Using iMap is as eas y as selecting a measurement and touching the displayed map where you want the measurement to be placed.
Measurement icons are color coded to indicate if the measurements have passed or failed limit tests. You can also add a direction
arrow to a measurement to indicate the direction the antenna was p ointing when you took a measurement.
You can load scanned bitmap files as maps for in-building mapping, or use GSF and MIF map file formats for outdoor maps.
Using GSF or MIF map files lets you use a connected GPS receiver (su ch as the Tektronix YBGPS1 GPS Timing Reference) to
automatically place measurements at your current location.
You c a n save maps and associated measurement results data to common file formats such as CSV or MapInfo. Saving maps
and measurement results lets you analyze measurement data (position, value, and direction) and prepare reports to help r esolve
interference problems.
1. To start the iMap tool, tap the iMap button.
When you open the iMap tool for the first
time, the screen displays the message No
map loaded. Otherwise, iMap displays the
last-loaded map.
Operating Basics
RF Scout Quick Start User Manual 53
Page 70

Operating Basics
Map File Concepts
The iMap too l uses two types of maps; Grid and Image.
Grid Maps. Grid maps have geophysical latitude and longitude coordinate references embedded in the map file. RF Scout uses
grid maps, along with an active GPS rec eiver, to place measurements on a map at your current geophysical position. RF Scout can
load both GSF- and MIF-format grid map files. You need to convert non-GSF or MIF grid maps to GSF format before you can load
them into the iMap tool. The iMap Converter program also lets you create grid maps from image files, the Google Earth application,
or the Microsoft MapPoint application. (See page 67, The iMap Converter Program.)
Grid maps require an active GPS receiver to correctly link measurements to geophysical map locations. An a ctive GPS receiver is a
receiver that is locked to four or more satellite signals and is providing the RF Scout with accurate GPS location data. If you load a
grid map and a GPS receiver is either not connected or does not have a goo d satellite signal lock, the instrument considers the
grid map as an image map.
Image Maps. Image maps do not have any geophysical latitude and longitude references embedded in the map file. A n image
map is a graphical image, such as a scanned building floor plan or aerial photograph, to which you can attach measurements at
the point where you tap the screen.
Converting Files to Maps. The iMap C onverter, a program that is downloadable from the Tektronix Web site, lets you convert
image files (BMP, JPEG, GIF, TIFF or PNG file) into GSF format image map files, convert image filestogridmaps,andcreategrid
maps from Google Earth or Microsoft MapPoint applications. (See page 67, The iMap Converter Program.)
54 RF Scout Quick Start User Manual
Page 71

LoadingaMapintoRFScout
You need to load a map before you can use the RF Scout iMap tool.
1. With iMap open, select File > Load Map.
2. Navigate to and select the map file to load
(Bitmap, GSF or MIF format).
3. Tap Open. The iMap application loads the
maponthescreen.
Operating Basics
RF Scout Quick Start User Manual 55
Page 72

Operating Basics
Mapping a Measurement
The following procedure requires that you have already set up the measurement. (See page 26, Setting Up t o Take a
Measurement.) You must have also loa ded a map file. (See page 55, Loading a Map into RF Scout.)
1. Tap t h e Single Measurement b utton.
2. Tap an iMap me asureme nt button.
Available measurements depend on
the current signal standard. Th e
selected measurement is displayed in the
Measurement Thumbnail area.
56 RF Scout Quick Start User Manual
Page 73

3. Tap the map:
If a connected GPS receiver is active,
andyouareusingagridmap,a
single measurement is placed at the
current GPS latitude and longitude
coordinates.
If a GPS receiver is not active, or if
youareusinganimagemap(such
as a building floor plan), a single
measurement is placed where you
tapped the map.
4. You can select a different measurement
button, and then tap the map to add a
new measurement to the map. Multiple
measurement icons at the same location
stack on top of each other.
Operating Basics
RF Scout Quick Start User Manual 57
Page 74

Operating Basics
5. To move an icon, tap the Select button
andthentouchanddragtheicontoa
new position. If the measurement was
part o f a stack of measurements (such as
measurements created by a macro), then
iMap move s the topmost icon in the stack.
If the icon is moved to a new stack of
measurements, then th e icon is placed in
the stack in time-of-measurement order.
NOTE. To add measurement s at a new location on a grid map with an active GPS receiver, you must physically move to the
new location.
NOTE. You can move measurement icons on an image map, or on a grid map with the GPS receiver inactive. Attempting
to move an icon on a grid map with an active GPS receiver causes iMap to drag the map and its measurement icons to a new
position on the screen; the measurement icons are not moved.
When a GPS receiver is not active, you can move any measurement icon. This includes moving measurement icons that were
placed on the map while in GPS mode. iMap does not reposition moved GPS-related measurement icons back to their original
geophysical position on a map when the GPS receiver is active.
58 RF Scout Quick Start User Manual
Page 75

Operating Basics
iMap Measu rement Icons
The iMap application uses icons on the map to represent a measurement taken at that location. There are three types of
measurement icons: large, small, and flag. The large and small icon s have individu al icon graphics for each measurement type that
they rep resent. The flag icon is a simple small flag, and is used for all measurement types. See the RF Scout Online help topic
iMap Measurement Map Icon Types for more information.
To select which type of measurement icon to display on a map, tap the View menu item and select the icon type to use. All
current icons on the map are changed to the selected icon type.
You can set the measurement icons to color their border to indicate the signal or measurement range value (from Best to
Unacceptable). Setting the icon border color lets you quickly evaluate the relative value of a measurement. To set icon color
ranges, tap Tools > iMap Measurement S ettings. See the RF Scout Online help topic Setting The iMap M easurement Icon
Colors for more information.
You can perform various actions on measurement icons, including view the measurement results of an icon, move the icon, delete
the icon , and attach a measurement direction arrow to an icon. See the following sections, and the RF Scout Online help topic
View Ma p Measuremen ts, for more information.
RF Scout Quick Start User Manual 59
Page 76

Operating Basics
Viewing and Deleting Icon Measurements
To view or delete the measurement results associated with an iMap measurement icon:
1. Tap the iMap Select mode button.
2. Tap a measurement icon to open the Map
Measurements dialog box.
3. Tap the measurement of interest in the list.
4. Tap Open to open the measurement
screen for the selected measurement.
Then tap the iMap button to return to the
iMap screen.
5. To delete the selected measurement, tap
the Delete button If there are multiple
measurements that you want to delete,
repeatedly tap Delete.
6. Tap OK to close the dialog box.
NOTE. You can also double-tap on a measurement icon to open the measure m ent window for that measurement. If there are
multiple measure m ents at a location, double-tapping an icon displays the results for the measurement icon that is at the top of
the list.
To delete all the measurement icons from a map, select File > Clear All Measurements.
60 RF Scout Quick Start User Manual
Page 77

Operating Basics
Draw a Measurement Direction Arrow
The iMap direction arrow function lets you draw an arrow on a mapped measurement icon. You can use the arrow to indicate the
direction your antenna was pointing when you took a measurement.
1. Tap t he Measurement Direction button.
2. Tap and drag from the center of a
measurement icon in the direction
the antenna was pointing when the
measurement was made. iMap draws an
arrow from the measurement icon.
3. To change the arrow direction, draw a new
line. iMap replaces the existing arrow with
the new direction arrow.
RF Scout Quick Start User Manual 61
Page 78

Operating Basics
Delete a Measurement Direction Arrow
1. Tap the iMap Select mode button.
2. Single-tap the measurement icon with the
direction arrow to delete. iMap opens the
Map Measurements dialog box.
3. Tap the measurement name that has the
direction arrow to delete.
4. Tap t he Remove Arrow button.
5. Tap OK. iMap closes the dialog box and
deletes the direction arrow.
62 RF Scout Quick Start User Manual
Page 79

Operating Basics
Logging iMap Measurements (Automatic Measurements)
Logging measurements lets you automatically map a single m e asurement at a set time interval or change in GPS position (with
active GPS receiver and a grid map).
NOTE. The iMap tool only maps completed measurement results. If the specified time interval is less than th at required to take a
measurement, iMap ignores the spe cified time interval and maps results as soon as the measurement acquisition is done.
For example, if the instrument requires 20 seconds to take a measurement, but the time interval is set to 10 seconds, then
the instrument maps results every 20 seconds.
1. Tap a measurement button. Available
measurements depend on the current
signal standard.
2. Tap th e Log Measurements button.
RF Scout Quick Start User Manual 63
Page 80

Operating Basics
3. Select the type of repeat measurement
to take (time interval or distance between
measurement positions).
4. Tap OK to return to the mapping screen.
5. Tap the map to start logging measurements:
ForgridmapswithanactiveGPS
receiver, tap the map at any point.
The instrumen t begins adding
measurement flags to the map at the
current GPS position.
For image maps o r for grid maps
withoutanactiveGPSreceiver,tap
the map at the measurement starting
location. The instrument begins taking
measurements, but does not display
them on the map until measurement
logging is done.
64 RF Scout Quick Start User Manual
Page 81

6. Tap the map to stop measurements:
ForgridmapswithanactiveGPS
receiver, tap the map at any position.
For image maps or grid maps without
an active GPS receiver, tap the map at
the position the last measurement was
taken. Measurements are then evenly
spaced on a straight line between the
start and stop map points.
7. Tap th e Single Measurement or the Select
button to exit the logging measurements
mode.
Operating Basics
RF Scout Quick Start User Manual 65
Page 82

Operating Basics
NOTE. The iMap Log measurements function a utomatically sets the map view measurem ents mode to Measurement Flags during
logging measurement acquisition. When iMap measurement logging is done, the instrument restores the map view measurements
mode to the mode it was at before the iMap measurement logging was initiated.
If you tap the Select, Measurement Direction,orSingle Measure ment button while logging measurements in non-GPS mode,
iMap cancels the log measurements mode and does not draw any measurement icons on the map.
Grid maps with an active GPS receiver support logging measurements by time interval or distance change interval. Image maps, or
grid maps with an inactive GPS receiver, support logging measurements by time intervals.
You cannot place a measurement icon on any area of the map that is covered by a message banner or by the zoom and pan controls.
iMap Measu rement Macros
iMap has the capability to use a macro file to take a set of sequential measurements with one operation, inste ad of selecting and
running individual measurements one at a time. Each macro file measurement can be unique, including measurements for different
channels, measurement settings, and signal standards. You create a macro file by using the iMap Macro Editor tool. You then load
the macro file into the instrument, and enable the macro to run with the Macro button on the iMap tool bar.
To open the iMap Macro Editor, select Tools > iMap Macro Editor. S ee the RF Scou t Online help topic Mapping Measurements
Using Macros for complete information on creating, saving, loading, and running iMap measurement macros.
66 RF Scout Quick Start User Manual
Page 83

Operating Basics
The iMap Converter P rogram
Tektronix provides a map file conversion program called iMap Converter that you can download from the Tektronix Web site. iMap
Converter lets you convert graphical image files or map files to GSF-format files for use with the instrument iMap tool. Types
of images or files that you c an convert include:
Bitmap, JPEG, GIF, TIFF and PNG graphical images (map images, building floor plans, aerial photographs)
Industry standard MapInfo Interchange Format (MIF), ArcInfo Shape (.shp), USGS Digital Line Graph (.opt) geophysical
coordinate maps
Other iMap Converter features include:
Easily captu re images from Google Earth or Microsoft MapPoint to create geophysical (coordinate) map files for use with
GPS measurement mapping
Manually assign geophysical coordinates (latitude/longitude) to image files, such as building floor plans or screen capture map
images, to create a grid map for use with GPS measurement plotting
Combine multiple coordinate map files (other than GSF) into a single large map file
To install the iMap Converter program on a PC:
1. Go to the Tektronix Web site (www.tektronix.com).
2. Click Software Downloads on the left side of the screen open the Software Downloads Web page.
3. Enter imapconverter (single word) in the Search by keyword field and click Go.
4. Select the iMap Converter link to download the software. Follow the installation instructions on the download page.
5. To open the iMap Converter tool on the PC, select Start > Programs > Tektronix > iMapConverter.
RF Scout Quick Start User Manual 67
Page 84

Operating Basics
6. Click the iMap Converter Help button for information on how to use the tool to convert files, add coordinates to an image file,
or create maps from Google Earth or Microsoft MapPoint.
NOTE. Bitmap files that are converted to GSF-forma t load faster on the instrument because the instrument does not have to do the
bitmap-to-GSF conversion in the instrument. However, it is then possible to confuse image GSF maps with grid (coordinate) GSF
files. Use a file naming convention to differentiate between GSF maps created from coordinate maps and GSF maps created
from bitmap files that do not have coordinate information.
NOTE. The MIF-format files take significantly longer to load than the GSF-format files. Tektronix recommends that you use iMap
Converter to convert MIF map files to GSF map files, rather than loading MIF files directly on the instrument.
68 RF Scout Quick Start User Manual
Page 85

Signal Measurements
Taking a Signal Measurement
Signal measurements include RF channel power, peak/average, carrier frequency, occupied bandwidth, signal quality, code power,
codograms, and pilot power. Available measurements depend on the current signal stan dard.
1. Set the instrument to measure a signal of
interest.(Seepage26,Setting Up to Take
a Measurement.)
2. Tap th e Signal Measurement button.
3. Tap th e Select Measurement button to
open the Select Signal Standard and
Measurement dialog box.
4. Tap the measurement button for which
you want to take measurements.
The instrument opens the selected
measurement screen.
Operating Basics
RF Scout Quick Start User Manual 69
Page 86

Operating Basics
5. Make any ne cessary setting changes on
the measurement screen (if available). For
example, the cdma2000 Signal Quality
measurement lets you select the signal
type to use for measuring Signal Quality
(Pilot only or Auto detect active codes).
6. Tap th e Edit button to open the Setup
dialog box and set additional measurement
parameters in the dialog box tabs.
Available parameters depend on the
current sign al standard and measurement
type. Not all measurements have se tup
parameters.
70 RF Scout Quick Start User Manual
Page 87

Specifications
This section lists the electrical, environmental, and physical specifications of the RF Scout Interference Hunter. All specifications
are guaranteed unless labeled “typical”. Typical specifications are provided for your conv enience and are not guaranteed.
Table 1: General characteristics
Characteristic Description
RF Input
Input Frequency Range 30 MHz – 2500 MHz
Input Impedance
Signal Amplitude for
Modulation Measurements
Signal Amplitude for
Spectral Display, typical
Input Overload Detect >1 W (+30 dBm) CW or peak envelope power
Maximum Input Power
without Damaging
Instrument
Coupling AC for all measurements and spectral display m odes
Specifications
50 ohms (nominal)
–50 dBm to +30 dBm for CW-like or peak envelope power
Measurements may be outside this range but accuracy is not guaranteed
CW or peak envelope power:
–144 dBm to +30 dBm, 200 MHz to 2.0 GHz
–142 dBm to +30 dBm, 2.0 GHz to 2.2 GHz
–139 dBm to +30 dBm, 2.2 GHz to 2.5 GHz
Levels apply when using 100 Hz resolution band width
50 W CW or peak envelope power
RF Scout Quick Start User Manual 71
Page 88

Specifications
Table 1: General characteristics (cont.)
Characteristic Description
External Frequency
Reference Input
Maximum Working Voltage
Spurious Input Signals To meet modulation measurement specifications:
Impedance
Input Connector 50 ohm BNC
Frequency Range
Level Range –15 dBm to +15 dBm
15 V (DC + peak AC)
(Total power of interest - Total power in spurious) > 35 dB
or
| Center frequency of signal of interest - center frequency of s puriou s signal | > 1.4 MHz
and
(Total power of interest - Total power in all spurious) ≥ –3 dB
1500 ohms (nominal)
Anymultipleof1MHzupto15MHzinclusive,±1ppm
Any multiple of 1.2288 MHz up to 19.6608 MHz inclusive, ± 1 ppm
2.048 MHz ± 1 ppm
4.8 MHz ± 1 ppm
dBm levels assume 50 ohm source
72 RF Scout Quick Start User Manual
Page 89

Table 1: General characteristics (cont.)
Characteristic Description
Maximum Input Level
without Damage
Coupling AC
Working Voltage
Lock Time < 15 seconds
Timing Input
Impedance
Minimum High Threshold 2.0 V
Maximum Low Threshold 0.8 V
Minimum High Time 10 ns
Minimum Low Time 10 ns
Maximum Input Level
without Damage
Coupling DC
Timing Error ± 10 ppm
± 3 V peak continuous
3 V (DC + peak AC)
10 kΩ
± 5 V peak continuous
Specifications
RF Scout Quick Start User Manual 73
Page 90

Specifications
Table 1: General characteristics (cont.)
Characteristic Description
Internal Time Base
Characteristics
Signal Path Characteristics
Error
Phase N oise
Noise Figure 1 kHz resolution bandwidth:
Displayed Average Noise
Level (DANL), typical
± 0.5 ppm drift from 0 °C to 50 °C
± 1.0 ppm aging/year
Ten minute warm-up period required to meet accuracy specification.
Users can connect the External Reference input to a frequency source and obtain a user
correction value. This value will be used to correct time base errors in measurements to
the accuracy of the external reference. The internal time base will continue to drift with
temperature and age as specifi ed above.
≤ –75 dBc/Hz @ 20 kHz carrier offset
≤10 dB, 200 MHz to 2000 MHz
≤12 dB typical, 2000 MHz to 2200 MHz
≤15 dB typical, 2200 MHz to 2500 MHz
10 Hz RBW: –152 dBm, 200 MHz to 2000 MHz
100 Hz RBW: –145 dBm, 200 M Hz to 2000 MHz
1 kHz RBW: –135 dBm, 200 MHz to 2000 MHz
74 RF Scout Quick Start User Manual
Page 91

Table 2: Measurement characteristics
Measurement Description
External
Attenuation
Code Domain
Power (cdmaOne,
cdma2000,
W-CDMA)
Units dB relative to Pilot Power or Total Power
Resolution 0.1 dB
Accuracy
User Selectable ON/OFF
Attenuation=–30dBto+80 dB
Measures the power in each of the Walsh codes (64 in cdmaOne, 128 in cdma2000) used in a CDMA
signal.
Measures the power in each of (up to 512) OVSF codes used in a W-CDMA signal.
cdmaOne and cdma 2000: ± 1 dB code domain power level > –20 dB relative to total power, using the
recommended TIA/EIA-IS-97-D pilot level of –;7.0 dB (20%) relative to total power.
W-CDMA: ± 1 dB Code domain power level > –20 dB relative to total power, using W-CDMA 3GPP
Test Model 3 .
Reference information: ± 2.5 dB for –27 dB < CDP < –20 d B relative to total power in band classes
0-6 (cdmaOne, cdma2000).
± 2.5 dB for –27 dB < CDP < –20 dB relative to total power (W-CDMA).
Specifications
RF Scout Quick Start User Manual 75
Page 92

Specifications
Table 3: Spectral analysis
Characteristic Description
Measurement
Frequency
Frequency Span Sets the frequency range covered by the sp ectral display.
Resolution Bandwidth
(RBW)
Sets the measurement frequency of the display. The me asurement frequency can be set by either
entering a specific frequency or by selecting a channel number.
Units
Resolution 1 kHz 1 channel
Range 30 MHz to 2500 MHz
Units
Resolution 1 kHz
Range 10 kHz to 2470 MHz, continuously variable or 1-2-5 steps
Units
Resolution Uses 1-3 steps to cover the range
Range 10Hzto6MHz
MegaHertz (MHz) or Channel Number
kiloHertz (kHz), MegaHertz (MHz)
Width of the resolution bandwidth filter
Hertz (Hz), kiloHertz (kHz), MegaHertz (MHz)
When in Auto mode, the instrument automatically sets the RBW. T he RBW is set as a combination
of 1-3 s teps at the 1, 2, 5 span settings, and a linear range between 1, 2, 5 span settings, for
a nominal value of approximately span/125.
76 RF Scout Quick Start User Manual
Page 93

Table 3: Spectral analysis (cont.)
Characteristic Description
Reference Level The power level indicated by the top line of the spectral display
Units dBm
Resolution 1 dBm
Range –100 dBm to +30 dBm
Spectral Display
Amplitude
Units
Resolution 0.1 dB
Accuracy ± 1.25 dB, –20 dBm to +30 dBm
dB relative to Reference Level
± 2.0 dB, –80 dBm to –20 dBm
± 2.75 dB, –120 dBm to –80 dBm
± 5 dB –134 dBm < Input < –120 dBm, typical
Accuracy specifications apply only for spans less than 1000 MHz and to CW-like signals.
Specifications
RF Scout Quick Start User Manual 77
Page 94

Specifications
Table 3: Spectral analysis (cont.)
Characteristic Description
Vertical Scale Factor
Units 1 dB to 10 dB in 1 dB increments
Display M odes Normal: updates display with each new result
Max Hold: updates displayed point only if new point > old point
Min Hold: updates displayed point only if new point < old point
Max/Min Hold: displays a bar between Max Hold and Min Hold
Average: displays average of N (specified by user) results
Reference information: Average is calculated as follows: The last N values are saved in memory;
when a new result is available, the earliest result of the N stored values is discarded, the new
average is calculated from the stored values. If the number of results is less than N, then all of
the results are averaged together.
Number of Averages
Spurious Free
Dynamic Range
(external signal
related)
1 ≤ N ≤ 99
IM3 better than –70 dBc typical, 100 MHz to 2500 MHz
2nd Harmonic better than –60 dBc, typical
78 RF Scout Quick Start User Manual
Page 95

Table 3: Spectral analysis (cont.)
Characteristic Description
Residual Spurious
Signals
–125 dBm at BTS Rx frequencies (776–794, 806–849, 872–940, 1453–1465, 1525–1549,
1710–1785, 1840–1910,1920–1980) MHz and GPS fre quencies (L1 1570.3–1580.5, L2
1222.5–1232.8, L5 1171.4–1181.6) MHz
–115 dBm at BTS Tx frequencies (746–764, 832–834, 840–960, 1477–1513, 1805–1880,
1930–1990, 2110–2170) MHz
–95 dBm at frequencies not listed above, except from 1155–1168 M Hz: -20 dBm in spans above
10 MHz, 1155 MHz–1175 MHz
Table 4: Interference analysis characteristics
Characteristic Description
Noise Floor
Measurement
Units dBm
Resolution 0.1 dB
Accuracy ± 3 dB typical
AM Demodulation
Measurement
Frequency
Measures the interference power that is coming into the receiver antenna for any standard.
Measurement defaults to uplink channel when specified by channel number.
Provides an audio output signal after AM demodulation of the user-selected signal to use for
identifying a signal.
30 MHz to 2500 MHz with 1 kHz resolution
Specifications
RF Scout Quick Start User Manual 79
Page 96

Specifications
Table 4: Interference analysis characteristics (cont.)
Characteristic Description
FM Demodulation
Input Signal Level
Measurement
Bandwidth
Audio Output
Bandwidth
Run Time 4 seconds per activation
Measurement
Frequency
Input Signal Level
Maximum Signal
Deviation
Measurement
Bandwidth
Audio Output
Bandwidth
Run Time 4 seconds per activation
–100 dBm minimum
8kHz
4kHz
Provides an audio output signal after FM demodulation of the user-selected signal to use for
identifying a signal.
30 MHz to 2500 MHz with 1 kHz resolution
-100 dBm minimum
Up to 100 kHz
8 kHz, 15 kHz, 75 kHz, 200 kHz; selected by user
4 kHz for Measurement BW = 8 kHz, 15 kHz
15 kHz for Measurement BW = 75 kHz, 200 kHz
80 RF Scout Quick Start User Manual
Page 97

Table 4: Interference analysis characteristics (cont.)
Characteristic Description
Signal Strength Indicator Provides an audio tone and a visual display that vary with the strength of the selected signal.
Measurement
Frequency
Input Sign al Level
Measurement
Bandwidth
Tone Type Variable beep rate, based on signal strength
30 MHz to 2500 MHz with 1 kHz resolution
–110 dBm minimum
Up to 10 MHz, dependent on span setting
Variable frequency tone, based on s ignal strength
Table 5: Scanner characteristics
Characteristic Description
W-CDMA Scrambling
Code An alyzer
Input Signal Range
Units and Resolution Io, Ec: dBm
Detects scrambling codes and pilot channel power levels of received co-channel W-CDMA
downlink signals.
–117 to +30 dBm, typical
Ec/Io: dB
0.1 dB
Specifications
RF Scout Quick Start User Manual 81
Page 98

Specifications
Table 5: Scanner characteristics (cont.)
Characteristic Description
cdma2000 PN Scanner Detects PN Offset, Tau (Timing Error) and Pilot Channel power levels of multiple co-channel
Accuracy Ec:
±2 dB for Ec ≥ –102 dBm and Ec/Io ≥ –12 dB, typical
±3 dB for Ec ≥ –112 dBm and Ec/Io ≥ –14 dB, typical
Display Controls Sort by Power (descending Ec value)
Sort by Scrambling Code (ascending SC index)
Lock (set) current Scrambling Code set
cdmaOne and/or cdma2000 forward link signals.
Input Signa l Range
Units Io, Ec: dBm
Resolution
–120 to +30 dBm, typical
Ec/Io: dB
PN Offset: PN index (0 to 511)
Tau: chips
Ec, Io, Ec/Io: 0.1 dB
PN Offset: 1 PN
Tau: 0.1 chip
82 RF Scout Quick Start User Manual
Page 99

Specifications
Table 5: Scanner characteristics (cont.)
Characteristic Description
Accuracy Ec:
±2 dB for Ec ≥ –95 dBm and Ec/Io ≥ –8 dB, typical
±3 dB for Ec ≥ –110 dBm and Ec/Io ≥ –12 dB, typical
Tau:
0.5 ch ip, of highest power multipath component of each detected PNOS, relative to inp ut timing
reference (ESC or YBGPS1), typical.
Display Controls Sort by Power (descending Ec value)
Sort by PN offset (ascending offset values)
Lock (set) current PN Offset values
1xEV-DO PN Scanner Detects PN Offset, Tau (Timing Error) and Pilot Channel power levels of multiple co-channel
1xEV-DO forward link signals. Up to 10 PN offsets are displayed.
Io: The total received power in the pilot intervals of the signal, within the signal bandwidth
(1.23 MHz).
Ec: The absolute power level of the detected pilot at the indicated PN Offset, in dBm.
Input Signal Range
Units Io, Ec: dBm
–120 to +30 dBm, typical
Ec/Io: dB
PN Offset: PN index (0 to 511)
Tau: chip s
RF Scout Quick Start User Manual 83
Page 100

Specifications
Table 5: Scanner characteristics (cont.)
Characteristic Description
GSM Channel Scanner The GSM channel scanner displays channel power and related information on a maximum of 128
Resolution
Accuracy, typical Ec:
Display Controls Sort by Power (descending Ec value)
Input Signa l Range
Ec, Io, Ec/Io: 0.1 dB
PN Offset: 1 PN
Tau: 0.1 chip
± 2.5 dB for Ec ≥ –95 dBm and Ec/Io ≥ –8 dB
± 3.5 dB for Ec ≥ –110 dBm and Ec/Io ≥ –12 dB
Tau:
±0.5 chip, of highest p owe r multipath component of each detected PNOS, relative to input timing
reference (ESC or YBGPS1)
Sort by PN offset (ascending offset values)
Lock (set) current PN Offset values
GSM forward link signals.
Displays Channel, Frequency, Peak Power, Traffic Type, C/I, and BSIC
The scanner is intended for off-air reception using an antenna, and measures only forward (down)
link signals. This measurement requires that YBT25 0 option GS1 is installed.
–120 to +30 dBm, typical
84 RF Scout Quick Start User Manual
 Loading...