

Page 1

xx
ZZZ
PWRVIEW
Online Help
*P077116500*
077-1165-00
Page 2

Page 3

PWRVIEW
ZZZ
Online Help
w.tek.com
ww
077-1165-00
Page 4

Copyright © Tektronix. All rights reserved. Licensed software products are owned by Tektronix or its
subsidiaries or suppliers, and are protected by national copyright laws and international treaty provisions.
Tektronix products are covered by U.S. and foreign patents, issued and pending. Information in this
publication supersedes that in all previously published material. Specifications and price change privileges
reserved.
TEKTRONIX and TEK are registered trademarks of Tektronix, Inc.
077-1165-00 Printed version of the 076–0386–00 PWRVIEW Online Help, March, 2016.
Contactin
Tektronix, Inc.
14150 SW Karl Braun Drive
P. O . B o x 50 0
Beaverton, OR 97077
USA
For product information, sales, service, and technical support:
g Tektronix
In North America, call 1-800-833-9200.
Worldwide, visit www.tek.com to find contacts in your area.
Page 5

Warranty
Tektronix warrants that this product will be free from defects in materials and workmanship for a period of
one (1) year from the date of shipment. If any such product proves defective during this warranty period,
Tektronix, at its option, either will repair the defective product without charge for parts and labor, or will
provide a rep
by Tektronix for warranty work may be new or reconditioned to like new performance. A ll replaced parts,
modules and products become the property of Tektronix.
In order to obtain service under this warranty, Customer must notify Tektronix of the defect before the
expiration of the warranty period and make suitable arrangements for the performance of service. Customer
shall be responsible for packaging and shipping the defective product to the service center designated by
Tektronix, with shipping charges prepaid. Tektronix shall pay for the return of the product to Customer if
the shipment is to a location within the country in which the Tektronix service center is located. Customer
shall be r
to any other locations.
lacement in exchange for the defective product. Parts, modules and replacement products used
esponsible for paying all shipping charges, duties, taxes, and any other charges for products returned
This war
inadequate maintenance and care. Tektronix shall not be obligated to furnish service under this warranty a) to
repair damage resulting from attempts by personnel other than Tektronix representatives to install, repair or
service the product; b) to repair damage resulting from improper use or connection to incompatible equipment;
c) to repair any damage or malfunction caused by the use of non-Tektronix supplies; or d) to service a product
that has been modified or integrated with other products when the effect of such modification or integration
incr
THIS WARRANTY IS GIVEN BY TEKTRONIX WITH RESPECT TO THE PRODUCT IN LIEU OF ANY
OTHE
IMPLIED WARRANTIES OF MERCHANTABILITY OR FITNESS FOR A PARTICULAR PURPOSE.
TEKTRONIX' RESPONSIBILITY TO REPAIR OR REPLACE DEFECTIVE PRODUCTS IS THE SOLE
AND EXCLUSIVE REMEDY PROVIDED TO THE CUSTOMER FOR BREACH OF THIS WARRANTY.
TEKTRONIX AND ITS VENDORS WILL NOT BE LIABLE FOR ANY INDIRECT, SPECIAL,
INCIDENTAL, OR CONSEQUENTIAL DAMAGES IRRESPECTIVE OF WHETHER TEKTRONIX OR
HE VENDOR HAS ADVANCE NOTICE OF THE POSSIBILITY OF SUCH DAMAGES.
T
[W2 – 15AUG04]
ranty shall not apply to any defect, failure or damage caused by improper use or improper or
eases the time or difficulty of servicing the product.
R WARRANTIES, EXPRESS OR IMPLIED. TEKTRONIX AND ITS VENDORS DISCLAIM ANY
Page 6

Page 7

Table of Contents
Welcome
Introduction ......................................................................................................... 1
Quick start................ ................................ ................................ ........................... 2
File menu
File menu ............................................................................................................ 7
Projects .............................................................................................................. 7
Default Project...................................................................................................... 9
Open / recent project .................. .................................. ................................ .......... 10
Save / Save As ....... ................................ .................................. ............................ 11
About................................................................................................................ 11
Setup
Setup ................................................................................................................ 13
Instrument add/remove
Instrument add/remove....................................................................................... 14
Add... .................................. ................................ ................................ ........ 15
Remove .................... .................................. ................................ .................. 16
Network........................................................................................................ 17
Application Mode ....................... ................................ .................................. ........ 17
Efficiency........................................................................................................... 18
Limits ............................................................................................................... 18
Upload ........................ .................................. ................................ .................... 20
Instrument setup panel
Instrument Setup panel....................................................................................... 20
Applications/tests panel
Applications/Tests panel ................................................................................ 21
Apply button.............................................................................................. 22
Applications wizard
Applications wizard................................................................................. 23
General
AC Power ............................................................................................ 24
LED Driver
LED Driver ...... ................................ ................................ .................... 24
LED Driver Input ................................... .................................. .............. 24
LED Driver Output ................................................................................. 25
LED Driver Efficiency........................ ................................ ...................... 26
Ballast
Table of Contents
PWRVIEW Online Help i
Page 8

Table of Contents
Instrument information panel.................. .................................. ............................ 37
Instrument wiring/setup
Wiring configuration
Ballast ........ ................................ ................................ ........................ 27
Ballast Input ... ................................ .................................. .................... 27
Ballast Output ....................................................................................... 28
Ballast Efficiency.......................................... ................................ .......... 29
PWM Motor Drive
PWM Motor Drive .................................................................................. 29
PWM Motor Drive Output ......................................................................... 30
PWM Motor Drive Efficiency ..................................................................... 31
Energy Me asurements
Energy Measurements .............................................................................. 32
Energy Consumption ..................................... ................................ .......... 32
Standby Power Measurements
Standby Power Measurements..................................................................... 32
Standby Power....................................................................................... 33
Compliance tests
Compliance tests ........ .................................. ................................ .......... 34
IEC 62301 Standby Power....... ................................ .................................. 34
MIL-1399 Current Harmonics ..................... ................................ ................ 36
IEC 61000-3-2 Current Harmonics (Pre-compliance) .......................................... 36
Wiring Instructions...................... ................................ ............................ 36
Wiring configuration..................................................................................... 37
Wiring type ............................................................................................... 39
Group names.............................................................................................. 39
Group configuration
Group configuration................................... ................................ .............. 40
Mode
Mode.................................. ................................ ................................ 41
Normal mode .................. ................................ ................................ ...... 42
Ballast mode......................................................................................... 43
Standby mode.................................... ................................ .................... 44
PWM mode .................................... ................................ ...................... 45
Integrator mode.............................. ................................ ........................ 45
Inrush mode................ .................................. ................................ ........ 46
IEC 62301 mode ........................................ .................................. .......... 46
MIL-1399 mode..................................................................................... 47
IEC 61000-3-2 mode ............................................................................... 47
Filter . . .................................... .. . . . . . . . . . . . . . . . . . . . . . . . . . . . . . . . . . . . . . . . . . . . . . . . . . . . . ...... 48
Frequency source.................................................................................... 49
Frequency range..................................................................................... 50
ii PWRVIEW Online Help
Page 9

Measure
Measure..................................... ................................ .................................. ...... 63
Start ... .................................. ................................ ................................ ............ 63
Stop ................................................................................................................. 64
Reset ................................................................................................................ 65
Significant figures ............. .................................. ................................ .................. 65
Averaging....................... ................................ ................................ .................... 66
Zero Blanking.............................. .................................. ................................ ...... 66
Integration .......................................................................................................... 67
Data logging
Measurement results and charts
Table of Contents
Voltage channel...................................................................................... 51
Current Channel............... ................................ ................................ ...... 51
Measurement selection
Measurement selections .......... ................................ ................................ .. 53
Sum results
Sum results........................................................................................... 53
1P3W Sum formulas................................................................................ 54
3P3W Sum formulas................................................................................ 56
3P4W Sum formulas................................................................................ 57
Harmonics................................ ................................ ............................ 58
Total harmonic distortion................... ................................ ........................ 59
Distortion factor ............... ................................ .................................. .... 60
Auxiliary inputs
Auxiliary inputs .............................. .................................. .......................... 60
Equation guidelines ........................ ................................ .............................. 61
Data logging................................................................................................... 67
Snapshot ....................................................................................................... 67
Record............................ ................................ .................................. ............ 68
Measurement results and charts............... ................................ .............................. 71
Results grid.............. ................................ .................................. .................... 71
Formulas and text......................... ................................ ................................ .... 72
Charts
Charts............................ .................................. ................................ ........ 72
Harmonic bar charts ..................................................................................... 73
Waveform charts ......................................................................................... 74
Trend charts............................. ................................ .................................. 75
Test
Test tab.............................................................................................................. 77
Test .... .................................. ................................ ................................ ............ 77
PWRVIEW Online Help iii
Page 10

Table of Contents
Test details
Test details..................................................................................................... 79
Laboratory..... ................................ .................................. .............................. 79
Customer....................................................................................................... 80
Product
Test info.... .................................. ................................ ................................ .. 82
IEC 62301 Standby power test
IEC 62301 Standby power test .............................. ................................ ................ 82
Power plot ... ................................ ................................ .................................. 83
Voltage quality . . . . . . . . . . . . . . . . . . . . . . . . .................... . . . . . . . . . . . . . . . . . . . . . . . . . . .................... . . . . . . 84
Power stability . . . . . . . . . . . . .......................... .. . . . . . . . . . . . . . . . . . . . . . . . . . . . . . . . . . . . . .................... 85
Uncertainty .................................................................................................... 85
Test status.................................... ................................ .................................. 86
MIL-1399 Current Harmonics test
MIL-1399 Current Harmonics test............................................ .............................. 86
Test limits.................................... ................................ .................................. 88
Harmonics graph/table . ................................ ................................ ...................... 89
Test status.................................... ................................ .................................. 90
IEC 61000-3-2 Current Harmonics
IEC 61000-3-2 Current Harmonics (pre-compliance) test ............................................... 91
Limit class types .............................................................................................. 93
Rated parameters.............................................................................................. 96
Harmonics graph/table . ................................ ................................ ...................... 98
Test results................................................................................................... 100
Product .................................................................................................... 80
Manufacturer ..................... ................................ ................................ ........ 81
Results
Results tab........................................................................................................ 101
Measurement results............................................................................................. 101
Test results.................. .................................. ................................ .................... 103
Standby power results
Standby power results .......... ................................ ................................ ............ 104
Results Summary tab ....................................................................................... 104
Power Readings tab......................................................................................... 105
MIL-1399 results
MIL-1399 results ........................................................................................... 105
Results Summary tab ....................................................................................... 106
Harmonics Results tab ............... ................................ .................................. .... 107
Current harmonic results
Current harmonic results................................................................................... 108
Results Summary tab ....................................................................................... 109
iv PWRVIEW Online Help
Page 11

Index
Table of Contents
Harmonics results tab ...................................................................................... 111
Reports
Reports ....................................................................................................... 112
PDF reports.. ................................ .................................. .............................. 113
Spreadsheet reports......................................................................................... 114
PWRVIEW Online Help v
Page 12

Table of Contents
vi PWRVIEW Online Help
Page 13

Welc o me Introduction
Introduction
Welcome to the PWRVIEW online help for the Tektronix power analyzers.
PWRVIEW has been designed to make power measurement and a nalysis as simple as possible using
Tektronix power analyzers.
Measure efficiency, energy consumption, standby power, harmonics, and other power parameters for
single and three phase applications
Remotely monitor, control and log power measurements
Take measurements simultaneously from multiple power analyzers
View voltage, current and power waveforms
Chart har
Set custom measurement limits to monitor when measurements have exceeded a user specified
thresho
Trend measurements by plotting their values over time
Save measurement snapshots
Record results for future analysis in spread sheets or comma separated value files
Run, compliance and pre-compliance tests for various regulatory standards such as IEC 62301
(Standby Power), IEC 61000-3-2 (Current Harmonics) or MIL-1399 (Current Harmonics)
monics to instantly visualize a voltage or current frequency spectrum
ld
Minimum system requirements
The minimum system requirements for running PWRVIEW are:
Microsoft Windows 7 or 8.1
2 GHz or faster 32-bit (x86) or 64-bit (x64) processor
2 GB RAM (minimum), 4 GB RAM (recommended)
inimum display resolution of XGA (1024 x 768)
M
PWRVIEW also supports "Virtual" instruments; these instruments can be used to learn the features of
ither product without a physical instrument being present.
e
Use the Setup
Setup Wizards make the most complex measurement settings simple by taking you step by step through
your unique requirements.
Use the Measure
all the selected measurement can be viewed in a grid. Harmonics, waveforms, and trend plots can also be
enabled on this screen.
PWRVIEW Online Help 1
(see page 13) screentoconfigure instruments and switch between Measure and Test modes.
(see page 63) screen to monitor and analyze measurement results. This s creen is where
Page 14

Welc o me Quick start
Use the Test (see page 77) screen to perform Regulatory Standards testing based on measured results.
IEC 62301 (Low Power Standby), IEC 61000-3-2 (Current Harmonics) and MIL-1399 (Current
Harmonics) st
andards testing is supported.
Use the Results
Use the File Menu
See the Quick Start
Quick start
This section provides a step-by-step guide for setting up and measuring results. This section uses a
single four-channel PA3000; if you have a single-channel instrument or multiple instruments, some
of the screens will differ from the ones shown.
1. Connect your power analyzer to the computer using your preferred communications method.
Communications are possible using USB, Ethernet, and GPIB. Not all instrument models have all
types of communication port available, and some may be optional. Please consult the documentation
for you
2. If using USB or GPIB, instruments are automatically detected. If using Ethernet, make sure the
instr
(see page 101) screen to export recorded data or to analyze and report the test results.
(see page 7) to save and manage measurement projects.
(see page 2) guide to quickly begin m aking measurements.
r model.
uments IP Addresses are configured in the Network Setup.
2 PWRVIEW Online Help
Page 15

Welc o me Quick start
3. Press the Add button to detect and add your instrument. The following dialog box will appear:
4. Click the Connect button to connect your instrument to PWRVIEW.
If desired, check the “Include Virtual Instruments” box to add demonstration instruments to the list and
then select one or more instruments before clicking the Connect button.
5. After closing the Add dialog box, the Setup tab will be displayed with the newly selected instruments.
The following figure shows the Setup tab with the w iring configuration for the PA3000.
If you have a single-channel instrument such as a PA1000, the Setup tab will show the settings
configuration.
PWRVIEW Online Help 3
Page 16

Welc o me Quick start
6. By default, the General/AC Power Application is applied to each instrument. This is used to make
general power measurements.
7. To start gathering measurement results, go to Measure tab on the top and click the Start button. The
settings will be automatically uploaded to the instrument. The measurements will be updated and
results will be shown in the results grid:
4 PWRVIEW Online Help
Page 17

Welc o me Quick start
8. Click the Stop button to stop the measurements.
PWRVIEW Online Help 5
Page 18

Welc o me Quick start
6 PWRVIEW Online Help
Page 19

File menu File menu
File menu
The File menu contains all functionality to manage project files.
Default Project (see page 9) returns PWRVIEW to a default state.
Open (see page 10) opens an existing project.
Save / Save As (see page 11) saves the current PWRVIEW configurationtoafile.
age
About (see p
Exit closes the application.
A Recent Projects list conveniently shows a list of the most recently used projects to open with a click of
the mouse.
11) provides information about PWRVIEW.
Projects
The current settings of the PWRVIEW application can be stored in a project file. The file suffix is .vpm.
The file includes:
A list of all the instruments currently added to PWRVIEW
wiring setup for each instrument
The
The configuration for each instrument group including the mode, Voltage channel, Current channel,
d measurement selections for all groups
an
The Auxiliary input configuration for an instrument (applicable to PA3000 or PA4000 instruments)
The Efficiency measurement settings
All limits definitions
PWRVIEW Online Help 7
Page 20

File menu Projects
All values that can be set from the Measurement tab:
Significant figures setting
Averaging setting
Zero blanking
The number o
The logging setup
If a test is active, all values associated with that test. The details vary per test.
Project files can be saved and recalled anywhere within the file system. Saving a project file has no impact
on the current PWRVIEW setup. Recalling a project file replaces the current PWRVIEW setup.
PWRVIEW automatically prompts you to save any changes you made to the setup settings before exiting.
This allows you to continue working with the same configuration setting when you restart PWRVIEW.
PWRVIEW provides a Default Project option to remove all instruments and return all settings to default
values w
hen desired.
f charts that are displayed
8 PWRVIEW Online Help
Page 21

File menu Default Project
Default Project
Default Project resets PWRVIEW to a default state. All instruments and defined formulas will be removed,
averaging, blanking, significant digits, and logging settings will be returned to default settings.
NOTE. Defaul
Default Project does not affect database or recorded test results.
1. Click the blue tab with white arrow below to expand the File Menu (see page 7),thenselectthe
Default Project entry.
2. Upon cl
of values.
t Project does not affect the current settings on the power analyzer.
icking Default Project you will be asked to confirm the removal of instruments and resetting
er confirmation, PWRVIEW will be returned to default settings: all instruments and defined
Aft
formulas will be removed, averaging, blanking, significant digits, and logging settings will be returned
to default settings.
PWRVIEW Online Help 9
Page 22

File menu Open / recent project
Open / recent project
Open
The Open button allows you to open previously saved project files.
1. Click the blue tab with white arrow to expand the File Menu
a saved project.
2. Select a
file as shown below with a .vpm extension and click Open.
(see page 7) andclickOpentoopen
PWRVIEW will be set based on the settings within the opened file.
Recent Projects
e Recent Projects area is a list of recently Saved/Saved As proje ct files. A new entry will appear after
Th
saving a project to file. Selecting an entry in this area opens that project file (it is equivalent to pressing the
Open selection and browsing to the project file path). Hovering the mouse over one of the recent projects
shows the full path of the project file.
10 PWRVIEW Online Help
Page 23

File menu Save / Save As
Save / Save As
Use the Save or Save As buttons to save the current PWRVIEW configuration to file.
About
The About dialog box shows information about the PWRVIEW software.
PWRVIEW Online Help 11
Page 24

File menu About
12 PWRVIEW Online Help
Page 25

Setup Setup
Setup
The Setup ribbon provides the ability to add and remove instruments as well as the ability to configure
instruments to make the desired me asurements. It contains the following areas:
Instruments (see page 14): Adds and removes power analyzers to and from PWRVIEW
Application Mode (see page 17): Switches between Measure and Test mode s
Efficiency (see page 18):Configures the Efficiency measurement
Limits (see page 18):Configures user defined limits for Measurement, Auxiliary inputs, and Formulas
Settings (
The Instrument Setup Panel (see page 20) has a dedicated tab for each instrument. Each instrument tab
has the fo
see page
llowing sub panels:
Applications / Tests Panel (see page 21) is used to configure instruments for specific applications
includi
Information Panel (see page 37) showing instrument details.
Wiring and Group panel which is used to setupaninstrument(see page 20) for various wiring
configurations.
ng enabling tests.
20): Uploads the current PWRVIEW settings to each added instrument
PWRVIEW Online Help 13
Page 26

Setup Instrument add/remove
Instrument add/remove
The setup ribbon provides the user with functionality that:
Adds (see page 15) new instruments
Removes (see page 16) currently added instruments
Network (see page 17) configures the IP addresses over which to communicate
PWRVIEW interacts with one or more power analyz ers to send setup information and receive measurement
results. Communication is achieved using TekVISA software which is available from www.tek.com
VISA system manages all communications links allowing PWRVIEW to use a common framework
regardless of the physical communication layer chosen. NI-VISA, National Instruments VISA, is also
supported.
Communication is possible u sing USB, Ethernet, and GPIB. All three buses are always available on the
PA1000 products. GPIB is optional for PA3000 products.
.The
USB connections
Using the Universal Serial Bus is the simplest way to connect your instrument to the computer. Just plug
a cable into any USB port on the computer running PWRVIEW and the square USB port (Standard
B) on the rear of the instrument. The computer should automatically detect and install an appropriate
communication driver. After driver installation, the attached power analyzer will be shown in the list of
available instruments.
Ethernet (Network) connections
Unlike USB and GPIB, an Ethernet enabled instruments are not automatically detected by VISA. The
IP address of each instrument must be entered into the Network address dialog box
approach eliminates long VISA Ethernet search times.
First connect both the PWRVIEW host computer and power analyzer onto the same Ethernet network.
The power analyzer will, by default, obtain an IP address automatically from the DHCP server. The IP
address can be accessed on PA1000 front panel by selecting Menu → Interfaces → Ethernet → Current IP
Settings. On the PA3000, the IP addresses can be accessed on the instrument front panel by pressing the
Setup button and then scrolling to the bottom of the screen.
Once the correct network IP address is entered into the Network dialog box, the instrument will be added
to the list of available instruments.
(see page 17).This
GPIB connections (IEEE 488.1)
General Purpose Instrument Bus connections require the addition of a GPIB controller to the host
computer. GPIB controllers come in a variety of formats from PCI cards that require installation inside
desktop computers to USB-GPIB converters that can simply be attached to the USB port of the computer.
14 PWRVIEW Online Help
Page 27

Setup Add
Whichever option is used the manufacturer must supply drivers that interface with the VISA system.
Connect the instrument to the GPIB controller using a GPIB cable and the instrument should be shown in
the list of ava
ilable instruments.
Add
The Add button activates the Add An Instrument dialog box. When this dialog is activated, PWRVIEW
will search
the Network dialog box
for instruments attached to the computer on USB, GPIB, and the Ethernet addresses defined in
(see page 17).
1. Click Add t
2. Upon clicking Add the following dialog box displays. It shows the instruments available for
connection. Click the box next to an instrument to add it to PWRVIEW.
o detect and add an instrument.
Clicking the Refresh button will initiate a new search for connected instruments.
Checking "Include Virtual Instruments" adds Virtual Instruments to the list of available instruments.
Virtual instruments can be used to learn the features of either product without a physical instrument
being present.
PWRVIEW Online Help 15
Page 28

Setup Remove
Remove
Remove opens a dialog box that can b e used to remove instruments from PWRVIEW.
1. Click Remove for removing already added instrument.
2. Select the instrument to remove.
3. All selected instruments will be removed from the project.
16 PWRVIEW Online Help
Page 29

Setup Network
Network
The Network dialog box specifies instrument IP addresses. PWRVIEW will only searc h the Ethernet
for addresses in this list.
The Add area allows you to enter new addresses to be searched. To remove an address, select it from the
list and click Remove.
The addresses in the list will be searched when the Add instrument function is performed.
The IP address list will be searched each time instruments are added. Therefore this list should be kept as
small as possible. Addresses that are not valid extend the search time.
Application Mode
Use the Application Mode to select either the Measure or Test modes. The Applications / Test (see
page 21) area on the left side of the screen provides a list of preset applications and tests. The selections in
the list depend on the instrument; The PA3000 and PA4000 have different tests than the PA1000. The
application mode selection helps set up the measurements or tests for your particular application.
Depending on the application mode, some selections are grayed out and are not active until you change the
mode. For example Compliance Tests are not available in Measure mode, but only in Test mode.
Use Measure to select the measurements, such as AC Power or LED Driver Input, and then click either the
Wizard button or the Apply button. After selecting the measurement, the configuration details appear on
the right side of the screen. When you select the Measure applicat
available where you can start or stop measurements and display the results using different tools such as
Harmonics
Use Test to select compliance tests for your instrument, such as IEC 62301 Standby Power. Click either
the Wizard button or the Apply button to apply the test setups on the right side of the screen. When you
select the Test application mode, the Test tab is available where you can start or stop the test.
PWRVIEW Online Help 17
(see page 98), Wavef o rms (see page 74),orTrend (see page 75) charts.
ion mode, the Measure tab becomes
Page 30

Setup Efficiency
Efficiency
The Efficiency Configure check box allows for configuring the Efficiency measurement. This feature
requires at least two groups added in PWRVIEW. Click the Configure check box to bring up the Efficiency
Setup tab to c
Click the Measure Efficiency check box to enable selected efficiency calculations on the measure grid.
onfigure the input and output instruments and groups.
Limits
Use the Limits setup to configure user defined limits for various measurement parameters.
its can be set for different categories (Standard, Harmonics, Sum, Aux and Formulas).
Lim
Click the down arrow for more options such as setting up limit values, saving limits to a file, recalling
its from a file, and clearing all limits. The limits file is independent of the PWRVIEW configuration
lim
file and can be saved and recalled independently.
18 PWRVIEW Online Help
Page 31

Setup Limits
Select Setup from the menu to open the Limits Setup dialog box for configuring limit values.
its will show up on the Measurement grid as an individual tab. Hovering over the results cell displays
Lim
the set Limit Function, Limit Value, Relative Value, and Pass-Fail Status in r eal-time.
PWRVIEW Online Help 19
Page 32

Setup Upload
Upload
Use the Upload button to remotely control and change settings on the power analyzer.
Upload sends the commands necessary to configure the power analyzer to measure the selected parameters.
The use of this button is not mandatory as the uploads take place automatically when trying to take
measurements; but it can be used for controlling the instrument remotely and for diagnostic purposes.
Instrument Setup panel
All instruments added to the configuration using the Add (see page 15) button will appear as a series of
tabs in the Instrument Setup panel. Select the instrument to configure by clicking the tab. Information to
allow simple identification of the instrument is shown in the Information Panel
and tests can be configured using Applications / Tests Panel
using the Wiring
(see page 37) and Group Configuration (see page 40) panels.
(see page 37). Applications
(see page 21). Other parameters are configured
20 PWRVIEW Online Help
Page 33

Setup Applications/Tests panel
Applications/Tests panel
The Applications / Tests selector provides a list of preset applications and tests. These suggest the
parameters for the applications and tests; when applied they can be modified to suit the application or test.
Select from the list of available applications and tests and then use the Wizard
page 22) button to quickly generate an instrument setup. The following figure shows the applications and
tests available for a PA3000; other test are available with other power analyzers.
NOTE. Some items in the list are grayed out depending on the whether the Application Mode is Measure
t. In the following figure, the Compliance Tests are grayed out because the Application Mode
or Tes
is Measure.
(see page 23) or Apply (see
PWRVIEW Online Help 21
Page 34

Setup Apply button
Apply button
The Apply button applies the default setup for the selected application / test.
After clicking Apply, the instrument configuration is generated. You can then make any necessary changes
before saving and u ploading the configuration.
22 PWRVIEW Online Help
Page 35

Setup Applications wizard
Appli
NOTE. The Apply button does not upload the settings to the power analyzer, it just configures the settings
of PWRVIEW. Click either the Upload button or the Start button under the Measure or Test tab to send
all the settings to the power analyzer.
cations wizard
pplications wizard launches a series of prompts that ask questions about the measurement application
The A
before automatically generating an instrument configuration. It can also provide help and wiring diagrams
to connect the instrument. The available applications vary depending on which power analyzer is being
used and the number of available channels.
1. Click the wizard button and follow the screen prompts.
PWRVIEW Online Help 23
Page 36

Setup AC Power
Available w iza
LED Driver Inpu
LED Driver Out
LED driver effi
Ballast Inpu
Ballast Outp
Ballast Effic
Standby Pow
PWM Drive Ou
PWM Drive E
Energy Con
Full Compl
rds (depending on instrument) are:
tWizard
put Wizard
ciency wizard
t
(see page 27)
ut
(see page 28)
iency
er
(see page 33)
tput
fficiency
sumption
iance Standby
(see page 24)
(see page 25)
(see page 26)
(see page 29)
(see page 30)
(see page 31)
(see page 32)
(see page 34)
xxx
AC Power
AC Power does not have a wizard; but is used to apply a default configuration for making general AC power
measurements in Normal mode. This configuration will expect steady st ate power for each line cycle.
LED Dr
iver
LED - L
ight Emitting Diode - applications are those that involve making AC-DC LED drive measurements.
An LED drive is the supply unit used to drive LED devices. They typically take line power in and produce
a constant current DC output.
LED Driver Input
LED Driver Input
The LED Driver Input wizard provides a wiring diagram showing how to connect the input of an LED
driver to the mains. The last page of the wizard presents a wiring summary showing a schematic with
wiring instruction
(see page 24),Output (see page 25),andEfficiency (see page 26) wizards are available.
(see page 36).
24 PWRVIEW Online Help
Page 37

Setup LED Driver Output
LED Driver Output
The LED Driver Output wizard provides a wiring diagram showing how to connect the Output of an LED
Driver to the LED module. The last page of the wizard pres ents a wiring summary showing a schematic
with wiring instructions.
(see page 36)
PWRVIEW Online Help 25
Page 38

Setup LED Driver Efficiency
LED Driver Efficiency
The LED Driver Efficiency wizard generates a configuration suitable for measuring the efficiency of
LED
(see page 24) Drive systems. Prompts are generatedthesameasthoseoftheLED Driver Input
(see page 24) an
(see page 36) shown.
d LED Driver Output
(see page 25) wizards before presenting the wiring instructions
26 PWRVIEW Online Help
Page 39

Setup Ballast
Ballast
Ballast applications involve measurements of lighting ballast systems. A typical ballast system will
take the line input and convert it to high frequency signals that can be heavily amplitude-modulated at
line frequen
cies.
Ballast Input
guide you th
Ballast Input
This wizard generates a suitable configuration for measuring the power input of ballast systems.
The maximum expected peak current is requested to determine which shunt (1 A or 30 A) should be used.
The last page of the wizard provides a wiring summary showing a schematic with wiring instructions
e
(see pag
36).
(see page 27), Output (see page 28),andEfficiency (see page 29) wizards are available to
rough the measurement application and apply an appropriate configuration.
PWRVIEW Online Help 27
Page 40

Setup Ballast Output
Ballast Output
This wizard generates a suitable configuration for measuring the output power of ballast systems. The
wizard requests the maximum expected peak current to determine which shunt (1 A or 30 A) should be
used. The lin
to the fundamental power frequency. Selecting a tube with a filament presents the required schematic
diagram. The last page of the wizard provides a wiring summary showing a schematic with wiring
instructions. (see page 36)
e frequency is requested and used by the power analyzer to synchronize the measurements
NOTE. The image shows the use of the Tektronix Ballast CT accessory for measuring output power and
tube current in h igh frequency electronic lighting ballast applications.
28 PWRVIEW Online Help
Page 41

Setup Ballast Efficiency
Ballast Efficiency
This wizard generates a suitable configuration for measuring the efficiency of ballast systems. Prompts are
generated the same as those of the ballast input
before creat
ing the wiring instructions
(see page 36) shown below.
(see page 27) and ballast output (see page 28) wizards
NOTE. The image demonstrates the use of the Tektronix Ballast CT accessory for measuring output power
and tube current in high frequency electronic lighting ballast application.
PWM Motor Drive
PWM (Pulse Width Modulation) motor d rive applications are those involved with measuring the power
consumption and efficiency of PWM motor inverter systems.
A typical PWM motor drive operates from a single or a three phase supply and converts the output voltage
to a high frequency pulse width modulated signal to accurately control a three phase motor. The resultant
output current is at motor frequency and represents the fundamental frequency for output power but can
often be highly distorted and not fit for frequency detection. The PWM mode
(see page 45) digitally filters
PWRVIEW Online Help 29
Page 42
Setup PWM Motor Drive Output
and demodulates the output voltage to accurately detect the fundamental power frequency. The digital filter
in PWM mode is only used for frequency detection and does not affect the actual RMS readings of voltage.
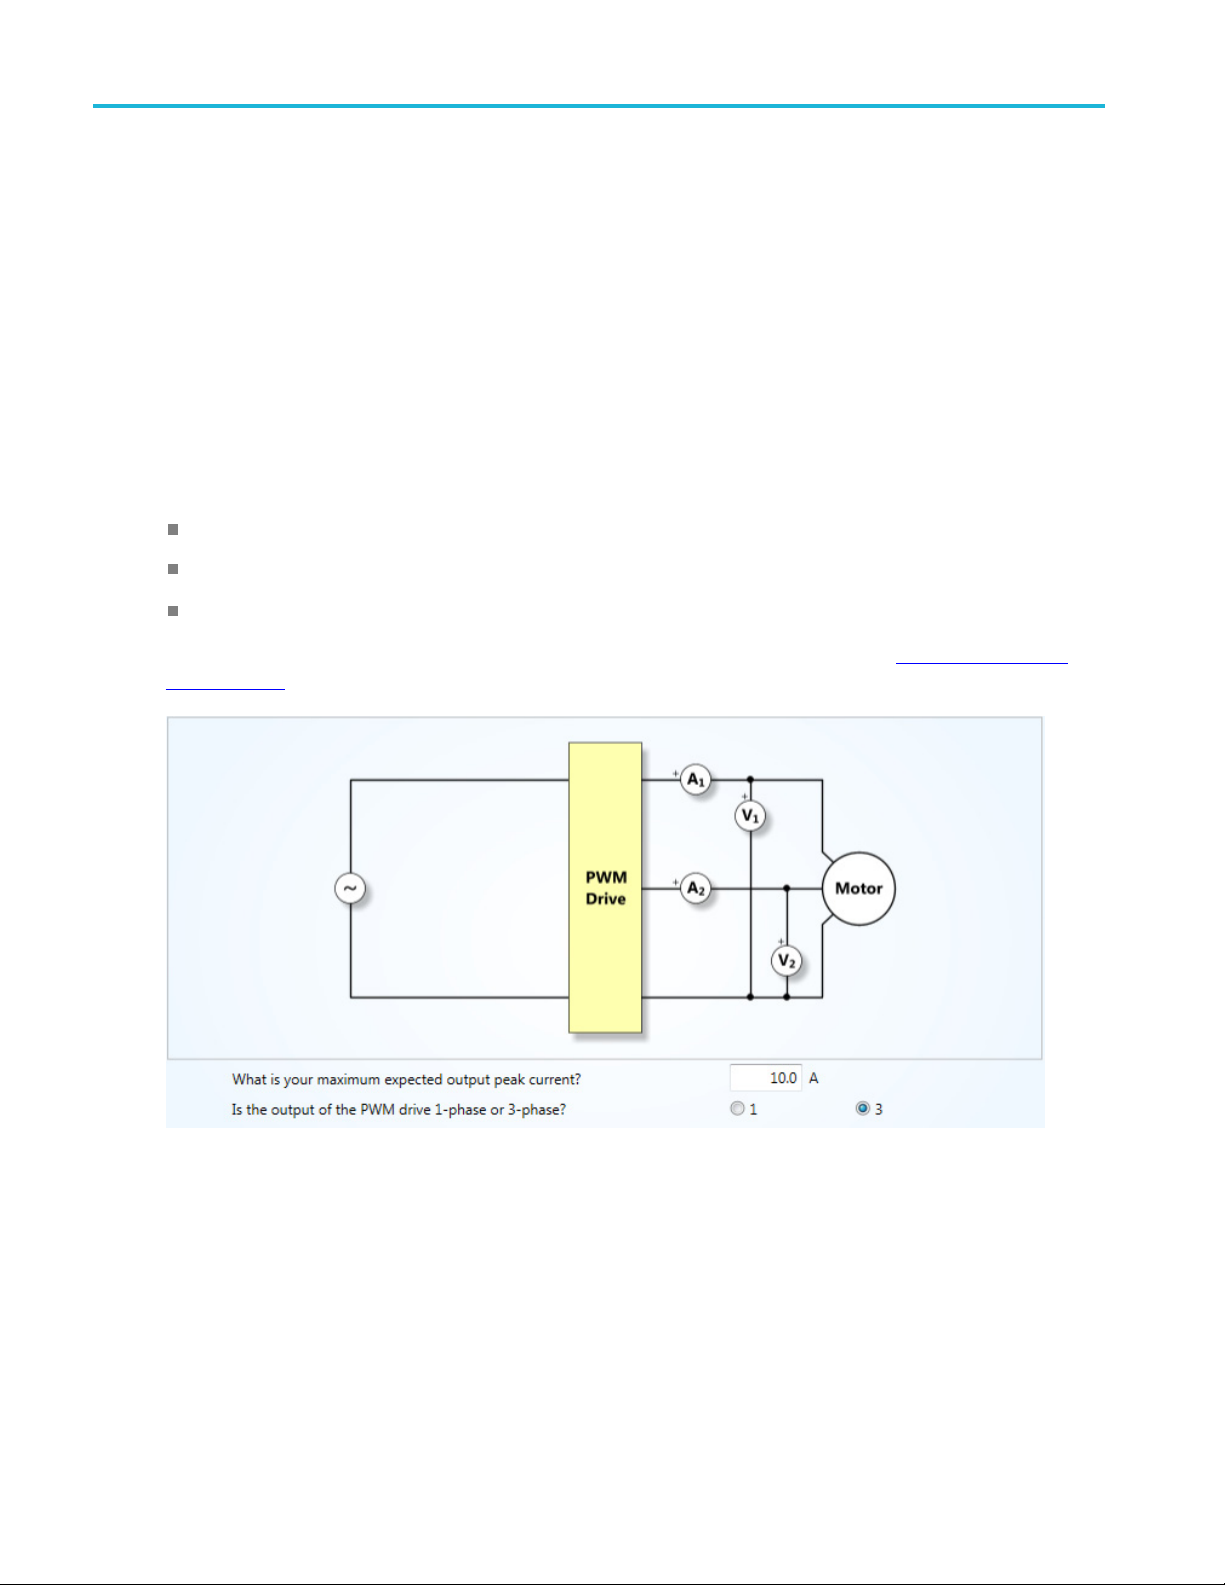
PWM Motor Drive Output
This wizard generates a suitable configuration for measuring the output power of PWM motor drive
systems using the two watt meter method.
The maximum expected peak current is requested to determine which shunt (1 A or 30 A) should be used.
The number of phases might be requested to determine the number of channels to use.
The following current measurement options are presented:
Direct Measurement
Current Transformer
Voltage Output Transducer
The las
(see page 36)
t page of the wizard provides a wiring summary showing a schematic with wiring instructions.
30 PWRVIEW Online Help
Page 43

Setup PWM Motor Drive Efficiency
PWM Motor Drive Efficiency
This wizard generates a suitable configuration for measuring the efficiency of PWM m otor drive systems
using the two watt meter method. Prompts are generated to ask questions about the power into the inverter,
followedbyq
Questions are asked about peak current (to determine the s hunt selection) and number of input phases. The
following i
Direct Measurement
Current Transformer
Voltage Output Transducer
The las t page of the wizard provides a wiring summary showing a schematic with wiring instructions.
(see page 36)
uestions similar to those of the PWM Drive Output
nput current measurement options are presented:
(see page 30) wizard.
PWRVIEW Online Help 31
Page 44

Setup Energy Measurements
Energy Measurements
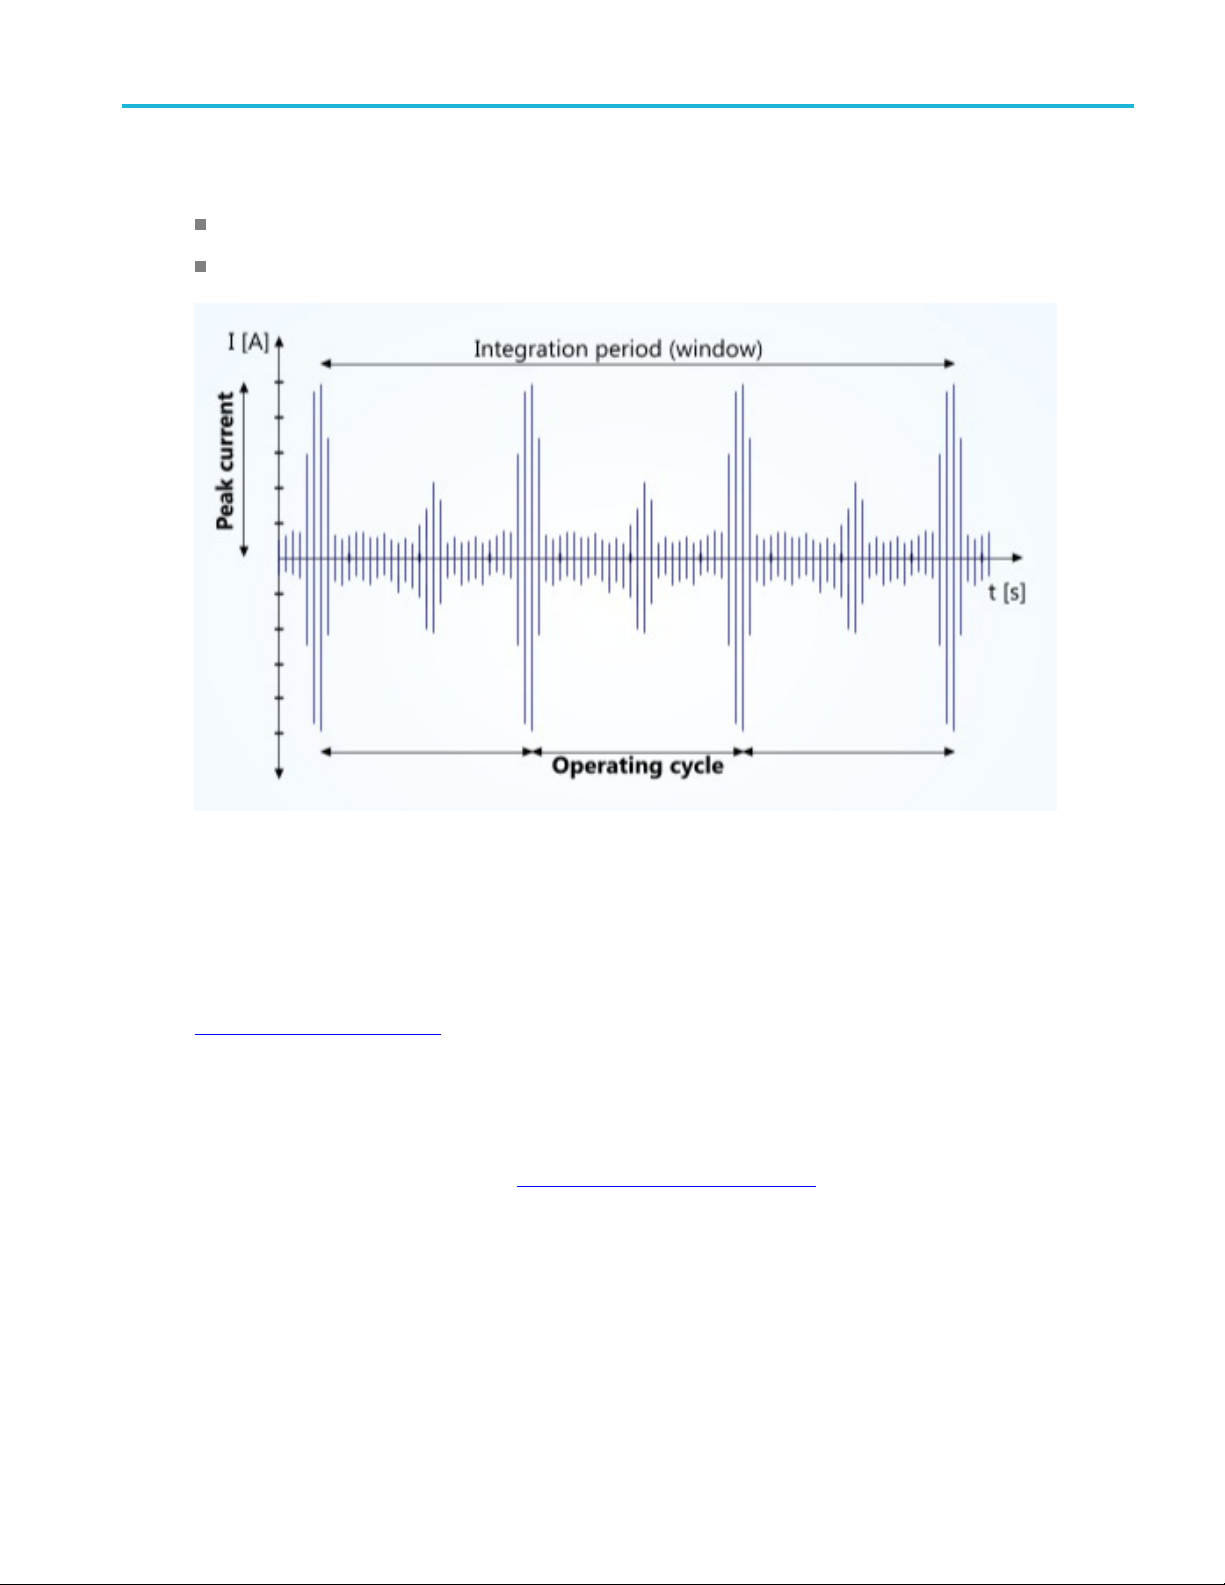
Energy consumption measurements require power integration over long periods of time to determine the
energy used (in kilowatt hours, for example). Integrator mode is used for these measurements.
Energy Consumption
This wizard generates a suitable configuration for measuring energy consumption of a device. The
maximum expected peak current is requested to determine which shunt (1 A or 30 A) should be used. The
number of input phases is requested. The software can also compute the Correction VArs (CVArs) based
on the target power factor for this measurement.
Thelastpageofthewizardprovidesawiring summary showing a schematic with wiring instructions.
(see page 36)
Standby Power Measurements
Standby power is generally defined as power consumption when the device under test is operating in a no
load or a low load scenario.
Standby power is usually very low and highly distorted. The signal normally has very low power factor
and high irregular peaks. Such signals require wide dynamic measuring range and long averaging to obtain
a stable power measurement.
32 PWRVIEW Online Help
Page 45
Setup Standby Power
PWRVIEW provides default application modes to measure or test standby power either for quick
measurement checks or for full compliance tests to the IEC 62301 standard.
Standby power
IEC 62301 Standby Power (Full Compliance Test)
Standby Power
This wizard generates a suitable configuration for measuring the input power of devices operating in
standby mode
r 30 A) and range should be used. The power analyzer is then set in Auto-up-only range setting,
(1 A o
where the range is set to increase every time a peak is detected but never switches down. This helps power
analyzer determine the optimum range for a given signal and not miss any irregular current peaks. The
operating c ycle time is also requested so that an integration time of three times the cycle time can be
set. An integration time of 10 seconds is used as default. The last page of the wizard provides a wiring
summary showing a schematic with wiring instructions.
PWRVIEW Online Help 33
(see page 44). The maximum expected peak current is requested to determine which shunt
(see page 36)
Page 46

Setup Compliance tests
NOTE. The image demonstrates the use of the Tektronix Breakout box (BB1000) for measuring input
AC standby power.
Compliance tests
The Compliance tests are available when the Application Mode is Test; none of these tests are available
under Measure. If you are in the Measure mode, you need to change the Application Mode to Test to
enable the compliance tests.
PWRVIEW will only run one test at a time on a single channel on a single instrument.
IEC 62301 Standby Power
This wizard generates a s uitable configuration for testing the standby power of devices according to
IEC 62301 ED 2.0 standard.
The instrument will be configured to use the IEC 62301 mode which uses the auto-up ranging system.
The auto-up ranging system allows the maximum test current to be measured a nd the range to be fixed so
that no range changes occur during the main test. Thelastpageofthewizardprovidesawiringsummary
showing a schematic with wiring instructions.
(see page 36)
After applying this wizard the IEC 62301 Standby Power Test can be controlled from the Test (see
page 77) tab.
34 PWRVIEW Online Help
Page 47

Setup IEC 62301 Standby Power
NOTE. The image demonstrates the use of the Tektronix Breakout box (BB1000) for measuring input
AC standby power.
PWRVIEW Online Help 35
Page 48

Setup MIL-1399 Current Harmonics
MIL-1399 Current Harmonics
The MIL-1399 Current Harmonics test is available with PA3000 and PA4000 instruments. This test does
not have a wizard. Click the Apply button to apply the test.
IEC 61000-3-2 Current Harmonics (Pre-compliance)
The IEC 61000-3-2 Current Harmonics (Pre-compliance) test is available with PA1000 instruments. This
test does not have a wizard. Click the Apply button to apply the test.
Wiring Instructions
Wiring instructions on the last page of each wizard summarize the wiring configuration and shunt selection
for each channel based on the application and user inputs. In the following example, the power analyzer is
setup in a 3p3w configuration using two watt meter method on input and output. Current Transducers
(CTs) are selected for each channel based on the user input. 1 A current shunts are used to connect the
output (secondary) of the current transducers as indicated by t
page. The voltage and current connections are shown in the schematic as V
channel number. A "+" indication denotes the "Hi" side connection.
he instruction on the bottom of the wizard
and Ansymbols where n is the
n
36 PWRVIEW Online Help
Page 49

Setup Instrument information panel
Instrument information panel
The Instrument Information Panel shows the following:
Instrument type
Connection details including:
Connection type used for communication
VISA vendor
Instrument serial number
Instrument firmware version
and version number
Wiring configuration
The wiring configuration is only present for a multi-channel instrument and is used to set up the channels
n a group. The wiring type
used i
required will be generated. Group tabs are shown to allow further group configuration.
Group names
(see page 39) can be changed by editing the values shown.
(see page 39) can be set for each channel and the number of groups
(see page 40).
PWRVIEW Online Help 37
Page 50

Setup Wiring configuration
NOTE. In Test mode, the wiring type is fixed at 1p2w and cannot be changed. Use the radio button in
the front of each channel to select which channel to run the test on.
38 PWRVIEW Online Help
Page 51

Setup Wiring type
Wiring type
The wiring type groups channels together as required by the application and specifies the wiring
configuration for the group.
Wiring type Number of channels in group
1p2w - 1 phase 2 wire 1
d]
se3wire
2
None – cha
nnel not used
1p3w - 1 pha
3p3w - 3 phase 3 wire 2
3p4w - 3 phase 4 wire 3
[Disable
xxx
Group names
Group names can be edited to allow for simple identification. Use a group a name that describes its purpose.
PWRVIEW Online Help 39
Page 52

Setup Group configuration
Group configuration
The group configuration section, shown for each group tab, allows configuration of a group of channels
with the following information:
Modes (see page 41)
Filtering (see page 48)
Frequency Source (see page 49)
Frequency Range (see page 50)
annel
Voltage Ch
Current Channel (see page 51)
Measurement selections (see page 53)
(see page 51)
40 PWRVIEW Online Help
Page 53

Setup Mode
Mode
The mode setting configures the instrument to operate in the manner required by certain measurement
ications. The available modes differ depending on the type of instrument. On changing the mode the
appl
available measurement selections
The following modes are available when the Application Mode is set to Measure:
Normal Mode (see page 42)
Ballast Mode (see page 43)
Standby Mode (see page 44)
PWM Mode [Applicable only for the PA3000] (see page 45)
PWRVIEW Online Help 41
(see page 53) and other setup options can change.
Page 54

Setup Normal mode
Integrator Mode (see page 45)
Inrush Mode [Applicable only for the PA1000] (see page 46)
List of modes available in the PA3000 are:
List of modes available in the PA1000 are:
Mode is set to one of the following tests when the Application Mode is set to Test:
IEC 62301 Standby Power (see page 46)
MIL 1399 Current Harmonics (see page 47), applicable only for the PA3000 and PA4000
IEC 61000-3-2 Curren
t Harmonics (Pre-compliance)
(see page 47), applicable only for the PA1000
Normal mode
Normal mode is the most common operating mode of the instrument. It can measure all available
measurement parameters and detects the frequency of the signals from the zero crossings of the waveforms.
42 PWRVIEW Online Help
Page 55

Setup Ballast mode
PA3000 Normal mode
PA1000 Normal mode
Ballast mode
Ballast mode is required to measure parameters of an AM (Amplitude Modulated) waveform typical of the
voltage outputs of ballast systems. The Tektronix power analyzers use a p roprietary dynamic frequency
detection technique for tracking periodic modulation frequency as zero crossing can be unreliable for
such applications.
PA3000 Ballast mode
PA1000 Ballast mode
On selecting ballast mode, any filter settings will normally be fixed to high bandwidth (to capture the faster
switching frequencies of the ballast) and a prompt for the line frequency will be given.
PWRVIEW Online Help 43
Page 56

Setup Standby mode
Standby mode
Standby mode is required when the current drawn by a load is low, very intermittent and irregular, such as
with modern power supplies running under no load conditions. Measurements are integrated over long
periods of ti
PA3000 Standby mode
PA1000 Standby mode
me to ensure that accurate average values can be determined.
On selecting Standby mode, the filter frequency is locked on High Bandwidth and a time period is
sted over which to integrate the measurement. The default value of 10 seconds is recommended for
reque
most applications, but if the unit under test draws variable power over a longer cycle time, this integration
period should be set to at least three times the longest cycle time.
All integrated measurement results will not be further averaged by PWRVIEW so the result is unaffected
by the averaging setting
(see page 66).
44 PWRVIEW Online Help
Page 57

Setup PWM mode
PWM mode
PWM mode is designed to demodulate a pulse width modulated voltage signal to determine the modulation
frequency without affecting the RMS values. This allows the power analyzer to synchronize measurements
to the modula
P3000 and PA4000 PWM Mode
tion frequency and get the most stable readings possible.
Integrator mode
Integrator mode is used for energy consumption measurements where the power is integrated over
time to produce measurements such as watt-hours or average watts. In the Integrator mode the energy
consumption measurements will become available in the measurement selections
to start and stop the integrator
PA3000 and PA4000 Integrator mode
PA1000 Integrator mode
(see page 67) will be available in the Measurement tab. (see page 63)
(see page 53) and options
On some instruments a targ
PWRVIEW Online Help 45
et power factor value can be entered here to compute the value of CVArs.
Page 58

Setup Inrush mode
Inrush mode
Inrush mode is used to measure the peak current drawn by a load, normally at mains power on. This mode
tells the power analyzer to continuously sample using fixedrangesontheVoltage Channel
and Current C
uploading
available in inrush mode with Filter
Click Reset
PA1000 Inrush mode
hannel
(see page 20) the configuration. A smaller subset of measurement selections (see page 53) are
(see page 65) in the Measurement tab (see page 63) to restart an inrush measurement.
(see page 51) so that a peak event is not missed. Select the correct range before
(see page 48) and Frequency Source (see page 49) settings unavailable.
(see page 51)
IEC 62301 mode
In IEC 62301 mode the test group is configured to perform low power standby tests suitable for full
compliance testing to IEC 62301 using the Sampling test method. The IEC 62301
become available under the Te st
and the auto-up only current ranging
allows the maximum test current to be measured and the range to be fixed so that n o range changes occur
during the main test. A range change would break the conditions defined in IEC 62301 which require
continuous measurements.
PA3000 IEC 62301 mode
PA1000 IEC 62301 mode
(see page 82) test will
(see page 77) tab, the minimum measurement parameters will be fixed
(see page 51) will be preselected. The auto-up ranging system
46 PWRVIEW Online Help
Page 59

Setup MIL-1399 mode
MIL-1399 mode
In MIL-1399 mode the test group is configured to test current harmonics according to MIL-STD-1399 –
Section 300B as published by Department of Defense Interface Standard – Electric Power, Alternating
Current.The
page 77) tab and the minimum measurement parameters and auto current ranging will be fixed.
MIL-1399 Current Harmonics
(see page 86) test will become available under the Test (see
MIL-1399 mo
PA3000andPA4000MIL-1399mode
de is available when interacting with PA3000 and PA4000 instruments.
IEC 61000-3-2 mode
In IEC 61000-3-2 mode the measurement group is configured to perform current harmonics measurements
le for pre-compliance testing to IEC 61000-3-2 standard. The IEC 61000-3-2 Current Harmonics
suitab
(Pre-compliance) (see page 91) test will become available under the Test (see page 77) tab and the minimum
measurement parameters along with auto-up only current ranging
The IEC 61000-3-2 mode is available w hen interacting with PA1000 instruments.
00 IEC 61000-3-2 mode
PA10
(see page 51) will be pre-selected.
PWRVIEW Online Help 47
Page 60

Setup Filter
Filter
Depending on the connected instrument a number of filter selections will be available. These are all low
pass filters designed to remove high frequency components. See the instrument user manual for more
information
The PA3000 and PA4000 have the following filter selections.
The PA1000 has the following filter selections.
.
48 PWRVIEW Online Help
Page 61

Setup Frequency source
Frequency source
To a ccurately measure most measurement parameters the frequency of the s ignals must be determined.
The frequency source selects the method by which this frequency is measured. The mode
selection af
is used to detect the frequency by looking at the zero crossings of the waveform. The voltage channel is
used by default, but current should be used if only measuring current or if the current waveform is less
distorted than the voltage so that the frequency can be determined more accurately. The PA3000 and
PA4000 also offer an external frequency option.
When Test is selected in the Application Mode, Voltage is the only available frequency source.
The PA3000 and PA4000 have the following frequency source selections.
fects the frequency detection operation, but generally either the voltage or the current channel
(see page 41)
The PA1000 has the following frequency source selections.
PWRVIEW Online Help 49
Page 62

Setup Frequency range
Frequency range
When the PA3000 Application Mode is set to Measure, the frequency range setting configures the
fundamental frequencies that can be measured. Normally this is only needed when making very low
frequency me
frequency range is fixed at > 10 Hz.
asurements, probably in PWM mode. When the application mode is set to Test, the
DC can be mea
The frequency range is only available for the PA3000 and PA4000.
sured in all ranges.
50 PWRVIEW Online Help
Page 63

Setup Voltage channel
Voltage channel
The Voltage Channel section allows the set up of ranging and scaling as shown below.
1. Use the Range selection to select auto range (when available) or to select fixed individual ranges
applicable to the connected instrument.
For example, if the PA3000 is connected, the following ranges are applicable:
2. Use Scaling to provide a method to adjust the measured value where voltage probes or voltage
transformers are used.
The Scaling value entered is multiplied by the applied voltage to give the correct scaled voltage value.
Current Channel
The Current Channel section allows the set up of ranging and scaling as well as the current shunt selection.
1. Use the Range selection to select auto range (when available) or to select fixed individual ranges
applicable to the connected instrument.
For example, if the PA3000 is connected, the following ranges are applicable:
PWRVIEW Online Help 51
Page 64

Setup Current Channel
2. Use Scaling to provide a method to adjust the measured value where current transformer, current
clamps, or specific custom shunts are being used. The value entered as Scaling is multiplied by the
applied current to give the correct scaled current value.
3. Use the Shunt selection to select a shunt to use for current measurements. Make sure the selection
matches the location where the current is connected on the instrument.
The PA3000 has the following shunt selections.
The PA1000 has the following shunt selections.
52 PWRVIEW Online Help
Page 65

Setup Measurement selections
Measurement selections
The Measurement selections allow the required measurements to be checked for inclusion in the
measurement results returned by the instrument. The available options depend on the type of instrument
and the measu
available in Integrator mode
Sum results
rement mode. In the figure below, a number of options grayed out because they are results
(see page 45) only and Normal mode (see page 42) is selected. Enabling t he
(see page 53) adds an extra Sum column to the group in the measurement results.
Volts Harmonics, Amp, and Watts Harmonics
Distortion Factor
(see page 60) automatically expand to give further options.
(see page 58), Total Harmonic Distortion (see page 59),and
Sum results
Selecting Sum results creates an extra column in the measurement results that shows the Sum values
computed according to the wiring type of the group. The formulas or equations used to calculate the
results are shown in the following links:
PWRVIEW Online Help 53
Page 66

Setup 1P3W Sum formulas
1P3W Sum formulas (see page 54)
3P3W Sum formulas (see page 56)
3P4W Sum formulas (see page 57)
For additional information on using Sum formulas or Sum equations, refer to the Sum Equations section
in the PA3000 User Manual.
NOTE. The Sum results are not available when selecting the 1p2W wiring type.
1P3W Sum formulas
The formulas used to compute the Sum results for 1P3W measurements are as follows:
54 PWRVIEW Online Help
Page 67

Setup 1P3W Sum formulas
PWRVIEW Online Help 55
Page 68

Setup 3P3W Sum formulas
3P3W Sum formulas
The formulas used to compute the Sum results for 3P3W measurements are as follows:
56 PWRVIEW Online Help
Page 69
Setup 3P4W Sum formulas
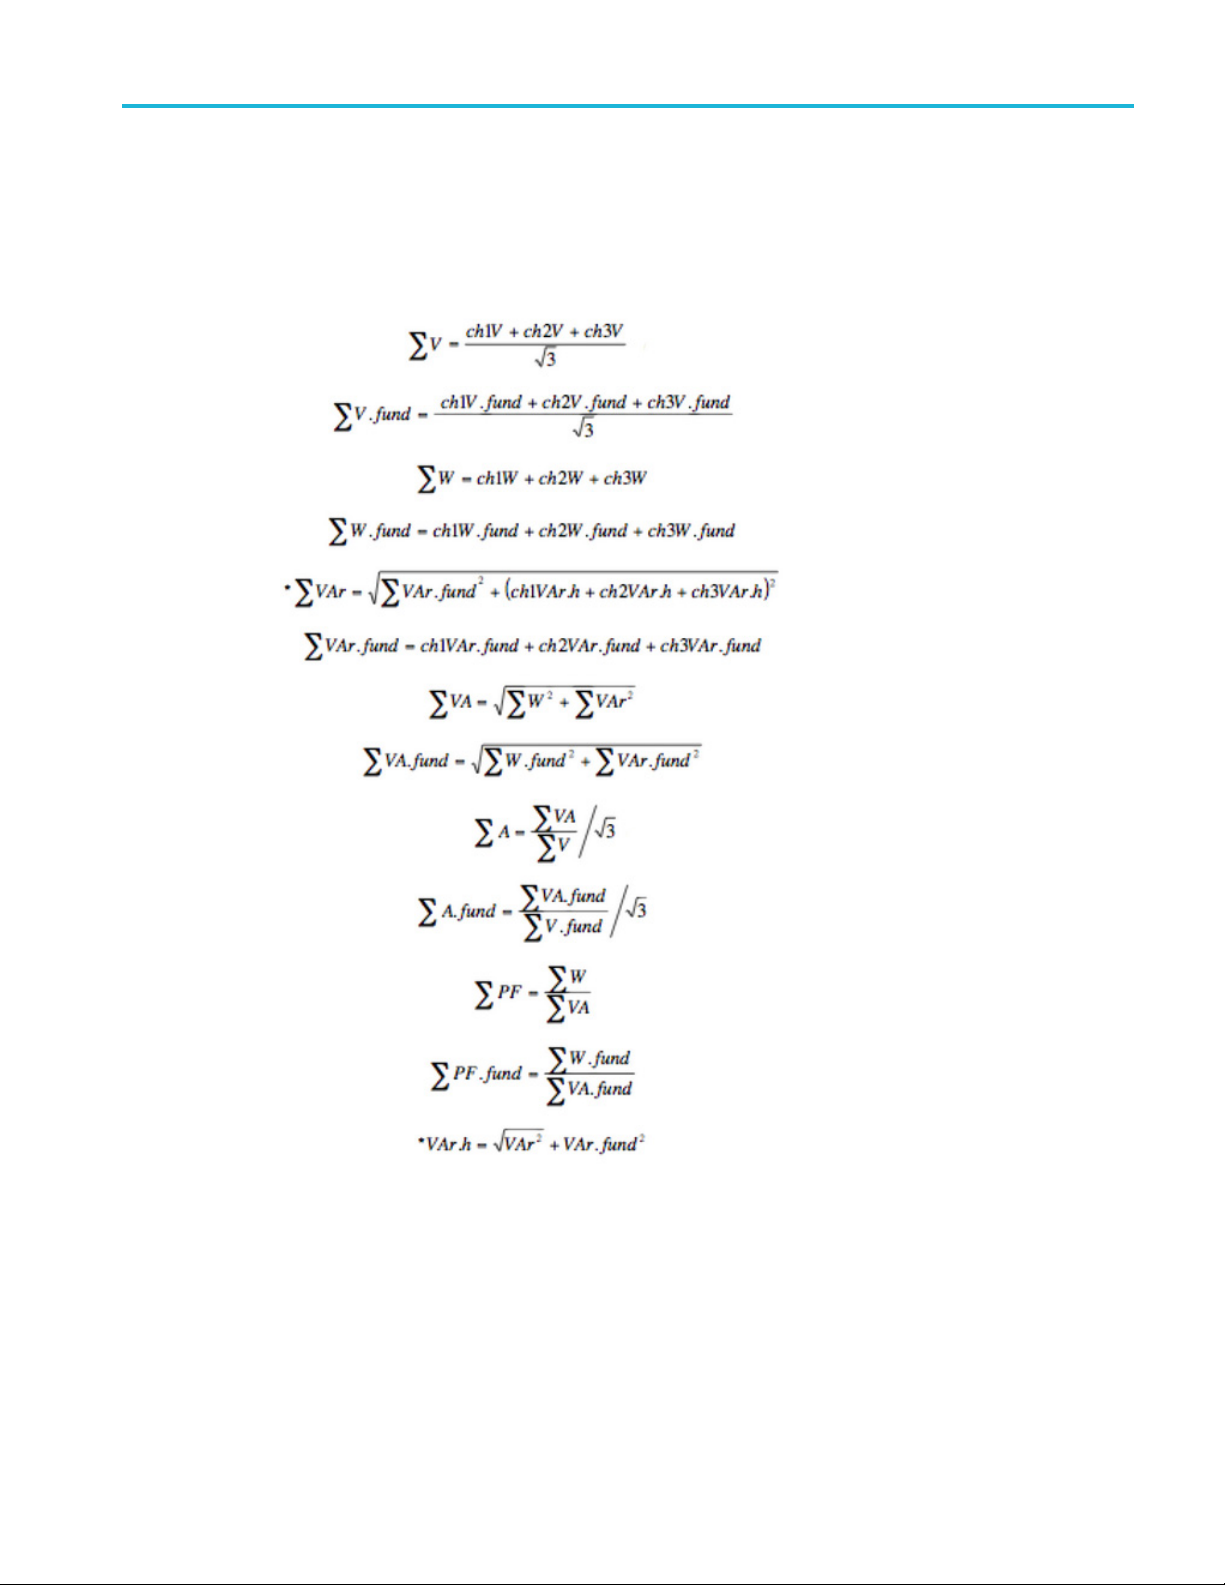
3P4W Sum formulas
The formulas used to compute the Sum results for 3P4W measurements are as follows:
PWRVIEW Online Help 57
Page 70

Setup Harmonics
Harmonics
Depending on the power analyzer, either 50 or 100 harmonics are available. The PA1000 supports 50 and
the PA3000 and the PA4000 support 100 harmonics.
You can view only odd harmonics or both odd and even harmonics.
The h armonic results can be selected as the absolute values (the actual reading) or as a percentage of
the fundamental (harmonic 1).
58 PWRVIEW Online Help
Page 71

Setup Total harmonic distortion
Total harmonic distortion
THD (Total Harmonic Distortion) is a measure of the distortion of a waveform.
Voltage and Current (Vthd & Athd) are available as separate selections. The minimum & maximum
harmonics to use for the computation are shown. The maximum is adjustable. Odd and Even or Odd
Only harmonics can be selected .
You can choose whether to include DC in the formula, and whether the measurement is expressed as a
percentage of the fundamental or the RMS value.
The selection of harmonics used in the THD measurement is independent of Volts Harmonics and Amp
Harmonics (see page 58) results. However the selections for the THD measurement must be a subset of
the Volts and Amps Harmonics selection. For example, the THD measurement could include odd only
harmonics 2 through 21, yet the Volts and Amps Harmonics could be configured for odd and even 1
through 50. If necessary, PWRVIEW will automatically adjust the Volts and Amps Harmonics selections
to accommodate THD selections.
The formulas for voltage and current THD are:
PWRVIEW Online Help 59
Page 72

Setup Distortion factor
The Total Harmonic Distortion formula (sometimes referred to as the series formula) will produce more
accurate results when the THD is less than 5%. It is important to set the maximum harmonic setting to
cover the majo
theharmoniccount,themoreaccuratetheresult.
rity of the harmonic components contained in the signal being measured. The higher
Distortion factor
Distortion Factor is a measure of the distortion of a waveform. Voltage and Current (Vdf & Adf) are
available as separate selections. You can choose whether the measurement is expressed as a percentage
of the fundamental or the RMS value.
The formulas for voltage and current Distortion Factor are:
Auxiliary inputs
The PA3000 and PA4000 have four analog inputs on the rear of the instrument. Each of the four inputs
can be used to measure signals from a device such as a torque sensor. Each of the four inputs has two
differentranges. Therangesare±10Vand±1V.
The PA3000 and PA4000 also h ave two counter inputs on the Auxiliary Inputs connector on the rear of the
instrument. Either of these can be used as an external frequency source for signals where there is too much
noise or speed sensors. Each of the two counter inputs accepts TTL-compatible square wave signals.
60 PWRVIEW Online Help
Page 73

Setup Equation guidelines
The Auxiliary Inputs option on the Instrument Tab must be enabled as shown in the following figure to
view and configure the auxiliary inputs.
NOTE. The Auxi
After the Auxiliary Inputs option is enabled, the Auxiliary Inputs tab becomes available as shown in the
following figure.
You can configure the label, units, and equation to be calculated from the measurement read from each
of the auxiliary inputs. You can also set the range for each of the four analog inputs and select which
ry inputs are enabled.
auxilia
liary Inputs option is not available for the PA1000.
Equation guidelines
Here is a brief explanation on the configurable columns in the Auxiliary Inputs screen:
Label. While measuring the auxiliary input, you can name a custom equation that is being configured.
For example: Torque.
PWRVIEW Online Help 61
Page 74

Setup Equation guidelines
Units. Specify the unit in which the measurement should be read, such as NM or RPM.
Equation. The
details.
Range. 1 V or 10 V c an be selected based on the Auxiliary input Volts Range of the physical input
being provided.
Enabled. If
displayed in the Measure tab.
Use the following guidelines to help configure the equation.
Equations can be a scaling number, expression, or empty.
Scaling numbers can be either integers or simple floating point values.
Expressions must contain the base name for the specific input source. Expressions can also contain
arithmetic operators and numbers. Parenthesis are also supported.
The defined base names are: ANA1, ANA2, ANA3, ANA4, COUNT1, COUNT2. They are not case
sensitive.
Arithmetic operators include operators and simple numbers.
Supportedoperators: +,–,/,*,(,)charactersareallowed.
formula o r equation to be calculated from the measurement read. See below for more
the check box is selected, the Auxiliary input will be considered for measurement and will be
ers include integers and simple floating point values such as 20, -35, 0.23, 100.15, -0.5
Numb
62 PWRVIEW Online Help
Page 75

Measure Measure
Measure
Use the Measure tab to control, log, monitor, and chart measurements. The Me asure tab is only available
when Application mode under the Setup tab is set to Measure. The Measure tab allows you to perform the
following ta
Start (see page 63) the measurements
Stop (see page 64) the measurements
Reset (see page 65) averaging and Min and Max values
Setup Limits (see page 18) for different limit categories
Set the Significant Figures (see page 65) or number format shown in the results grid (see page 71)
sks:
Set the Av
Turn on/off Zero Blanking (see page 66)
Enable/disable Efficiency (see page 18) measurement
Control Integration (see page 67)
Chart (see page 72) measurement results
Perform data logging (see page 67)
Monit
Ribbon options available on the Measure tab:
eraging
or measurement results in the results grid
(see page 66) depth
(see page 71)
Start
The Start button starts the measurement process to list the results into the results grid as shown below:
PWRVIEW Online Help 63
Page 76

Measure Stop
Stop
The Stop button stops the current measurement cycle.
64 PWRVIEW Online Help
Page 77

Measure Reset
Reset
Use the Reset button to reset the averaging (see page 66), all Min and Max results, and inrush
measurements when in inrush mode
start averag
ing the results again. Large averaging values can take a long time to show changes.
(see page 46).Thisisusefultofind new Min and Max values and to
Significant figures
The significant figures affect the results and determine the number of digits displayed.
The foll
owing figure specifies five significant figures to give a fixed width of five digits.
PWRVIEW Online Help 65
Page 78

Measure Aver aging
Averaging
Averaging is a function that smooths out results to improve the readability of varying quantities. The
higher the averaging, the more stable the result will be. You can specify an averaging depth up to 64. The
default aver
response to large step changes. Normally leave the setting to Auto. Click the Reset
restart the averaging process.
aging is Auto, which is effectively an averaging of eight with an algorithm that improves the
(see page 65) button to
Zero Blanking
Turn off Zero Blanking to see very small readings that would normally show up as zero.
66 PWRVIEW Online Help
Page 79

Measure Integration
Integration
Integration can be controlled using the Integrator Start/Stop/Reset buttons available on the Measurement
ribbon. On pressing Start, the integrator will start running on the instrument and integrator results will
begintoaccu
Reset clears the integrator results to zero. These controls are only visible when at least one group is
configured for the Integrator Mode.
xxx
mulate. The button will also change to a S top button which is used to stop the integrator.
(see page 45)
or
Data logg
Data logg
Snapshot (see page 67) takes the results as shown in the results grid (see page 71) and saves them to
a file.
Record (see page 68) saves all measurement results continuously to a database system for later
exporting and analysis.
Snapshot
Snapshot saves a copy of the results grid in CSV format for reading into spread sheet applications.
ing
ing allows recording and exporting measurement results.
Click the down arrow f or more snapshot options such as view after creation:
PWRVIEW Online Help 67
Page 80

Measure Record
Upon clicking Snapshot all listed results are exported to the CSV format. A Save As dialog box prompts
you for a location and file name for saving the file. When View after creation is checked, the file will
be automatically opened for viewing.
Record
Click Record at any time to immediately start recording all measurement results to the PWRVIEW
database system.
68 PWRVIEW Online Help
Page 81
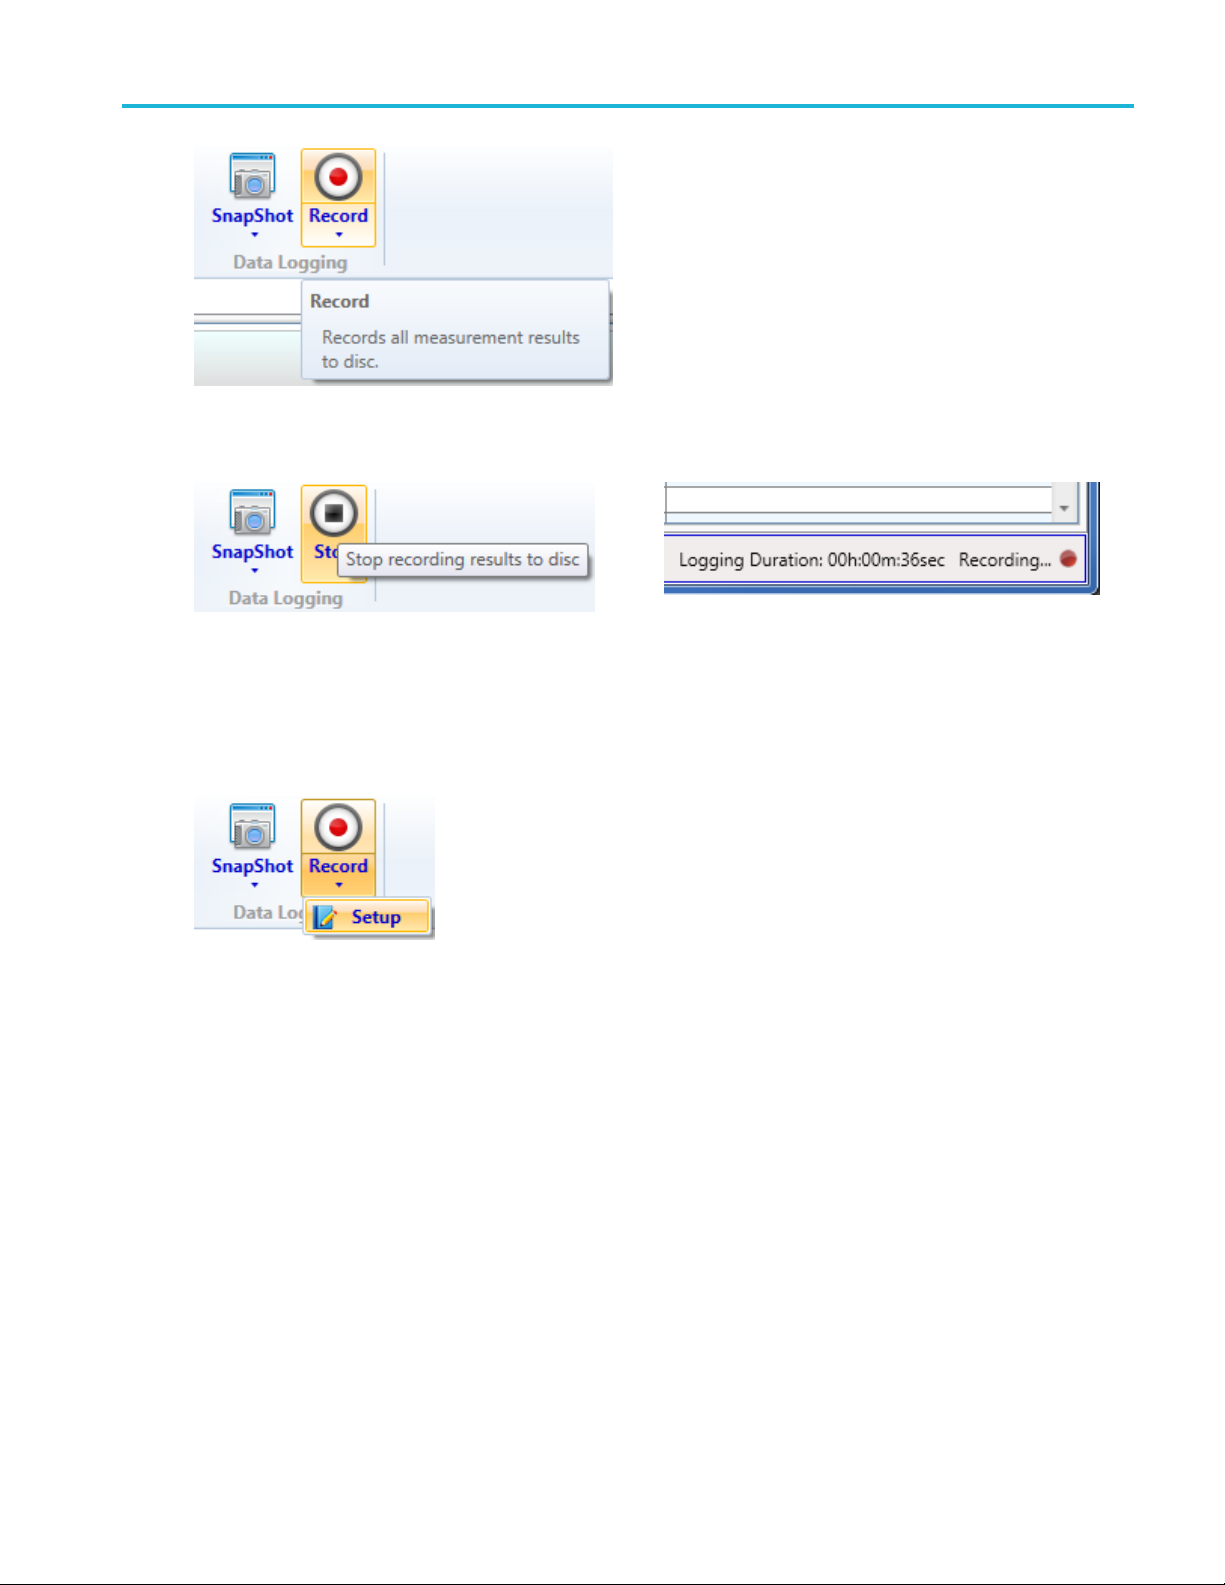
Measure Record
The Status Bar indicates that results are b eing recorded and the Record button will change to Stop.
xxx
The minimal amount of data to represent all measurement results is stored to the database to save space
- not the
results shown on the results grid. This means that results that can be computed from the other
results are not stored in the database.
he down arrow for more record options such as data logging setup.
Click t
Selecting the Setup option opens the Data Logging Setup dialog box to configure the logging duration
and interval. The logging duration can be set to log data until stopped or for a specific duration in days,
hours, minutes, and seconds. The logging interval can be specified to log data as fast as possible, at a
specific interval, or manually.
PWRVIEW Online Help 69
Page 82

Measure Record
If Log Data Manually is selected, a log button appears on the status bar when the data logging has started.
Data logging will only occur whenever the log button is selected. A counter shows the amount of
logged data.
70 PWRVIEW Online Help
Page 83

Measure Measurement results and charts
Measurement results and charts
Measurement results are shown in the results grid (see page 71) or charted (see page 72) as Harmonic Bar
(see page 73), Wa veform (see page 74),orTrend (see page 75) charts.
Results grid
The results grid is used to view the results from all instruments and to compute other values by entering
formulas and text
width can b
click when the grab cursor displays) and dragging them to the desired width.
(see page 72). Only cells in the Formula column can be edited. The formula column
e re-sized by grabbing the dividing lines of the header row (hold the left mouse button and
Hovering
reset these values to the present reading and begin accumulating the Min and Max values again.
Right-click the mouse within the results column to open a dialog box with options for handling the data
such as adding or editing limits or adding a Trend measurement.
the mouse over a result will display Min and Max values. Click the Reset
(see page 65) button to
PWRVIEW Online Help 71
Page 84

Measure Formulas and text
Formulas and text
Custom formulas and text can be entered into the results grid. This allows the calculation and labelling
of parameters to be computed across multiple instruments. All arithmetic operations of +, -, *, and / are
available. T
sheet type Row/Column notation where the row number is the table index and column letter shown in
each results column. Clicking the desired cell automatically fills in the Row/Column information. Type '='
followed by the formula, or omit the '=' and enter text. For example, an efficiency calculation is shown.
erms can be placed in brackets to control the order of computation. Use standard spread
Charts
Different chart types are available to view for different types of information. Available options are:
Harmonic Bar Charts (see page 73)
Waveform Charts (see page 74)
Trend Charts (see page 75)
A number of charts can be added to the Measure tab and customized as needed.
When selecting Harmonics, Waveform, or Trend from Charting a new tab appears. Click them to create
one of the available charts. Multiple charts of each type can be created for Harmonics, Waveform, and
Trend charts. The total number of charts that can be created is three times the number of instrument
72 PWRVIEW Online Help
Page 85

Measure Harmonic bar charts
channels shown in the results grid. The Harmonics, Waveform, and Trend buttons are disabled when the
limit is reached.
Harmonic bar charts
Harmonic bar charts are useful to view the relative strengths of the harmonic amplitudes. Hovering
over the individual harmonic bar presents the harmonic number, harmonic absolute a mplitude, and the
percentage
NOTE. If no harmonics are selected on the Setup screen, the Harmonics graph feature displays a blank
screen.
value with respect to fundamental harmonic.
PWRVIEW Online Help 73
Page 86

Measure Waveform charts
Waveform charts
Waveform charts show the waveform being measured by the power analyzer.
PWRVIEW waveforms are constructed using the harmonic data collected from the power analyzer. The
accuracy of the waveform depends on the amount of h armonic information available. For optimum results,
select maximum number of harmonics to display in the setup area. Selecting 50 harmonics for the PA1000
and 100 harm
NOTE. If no harmonics are selected on the Setup screen, the Waveform feature displays a blank screen.
onics for the PA3000 gives the best results.
The Wavefo
rm feature cannot display DC waveforms.
74 PWRVIEW Online Help
Page 87

Measure Trend charts
Trend charts
Trend charts are useful to view the trend of a selected measurement over a period of time.
Activate the Trend chart by either clicking on the Trend button on the Measure tab or by right-clicking the
desired value in the Measure Grid and then clicking Trend Measurement.
To refresh/reset the chart, click the Reset button. Resetting the trend chart will not affect logging results.
PWRVIEW Online Help 75
Page 88

Measure Trend charts
76 PWRVIEW Online Help
Page 89

Test Test tab
Test tab
The Test tab allows for the setup and execution of various power standards tests. The Test tab is only
available when the Application Mode under the Setup tab is set to Test.
PWRVIEW will only run one test type at a time. The test will be run o n a single channel of the instrument.
If multiple instruments or channels are added in the Setup tab, the last configured test will replace any
previously
The selected test type, instrument, and channel are displayed to the right of the Start button. Go back to
the Setup t
configuration options.
configured tests.
ab if you need to change any of these selections. The Test ribbon includes the test details and
T
PWRVIEW s upports three different test types:
IEC 62301 Standby Power. This test is designed to test according to IEC 62301 Measurement of Standby
Power. It uses the Sampling method as defined in this standard. The IEC 62301 Standby Power test is
available for the PA3000, PA4000, and PA1000 instruments.
MIL-1399 Current Harmonics. This test is designed to test current harmonics according to MIL-STD-1399
– Section 300B as published by Department of Defense Interface Standard – Electric Power, Alternating
Current. Available for PA3000 and PA4000 instruments.
IEC 61000-3-2 Current Harmonics (Pre-Compliance). This test is designed to test current harmonics
cording to the limits specified in the IEC 61000-3-2:2014 Ed.4 and IEC 61000-4-7:2002+A1:2009
ac
(including interharmonics) standard. Available for PA1000 instruments.
est
The Test section of the Test ribbon contains a Start/Stop button and a read-only summary of test
configuration as selected in the Setup
(see page 13) tab.
PWRVIEW Online Help 77
Page 90

Test Test
Start / Stop button
The Start/
to Stop when the test is running. Click the button to start the test. Click Stop to stop the test and to save
the test results to the results database.
Stop button allows the control of the test execution. This button shows Start initially but changes
Test configuration summary
The test configuration summary shows three essential fields:
Test Type. Thetypeoftestselected
Instrument. The instrument to use for testing
Channel. The instrument channel from which to take the results used for the test
78 PWRVIEW Online Help
Page 91

Test Test details
Test details
Use the Details area to enter specific details of the test, including the following information:
The Laboratory (see page 79) defines the institution performing the testing.
The Customer (see page 80) defines who the testing is being done for.
The Product (see page 80) defines information about the product being tested.
o
The Test Inf
(see page 82) provides a way to enter test information for reporting p urposes.
Laboratory
Add, Delete, or Select the Laboratory using the buttons below the list box on the left. Click the Edit button
to make c
hanges to the Laboratory information. The information will be added to test reports.
PWRVIEW Online Help 79
Page 92

Test Customer
Customer
Add, Delete, or Select the Customer using the buttons below the list box on the left. Click the Edit button
to make changes to the Customer information. The information will be added to test reports as well as
providing a c
onvenient method for a laboratory to manage the customer contacts.
Product
Add, Delete, or Select the Product using the buttons below the list box on the left. Click the Edit button to
make changes to the Product information. A Manufacturer
of manufacturer information. The information will be added to test reports.
(see page 81) product field allows management
80 PWRVIEW Online Help
Page 93

Test Manufacturer
Manufacturer
Add, Delete, or Select the Manufacturer using the buttons below the list box on the left. Click the Edit
button to make changes to the Manufacturer information. The information will be added to test reports.
PWRVIEW Online Help 81
Page 94

Test Test info
Test info
Test Info is the place to enter test information for reporting purposes.
You can enter the following information:
Test o fficer name
Ambient temperature
Relative hu
Test n otes
NOTE. Temperature and humidity are not measured. The values entered by the user will be used on the
test report.
midity
IEC 62301 Standby power test
The Standby Power test is designed to test according to IEC 62301 Edition 2.0 Measurement of Standby
Power. It uses the Sampling method as defined in this standard and can be used to measure the standby
power of any appliance.
Measurement parameters and limits are derived from the information entered into the fields on the left
side of the screen:
Test Time Duration sets the minimum test time period which must pass (15 minutes is the minimum
defined in IEC 62301 ED 2.0). This test time can exceed the minimum required if the equipment under
82 PWRVIEW Online Help
Page 95

Test Power plot
test operates with a cycle time greater than this. The test can run longer than the default minimum time
until either the power stability
Power Limit sets the maximum average power allowed over the last two-thirds of the test to pass. The
power limit should be derived from the standards applicable to the device under test.
Test Voltage and Frequency are checked to be within the limits defined in IEC 62301 ED 2.0.
(see page 85) criteria is met or three hours have passed.
On the right side of the screen, the Power Plot
the test. The Voltage Quality
parameters are displayed under the Power Plot chart.
(see page 84), Power Stability (see page 85) and Uncertainty (see page 85)
(see page 83) chart shows power measurements taken during
Power plot
The power readings are shown as a graph that automatically scales both power and time axis.
PWRVIEW Online Help 83
Page 96

Test Voltage quality
Voltage quality
During a Standby Power measurement, the voltage quality, as defined in IEC 62301 ED 2.0, is continuously
monitored. If any of the parameters go outside of specification, then the result box will turn red.Anorange
result box will be shown if the current reading is within specification but it has gone outside of specification
in the past. Any single result outside of specification at any point during the test will result in a FA I L .
Volts.
VCF. The Voltage Crest Factor
VTHC. The Voltage Total Harmonic Content
The measured line voltage
84 PWRVIEW Online Help
Page 97

Test Power stability
Power stability
Power stability is measured according to IEC 62310 ED 2.0.
Watts Averag
Watts Average 2/3. The average power during the second two thirds of the test
Stability. Determined by a linear regression over the last two thirds of the test and is shown in red if
the stability criteria is not met.
Uncertainty
Uncertainty is checked according to IEC 62301 ED 2.0. MCR and Ulim are defined by the standard. Ulim
is the limit of uncertainty and Ures is the uncertainty of the result (as calculated from the specification
instruments). Ures must always be less than Ulim. If this is not true for any single measurement,
of the
then the results box will turn red.Anorange results box means that the current Ures value is within
specification but has previously gone outside of specification. Ulim and Ures are used in the Standby
Power Results to compute the value of TUR (Test Uncertainty Ratio) which is defined a s Ulim/Ures. This
figure gives a convenient representation of how close Ures is to Ulim. If TUR is < 1 then the test is failed.
e1/3. The average power during the first third of the test
PWRVIEW Online Help 85
Page 98

Test Test status
Test status
The Test status shows one of the following:
Running. The
PASS. The test has passed.
FAIL. Thetesthasfailed.
N/A. Not Ap
test is running.
plicable. This is because the test has not been run long enough to determine PASS or FAIL
MIL-1399 Current Harmonics test
The MIL-1399 Current Harmonics test is designed to test current harmonics according to MIL-STD-1399 Section 300B as published by Department of Defense Interface Standard – Electric Power, Alternating
Current.
The MIL-1399 Current Harmonics test limit-checks all the individual current harmonic values up to 100
harmonics against the levels set by the standard. Enter information into the Rated Amps Fundamental field;
ftware will limit-check all 100 harmonics including the measured fundamental based on the standard.
the so
The standard set limits are displayed on the graph with a dashed line. To fully comply with the standard,
the individual current harmonics should be at or below the set limit as discussed in Limit
section. Any individual current harmonics that exceed these limits are displayed as red bars on the graph
view. If any of the current harmonics exceed the set level, the overall Test Status displays Run Failing.
(see page 88)
Measurement parameters and limits are derived from the information entered into the following fields
on the left side of the screen:
Limit class as described in the Limit (see page 88) section
Rated Amps Fundamental
Test Time Duration
n the right side of the screen, all harmonics measurement results
O
can be displayed in either graph or table format.
(see page 89) taken during the test
86 PWRVIEW Online Help
Page 99

Test MIL-1399 Current Harmonics test
The following figure is an extreme case where the Rated Amps Fundamental is set to be lower than the real
rated cu
rrent to display the failing harmonics clearly. (Not a real scenario)
PWRVIEW Online Help 87
Page 100

Test Test limits
Test limits
MIL-1399 Current Harmonics Test limits can be set using the drop down menu on the left column.
Based on the MIL-1399 standard, there are four limits to choose from.
60 Hz user equipment greater than or equal to 1 kVA
This option is applicable to user equipment or aggregate with power ratings ≥ 1 kVA and fundamental
frequency of 60 Hz. This setting checks individual current harmonics at or above 60 Hz, up to 2000 Hz
against 3% of the fundamental current amplitude. This applies to the 2
Additionally it also checks any harmonic line current above 2000 Hz through 20 kHz against a limit line of
(6000/f) percent of the fundamental full load current, where, f is the nominal frequency of that particular
harmoni
c current. This applies to the 34
th
through the 100thharmonic.
nd
through the 33rdharmonic.
60 Hz user equipment less than 1 kVA
This option is applicable to user equipment or aggregate with power ratings < 1 kVA and fundamental
frequency of 60 Hz. This setting checks any harmonic line current from 60 Hz through 20 kHz against a
limit line of (6000/f) percent of the fundamental full load current, where, f is the nominal frequency of that
particular harmonic current. This applies to the 2
z user equipment greater than or equal to 0.2 kVA
400 H
nd
through the 100thharmonic.
This option is applicable to user equipment or aggregate with power ratings ≥ 0.2 kVA and fundamental
quency of 400 Hz. This setting checks individual current harmonics at or above 400 Hz up to 13.33 kHz
fre
against 3% of the fundamental current amplitude. This applies to the 2
ditionally, it also checks any harmonic line current above 13.34 kHz through 20 kHz against a limit
Ad
nd
through the 33rdharmonic.
line of (40,000/f) percent of the fundamental full load current, where, f is the nominal frequency of that
particular harmonic current. This applies to the 34
th
through the 50thharmonic.
400 Hz user equipment less than 0.2 kVA
This option is applicable to user equipment or aggregate with power ratings < 0.2 kVA and fundamental
frequency of 400 Hz. The setting checks any harmonic line current from 400 Hz through 20 kHz against a
limit line of (40,000/f) percent of the fundamental full load current, where, f is the nominal frequency of
that particular harmonic current. This applies to the 2
nd
through the 50thharmonic.
88 PWRVIEW Online Help
 Loading...