

Page 1

OSCILLOSCOPE
ANALYSIS AND
Adding Live Oscilloscope Data to Popular Analysis Software
Includes Excel
CONNECTIVITY
, Visual Basic, MATLAB
MADE EASY
and LabVIEW
Examples
Page 2

Copyright Tektronix Inc. All rights reserved. Licensed software products
are owned by Tektronix or its suppliers and are protected by United States
copyright laws and international treaty provisions. LabVIEW and
LabWindows™/CVI are trademarks of National Instruments Corporation.
Mathcad is a registered trademark of MathSoft, Inc. MATLAB is a registered
trademark of The MathWorks, Inc. Microsoft and Excel are trademarks and
Windows is a registered trademark of Microsoft Corporation.
Tektronix, Inc., P.O. Box 500, Beaverton, OR 97077
Tektronix and Tek are registered trademarks of Tektronix, Inc.
Software on the CD is provided AS IS with no warranties of any
Note:
kind, specifically excluding WARRANTIES OF MERCHANTABILITY
AND FITNESS FOR A PARTICULAR PURPOSE. Tektronix, Inc.
assumes no liability of any kind for your use of this software.
Page 3

Table of Contents
PREFACE........................................................................................................................................XI
What This Book is About.................................................................................................................. xi
Who Should Read This Book........................................................................................................... xi
How This Book is Organized............................................................................................................ xi
Document Conventions....................................................................................................................xii
CHAPTER 1: CONNECTIVITY BUILDING BLOCKS ..................................................................... 1
Connectivity Made Easier ................................................................................................................. 1
Built-in Connectivity Features ........................................................................................................... 1
New Connectivity Building Blocks..................................................................................................... 3
TekVISAA Standard Way to Connect....................................................................................... 4
MATLAB’s Instrument Control Toolbox.......................................................................................... 9
PART 1: EXCEL AND VISUAL BASIC .......................................................................................... 11
CHAPTER 2: THE TEKEXCEL TOOLBAR................................................................................... 13
Introduction ..................................................................................................................................... 13
Toolbar Prerequisites.................................................................................................................. 13
Toolbar Features......................................................................................................................... 14
Adding the TekExcel Toolbar to Excel............................................................................................14
Connecting to Oscilloscopes........................................................................................................... 15
Saving and Restoring Scope Settings.............................................................................................16
Save Settings from the Scope.....................................................................................................17
Assign Stored Settings to the Scope...........................................................................................20
Capturing and Graphing Waveforms...............................................................................................21
Clearing the Active Sheet................................................................................................................24
Capturing and Graphing Measurements......................................................................................... 24
Capture Single Measurement(s)................................................................................................. 24
Capture and Graph Repeated Measurement(s).......................................................................... 27
Capturing Triggered Waveforms..................................................................................................... 31
Getting Help with the TekExcel Toolbar..........................................................................................34
TekExcel Toolbar Source Code...................................................................................................... 35
Chapter 2 Review ...........................................................................................................................35
CHAPTER 3: UNDERSTANDING THE TEKVISA ACTIVEX CONTROL ....................................37
Introduction ..................................................................................................................................... 37
Background Information.................................................................................................................. 37
Terminology .................................................................................................................................... 38
Automated Acquisition .................................................................................................................... 38
Native GPIB Commands and Queries ........................................................................................ 39
i
Page 4

TekVISA ActiveX Control Methods, Properties, and Events .......................................................39
CHAPTER 4. A SIMPLE PROGRAM TO GET WAVEFORMS ......................................................41
Introduction .....................................................................................................................................41
GPIB Commands for Waveform Acquisition....................................................................................41
Waveform Data ...........................................................................................................................41
Waveform Preamble....................................................................................................................43
The TekVISA ActiveX Control and Waveform Acquisition...............................................................43
The GetWaveform Method..........................................................................................................43
Other Methods of Waveform Acquisition.....................................................................................43
Getting Started................................................................................................................................ 44
What You Need to Get Started....................................................................................................44
What You Will Do ........................................................................................................................45
What You Will Learn....................................................................................................................47
The Get Waveform Example in Excel VBA .....................................................................................48
Building the Form........................................................................................................................48
Getting Help ................................................................................................................................53
Changing Properties in the Properties Window...........................................................................54
Using the Object Browser (F2)....................................................................................................57
Coding the Event Procedures .....................................................................................................60
Running the GetWaveForm Program..........................................................................................69
Running the Program with the Jitter Example .................................................................................71
Using VB Instead of VBA ................................................................................................................74
Chapter 4 Review............................................................................................................................76
CHAPTER 5. A MORE COMPLEX FOUR-PART PROGRAM .......................................................77
Introduction .....................................................................................................................................77
What You Need to Get Started....................................................................................................77
What You Will Do ........................................................................................................................78
What You Will Learn....................................................................................................................80
The TekVISA Test Run Example in Excel VBA...............................................................................81
Building the Form........................................................................................................................81
Changing Properties in the Properties Window...........................................................................81
The Current Devices List Box......................................................................................................83
The Measurement Commands Frame.........................................................................................84
The Waveform Data Frame.........................................................................................................87
The Send GPIB Commands Frame ............................................................................................93
Running the TekVISA Test Run Program....................................................................................95
Using VB Instead of VBA ................................................................................................................97
Chapter 5 Review............................................................................................................................98
CHAPTER 6: A MEASUREMENT CHARTING EXAMPLE........................................................... 99
Introduction .....................................................................................................................................99
What You Need to Get Started....................................................................................................99
ii
Page 5

What You Will Do...................................................................................................................... 100
What You Will Learn ................................................................................................................. 103
The Chart Measurements Example in Excel VBA.........................................................................104
Building the Form...................................................................................................................... 104
Changing Properties in the Properties Window ........................................................................104
Initialization ............................................................................................................................... 107
Choosing Measurements.......................................................................................................... 109
Displaying Results ....................................................................................................................116
Running the Chart Measurements Program .............................................................................120
Using VB Instead of VBA.............................................................................................................. 121
Chapter 6 Review .........................................................................................................................124
CHAPTER 7: A TRIGGERED WAVEFORM CAPTURE EXAMPLE........................................... 127
Introduction ................................................................................................................................... 127
Getting Started.............................................................................................................................. 127
What You Need to Get Started ................................................................................................. 127
What You Will Do...................................................................................................................... 128
What You Will Learn ................................................................................................................. 130
The Triggered Waveform Capture Example in VB........................................................................ 130
Building the Form...................................................................................................................... 130
Getting Help.............................................................................................................................. 141
Reviewing the Code.................................................................................................................. 143
Running the Triggered Waveform Capture Example ................................................................ 158
Using VBA Instead of VB.............................................................................................................. 162
Chapter 7 Review .........................................................................................................................163
PART 2: MATLAB AND LABWINDOWS/CVI AND LABVIEW................................................... 165
CHAPTER 8: LIVE UPDATES TO MATLAB USING ICT ...........................................................167
Introduction ................................................................................................................................... 167
What You Need to Get Started ................................................................................................. 167
What You Will Do...................................................................................................................... 168
What You Will Learn ................................................................................................................. 168
The Instrument Control Toolbox....................................................................................................168
Configuring VISA Resources .................................................................................................... 169
Communicating with VISA-GPIB Objects..................................................................................169
Using the Instrument Control ASCII Communication Tool ........................................................ 170
Cleaning up Instrument Objects during Debugging ..................................................................172
The Jitter Example with MATLAB ICT Functions.......................................................................... 173
Creating the jitter2 Function...................................................................................................... 174
Testing Automatic Waveform Acquisition.................................................................................. 182
Improved Jitter Example with a GUI Interface............................................................................... 184
Adding GUI Components to the Solution.................................................................................. 184
Performing an Interim Test........................................................................................................189
iii
Page 6

Modifying Auto-Generated Functions........................................................................................189
Testing the Improved Solution...................................................................................................204
Chapter 8 Review..........................................................................................................................206
CHAPTER 9: LABWINDOWS/CVI AND LABVIEW ....................................................................207
Introduction ...................................................................................................................................207
Tektronix Plug-n-Play Drivers........................................................................................................207
Overview of LabWindows/CVI.......................................................................................................208
Using Tektronix Plug-n-Play Drivers with LabWindows/CVI..........................................................209
Loading the Driver.....................................................................................................................209
Building the Interface.................................................................................................................213
Getting Help ..............................................................................................................................216
Modifying Auto-Generated Functions........................................................................................217
Running Your Program..............................................................................................................226
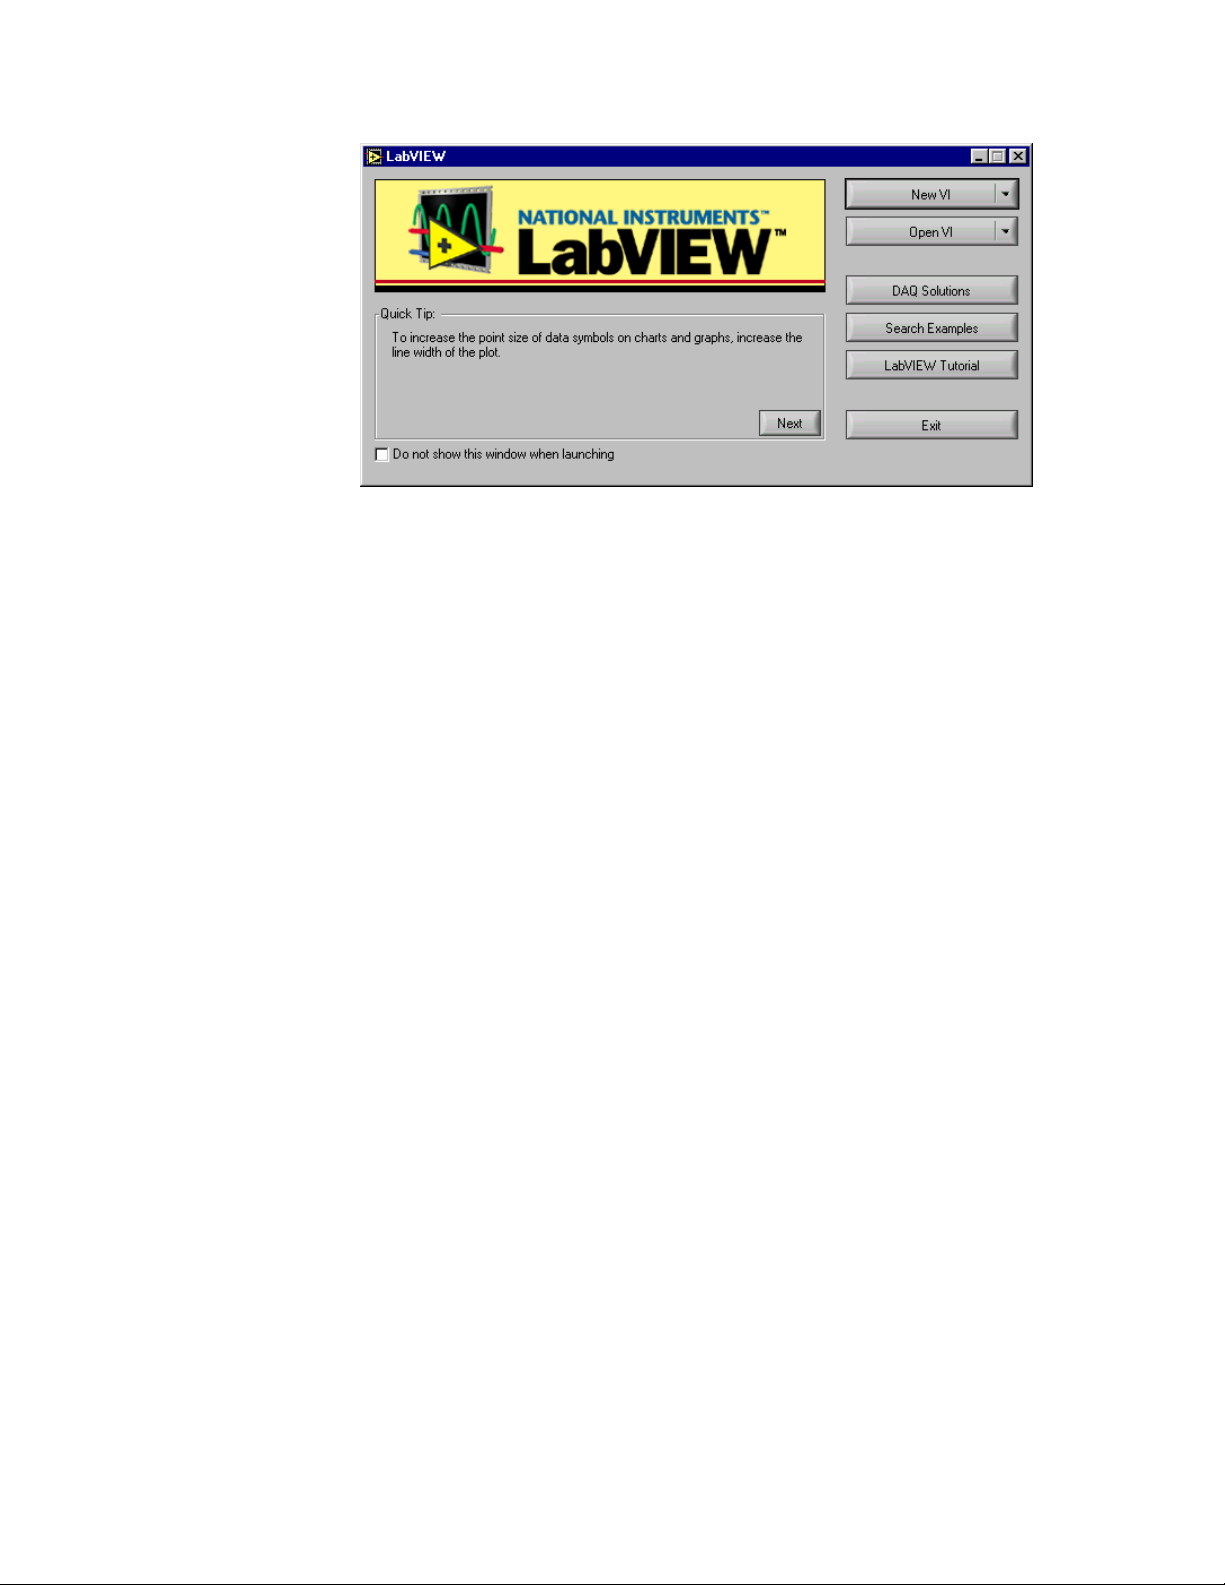
Overview of LabVIEW ...................................................................................................................227
Using Tektronix Plug-n-Play Drivers with LabVIEW......................................................................228
Loading the Driver.....................................................................................................................228
Viewing Driver Functions...........................................................................................................230
Getting Help ..............................................................................................................................231
Creating a Quick Demo Program ..............................................................................................234
Running Your Program..............................................................................................................243
Using VISA Operations with LabVIEW..........................................................................................244
Creating a Timed Measurement Program.................................................................................244
Running Your Program..............................................................................................................252
Chapter 9 Review..........................................................................................................................253
APPENDIX A: COMMAND AND CONTROL REFERENCE.........................................................255
Introduction ...................................................................................................................................255
Native GPIB Commands and Queries...........................................................................................255
TekVISA Active X Control Methods, Properties, and Events ........................................................263
MATLAB Instrument Control Toolbox Functions ...........................................................................281
PnP Driver Functions ....................................................................................................................287
VISA Operations............................................................................................................................288
APPENDIX B: FAST LAN ACCESS TO YOUR OSCILLOSCOPE.............................................. 291
Introduction ...................................................................................................................................291
VXI-11 and LAN Connectivity for Oscilloscopes............................................................................291
Benefits of LAN Access.................................................................................................................292
Deployment Considerations..........................................................................................................293
VXI-11 LAN Server Installation and Configuration ........................................................................293
VXI-11 LAN Client Access Setup ..................................................................................................294
TekVISA Installation..................................................................................................................294
Application Examples....................................................................................................................299
Visual Basic Example................................................................................................................299
iv
Page 7

MATLAB Example...................................................................................................................... 299
LabWindows/CVI Example........................................................................................................299
LabVIEW Example.................................................................................................................... 300
C Program Example.................................................................................................................. 300
Programming Tips......................................................................................................................... 300
Timeout Settings....................................................................................................................... 300
Non-TekVISA VXI-11 Clients .................................................................................................... 301
VXI-11 Standard ...........................................................................................................................301
APPENDIX C: OTHER VB EXAMPLES....................................................................................... 303
Introduction ................................................................................................................................... 303
Alternate Methods for Getting Waveform Data Using the TekVISA Control .................................303
Writing and Reading Binary/ASCII Waveform Example................................................................ 303
The User Interface .................................................................................................................... 305
How the Program Works........................................................................................................... 307
Code Listing.............................................................................................................................. 309
APPENDIX D: USING THE WAVEFORM GENERATOR ............................................................ 321
Introduction ................................................................................................................................... 321
To Generate a Live Waveform...................................................................................................... 321
Set up Your Display Mode ........................................................................................................ 321
Locate the Software and Examples for This Book ....................................................................323
Connect the Cable .................................................................................................................... 323
Start Up the Waveform Generator ............................................................................................ 324
Set Up the Oscilloscope and Calibrate the Sound Card ........................................................... 325
Generate the Waveform............................................................................................................ 327
Copy and Paste the Waveform Data into Excel........................................................................ 327
Export the Waveform into a File Appropriate for Excel .............................................................328
Import the Waveform into Excel................................................................................................ 328
INDEX........................................................................................................................................... 331
v
Page 8

List of Figures
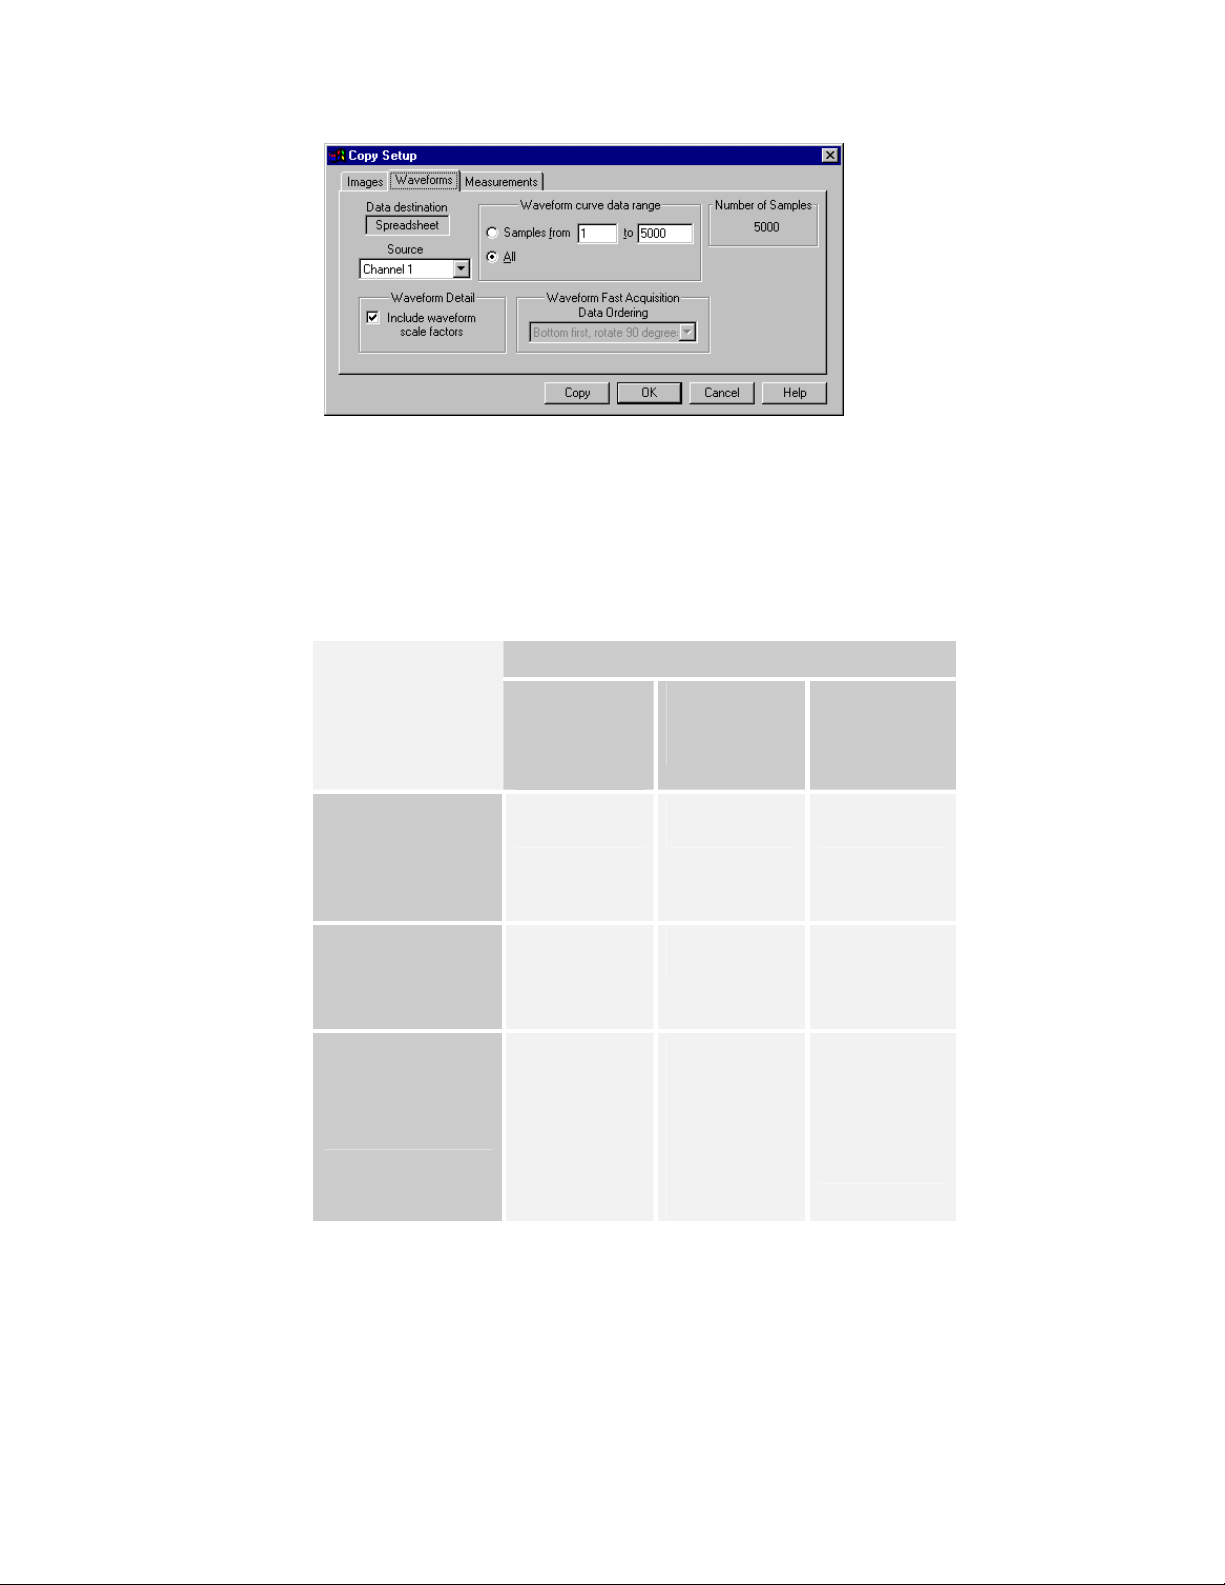
Figure 1: A Copy Setup box prepares waveform data for Excel ..... 2
Figure 2: TekVISA supports connectivity to programming
environments........................................................................... 5
Figure 3: Range of connections made possible by TekVISA
components............................................................................. 7
Figure 4: The path to LAN connectivity........................................... 8
Figure 5: Tektronix VXI Plug-n-Play Drivers integrate with
popular test automation software such as LabVIEW ............... 9
Figure 6: The TekExcel Toolbar in Excel ...................................... 13
Figure 7: How TekVISA ActiveX Controls interface with
Excel VBA and VB................................................................. 43
Figure 8: The form you will design for the GetWaveform
example................................................................................. 44
Figure 9: The Get Waveform form at runtime ............................... 45
Figure 10: Excel Clock Jitter example........................................... 46
Figure 11: Get Waveform form before changing default
properties............................................................................... 52
Figure 12: Using the VBA Help facility.......................................... 53
Figure 13: The redesigned form for Get Waveform ...................... 56
Figure 14: A object hierarchy from the Excel Object Model .......... 57
Figure 15: Using the Object Browser with Excel VBA................... 58
Figure 16: Related online help from the Object Browser .............. 59
Figure 17: The Clock Jitter example with the Get Waveform
program added ...................................................................... 73
Figure 18: Visual Basic 6.0 version of Get Waveform program .... 74
Figure 19: The form you will design for the Test Run example..... 78
Figure 20: The Test Run form at runtime...................................... 79
Figure 21: TekVISA Test Run form before changing default
captions and appearance of controls..................................... 81
Figure 22: The redesigned form for TekVISA Test Run................ 81
Figure 23: The Current Devices list box........................................ 82
Figure 24: The Measurement Commands frame .......................... 84
Figure 25: The Waveform Data frame .......................................... 88
Figure 26: The Send GPIB Commands frame.............................. 93
Figure 27: Visual Basic 6.0 version of the TekVISA Test Run
program ................................................................................. 96
Figure 28: The form you will design for the Chart
Measurements example ...................................................... 100
Figure 29: The Chart Measurements form at runtime................. 101
Figure 30: Chart Measurements plotted results.......................... 102
Figure 31: Chart Measurements form before changing default
captions and appearance of controls................................... 104
Figure 32: The redesigned form for Chart Measurements.......... 104
vi
Page 9

Figure 33: How the Excel model incorporates charts ..................117
Figure 34: Visual Basic 6.0 version of Chart Measurement
program................................................................................121
Figure 35: The form you will design for the Triggered
Waveform Capture example.................................................128
Figure 36: The Triggered Waveform Capture form at runtime.....129
Figure 37: The Settings tab at design time..................................133
Figure 38: The TDS7000 Series Measurements tab at design
time.......................................................................................136
Figure 39: The TDS8000 Series Measurements tab at design
time.......................................................................................137
Figure 40: The Data tab at design time .......................................139
Figure 41: Using the Object Browser with Visual Basic 6.0.........141
Figure 42: The form module and code module in separate
Code Windows of VB............................................................143
Figure 43: Triggered Waveform Capture example flow diagram.144
Figure 44: The VISA Configuration Utility....................................168
Figure 45: MATLAB’s Instrument Control Toolbox ASCII
communication tool ..............................................................171
Figure 46: How commands and queries are funneled through
MATLAB functions................................................................173
Figure 47: The first screen of the jitter2 function in MATLAB ......181
Figure 48: The plotted graph solutions for jitter2 in the MATLAB
Figure Window .....................................................................182
Figure 49: Building a GUI using the MATLAB guide utility...........184
Figure 50: The MATLAB guide utility Property Inspector.............185
Figure 51: First page of completed jitter3 example in MATLAB...203
Figure 52: The plotted graph solutions for jitter3 in the MATLAB
Figure Window .....................................................................205
Figure 53: Plug-n-play Driver Help file for TDS/CSA8000 Series
oscilloscopes........................................................................207
Figure 54: The Measurement Capture program interface at
LabWindows/CVI design time...............................................212
Figure 55: Adding controls to a LabWindows/CVI panel..............213
Figure 56: Dialog box for editing attributes of the Dial control in
LabWindows/CVI..................................................................213
Figure 57: Page from the LabWindows/CVI Help file ..................216
Figure 58: The LabWindows/CVI Code Window .........................218
Figure 59: The LabWindows/CVI program while executing.........226
Figure 60: Page from the LabVIEW Tutorial in the Help file........232
Figure 61: Sample context help for a PnP Driver functon............233
Figure 62: The Front Panel for the LabVIEW example................246
Figure 63: The Block Diagram for the LabVIEW example...........252
Figure 64: The LabVIEW program while executing .....................253
Figure 65: LAN connectivity from PC applications to Tektronix
oscilloscope..........................................................................292
vii
Page 10

Figure 66: VISA Configuration Window ...................................... 296
Figure 67: TekVISA Remote Host dialog box ............................. 298
Figure 68: Sample VISA program for LAN-based oscilloscope
access ................................................................................. 300
Figure 69: Design-time form for the Writing and Reading
Binary/ASCII Waveform example ........................................ 305
Figure 70: Runtime form for the Writing and Reading
Binary/ASCII Waveform example ........................................ 307
viii
Page 11

List of Tables
Table 1: Table of typographic conventions.................................... xii
Table 2: Quick review of exporting and importing oscilloscope
data ..........................................................................................2
Table 3: Summary of TekExcel Toolbar buttons............................14
Table 4: Some command and control terminology ........................37
Table 5: Useful icons on the VBA Standard Toolbar .....................48
Table 6: Icons for VBA controls used in this book .........................50
Table 7: Changes to make in the Properties window to Get
Waveform...............................................................................54
Table 8: Property changes to make outside of frames in
TekVISA Test Run..................................................................82
Table 9: Property changes to make in the Measurement
Commands frame...................................................................83
Table 10: Measurements available in the Measurement
Commands frame...................................................................84
Table 11: Property changes to make in the Waveform Data
frame ......................................................................................87
Table 12: Property changes to make in the Send GPIB
Commands frame...................................................................92
Table 13: Changes to make in the Properties window to Chart
Measurements......................................................................104
Table 14: Useful icons on the VB Standard Toolbar....................130
Table 15: Icons for VB controls used in this example ..................132
Table 16: Changes to make in the Properties window to the
Settings tab ..........................................................................134
Table 17: Changes to make in the Properties window to the
TDS7000 Series Measurements tab ....................................137
Table 18: Changes to make in the Properties window to the
TDS8000 Series Measurements tab ....................................138
Table 19: Changes to make in the Properties window to the
Data tab................................................................................139
Table 20: List of Initialization routines..........................................144
Table 21: Routines involved in listing devices and displaying
channels...............................................................................146
Table 22: Routines involved in listing measurements to capture.148
Table 23: Routines involving dialog box buttons .........................150
Table 24: Routines involved in setting registers ..........................152
Table 25: Routines involved in handling trigger events ...............155
Table 26: Routines involved in getting measurement and
waveform data......................................................................155
Table 27: Routines involved in displaying results in the grid .......156
Table 28: Routines involved in saving data to disk......................156
Table 29: General purpose routines............................................157
ix
Page 12

Table 30: Icons for MATLAB guide toolbar controls used in this
book..................................................................................... 184
Table 31: Changes to make in the Property Inspector to GUI
controls................................................................................ 187
Table 32: Relevant attributes of controls that appear on the
Measurement Capture panel in LabWindows/CVI ............... 214
Table 33: Relevant attributes of controls that appear on the
measuredemo.vi Front Panel in LabVIEW........................... 247
Table 34: TDS7000 Series native GPIB commands used in
examples in this book.......................................................... 256
Table 35: TDS7000 Series native GPIB queries used in
examples in this book.......................................................... 261
Table 36: Methods, properties and events of the TekVISA
ActiveX Control.................................................................... 263
Table 37: MATLAB Instrument Control Toolbox functions.......... 281
Table 38: TDS/CSA 8000 PnP driver functions used in
LabWindows/CVI and LabVIEW examples.......................... 287
Table 39: VISA operations used in LabVIEW and LAN Server
examples ............................................................................. 288
Table 40: Changes to make in the Properties window to the
Writing and Reading Binary/ASCII Waveform example....... 306
Table 41: Summary of functions in the Reading Binary/ASCII
Files example....................................................................... 308
x
Page 13

What This Book is About
Preface
What This Book is About
This book shows you how to use a variety of popular tools to build graphical
user interfaces to Tektronix Windows-based oscilloscopes. By using these
“soft front panels,” you can quickly and easily connect your oscilloscope,
whether locally or remotely, to the latest PC tools for analyzing waveform
and measurement data. In addition, this book explores the functionality of the
TekExcel Toolbar Add-In for Excel, which requires no additional
programming.
Who Should Read This Book
Whether you are a novice who has never built a graphical user interface
before or an experienced programmer, you will find this book helpful if you
are interested in increasing your productivity with Tektronix Windows-based
oscilloscopes. The examples cover programming environments ranging from
Excel Visual Basic for Applications (VBA) and Visual Basic 6.0 to
MATLAB, LabWindows/CVI, and LABVIEW. Familiarity with any or all of
these environments is helpful but not necessary in order to work most of the
examples.
How This Book is Organized
This book is divided into two parts. Each part includes multiple chapters and
is designed to impart new information in progressive steps.
• Part 1 covers the use of Excel with the TekExcel Toolbar
and the TekVISA ActiveX control, and also includes Visual
Basic 6.0 examples with the TekVISA ActiveX control.
• Part 2 describes the use of MATLAB with the Instrument
Control Toolbox, and the use of LabWindows/CVI and
LabView with Tektronix Plug-n-Play drivers.
• The appendices summarize the syntax of commands and
controls used in the book, discuss LAN connectivity, present
more complex examples, and describe the use of an optional
Waveform Generator program to generate live waveforms
for examples.
Oscilloscope Analysis and Connectivity Made Easy xi
Page 14

Document Conventions
A CD-ROM accompanies this book. The CD-ROM includes the text of the
book saved in PDF format, so you can use Adobe Acrobat Reader to access
the book on-line. Also on the CD are the programming examples discussed in
the book.
Document Conventions
This book makes use of certain notational conventions and typefaces in
distinctive ways, as summarized in Table 1.
Table 1: Table of typographic conventions
Typeface Meaning Example
boldface
italics
SampleName
Note:
Code
Menu >
Submenu
Used to emphasize important
points and to denote exact
characters to type or buttons to
click in step-by-step
procedures.
Used to introduce terms and to
specify variables in syntax
descriptions.
Used to designate the name of
a function, statement, filename,
or similar construct in regular
body text.
Used to call attention to notes
or tips in text.
Used to designate blocks of
code.
Used to designate a series of
cascading menus.
The example here means: from
the Tools menu, choose
Macro.
Connect your monitor to the
video port.
1. Click OK.
An industry-standard
communications protocol
called VXI-11
Attribute (type) = newvalue
You will employ a userdefined function called
Acquire_Instrument.
Note: Start here.
sCHCommands =
"DESE 1;*ESE 1;*SRE 32"
1. Choose Tools > Macro.
xii Oscilloscope Analysis and Connectivity Made Easy
Page 15

Connectivity Made Easier
Chapter 1: Connectivity Building Blocks
Connectivity Made Easier
The first connectivity book to accompany a Windows-based Tektronix
oscilloscope was entitled Oscilloscope Connectivity Made Easy. Since that
book was published, Tektronix has added a number of new building blocks to
make connectivity even more seamless and broad-based. These connectivity
building blocks provide a new layer of middleware for connecting your
Windows-based analysis programs to Tektronix embedded oscilloscope
software.
The previous book showed you how to copy and paste or export and import
data into three popular analysis programs: Excel, Mathcad, and MATLAB.
That book also showed you how to use a stand-alone application to feed
waveform data repeatedly into Excel or Mathcad.
This Oscilloscope Analysis and Connectivity Made Easy book gives you
even more routes to jump-start connectivity to your favorite analysis
program. You will:
• explore new levels of connectivity to Excel and MATLAB
• learn how to use Visual Basic to interact with your
oscilloscope in the Windows environment
• acquire the tools and expertise to interconnect with the
LabVIEW graphical programming environment
Built-in Connectivity Features
Because Excel and MATLAB are of special interest to our customers,
Tektronix has built simple point-and-click interfaces from its oscilloscopes to
these three programs. For example, Figure 1 shows the dialog box for
copying TDS5000/7000 Series Oscilloscope waveform data to be pasted into
Excel. The oscilloscope software also includes similar setup boxes for
exporting data in a format suitable for MATLAB.
Oscilloscope Analysis and Connectivity Made Easy 1
Page 16
Built-in Connectivity Features
Figure 1: A Copy Setup box prepares waveform data for Excel
Table 2 quickly reviews how to pass oscilloscope data to Excel and
MATLAB. As shown in the table, you can use copy-and-paste or export-andimport techniques to move information from your oscilloscope to these
programs.
Table 2: Quick review of exporting and importing oscilloscope data
To Copy / Export
Data from
Microsoft
Excel with
Clipboard
Edit > Copy
Setup
Menu Selections / Commands
Using
Using
Microsoft
Excel .txt File
File > Export
Setup
Using
MATLAB
.dat File
File > Export
Setup
TDS5000 and
TDS7000 Series
Oscilloscopes
To Copy / Export
Data from
Edit > Copy
Waveform
File > Export
Waveform
TDS/CSA8000 Series
Oscilloscopes
To Paste / Import
Data into
Excel / MATLAB
Edit > Paste Data > Get
External Data >
Import Text File
or
Right-click and
Reference data
filename as
argument of
M-file function
call in Command
Window
select
Refresh Data
2 Oscilloscope Analysis and Connectivity Made Easy
Page 17

New Connectivity Building Blocks
New Connectivity Building Blocks
Now a number of new connectivity components have come on the scene.
These new connectivity tools support faster and more seamless transfer of
continuous live data into Excel and MATLAB. New connectivity building
blocks also support other popular programming environments: Visual Basic
as well as LabVIEW and LabWindows/CVI, a Measurement Studio
component.
Tektronix latest connectivity solutions incorporate:
• TekExcel Toolbar, an add-in that supports easy data capture
into Microsoft Excel without any programming
• TekVISA ActiveX Control, a Visual Basic OCX control that
“wraps” and encapsulates the TekVISA library, enabling
rapid application development in Visual Basic 6.0 or Visual
Basic for Applications (VBA)Excel’s behind-the-scenes
development environment
• TekVISA API, a standard application programming interface
(API) and common I/O library for connecting to and
controlling measurement devices such as oscilloscopes
• Internal “virtual”GPIB, a software resource built into
TekVISA, that links the Windows processor to the
embedded processor in Tektronix Windows-based
oscilloscopes, permitting faster acquisitions than
conventional GPIB hardware links
• VXI Plug-n-Play Drivers, for Tektronix Windows-based
oscilloscopes, capable of connecting with LabWindows/CVI
and LabVIEW test automation software and other
programming environments
• Seamless connectivity with MATLAB via the Instrument
Control Toolbox, available from The MathWorks, Inc.
• VXI-11.2 Client/Server, technology for LAN connectivity
Oscilloscope Analysis and Connectivity Made Easy
3
Page 18

New Connectivity Building Blocks
TekVISAA Standard Way to Connect
TekVISA is the new Tektronix implementation of the industry-standard
library of common I/O operations known as VISA. VISA (Virtual Instrument
Software Architecture) was the brainchild of the VXIplug&play Systems
Alliance (http://www.vxipnp.org
), a group formed to standardize the building
of instrumentation drivers. TekVISA’s set of operations, attributes, and
events supports connectivity between application development
environmentssuch as C++, Visual Basic, MATLAB, and LabVIEWand
multiple kinds of resources including devices connected:
• via a local GPIB connection
• via a local Serial (RS-232) connection
• via the Tektronix internal software connection known as
virtual GPIB
• via a remote GPIB-LAN connection
• remotely via virtual GPIB, Tektronix VXI-11 client/server
technology, and an Ethernet LAN connection
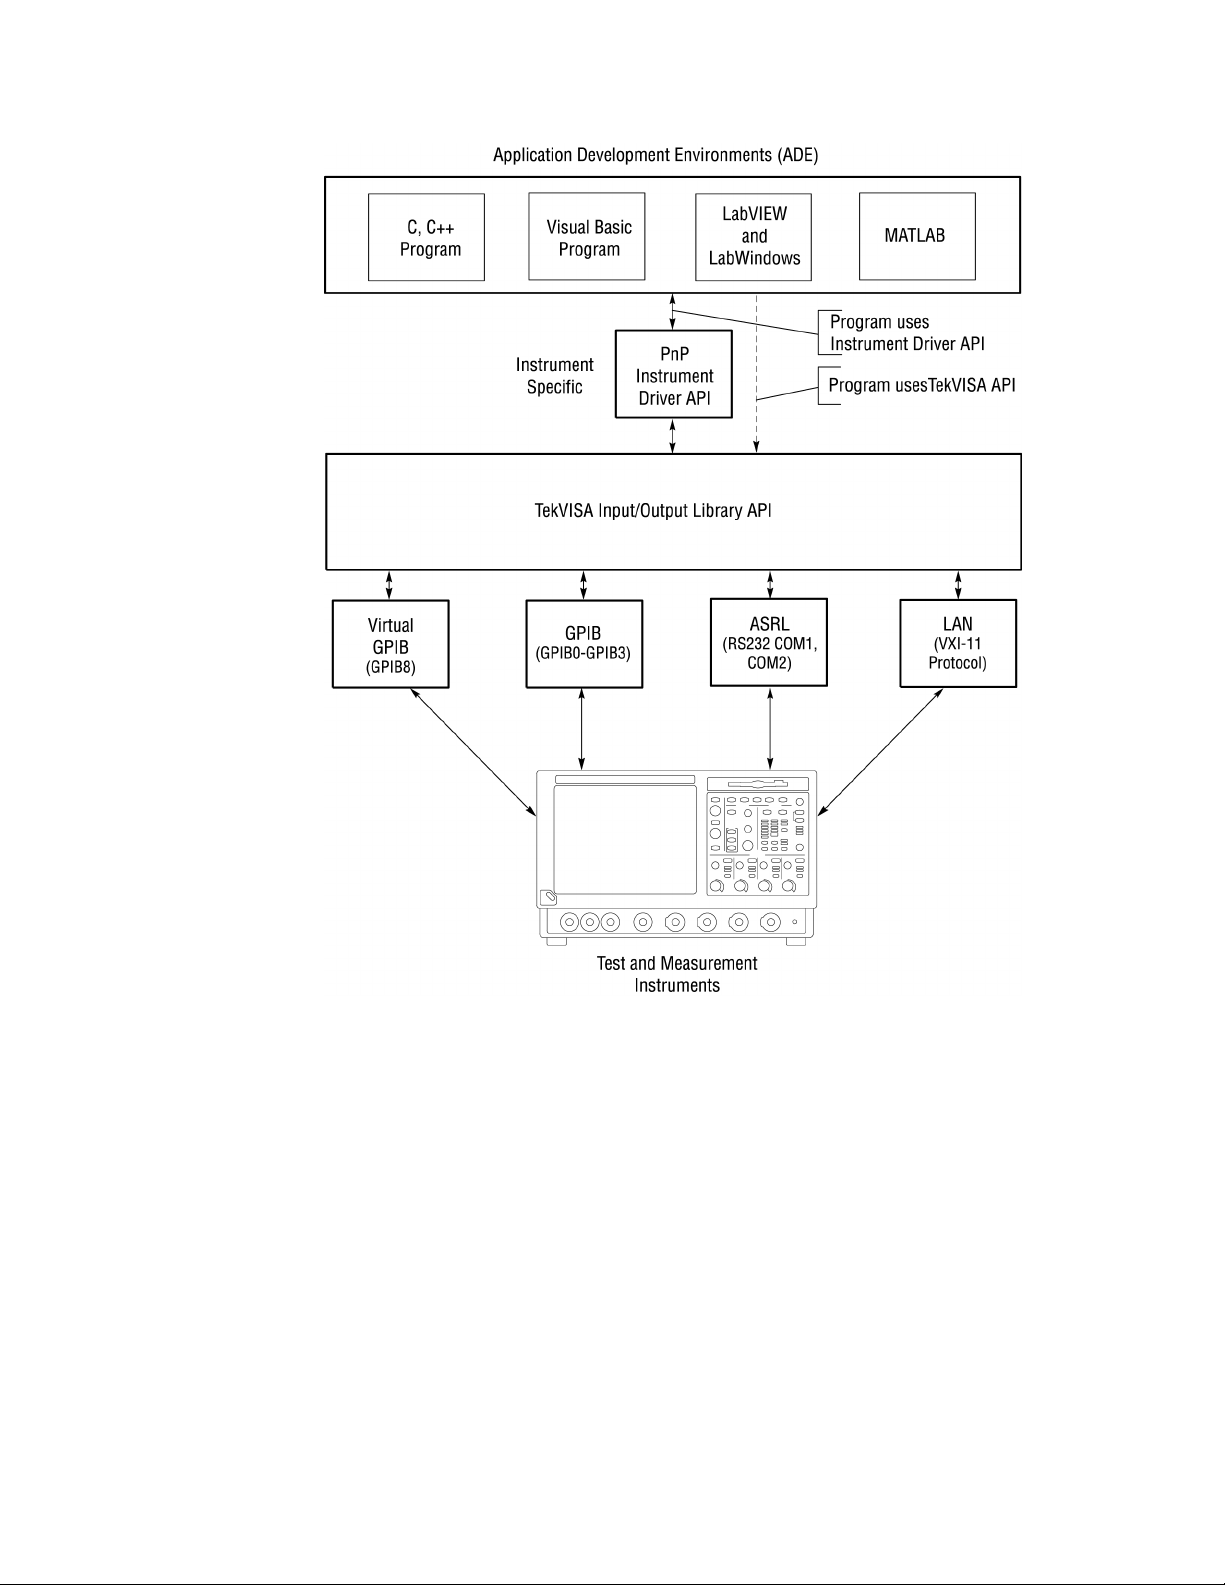
Figure 2 shows the broad range of connectivity brought together through
TekVISA technology.
4 Oscilloscope Analysis and Connectivity Made Easy
Page 19
New Connectivity Building Blocks
Figure 2: TekVISA supports connectivity to programming environments
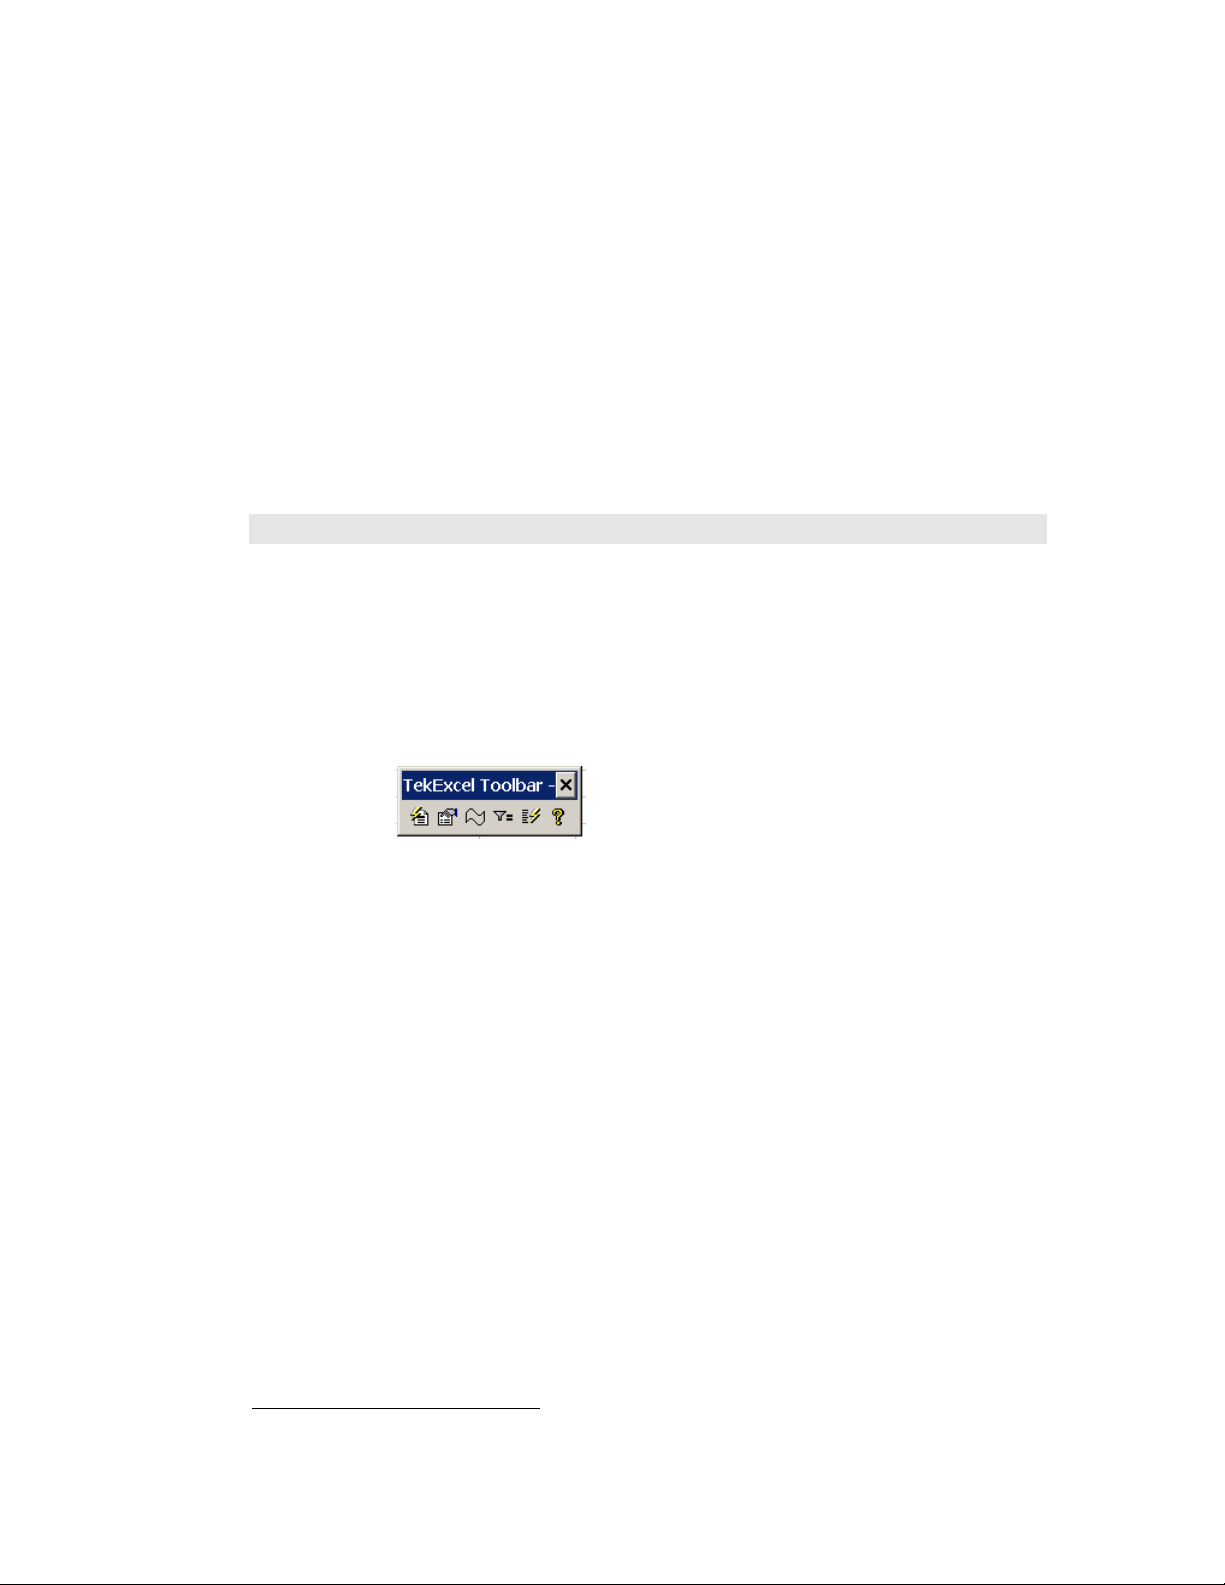
TekExcel Toolbar
The easiest way to get up and running with your Windows-based
oscilloscope is by making connections using the TekExcel Toolbar. This addin to Microsoft Excel works just like any other toolbar in that application.
When you click an icon, a dialog box pops up that allows you to pass
information back and forth between the Microsoft Excel application and your
Windows-based oscilloscope, without any programming modifications. If
you need no special customization beyond the built-in toolbar functions, the
TekExcel Toolbar will serve you well and get you going quickly, whether
you are transferring oscilloscope measurements or captured waveforms into
Excel. Chapter 2 introduces you to the use of this multi-purpose toolbar.
Oscilloscope Analysis and Connectivity Made Easy
5
Page 20

New Connectivity Building Blocks
TekVISA ActiveX Control
The TekVISA ActiveX Control will make your job a lot easier if you are
familiar with Visual Basic or Excel’s Visual Basic for Applications. This
book explores some ways to use this powerful control to build fast
connections from VB or VBA to the acquisitions side of your oscilloscope.
With this tool, you can spend time using the programs that help you do your
job, instead of losing time building complicated specialized instrument
drivers out of sheer necessity, as was often required in the past. You can
simply drop this control onto a form and then quickly design an interface
with buttons and boxes to suit your needs.
If you just know a little bit about VB, the TekVISA ActiveX Control and the
sample programs that come with this book will arm you with enough
hands-on information to customize the examples given. Or, you can write
your own pop-up dialogs between your oscilloscope and Excel or Visual
Basic 6.0. Chapters 3 through 7, along with Table 36 in Appendix A, cover
programming at this level using the TekVISA Control. Chapters 3 through 6
focus on using VBA with Excel spreadsheets, while Chapter 7 and Appendix
C concentrate on using Visual Basic 6.0.
TekVISA API
If you are an accomplished VB or C++ programmer, you can write programs
that call TekVISA operations directly, especially if you need more
fine-grained control. The TekVISA API software now comes standard on
Tektronix Windows-based oscilloscopes. The online TekVISA Programming
Manual includes a lookup reference section and a tutorial section with
programming examples. This subject matter is beyond the scope of this book.
Internal “Virtual” GPIB
TekVISA support for an internal resource called virtual GPIB means fast
connectivity between Windows and the embedded software side of your
oscilloscope. Virtual GPIB provides a software bridge to and from embedded
oscilloscope software, permitting direct internal access to the oscilloscope for
much faster and larger acquisitions than conventional GPIB ports. What is
more, this feature facilitates remote connections with other PCs over a
standard Ethernet LAN without the need for special GPIB-to-LAN hardware
adapters.
TekVISA also includes Asynchronous Serial (ASRL) and GPIB resources
that support more traditional connections to non-Windows-based
instruments.
VXI-11.2 Client /Server Connected by Local Area Network (LAN)
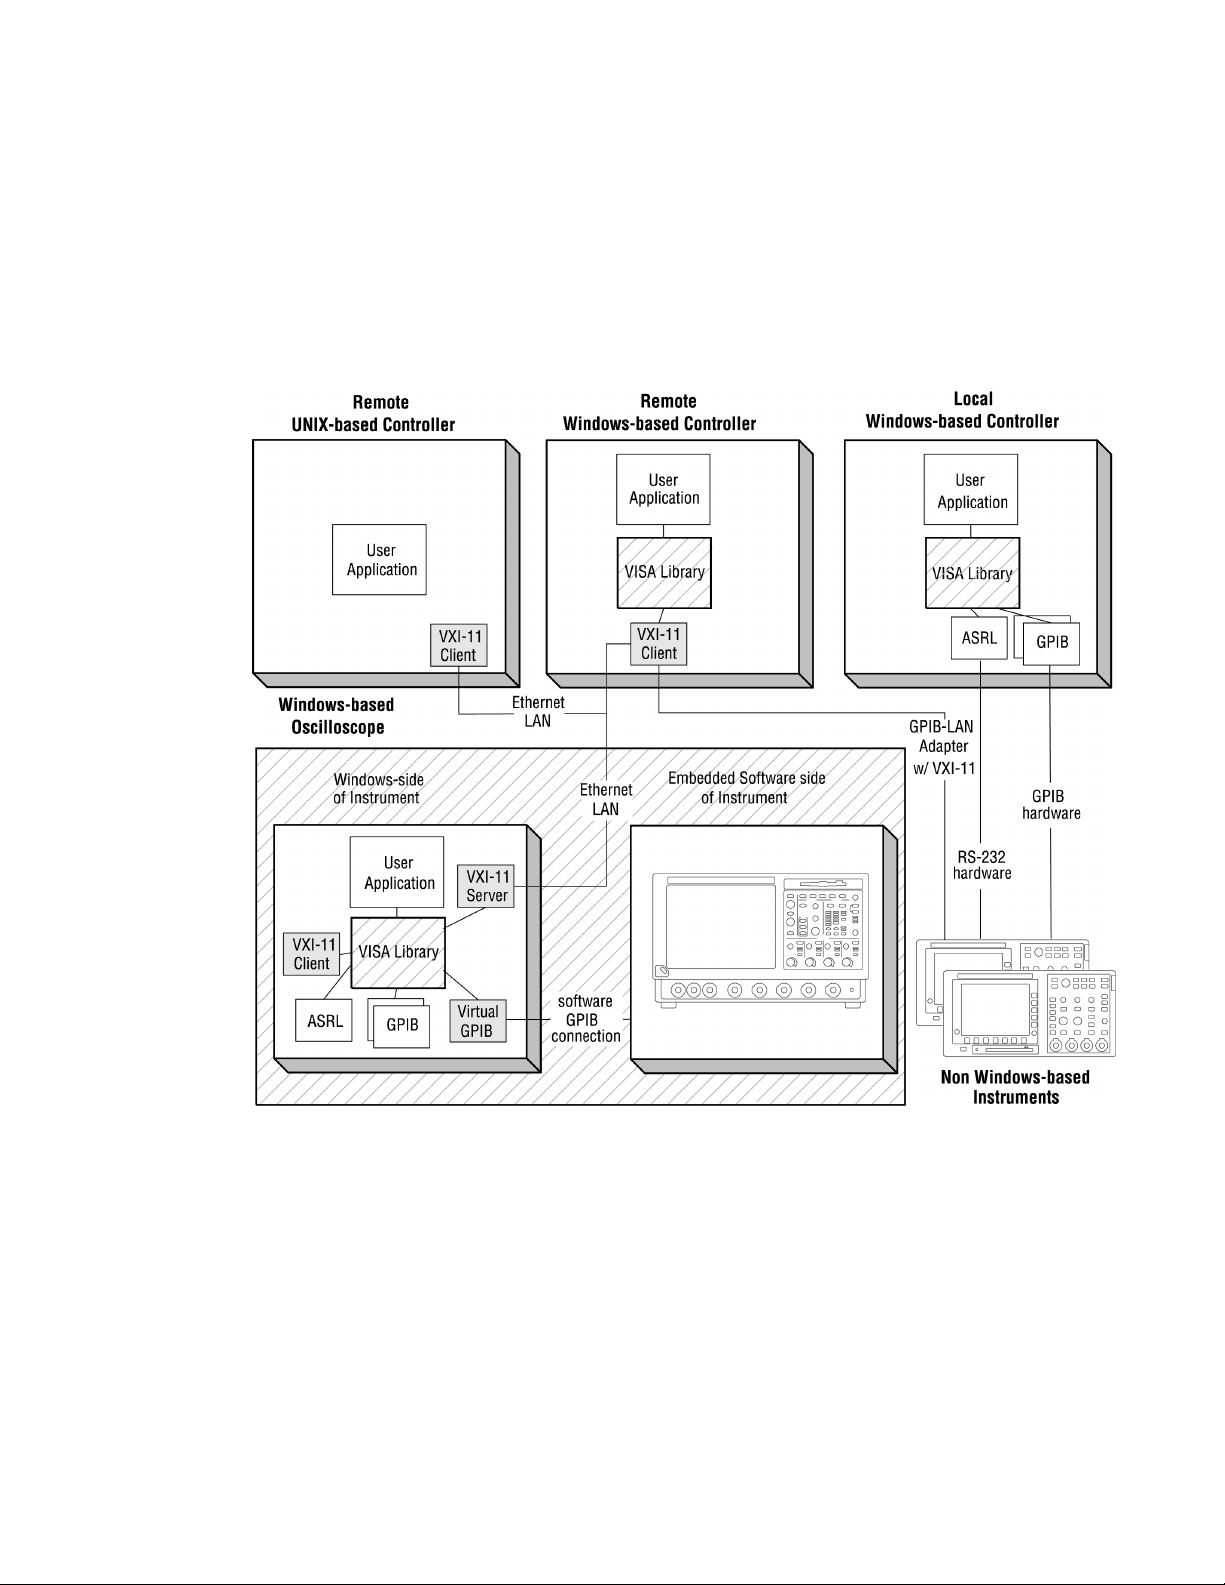
Tektronix VXI-11.2 Client/Server technology adds another important piece
to the connectivity picture. The VXI-11 Server-side component, combined
with TekVISA’s virtual GPIB, provides a software passageway for
connecting your Windows-based oscilloscope over an Ethernet LAN to
remote PCs. On each remote PC, you would install another copy of TekVISA
to make use of its built-in VXI-11 Client-side component.
6 Oscilloscope Analysis and Connectivity Made Easy
Page 21
New Connectivity Building Blocks
You will need your own VXI-11 Client-side software if you want to connect
UNIX-based systems to your Windows-based oscilloscope.
Appendix B discusses the details of accessing the oscilloscope across a local
area network (LAN) from the programming environments discussed in this
book. Figure 3 shows the range of connections made possible by the various
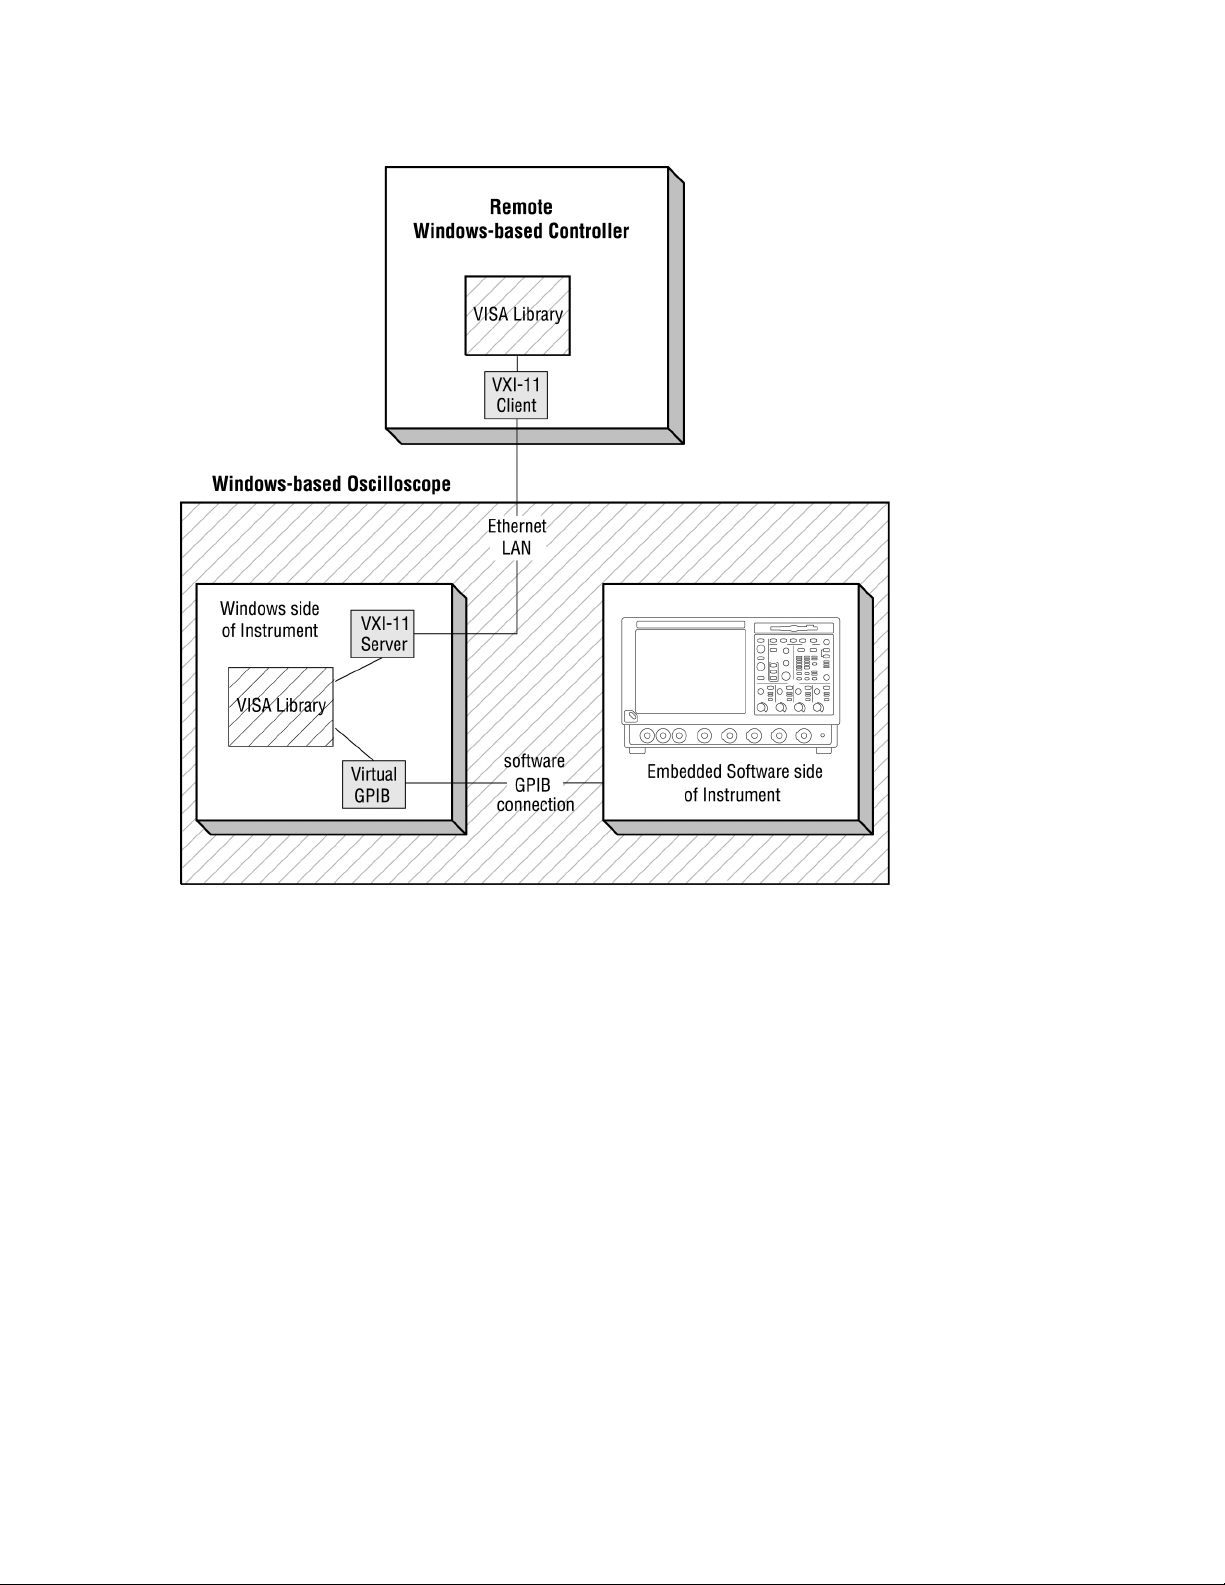
TekVISA building block components. Figure 4 focuses on the components
that make LAN connectivity possible.
Figure 3: Range of connections made possible by TekVISA components
Oscilloscope Analysis and Connectivity Made Easy
7
Page 22
New Connectivity Building Blocks
Figure 4: The path to LAN connectivity
Tektronix Plug-n-Play Drivers with LabWindows/CVI and LabVIEW
Tektronix VXI Plug-n-Play drivers add another feature to the connectivity
landscape, enabling easy linkage with popular test automation software such
as LabVIEW (Figure 5) and LabWindows/CVI. VXI Plug-n-Play drivers for
Tektronix Windows-based oscilloscopes add a layer of middleware so you
can work in these graphical programming environments without spending a
lot of time getting data in or out of your test equipment. Chapter 9 and Table
38 in Appendix A focus on connectivity scenarios using these graphical
tools.
8 Oscilloscope Analysis and Connectivity Made Easy
Page 23
New Connectivity Building Blocks
Figure 5: Tektronix VXI Plug-n-Play Drivers integrate with popular test automation
software such as LabVIEW
MATLAB’s Instrument Control Toolbox
Anothr connectivity tool has emerged from The MathWorks, which now
offers an Instrument Control Toolbox with MATLAB
. This toolbox makes
connectivity with Windows-based oscilloscopes such as the Tektronix TDS
Family possible without complicated programming. Chapter 8 shows you
how to import live waveforms into MATLAB using this new toolbox.
Oscilloscope Analysis and Connectivity Made Easy
9
Page 24

New Connectivity Building Blocks
10 Oscilloscope Analysis and Connectivity Made Easy
Page 25

PART 1: EXCEL AND VISUAL BASIC
CHAPTER 2: THE TEKEXCEL TOOLBAR 13
CHAPTER 3: UNDERSTANDING THE TEKVISA ACTIVEX CONTROL 37
CHAPTER 4: A SIMPLE PROGRAM TO GET WAVEFORMS 41
CHAPTER 5: A MORE COMPLEX FOUR-PART PROGRAM 77
CHAPTER 6: A MEASUREMENT CHARTING EXAMPLE 99
CHAPTER 7: A TRIGGERED DATA CAPTURE EXAMPLE 127
11
Page 26

PART 1: EXCEL AND VISUAL BASIC
12 Oscilloscope Analysis and Connectivity Made Easy
Page 27
Introduction
Chapter 2: The TekExcel Toolbar
Using the TekExcel Toolbar with
Microsoft
Excel
Introduction
This chapter introduces you to the TekExcel Toolbara multi-purpose
toolbar that allows you to place data from your Windows-based oscilloscope
directly into an Excel document simply by clicking a few buttons. Easy
acquisition is the heart of the toolbar. You can make single or repeated
captures of data on a triggered, periodic, or timed basis, with the option of
also graphing the data. Figure 6 shows the TekExcel Toolbar, which includes
six button icons.
Figure 6: The TekExcel Toolbar in Excel
No programming is required in order to use the TekExcel Toolbar; however,
the Visual Basic source code for the toolbar is available on the companion
CD for experienced VB programmers who wish to modify toolbar features
for their own use. In later chapters of this book, you will learn how to build
less complicated VBA programs that implement some of the functions built
into this toolbar.
Toolbar Prerequisites
You can use the TekExcel Toolbar with Microsoft Excel
your Tektronix Windows-based oscilloscope or on a separate PC connected
by a network to your oscilloscope. The oscilloscope and connected PC (if
any) must each have TekVISA installed on it in order to establish a
connection between Excel and your oscilloscope. See Appendix B for
information about configuring access to networked oscilloscopes.
1
The toolbar runs as an Add-In to Microsoft Excel 2000 and XP.
1
running either on
Oscilloscope Analysis and Connectivity Made Easy 13
Page 28
Adding the TekExcel Toolbar to Excel
Toolbar Features
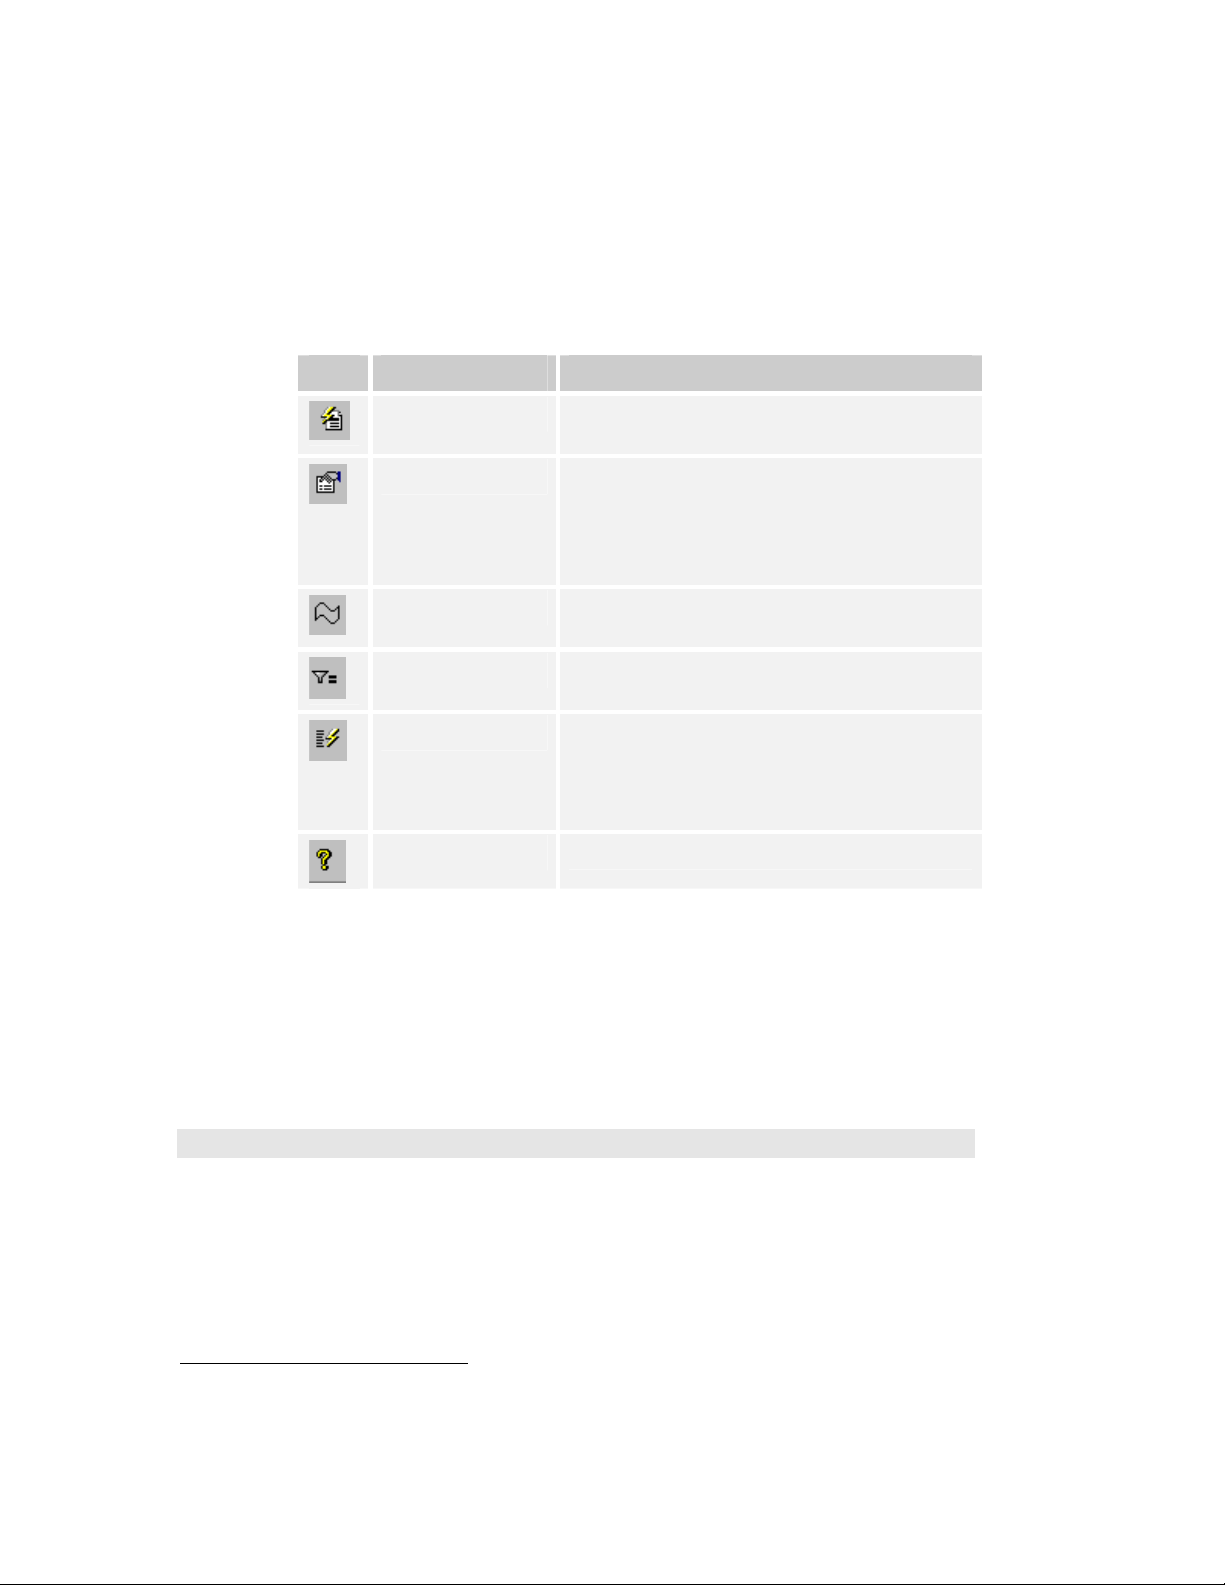
The TekExcel Toolbar enables rapid capture of oscilloscope data from within
Microsoft Excel worksheets. Table 3 describes the six buttons on the toolbar
that work with the TDS5000, 6000, and 7000. Some other instruments do not
offer all six buttons.
Table 3: Summary of TekExcel Toolbar buttons
Icon Button Name Meaning
Connect
Settings
Chooses the TekVISA-enabled oscilloscope with which
to connect.
Saves oscilloscope settings to a file or Excel workbook,
and restores oscilloscope settings from a file or Excel
workbook. Settings saved into a workbook are
automatically loaded into the oscilloscope when the
workbook is opened.
Waveform
Measurement
Trigger Capture
Captures waveform data into a worksheet and graphs
it.
Captures and graphs single or periodic waveform
measurements.
Captures waveform data from an oscilloscope-defined
trigger, places it into a worksheet, and graphs it.
Note: The TDS5000, 6000, and 7000 support this
toolbar button. Other instruments do not.
Help
Launches the online help file for the TekExcel Toolbar.
The toolbar is easy to use. Click a button and a dialog box appears. Within
dialog boxes, you can select the type of data you want to capture and
automatically paste into Excel, along with an optional line chart.
If you let your mouse linger over a button, a tool tip will appear indicating
the button’s function. Clicking the
Help button launches an online help file
for the TekExcel Toolbar (see page 34).
Adding the TekExcel Toolbar to Excel
The TekExcel Toolbar is an Excel Add-In. During toolbar installation, the
toolbar file (
main TekVISA files.
14 Oscilloscope Analysis and Connectivity Made Easy
2
Assuming you are installing on the C: drive on a Windows 98 system, the toolbar is placed in
C:\VXIpnp\Win95\TEKvisa\ExcelToolbar\TekExcelToolbar.xla. On a Windows NT system, the toolbar is
placed in C:\VXIpnp\WinNT\TEKvisa\ExcelToolbar\TekExcelToolbar.xla.
TekExcelToolbar.xla) is normally placed in a subdirectory of the
2
Page 29
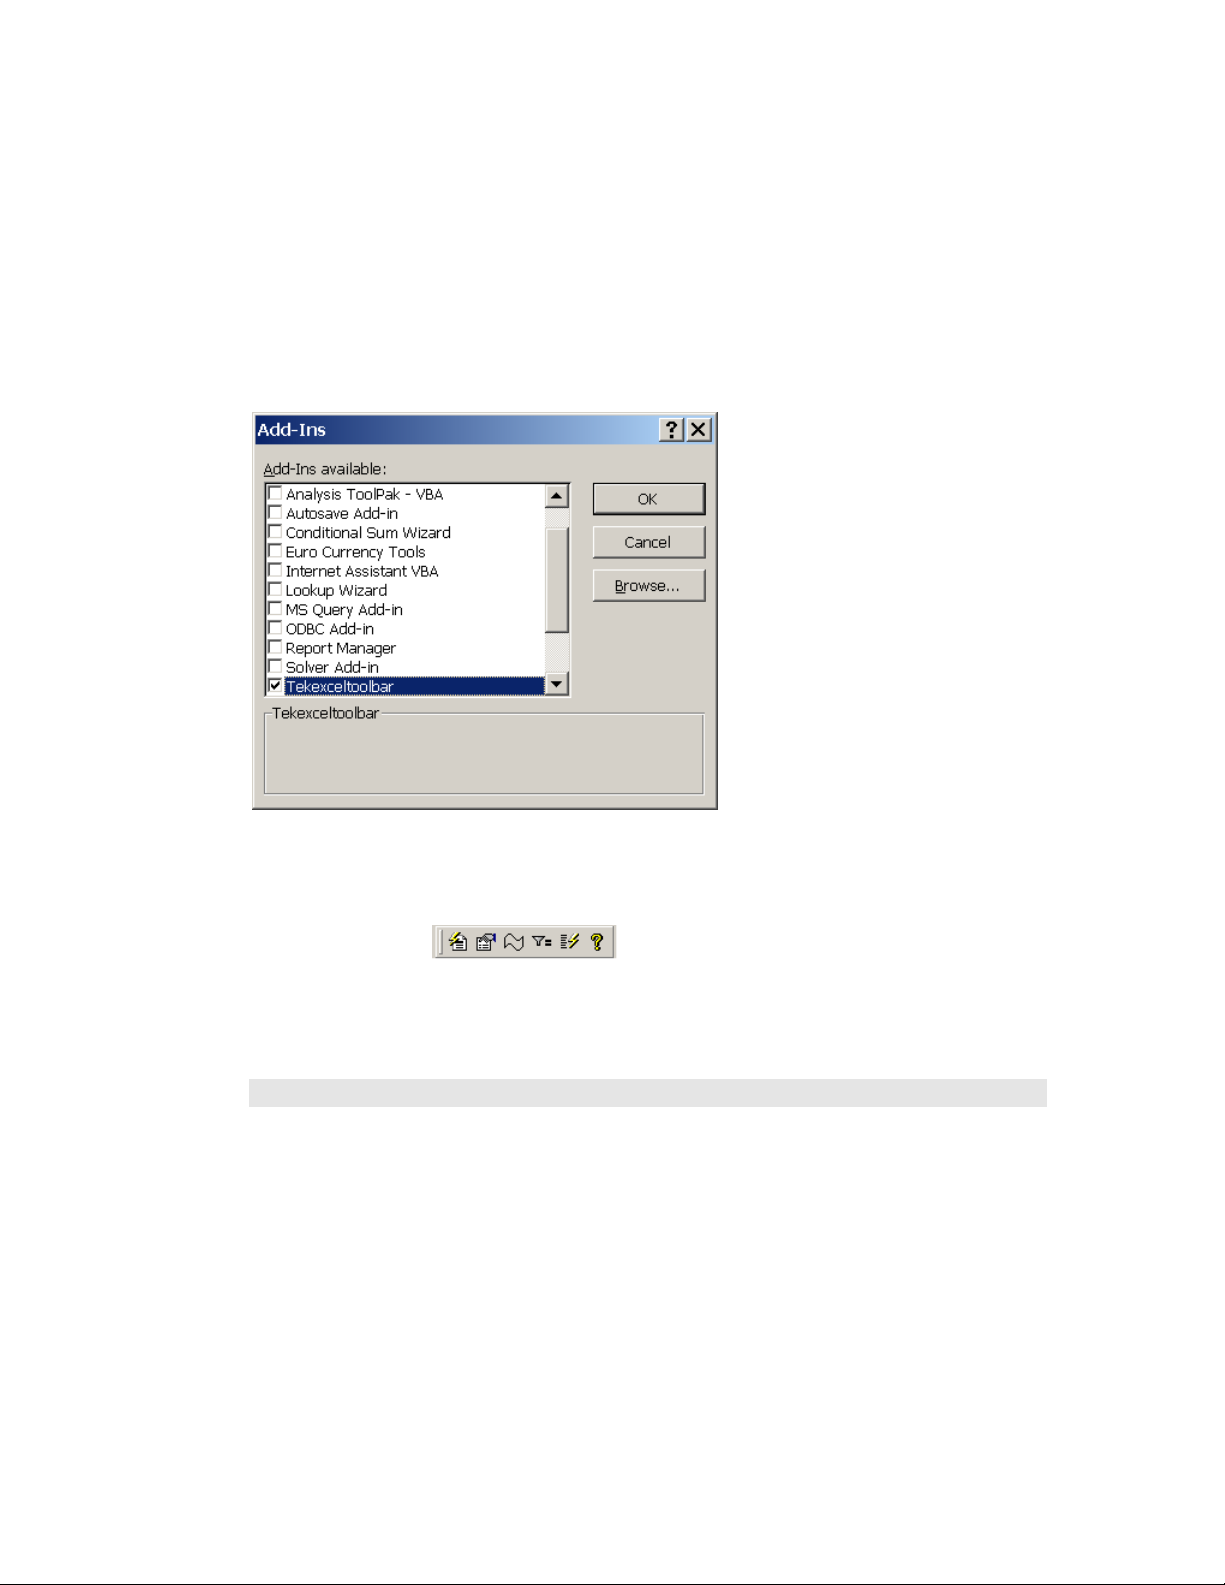
Connecting to Oscilloscopes
When you first install the TekExcel Toolbar, follow these steps to add it to
Excel:
Start up Excel and select
Tools > Add-Ins… from the Excel menu bar.
The Add-Ins dialog box appears.
Select the check box next to
TekExcel Toolbar in the list of choices. If the
TekExcel Toolbar does not appear in the list, click the
to the appropriate directory, and select the
TekExcelToolbar.xla file.
Browse… button, navigate
Click
OK.
The TekExcel Toolbar appears undocked in the Excel program.
Leave the toolbar undocked, or drag it up to the Excel Formatting Toolbar if you
want it to remain docked in a fixed position.
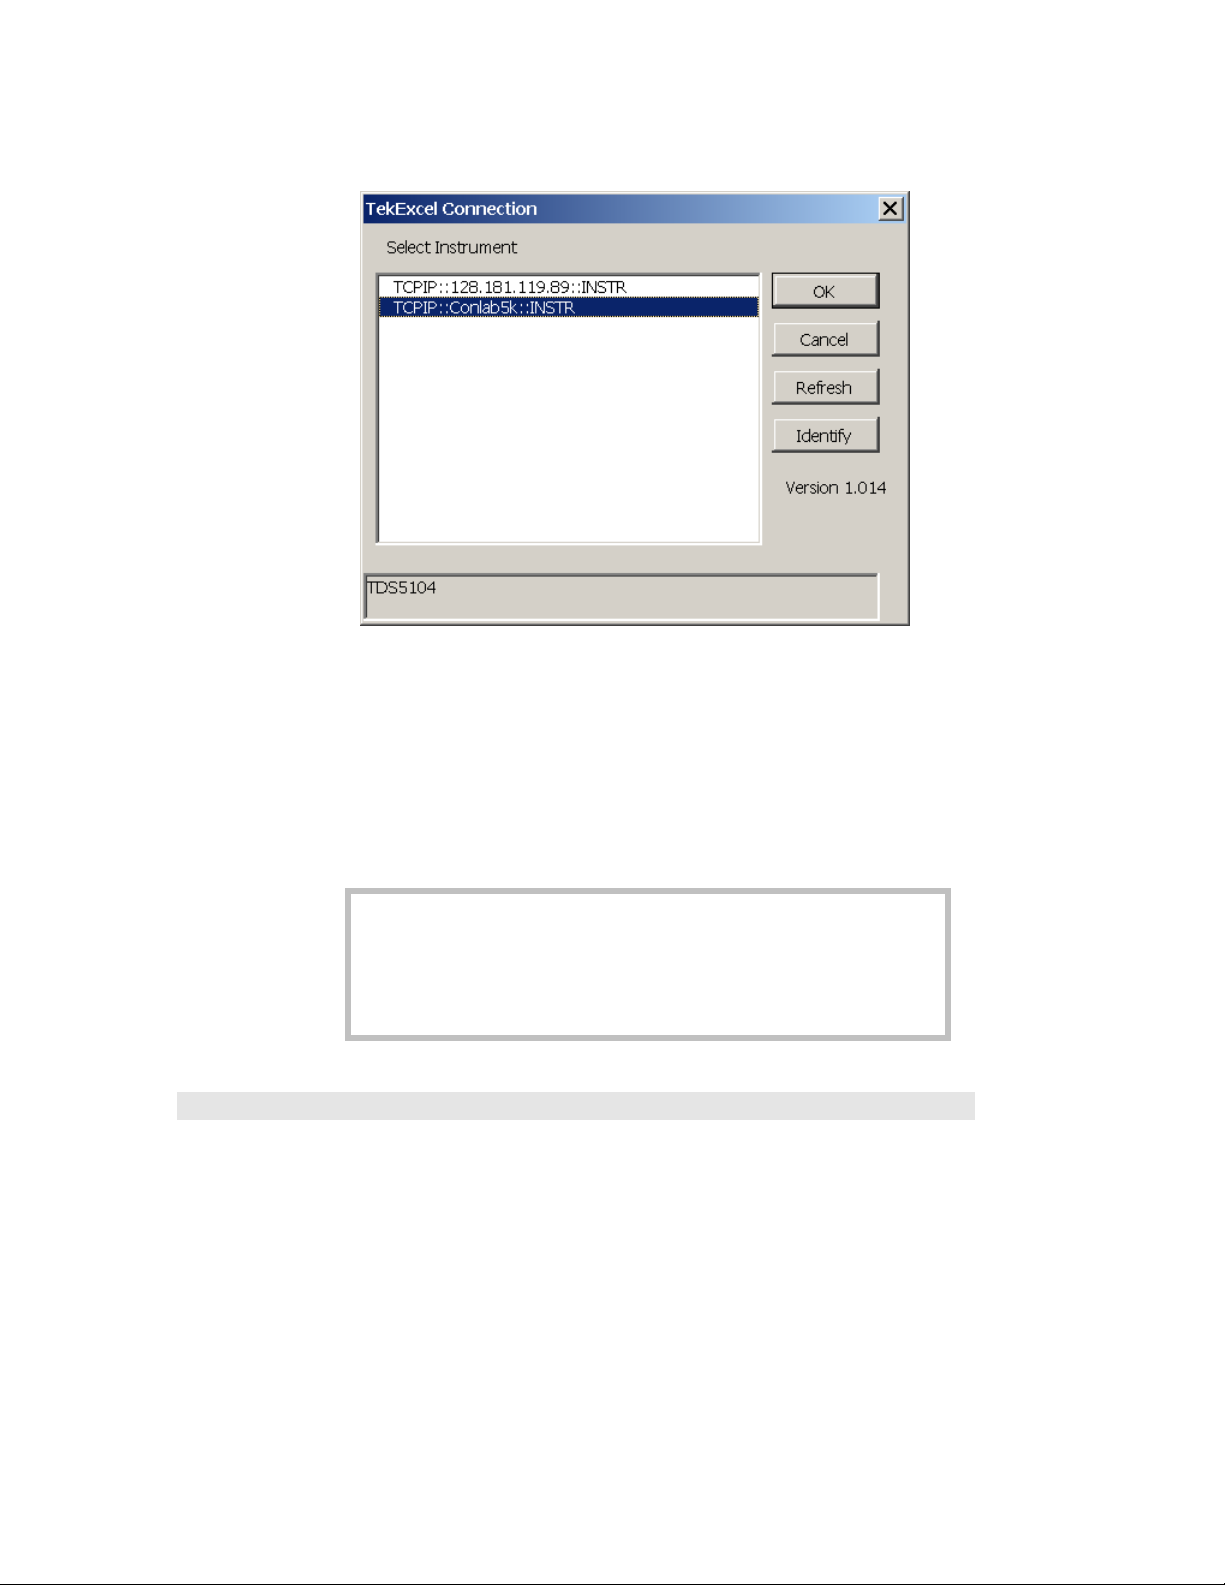
Connecting to Oscilloscopes
The Connect button on the TekExcel Toolbar allows you to select a
TekVISA-enabled oscilloscope with which to establish a connection.
To connect to a Tektronix Windows-based oscilloscope from within Excel:
1. Click the Connect button on the TekExcel Toolbar.
Oscilloscope Analysis and Connectivity Made Easy
15
Page 30
Saving and Restoring Scope Settings
A dialog box similar to the following appears:
2. By default, the first GPIB device encountered in the
instrument list is selected.
3. Leave the selection as is, or select another instrument with
which to connect and click
OK.
The connection with the selected instrument is made. You may only
connect to one instrument at a time using the TekExcel Toolbar.
Note: Click the Refresh button to display any changes to the list
of connected devices since the last time you clicked the Connect
button.
Click the Identify button to display the instrument model number at
the bottom of the dialog box.
Saving and Restoring Scope Settings
The Settings button on the TekExcel Toolbar allows you to save
oscilloscope settings to a file or to an active Excel workbook, and restore
them later to the oscilloscope.
If you save settings to an active worksheet and then save and reopen the
associated Excel .
oscilloscope.
xls file, the settings are automatically assigned to the
If you save settings to a file, you have the option of placing a descriptor in
the settings file. The file can take one of two forms:
16 Oscilloscope Analysis and Connectivity Made Easy
Page 31

Saving and Restoring Scope Settings
• Files with a .set extension are identical to settings saved
from within the oscilloscope.
Files with an .stg extension contain both the oscilloscope
•
settings and a
descriptor that you specify when saving the
settings. Descriptors may be up to 256 characters in length
and can serve as useful reminders when you are storing
many different oscilloscope settings on disk. Descriptors
also provide an alternative to long file names as a way of
differentiating files.
Save Settings from the Scope
Display Current Settings from the Scope
To capture and display oscilloscope settings:
1. Click the Settings button on the TekExcel Toolbar.
A dialog box labeled TekExcel Settings appears.
2. Click the Scope button in the upper-left pane labeled Get
Settings from
.
Settings from the oscilloscope appear in a scrollable list box on the
lower-right pane.
Save Scope Settings to a Workbook
To save current oscilloscope settings to the Excel workbook:
1. Click the Workbook button in the lower-left pane labeled
Send Settings to.
Oscilloscope settings are saved into an invisible worksheet in the
workbook named
under Excel, this worksheet is stored inside your
ExcelVISASettings. When you save your work
.xls file.
Oscilloscope Analysis and Connectivity Made Easy
17
Page 32

Saving and Restoring Scope Settings
Note: To make the TekExcelSettings sheet visible:
• Press Alt+F11 to open the Visual Basic for Applications editor.
• Press Ctrl+G to open the Immediate Window.
• Type the following line exactly as shown (the name is
case-sensitive):
Activeworkbook.Worksheets("TekExcelSettings").Visible =
True
• Press Enter
A tab for the worksheet now appears, with the oscilloscope
settings stored in a single cell of the sheet. The worksheet
remains visible until you type the following line in the
Immediate Window and press Enter:
Activeworkbook.Worksheets("TekExcelSettings").Visible =
False
Save Scope Settings to a File
To save the current oscilloscope settings to a file:
1. If desired, type in a descriptor for the current oscilloscope
settings in the edit box on the upper-right pane of the
TekExcel Settings window
2. Click the File button in the lower-left pane labeled Send
Settings to
.
A Save Scope Settings box appears, as shown below.
18 Oscilloscope Analysis and Connectivity Made Easy
Page 33

Saving and Restoring Scope Settings
The default name of the file is a date/time representation in the
format yymmdd_hhmmss (using two-digit representations of
year/month/day_hour/minute/second). For instance, the file name
010412_183303 represents April 12, 2001 at 6:33:03 PM.
If the descriptor edit box:
• is empty, the default file type in the Save Scope
Settings box is
.set.
• contains text, the default file type in the Save Scope
Settings box is
.stg.
Regardless of the file type presented, you can still select a different
scope settings file type from the Save as t
ype field in the Save Scope
Settings box.
3. Leave the file name and type as is, or change the name
and/or type to your preferences.
4. Click Save to save the file under the selected name and type.
A message appears at the bottom of the TekExcel Settings dialog box
confirming the location of the saved file.
Oscilloscope Analysis and Connectivity Made Easy
19
Page 34

Saving and Restoring Scope Settings
Assign Stored Settings to the Scope
Assign Settings from a Workbook
When you save your work under Excel, the
stored inside your
.xls file. When you open the Excel file later, the settings
TekExcelSettings worksheet is
saved in the workbook are automatically loaded into the oscilloscope by a
stored Excel macro. If for some reason this macro fails to execute, you can
assign settings stored in the workbook by taking the following steps:
1. Click the Settings button on the TekExcel Toolbar.
A TekExcel Settings box appears.
2. Click on the Get Settings from Workbook button.
3. Click on the Send Settings to Scope button.
Assign Settings from a File
To assign settings to the oscilloscope from those stored in a file:
1. Click the Settings button on the TekExcel Toolbar.
A TekExcel Settings box appears.
2. Click on Get Settings from File button.
An Scope Settings files box appears showing (.set) and (.stg) files.
20 Oscilloscope Analysis and Connectivity Made Easy
Page 35

Capturing and Graphing Waveforms
3. Select the desired file and click Open.
Settings appear in the TekExcel Settings box. The settings are
assigned to the oscilloscope. For settings stored in (.stg) files, the
descriptor also appears above the list box as shown:
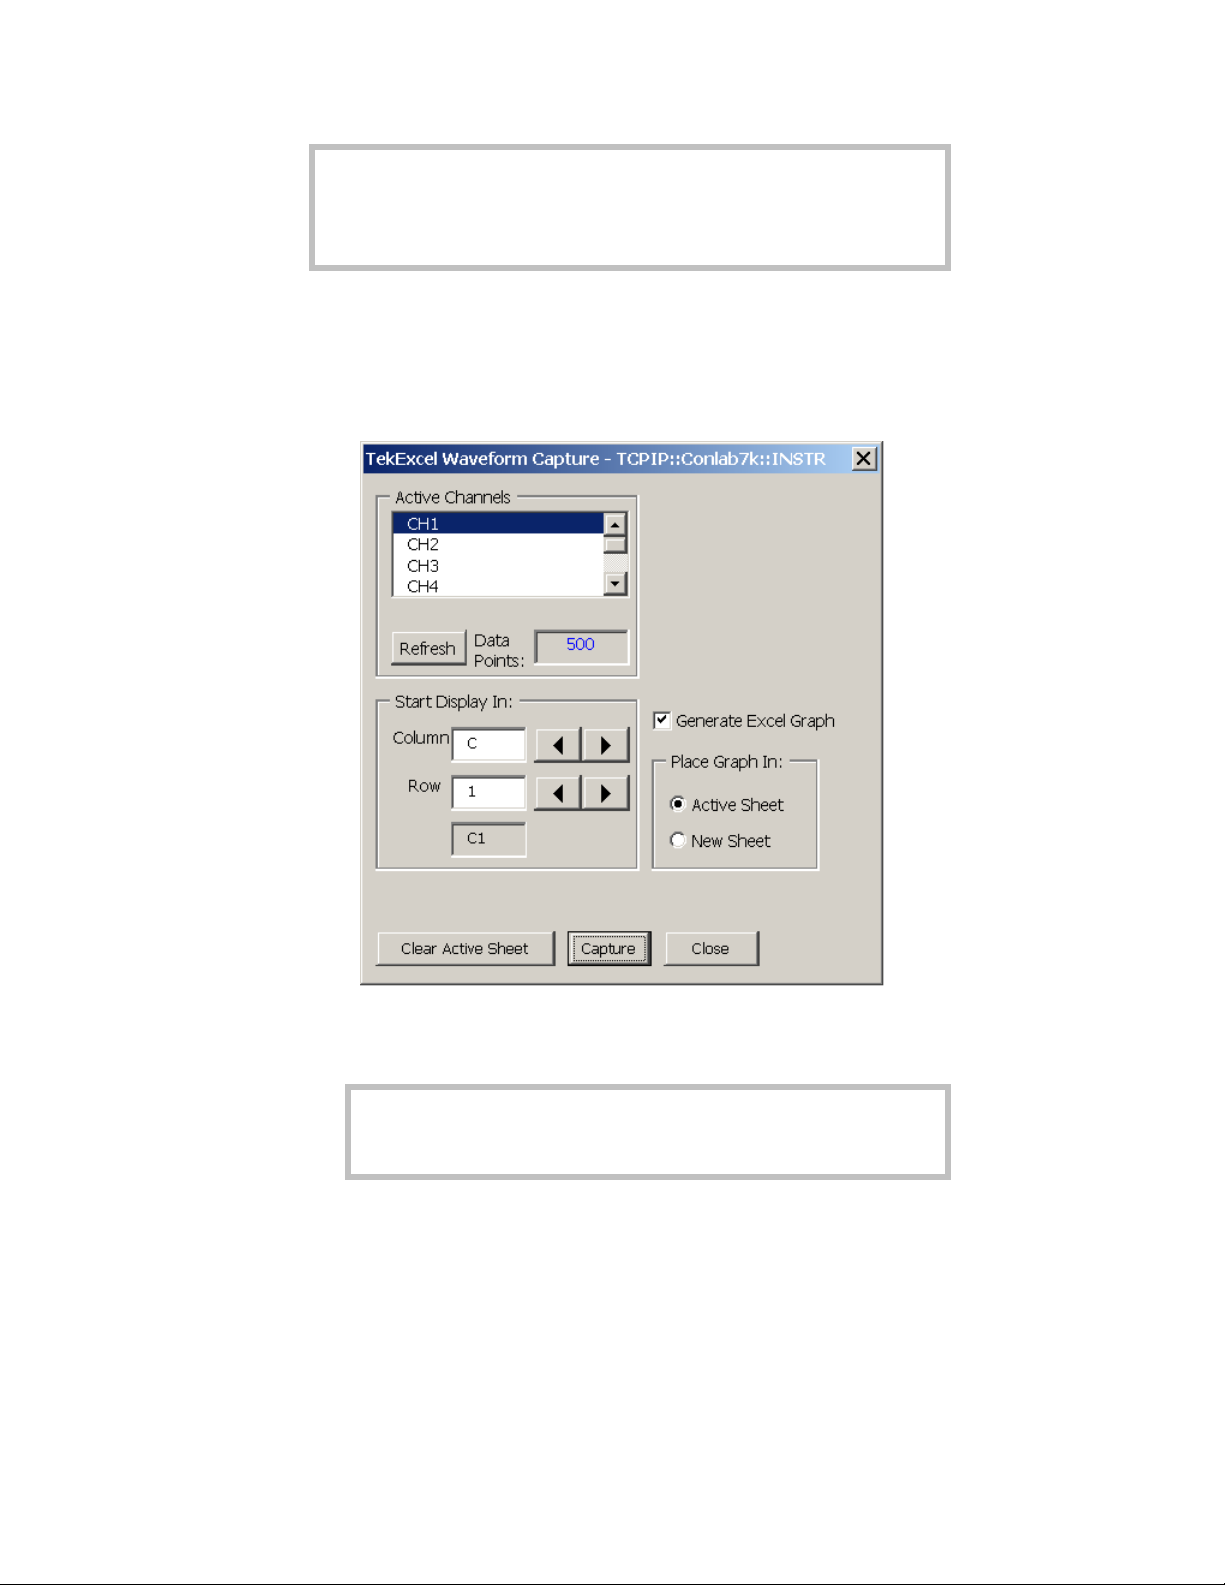
Capturing and Graphing Waveforms
The Waveform button on the TekExcel Toolbar allows you to capture the
time and values of a single waveform sequence into the current worksheet,
beginning at a chosen cell location. You select the type of waveform (such as
Sample or Average—see page 42) on the oscilloscope before the capture.
Waveform data from all selected channels is captured and placed into the
active sheet. The waveform capture is limited to 65000 rows of data, the
approximate number of rows in Excel spreadsheets.
You also have the option of charting the waveform data. You can have the
chart inserted into the active sheet or a separate sheet.
Oscilloscope Analysis and Connectivity Made Easy
21
Page 36
Capturing and Graphing Waveforms
If you want to capture triggered waveform data instead of a
Note:
single untriggered sequence, see the Trigger Capture button on page
31.
For information about clearing the active sheet, see page 24.
To capture waveforms into an Excel spreadsheet and, optionally, graph it:
1. Select the Waveforms button on the TekExcel Toolbar.
A dialog box similar to the following appears:
All active channels are displayed, along with the number of data
points in the waveform sample, derived from oscilloscope settings.
Note: You can click the Refresh button to display any
oscilloscope changes to the number of active channels, the
measurement source channel, or the number of data samples.
2. Select the channel(s) from which you want to capture data.
(Hold down the
Ctrl key while clicking if you want to make
multiple selections.)
3. Select the starting cell in which to begin inserting the
waveform, or leave the default as is (
A1).
You can specify the starting cell either by scrolling through the
column and row values, or by directly entering the row and column
22 Oscilloscope Analysis and Connectivity Made Easy
Page 37
Capturing and Graphing Waveforms
values in the edit boxes under the Start Data Display heading.
Possible Excel starting cells range from A1 to AZ99. Starting cell
designations must take the A1-style format rather than the R1C1style format (explained on page 68).
4. If you want to generate an Excel graph on completion of the
waveform capture, select the
Generate Excel graph check
box to enable the graph placement option buttons, and click
Active Sheet or New Sheet, depending on where you want
the chart inserted.
5. Click OK to start the acquisition and display the data in the
active sheet starting at the designated cell.
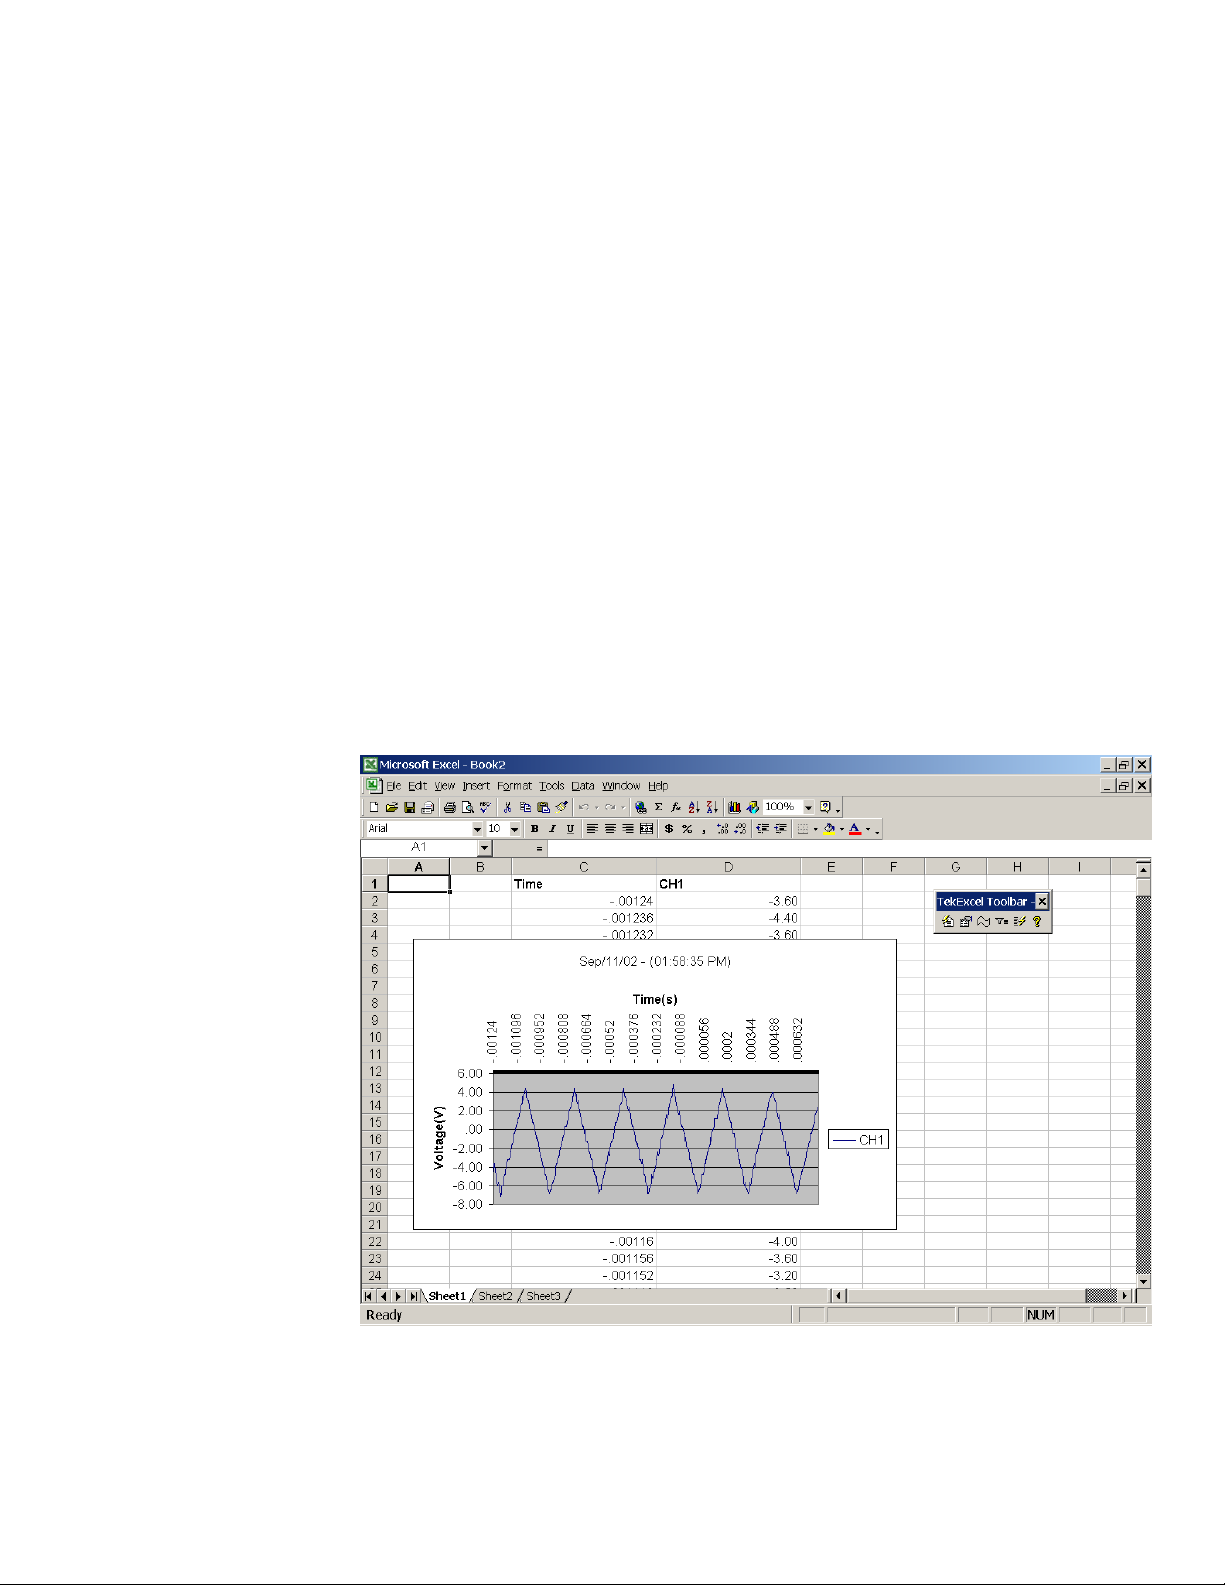
A single time column is displayed and the data values from all
selected channels appear in successive columns (with a maximum of
65000 rows).
If you checked the box to graph the data, a stacked line graph
appears after the capture, either in the active sheet (as shown here) or
in a separate chart sheet. If necessary, you can modify this chart
using Excel.
Oscilloscope Analysis and Connectivity Made Easy
23
Page 38

Clearing the Active Sheet
Clearing the Active Sheet
The Clear Active Sheet button is available on the dialog box displayed when
you click the
toolbar. Behavior is the same in all three cases.
To clear the active sheet (data and charts):
1. Click the Clear Active Sheet button.
2. Click Yes to clear all contentsdata and charts.
Waveform, Measurement, or Trigger Capture buttons on the
The following prompt message appears:
This clears all data, all cell formulas, and all cell formatting from the
active worksheet cells. It also removes any embedded charts inside
the active worksheet.
3. If the active sheet is a separate chart sheet, select the sheet
labeled
TekChart1, and click the Clear Active Sheet button.
The following prompt message appears:
4. Click OK to clear the chart.
TekChart1 chart sheet is removed.
The
Capturing and Graphing Measurements
The Measurement button on the TekExcel Toolbar allows you to capture
single or repeated timed measurement(s) and optionally graph them as well.
Capture Single Measurement(s)
To capture one or more single measurements:
1. Select the Measurement button on the TekExcel Toolbar.
24 Oscilloscope Analysis and Connectivity Made Easy
Page 39

Capturing and Graphing Measurements
A three-tabbed dialog box appears.
2. Choose the Selection tab.
All active channels are displayed. The current measurement source
channel is indicated by the appearance of the word
Measure to the
right of the measurement channel (screen appearance is slightly
different for TDS/CSA8000 Series Oscilloscopes).
Note: You can click the Refresh button to display any
oscilloscope changes to the number of active channels or the
measurement source channel.
3. Select the Single Capture option button.
The Timing and Charting tab forms disappear and a Select All check
box appears on the Selection tab.
4. Click a measurement from the list box under the Select
Measurement(s) heading to select it. To select multiple
measurements, hold down the
measurements you want to select, or select the
Ctrl key while highlighting the
Select all
check box as shown to select all measurements available in
the list.
Oscilloscope Analysis and Connectivity Made Easy
25
Page 40

Capturing and Graphing Measurements
5. Select the starting cell in which to begin inserting the
measurement(s), or leave the default as is (
A1).
You can specify the starting cell either by scrolling through
the column and row values, or by directly entering the row
and column values in the edit boxes under the Start Data
Display heading. Possible Excel starting cells range from A1
to AZ99. Starting cell designations must take the A1-style
format rather than the R1C1-style format (explained on page
68).
Columns or Rows, depending on how you want the data arranged.
Click
Usually captured measurements are placed in columns, because there
are over 65000 rows in an Excel worksheet, whereas data placed in
rows is subject to a 256-column limit in Excel worksheets. If you
choose the
Select All check box, however, the Rows option button is
selected by default because these measurement snapshots are best
displayed vertically, with engineering units in a column to the right.
Active Sheet or New Sheet, depending on where you want the data
Click
inserted.
Click Start.
Note: For information about clearing the active sheet, see page
24.
Measurement heading(s) and current values, along with their units of
measure, are placed in the selected sheet starting at the designated
cell.
26 Oscilloscope Analysis and Connectivity Made Easy
Page 41

Capturing and Graphing Measurements
Capture and Graph Repeated Measurement(s)
To capture multiple timed measurement(s):
1. Select the Measurement button on the TekExcel Toolbar.
A three-tabbed dialog box appears.
Oscilloscope Analysis and Connectivity Made Easy
27
Page 42

Capturing and Graphing Measurements
2. Choose options from the Selection tab (see Select
Measurement(s) on page 28), the
and the
3. When you have made all your selections, click Start from
Charting tab (see page 30).
Timing tab (see page 29),
any of the tabs.
Measurement heading(s) and current values, along with their units of
measure, are placed in the selected sheet starting at the designated
cell. An optional chart may also appear in the active sheet as shown
here, or in a separate chart sheet:
Select Measurement(s)
To select the measurement(s) to capture:
1. Choose the Selection tab.
All active channels are displayed.
Note: You can click the Refresh button to display any
oscilloscope changes to the number of active channels or the
measurement source channel.
2. Select the Repeated timed captures option button.
28 Oscilloscope Analysis and Connectivity Made Easy
Page 43

Capturing and Graphing Measurements
3. Click a measurement from the list box under the Select
Measurement(s) heading to select it. To select multiple
measurements, hold down the
Ctrl key while highlighting the
measurements you want to select.
4. Select the starting cell in which to begin inserting the
waveform, or leave the default as is (
C1).
You can specify the starting cell either by scrolling through the
column and row values, or by directly entering the row and column
values in the edit boxes under the Start Data Display heading.
Possible Excel starting cells range from A1 to AZ99. Starting cell
designations must take the A1-style format rather than the R1C1style format (explained on page 68).
5. Click Columns or Rows, depending on how you want the
data arranged.
Usually captured measurements are placed in columns, because there
are over 65000 rows in an Excel worksheet, whereas data placed in
rows is subject to a 256-column limit in Excel worksheets.
6. Click Active Sheet or New Sheet, depending on where you
want the data inserted.
Note: For information about clearing the active sheet, see page
24.
Specify Timing
To specify timing of the capture:
1. Select the Timing tab.
2. If you want the measurement capture to begin as soon as you
click the
3. If you want to delay measurement capture until a specified
Start button, choose the Immediately option button.
time:
a. Choose the Specified Time option button.
b. In the Day box, type or select the date to begin the
measurement capture.
c. In the Time box, type or select the hour and minute to
begin the capture.
4. In the Interval box, type or select a time value to specify the
interval between captures. Notice that this value adjusts the
Record Length value.
Oscilloscope Analysis and Connectivity Made Easy
29
Page 44

Capturing and Graphing Measurements
5. In the Duration box, type or select a time value to specify the
duration of each capture. Notice that this value adjusts the
Record Length value.
6. If necessary, change the value in the Record Length text box
to change the record length of each capture. Notice that this
value adjusts the
Duration value.
For example, suppose that a capture with a 2-second interval and a
1-minute duration displays a record length of 30. If you change the
capture to a 3-second interval, the record length changes to 20. If
instead, you keep the 2-second interval and change the record length
to 60, the duration changes from 1-minute to 2-minute.
Choose Charting Options
To specify charting options for the capture:
1. Select the Charting tab.
The
No Chart option appears preselected as the default option.
2. If you want charting to take place at periodic intervals, click
the
Periodically option button and choose 10, 20, 25, or 50 as
the percentage of completion interval for periodic chart
updates.
3. If you want charting to take place after all measurement
capturing completes, click the
Upon Completion option
button.
30 Oscilloscope Analysis and Connectivity Made Easy
Page 45

Capturing Triggered Waveforms
4. Click Active Sheet or New Sheet, depending on where you
want the chart inserted.
Note: For information about clearing the active sheet, see page
24.
Capturing Triggered Waveforms
The Trigger Capture button on the TekExcel Toolbar allows you to capture
the time and values of a triggered waveform and/or measurement(s) into the
current worksheet, beginning at a chosen cell location. You select the type of
trigger event (such as
or
Average—see page 42), the active channels, and the measurement channel
on the oscilloscope before the capture. The toolbar dialog box allows you to
select one or more active channels from which to capture a waveform, and
one or more types of measurements to capture over the measurement
channel.
If you select the Waveform check box, waveform data from all selected
active channels is captured and placed into the active sheet when the trigger
event occurs. The waveform capture is limited to 65000 rows of data, the
approximate number of rows in Excel spreadsheets.
Edge or Glitch), the type of waveform (such as Sample
If you select the Measurement check box, measurement data from the
measurement channel is captured and placed into the active sheet (in a
column before any captured waveform data) when the triggered event occurs.
You have the option of performing a specified number of captures.
Note: If you want to capture a single untriggered waveform sequence
instead of triggered waveform data, see the Waveform button on page 21.
If you want to capture untriggered measurement data, see the
Measurement button on page 24.
For information about clearing the active sheet, see page 24.
To capture triggered data into an Excel spreadsheet:
1. Select the Trigger Capture button on the TekExcel Toolbar.
Oscilloscope Analysis and Connectivity Made Easy
31
Page 46

Capturing Triggered Waveforms
A dialog box similar to the following appears:
All active channels are displayed, along with the number of data
points in the waveform sample, derived from oscilloscope settings.
The current measurement source channel is indicated by the
appearance of the word
Measure to the right of the measurement
channel.
Note: You can click the Refresh button to display any
oscilloscope changes to the number of active channels, the
measurement source channel, or the number of data samples.
2. If you want to capture triggered waveform data from the
measurement source channel:
a. Select the Waveform check box.
b. Click to select one or more active channels in the list
box from which to capture the data.
3. If you want to capture triggered measurement data:
a. Select the Measurement check box.
b. Click to select one or more measurements in the list box
to capture over the Measurement channel.
4. Select the starting cell in which to begin inserting the data,
or leave the default as is (
32 Oscilloscope Analysis and Connectivity Made Easy
A1).
Page 47

Capturing Triggered Waveforms
You can specify the starting cell either by scrolling through the
column and row values, or by directly entering the row and column
values in the edit boxes under the Start Data Display heading.
Possible Excel starting cells range from A1 to AZ99. Starting cell
designations must take the A1-style format rather than the R1C1style format (explained on page 68).
5. Specify the number of captures to perform or leave the
default value of
6. Click OK to start the acquisition and display the data in the
1.
active sheet starting at the designated cell.
For measurement data, a time stamp for the triggered event appears
in the first row of a column, followed by the requested
measurement(s), with engineering unit(s) added if that box was
checked.
For waveform data, times for each data point appear in the first
column. The first row of subsequent columns contains a time stamp
for each capture of a triggered event. Below the time stamp,
waveform data values appear in successive rows (with a maximum
of 65000 rows). The number of columns of data varies depending on
the number of captures.
Oscilloscope Analysis and Connectivity Made Easy
33
Page 48

Getting Help with the TekExcel Toolbar
Getting Help with the TekExcel Toolbar
The Help button on the TekExcel Toolbar displays online help for the
toolbar. When you click this button, the following Help screen appears:
You can navigate through the pages of this online help system using the
usual buttons and links available in Windows-based Help files.
34 Oscilloscope Analysis and Connectivity Made Easy
Page 49

TekExcel Toolbar Source Code
TekExcel Toolbar Source Code
Tektronix used the TekVISA ActiveX control to build the TekExcel Toolbar
described in this chapter. The source code for this Add-In along with
explanatory text is available on the companion CD that accompanies this
book. You can also view the source code by loading the TekExcel Toolbar
and going to the Excel Visual Basic Editor (select
Basic Editor
or press Alt+F11).
Tools > Macro > Visual
The source code is a good place to look if you wish to build your own
specialized Excel Add-In or customize the TekExcel Toolbar. Before dealing
with the extra complexity of building an Add-In, however, look over the rest
of the chapters in the Excel part of this book. These chapters introduce you to
the TekVISA ActiveX control, and take you step-by-step through procedures
for using Excel VBA to build some simple dialog boxes for capturing
oscilloscope data and communicating with your oscilloscope.
Chapter 2 Review
To review what you learned in this chapter:
• You learned that you
do not have to do any programming
to use the TekExcel Toolbar.
• You learned how to use the TekExcel Toolbar to
connection
set scope settings
• You learned how to use the
measurement and waveform data from your oscilloscope
between Excel and your oscilloscope and get or
.
TekExcel Toolbar to acquire
and optionally chart it.
• You learned that the TekExcel Toolbar
available
to you if you want to customize the functionality of
source code is
the toolbar or learn how to build your own.
establish a
Oscilloscope Analysis and Connectivity Made Easy
35
Page 50

Chapter 2 Review
36 Oscilloscope Analysis and Connectivity Made Easy
Page 51

Introduction
Chapter 3: Understanding the TekVISA ActiveX Control
Some background information about
oscilloscope controls and commands
Introduction
Chapter 2 examined the functionality of a toolbar that enables
point-and-click communication between your oscilloscope and Microsoft
Excel. If you want more detailed information on the workings of those
functions or want to create your own connectivity functions, read this
chapter.
Background Information
In this chapter, you will:
1. Review some general terminology.
2. Become familiar with the TekVISA ActiveX Control used to
build the TekExcel Toolbar Add-In. You will learn about
using this control to acquire and receive oscilloscope data
and pass it to Excel VBA and Visual Basic 6.0 automation
interfaces.
3. Review information about GPIB commands and queries
that are native to your oscilloscope.
4. Learn how some TekVISA ActiveX Control methods can be
used to send
oscilloscope from Excel or Visual Basic programs and
receive the results, if any.
native GPIB commands and queries to the
Oscilloscope Analysis and Connectivity Made Easy
37
Page 52

Terminology
Terminology
This chapter uses the same terminology as Chapter 1. In addition, you will
become familiar with a few new terms as shown in Table 4.
Table 4: Some command and control terminology
Term Meaning
Automated Acquisition
Waveform
Acquisition
program
TekVISA API
TekVISA ActiveX
Control
Native GPIB
commands and
queries
VXI Plug-n-Play
driver commands
A set of application programming interfaces (APIs) to your
oscilloscope that let you automate the same functions you would
normally perform using the knobs and graphs on your
oscilloscope. Includes elements discussed below.
A Visual Basic program, either stand-alone or used in conjunction
with Excel, which uses the TekVISA Control and GPIB
commands to implement a direct waveform connection.
A set of resources, operations, attributes, and events that
conform to the VISA standard for building drivers for test and
measurement equipment.
A set of methods, properties, and events that encapsulate
portions of the TekVISA API and provide an easy way to use VB
or VBA to get waveforms or to send GPIB commands and
queries to the oscilloscope and obtain query responses back
from the oscilloscope.
A set of GPIB commands and queries native to specific Tektronix
Windows-based oscilloscopes, that can be passed by certain
TekVISA ActiveX Control methods.
A set of driver commands for controlling specific Tektronix
Windows-based oscilloscopes. These commands conform to
VXIPlug&Play standards, and enable connectivity with
LabWindows/CVI and LabVIEW.
VXI-11 LAN Server
A software component that supports LAN-based instrument
communication using the VXI-11 communications protocol, a part
of the TekVISA software.
Automated Acquisition
To perform automated acquisition, you will add two kinds of elements to
your program:
• Native GPIB commands and queries based on ANSI/IEEE
standards that define the GPIB hardware interface, signals,
and common commands
• The TekVISA ActiveX Control based on the VISA standard
for building test and measurement system drivers
38 Oscilloscope Analysis and Connectivity Made Easy
Page 53

Automated Acquisition
Native GPIB Commands and Queries
To use an analogy, native GPIB commands are like telephone numbers. You
have to specify things like the country code, area code, exchange, and the
extension. TekVISA ActiveX Control methods are more like speed
dialingthey provide shortcut ways to send telephone numbers or, in this
case, native GPIB commands.
In subsequent chapters, you will use some native GPIB commands and
queries to control waveform acquisition and measurement functions of your
instrument. These commands follow GPIB interface conventions. Table 34
and Table 35 in Appendix A explain the subset of native GPIB commands
and queries used in this book.
• Commands modify instrument settings or tell the
oscilloscope to perform a specific action.
• Queries cause the oscilloscope to return data and
information about its status.
To learn more about the full set of native GPIB commands, see the Online
Programmer Guide for your Tektronix Oscilloscope Series.
TekVISA ActiveX Control Methods, Properties, and Events
The TekVISA ActiveX Control includes a simple set of Visual Basic methods,
properties, and events that overlay more detailed operations defined in the
TekVISA API.
Because these ActiveX Controls use in-process calls, they execute nearly as
fast as if you had coded to the TekVISA API itself. As you saw from using
the TekExcel Toolbarwhich was written in Visual Basicthis can mean
rapid application development without the usual loss of performance
associated with a more simplified, higher level interface.
In upcoming chapters, you will become more familiar with the TekVISA
ActiveX Control that provides a portal into your oscilloscope. You will learn
how to customize interfaces by accessing this control through its methods,
properties, and events:
• Some methods, such as
Query, WriteString, and ReadString
involve more detailed programming that directly accesses
native GPIB commands.
• Other methods, such as
GetWaveform, offer much higher-
level interfaces that consolidate multiple TekVISA
operations and involve fewer lines of code.
Table 36 in Appendix A summarizes the methods, properties, and events of
the TekVISA ActiveX Control used with Excel VBA and Visual Basic 6.0
examples.
Oscilloscope Analysis and Connectivity Made Easy
39
Page 54

Automated Acquisition
40 Oscilloscope Analysis and Connectivity Made Easy
Page 55

Introduction
Chapter 4. A Simple Program To Get Waveforms
Using VBA to import real-time waveforms into
Excel
Introduction
You have looked at how to use the TekExcel Toolbar to import data quickly
into Microsoft Excel, and learned about the TekVISA ActiveX Control. In
this chapter, you will paste the TekVISA ActiveX Control onto a form and
build a simple user interface to transfer acquisition data from the oscilloscope
to your spreadsheet/worksheet. This will add a direct connection for
waveforms to Excela connection that automatically gets waveform data
out of the oscilloscope and inserts it into Excel.
If this application solves your waveform data acquisition needs as supplied,
you can use it “as is” with Excel. In that case, you may wish to load it from
the companion CD and immediately begin using it. However, if you think
you might want to customize the application, read onbecause you will
explore the inner workings of the underlying VBA program in some detail.
GPIB Commands for Waveform Acquisition
Before writing the program, you will examine some relevant Native GPIB
commands that involve waveform acquisition. Then you will look at the
GetWaveform method exposed by the TekVISA ActiveX Control.
Waveform Data
Waveform data points are a collection of values that define a waveform. One
data value usually represents one data point in the waveform record.
You can get waveform data from the oscilloscope by using the
query. Before you transfer waveform data, you must typically specify the
data format, record length, and waveform source.
CURVE?
Oscilloscope Analysis and Connectivity Made Easy 41
Page 56

GPIB Commands for Waveform Acquisition
Waveform Data Formats
Acquired waveform data uses eight or more bits to represent each data point.
The number of bits used depends on the acquisition mode specified when
you acquired the data. For example, on Tektronix real-time Windows-based
oscilloscopes (such as TDS5000 and TDS7000 Series oscilloscopes), data
acquired in
point. Data acquired in
SAMple or ENVelope mode uses eight bits per waveform data
AVERage mode uses up to 14 bits per point.
You specify the format with the
DATa:ENCdg command. The instrument can
transfer waveform data in either ASCII or binary format.
Binary data can be represented by integer or floating-point values. The range
of the values depends on the number of bytes specified. When the byte
number is one, signed integer data ranges from -128 to 127, and positive
integer values range from 0 to 255. When the byte number is two, the values
range from -32768 to 32767. When a MATH (or REF that came with a
MATH) is involved, 32-bit floating-point values are used that are four bytes
in number.
The defined binary formats specify the order in which the bytes are
transferred.
RIBinary specifies signed integer data-point representation
•
with the most significant byte transferred first.
the same as
RIBinary except that the byte order is swapped
SRIbinary is
so the least-significant byte is transferred first.
RPBinary is positive integer data-point representation, with
•
the most significant byte transferred first.
same as
RPBinary except that the byte order is swapped so
SFPbinary is the
the least-significant byte is transferred first.
FPBinary is single-precision floating-point representation of
•
data whose width is 4.
SFPbinary is the same as FPBinary
except that the byte order is swapped so the least-significant
byte is transferred first.
Waveform Record Length
You can transfer multiple points for each waveform record. You can also
transfer a portion of the waveform or the entire record. When transferring
data from the instrument, you can specify the first and last data points in the
waveform record. Setting
DATa:STARt to 1 and DATa:STOP to the record
length will always return the entire waveform.
Waveform Source
DATa:SOUrce command specifies the waveform source when
The
transferring a waveform from the instrument. You can only transfer one
waveform at a time.
42 Oscilloscope Analysis and Connectivity Made Easy
Page 57

The TekVISA ActiveX Control and Waveform Acquisition
Waveform Preamble
Each waveform that you transfer has an associated preamble that contains
information such as the horizontal scale, the vertical scale, and other settings
in effect when the waveform was created.
You can get preamble data from the oscilloscope by using the
WFMOutpre?
query.
The TekVISA ActiveX Control and Waveform Acquisition
TekVISA provides a way to get waveforms without having to issue all the
GPIB commands just summarized. If you only want to get waveform data at
the current oscilloscope settings, without altering those settings
programmatically, you can use the method discussed next.
The GetWaveform Method
The TekVISA ActiveX Control provides a way to combine the equivalent of
dozens of native GPIB commands or multiple TekVISA API operations in a
single method called
current oscilloscope settings, along with its sample interval and trigger
position. You can specify the channel from which to retrieve the waveform
and the desired screen resolution to use in displaying the waveform.
Note: If the waveform setting is MIN/MAX, this method gets double
the number of points and still displays the waveform correctly.
GetWaveform. This method gets a waveform at the
Other Methods of Waveform Acquisition
As shown in Figure 7, you can use ActiveX Control methods like
to send and receive native GPIB commands and queries (such as
CURVE?) to your oscilloscope, and methods like ReadString to receive
and
WriteString
ACQuire
responses from the oscilloscope (such as waveform data in the form of an
array named
wave in this example). Or, you could use the GetWaveform
method to do virtually the same thing.
Oscilloscope Analysis and Connectivity Made Easy
43
Page 58

Getting Started
Figure 7: How TekVISA ActiveX Controls interface with Excel VBA and VB
Getting Started
What You Need to Get Started
You can work this example either on a separate PC or on your Windowsbased oscilloscope, using either the Excel Visual Basic for Applications
Editor or Visual Basic 6.0. To get started, you will need the following:
• A Windows-based Tektronix oscilloscope (an external
monitor is recommended if you are working the example on
your oscilloscope)
• Excel 2000 or XP (or Visual Basic 6.0) installed on your
oscilloscope or on an attached external PC
• The TekVISA connectivity software described in Chapter 1
(see page 323 for the location of the completed example)
44 Oscilloscope Analysis and Connectivity Made Easy
Page 59

Getting Started
What You Will Do
In this chapter, you will learn how to use VBA (or VB) to build a program
with features similar to the one that runs when you click the
Waveform icon
on the TekExcel Toolbar. This sample program illustrates how to capture raw
waveform data at the current oscilloscope settings and insert it into your
spreadsheet.
Figure 8 shows the design-time interface that you will create. As you can see,
the user interface consists of a VBA UserForm with one Frame on the left
and one unframed List Box on the right. A Label appears above the List Box.
The Frame groups these fields:
• three caption Labels
• three Labels being used to hold results
• two Command Buttons
Each caption Label appears to the left of each empty result Label.
Figure 8: The form you will design for the GetWaveform example
Oscilloscope Analysis and Connectivity Made Easy
45
Page 60

Getting Started
This UserForm allows users to get the following information when they click
the
Get Waveform button:
• the currently active TekVISA resource
device being used for
the waveform transfer
• the current data point sample values of the
waveform and
associated times (relative to the trigger point), displayed in
two columns in the spreadsheet
• the current
record length of the waveform being retrieved
(calculated by subtracting the starting data point from the
ending data point)
• the current
• the current
sample interval of the waveform being retrieved
trigger position of the waveform being retrieved
Figure 9 shows the same UserForm at runtime after fields have been
populated with results.
Figure 9: The Get Waveform form at runtime
46 Oscilloscope Analysis and Connectivity Made Easy
Page 61

Getting Started
After sending waveforms to an empty spreadsheet as shown in Figure 9, you
will use the same program to send waveforms to the Excel clock jitter
example (Figure 10) from the Oscilloscope Connectivity Made Easy book.
This example has been provided in its completed form on the CD that
accompanies this book. (The spreadsheet is set up to receive data in the
format exported by TDS7000 Series Oscilloscopes.)
Figure 10: Excel Clock Jitter example
What You Will Learn
The purpose of this chapter is to illustrate some basic operations of the
TekVISA ActiveX Control and familiarize you with the interface. Once you
have gone through this chapter, you will know how to:
• add the TekVISA ActiveX Control to the list of available
controls in Excel, and use some of its properties and methods
• design and create a UserForm in Excel by dragging and
dropping controls onto the form
• modify controls on the form by changing properties in the
Properties window
• expand the VBA code blocks created by inserting controls
• add a button to run the VBA program that you just created
from your Excel spreadsheet
Oscilloscope Analysis and Connectivity Made Easy
47
Page 62

The Get Waveform Example in Excel VBA
• insert and run the program in a blank spreadsheet
• insert and run the program with a spreadsheet that already
contains data and formulas
• find out the changes you will need to make if you want the
program to run in Visual Basic 6.0 instead of Excel VBA
The Get Waveform Example in Excel VBA
Building the Form
If you are already familiar with the Visual Basic for Applications design
environment, the step-by-step instructions below may seem elementary. If so,
you may wish to skip the instructions on how to build the UserForm and just
refer to Figure 8 on page 45 and Table 7 on page 55 for details on building
the user interface, then have a look at the code. Later chapters focus
primarily on the VBA code and assume you are already familiar with VBA’s
visual editing tools for constructing dialog interfaces.
Open VBA in Excel (Alt+F11)
To begin building the UserForm:
1. Open Excel and save the spreadsheet under the name
Getwaveform.xls.
2. To access the Visual Basic for Applications design
environment from within Excel, select
Visual Basic Editor
Note: The keystroke combination ALT+F11 switches you back
or press ALT+F11.
Tools > Macro >
and forth between the Excel spreadsheet and the Visual Basic
Editor.
48 Oscilloscope Analysis and Connectivity Made Easy
Page 63

The Get Waveform Example in Excel VBA
The Microsoft Visual Basic screen appears with the Project Explorer
window on the top left, the
and space on the right for the
Properties window on the bottom left,
Code window or Object Browser to
display.
3. If you do not see the Project Explorer or Properties window,
display them by selecting icons from the standard toolbar
(see Table 5).
Table 5: Useful icons on the VBA Standard Toolbar
Icon Icon Name Select from
Insert UserForm Standard Toolbar
Object Browser Standard Toolbar
Project Explorer Standard Toolbar
Properties Standard Toolbar
Toolbox Standard Toolbar
Oscilloscope Analysis and Connectivity Made Easy
49
Page 64

The Get Waveform Example in Excel VBA
Insert a UserForm
To begin building a UserForm:
1. Click the Insert UserForm icon on VBA’s Standard Toolbar:
A UserForm appears with the name UserForm1 preassigned
along with the Controls Toolbox for adding controls to the form.
Table 6 shows icons on the Controls Toolbox that are relevant to this
book.
50 Oscilloscope Analysis and Connectivity Made Easy
Page 65
The Get Waveform Example in Excel VBA
Table 6: Icons for VBA controls used in this book
Icon Icon Name Select from
Checkbox Controls Toolbox
CommandButton Controls Toolbox
Frame Controls Toolbox
Label Controls Toolbox
Listbox Controls Toolbox
Spin Button Controls Toolbox
Textbox Controls Toolbox
Add the TekVISA ActiveX Control
To add the TekVISA ActiveX Control to the UserForm:
1. Select Tools > Additional Controls.
The Additional Controls dialog box appears.
2. Place an X in the box next to the TekVISA Control
TvcControl) and click OK.
(
Oscilloscope Analysis and Connectivity Made Easy
51
Page 66

The Get Waveform Example in Excel VBA
The TekVISA Control icon is added to the Controls Toolbox.
3. Drag the TekVISA Control icon from the Controls Toolbox
onto the lower right quadrant of
UserForm1 where it appears
as an icon at design time, but is invisible at runtime.
By adding the Control to your Userform, you have made all its
methods, properties, and events available to be called by your code.
Design the Form
To design the Get Waveform UserForm:
1. Insert a Frame into UserForm1 using one of the following
techniques:
Note: Frames are used to group and organize other controls.
a. Click the Frame in the Toolbox and then click in the
UserForm, or
b. Drag the Frame from the Toolbox to the UserForm, or
c. Double-click the Frame in the Toolbox, and then click in
the UserForm once for each Frame you want to create.
The Frame appears in its default size. VBA automatically gives
it the name
Note: You can use similar techniques to insert other kinds of
Frame1.
controls in a UserForm or to insert controls inside a Frame.
2. Position the frame on the left side of the UserForm and, if
necessary, drag the sides or corners of the Frame to change
its size.
3. Drag a List Box onto the right side of UserForm1. VBA
automatically names it
52 Oscilloscope Analysis and Connectivity Made Easy
ListBox1.
Page 67

The Get Waveform Example in Excel VBA
4. Add two Command Buttons to the bottom of Frame1,
placing them side by side.
Note: To place a control within a frame, you can use any of
the techniques described in step 1. As an alternative, you can
give the frame focus by clicking it, and then cut or copy a
control elsewhere on the form and paste it into the frame.
5. Similarly, add six Labels to Frame1 and a seventh Label
ListBox1, making sure that each control is placed as
above
shown in Figure 11.
Figure 11: Get Waveform form before changing default properties
Getting Help
Labels are not just used for captions. Labels 4 through 6 will be used to hold
resultsspecifically, additional waveform values (record length, sample
interval, and trigger position) associated with the waveform data.
You can find out more about using Labels by taking a look at the
Help
facility:
1. From the Microsoft Visual Basic menu bar, select Help >
Contents and Index > Microsoft Forms Design Reference >
Label Control.
2. Click Example and select Zoom Event Example to see usage
of Labels in a coded example.
As shown in Figure 12, the text explains that you can use a Label to
display the current value. Examples like these can be very useful
when you are writing VBA code.
Oscilloscope Analysis and Connectivity Made Easy
53
Page 68

The Get Waveform Example in Excel VBA
Figure 12: Using the VBA Help facility
Changing Properties in the Properties Window
Table 7 summarizes all the changes to make in the Properties window to
modify the UserForm from its appearance in Figure 11 to its final appearance
in Figure 8.
54 Oscilloscope Analysis and Connectivity Made Easy
Page 69

The Get Waveform Example in Excel VBA
Table 7: Changes to make in the Properties window to Get Waveform
Control Property Change from Change to
UserForm1 Caption UserForm1 Get Waveform
tvc (TekVISA) (Name) Tvc1 Tvc1 (no change needed)
Frame1 Caption Frame1 Waveform Data
Label1 Caption Label1 Record Length
Label2 Caption Label2 Interval
Label3 Caption Label3 Trigger
Label4
Label5
Label6
Label7 Caption Label7 Devices
Listbox1 (Name) Listbox1 lstDevices
(Name) Label4 LblRL
Caption Label4 (no Caption)
BackColor Button Face Button Light Shadow
Special Effect Flat Sunken
(Name) Label5 LblInterval
Caption Label5 (no Caption)
BackColor Button Face Button Light Shadow
Special Effect Flat Sunken
(Name) Label6 LblTriggerPos
Caption Label6 (no Caption)
BackColor Button Face Button Light Shadow
Special Effect Flat Sunken
(Name) CommandButton1 cmdGetWaveform CommandButton1
Caption CommandButton1 Get Waveform
(Name) CommandButton2 cmdClear CommandButton2
Caption CommandButton2 Clear
To make the code more meaningful, you will also rename some of the
controls that will correspond to variable names and subroutine names in the
VBA code logic you will write later. Changes to names are underlined
in the
table, to help distinguish them from captions. To support good coding
practice, always name a control first before changing any of its other
properties, if you think you might want to associate it with a code block later.
Note: A control’s name corresponds to its subroutine name or
variable name in the code. A control’s caption appears on the
UserForm and affects how the form looks, but has nothing to do with
the code.
Oscilloscope Analysis and Connectivity Made Easy
55
Page 70

The Get Waveform Example in Excel VBA
To use the Properties window to change the properties of controls:
1. In the Properties window, change the caption (not the name)
UserForm1 to Get Waveform.
for
2. Change the caption for Frame1 to Waveform Data.
3. Change the caption for Label1 to Record Length.
and resize Label1 by dragging the box handles if necessary.
Note:
If you want a label to appear on two lines, change its Wrap
property to True.
4. Change the caption for Label2 to Interval and the caption for
Label3 to Trigger.
5. For Label4 through Label6, change the names to lblRL,
lblInterval, and lblTriggerPos, respectively, and delete their
captions so they do not appear on the form.
6. For Label4 through Label6, use drop-down lists in the
Properties window to change BackColor (the background
color) from Button Face to
SpecialEffect from Flat to
Button Light Shadow, and
Sunken.
56 Oscilloscope Analysis and Connectivity Made Easy
Page 71

The Get Waveform Example in Excel VBA
Note:
The drop-down arrow may not be visible until you click
inside the rows for the BackColor and SpecialEffect properties.
7. Change the rest of the captions and sizes for controls as
shown in Table 7 so that the form looks like Figure 13.
Figure 13: The redesigned form for Get Waveform
Using the Object Browser (F2)
In addition to using the online help discussed on page 53, you can use the
Object Browser to learn more about the classes and members of Excel’s
built-in object model.
Oscilloscope Analysis and Connectivity Made Easy
57
Page 72

The Get Waveform Example in Excel VBA
A Quick Overview of the Excel Object Model
Figure 14 shows a hierarchy of some relevant objects in the Excel Object
Model.
Figure 14: A object hierarchy from the Excel Object Model
The Application object is at the root of the hierarchy tree and has a number of
“active” properties such as
hold other objects. For example,
objects, which in turn contain
each of which contains
ActiveSheet. Plural objects are collections that
Workbooks is a container for Workbook
Worksheet collections of Worksheet objects,
Range objects.
Much of your code will focus on
cell, a row or column, or an entire sheet. You can use the Range
Range objects, which can reference a single
End
property to select contiguous cells until an empty cell is encountered. The
following examples demonstrate some ways you can reference ranges:
Application.Range(“A3”)
Application.Worksheets(“Sheet1”).Range(“A3”)
Application.ActiveSheet.Range(“A3”)
Range(“A3”)
Range(“A1:D10”)
Range(“A1”,”D10”)
Range(“A1:A10, D1:D10, G1:G10”)
Range(“MyRange”)
[A1:D10] (Evaluate Method)
Range(ActiveCell, ActiveCell.End(xlDown)).Select
You can use the Cells property to reference all cells within a worksheet or
range, or limit the reference by using this R1C1 row/column syntax:
cells (rowindex, columnindex)
For example, the following code assigns a formula to cell C2:
ActiveSheet.Cells(2,3).Formula = “=SUM(D1:D10)”
By pressing F2 or clicking the Object Browser icon on the Standard Toolbar,
you can browse to find out which methods, properties, and events to use with
such object components as
, so you can make the correct calls and references in your code.
Cell
Application, Worksheet, UserForm, Range, and
58 Oscilloscope Analysis and Connectivity Made Easy
Page 73
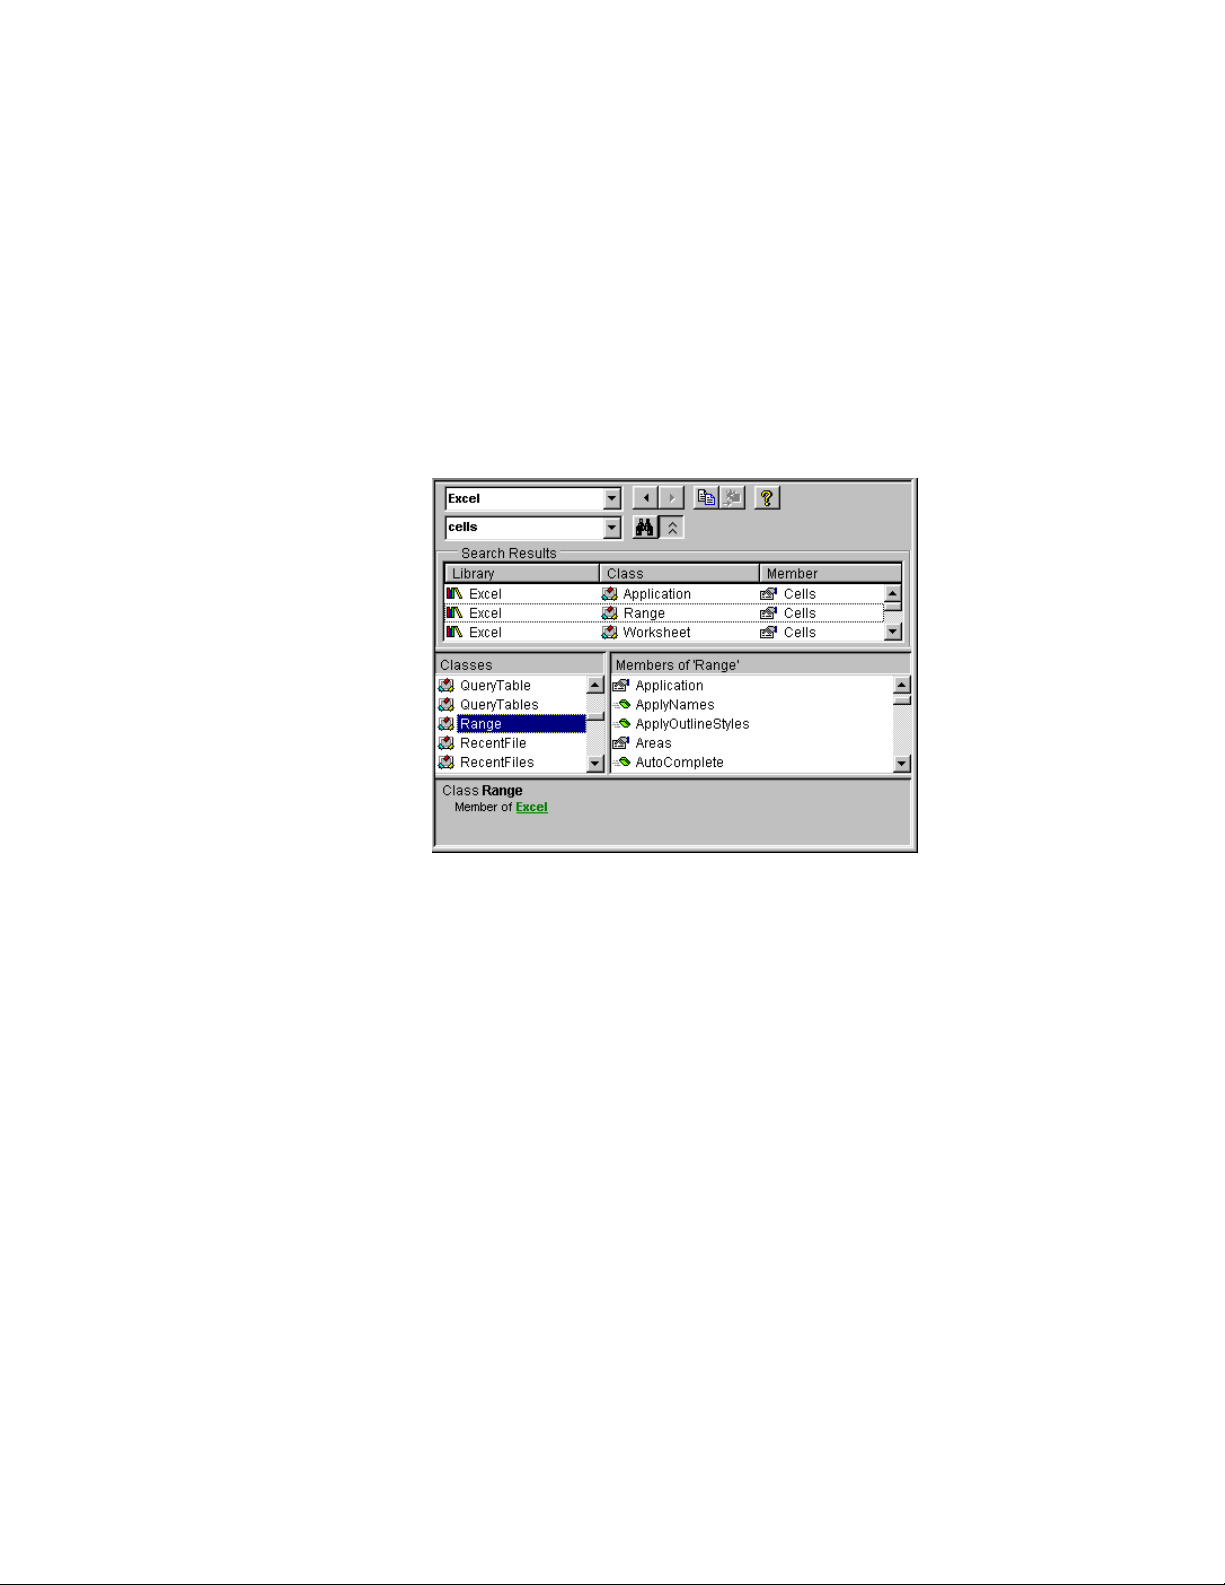
The Get Waveform Example in Excel VBA
For example, to find out more about the Cells property:
1. Press F2 to bring up the Object Browser.
Excel from the upper drop-down list.
Select
Cells in the lower drop-down list as the object to search for.
Type
Enter.
Press
You will see the screen shown in Figure 15. You can then click on
various library entries in the Search Results to see how the
Cells
property relates to other members of the object model.
Figure 15: Using the Object Browser with Excel VBA
F1 From the Object Browser Is Your Friend
From the Object Browser, you can jump to a context-sensitive online help
topic.
For example:
1. Select a related class such as Range.
2. Press F1 (or right-click and select Help).
Figure 16 shows the resulting help screen.
Oscilloscope Analysis and Connectivity Made Easy
59
Page 74

The Get Waveform Example in Excel VBA
Figure 16: Related online help from the Object Browser
Within this help screen, you can click items in the hierarchy diagram
to jump to other related topics if necessary, or to see more of the
hierarchy tree.
Coding the Event Procedures
Mostly by acting on events, you will be coding what should happen when the
form is initialized and when the user clicks each button on the form.
As you type the code, you will notice some helpful features. For example,
when you type a period after a COM object such as the TekVISA ActiveX
Control, the VBA Intellisense feature opens a list that prompts you with
choices. Valid properties, methods, and events exposed by the COM object
as public are preceded by a green icon, like the first choice in the following
list:
60 Oscilloscope Analysis and Connectivity Made Easy
Page 75

The Get Waveform Example in Excel VBA
Similarly, after you type an opening parenthesis, the Intellisense feature
prompts you with the syntax for arguments, and displays valid choices:
The Activate UserForm Routine
This is the main body of the code, because it executes immediately to assign
initial variables and prepare a UserForm before it is displayed. This routine
uses TekVISA calls to find all available device resources, then sets the active
device to be virtual GPIB, which is always GPIB8.
1. In the Project Explorer window, right-click the
frmGetWaveform icon in the Forms folder and select View
Code
or press F7 to switch to the Code window for this project.
2. Type the following in the Code window:
Option Explicit
This statement causes VBA to ensure that a variable is defined
before you use it.
3. In the Project Explorer window, do one of the following to
switch to the UserForm:
a. Double-click the frmGetWaveform icon in the Forms
folder, or
b. Right-click the frmGetWaveform icon in the Forms
folder and select
c. Press Shift+F7.
4. Double-click the right side of the UserForm, outside of the
View Object, or
frame.
VBA inserts the following code fragment into the Code window. It is
so named because
Private Sub UserForm_Click()
End Sub
Oscilloscope Analysis and Connectivity Made Easy
Click is the default event for the UserForm object.
61
Page 76

The Get Waveform Example in Excel VBA
5. Delete this code block, since you want to write a routine that
takes place when the form is activated, not when a user
clicks it.
6. Click the right drop-down menu to see a list of members
(methods, properties, and events) that are valid with
UserForm, and select Activate. The Activate event allows
you to initialize module-level variables before the UserForm
is first displayed.
VBA inserts the following code block:
Private Sub UserForm_Activate()
End Sub
7. Type the following code inside the UserForm_Activate
subroutine (TekVISA-related statements are highlighted in
boldface):
Dim i As Integer
Dim dev As Variant
Tvc1.SearchCriterion = 0 'search all devices
' get detected VISA devices
dev = Tvc1.FindList
' populate devices listbox
If IsArray(dev) Then
For i = LBound(dev) To UBound(dev)
lstDevices.AddItem dev(i)
Next
End If
When the UserForm is activated before it first displays, this code:
a. Declares a counter variable and a list array of devices.
b. Uses the SearchCriterion property of the TekVISA
ActiveX Control to set criteria to search for resource
devices detected on this instrument.
62 Oscilloscope Analysis and Connectivity Made Easy
Page 77

The Get Waveform Example in Excel VBA
c. Uses the FindList property of the TekVISA ActiveX
Control to get the results of the search and store them in
a device list array.
d. Uses LBound and UBound functions to refer to the lower
and upper boundaries of the device list array while
iterating through the list.
e. Uses the Excel AddItem method to populate the
lstDevices list box with the Find list results, which will
appear on the form as available devices.
8. Type the following code next inside the UserForm_Activate
subroutine:
Fori=0TolstDevices.ListCount - 1
If Left(lstDevices.List(i), 5) = "GPIB8" Then
' default to virtual GPIB device
lstDevices.ListIndex = i
Tvc1.Descriptor = lstDevices.Text
Exit For
End If
Next
This code:
a. Uses the Excel ListCount property to iterate through the
items in the
lstDevices list box for an entry
corresponding to a virtual GPIB device (GPIB8).
b. Uses the Excel ListIndex property to set the virtual GPIB
device as the currently selected item in the
lstDevices list
box, so that it appears preselected on the form.
c. Uses the Descriptor property of the TekVISA ActiveX
Control to set the value in the
Text property of the
lstDevices list boxin this case, the virtual GPIB device
stringas the active VISA resource.
The Clear Button Routine
Next you will initialize some variables. You know that the
Clear command
button will clear fields, so you will write that initialization code also.
1. Type the following in the Code window, just below the
Option Explicit statement:
Dim rngHold As Range ' reference to worksheet range for
' clearing
This statement declares a variable of data type Range to hold the
worksheet range. Since this variable appears outside of any
subroutine, its scope is modular and it can be referenced from any
routine in the module. You will reference this range when you write
Oscilloscope Analysis and Connectivity Made Easy
63
Page 78

The Get Waveform Example in Excel VBA
the code associated with the Clear command button, which must
clear the range between acquisitions.
2. Select cmdClear from the left drop-down menu in the Code
window.
The following code fragment for the cmdClear_Click subroutine
appears in the Code window.
Click is the default event for command
button controls.
Private Sub cmdClear_Click()
End Sub
In this case, Click is the event you want to use in your code.
3. Type the following code inside the cmdClear_Click
subroutine:
If Not rngHold Is Nothing Then
rngHold.Clear
rngHold.ClearContents
rngHold.ClearFormats
End If
lblInterval.Caption = ""
lblRL.Caption = ""
lblTriggerPos.Caption = ""
When the Clear button is clicked, if waveform data is present, this
code:
a. uses Clear, ClearContents, and ClearFormats methods of an
Excel
Range object to clear the spreadsheet columns where
waveform data appears (including all values, formulas, and
formatting)
b. uses the Caption property of an Excel Label control to clear the
captions of the result Labels (where additional waveform values
appear on the form)
64 Oscilloscope Analysis and Connectivity Made Easy
Page 79

The Get Waveform Example in Excel VBA
The Get Waveform Button Routine
Next you will work on the logic that takes place when the user clicks the
Waveform
button. This involves placing a call to the GetWaveform method
Get
of the TekVISA ActiveX Control, which takes five arguments. You will also
learn to use the
Application object, which represents the entire Excel application. In the
Excel
process, you will encounter some Excel fine points, such as
xlDefault, which are preassigned mouse-pointer constants that can be
assigned to the
Note: You can use Application object shortcuts (for example,
ActiveSheet.Range) rather than fully-qualified references (for
ScreenUpdating, Cursor, and ActiveSheet properties of the
xlWait and
Cursor property.
example, Workbook.ActiveSheet.Range) whenever doing so is
unambiguous.
1. Press Shift+F7 to switch to the UserForm, and double-click
Get Waveform button.
the
VBA inserts the following code block:
Private Sub cmdGetWaveform_Click()
End Sub
2. Type the following code inside the cmdGetWaveform_Click
subroutine code block:
Dim arrWF As Variant, xinc As Double, trigpos As Long
' variables for GetWaveform method
Dim arrLength As Long, i As Long
Dim t As Double
Dim tracker As Long
Dim blnProceed As Boolean
Dim msg As String
Dim ans As Integer
Dim hUnits As String, vUnits As String
On Error GoTo cmdGetWaveFormErr
This code declares:
a. Variables for three arguments passed by the
GetWaveform method of the TekVISA ActiveX Control,
including an array variable to hold the waveform values,
and variables to hold the sample interval (x-axis
increment) and trigger position.
b. An array variable to hold the waveform record length
and a variable for iteration through the array.
c. An interim variable t to hold the time value (relative to
the trigger point) associated with each data point sample
value.
d. A variable to track the rows in cells of the active
worksheet.
Oscilloscope Analysis and Connectivity Made Easy
65
Page 80

The Get Waveform Example in Excel VBA
e. A Boolean variable to determine whether to proceed in
the case of large waveforms.
f. Variables to hold MsgBox messages and user answers.
g. Two variables for output parameters of the
GetWaveform method.
If clicking the
the
cmdGetWaveformErr error routine.
3. Type the following code inside the cmdGetWaveform_Click
GetWaveform button causes an error, control passes to
subroutine code block:
Call Tvc1.GetWaveform(CH1, arrWF, xinc, trigpos,
' test that an array has been returned
If IsArray(arrWF) Then
' get length of array
arrLength = UBound(arrWF) - LBound(arrWF) + 1
lblRL.Caption = arrLength
End If
' show rest of waveform info
lblInterval.Caption = xinc
lblTriggerPos.Caption = trigpos
DoEvents
vUnits, hUnits)
This code:
a. Calls the TekVISA Control with the GetWaveform
method, which accepts one argument (the channel from
which to get a waveform) and passes back five
arguments (see Table 36 in Appendix A for more
information about this method).
b. Uses the IsArray function to test that a waveform array
has been returned .
c. Calculates the record length by subtracting the starting
data point from the ending data point (+ 1) and stores it
Caption property of the lblRL Label control, so that
in the
it will appear on the form.
d. Stores the returned sample interval and trigger position
argument values in the
and lblTriggerPos
Caption property of the lblInterval
Label controls, respectively, so that
they will appear on the form.
e. Uses the DoEvents function to pass control to the
operating system so it can repaint the screen, allowing
the user to see the updated fields on the form. Control is
returned after the operating system has finished
processing the events in its queue.
66 Oscilloscope Analysis and Connectivity Made Easy
Page 81

The Get Waveform Example in Excel VBA
4. Type the following code inside the cmdGetWaveform_Click
subroutine code block:
' flag for large waveform sets
blnProceed = True
If arrLength > 10000 Then
msg = "Waveform includes " & arrLength & " values. "
msg = msg & "Do you wish these values to be displayed ?"
ans = MsgBox(msg, vbYesNo + vbDefaultButton2,
If ans = vbNo Then blnProceed = False
End If
If blnProceed = False Then Exit Sub
"Get Waveform")
This code:
a. Sets a Boolean flag to true.
b. If the record length exceeds 10,000, puts up a message
box with Get Waveform displayed in the title bar, asking
the user whether or not to display the values.
c. Uses the vbyesno and vbDefaultButton2 constants to set
the message box style to include Yes and No buttons,
with the second button (the No button) preselected as the
default.
d. Gets the user’s response and, if the user clicked the No
button, sets the flag to false and exits the subroutine.
5. Type the following code inside the cmdGetWaveform_Click
subroutine code block:
' proceed to display the data
If (IsArray(arrWF) And blnProceed) Then
' set headers
ActiveSheet.Range("C1").Value = "Time"
ActiveSheet.Range("C1").Font.Bold = True
ActiveSheet.Range("D1").Value = "Value"
ActiveSheet.Range("D1").Font.Bold = True
tracker = 2
' let user know we are filling cells
Application.Cursor = xlWait
' stop screen repaints while filling cells
Application.ScreenUpdating = False
If a waveform array is present and the Boolean flag is set to true, this
code:
a. Assigns Time and Value headers to cells in range C1:C1
and D1:D1 of the active Excel sheet (the
Range property
applies to single cells in this example).
Oscilloscope Analysis and Connectivity Made Easy
67
Page 82

The Get Waveform Example in Excel VBA
b. Sets the row-tracking variable to 2 so the program will
start inserting values in the second row under the
headers.
c. Changes the mouse pointer cursor to an hourglass to let
the user know that the program is busy filling cells.
d. Turns off screen repainting to speed up execution while
processing waveform data.
6. Type the following code inside the cmdGetWaveform_Click
subroutine code block:
For i = LBound(arrWF) To UBound(arrWF)
Exit Sub
' calculate time
t = (i - trigpos) * xinc
ActiveSheet.Cells(tracker, 3).Value = t
ActiveSheet.Cells(tracker, 4).Value = arrWF(i)
tracker = tracker + 1
Next
' we are done reset cursor and screen painting
Application.Cursor = xlDefault
Application.ScreenUpdating = True
' set reference to range for the clear button
Set rngHold = ActiveSheet.Range("C1", Cells(tracker, 4))
Else
MsgBox "Error encountered acquiring Waveform", vbOKOnly,
"Get Waveform"
End If
This code:
a. Loops through the waveform array, calculating the time
value (relative to the trigger point) for each waveform
data point according to the formula
(data-point-index – trigger-position) * sample-interval
and assigning time and data point values to cells in columns C
and D of the active sheet for as many rows as needed.
Note: The Cells property uses R1C1-style references. For
example, cell C5 would be “C5” in A1 notation, but “R5C3”
in R1C1 notation.
b. Changes the cursor back to the default mouse pointer
arrow.
c. Turns on screen repainting again so that the screen will
refresh.
d. Sets the range reference for the Clear button to start with
C1 and end with the row in column D referenced by the
tracker variable.
68 Oscilloscope Analysis and Connectivity Made Easy
Page 83

The Get Waveform Example in Excel VBA
e. Adds an Else clause, in case waveform acquisition fails,
that displays an error message in a message box with an
OK button and “Get Waveform” displayed in the title
bar.
7. Type the following code inside the cmdGetWaveform_Click
subroutine code block:
cmdGetWaveFormErr:
MsgBox "Error " & Err.Number & ": " & Err.Description,
Application.Cursor = xlDefault
Application.ScreenUpdating = True
vbOKOnly,"Get Waveform"
If an error occurs when the Get Waveform button is clicked, this
code:
a. Displays an error message that includes the error number
and its description, using a message box with an OK
button and “Get Waveform” displayed in the title bar.
b. Changes the cursor back to the default mouse pointer
arrow.
c. Turns on screen repainting again so that the screen will
refresh.
Running the GetWaveForm Program
The Show Form Routine
Now that you have created the form, the next step is to create a short routine
that displays it when the user clicks a button on the spreadsheet.
1. Expand the Modules folder in the Project Explorer window
and double-click
2. An empty page in the Code window appears.
3. Type the following:
Option Explicit
Sub btnShowForm()
frmGetWaveform.Show vbModeless
End Sub
Module1.
This code displays the GetWaveform form with the display style set
to the constant
vbModeless, meaning that the form is not modal.
Since it is modeless, no applications are suspended when the form is
displayed, so the user need not respond to the form before using any
other part of the application.
Oscilloscope Analysis and Connectivity Made Easy
69
Page 84
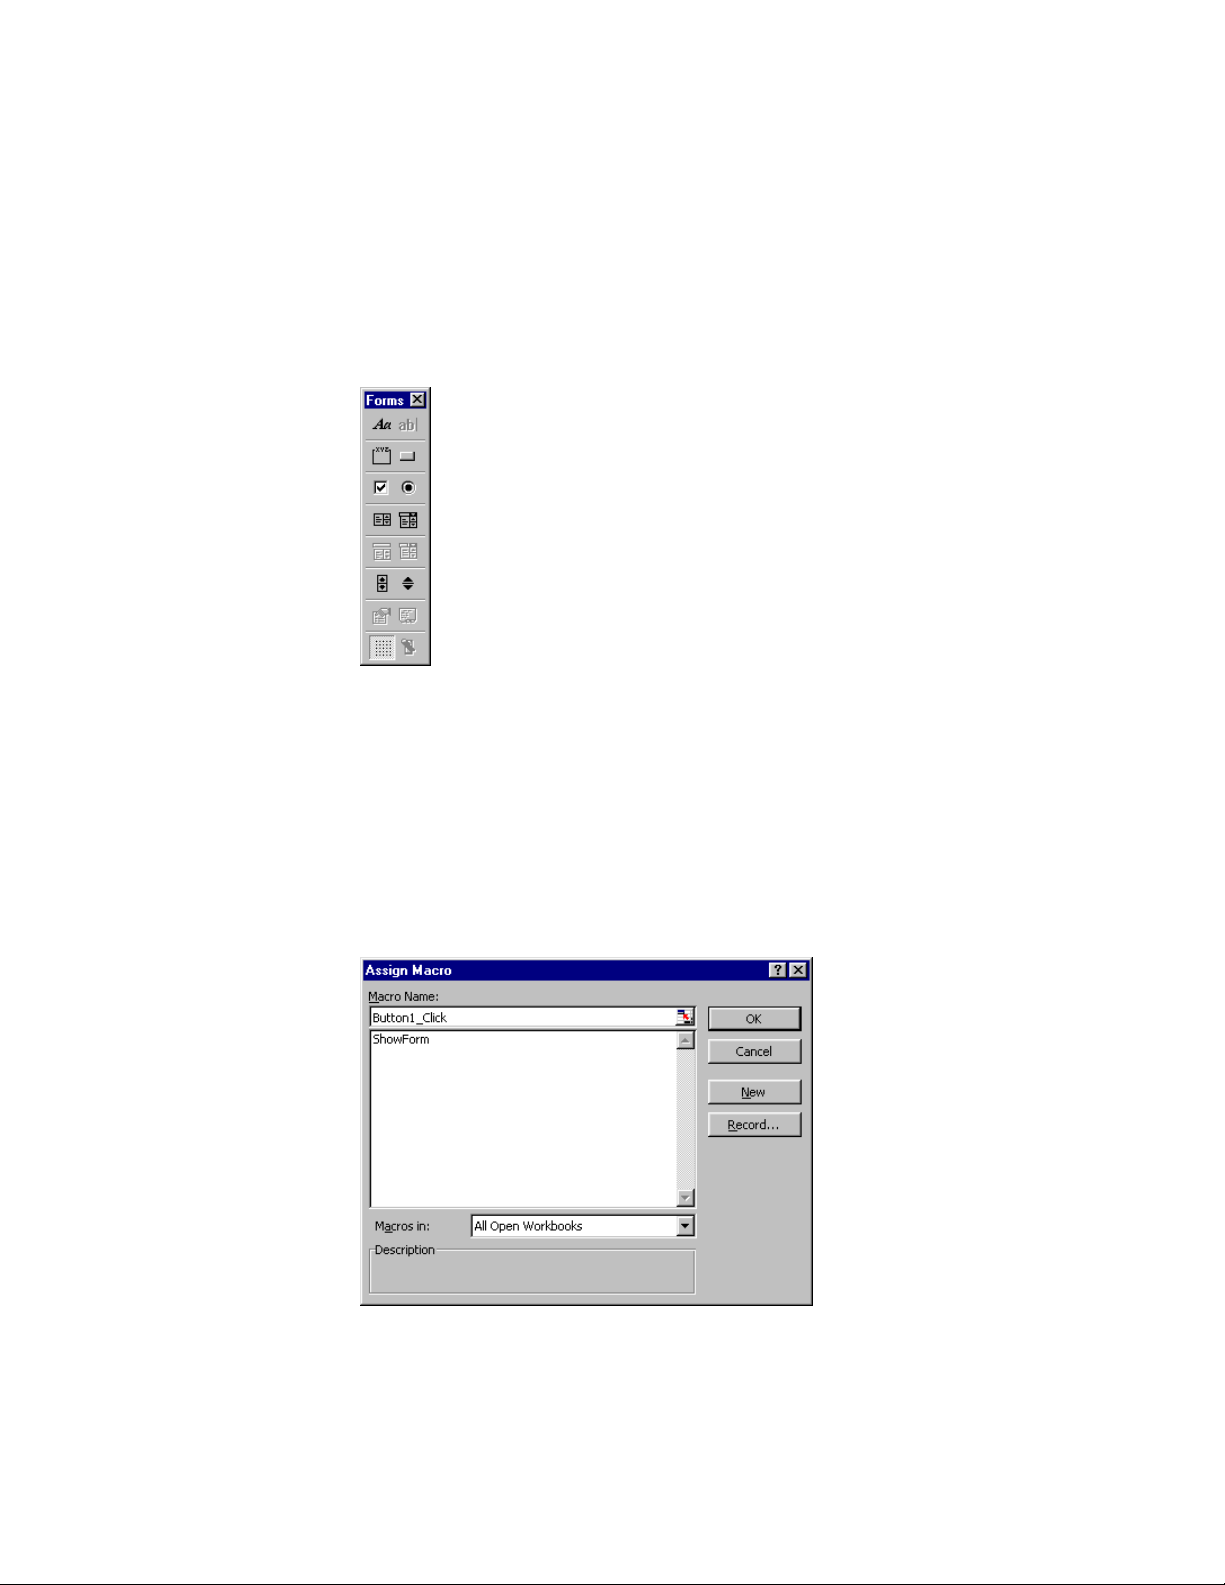
The Get Waveform Example in Excel VBA
To add a button to the spreadsheet so you can run the program you just
created:
1. Press Alt+F11 to switch from VBA to the Excel spreadsheet.
2. If the Excel Forms Toolbar is not visible, select View >
Toolbar > Forms
to display it. You can dock the toolbar so
that it displays horizontally below the menu bar, or let it
float free as shown here:
As you can see, the Forms Toolbar on the Excel spreadsheet is
similar in appearance to VBA’s Control Toolbox. Some of the
control icons are identical, but these icons are meant to be associated
with macros of recorded actions, or with preexisting code modules
such as the
3. Double-click the Button icon and click in or near cell A4, the
ShowForm module you just created.
spot in the spreadsheet where you want to insert it.
The Assign Macro dialog box appears.
4. Select the ShowForm module as the macro name and click
OK.
70 Oscilloscope Analysis and Connectivity Made Easy
Page 85

Running the Program with the Jitter Example
5. Right-click the button, select Edit Text, and change the
button caption from
6. Select File > Save to save the GetWaveform.xls spreadsheet,
Button1 to Show Form.
along with the VBA program you just created.
7. Click away from the button if necessary to exit Design
mode, and then click the
Show Form button to run the
program.
The GetWaveform dialog box appears.
Note: Even if you do not have a waveform source connected to
Channel 1 of your oscilloscope, you will still be able to pick up
enough noise to generate some data to see if your program
works.
8. Modify your oscilloscope settings to prepare for a waveform
transfer. Be sure to set the record length as part of this step.
9. Click the Get Waveform button.
You will see results similar to Figure 9 on page 46. If an error
occurs, switch to VBA and choose
Visual Basic User Interface Help > Toolbars > Debug Toolbar
Help > Contents and Index >
quick summary of the debugging features of VBA.
Running the Program with the Jitter Example
You have used the Get Waveform program to insert a waveform into an
empty spreadsheet. Now you will use it to insert a waveform into a
spreadsheet already filled with data and formulas.
You will use the
Oscilloscope Connectivity Made Easy book.
Note: If you have the Oscilloscope Connectivity Made Easy book,
refer to it for instructions on setting up the Waveform Generator and
connecting a cable from your oscilloscope sound port to Channel 1.
These instructions also appear in Appendix D on page 321. If you do
not want to use the Waveform Generator, you will still be able to
pick up enough random noise on Channel 1 to generate some data,
enough to verify that your program is making connections.
jitter1.xls spreadsheet, the Excel Jitter example from the
for a
1. In the GetWaveform.xls spreadsheet, press Alt+F11 to switch
from the Excel spreadsheet to VBA.
2. Select frmGetWaveform in the Project Explorer window.
Oscilloscope Analysis and Connectivity Made Easy
71
Page 86

Running the Program with the Jitter Example
3. Select File > Export File… and click Save to save the
frmGetWaveForm UserForm and VBA code.
Excel writes two files to disk, one with a
.frx extension.
a
4. Select Module1 in the Project Explorer window.
5. Select File > Export File… and click Save to save the
.frm extension and one with
ShowForm VBA code.
Excel writes a file to disk with a
6. Close the GetWaveform.xls spreadsheet and open the
.bas extension.
jitter1.xls spreadsheet in Excel.
7. To disable automatic calculation, select Tools > Options and
click
Manual on the Calculation tab.
This will keep you from having to wait while Excel recalculates the
entire spreadsheet numerous times while you are working.
8. Press Alt+F11 to switch from the Excel spreadsheet to VBA.
9. Select File > Import File… , select frmGetWaveForm.frm
and click
and VBA code into the
Open to insert the frmGetWaveForm UserForm
jitterfast.xls spreadsheet.
10. Select File > Import File… , select Module1.bas and click
Open to insert the Module1 VBA code (the ShowForm code)
into the
11. Double-click the frmGetWaveform icon in the Project
jitterfast.xls spreadsheet.
Explorer window and change these lines in the Code
window:
ActiveSheet.Range("C1").Value = "Time"
ActiveSheet.Range("C1").Font.Bold = True
ActiveSheet.Range("D1").Value = "Value"
ActiveSheet.Range("D1").Font.Bold = True
tracker = 2
ActiveSheet.Cells(tracker, 3).Value = t
ActiveSheet.Cells(tracker, 4).Value = arrWF(i)
' set reference to range for the clear button
Set rngHold = ActiveSheet.Range("C1", Cells(tracker, 4))
to these lines, so that the waveform data will be inserted in columns
H and I, starting at row 6:
ActiveSheet.Range("H1").Value = "Time"
ActiveSheet.Range("H1").Font.Bold = True
ActiveSheet.Range("I1").Value = "Value"
ActiveSheet.Range("I1").Font.Bold = True
72 Oscilloscope Analysis and Connectivity Made Easy
Page 87

Running the Program with the Jitter Example
tracker = 6
ActiveSheet.Cells(tracker, 8).Value = t
ActiveSheet.Cells(tracker, 9).Value = arrWF(i)
' set reference to range for the clear button
Set rngHold = ActiveSheet.Range("H1", Cells(tracker, 9))
12. Press Alt+F11 to switch from VBA to the Excel spreadsheet.
13. Insert a Show Form button into the Jitterfast.xls spreadsheet
and assign the button to the
earlier for the
GetWaveform.xls spreadsheet.
ShowForm code as you did
Note: Instead of adding a form button, you may want to add a
custom menu item. Such menu items are typically added by
coding the Workbook object’s Open and BeforeClose events:
Private Sub Workbook_BeforeClose(Cancel As Boolean)
Dim sMenuName As String
smenuName = "&JitterExample"
' Delete the menu before closing
On Error Resume Next
MenuBars(xlWorksheet).Menus(sMenuName).Delete
End Sub
Private Sub Workbook_Open()
' Creates a new menu and adds menu items
Dim sMenuName As String
Dim sCaption As String
Dim SMacro As String
sMenuName = "&JitterExample"
sCaption = "Show Jitter Form"
sMacro = "LaunchForm"
On Error Resume Next
' Delete the menu if it already exists
MenuBars(xlWorksheet).Menus(sMenuName).Delete
' Add the menu
MenuBars(xlWorksheet).Menus(sMenuName).MenuItems
.Add Caption:=sCaption, OnAction:=sMacro
End with
End Sub
14. Save the spreadsheet, then click the Show Form button to
display the Get Waveform dialog box.
15. Click the Get Waveform button.
16. Press F9 to manually recalculate the spreadsheet.
The program inserts new waveform data into the form fields and new
waveform time and data point values into columns H and I of the
spreadsheet, starting at row 6.
Oscilloscope Analysis and Connectivity Made Easy
73
Page 88
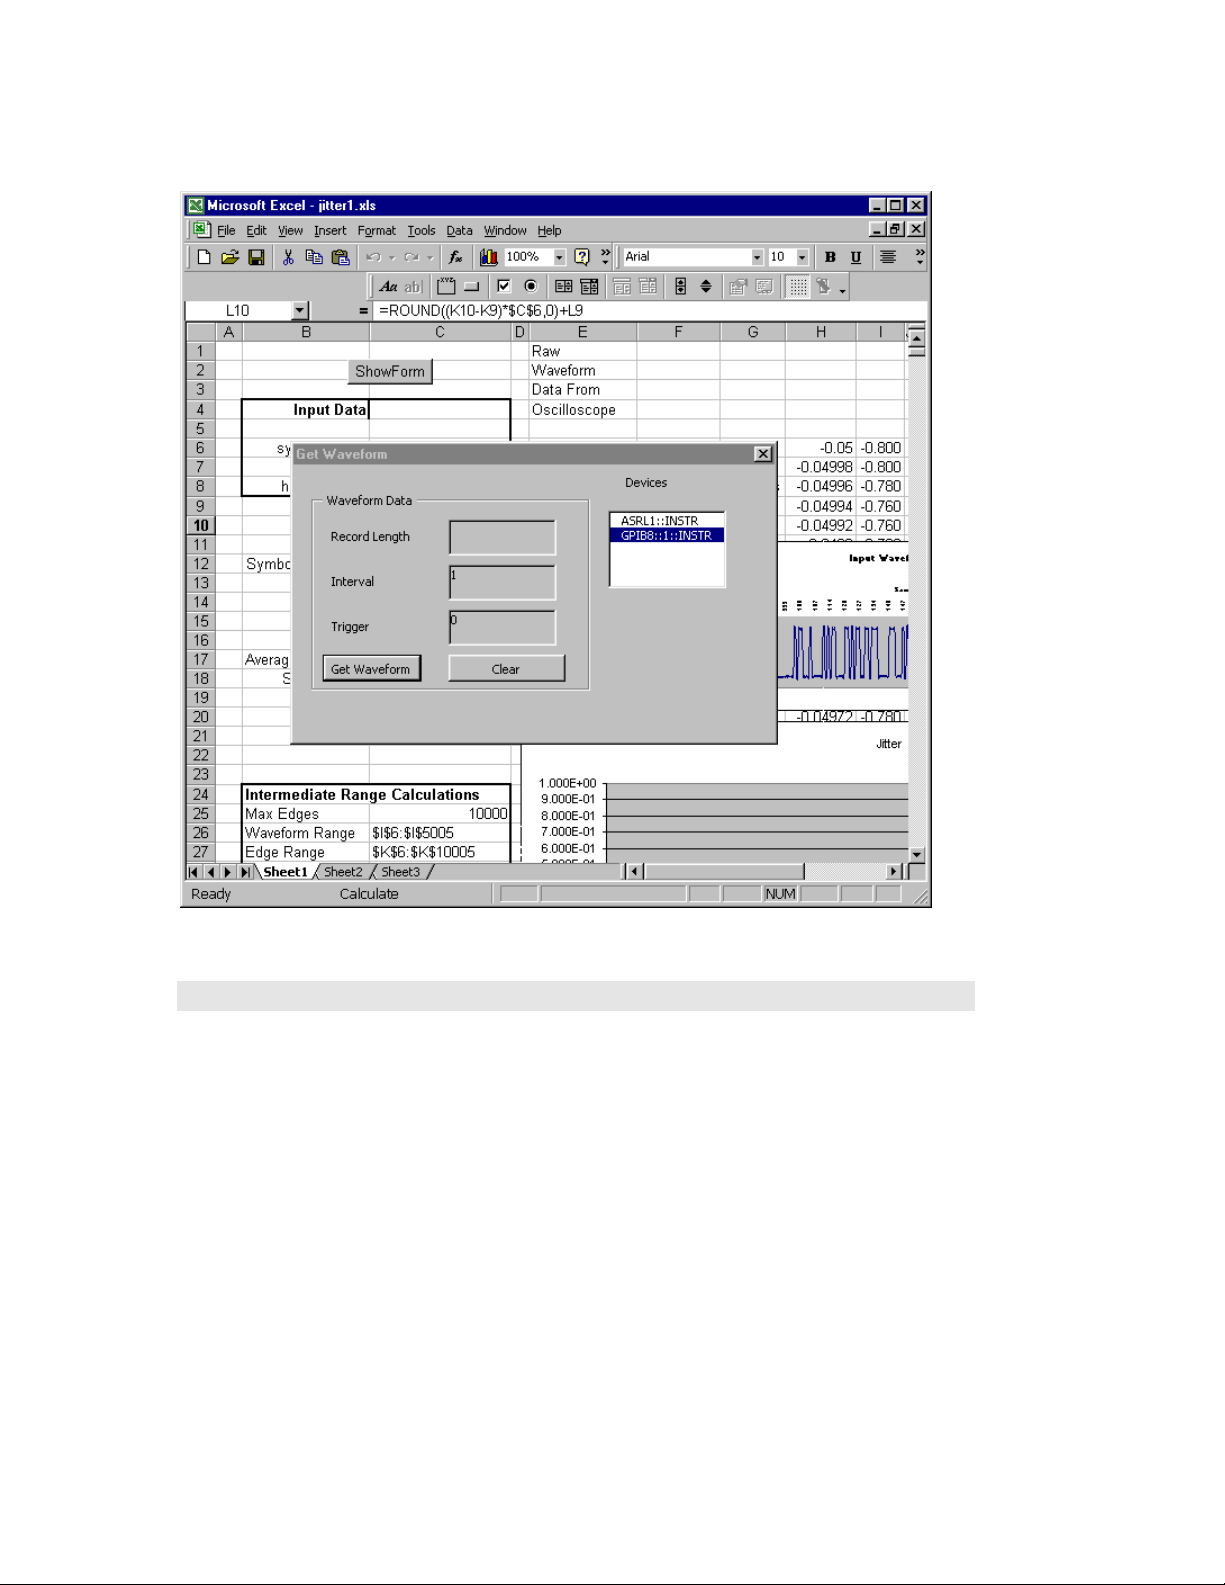
Using VB Instead of VBA
A screen similar to the one shown in Figure 17 displays.
Figure 17: The Clock Jitter example with the Get Waveform program added
Using VB Instead of VBA
If you want to work this exercise using Visual Basic 6.0, you will need to
create the form using that tool instead of Excel VBA. Refer to Chapter 7 for
an example of how to use Visual Basic 6.0 controls to design a form.
Figure 18 shows a VB 6.0 version of the
in this chapter. This program was saved under the project name
p_Ch4VB.vbp on the CD that accompanies this book. Notice that a list box
has been used to display the waveform data points in this example, since
there is no spreadsheet.
Get Waveform example discussed
74 Oscilloscope Analysis and Connectivity Made Easy
Page 89

Using VB Instead of VBA
Figure 18: Visual Basic 6.0 version of Get Waveform program
You will also have to make some changes to the code. Where you used the
UserForm class with the Activate event, substitute the VB Form class
VBA
with the
subroutine, you will create a
Load event. Therefore, instead of creating a UserForm_Activate()
Form_Load() subroutine in VB 6.0 as shown
here:
Private Sub Form_Load()
Instead of using a spreadsheet to store the waveform data points, you will use
a list box named
lstWF in the form itself. The GetWaveform routine is shown
here:
Private Sub cmdGetWaveForm_Click()
' declare variables
Dim arrWF As Variant 'array variable which will hold waveform values
Dim xinc As Double ' variable which will hold the x axis increment
Dim trigpos As Long ' variable which hold the timing trigger
Dim i As Long ' counter variable
Dim hUnits As String, vUnits As String ' variables for returning
On Error GoTo cmdGetWFMErr
'CH1 is the OCX built-in constant specifying Channel 1
Call Tvc1.GetWaveform(CH1, arrWF, xinc, trigpos, vUnits, hUnits)
If IsArray(arrWF) Then ' check to be sure returned value is an
lblRecLength.Caption = UBound(arrWF) - LBound(arrWF) + 1
Else
Exit Sub
End If
lblInterval.Caption = xinc
lblTrigPos.Caption = trigpos
If chkDisplayWF.Value = 1 Then ' if user wants values displayed,
For i = LBound(arrWF) To UBound(arrWF)
lstWF.AddItem arrWF(i)
Next
End If
' position
' unit types
' array
' loop through the array
Oscilloscope Analysis and Connectivity Made Easy
75
Page 90

Chapter 4 Review
You cannot load VB 6.0 forms into Excel VBA (or load VBA user forms into
VB 6.0). If you try to load a VB 6.0 form into Excel VBA, you will get this
message:
The form class contained in the specified file is not supported in Visual
Basic for Applications; the file can't be loaded.
However, you can cut and paste portions of the code between the two
programs, and then edit it to correct for differences in syntax.
Unlike VBA, which is interpreted code that only runs inside Microsoft Office
applications, Visual Basic 6.0 code can be compiled into a stand-alone
executable.
Chapter 4 Review
Now to review what you learned in Chapter 4:
• You can use
Visual Basic for Applications (VBA), which is
included in Excel, to design your own forms and build your
own functions.
• You can add the
TekVISA Control to VBA, and then drag it
onto your form just like any other ActiveX control.
• The Excel
Object Browser can help you understand the hierarchy of
the
objects in the
Help facility contains many useful examples, and
Excel object model. The Excel help system
and the Object Browser are closely interwoven.
• The Excel
Intellisense feature prompts you with valid
arguments and other choices when you type code in the
Code window
• You can use the
Get Waveform program described in this
chapter to insert waveform data into an empty spreadsheet,
or into a spreadsheet that already contains data and formulas.
76 Oscilloscope Analysis and Connectivity Made Easy
Page 91

Introduction
Chapter 5. A More Complex Four-Part Program
Using VBA to get current resource, waveform,
measurement, and other query results
Introduction
You have looked at how to use the TekVISA ActiveX Control to build a
simple dialog box to get waveforms. Now you can go a step further and
become more familiar with the TekVISA ActiveX control.
This chapter uses Excel VBA to build a more complicated multifunction
dialog box than the previous chapter. As in Chapter 4, this four-part program
allows you to get the currently active resource device and obtain waveform
data. In addition, the program lets you send GPIB commands to capture
oscilloscope measurements, or send other kinds of GPIB commands and
queries and get back results.
The program you build in this chapter introduces more core properties and
methods of the TekVISA ActiveX Control. In addition, you may find some
practical applications for using this program, especially since you can
customize it yourself.
What You Need to Get Started
You can work this example either on a separate PC or on your Windowsbased oscilloscope, using either Excel’s built-in VBA or Visual Basic 6.0. To
get started, you will need the following:
• A Windows-based Tektronix oscilloscope (an external
monitor is recommended if you are working the example on
your oscilloscope)
• Excel 2000 or XP (or Visual Basic 6.0) installed on your
oscilloscope or on an external PC
• The TekVISA connectivity software described in Chapter 1
(see page 323 for the location of the completed example)
Oscilloscope Analysis and Connectivity Made Easy 77
Page 92

Introduction
What You Will Do
In this chapter, you will build a sample VBA program that
• issues native GPIB commands to capture immediate
measurement data
• issues other native GPIB commands and queries to control
the instrument
• captures raw waveform data
• finds resource devices recognized by TekVISA
Figure 19 shows the design-time interface that you will create. As you can
see, the user interface is divided into parts to accomplish these tasks. The
VBA form consists of three frames and one unframed list box. This user
form allows you to interact with your oscilloscope in the following ways:
• the top left frame sends
measurement commands and gets
results
• the lower left frame sends
queries and gets results, if any
• the top right frame gets
native GPIB commands and
waveform data at the current
settings, along with the record length, sample interval, and
trigger position
• the lower right list box shows
currently available devices
(GPIB and serial resources on your instrument) that are
recognized by the TekVISA ActiveX Control
78 Oscilloscope Analysis and Connectivity Made Easy
Page 93

Introduction
Figure 19: The form you will design for the Test Run example
Figure 20 shows the same UserForm at runtime after fields have been
populated with results in all four quadrants of the form.
Oscilloscope Analysis and Connectivity Made Easy
79
Page 94

Introduction
Figure 20: The Test Run form at runtime
What You Will Learn
The purpose of this chapter is to illustrate more operations of the TekVISA
ActiveX Control and familiarize you with more features of the OCX
interface. In this chapter, you will:
• build a form with more expanded functionality than the
previous exampleincluding multiple frames, a text box,
and multiple check boxes, list boxes, command buttons, and
labels
• use TekVISA ActiveX Control operations to send native
GPIB measurement queries and other kinds of GPIB
commands and queries to your oscilloscope and get back
results
• review the TekVISA method used to get waveform data
• review the TekVISA properties used to find resource devices
• add a button to run this VBA program from your Excel
spreadsheet
• find out the changes you will need to make if you want the
program to run in Visual Basic 6.0 instead of Excel VBA
80 Oscilloscope Analysis and Connectivity Made Easy
Page 95

The TekVISA Test Run Example in Excel VBA
The TekVISA Test Run Example in Excel VBA
Building the Form
This chapter focuses primarily on the VBA code and assumes you are
already familiar with VBA visual editing tools for constructing dialog
interfaces. For step-by-step instructions on designing a form for the VBA
design environment, refer to page 48.
To begin building the UserForm:
1. Open Excel and save the spreadsheet under the name
TestRun.xls.
2. Press ALT+F11 to access the Visual Basic for Applications
design environment from within Excel.
3. Insert a UserForm by clicking the Insert UserForm icon on
the VBA Standard Toolbar.
4. Rename the UserForm TekVISA Test Run.
5. If necessary, follow the instructions on page 51 to add the
TekVISA ActiveX Control to the Controls Toolbox.
6. Drag the TekVISA Control icon onto the lower right
quadrant of the Userform where it appears as an icon at
design time but is invisible at runtime.
7. Using your chosen method, insert three frames into the
Userform from left to right. VBA automatically names them
Frame1, Frame2, and Frame3.
8. Drag a label and a list box into the lower right-hand corner
of the Userform. VBA automatically names them
ListBox1.
9. Similarly, drag the rest of the needed controls onto the form,
Label1 and
making sure that each control is placed as shown in Figure
21.
Note: It is not necessary to drag the controls onto the form in the
exact order shown; however, doing so will help you verify that
you have changed all the properties correctly.
Changing Properties in the Properties Window
Table 8, Table 9, Table 11, and Table 12 (which appear later in this chapter)
summarize all the changes to make in the Properties window to convert the
UserForm from its appearance in Figure 21 to its final appearance.
Oscilloscope Analysis and Connectivity Made Easy
81
Page 96
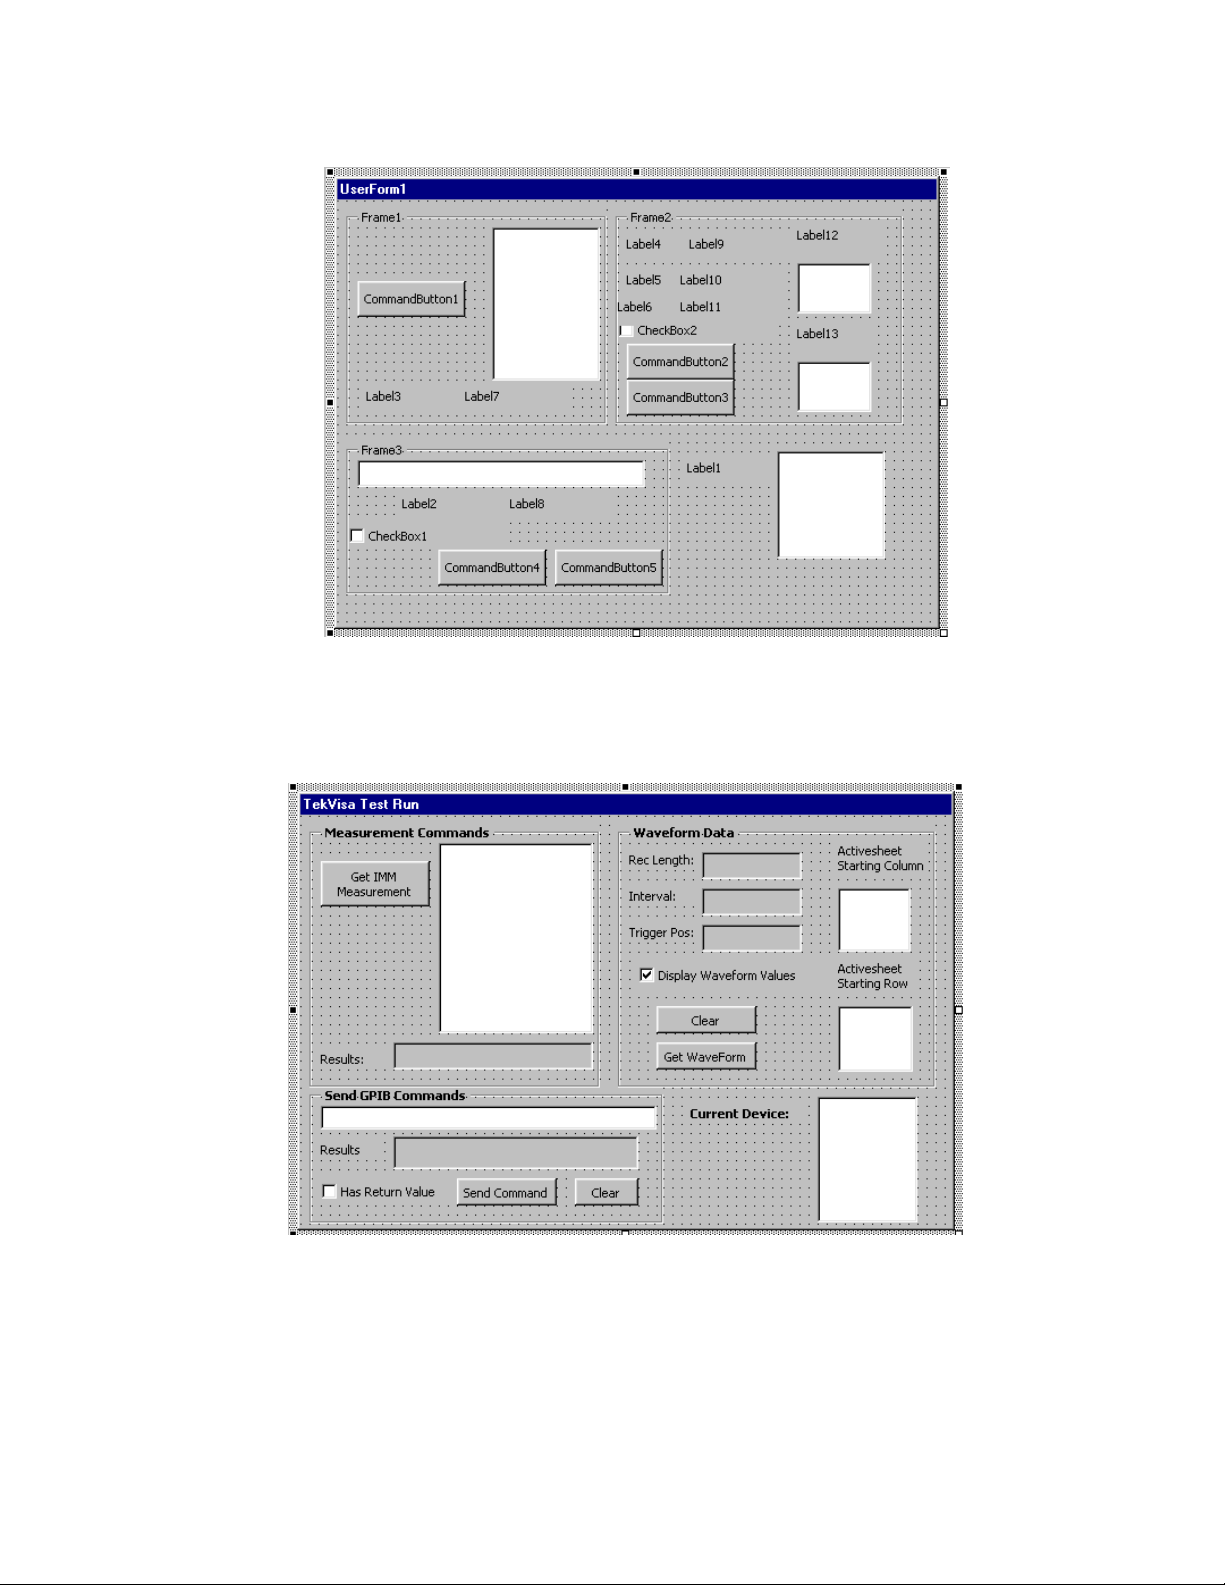
The TekVISA Test Run Example in Excel VBA
Figure 21: TekVISA Test Run form before changing default captions and
appearance of controls
After changing the name, captions, and other properties itemized in those
tables and resizing controls, the form will look like Figure 22.
Figure 22: The redesigned form for TekVISA Test Run
82 Oscilloscope Analysis and Connectivity Made Easy
Page 97

The TekVISA Test Run Example in Excel VBA
The Current Devices List Box
The Current Devices List Box Design
Table 8 summarizes the changes to make to the UserForm in areas not
enclosed by frames.
Table 8: Property changes to make outside of frames in TekVISA Test Run
Control Property Change from Change to
UserForm1 Caption UserForm1 TekVISA Test Run
Label1 Caption Label1 Current Device:
Listbox1 (Name) Listbox1 lstDevices
Figure 23 shows the portion of the form detailed in Table 8.
Figure 23: The Current Devices list box
The UserForm Initialize Routine
This code executes immediately before the UserForm is first displayed. It
uses TekVISA calls to find all the available device resources automatically,
and is identical to the code explained in Chapter 4 beginning on page 61.
Refer back to that explanation for a line-by-line discussion. The ActiveX
Control properties used in this subroutine are
Descriptor.
1. Press F7 to switch to the Code window.
2. Type the following statement so VBA will ensure that
SearchCriterion, FindList, and
variables are defined before you use them:
Option Explicit
3. Add the following code, or copy and paste it from the Get
Waveform
Private Sub UserForm_Initialize()
Dim dev As Variant ' array that holds devices detected by
Dim i As Integer
program:
' the OCX control
lstRow.ListIndex = 0
Tvc1.SearchCriterion = 0 'search all devices
' get detected VISA devices
dev = Tvc1.FindList
' populate devices listbox
If IsArray(dev) Then
For i = LBound(dev) To UBound(dev)
Oscilloscope Analysis and Connectivity Made Easy
83
Page 98

The TekVISA Test Run Example in Excel VBA
lstDevices.AddItem dev(i)
Next
End If
Fori=0TolstDevices.ListCount - 1
If Left(lstDevices.List(i), 5) = "GPIB8" Then
' default to virtual GPIB device
lstDevices.ListIndex = i
Tvc1.Descriptor = lstDevices.Text
Exit For
End If
Next
End Sub
The Measurement Commands Frame
The Measurement Commands Frame Design
Table 9 shows the property changes to make in the Measurement Commands
frame.
Table 9: Property changes to make in the Measurement Commands frame
Control Property Change from Change to
Measurement Commands frame (top left)
Frame1 Caption Frame1 Measurement Commands
Label3 Caption Label3 Result
Label7
(Name) Label7 lblDisplay
Caption Label7 (no Caption)
BackColor Button Face Button Light Shadow
Special Effect Flat Sunken
(Name) CommandButton1 cmdMeasure CommandButton1
Caption CommandButton1 Get IMM Measurement
Listbox2 (Name) Listbox2 lstMeasurement
Figure 24 shows the portion of the form detailed in Table 9.
84 Oscilloscope Analysis and Connectivity Made Easy
Page 99
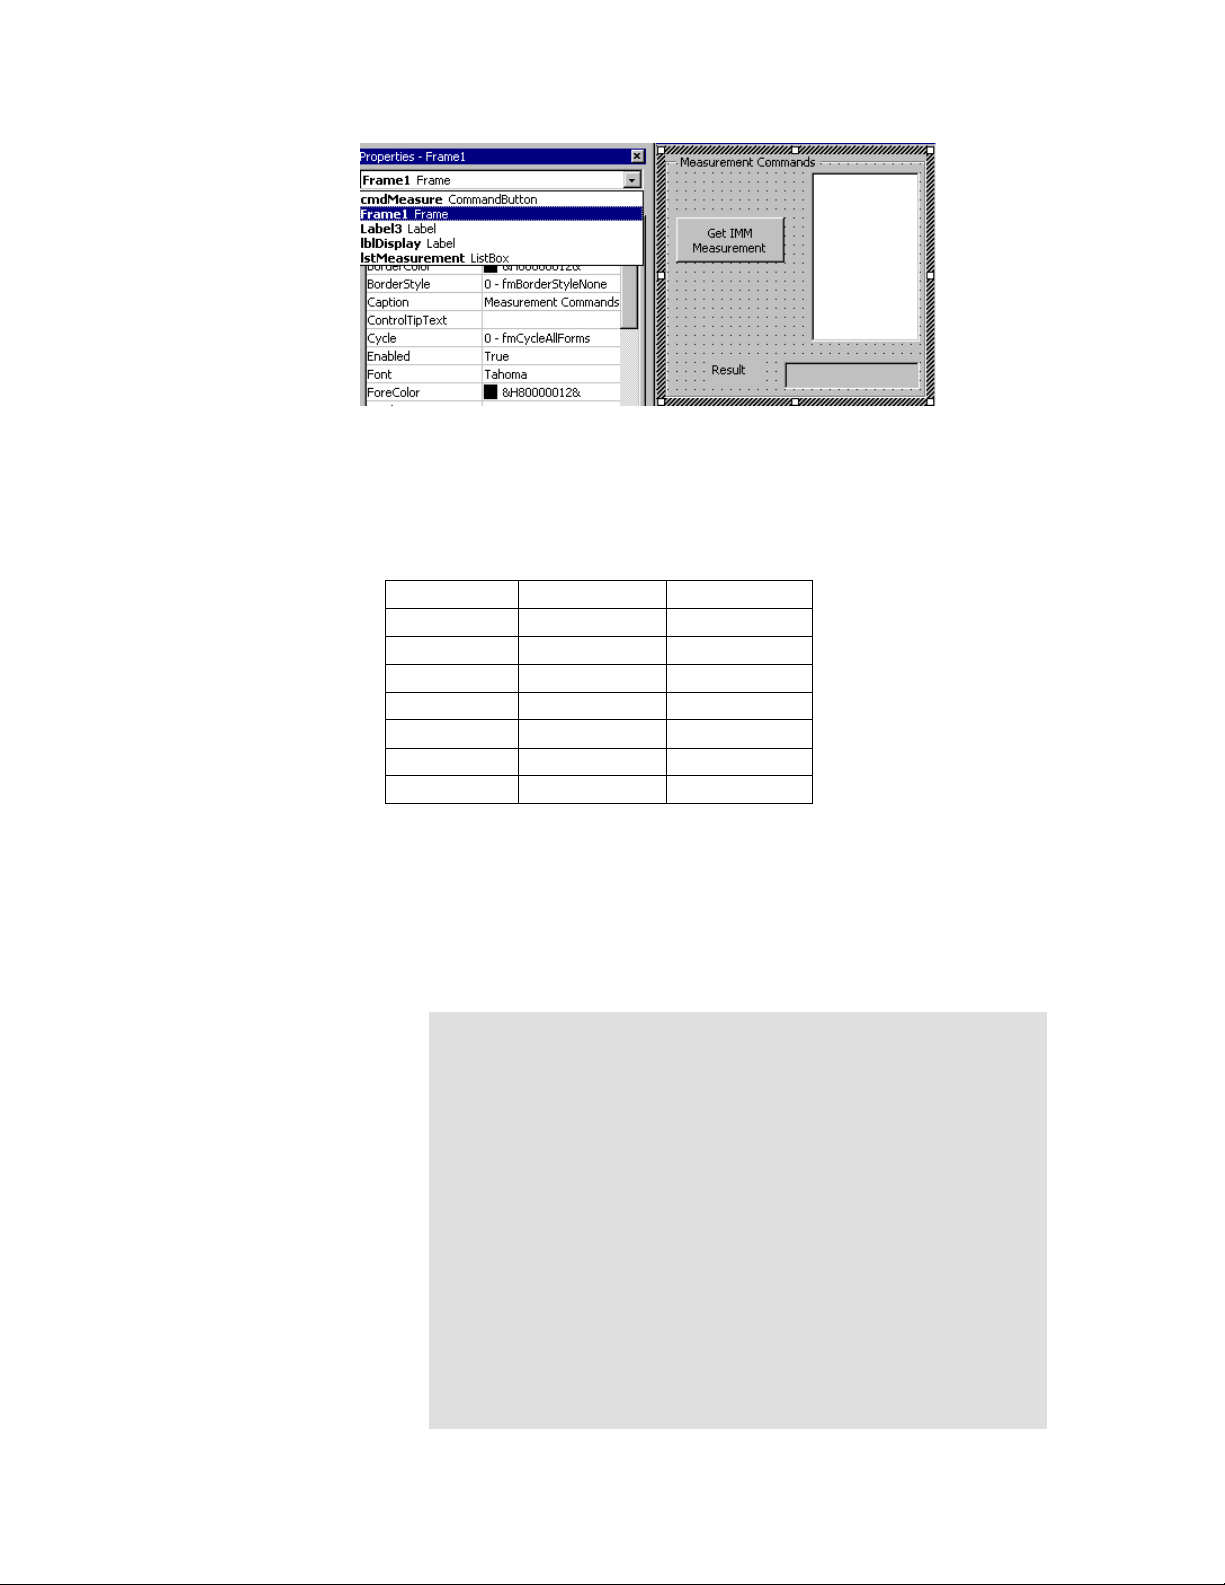
The TekVISA Test Run Example in Excel VBA
Figure 24: The Measurement Commands frame
This frame groups the controls that allow the user to obtain any of the
immediate measurements summarized in Table 10.
Table 10: Measurements available in the Measurement Commands frame
AMPLITUDE HIGH PERIOD
AREA LOW PHASE
BURST MAXIMUM PK2PK
CAREA MINIMUM POVERSHOOT
CRMS NDUTY PWIDTH
DELAY NOVERSHOOT RISE
FALL NWIDTH RMS
FREQUENCY PDUTY PERIOD
Additions to the UserForm Initialize Routine
Next you will add the code that initializes the list box containing the
Measurement commands to choose from.
1. Add the following code to the UserForm_Initialize
subroutine, just after the subroutine declaration:
' add GPIB immediate measurement commands to the list box
With lstMeasurement
.AddItem "AMPLITUDE"
.AddItem "AREA"
.AddItem "BURST"
.AddItem "CAREA"
.AddItem "CRMS"
.AddItem "DELAY"
.AddItem "FALL"
.AddItem "FREQUENCY"
.AddItem "HIGH"
.AddItem "LOW"
.AddItem "MAXIMUM"
.AddItem "MINIMUM"
.AddItem "NDUTY"
.AddItem "NOVERSHOOT"
.AddItem "NWIDTH"
.AddItem "PDUTY"
.AddItem "PERIOD"
.AddItem "PHASE"
.AddItem "PK2PK"
.AddItem "POVERSHOOT"
.AddItem "PWIDTH"
Oscilloscope Analysis and Connectivity Made Easy
85
Page 100

The TekVISA Test Run Example in Excel VBA
.AddItem "RISE"
.AddItem "RMS"
.ListIndex = 0
End With
When the UserForm is initialized before it first displays, this code:
a. Uses the Excel AddItem method to populate the
lstMeasurement list box with literal items to choose
from.
Note: In this case, the items correspond to measurement
commands that are valid with Tektronix TDS7000 Series
oscilloscopes. Your Windows-based oscilloscope may use a
slightly different command set.
b. Uses the Excel ListIndex property to set the first row in
the list as the currently selected item in the
list box, so
that it appears preselected on the form.
The Get Immediate Measurement Button Routine
Next you will tackle the logic invoked when a user selects a measurement
type from the list box, and then clicks the
Get IMM Measurement button in
the Measurement Commands frame.
1. Press Shift+F7 to switch to the UserForm, and double-click
Get IMM Measurement button.
the
VBA inserts the following code block:
Private Sub cmdMeasure_Click()
End Sub
2. Type the following code inside the cmdMeasure_Click
subroutine code block.
Dim strID As String
Dim s1 As String
s1 = lstMeasurement.List(lstMeasurement.ListIndex)
lblDisplay.Caption = "" ' clear the label which will
' display the result
' construct the GPIB command
strID = "MEASUREMENT:IMMED:TYPE"&s1&";VAL?;:HEADER OFF"
' send the command
Tvc1.WriteString strID
' read the result and display it
lblDisplay.Caption = Tvc1.ReadString
86 Oscilloscope Analysis and Connectivity Made Easy
 Loading...