

Page 1

User Manual
NetTekt Analyzer
OTDR Modules
071-1213-02
This document supports software version 3.00
and above.
www.tektronix.com
Page 2

Copyright © Tektronix, Inc. All rights reserved.
Tektronix products are covered by U.S. and foreign patents, issued and
pending. Information in this publication supercedes that in all previously
published material. Specifications and price change privileges reserved.
Tektronix, Inc., P.O. Box 500, Beaverton, OR 97077
TEKTRONIX, TEK, NETTEK, TARGET1, and INTELLITRACE PLUS are
registered trademarks of Tektronix, Inc.
Page 3

WARRANTY
Tektronix warrants that the products that it manufactures and sells will be free from defects
in materials and workmanship for a period of one (1) year from the date of purchase from
an authorized T ektronix distributor. If any such product proves defective during this
warranty period, Tektronix, at its option, either will repair the defective product without
charge for parts and labor, or will provide a replacement in exchange for the defective
product. Batteries are excluded from this warranty.
In order to obtain service under this warranty, Customer must notify Tektronix of the
defect before the expiration of the warranty period and make suitable arrangements for the
performance of service. Customer shall be responsible for packaging and shipping the
defective product to the service center designated by Tektronix, shipping charges prepaid,
and with a copy of customer proof of purchase. Tektronix shall pay for the return of the
product to Customer if the shipment is to a location within the country in which the
Tektronix service center is located. Customer shall be responsible for paying all shipping
charges, duties, taxes, and any other charges for products returned to any other locations.
This warranty shall not apply to any defect, failure or damage caused by improper use or
improper or inadequate maintenance and care. Tektronix shall not be obligated to furnish
service under this warranty a) to repair damage resulting from attempts by personnel other
than T ektronix representatives to install, repair or service the product; b) to repair damage
resulting from improper use or connection to incompatible equipment; c) to repair any
damage or malfunction caused by the use of non-Tektronix supplies; or d) to service a
product that has been modified or integrated with other products when the effect of such
modification or integration increases the time or difficulty of servicing the product.
THIS WARRANTY IS GIVEN BY TEKTRONIX WITH RESPECT TO THE
LISTED PRODUCTS IN LIEU OF ANY OTHER WARRANTIES, EXPRESS OR
IMPLIED. TEKTRONIX AND ITS VENDORS DISCLAIM ANY IMPLIED
WARRANTIES OF MERCHANTABILITY OR FITNESS FOR A PARTICULAR
PURPOSE. TEKTRONIX’ RESPONSIBILITY TO REPAIR OR REPLACE
DEFECTIVE PRODUCTS IS THE SOLE AND EXCLUSIVE REMEDY
PROVIDED TO THE CUSTOMER FOR BREACH OF THIS WARRANTY.
TEKTRONIX AND ITS VENDORS WILL NOT BE LIABLE FOR ANY
INDIRECT, SPECIAL, INCIDENTAL, OR CONSEQUENTIAL DAMAGES
IRRESPECTIVE OF WHETHER TEKTRONIX OR THE VENDOR HAS
ADVANCE NOTICE OF THE POSSIBILITY OF SUCH DAMAGES.
Page 4

Page 5

Table of Contents
General Safety Summary ix............................
Preface xi............................................
Software Version xi....................................
Related Products xii....................................
Conventions xii........................................
About this Manual xii...................................
Related Documentation xiii...............................
Contacting Tektronix xiv................................
Getting Started
Product Description 1--1..................................
Installing an Instrument Module 1--2........................
Removing an Instrument Module 1--6.......................
Using the Laser Optical Port and Connector Adapter 1--7........
Install the Appropriate Connector Adapter 1--9.............
Remove a Connector Adapter 1--10.......................
Operating Basics
Using the Online Help 2--1................................
Elements of the Main Screen 2--3...........................
Main Screen Buttons 2--3..............................
Viewing the Trace and Table 2 --5...........................
Changing the Proportions of the Trace and Table Regions 2--5.
Setting Trace Display Options 2--6.......................
Zooming 2--7........................................
Cursors 2--11.........................................
Event Table Columns 2--12..............................
Tutorial 2--15...........................................
Take a Basic Measurement 2--15............................
Analyze the Results 2--16..................................
NetTek Analyzer OTDR Modules User Manual
i
Page 6

Table of Contents
Examine the Trace Data 2--16............................
Find the Length of the Fiber 2--18........................
Examine the Two-Point Loss 2--18........................
Examine an Event 2--19................................
Examine the Event Table Data 2--19......................
Configuring the Settings and Saving and Opening Files 2--21...
Configuring Settings 2--21.................................
Settings that Affect How Data is Collected 2--24.............
Settings that Affect How Data is Displayed 2--26............
Copying Settings to Other Tabs 2--28......................
Saving Tests and Settings 2--29.............................
SaveaTest 2--29......................................
Save Settings Only 2--31................................
Opening Trace or Setting and Limit Files 2--33.................
Opening a Trace File 2--33..............................
Opening a Settings Only File 2--34........................
Determine Which Settings Were Used for a Trace 2--36..........
Examine the Test1.SOR, Test2.SOR, and Test--MM.SOR
Files 2--37...........................................
Reference
Taking Measurements 3-- 1...............................
Performing Event Loss Measurements 3--2...................
Event Loss Advanced Controls 3--3......................
Performing Two Point Measurements 3--4....................
Two Point Loss Advanced Controls 3--5..................
Performing Reflectance Measurements 3-- 6...................
Reflectance Advanced Controls 3--6.....................
Performing ORL Measurements 3--7........................
Compare Two Traces 3--8.................................
Bidirectional Average Measurements 3--8.................
Difference Measurements 3--8..........................
Dual Trace Mode 3--8.................................
Performing Bidirectional Averages Measurement 3--9..........
Performing Difference Measurements 3--11....................
Auto Test and Save Dialog Box 3--12........................
Auto Sequence Wavelength Choices Dialog Box 3--13........
ii
NetTek Analyzer OTDR Modules User Manual
Page 7

Table of Contents
Other Features 3--15.....................................
Increasing the Range 3--16.................................
Finding the End When Grouped Events are Marked as “End” 3--17.
Getting the Best Resolution on Multimode Tests 3--18...........
Printing 3--19............................................
Using with a Keyboard 3--20...............................
Joining Cursors 3--21.....................................
Setting the Front Panel Loss Warning 3--21....................
Setting the Distance Units 3--21.............................
Setting Factory Defaults 3--21..............................
About File Types 3--22....................................
SOR Format 3--22.....................................
CFF Format 3--22.....................................
SET Format 3--22.....................................
WFM Format 3--22....................................
Making Notes on Events, Landmarks, and Fibers 3--23..........
Event / Landmark Notes Dialog Box 3--23.................
Fiber Notes Dialog Box 3--25............................
Adding, Moving, and Deleting, Events or Landmarks 3--26.......
Adding Events 3--26...................................
Moving Events 3--27...................................
Adding Landmarks 3--28................................
Moving Landmarks 3--29...............................
Deleting Events 3--29..................................
Deleting Landmarks 3--30...............................
Deleting All Landmarks 3--30............................
Freezing Events 3--30..................................
Appendices
Appendix A: Specifications A--1...........................
Appendix B: User-replaceable Parts, Options, and
Accessories B--1.....................................
Appendix C: Maintenance C--1...........................
Cleaning C--1...........................................
Cleaning the Optical Port C--2...........................
Cleaning the Connector Adapter C--2.....................
Cleaning the Test Fiber Connector C--3...................
Cleaning the Exterior of the Module C--3..................
Transporting the OTDR C--4...............................
NetTek Analyzer OTDR Modules User Manual
iii
Page 8

Table of Contents
Repackaging for Shipment C--5............................
Appendix D: Installing an OTDR Software Upgrade D--1.....
Glossary
Index
iv
NetTek Analyzer OTDR Modules User Manual
Page 9

Figures
Figure 1--1: Removing the bus door 1--3....................
Figure 1--2: Install instrument module 1--4.................
Figure 1--3: Laser optical connector 1--8...................
Figure 1--4: Connector adapter installation 1--9.............
Figure 2--1: Main screen 2--3.............................
Figure 2--2: Zoomed out trace 2--7........................
Figure 2--3: Zoomed in trace, with overview window
Figure 2--4: Event Table Only view 2--12....................
Figure 2--5: A Run tab of the Test Settings and Limits
Figure 2--6: A Trace tab (labeled with the file name) of the
Figure 2-- 7: Sample file Test1.SOR illustrates that different
Figure 2--8: Compare the amounts of loss and reflectance in
Figure 2--9: Event 2 is an FC regular connector 2--40..........
Figure 2-- 10: Event 3 is a fusion splice 2 --41..................
Figure 2--11: Event 4 is a mechanical splice 2--42.............
Figure 2--12: Event 5 is a bend 2--43........................
Figure 2-- 13: Event 6 is a fusion splice 2 --44..................
Figure 2--14: Event 7 is the end of the fiber 2--45.............
Figure 2--15: Sample file test2.SOR shows a worn
Figure 2--16: Sample file Test--MM.SOR shows several types
Table of Contents
showing whole trace 2--8..............................
dialog box 2--22......................................
Test Settings and Limits dialog box 2--23.................
types of events can look similar 2--38....................
each of the events in the sample file Test1.SOR 2--39.......
angle-polished connector (Event 5) and several fusion
splices 2--46..........................................
of events on a multimode fiber 2--47.....................
NetTek Analyzer OTDR Modules User Manual
v
Page 10

Table of Contents
Figure 2--17: Look at the event notes in the event table of
sample file Test--MM.SOR 2--48........................
Figure 2--18: Event 1 (the front panel) and Event 2 (a
jumper cable) are grouped due to the short distance
between them 2-- 49...................................
Figure 2--19: Events 3 and 4 are echoes of 1 and 2 and are
groupedwitheachother 2--50..........................
Figure 2--20: Event 5 (high loss) and Event 6 (low loss) are
both patch panel connectors 2--51.......................
Figure 2--21: Event 7 is a good (low loss) fusion splice 2--52.....
Figure 2--22: Event 8 (the start of a pigtail), Event 9 (a patch
panel connector), and Event 10 (the end of the fiber) 2--53..
Figure 3--1: Event Loss for Event 2 3--2....................
Figure 3-- 2: Bidirectional Averages traces 3--9...............
vi
NetTek Analyzer OTDR Modules User Manual
Page 11

Tables
Table of Contents
Table i: NetTek Analyzer OTDR Modules xi..............
Table 2--1: Help window buttons 2--2......................
Table 2--2: Main screen buttons 2-- 4.......................
Table 2--3: Event Table column definitions 2--13.............
Table 2--4: Event Table symbols and highlights 2--14..........
Table 2--5: Choosing the Test Mode 2--25...................
Table 3--1: Sample event table with grouped end events 3--17...
Table A-- 1: NetT ek Analyzer OTDR Module
characteristics A-- 1..................................
Table A-- 2: General characteristics A--2....................
Table A--3: Transportation and storage A--4................
Table A--4: Environmental characteristics A--5..............
Table A--5: Physical characteristics A--7...................
Table A--6: Miscellaneous characteristics A--7...............
Table A--7: Certifications and compliances A--8.............
Table A--8: Safety compliance A--9........................
Table B--1: User-replaceable parts B--1....................
Table B--2: Connector options B--1........................
Table B--3: Optional accessories B--2......................
Table B--4: Standard accessories B--2......................
NetTek Analyzer OTDR Modules User Manual
vii
Page 12

Table of Contents
viii
NetTek Analyzer OTDR Modules User Manual
Page 13

General Safety Summary
Review the following safety precautions to avoid injury and prevent
damage to this product or any products connected to it. To avoid
potential hazards, use this product only as specified.
Only qualified personnel should perform service procedures.
While using this product, you may need to access other parts of the
system. Read the General Safety Summary in other system manuals
for warnings and cautions related to operating the system.
To Avoid Fire or Personal Injury
Observe All Terminal Ratings. To avoid fire or shock hazard, observe all
ratings and markings on the product. Consult the product manual for
further ratings information before making connections to the product.
The common terminal is at ground potential. Do not connect the
common terminal to elevated voltages.
Do Not Operate Without Covers. Do not operate this product with
covers or panels removed.
Avoid Exposed Circuitry. Do not touch exposed connections and
components when power is present.
Wear Eye Protection. Wear eye protection if exposure to high-intensity
rays or laser radiation exists.
Do Not Operate With Suspected Failures. If you suspect there is damage
to this product, have it inspected by qualified service personnel.
Do Not Operate in Wet/Damp Conditions.
Do Not Operate in an Explosive Atmosphere.
Keep Product Surfaces Clean and Dry.
Provide Proper Ventilation. Refer to the manual’s installation
instructions for details on installing the product so it has proper
ventilation.
NetTek Analyzer OTDR Modules User Manual
ix
Page 14

General Safety Summary
Safety Terms and Symbols
Terms in This Manual. These terms may appear in this manual:
WARNING. Warning statements identify conditions or practices that
could result in injury or loss of life.
CAUTION. Caution statements identify conditions or practices that
could result in damage to this product or other property.
Terms on the Product. These terms may appear on the product:
DANGER indicates an injury hazard immediately accessible as you
read the marking.
WARNING indicates an injury hazard not immediately accessible as
you read the marking.
CAUTION indicates a hazard to property including the product.
Symbols on the Product. These symbols may appear on the product:
CAUTION
Refer to Manual
Static Sensitive
x
Double
Insulated
NetTek Analyzer OTDR Modules User Manual
Protective Ground
(Earth) Terminal
Laser Aperture
Page 15

Preface
This manual contains operating instructions for several Tektronix
NetTek Analyzer OTDR modules. See Table i.
Table i: NetTek Analyzer OTDR Modules
Module Fiber type Range Wavelengths
YSS1310 Singlemode Standard
YSS1315 Singlemode Standard
YSL1315 Singlemode Long
YSL1625 Singlemode Long
YSL1516 Singlemode Long
YSU1315 Singlemode Ultra long
YSU1625 Singlemode Ultra long
YM8513 Multimode Short
Software Version
This manual supports firmware version 3.0 and above of the Net Tek
Analyzer OTDR.
To verify your software and firmware versions, do the following:
1. Open the OTDR application.
2. Select Help > About OTDR....
1310 nm
1310 nm / 1550 nm
1310 nm / 1550 nm
1625 nm
1550 nm / 1625 nm
1310 nm / 1550 nm
1625 nm
850 nm / 1300 nm
NetTek Analyzer OTDR Modules User Manual
xi
Page 16

Preface
Related Products
The Y350C NetTek Analyzer Platform supports the NetTek Series of
OTDR and base station instrument module test tools that you can add
or remove from the analyzer platform.
The NetTek analyzer platform accepts up to four modules at once,
plus a PCMCIA module. You can mix and match modules to suit
your needs. The platform is a full capability hand-held PC, running
Windows CE.
Conventions
This book uses the following convention to represent menus:
To open the help window and find information on a specific topic,
you would be instructed to select Start > Help. To accomplish this,
tap Start in the toolbar at the bottom of the desktop window; then
tap Help in the resulting WindowsCE menu.
Words in italics, such as event loss, indicate a glossary term.
About this Manual
Refer to this documentation for information such as the following:
H Module installation instructions
H Location of the laser on the OTDR
H Overview of screen features
H Tutorial for basic measurement and analysis tasks
H Measurement descriptions
H OTDR specifications, options and accessaries, and user
maintenance information
H OTDR terminology
xii
NetTek Analyzer OTDR Modules User Manual
Page 17

Related Documentation
For general help and content sensitive help for the OTDR, refer to
the OTDR online help.
H NetTek Analyzer OTDR Online Help
(In the OTDR application, select Help > Help Topics... or tap the
? button in a dialog box.)
The OTDR module attaches to and runs on the Y350C NetTek
Analyzer platforms. For platform information, refer to the following
resources:
H Y350C NetTek Analyzer Platform User Manual
H Y350C NetTek Analyzer Platform Online Help
(Select Start > Help or tap the ? button in a dialog box.)
H Windows CE Operating System Online Help
(Select Start > Help or tap the ? button in a dialog box.)
Refer to the platform resources listed above for information about
the following topics:
Preface
H Battery and AC power, Battery care
H Platform power on and functional check
H Touch-screen calibration
H Platform operating instructions and menu descriptions
H Memory resources, floppy disk storage, PCMCIA interface
H Remote PC connection
H Instructions for upgrading platform software and changing the
language
H Platform technical specifications
H Platform accessories, maintenance, diagnostics
NetTek Analyzer OTDR Modules User Manual
xiii
Page 18

Preface
Contacting Tektronix
Phone 1-800-833-9200*
Address Tektronix, Inc.
Web site www.tektronix.com
Department or name (if known)
14200 SW Karl Braun Drive
P.O. Box 500
Beaverton, OR 97077
USA
Sales support
Service
support
Technical
support
* This phone number is toll free in North America. After office
hours, please leave a voice mail message. Outside North
America, contact a Tektronix sales office or distributor; see the
Tektronix web site for a list of offices.
1-800-833-9200, select option 1*
1-800-833-9200, select option 2*
Email: techsupport@tektronix.com
1-800-833-9200, select option 3*
6:00 a.m. -- 5:00 p.m. Pacific time
xiv
NetTek Analyzer OTDR Modules User Manual
Page 19

Getting Started
Page 20

Page 21

Getting Started
Before using the NetTek Analyzer Platform for the first time, refer to
the platform user manual for information on getting started,
including the following:
H Battery and power source information. (You must charge the
batteries before you can operate the NetTek Analyzer Platform
from internal battery power.)
H Calibrating the touch screen.
H Installing the tilt stand, shoulder strap, or strand hook.
Product Description
An optical time domain reflectometer (OTDR) measures and locates
fiber characteristics by transmitting light pulses into a fiber and
measuring the elapsed time and the amplitude of the received
reflection. The OTDR measures the distance to an event by
measuring the amount of time required to receive the reflection.
With this OTDR, you can:
H Document and verify installations of new fibers in a network.
H Locate faults in the fiber.
H Check bandwidth upgrade capability by measuring the return loss
and end-to-end loss in the network.
H Perform general preventive maintenance.
NetTek Analyzer OTDR Modules User Manual
1- 1
Page 22

Getting Started
The NetTek Analyzer OTDR, with its easy-to-use interface, gives
you good results with minimal training. The IntelliTrace Plus test
mode automatically optimizes test parameters so you don’t have to.
It gives you the best resolution on every section of the fiber while
maximizing dynamic range. The NetTek Analyzer OTDR provides
an IntelliTrace Plus multi-pulsewidth, single-result auto test function
to significantly reduce dead zone effects on your tests. You can see
close events, including the first connector, at the same time you see
events 200 km away. Advanced wave-shape analysis software finds
more events than other OTDRs can locate. All these features
combine to give you more information on your cables, with precise
accuracy.
Installing an Instrument Module
Use the following procedure to install an instrument module onto the
rear of the NetTek Analyzer Platform or to attach one module onto
another. Refer to Figure 1--2 throughout this procedure.
1- 2
CAUTION. The platform and modules contain static sensitive devices.
Do not touch the connector pins.
1. Power off the NetTek Analyzer Platform: select Start >
Shutdown.
2. Disconnect all cables to the NetTek Analyzer Platform and
instrument modules.
NetTek Analyzer OTDR Modules User Manual
Page 23

Getting Started
3. Place the NetTek Analyzer face down on a flat surface. Support
the analyzer by its four corner bumpers only.
4. Remove the bus door from the rear of the NetTek Analyzer
Platform or instrument module. See Figure 1--1 or 1--2.
Bus door
Bus connector
NetTek Analyzer Platform
Figure 1- 1: Removing the bus door
5. Carefully lower an Instrument module onto the NetTek Analyzer
Platform or previously installed module to engage the bus
connector. See Figure 1--2.
NetTek Analyzer OTDR Modules User Manual
1- 3
Page 24

Getting Started
6. Press down firmly to seat the connector and ensure electrical
7. Locate the four thumb screws. See Figure 1--2.
Bus door
contact.
Thumb screw (4)
Instrument module
1- 4
NetTek Analyzer
Platform
Bus connector
Figure 1- 2: Install instrument module
NetTek Analyzer OTDR Modules User Manual
Page 25

Getting Started
8. For each thumb screw, push down on the head and turn it in a
counter-clockwise direction to extend the length.
9. Tighten the screws by turning them in a clockwise direction. Use
the coin slot in the top of the thumb screw if you require
additional torque. Be sure to tighten all screws evenly.
10. To recess the thumb screw heads, push and turn each screw head
in a clockwise direction.
11. To maintain the enclosure seal integrity, reinstall the bus door
into the rear of the instrument module.
NetTek Analyzer OTDR Modules User Manual
1- 5
Page 26

Getting Started
Removing an Instrument Module
Use the following procedure to remove an instrument module from
the rear of the NetTek Analyzer Platform or to detach one module
from another. Refer to Figure 1--2 throughout this procedure.
CAUTION. The platform and modules contain static sensitive devices.
Do not touch the connector pins.
1. Power off the NetTek Analyzer Platform: select Start >
Shutdown.
2. Disconnect all cables from the NetTek Analyzer Platform and
instrument modules.
3. Place the NetTek Analyzer face down on a flat, uncluttered
surface. Support the analyzer by its four corner bumpers only.
4. To release the thumb-screw heads, push and turn each screw head
in a counter-clockwise direction.
1- 6
5. Disengage all four screws by turning them in a counter-clockwise
direction. A tool or coin may be required if the screws are tight.
6. Pull up on the instrument module to remove it.
7. To maintain enclosure seal integrity, reinstall the bus door into
the NetTek Analyzer Platform or instrument module.
NetTek Analyzer OTDR Modules User Manual
Page 27

Getting Started
Using the Laser Optical Port and Connector Adapter
WARNING. The light emitted by the laser source is invisible to the
human eye. Do not stare directly into the laser source. Doing so
while the laser is on can damage your eye.
Do not stare at the free end of a test fiber (the end not connected to
the instrument). If possible, direct the free end toward a non-reflective surface.
CAUTION. Do not touch the exposed end of the laser output port with
anything but the proper cleaning materials. To maintain the
performance of fiber optic connectors, clean them every time you use
them. Refer to Cleaning beginning on page C--1.
To protect against dust and damage, cover the optical port when not
in use.
The OTDR tests optical fibers by emitting short pulses of laser light.
Figure 1--3 shows the location of the OTDR optical port. The optical
port snaps out to a 45% angle. To return the optical port to the closed
position, lift the release lever.
NetTek Analyzer OTDR Modules User Manual
1- 7
Page 28

Getting Started
Optical port cover
Lift the release lever to stow
the optical connector.
Release lever Optical port
Release lever
Figure 1- 3: Laser optical connector
1- 8
NetTek Analyzer OTDR Modules User Manual
Page 29

Getting Started
Install the Appropriate Connector Adapter
CAUTION. To avoid damage to the instrument, never connect a bare
fiber adapter directly to the instrument.
The connector adapter attaches the fiber to the laser optical port.
Connector adapters are packaged separately with new instruments,
and must be installed on the laser optical port before use.
The connector adapter on the OTDR must match the connector on
the test fiber. See page B--1 for a list of connector adapter options.
Connector adapters are keyed for proper mating with the laser output
port.
To install a connector adapter, align the keyed elements, slide the
connector adapter onto the laser output port, and turn clockwise until
the connector adapter is finger tight (see Figure 1--4).
Connector adapterOptical port
Figure 1- 4: Connector adapter installation
NetTek Analyzer OTDR Modules User Manual
Align the keys
1- 9
Page 30

Getting Started
Remove a Connector Adapter
To remove a connector adapter, unscrew it counterclockwise and pull
it straight off the port. Refer to Figure 1--4 on page 1--9.
1- 10
NetTek Analyzer OTDR Modules User Manual
Page 31

Operating Basics
Page 32

Page 33

Operating Basics
Read this section to understand the online help system and the main
screen features.
Using the Online Help
Refer to the online help for information on operating the NetTek
Analyzer and the OTDR. You will find both general help topics and
context-sensitive help topics.
There are several ways to access online help:
H For platform information, select Windows CE Start > Help.
H For OTDR help, select Windows CE Start > Help > OTDR.
H For OTDR help when the OTDR program is open, you can also
select Help from the upper right corner of the screen.
H For context-sensitive OTDR help when the OTDR program is
open, select the ? button in any dialog box.
To read a long help topic without having to scroll, select the
button to increase the size of the help window to full screen size.
To access related help topics, tap blue, underlined text.
If the Input Panel covers the help window, tap the
bottom of the screen to close the Input Panel. Tap the button again to
open the Input Panel.
NetTek Analyzer OTDR Modules User Manual
button at the
2- 1
Page 34

Operating Basics
Table 2- 1: Help window buttons
Tap this button To
All Topics Display the NetTek Analyzer main table of contents.
Back Return to the previous help screen.
Contents Display the current program or local table of
contents.
Display full-screen help text.
Display the help text in its own window. Tap and drag
the Help window title bar to move the window.
Minimize the Help window. To maximize the window,
tap the Help icon in the taskbar.
Close the Help window and quit help.
Scroll the text towards the bottom of the screen.
Scroll the text towards the top of the screen.
2- 2
Open and close the soft keypad Input Panel. The
button is located in the lower right hand corner of the
touch screen. (Tap this button to uncover the Help.)
NetTek Analyzer OTDR Modules User Manual
Page 35
Elements of the Main Screen
The features you need most often are available on the main screen.
Main Screen Buttons
The main screen buttons represent the tasks that you need to perform
most often. Many of these buttons duplicate operations that are
available in the main menus. Refer to Figure 2--1 for the layout of
the main screen; Table 2--2 lists the function of each button.
Operating Basics
Figure 2- 1: Main screen
NetTek Analyzer OTDR Modules User Manual
2- 3
Page 36

Operating Basics
Table 2- 2: Main screen buttons
Change the display proportions. See Changing the Proportions of
the Trace and Table Regions on page 2--5.
Refresh the screen. Use this button if a screen element or the
trace disappears. Use this button to center the trace around the
active cursor when zoomed in.
Toggle the active cursor. (Cursor A is active in this picture.)
Move the active cursor left or right along the trace in large
increments.
Move the active cursor left or right along the trace in small
increments.
Jump the active cursor one event to the left or right.
Control zooming. See Zooming on page 2--7.
2- 4
Save changes to the file. See Saving Tests and Settings on
page 2--29.
Open a dialog box, allowing you to automate taking and saving
numerous, similar tests. See Auto Test and Save Dialog Box on
page 3--12.
Start an acquisition.
Open a dialog box, allowing you to set up measurement
thresholds and to flag out-of-limit data for the next trace you
acquire. See Configuring Settings on page 2--21.
NetTek Analyzer OTDR Modules User Manual
Page 37

Table 2- 2: Main screen buttons (Cont.)
Open a dialog box, allowing you to set up measurement
thresholds and to flag out-of-limit data for the active trace. See
Configuring Settings on page 2--21.
Open and close the soft keypad Input Panel, allowing you to enter
alphanumeric characters with the touch screen. (This button is
located in the lower right corner of the touch screen.)
Viewing the Trace and Table
There are several ways that you can change the appearance of the
main screen to best see your data.
Changing the Proportions of the Trace and Table Regions
You can change the proportions of the trace and table regions using
Operating Basics
the icons in the upper right corner of the screen:
You can also use the View menu:
H Select View > Maximize Trace to show the trace and only one
row of event table data.
H Select View > Split Trace and Table to show the trace and three
rows of event table data.
H Select View > Event Table Only to hide the trace and show only
the event table.
Additionally, you can select V iew > Display Settings to hide or
show key settings at the bottom of the main screen. Hide the settings
to increase the size of the trace and to see more rows of the event
table.
NetTek Analyzer OTDR Modules User Manual
.
2- 5
Page 38

Operating Basics
Setting Trace Display Options
Select View > Trace Display Options.
In this dialog box, you can change the appearance of the trace region
of the main screen:
H Select or clear Event Markers to show or hide the
H Select or clear Delta Readouts to show or hide the readouts that
appear along the top of the trace region.
H Select or clear Grid to show or hide grid lines on the trace region.
markings.
2- 6
NetTek Analyzer OTDR Modules User Manual
Page 39

Operating Basics
Zooming
Whenever the trace is visible, as in Figure 2--2, you can zoom in to
take a closer look at an area of interest. The pink zoom box shows
the area of the trace that will be zoomed in on. The zoom box will
follow the active cursor.
Zoom box
Figure 2- 2: Zoomed out trace
When you zoom in, the upper right corner of the screen displays an
overview window showing the whole trace. As shown in Figure 2-- 3,
the zoom box in the overview window indicates the part of the trace
that you zoomed in on.
You can show or hide the overview window by selecting Vie w >
Display Overview Window.
NetTek Analyzer OTDR Modules User Manual
2- 7
Page 40

Operating Basics
To zoom:
1. Move a cursor to the point of interest on the trace.
2. Drag the corners of the zoom box to adjust its size and shape.
3. Tap
4. Tap
trace again.
to zoom in.
to zoom out when you want to look at the whole
Overview window
Zoom box
2- 8
Figure 2- 3: Zoomed in trace, with overview window showing whole
trace
NetTek Analyzer OTDR Modules User Manual
Page 41

Operating Basics
Sizing the Zoom Box with the Zoom Buttons. By changing the size of
the zoom box, you can control the amount that you magnify the view
of the trace, or you can change the scale of each axis independently.
To change the size of the pink zoom box:
H Drag the corners of the zoom box to adjust its size and shape.
H Tap the
button, and then use the arrow buttons:
Toggles
increases the height of the pink zoom box.
decreases the height of the pink zoom box.
increases the width of the pink zoom box.
decreases the width of the pink zoom box.
To better see the power loss or reflectance of an event, change
the vertical scale by tapping the
arrow several times.
If the zoom box disappears, select View > Restore Zoom Box to
bring it back.
NetTek Analyzer OTDR Modules User Manual
2- 9
Page 42

Operating Basics
Moving the Zoomed View. When you are zoomed in, you can change
the part of the trace that you see by:
H Moving the active cursor. For example, tap one of the Cursor
buttons.
H Tapping the refresh button centers the view around the intersec-
tion of the active cursor and the trace.
H Moving the zoom box with scroll bars. Select View > Zoom
Scroll Bars to show or hide the scroll bars. Use the scroll bars to
move the pink zoom box in the overview window.
2- 10
NetTek Analyzer OTDR Modules User Manual
Page 43

Cursors
Operating Basics
There are two cursors. Tap the
cursor. The active cursor appears in the center of the pink zoom box.
Try these ways to move the cursors:
H Touch and drag either cursor to move it along the trace.
H Tap the
the left or to the right.
H Use the
along the trace in large increments.
H Use the
along the trace in small increments.
H Tap the event marker,
H Tap the event row,
H Double-tap a location in the trace area.
buttons to jump the active cursor one event to
buttons to move the active cursor left or right
buttons to move the active cursor left or right
, in the trace area.
, in the event table.
buttons to toggle the active
NetTek Analyzer OTDR Modules User Manual
2- 11
Page 44
Operating Basics
Event Table Columns
In Split Trace and Event Table view, you can see six columns of data
in the event table. In Event Table Only view, you can also see
Loss ∆, Dist. ∆, and Event Notes (if you scroll to the right). For
landmarks, data will only appear in the Event#, Dist., and Notes
columns.
Figure 2--4 below shows data in the Event Table Only view. Refer to
Table 2--3 on page 2--13 for descriptions of the data in each event
table column and Table 2--4 on page 2--14 for the meanings of marks,
symbols, and highlights that appear in the event table.
2- 12
Figure 2- 4: Event Table Only view
NetTek Analyzer OTDR Modules User Manual
Page 45

Operating Basics
Table 2- 3: Event Table column definitions
Column Definition
Event# Event numbers correspond to event markers or landmarks
in the trace area.
Dist. Distance represents the distance from the front panel to
the event or landmark.
Loss Loss lists the loss of optical power at an event due to
scattering, absorption, and bending.
Reflectance Reflectance lists the ratio of reflected optical power to
incident optical power for reflective events.
Cuml. Loss Cumulative Loss lists the total loss from the front panel up
to and including this event.
Slope Slope lists the attenuation of the fiber between an event
and the preceding event.
Loss ∆ Loss Delta lists the loss between an event and the
preceding event.
Distance ∆ Distance Delta lists the distance between an event and the
preceding event.
Event Notes Event Notes displays the Comments field of the Event /
Landmark Notes dialog box.
NetTek Analyzer OTDR Modules User Manual
2- 13
Page 46

Operating Basics
Table 2- 4: Event Table symbols and highlights
Mark Definition
e An “e” appears next to an echo event.
g A “g” appears next to a grouped event.
* An asterisk (*) appears next to any manually adjusted
L An “L” appears next to landmarks that you have manually
End “End” marks the event at the end of the fiber. See
OOR Out of Range. Occasionally, on very long fibers, the
Yellow Rows The active event data displays in yellow.
Red Cells Any data that surpasses the thresholds you set on the Test
values in the table.
added to the table.
page 3--17 for an explanation of grouped end events.
OTDR cannot detect the end of the fiber because the
resolution is insufficient. The phrase “Out of range” will
appear in the event table. If this happens, see page 3--16
for how to increase the range.
Settings and Limits dialog window is flagged in red.
2- 14
NetTek Analyzer OTDR Modules User Manual
Page 47

Tutorial
In this tutorial you will learn to take a basic measurement and to
analyze the results. Italicized terms are defined in the glossary.
Take a Basic Measurement
CAUTION. To maintain the performance of fiber optic connectors,
clean them every time you use them. Refer to Cleaning beginning on
page C--1.
1. Clean the instrument connector and the fiber connector.
CAUTION. To avoid damage to the instrument, never connect a bare
fiber adapter directly to the instrument.
2. Connect the fiber.
3. Select the Run Settings button.
4. Select a wavelength that is appropriate for your system.
5. For Test Mode, select IntelliTrace Plus.
6. Enter an event loss threshold that is appropriate for your system.
7. Select OK.
8. Select the OTDR Run button.
The hour-glass cursor appears and the status bar displays
“Acquiring...” and the status bar displays the elapsed time in
seconds..
NetTek Analyzer OTDR Modules User Manual
2- 15
Page 48

Tutorial
Analyze the Results
In this section you will learn to understand trace data, find the length
of the fiber, and examine two point loss.
Examine the Trace Data
Look at events in the trace region and in the event table.
Beginning
of fiber
Event End of fiberTrace
2- 16
See Changing the Proportions of the Trace and Table Regions on
page 2--5 for information on making either the trace or table area
larger.
NetTek Analyzer OTDR Modules User Manual
Page 49

Tutorial
The trace is the line that visually represents the fiber. It typically
slopes gently from the upper left of the trace region down to the
lower right. From the shape and length of the trace, you can see the
characteristics and length of the fiber. Sudden variations in the trace
are marked as events.
An event is an irregularity along the fiber such as a connector or a
bend. Each event is marked with a numbered square at the
appropriate distance along the horizontal axis of the trace region,
representing its distance along the fiber. Each numbered square event
marker correlates to a numbered row of data in the event table. The
event table lists the distance, loss, reflectance, cumulative loss, and
slope for each event on the fiber.
The OTDR displays an event when the event loss (a drop in the
power) or reflectance (an increase in the power) is greater than the
Event Loss or Reflectance thresholds that you set. (See page 2--21
for information about setting thresholds.)
NetTek Analyzer OTDR Modules User Manual
2- 17
Page 50

Tutorial
Find the Length of the Fiber
The last event usually marks the end of the fiber; the distance of the
end event is the length of the fiber.
In the event table, look at the distance of the event marked “End.”
Alternatively, in the trace region, look at the event where the trace
drops abruptly and is followed by noise.
Occasionally the OTDR may indicate that the end of the fiber is out
of range. If this occurs, refer to Increasing the Range on page 3--16.
Examine the Two-Point Loss
Look at the loss between two points on the trace:
Be sure both cursors are on backscatter regions of the trace.
1. Zoom in on the area of the trace. (Refer to Zooming on
page 2--7.)
2. Select Measurements > Two Point....
3. Drag a cursor or use the cursor buttons to place a cursor on
backscatter to the left of an area of interest on the trace.
2- 18
4. Use the
5. Place the second cursor on backscatter to the right of the area of
interest on the trace.
6. Look at the top line of the trace region for the readouts of
distance, two point loss, and slope between the two cursors.
cursor buttons to toggle the active cursor.
NetTek Analyzer OTDR Modules User Manual
Page 51

Tutorial
Examine an Event
Select an event to make it active. The active event will be highlighted in the event table and in the trace region so you can compare
the event data to the visual representation of that event.
To select an event, do one of the following:
H Taparowintheeventtable.
H Tap the event marker in the trace region.
H Move a cursor to the event marker in the trace region.
Examine the Event Table Data
Select View > Event Table Only to hide the trace and show only the
event table. Examine the data in the event table. Take note of any
data highlighted in red (black on monochrome screens) or event
numbers marked with an “e”, “g”, or “*”.
Refer to Event Table Columns on page 2--12 for more information
about the table data and the meanings of symbols and highlighting.
NetTek Analyzer OTDR Modules User Manual
2- 19
Page 52

Tutorial
2- 20
NetTek Analyzer OTDR Modules User Manual
Page 53

Configuring the Settings and Saving and Opening Files
Settings tabs (in the Test Settings and Limits dialog box) allow you
to switch between different settings configurations as you acquire
new traces. See Configuring Settings below.
You can save a trace with settings, or you can save the settings alone.
See page 2--29 for information about saving files.
You can open a trace with settings, or you can open the settings
alone. See page 2--33 for information about opening files.
Configuring Settings
The several settings tabs allow you to switch between different
settings configurations as you acquire new traces.
Open the Test Settings and Limits dialog box by selecting Settings >
Test Setting and Limits, and then one of the following choices:
H Run 1. Opens a tab displaying the settings that will be used by
the next trace you acquire in the first mainscreen tab. (You will
use this tab most of the time.)
H Trace 1. Opens a tab displaying the settings used by the current
trace in the first mainscreen tab.
H Run 2. Opens a tab displaying the settings that will be used by
the next trace that you acquire in the second mainscreen tab.
(You can acquire traces in the second mainscreen tab when you
turn Dual Trace mode on or when you use the Auto Test and
Save feature for two wavelengths.)
H Trace 2. Opens a tab displaying the settings used by the current
trace in the second mainscreen tab. This choice is only available
if a second trace is open.
NetTek Analyzer OTDR Modules User Manual
2- 21
Page 54

Configure the Settings and Saving and Opening Files
The Run tabs show the test settings for the next trace you will
acquire. See Figure 2--5.
Figure 2- 5: A Run tab of the Test Settings and Limits dialog box
2- 22
NetTek Analyzer OTDR Modules User Manual
Page 55

Configure the Settings and Saving and Opening Files
The trace tabs show the test settings for a trace that you have already
acquired. See Figure 2--6. If you have saved the file, then the test tab
is labeled with the file name. If you have not yet saved the file, then
the tab is labeled either Trace 1 or Trace 2.
Figure 2- 6: A Trace tab (labeled with the file name) of the Test Settings and Limits
dialog box
NetTek Analyzer OTDR Modules User Manual
2- 23
Page 56

Configure the Settings and Saving and Opening Files
Settings that Affect How Data is Collected
In the Test Settings and Limits dialog box, you can set a number of
parameters which will affect how test data is collected:
NOTE. Because these settings affect how data is collected, you can
not change these test settings in the trace tabs. The trace tabs
represent the settings for traces that you have already acquired.
H Test Mode. Refer to Table 2--5 for information about each test
mode.
You can also set the test mode from the main screen drop-down
menu; however, to specially optimize IntelliTrace Plus mode for
Fastest or Standard, you must use the Test Settings tab.
H Pulsewidth. The duration in time (ns) that the laser pulses the
fiber. Longer pulse widths provide greater range; shorter pulse
widths provide shorter loss dead zones between events.
H Range. From the drop-down box, select the shortest length that is
greater than the length of the fiber you will test.
2- 24
H Test Time. Longer test times will give you more averaging which
reduces noise and increases the usable range.
H Wavelength. Select the wavelength of light with which to test.
H End Detection. Enter the signal level threshold for End
Detection. When the signal drops at a single point below this
threshold, the OTDR will indicate the end of the fiber.
NetTek Analyzer OTDR Modules User Manual
Page 57

Configure the Settings and Saving and Opening Files
Table 2- 5: Choosing the Test Mode
Test Mode Purpose
IntelliTrace Plus To automate a measurement; the OTDR picks the
best settings. You can optimize IntelliTrace Plus
for different needs. In the IntelliTrace Plus
Configuration field, choose from:
1
Fastest
For the shortest test time but not the best
resolution
Standard
1
For fairly good resolution and a reasonably
quick test
Manual To control your own test settings. You must set
Pulse Width, Range, and Test Time.
End of Fiber To quickly measure the length of the fiber.
Real Time To look at a signal that changes with time. In real
time acquisition, there is no averaging. For
example, you can see changes in the trace as you
manipulate the fiber or as you adjust a connection.
To stop acquisition, select the Stop button.
When you have two trace files open, you cannot
take Real Time measurements. Select Dual Trace
> Remove Trace 2 to close the second tab.
1
These optimizations are only available from the Test Settings tab.
NetTek Analyzer OTDR Modules User Manual
2- 25
Page 58

Configure the Settings and Saving and Opening Files
Settings that Affect How Data is Displayed
In the Test Settings and Limits dialog box, you can set a number of
parameters that affect how test data is displayed:
NOTE. Because these settings do not change how you acquire the test
data, you can change these settings in either Run or Trace tabs.
H Refractive Index. Enter the refractive index specification of the
fiber.
H Cabling Factor. Enter the percent of extra fiber compared to the
sheath measurements. (The OTDR measures the length of the
fiber, which, because it twists, is longer than the length of the
sheath.)
H Backscatter Coefficient. Enter the backscatter coefficient
specification of the fiber. (This affects only reflectance
measurements.)
H Zero Reference. Enter the Zero Reference (the length of optica l
fiber between the OTDR and the link you are testing).
2- 26
Select or clear the checkbox for each limit or threshold. The
checkboxes are global; changing a checkbox in one tab (for example,
Run 1) changes that checkbox in all the other tabs to the same state.
When the checkbox is not checked, the associcated edit box is
grayed out. Either check the box or tap the numeric keypad button
next to the edit box to turn on the checkbox and then edit the
checkbox contents.
Limits. Select the limit settings to highlight in red the out-of-limit
data in the event table or in the Link Loss display.
You can set these limits:
H Link Loss Limit.
H Slope Limit.
H Event Loss Limit.
H Reflectance Limit.
NetTek Analyzer OTDR Modules User Manual
Page 59

Configure the Settings and Saving and Opening Files
Thresholds. Select the threshold settings to control whether a possible
event will be displayed or not. All possible events are determined;
the thresholds only control which of those events are displayed. If
you want to display all possible events (regardless of loss or
reflectance value), uncheck the Event Loss Threshold box. This
disables (grays out) the Threshold value (indicating that it now has
no effect on displayed events) and shows all events.
You can set these thresholds:
H Event Loss Threshold. Enter the Event Loss Threshold for
displaying events. If the trace shows a loss of more than the
Event Loss number, the OTDR will display an event.
H Reflectance Threshold. Enter the Reflectance Threshold for
displaying events. If the trace shows a reflectance more than the
Reflectance number, the OTDR will display an event.
NetTek Analyzer OTDR Modules User Manual
2- 27
Page 60

Configure the Settings and Saving and Opening Files
Copying Settings to Other Tabs
In the Test Settings and Limits dialog box, you can copy the settings
from the active tab to the other tabs by tapping the Copy to Run
button or the Copy to Trace button.
In the Test Settings and Limits dialog box, there can be as many as
four tabs, as shown in Figures 2--5 and 2--6. You can designate the
settings differently in each of these tabs. The checkboxes for the
limits settings change globally for all four tabs, but the other fields
change independently for each tab.
You can change any setting in a Run tab and use these settings for
your next acquisition. Each Trace tab represents the settings of a
trace that you have taken or opened, so some of these settings cannot
be changed; they are grayed out.
When you tap the Copy to Trace button, some settings will only be
applied to the target Trace tab if the wavelength is the same in both
the active tab and the target tab.
NOTE. Avoid copying a settings file with a wavelength that is not
supported by your OTDR module. If you do, the wavelength
dependent values listed below will change, but the default valid
wavelength for your module will be used. Most likely, you would end
up with settings that are different from what you had intended.
2- 28
The following settings are wavelength dependent:
H Pulse-width (for manual test mode)
H Averages (for manual test mode)
H Refractive Index
H Backscatter Coefficient
H End Detection
H Slope Limit
H Link Loss Limit
NetTek Analyzer OTDR Modules User Manual
Page 61

Configure the Settings and Saving and Opening Files
Saving Tests and Settings
You can save tests with test settings, or you can save the test settings
alone. All files that you save are Telcordia compliant. For more
information, refer to About File Types on page 3--22.
Save a Test
To save the test in the active trace tab, select File > Save As or press
the disk icon.
When you save a test, the following information is saved to a file:
the trace, event table, test measurements, events, event notes,
landmarks, landmark notes, fiber notes, test settings and limits,
cursor positions, cursor selection, and zoom box size.
NetTek Analyzer OTDR Modules User Manual
2- 29
Page 62

Configure the Settings and Saving and Opening Files
In the Save As dialog box, proceed as follows:
NOTE. When storing files or creating folders in the BuiltInDisk
folder, you should limit the number of files and folders within the
root directory of the folder to between 30 and 40. When storing files
and folders in a PCMCIA memory card, you should limit the number
of files and folders in the root directory to about 60. Store files in
subdirectories, in which there is effectively no limit to how many files
can be stored.
1. In the Save in field, select the location where you want the file
saved. Use the folder icons to navigate to a higher level of folder
or to create a new folder. The list box below the field displays the
names of existing files in the selected folder.
NOTE. Save files in \BuiltInDisk, on a floppy disk, or on a PC card.
Files saved anywhere else will be lost when you power off the NetTe k
Analyzer.
2- 30
2. Enter a filename in the Filename field.
3. If you want to add or edit notes about the fiber, select the Fiber
Notes... button, enter information about the fiber, and tap OK.
4. Tap the Save button.
NetTek Analyzer OTDR Modules User Manual
Page 63

Configure the Settings and Saving and Opening Files
Save Settings Only
You can save frequently used test settings and limits to a file that you
can reuse.
Select Settings > Save Settings and then select the settings tab that
you want to save:
H Run 1
H Trace 1
H Run 2
H Trace 2
NOTE. When storing files or creating folders in the BuiltInDisk
folder, you should limit the number of files and folders within the
root directory of the folder to between 30 and 40. When storing files
and folders in a PCMCIA memory card, you should limit the number
of files and folders in the root directory to about 60. Store files in
subdirectories, in which there is effectively no limit to how many files
can be stored.
NetTek Analyzer OTDR Modules User Manual
2- 31
Page 64

Configure the Settings and Saving and Opening Files
NOTE. Save files in \BuiltInDisk, on a floppy, or on a PC card. Files
saved anywhere else will be lost when you power-off the NetTek
Analyzer.
2- 32
Test data is not saved from this tab; use the Save Test tab instead.
1. In the Save in field, select the location where you want the file
saved. Use the folder icons to navigate to a higher level of folder
or to create a new folder. The list box below the Save In field
displays the names of existing files in the selected folder.
2. In the Filename field, enter a filename. The file extension .set
indicates that this file contains only settings and limits data (no
test data).
All the test settings and limits from the Test Settings and Limits
dialog box are saved to your file.
NetTek Analyzer OTDR Modules User Manual
Page 65

Configure the Settings and Saving and Opening Files
Opening Trace or Setting and Limit Files
You can open files from floppy disk, internal memory, or a storage
card. You can open a trace file or a settings and limits file. For more
information, refer to About File Types on page 3--22.
Opening a Trace File
Select File > Open.
From this tab, you can open .SOR files containing settings, limits,
and trace data. You can also open .CFF or .WFM files to view.
1. From the Look in: box, select the floppy disk, internal memory,
or the storage card. The contents of the folder will appear in the
box below. Tap a folder to open it. If you want to back up to a
higher level of folder, use the folder icon. Tap the file name you
want to open.
The fields on the right side of the dialog box give you a preview
of information related to the highlighted file.
If you have trouble finding a file, use the Files of Type
drop-down box to limit the files displayed to SOR Format or CFF
Format, or you can expand the types of files that are visible by
choosing All Files.
NetTek Analyzer OTDR Modules User Manual
2- 33
Page 66

Configure the Settings and Saving and Opening Files
2. Select Replace Run and Trace settings and limits to make the
test settings and limits of the saved trace file the default ones
used when you acquire the next trace and to apply the saved
settings to the trace. If this box is not checked, none of the
settings are changed from the last settings saved for the
wavelength of the file (see About Trace to see the file settings).
2- 34
3. Select Open as Trace 1 or Open as Trace 2.
4. Tap Open to open the highlighted file name.
Opening a Settings Only File
You can open .SET files. These .SET files are smaller than .SOR or
.CFF files, which also contain trace data.
Select Settings > Open Settings, and then select which tab to open
the settings into:
H Run 1. Select if you want the next trace you acquire in the first
tab to use the settings that you open.
H Trace 1. Select if you want the current trace in the first tab to use
the settings that you open.
NetTek Analyzer OTDR Modules User Manual
Page 67

Configure the Settings and Saving and Opening Files
H Run 2. Select if you want the next trace you acquire in the second
tab to use the settings that you open. (You can acquire traces in
the second tab when you turn Dual Trace mode on or when you
use the Auto Test and Save feature for two wavelengths.)
H Trace 2. Select if you want the current trace in the second tab to
use the settings that you open.
1. From the Look in: box, select the floppy disk, internal memory,
or the storage card. The contents of the folder will appear in the
box below this field.
Tap a folder to open it. If you want to back up to a higher level of
folder, use the folder icon.
If you insert a floppy disk or a storage card, tap the Refresh
button to see the contents.
2. Double-tap the file name you want to open.
NetTek Analyzer OTDR Modules User Manual
2- 35
Page 68

Configure the Settings and Saving and Opening Files
Determine Which Settings Were Used for a Trace
Select Settings menu > About Trace.
This dialog box displays all the static settings that were used to
acquire the trace and all the dynamic settings that were saved with
the trace.
2- 36
NetTek Analyzer OTDR Modules User Manual
Page 69

Examine the Test1.SOR, Test2.SOR, and Test--MM.SOR Files
In this section you will look at three sample files provided with your
OTDR:
H Test1.SOR illustrates that different types of events can look
similar.
H Test2.SOR illustrates a damaged angle-polished splice.
H Test--MM.SOR illustrates a multimode fiber with a number of
events, including echoes and grouped events.
Starting with Test1.SOR, in the following steps, you will compare
the appearances of each event in the trace and compare the amounts
of loss and reflectance of each event in the event table.
NetTek Analyzer OTDR Modules User Manual
2- 37
Page 70

Examine the Test1.SOR, Test2.SOR, & Test--MM.SOR Files
1. Open Test1.SOR from Internal Memory. (Select File > Open,
then Look in: Internal Memory, and double-tap Test1.SOR.)
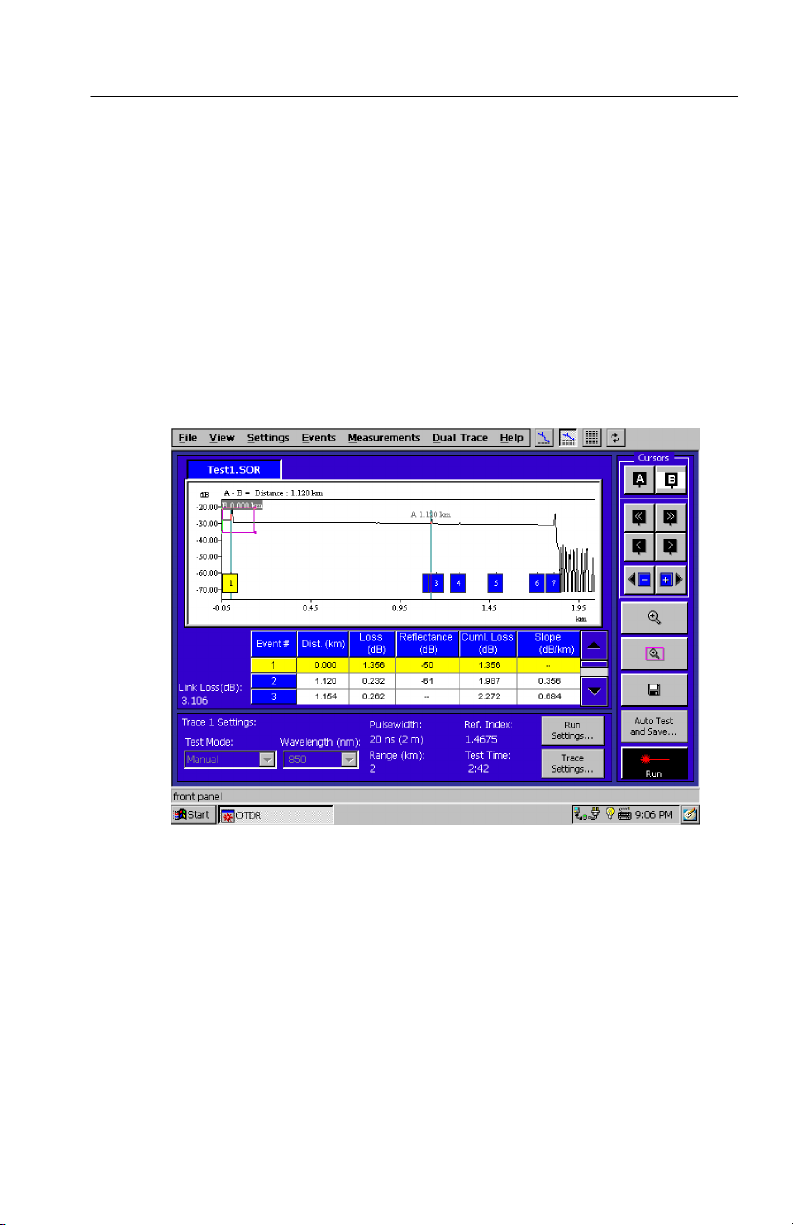
2. Look at the seven events. You will see something similar to
Figure 2--7.
2- 38
Figure 2- 7: Sample file Test1.SOR illustrates that different types of
events can look similar
NetTek Analyzer OTDR Modules User Manual
Page 71

Examine the Test1.SOR, Test2.SOR, & Test--MM.SOR Files
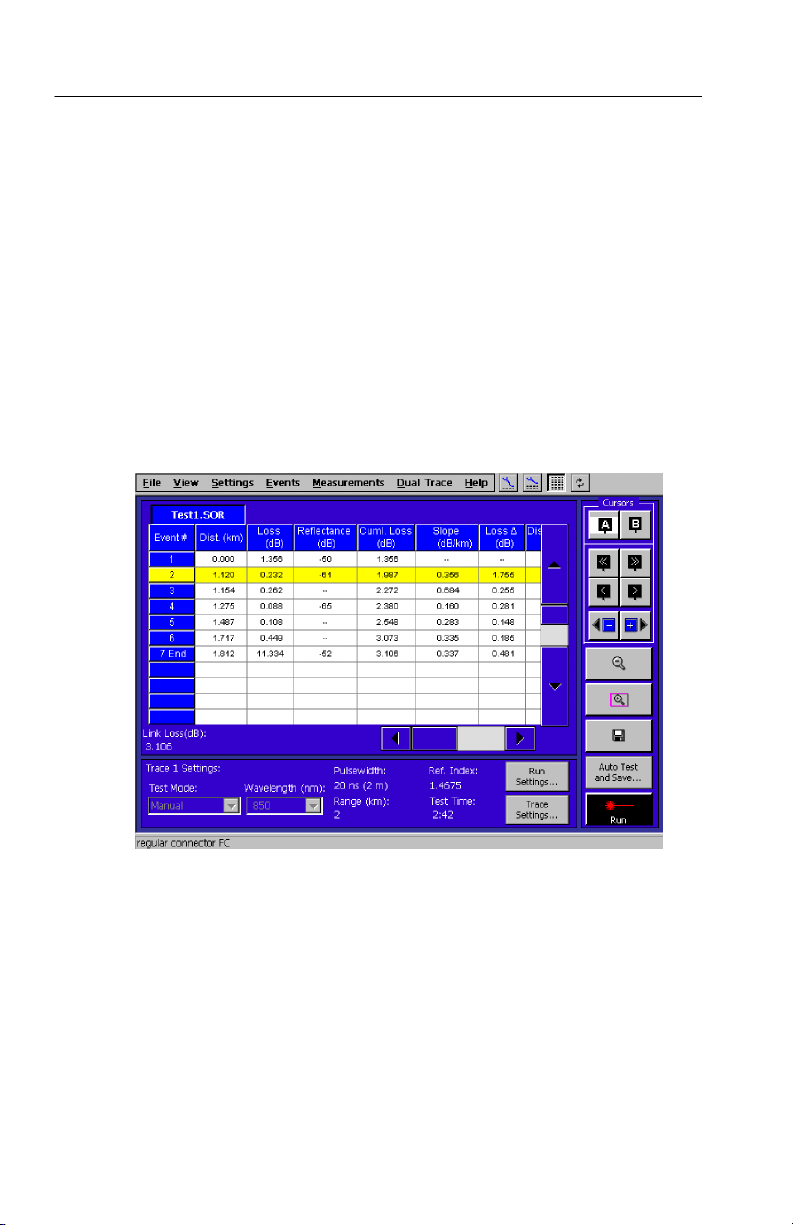
3. Switch to Event Table Only view to compare the event loss and
reflectance values of each event. (Select View > Event Table
Only.) You will see something similar to Figure 2-- 8. You can
scroll to the right to view a description of each event in the Event
Notes column.
Figure 2- 8: Compare the amounts of loss and reflectance in each of the
events in the sample file Test1.SOR
4. Switch back to the trace view again. (Select View > Maximize
Trace.)
The first event is the beginning of the fiber at the front panel.
NetTek Analyzer OTDR Modules User Manual
2- 39
Page 72
Examine the Test1.SOR, Test2.SOR, & Test--MM.SOR Files
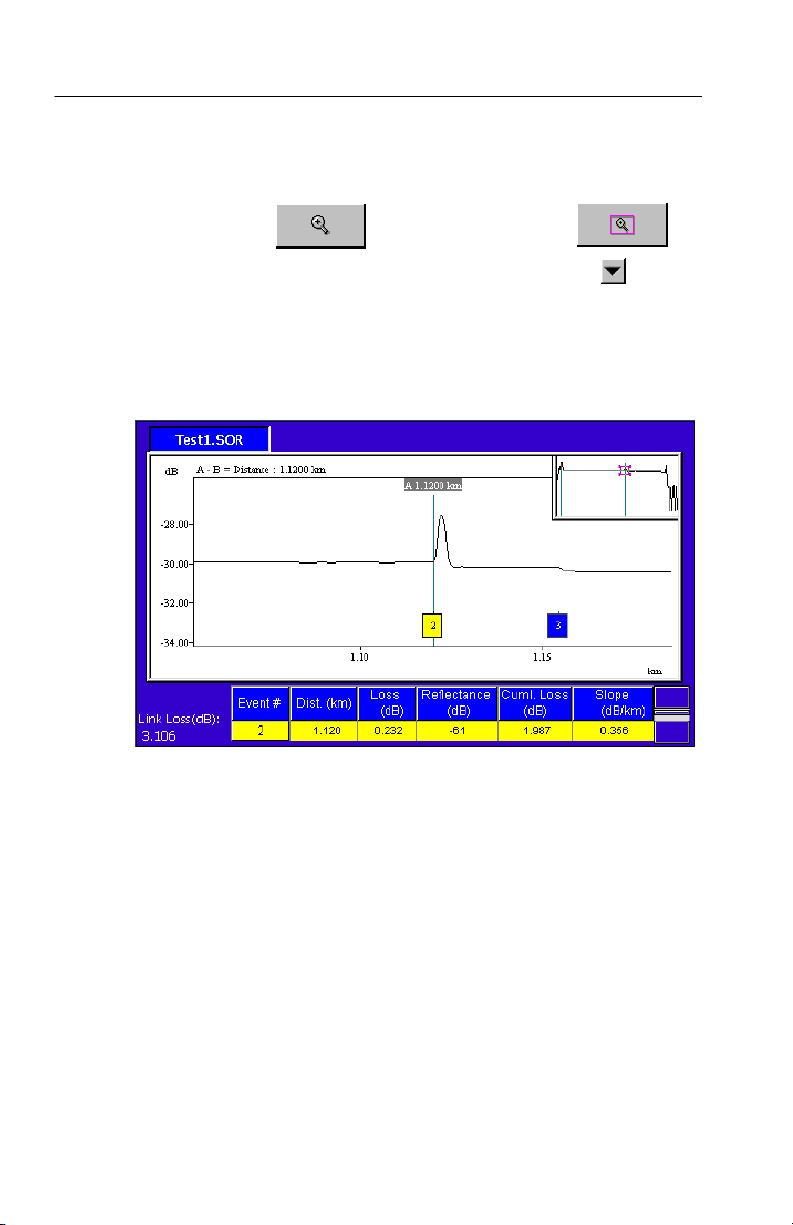
5. Starting with the second event, select each event in turn and
zoom in. Tap
adjust the size of the zoom box. Tap the down arrow,
times to maximize the appearance of small reflections and losses.
Event 2, shown in Figure 2--9, is an FC regular connector. It has
fairly large amounts of both loss and reflection.
Figure 2- 9: Event 2 is an FC regular connector
to zoom in, and then tap to
, several
2- 40
NetTek Analyzer OTDR Modules User Manual
Page 73

Examine the Test1.SOR, Test2.SOR, & Test--MM.SOR Files
Event 3, shown in Figure 2--10, is a fusion splice. It has a small
amount of loss and no significant reflectance.
Figure 2- 10: Event 3 is a fusion splice
NetTek Analyzer OTDR Modules User Manual
2- 41
Page 74

Examine the Test1.SOR, Test2.SOR, & Test--MM.SOR Files
Event 4, shown in Figure 2--11, is a mechanical splice. Like the
FC regular connector, it has large amounts of both loss and
reflection.
2- 42
Figure 2- 11: Event 4 is a mechanical splice
NetTek Analyzer OTDR Modules User Manual
Page 75

Examine the Test1.SOR, Test2.SOR, & Test--MM.SOR Files
Event 5, shown in Figure 2--12, is a bend. Like the fusion splice,
the bend has a very small amount of loss and no significant
reflectance.
On singlemode fiber, testing with multiple wavelengths is a good
way to tell if an event is a bend. In contrast to fusion and
mechanical splices, the slope and loss values of a bend will differ
depending on the wavelength you use for testing.
Figure 2- 12: Event 5 is a bend
NetTek Analyzer OTDR Modules User Manual
2- 43
Page 76

Examine the Test1.SOR, Test2.SOR, & Test--MM.SOR Files
Event 6, shown in Figure 2--13, is another fusion splice like
Event 3. It has a large amount of loss but no reflectance.
Figure 2- 13: Event 6 is a fusion splice
2- 44
NetTek Analyzer OTDR Modules User Manual
Page 77

Examine the Test1.SOR, Test2.SOR, & Test--MM.SOR Files
Event 7, shown in Figure 2--14, is the end of the fiber. Notice that
it has large values for both loss and reflectance. The trace power
level drops off into noise at the end of the fiber.
Figure 2- 14: Event 7 is the end of the fiber
NetTek Analyzer OTDR Modules User Manual
2- 45
Page 78

Examine the Test1.SOR, Test2.SOR, & Test--MM.SOR Files
6. Open Test2.SOR from Internal Memory. (Select File > Open,
then Look in: Internal Memory, and double-tap Test2.SOR.)
7. Look at the 16 events. You will see something similar to
Figure 2--15.
In the sample file, Test2.SOR, events 1 and 16 represent the
beginning and ending of the fiber, respectively. All the other
events are fusion splices except event 7, which is an angle-polished splice. Usually angle-polished splices have no reflectance.
In this case, however, the ends are worn. This damage accounts
for the large amount of reflectance you see in Figure 2--15.
You can switch to Event Table Only view and scroll to the right
to view a description of each event in the Event Notes column.
2- 46
Figure 2- 15: Sample file test2.SOR shows a worn angle-polished
connector (Event 5) and several fusion splices
NetTek Analyzer OTDR Modules User Manual
Page 79

Examine the Test1.SOR, Test2.SOR, & Test--MM.SOR Files
8. Open Test-- MM.SOR from Internal Memory. (Select File >
Open, then Look in: Internal Memory, and double-tap
Test--MM.SOR.)
9. Look at the 10 events. You will see something similar to
Figure 2--16.
Figure 2- 16: Sample file Test- MM.SOR shows several types of events
on a multimode fiber
NetTek Analyzer OTDR Modules User Manual
2- 47
Page 80

Examine the Test1.SOR, Test2.SOR, & Test--MM.SOR Files
10. Switch to Event Table Only view and scroll to the right to view a
description of each event in the Event Notes column. You will
see something similar to Figure 2 --17.
2- 48
Figure 2- 17: Look at the event notes in the event table of sample file
Test- MM.SOR
NetTek Analyzer OTDR Modules User Manual
Page 81

Examine the Test1.SOR, Test2.SOR, & Test--MM.SOR Files
11. Select View > Split Trace and Event Table and zoom in on
events 1 and 2.
Events 1 and 2 are grouped (marked “g”) due to the short
distance between them. Event 1 is the connector on the OTDR.
Event 2 is a jumper cable.
Often a jumper cable is used to connect the OTDR to the system
patch panel. If the cable is short (it is 4 meters in this example),
the loss measurement will be grouped with the front panel loss.
Figure 2- 18: Event 1 (the front panel) and Event 2 (a jumper cable) are
grouped due to the short distance between them
NetTek Analyzer OTDR Modules User Manual
2- 49
Page 82

Examine the Test1.SOR, Test2.SOR, & Test--MM.SOR Files
12. Look at events 3 and 4 shown in Figure 2--19.
Event 3 is an echo from Event 1, the front panel.
Event 4 is an echo from Event 2, the jumper cable.
2- 50
Figure 2- 19: Events 3 and 4 are echoes of 1 and 2 and are grouped with
each other
NetTek Analyzer OTDR Modules User Manual
Page 83

Examine the Test1.SOR, Test2.SOR, & Test--MM.SOR Files
13. Look at Events 5 and 6 shown in Figure 2--20.
Event 5 is a patch panel connector with higher than normal loss.
Event 6 is a patch panel connector with low loss.
Figure 2- 20: Event 5 (high loss) and Event 6 (low loss) are both patch
panel connectors
NetTek Analyzer OTDR Modules User Manual
2- 51
Page 84

Examine the Test1.SOR, Test2.SOR, & Test--MM.SOR Files
14. Look at Event 7 shown in Figure 2--21.
Event 7 is a good (low loss) fusion splice. Note that there is no
reflection peak as with connectors. Fusion splices and bends have
losses without reflections.
2- 52
Figure 2- 21: Event 7 is a good (low loss) fusion splice
NetTek Analyzer OTDR Modules User Manual
Page 85

Examine the Test1.SOR, Test2.SOR, & Test--MM.SOR Files
15. Look at events 8, 9, and 10.
Event 8 is a pigtail fusion splice. Sometimes, instead of installing
a connector on the fiber, a pigtailed connector is spliced onto the
system. A pigtail is a jumper cable with a factory installed
connector on a section of fiber. This section of fiber is fusion
spliced onto the system as a way of installing the connector.
Event 8 is the pigtail fusion splice that goes with the connector at
Event 9. Note that you can see the fusion splice before the
connector, but it is less likely to see a fusion splice after the large
reflection of the connector (Event 9).
Event 9 is a patch panel connector. It is grouped with the pigtail
splice at event 8 due to the short distance between the two events.
Event 10. This is the end of the fiber. If you look to the right of
it, you can see several more peaks. These are echoes of the end.
It is fairly common on multimode tests to have echoes after the
end of the fiber.
Figure 2- 22: Event 8 (the start of a pigtail), Event 9 (a patch panel
connector), and Event 10 (the end of the fiber)
NetTek Analyzer OTDR Modules User Manual
2- 53
Page 86

Examine the Test1.SOR, Test2.SOR, & Test--MM.SOR Files
2- 54
NetTek Analyzer OTDR Modules User Manual
Page 87

Reference
Page 88

Page 89

Taking Measurements
This section covers taking measurement menu measurements (see
below), comparing two traces in various ways (see page 3 --8), and
setting up automatic testing and saving of measurements (see
page 3--12).
To perform advanced measurements, choose a measurement from the
measurement menu.
These measurements are taken on one trace:
H Event Loss: Measures loss at a point on a fiber. See page 3--2.
H Two Point: Measures the loss, slope, and distance between two
points on a fiber. See page 3--4.
H Reflectance: Measures the loss due to light reflected by a
particular fiber feature, such as a connector or splice. See
page 3--6.
H ORL:(Optical Return Loss) Measures the reflected light from a
section of fiber or from the whole fiber. See page 3--7.
These measurements are taken on two traces in Dual Trace mode:
H Bidirectional Averages: Averages the events of two traces taken
from opposite ends of the same fiber. Some events may appear
differently depending on which end of the fiber you test. Use this
measurement for a more accurate representation of the fiber than
either trace alone can give. See page 3--9.
H Difference: Subtracts one trace from another. Use this measure-
ment to compare two similar trace files. See page 3--11.
NetTek Analyzer OTDR Modules User Manual
3- 1
Page 90

Taking Measurements
Performing Event Loss Measurements
Select Measurements > Event Loss....
Measures loss at a point on a fiber. The loss appears as a readout at
the top of the trace.
The events that you add are marked in the event table with an
asterisk (*).
Figure 3--1 shows an example of an event loss measurement.
3- 2
Figure 3- 1: Event Loss for Event 2
NetTek Analyzer OTDR Modules User Manual
Page 91

Taking Measurements
Event Loss Advanced Controls
Select Measurements > Event Loss... > Advanced Controls button.
Advanced Controls allow you to manually adjust the slope cursor
either to the Left or the Right of the event.
Select Reset to return the slope cursor angles to match the
backscatter slope.
Select Update Table to update the event table with your manually
adjusted loss data. Manually adjusted data in the event table are
marked with an asterisk (*).
NetTek Analyzer OTDR Modules User Manual
3- 3
Page 92

Taking Measurements
Performing Two Point Measurements
Select Measurements > Two Point....
Measure the loss, slope, and distance between two points on a fiber.
Be sure both cursors are on backscatter regions of the trace.
Look at the loss between two points on the trace:
1. Zoom in on the area of the trace.
2. Select Measurements > Two Point....
3. Drag a cursor or use the cursor buttons to place a cursor on
backscatter to the left of an area of interest on the trace.
4. Use the A/B cursor buttons to toggle the active cursor.
5. Place the second cursor on backscatter to the right of the area of
interest on the trace.
6. Look at the top line of the trace region for the readouts of
distance, two point loss, and slope between the two cursors.
3- 4
NetTek Analyzer OTDR Modules User Manual
Page 93

Taking Measurements
Two Point Loss Advanced Controls
Select Measurements > Two Point... > Advanced Controls button.
To manually adjust the cursors, select either Two Point Slope or LSA
Slope:
H Select Two Point Slope to measure the loss across a feature of
the fiber. In two-point slope calculations, the two-point loss is
divided by the two-point distance, using the data point at each
intersection between the loss cursors and the waveform. This
type of calculation is better if there are reflective events close to
the one you are trying to measure.
H Select LSA Slope to measure fiber loss on featureless sections of
backscatter. In LSA slope calculations, the data points on the
waveform between the distance cursors are used to determine the
best-fitting straight line using the least-squares average
algorithm. This type of calculation is better if the trace is noisy
and there are no reflective events close to the one you are trying
to measure.
Using the scroll bar to move the cursor vertically and the knob
buttons to rotate the cursor, match the angle and position of the
cursor to the slope and level of the backscatter.
Use the double arrow side of the knob to rotate the cursors by large
increments. Use the single arrow side of the knob to rotate the
cursors by small increments.
Select Reset to return the loss cursor position to match the
automatically determined level of the backscatter.
NetTek Analyzer OTDR Modules User Manual
3- 5
Page 94

Taking Measurements
Performing Reflectance Measurements
NOTE. Before performing reflectance measurements, be sure that the
backscatter coefficient setting is correct in the Test Settings tab.
Select Measurement > Reflectance....
Measure the reflectance at a point on a fiber, such as at a connector
or splice.
Place a cursor at the point of interest on the trace. The reflectance
from that point appears as a readout at the top of the trace region.
Reflectance Advanced Controls
Select Measurements > Reflectance... > Advanced Controls
button.
Advanced Controls allow you to manually adjust the slope cursor
either to the Left or the Right of the event.
Select Reset to return the slope cursor angles to match the
backscatter slope.
3- 6
Select Update Table to update the event table with your manually
adjusted reflectance data.
Manually adjusted data in the event table are marked with an
asterisk (*).
NetTek Analyzer OTDR Modules User Manual
Page 95

Performing ORL Measurements
NOTE. Before performing reflectance measurements, be sure that the
backscatter coefficient setting is correct in the Test Settings tab.
Select Measurements > ORL.
Optical Return Loss measures the reflected light from a section of
fiber or from the whole fiber. This measurement tells you how much
noise is on the fiber.
The ORL readout appears at the top of the trace region.
Taking Measurements
NetTek Analyzer OTDR Modules User Manual
3- 7
Page 96

Taking Measurements
Compare Two T races
There are several ways you can compare two traces:
Bidirectional Average Measurements
This measurement averages the events of two traces taken from
opposite ends of the same fiber. Use this measurement when you
need especially precise splice loss measurements. Select Measure-
ments > Bidirectional Averages. See page 3--9 for more
information.
Difference Measurements
This measurement subtracts one trace from another. Use this
measurement to compare two similar trace files. Select Measure-
ments > Difference. See page 3--11 for more information.
Dual Trace Mode
Use Dual Trace mode to view and compare two trace files within
one tab.
1. Open or acquire a trace.
3- 8
2. Select Dual Trace > Dual Trace On.
3. Open or acquire a second trace.
4. Select the tab of the trace data you want to be active. (The two
tabs above the trace region are each named for one of the traces.)
The event markers of the active trace are dark and the event
markers of the inactive trace are light. The event table shows the
events of the active trace data.
Select Dual Trace > Dual Trace Off to look at only one trace at a
time within the same tab. Select Dual Trace > Remove Tr ace 2 to
close the second tab. (When you have two trace files open, you
cannot take Real Time measurements.)
NetTek Analyzer OTDR Modules User Manual
Page 97

Taking Measurements
Performing Bidirectional Averages Measurement
Select Measurement > Bi-directional Averages.
Events may appear differently depending on which end of the fiber
you test. Take trace measurements from each end of a fiber, and then
use the Bidirectional Averages function to view the average losses of
the two trace files. The averaged event loss values yield a more
accurate representation of the fiber than either trace alone. This
measurement generates a third tab with a trace and event table
showing the averages of the two trace files.
Refer to Figure 3--2 for an example of a bidirectional averages
measurement.
Figure 3- 2: Bidirectional Averages traces
NetTek Analyzer OTDR Modules User Manual
3- 9
Page 98

Taking Measurements
1. Open or acquire a trace.
2. Select Measurement > Bi-directional Averages.
3. Open or acquire a second trace taken from the opposite end of the
fiber from step 1.
4. View and interpret the bidirectional averages trace and event
table data in the third tab.
NOTE. You cannot save the third tab as a file. Instead, save the
separate traces; you can regenerate the data at any time from the
saved trace files.
The Bidirectional Averages tab displays the two traces (taken
from both ends of the same fiber) and the average of the two
traces. The two traces are represented in opposite directions. The
end of one trace is the beginning of the other trace, and the two
traces meet in the middle.
The trace from the first tab will appear as usual, starting in the
upper left corner and sloping down to its end in the lower right
corner. The trace from the second tab looks like a superimposed
mirror image of the first. It starts in the upper right corner and
slopes down to its end in the lower left, and its events should line
up vertically with the events from the first trace.
3- 10
When the third tab is active, the event table shows the averages
of each event. If an event appears on one of the traces but not at
the corresponding distance on the other, “----” appears in the table
cell.
NetTek Analyzer OTDR Modules User Manual
Page 99

Performing Difference Measurements
Select Measurement > Difference.
NOTE. You must have two files open to create difference data.
You cannot save the third tab as a file, but you can regenerate the
data at any time from the saved trace files.
The Difference function subtracts the second trace from the first and
displays the results as a third trace. Look at the difference to
compare two similar trace files, such as traces taken on the same
fiber at different times, or traces taken on adjacent fibers in the same
cable. This measurement generates a third tab with a trace and event
table that show the difference between the two trace files. The
difference in the event loss values show you changes in the fiber
between the acquisitions or the differences between two adjacent
fibers.
The settings in the Trace 1 settings tab apply to both traces in
difference measurements.
Taking Measurements
To perform a difference measurement:
1. Open or acquire a trace.
2. Select Measurement > Difference.
3. Open or acquire a second trace.
4. Select the third tab to view the difference data.
The tabs above the trace region are labeled with the file name of the
trace data. Select the tab of the trace data you want to be active. The
event markers of the active trace are dark and the event markers of
the inactive trace are light. The event table shows the events of the
active trace data.
NetTek Analyzer OTDR Modules User Manual
3- 11
Page 100

Taking Measurements
Auto Test and Save Dialog Box
Select Auto Test and Save button.
Use this dialog box to automate taking and saving numerous, similar
tests. The auto test will use the test settings on the main screen.
3- 12
Next Fiber Number: Tells you what fiber number the OTDR will
assign to the next fiber it measures. Enter the fiber number you want
the OTDR to start with.
Back button. Decrements the Next Fiber Number.
Next File Name: Press the keyboard icon to access the Next File
Name dialog box (shown in part below) where you enter the first part
of the fiber name into the field.
NetTek Analyzer OTDR Modules User Manual
 Loading...