

Page 1

User Manual
MTS400 Series
MPEG Test Systems
Volume 1 of 2
071-1507-04
This document applies to firmware version 1.4
and above.
www.tektronix.com
Page 2

Copyright © Tektronix. All rights reserved. Licensed software products are owned by Tektronix or its subsidiaries or
suppliers, and are protected by national copyright laws and international treaty provisions.
Tektronix products are covered by U.S. and foreign patents, issued and pending. Information in this publication supercedes
that in all previously published material. Specifications and price change privileges reserved.
TEKTRONIX and TEK are registered trademarks of Tektronix, Inc.
Contacting Tektronix
Tektronix, Inc.
14200 SW Karl Braun Drive
P.O. Box 500
Beaverton, OR 97077
USA
For product information, sales, service, and technical support:
H In North America, call 1-800-833-9200.
H Worldwide, visit www.tektronix.com to find contacts in your area.
Page 3

Warranty 2
Tektronix warrants that this product will be free from defects in materials and workmanship for a period of one (1)
year from the date of shipment. If any such product proves defective during this warranty period, Tektronix, at its
option, either will repair the defective product without charge for parts and labor, or will provide a replacement in
exchange for the defective product. Parts, modules and replacement products used by Tektronix for warranty work
may be new or reconditioned to like new performance. All replaced parts, modules and products become the
property of Tektronix.
In order to obtain service under this warranty, Customer must notify Tektronix of the defect before the expiration
of the warranty period and make suitable arrangements for the performance of service. Customer shall be
responsible for packaging and shipping the defective product to the service center designated by Tektronix, with
shipping charges prepaid. Tektronix shall pay for the return of the product to Customer if the shipment is to a
location within the country in which the Tektronix service center is located. Customer shall be responsible for
paying all shipping charges, duties, taxes, and any other charges for products returned to any other locations.
This warranty shall not apply to any defect, failure or damage caused by improper use or improper or inadequate
maintenance and care. Tektronix shall not be obligated to furnish service under this warranty a) to repair damage
resulting from attempts by personnel other than Tektronix representatives to install, repair or service the product;
b) to repair damage resulting from improper use or connection to incompatible equipment; c) to repair any
damage or malfunction caused by the use of non-Tektronix supplies; or d) to service a product that has been
modified or integrated with other products when the effect of such modification or integration increases the time
or difficulty of servicing the product.
THIS WARRANTY IS GIVEN BY TEKTRONIX WITH RESPECT TO THE PRODUCT IN LIEU OF ANY
OTHER WARRANTIES, EXPRESS OR IMPLIED. TEKTRONIX AND ITS VENDORS DISCLAIM ANY
IMPLIED WARRANTIES OF MERCHANTABILITY OR FITNESS FOR A PARTICULAR PURPOSE.
TEKTRONIX’ RESPONSIBILITY TO REPAIR OR REPLACE DEFECTIVE PRODUCTS IS THE SOLE AND
EXCLUSIVE REMEDY PROVIDED TO THE CUSTOMER FOR BREACH OF THIS WARRANTY.
TEKTRONIX AND ITS VENDORS WILL NOT BE LIABLE FOR ANY INDIRECT, SPECIAL, INCIDENTAL,
OR CONSEQUENTIAL DAMAGES IRRESPECTIVE OF WHETHER TEKTRONIX OR THE VENDOR HAS
ADVANCE NOTICE OF THE POSSIBILITY OF SUCH DAMAGES.
Page 4

Warranty 9(b)
Tektronix warrants that the media on which this software product is furnished and the encoding of the programs on
the media will be free from defects in materials and workmanship for a period of three (3) months from the date of
shipment. If any such medium or encoding proves defective during the warranty period, Tektronix will provide a
replacement in exchange for the defective medium. Except as to the media on which this software product is
furnished, this software product is provided “as is” without warranty of any kind, either express or implied.
Tektronix does not warrant that the functions contained in this software product will meet Customer’s
requirements or that the operation of the programs will be uninterrupted or error-free.
In order to obtain service under this warranty, Customer must notify Tektronix of the defect before the expiration
of the warranty period. If Tektronix is unable to provide a replacement that is free from defects in materials and
workmanship within a reasonable time thereafter, Customer may terminate the license for this software product
and return this software product and any associated materials for credit or refund.
THIS WARRANTY IS GIVEN BY TEKTRONIX WITH RESPECT TO THE PRODUCT IN LIEU OF ANY
OTHER WARRANTIES, EXPRESS OR IMPLIED. TEKTRONIX AND ITS VENDORS DISCLAIM ANY
IMPLIED WARRANTIES OF MERCHANTABILITY OR FITNESS FOR A PARTICULAR PURPOSE.
TEKTRONIX’ RESPONSIBILITY TO REPLACE DEFECTIVE MEDIA OR REFUND CUSTOMER’S
PAYMENT IS THE SOLE AND EXCLUSIVE REMEDY PROVIDED TO THE CUSTOMER FOR BREACH OF
THIS WARRANTY. TEKTRONIX AND ITS VENDORS WILL NOT BE LIABLE FOR ANY INDIRECT,
SPECIAL, INCIDENTAL, OR CONSEQUENTIAL DAMAGES IRRESPECTIVE OF WHETHER TEKTRONIX
OR THE VENDOR HAS ADVANCE NOTICE OF THE POSSIBILITY OF SUCH DAMAGES.
Page 5

Table of Contents
Volume 1
Volume 2
General Safety Summary iii
Service Safety Summary v
Preface vii
Related Material vii
Manual Conventions viii
Introduction 1
Transport Stream Compliance Analyzer 2
PES Analyzer 3
T-STD Buffer Analyzer 4
Elementary Stream Analyzer 5
Carousel Analyzer 6
Carousel Generator 7
Multiplexer 8
Transport Stream Editor 9
MPEG Player 10
Make Seamless Wizard 11
TS Cutter 12
Script Pad 13
MTS400 Series MPEG Test System User Manual
i
Page 6

Table of Contents
ii
MTS400 Series MPEG Test System User Manual
Page 7

General Safety Summary
Review the following safety precautions to avoid injury and prevent damage to
this product or any products connected to it.
To avoid potential hazards, use this product only as specified.
Only qualified personnel should perform service procedures.
To Avoid Fire or
Personal Injury
Use Proper Power Cord. Use only the power cord specified for this product and
certified for the country of use.
Ground the Product. This product is grounded through the grounding conductor
of the power cord. To avoid electric shock, the grounding conductor must be
connected to earth ground. Before making connections to the input or output
terminals of the product, ensure that the product is properly grounded.
Observe All Terminal Ratings. To avoid fire or shock hazard, observe all ratings
and markings on the product. Consult the product manual for further ratings
information before making connections to the product.
Power Disconnect. The power cord disconnects the product from the power
source. Do not block the power cord; it must remain accessible to the user at all
times.
Do Not Operate Without Covers. Do not operate this product with covers or panels
removed.
Do Not Operate With Suspected Failures. If you suspect there is damage to this
product, have it inspected by qualified service personnel.
Avoid Exposed Circuitry. Do not touch exposed connections and components
when power is present.
Use Proper Fuse. Use only the fuse type and rating specified for this product.
Do Not Operate in Wet/Damp Conditions.
Do Not Operate in an Explosive Atmosphere.
Keep Product Surfaces Clean and Dry.
Provide Proper Ventilation. Refer to the manual’s installation instructions for
details on installing the product so it has proper ventilation.
MTS400 Series MPEG Test System User Manual
iii
Page 8
General Safety Summary
Terms in this Manual
Symbols and Terms
on the Product
These terms may appear in this manual:
WARNING. Warning statements identify conditions or practices that could result
in injury or loss of life.
CAUTION. Caution statements identify conditions or practices that could result in
damage to this product or other property.
These terms may appear on the product:
H DANGER indicates an injury hazard immediately accessible as you read the
marking.
H WARNING indicates an injury hazard not immediately accessible as you
read the marking.
H CAUTION indicates a hazard to property including the product.
The following symbols may appear on the product:
CAUTION
Refer to Manual
Protective Ground
(Earth) Terminal
iv
MTS400 Series MPEG Test System User Manual
Page 9

Service Safety Summary
Only qualified personnel should perform service procedures. Read this Service
Safety Summary and the General Safety Summary before performing any service
procedures.
Do Not Service Alone. Do not perform internal service or adjustments of this
product unless another person capable of rendering first aid and resuscitation is
present.
Disconnect Power. To avoid electric shock, switch off the instrument power, then
disconnect the power cord from the mains power.
Use Care When Servicing With Power On. Dangerous voltages or currents may
exist in this product. Disconnect power, remove battery (if applicable), and
disconnect test leads before removing protective panels, soldering, or replacing
components.
To avoid electric shock, do not touch exposed connections.
Use only Tektronix approved components when servicing the unit.
MTS400 Series MPEG Test System User Manual
v
Page 10

Service Safety Summary
vi
MTS400 Series MPEG Test System User Manual
Page 11

Preface
Related Material
This manual describes the functions and use of the Tektronix MTS400 Series
MPEG Test System. After the introduction, each section of the manual describes
one of the software applications or tools that make up the MTS400 Series
system.
Other documents are available on the Tektronix Web site (www.tektronix.com):
H MTS400 Series MPEG Test System Getting Started Manual (071-1505-xx).
H MTS400 Series MPEG Test System Programmer Manual (071-1725-xx).
This manual specifies the remote control and status monitoring interfaces
available to a management application.
Additional documentation, such as Read Me files, may be included on the
installation disks.
The following URLs access the Web sites for the standards organizations listed
(the URLs listed were valid at the time of writing):
H MPEG-2 standards (International Organization for Standards)
http://www.iso.ch/
H DVB standards (European Technical Standards Institute)
http://www.etsi.org/
H ATSC standards (Advanced Television Systems Committee)
http://www.atsc.org/
H ISDB/ARIB standards (Association of Radio Industries and Businesses)
http://www.arib.or.jp/english/
H SCTE Society of Cable Television Engineers
http://www.scte.org/
MTS400 Series MPEG Test System User Manual
vii
Page 12

Preface
Manual Conventions
Naming conventions for the interface elements are based on standard Microsoft
Windows naming conventions. Naming conventions for MPEG−2, ATSC, and
DVB structures follow the conventions derived from the standards listed above.
In addition, the following formatting conventions apply to this manual:
H Bold text refers to specific interface elements that you are instructed to
select, click, or clear.
Example: Select Settings from the Configuration menu.
H Mono−spaced text can indicate the following:
H Text you enter from a keyboard
Example: Enter the network identity (
H Characters you press on your keyboard
Example: Press CTRL+C to copy the selected text.
H Paths to components on your hard drive
Example: The program files are installed at the following location:
C:\Program Files\Tektronix\
http://TSMonitor01)
viii
MTS400 Series MPEG Test System User Manual
Page 13

Introduction
Page 14

Page 15
Introduction
Table 1−1 summarizes the software applications that make up the MTS400
Series MPEG Test Systems. Options are enabled by a software key; not all
options may be enabled. Detailed descriptions of all applications can be found in
the remainder of this manual.
See also the MTS400 Series MPEG Test Systems Getting Started manual
(071-1507-xx).
The MTS4EA Compressed Video ES Analyzer options are described in the
MTS4EA User Manual (071-1641-xx).
(The applications are shown in the same order that they appear in the Windows
Start menu.)
Table 1−1: MTS430 / MTS400 / MTS4SA / MTS4UP / MTX100B Installed
Applications
Desktop Icon
Application
Analyzers
(where installaed)
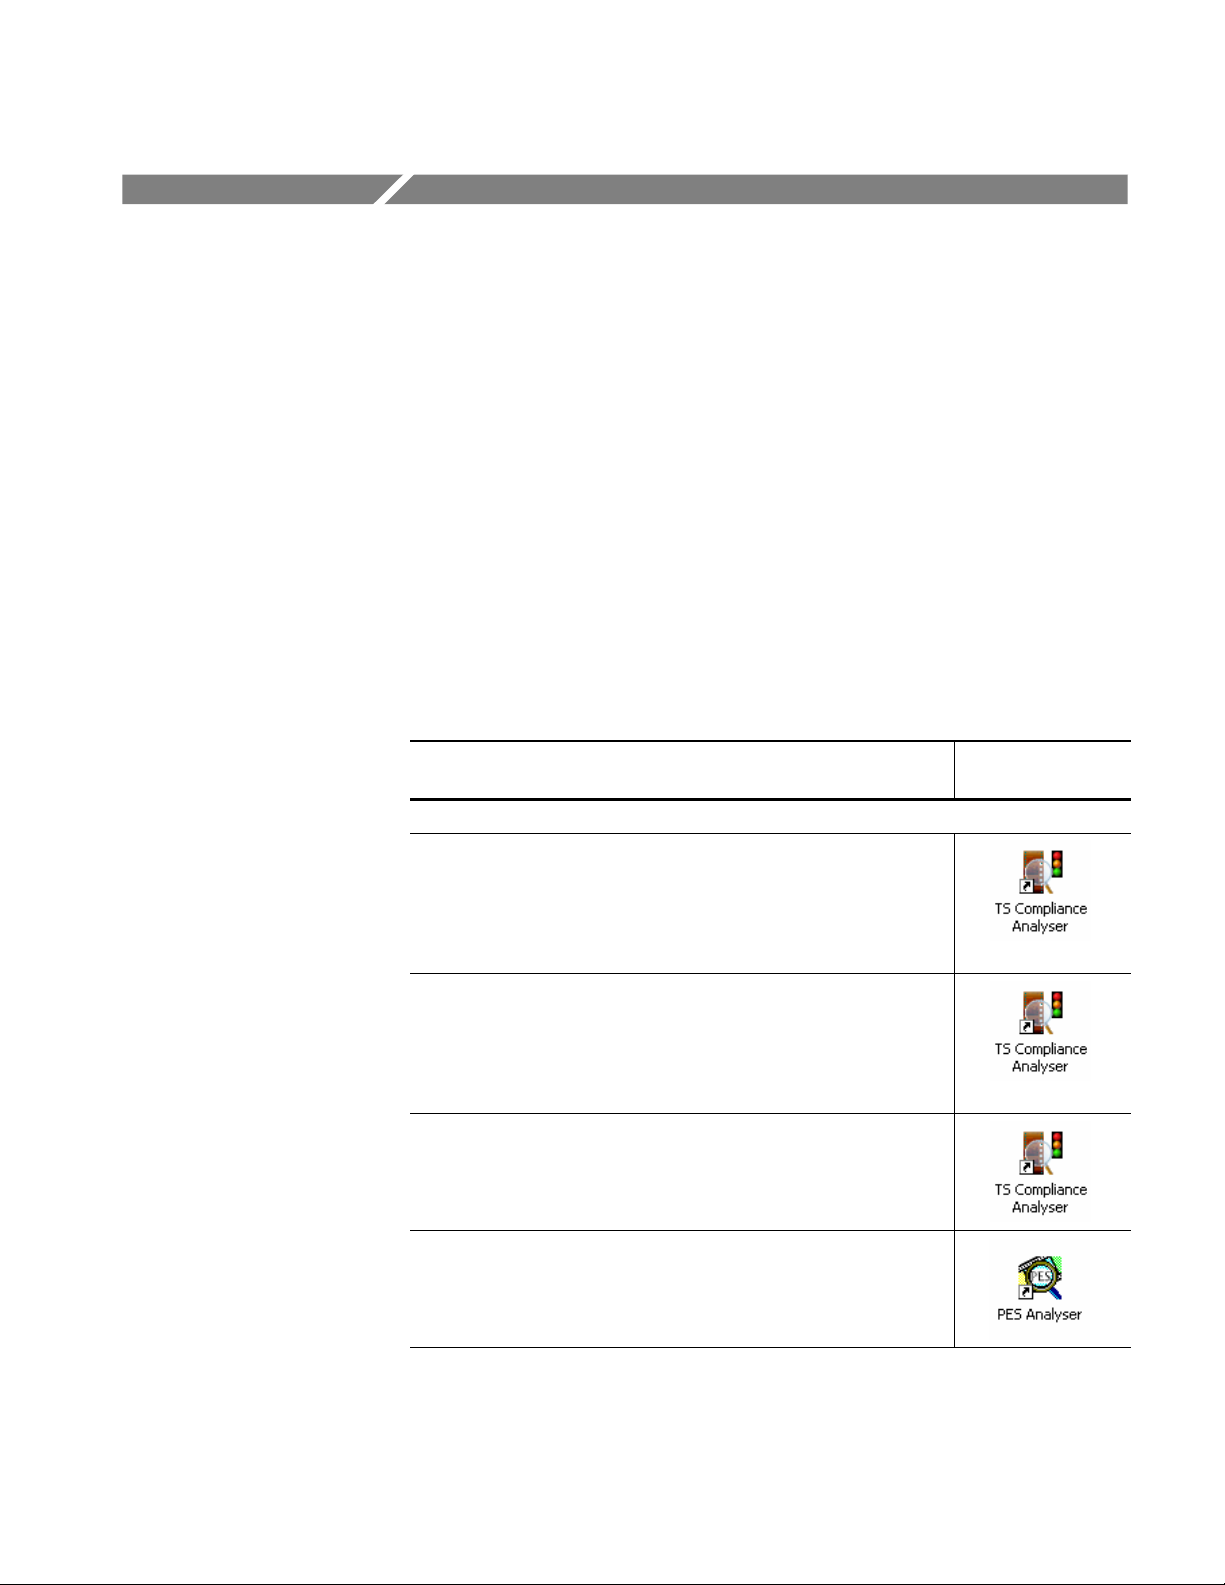
Transport Stream Compliance Analyzer (TSCA) - Real Time
Real-time transport stream analysis with user-selectable MPEG-2, DVB,
ATSC and ISDB conformance tests. Shows transport structure, header
contents, hexadecimal packet contents, PCR timing /transport rate
graphs and error message logs.
Transport Stream Compliance Analyzer (TSCA) - Deferred
D.eferred transport stream analysis with user-selectable MPEG-2, DVB,
ATSC and ISDB conformance tests. Shows transport structure, header
contents, hexadecimal packet contents, PCR timing /transport rate
graphs and error message logs.
Transport Stream Compliance Analyzer Lite (TSCA) - Deferred
Same as for the TS Analyzer except that the file size of transport
streams to be analyzed is limited to 192 MB.
Packetized Elementary Stream (PES) Analyzer
PES analysis with selectable test options. Shows PES program
structure, header contents, packet contents, PTS/DTS timing graphs
and analysis reports.
MTS400 Series MPEG Test System User Manual
1−1
Page 16
Introduction
Table 1−1: MTS430 / MTS400 / MTS4SA / MTS4UP / MTX100B Installed
Applications (Cont.)
Desktop Icon
Application
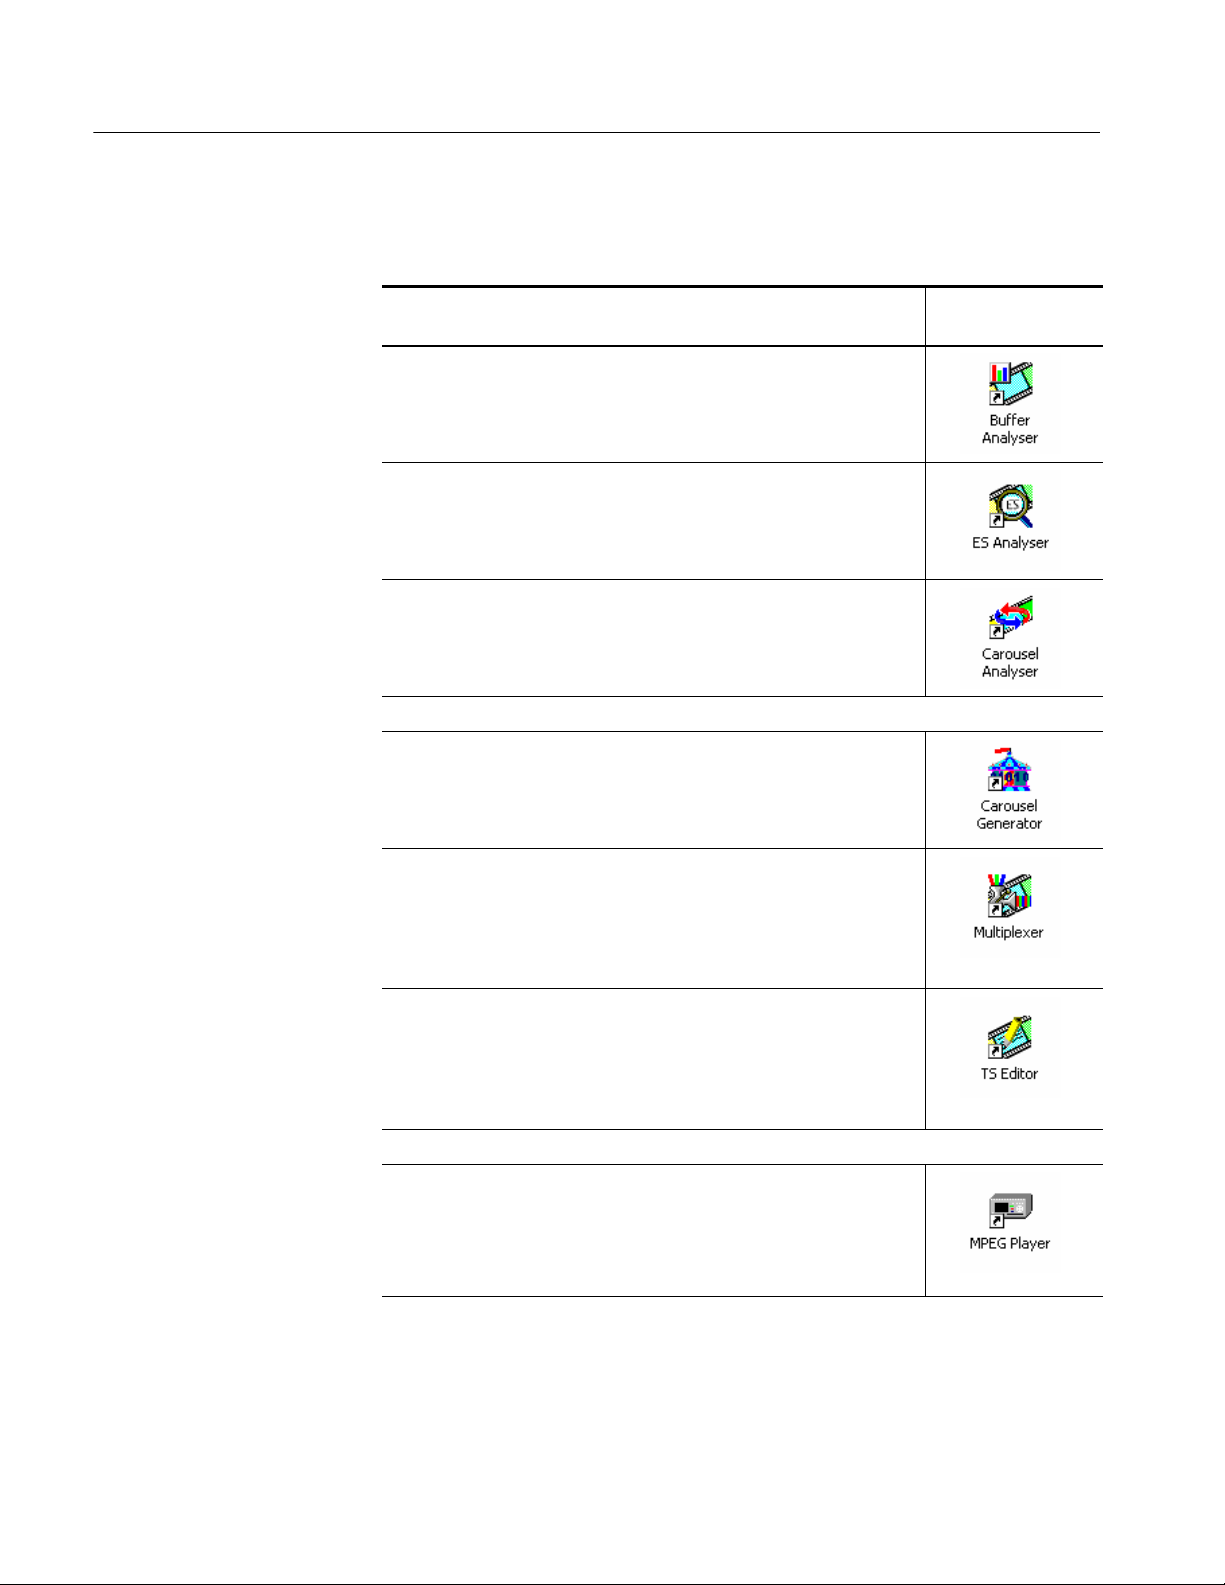
Transport Stream - System Target Decoder (T-STD) Buffer Analyzer
Analyzes program streams modeling their behavior in, and their
conformance to, the MPEG 2 T STD Buffer Model.
Elementary Stream Analyzer
Elementary Stream analysis at video picture and audio level. This
includes vector graphs and macroblock picture quality.
Carousel Analyzer
Data analysis showing structure, bit rate, repetition rate, syntax and
semantics of data items.
(where installaed)
Generators
Carousel Generator
Provides in-depth off-line generation of MPEG-2, DVB transport
streams containing a range of data broadcast protocols.
Multiplexer
Multiplexes table information and packetized elementary streams
together to synthesize new transport streams. A fine level of control is
provided to allow non-conformances and test cases to be specified for
new transport streams.
TS Editor
Viewing and Editing of transport stream packets, using a hexadecimal
view of the packet contents and semantic interpretation of the header.
Provides facilities to remap PIDs, recalculate PCR values, and
introduce PCR inaccuracies.
Players
MPEG Player
Records and Plays out MPEG-2 streams.
(The MTX100B MPEG Player and Recorder is described in the
MTX100B User Manual, Tektronix part number 071-1927-xx.)
1−2
MTS400 Series MPEG Test System User Manual
Page 17

Table 1−1: MTS430 / MTS400 / MTS4SA / MTS4UP / MTX100B Installed
Applications (Cont.)
Desktop Icon
Application
Utilities
Make Seamless Wizard
Guides the user through the process of creating an MPEG-2 file for use
by Stream Player in continuously looped operation.
Stream Cutter
Extracts sections of MPEG-2 files to new files.
Script Pad
Enables users to create and modify System Information (SI) scripts.
(where installaed)
Introduction
MTS400 Series MPEG Test System User Manual
1−3
Page 18

Introduction
1−4
MTS400 Series MPEG Test System User Manual
Page 19

Transport Stream
Compliance Analyzer
Page 20

Page 21

Table of Contents
Transport Stream Compliance Analyzer - Getting Started 2−1. . . . . . . .
TSCA Features 2−2. . . . . . . . . . . . . . . . . . . . . . . . . . . . . . . . . . . . . . . . . . . . . . . . . .
Deferred and Real-Time Modes 2−2. . . . . . . . . . . . . . . . . . . . . . . . . . . . . . . . . . . . .
Technical Background 2−3. . . . . . . . . . . . . . . . . . . . . . . . . . . . . . . . . . . . . . . . . . . .
User Interface 2−3. . . . . . . . . . . . . . . . . . . . . . . . . . . . . . . . . . . . . . . . . . . . . . . . . . .
CaptureVu Feature 2−5. . . . . . . . . . . . . . . . . . . . . . . . . . . . . . . . . . . . . . . . . . . . . . .
Triggered Recording 2−5. . . . . . . . . . . . . . . . . . . . . . . . . . . . . . . . . . . . . . . . . . . . . .
Starting the TSCA Software 2−6. . . . . . . . . . . . . . . . . . . . . . . . . . . . . . . . . . . . . . . .
Setting Up the IP Interface 2−13. . . . . . . . . . . . . . . . . . . . . . . . . . . . . . . . . . . . . . . . .
Setting the Stream Content Font 2−18. . . . . . . . . . . . . . . . . . . . . . . . . . . . . . . . . . . .
Understanding the Analyzer Window 2−21. . . . . . . . . . . . . . . . . . . . . . . . .
TSCA Window Components 2−22. . . . . . . . . . . . . . . . . . . . . . . . . . . . . . . . . . . . . . .
Error Status LEDs 2−26. . . . . . . . . . . . . . . . . . . . . . . . . . . . . . . . . . . . . . . . . . . . . . . .
Shortcut Menus 2−27. . . . . . . . . . . . . . . . . . . . . . . . . . . . . . . . . . . . . . . . . . . . . . . . . .
Using the Program View 2−29. . . . . . . . . . . . . . . . . . . . . . . . . . . . . . . . . . . .
Program Navigation - Transport Stream Node 2−31. . . . . . . . . . . . . . . . . . . . . . . . .
Program Navigation - Program Nodes 2−37. . . . . . . . . . . . . . . . . . . . . . . . . . . . . . . .
Program Navigation - Elementary Stream Node 2−39. . . . . . . . . . . . . . . . . . . . . . . .
Using the Tests View 2−43. . . . . . . . . . . . . . . . . . . . . . . . . . . . . . . . . . . . . . .
Tests Navigation - All Tests 2−47. . . . . . . . . . . . . . . . . . . . . . . . . . . . . . . . . . . . . . . .
Test Navigation - Test Nodes 2−48. . . . . . . . . . . . . . . . . . . . . . . . . . . . . . . . . . . . . . .
Test Navigation - PID Nodes 2−49. . . . . . . . . . . . . . . . . . . . . . . . . . . . . . . . . . . . . . .
Using the Tables View 2−51. . . . . . . . . . . . . . . . . . . . . . . . . . . . . . . . . . . . . .
Table Summary Pane 2−52. . . . . . . . . . . . . . . . . . . . . . . . . . . . . . . . . . . . . . . . . . . . .
Tables Detail View - Section View 2−53. . . . . . . . . . . . . . . . . . . . . . . . . . . . . . . . . . .
Tables Detail View - SI Repetition Graphs 2−55. . . . . . . . . . . . . . . . . . . . . . . . . . . .
Using the PID View 2−57. . . . . . . . . . . . . . . . . . . . . . . . . . . . . . . . . . . . . . . .
PID View - All PIDs 2−58. . . . . . . . . . . . . . . . . . . . . . . . . . . . . . . . . . . . . . . . . . . . . .
PID View - Detail View (All PID and PID Group) 2−59. . . . . . . . . . . . . . . . . . . . . .
PID View - Detail View (PIDs) 2−60. . . . . . . . . . . . . . . . . . . . . . . . . . . . . . . . . . . . .
Using the Packets View 2−63. . . . . . . . . . . . . . . . . . . . . . . . . . . . . . . . . . . . .
Packet Navigation Bar 2−64. . . . . . . . . . . . . . . . . . . . . . . . . . . . . . . . . . . . . . . . . . . .
Packet Navigation - Filter Nodes 2−65. . . . . . . . . . . . . . . . . . . . . . . . . . . . . . . . . . . .
Packet Detail View 2−66. . . . . . . . . . . . . . . . . . . . . . . . . . . . . . . . . . . . . . . . . . . . . . .
Using the Interface View 2−69. . . . . . . . . . . . . . . . . . . . . . . . . . . . . . . . . . . .
Detail View Tabs 2−70. . . . . . . . . . . . . . . . . . . . . . . . . . . . . . . . . . . . . . . . . . . . . . . .
Readings and Controls 2−70. . . . . . . . . . . . . . . . . . . . . . . . . . . . . . . . . . . . . . . . . . . .
RF Interface Card Overview 2−71. . . . . . . . . . . . . . . . . . . . . . . . . . . . . . . . . . . . . . .
RF Interface View Screens 2−74. . . . . . . . . . . . . . . . . . . . . . . . . . . . . . . . . . . . . . . . .
Common User Interface Concepts 2−85. . . . . . . . . . . . . . . . . . . . . . . . . . . .
Windows Management 2−86. . . . . . . . . . . . . . . . . . . . . . . . . . . . . . . . . . . . . . . . . . . .
Icons 2−87. . . . . . . . . . . . . . . . . . . . . . . . . . . . . . . . . . . . . . . . . . . . . . . . . . . . . . . . . .
Graph Management 2−91. . . . . . . . . . . . . . . . . . . . . . . . . . . . . . . . . . . . . . . . . . . . . .
Timing Graphs 2−97. . . . . . . . . . . . . . . . . . . . . . . . . . . . . . . . . . . . . . . . . . . . . . . . . .
Bit Rate Graphs 2−101. . . . . . . . . . . . . . . . . . . . . . . . . . . . . . . . . . . . . . . . . . . . . . . . .
MTS400 Series MPEG Test System User Manual
i
Page 22

Table of Contents
PIT Graph 2−101. . . . . . . . . . . . . . . . . . . . . . . . . . . . . . . . . . . . . . . . . . . . . . . . . . . . . .
Now Playing Views 2−102. . . . . . . . . . . . . . . . . . . . . . . . . . . . . . . . . . . . . . . . . . . . . .
Parameter Edit 2−104. . . . . . . . . . . . . . . . . . . . . . . . . . . . . . . . . . . . . . . . . . . . . . . . . .
Event Log 2−107. . . . . . . . . . . . . . . . . . . . . . . . . . . . . . . . . . . . . . . . . . . . . . . . . . . . . .
Bit Rates 2−111. . . . . . . . . . . . . . . . . . . . . . . . . . . . . . . . . . . . . . . . . . . . . . . . . . . . . . .
EPG View 2−11 5. . . . . . . . . . . . . . . . . . . . . . . . . . . . . . . . . . . . . . . . . . . . . . . . . . . . . .
MPE Views 2−11 9. . . . . . . . . . . . . . . . . . . . . . . . . . . . . . . . . . . . . . . . . . . . . . . . . . . . .
CaptureVu Feature 2−120. . . . . . . . . . . . . . . . . . . . . . . . . . . . . . . . . . . . . . . . . . . . . . .
Triggered Recording 2−126. . . . . . . . . . . . . . . . . . . . . . . . . . . . . . . . . . . . . . . . . . . . . .
Menu Bar and Options 2−130. . . . . . . . . . . . . . . . . . . . . . . . . . . . . . . . . . . . . . . . . . . .
Preferences 2−133. . . . . . . . . . . . . . . . . . . . . . . . . . . . . . . . . . . . . . . . . . . . . . . . . . . . .
Script Files 2−135. . . . . . . . . . . . . . . . . . . . . . . . . . . . . . . . . . . . . . . . . . . . . . . . . . . . .
Task Examples 2−141. . . . . . . . . . . . . . . . . . . . . . . . . . . . . . . . . . . . . . . . . . . .
Which tests have failed in an analyzed stream? 2−142. . . . . . . . . . . . . . . . . . . . . . . .
How many PIDs are there in a stream?
How many PIDs are referenced?
How many are unreferenced? 2−145. . . . . . . . . . . . . . . . . . . . . . . . . . . . . . . . . . .
What tests have been applied to a program PID? 2−146. . . . . . . . . . . . . . . . . . . . . . .
Establish the stream type of a PID 2−147. . . . . . . . . . . . . . . . . . . . . . . . . . . . . . . . . . .
How many programs are there in the stream? 2−148. . . . . . . . . . . . . . . . . . . . . . . . . .
What are the contents of the programs?
And what PIDs are they on? 2−149. . . . . . . . . . . . . . . . . . . . . . . . . . . . . . . . . . . .
What is the bit rate of each PID in a program? 2−150. . . . . . . . . . . . . . . . . . . . . . . . .
What is the latest version number
of the Program Association Table (PAT) in the SI? 2−153. . . . . . . . . . . . . . . . . .
Examine a Transport Packet 2−154. . . . . . . . . . . . . . . . . . . . . . . . . . . . . . . . . . . . . . . .
SI/PSI Nodes 2−157. . . . . . . . . . . . . . . . . . . . . . . . . . . . . . . . . . . . . . . . . . . . . .
ii
MTS400 Series MPEG Test System User Manual
Page 23

List of Figures
Table of Contents
Figure 2−1: TSCA Program view - Deferred analysis 2−1. . . . . . . . . . . .
Figure 2−2: TSCA Start-up 2−6. . . . . . . . . . . . . . . . . . . . . . . . . . . . . . . . . .
Figure 2−3: Stream Interpretation dialog box 2−7. . . . . . . . . . . . . . . . . .
Figure 2−4: TSCA File Analysis (Offline) dialog box 2−9. . . . . . . . . . . . .
Figure 2−5: TSCA Real-time Analysis dialog box 2−11. . . . . . . . . . . . . . .
Figure 2−6: TSCA window showing analysis progress 2−12. . . . . . . . . . .
Figure 2−7: Setting up the IP interface 2−13. . . . . . . . . . . . . . . . . . . . . . . .
Figure 2−8: UDP flow selection dialog box 2−15. . . . . . . . . . . . . . . . . . . . .
Figure 2−9: Selecting a display font from the Preferences dialog box 2−18
Figure 2−10: Analyzer window 2−21. . . . . . . . . . . . . . . . . . . . . . . . . . . . . . .
Figure 2−11: Analyzer window - no file 2−25. . . . . . . . . . . . . . . . . . . . . . . .
Figure 2−12: Shortcut menu (example) 2−27. . . . . . . . . . . . . . . . . . . . . . . .
Figure 2−13: Program view 2−29. . . . . . . . . . . . . . . . . . . . . . . . . . . . . . . . . .
Figure 2−14: Program view nodes 2−30. . . . . . . . . . . . . . . . . . . . . . . . . . . .
Figure 2−15: Bit rate values display 2−34. . . . . . . . . . . . . . . . . . . . . . . . . . .
Figure 2−16: Event log 2−35. . . . . . . . . . . . . . . . . . . . . . . . . . . . . . . . . . . . . .
Figure 2−17: PCR Graphs view 2−40. . . . . . . . . . . . . . . . . . . . . . . . . . . . . .
Figure 2−18: Tests Navigation view 2−43. . . . . . . . . . . . . . . . . . . . . . . . . . .
Figure 2−19: Test view nodes 2−44. . . . . . . . . . . . . . . . . . . . . . . . . . . . . . . .
Figure 2−20: Test filtering buttons 2−46. . . . . . . . . . . . . . . . . . . . . . . . . . . .
Figure 2−21: Test Failures screen 2−47. . . . . . . . . . . . . . . . . . . . . . . . . . . . .
Figure 2−22: Tables view 2−51. . . . . . . . . . . . . . . . . . . . . . . . . . . . . . . . . . . .
Figure 2−23: Tables view - Programs (example) 2−52. . . . . . . . . . . . . . . . .
Figure 2−24: Section payload 2−54. . . . . . . . . . . . . . . . . . . . . . . . . . . . . . . .
Figure 2−25: PID Summary view 2−59. . . . . . . . . . . . . . . . . . . . . . . . . . . . .
Figure 2−26: PID Information view 2−60. . . . . . . . . . . . . . . . . . . . . . . . . . .
Figure 2−27: Packet view - ISDB detail -IIP 2−67. . . . . . . . . . . . . . . . . . . .
Figure 2−28: Packet view - ISDB detail - Transport packet 2−68. . . . . . .
Figure 2−29: Interface View - Example 2−69. . . . . . . . . . . . . . . . . . . . . . . .
Figure 2−30: Open Transport Stream dialog box 2−72. . . . . . . . . . . . . . . .
Figure 2−31: RF Firmware update 2−73. . . . . . . . . . . . . . . . . . . . . . . . . . . .
Figure 2−32: Interface View - RF - QAM (Annex B) 2−74. . . . . . . . . . . . .
Figure 2−33: Interface View - RF - COFDM 2−77. . . . . . . . . . . . . . . . . . . .
Figure 2−34: Interface View - RF - 8VSB 2−80. . . . . . . . . . . . . . . . . . . . . .
Figure 2−35: Interface View - RF - QPSK/8PSK 2−82. . . . . . . . . . . . . . . .
MTS400 Series MPEG Test System User Manual
iii
Page 24

Table of Contents
Figure 2−36: Window size adjustments 2−87. . . . . . . . . . . . . . . . . . . . . . . .
Figure 2−37: Timing graphs 2−92. . . . . . . . . . . . . . . . . . . . . . . . . . . . . . . . .
Figure 2−38: Graphs - cursor 2−93. . . . . . . . . . . . . . . . . . . . . . . . . . . . . . . .
Figure 2−39: Graph toolbar 2−94. . . . . . . . . . . . . . . . . . . . . . . . . . . . . . . . .
Figure 2−40: Graph Shortcut menu 2−95. . . . . . . . . . . . . . . . . . . . . . . . . . .
Figure 2−41: Out of range indicator 2−96. . . . . . . . . . . . . . . . . . . . . . . . . .
Figure 2−42: PCR Drift/Jitter Demarcation Filters dialog box 2−99. . . . .
Figure 2−43: PCR parameters - Filter settings 2−100. . . . . . . . . . . . . . . . . .
Figure 2−44: Bit rate graph 2−101. . . . . . . . . . . . . . . . . . . . . . . . . . . . . . . . .
Figure 2−45: Now Playing - Thumbnail view 2−102. . . . . . . . . . . . . . . . . . .
Figure 2−46: Now Playing - Summary view 2−103. . . . . . . . . . . . . . . . . . . .
Figure 2−47: Now Playing - Detail view 2−103. . . . . . . . . . . . . . . . . . . . . . . .
Figure 2−48: Test parameters 2−104. . . . . . . . . . . . . . . . . . . . . . . . . . . . . . . .
Figure 2−49: PID test parameters 2−105. . . . . . . . . . . . . . . . . . . . . . . . . . . .
Figure 2−50: Parameter value - default icon 2−106. . . . . . . . . . . . . . . . . . . .
Figure 2−51: Event log - color coding 2−109. . . . . . . . . . . . . . . . . . . . . . . . .
Figure 2−
Figure 2−53: Event log - color dialog boxes 2−11 0. . . . . . . . . . . . . . . . . . . .
Figure 2−54: Bit Rate display selection 2−11 1. . . . . . . . . . . . . . . . . . . . . . . .
Figure 2−55: Bar chart 2−11 2. . . . . . . . . . . . . . . . . . . . . . . . . . . . . . . . . . . . .
Figure 2−56: Pie chart 2−11 4. . . . . . . . . . . . . . . . . . . . . . . . . . . . . . . . . . . . . .
Figure 2−57: EPG Summary view 2−11 6. . . . . . . . . . . . . . . . . . . . . . . . . . . .
Figure 2−58: EPG nodes 2−11 7. . . . . . . . . . . . . . . . . . . . . . . . . . . . . . . . . . . .
Figure 2−59: MPE view 2−11 9. . . . . . . . . . . . . . . . . . . . . . . . . . . . . . . . . . . . .
Figure 2−60: CaptureVu breakpoint - Test view 2−123. . . . . . . . . . . . . . . . .
Figure 2−61: CaptureVu breakpoint - Packet view 2−124. . . . . . . . . . . . . .
Figure 2−62: Record Settings dialog box 2−126. . . . . . . . . . . . . . . . . . . . . . .
Figure 2−63: Record Settings dialog box - Armed state 2−129. . . . . . . . . . .
Figure 2−64: Preferences - General 2−133. . . . . . . . . . . . . . . . . . . . . . . . . . .
Figure 2−65: Preferences - Font 2−134. . . . . . . . . . . . . . . . . . . . . . . . . . . . . .
Figure 2−66: Preferences - Decode 2−135. . . . . . . . . . . . . . . . . . . . . . . . . . . .
Figure 2−67: Stream Interpretation dialog box 2−136. . . . . . . . . . . . . . . . .
Figure 2−68: Failed tests - example 2−142. . . . . . . . . . . . . . . . . . . . . . . . . . .
Figure 2−69: Program count 2−148. . . . . . . . . . . . . . . . . . . . . . . . . . . . . . . . .
Figure 2−70: PID count 2−149. . . . . . . . . . . . . . . . . . . . . . . . . . . . . . . . . . . . .
Figure 2−71: Program PID bit rate - bar chart 2−150. . . . . . . . . . . . . . . . .
Figure 2−72: Program PID bit rate - pie chart 2−151. . . . . . . . . . . . . . . . . .
Figure 2−73: Bit rate graph 2−152. . . . . . . . . . . . . . . . . . . . . . . . . . . . . . . . .
52: Event log - shortcut menu - color 2−11 0. . . . . . . . . . . . . . . . .
iv
MTS400 Series MPEG Test System User Manual
Page 25

List of Tables
Table of Contents
Figure 2−74: Table Identity and Version (summary view) 2−153. . . . . . . . .
Figure 2−75: Table Identity and Version (section view) 2−154. . . . . . . . . . .
Figure 2−76: Primary SI/PSI nodes (DVB example) 2−157. . . . . . . . . . . . .
Table 2−1: Toolbar icons 2−22. . . . . . . . . . . . . . . . . . . . . . . . . . . . . . . . . . .
Table 2−2: Program view tabs 2−30. . . . . . . . . . . . . . . . . . . . . . . . . . . . . . .
Table 2−3: Object identification icons 2−88. . . . . . . . . . . . . . . . . . . . . . . .
Table 2−4: Interface management icons 2−89. . . . . . . . . . . . . . . . . . . . . . .
Table 2−5: Quick link icons 2−90. . . . . . . . . . . . . . . . . . . . . . . . . . . . . . . . .
Table 2−6: Timing measurement graphs 2−97. . . . . . . . . . . . . . . . . . . . . .
Table 2−7: PCR settling times 2−100. . . . . . . . . . . . . . . . . . . . . . . . . . . . . . .
Table 2−8: File menu options 2−130. . . . . . . . . . . . . . . . . . . . . . . . . . . . . . . .
Table 2−9: Navigation menu options 2−131. . . . . . . . . . . . . . . . . . . . . . . . . .
Table 2−10: Settings menu options 2−131. . . . . . . . . . . . . . . . . . . . . . . . . . .
Table 2−11: CaptureVu menu options 2−132. . . . . . . . . . . . . . . . . . . . . . . . .
Table 2−12: Record menu options 2−132. . . . . . . . . . . . . . . . . . . . . . . . . . . .
Table 2−13: Help menu options 2−133. . . . . . . . . . . . . . . . . . . . . . . . . . . . . .
Table 2−14: Bit rate views 2−150. . . . . . . . . . . . . . . . . . . . . . . . . . . . . . . . . .
Table 2−15: MPEG SI/PSI 2−158. . . . . . . . . . . . . . . . . . . . . . . . . . . . . . . . . .
Table 2−16: DVB SI/PSI 2−158. . . . . . . . . . . . . . . . . . . . . . . . . . . . . . . . . . . .
Table 2−17: ATSC SI/PSI 2−159. . . . . . . . . . . . . . . . . . . . . . . . . . . . . . . . . . .
Table 2−18: ISDB-S SI/PSI nodes 2−160. . . . . . . . . . . . . . . . . . . . . . . . . . . .
Table 2−19: ISDB-T SI/PSI nodes 2−161. . . . . . . . . . . . . . . . . . . . . . . . . . . .
MTS400 Series MPEG Test System User Manual
v
Page 26

Table of Contents
vi
MTS400 Series MPEG Test System User Manual
Page 27
Transport Stream Compliance Analyzer - Getting Started
The MTS400 MPEG Transport Stream Compliance Analyzer (TSCA) enables
you to monitor and interpret the contents of real-time, previously recorded or
synthesized transport streams using the latest MPEG, DVB, ATSC, ISDB-T, and
ISDB-S standards.
The TSCA is specifically designed to enable you to quickly locate and identify
problems within a transport stream using a minimum number of mouse clicks.
By quickly identifying the problem areas, the TSCA software helps you save
time during the development and test of equipment, networks, and services. You
can configure the TSCA software to display stream information in user-selected
fonts. This feature enables you to view stream information in your local language
or to use custom fonts.
The TSCA software will run stand-alone on computers with Microsoft Windows 2000 or Windows XP operating systems.
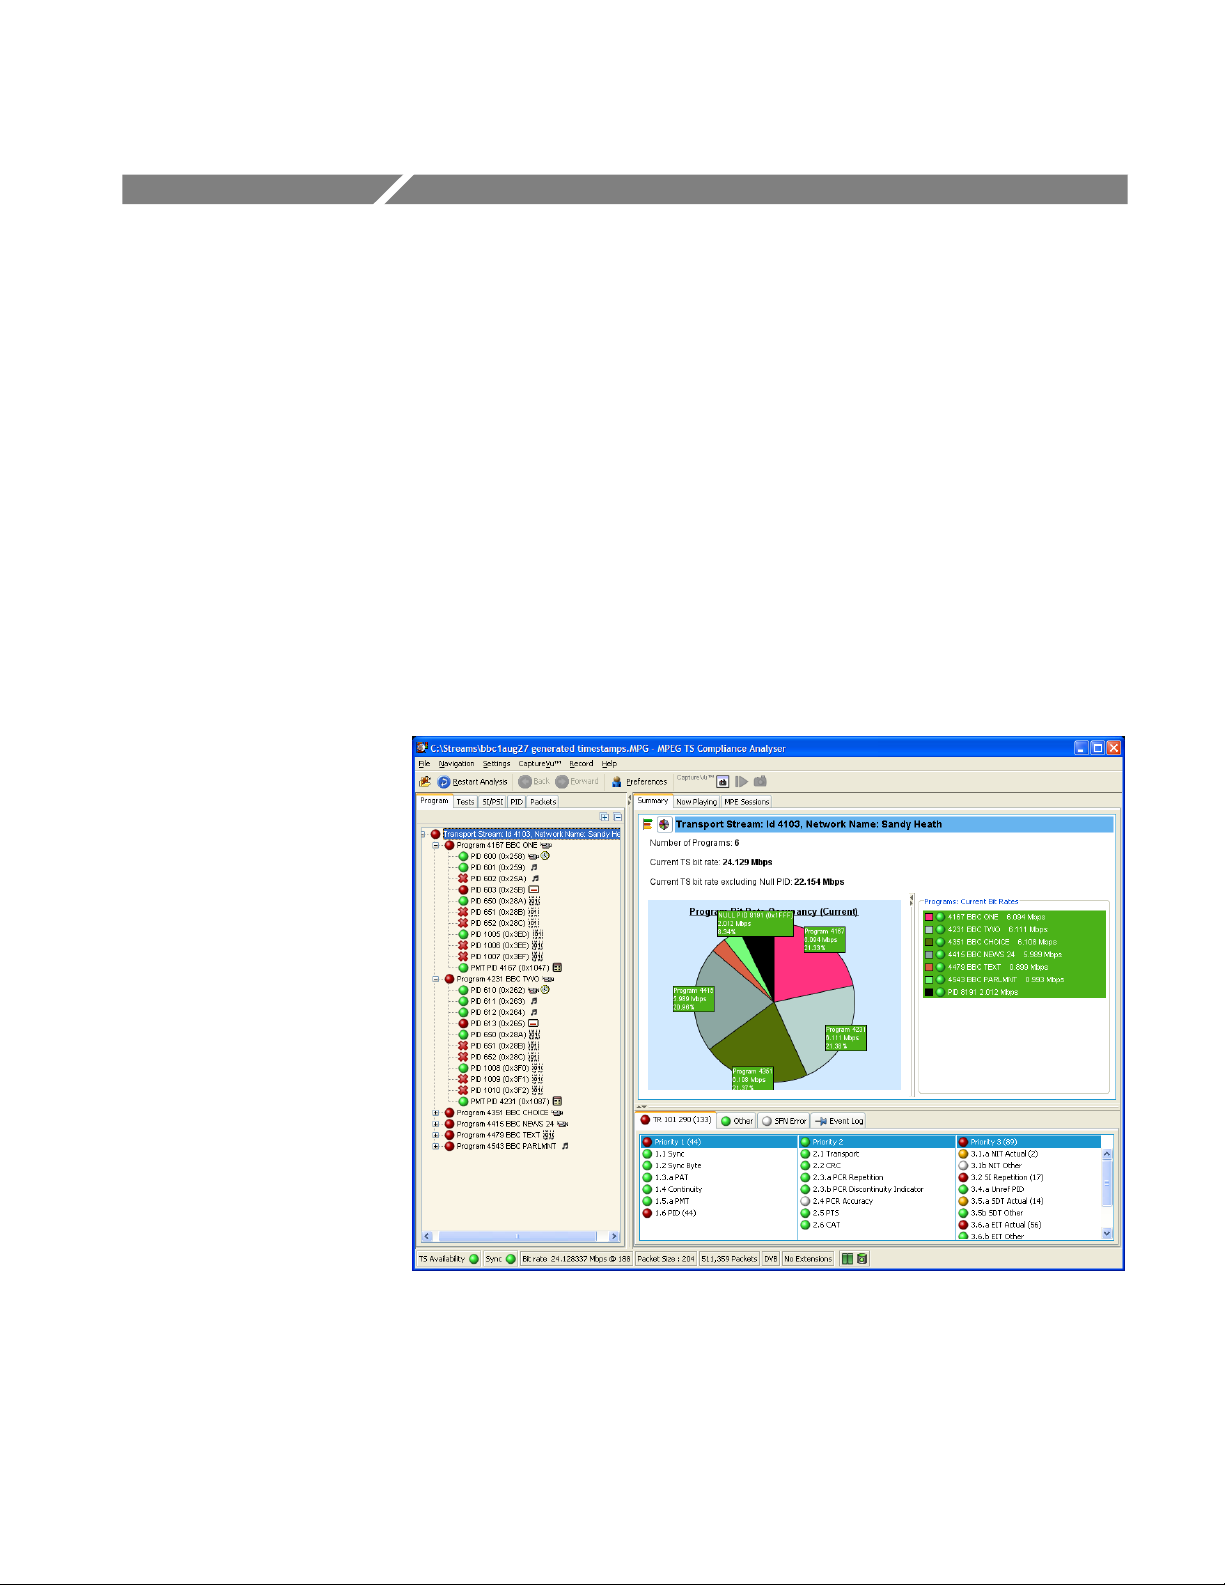
Figure 2−1: TSCA Program view - Deferred analysis
MTS400 Series MPEG Test System User Manual
2−1
Page 28

TSCA - Getting Started
TSCA Features
H Easy “program centric” user interface quickly isolates information of interest
H CaptureVut technology captures and analyzes system events in real or
deferred time
H In-depth analysis of stored transport streams including support for MPEG,
ATSC, DVB, ISDB-T and ISDB-S table types
H Data summaries and automated filters simplify the analysis of complex
transport streams
H TR 101 290 Priority 1, 2 and 3 tests
(European Telecommunications Standards Institute (ETSI) TR 101 290:
Digital Video Broadcasting (DVB); Measurement Guidelines for DVB
Systems.)
H Syntax analysis and display supported for TMCC and IIP data
H Consistency checks performed between SI, TMCC, and IIP data
H Proprietary PSI/SI syntax section rate error testing
H Error logging
H Suspension of all tests at program changeover based on PMT version change
H DII and DDB error checking
Deferred and Real-Time Modes
The TSCA can be run in Deferred or Real-Time mode.
The Deferred mode is available on any recommended platform (including the
user’s own PC). In Deferred mode, a static stream can be analyzed and displayed; the content can then be inspected at leisure.
The Real-time mode, with which a live stream can be analyzed, is available
when the TSCA is installed on a Tektronix MTS400 series MPEG Test System
or an MTX100B with an Option 7 interface card. Real-time streams can be
paused for detailed offline analysis and then when the issue has been found,
real-time analysis can be resumed. Real-time monitoring of Video over IP
(internet protocol) is also available as a standalone application on a user’s own
PC.
2−2
MTS400 Series MPEG Test System User Manual
Page 29

Technical Background
TSCA - Getting Started
The analyzer has a client-server architecture. Every time the analyzer opens, it
starts two processes: tsca.exe, which is the client, and MpegCore.exe, which is
the MPEG analysis engine. Additionally, when the analyzer opens for the first
time, another single process, CoreManager.exe, is started. CoreManager.exe
forms an intermediary between TSCA clients and MPEG cores.
The tsca.exe, MpegCore.exe, and CoreManager.exe processes use SNMP
(Simple Network Management Protocol) and HTTP (Hypertext Transfer
Protocol) to communicate. The port numbers used for communication are read
from a configuration file, CoreInfo.xml. In a default installation, this file can be
found in c:\program files\tektronix\mpeg\mts400\apps\tsca\xml\. The default
port range is 15700-15800. These values can be changed if they conflict with
other applications.
On the MTS400 platform, another process, mint.exe, runs from system startup.
This process controls shared access to the MTS400 Series hardware by the
analyzer and player.
User Interface
Program View
You must have local administrator rights to be able to use IP analysis. If you
need to change your rights , please consult your system administrator.
The TSCA software uses a single main program summary window with different
context sensitive views contained within tabbed frames. This provides the
maximum amount of useful information while keeping the screen from appearing
cluttered. From the main window, you can access the following views: Program,
Tests, Tables,PID, Packets, and Interface.
The Program view provides a fast overview of the transport stream contents in
terms of program content, bit rate use by each program, and TR 101 290 test
results. Red, amber and green LEDs highlight errors associated with each
program, or element of a program, within the transport stream. Red LEDs
indicate that there are current errors in the stream, amber LEDs indicate that
errors have occurred but are now clear, and green LEDs indicate that no errors
have been detected.
Errors that are detected at lower levels in the program stream hierarchy propagate
up to the highest level. This allows you to monitor all of the programs in the
stream at a high level and then quickly go to lower levels as necessary to locate a
problem.
MTS400 Series MPEG Test System User Manual
2−3
Page 30

TSCA - Getting Started
Tests View
SI/PSI (Tables) View
PID View
The Tests view enables you to isolate errors to the specific tests that have been
applied to the transport stream. The error log is automatically filtered by the
selected test, and can also be filtered by Packet Identifier (PID). In addition to
the standard first, second, and third priority tests included in TR 101 290
standard, tests are available for Program Clock Reference (PCR) jitter and
program/PID bit rate. A variability test enables you to test the changes in the bit
rate of a specific PID, and there are many tests that are specific to ISDB-T and
ISDB-S streams.
The SI/PSI (Tables) view displays the service information tables that have
occurred in the analyzed stream which comply with the selected digital video
standard. This includes MPEG-specific program information, DVB service
information, and ATSC, ISDB program, and system protocol information. The
tables are grouped together by function and hyperlinks enable you to quickly
access related information within other tables.
The PID view displays information about all of the PIDs found in the transport
stream. When you select the transport stream, the associated summary view
provides a PID-oriented overview of the transport stream, displaying the relative
data rates of all of the PIDs contained within the stream. The information can be
displayed as either a bar chart or as a pie chart. Pop up menus enable fast limit
selection and links.
Packets View
Interface View
Each PID is associated with a number of tests. When one or more tests fail, each
failed test will be listed under the relevant PID. Select a specific PID to display a
summary of all the associated tests. Select a specific test to display the Event
Log and Parameters for only that test.
The Packets view displays information about all of the packets found in the
transport stream grouped according to content. These groups include PID value,
SFN mega-initialization packets (MIPs) (DVB only), and ISDB-T information
packets (IIPs). When you select a specific PID or MIP, only packets carrying that
particular PID or MIP are displayed. A section view is also available. Deferred
analysis of PCAP files allows you to see the ethernet packets.
The Packets view is not available in real-time mode. However, packets in a
real-time stream can be examined using the CaptureVu feature.
The Interface view provides a central location for information related to the RF
interface card (where installed).
H Test results
H Graphical representation of specific RF card readings
H RF card readings and control settings
2−4
MTS400 Series MPEG Test System User Manual
Page 31

CaptureVu Feature
Triggered Recording
TSCA - Getting Started
The graphical views display a selection of graphs of instantaneous measurements
and measurement trends. Also available are an Event Log and a Parameter view.
The Interface tab is displayed only when an interface is installed.
The CaptureVu feature captures a snapshot of system events in real and deferred
time, and allows you to debug the intermittent and complex problems that
traditional analyzers miss. You can initiate CaptureVu either manually or
automatically by associating a CaptureVu Breakpoint with any test event. When
a breakpoint is detected, either manual or automatic, the stream is paused and an
in-depth deferred time analysis can be performed on stored data. This powerful
debug mode enables fast debugging of troublesome intermittent problems.
During real-time analysis, stream information can only be held for a finite time eventually it will be overwritten by more up-to-date information. Triggered
recording allows a portion of a stream to be recorded and subsequently analyzed
in detail.
The following trigger sources and conditions apply:
H Any test event
H External input; (TTL) edge specifiable
H Date and time
H Recorded file size can be specified
H Pretrigger buffer size can be specified as a percentage of the overall file size
range from 0 – 100%
MTS400 Series MPEG Test System User Manual
2−5
Page 32

TSCA - Getting Started
Starting the TSCA Software
The TSCA can analyze transport streams in either real-time or off-line (deferred)
mode.
Opening the TSCA
Click File Analysis to select the transport stream file to analyze and to select the method for calculating the
rate of the stream.
Click Real-time Analysis to select an
input source (IP or hardware interface) for real-time analysis.
From the Windows Desktop, select Start > Programs > Tektronix MTS400 >
Analyzers > TS Compliance Analyzer.
The TSCA is opened, initially overlaid with the Open Transport Stream...
dialog box.
2−6
Figure 2−2: TSCA Start-up
The Open Transport Stream... dialog box allows you to:
H Select the interpretation standard to be used for analysis.
(The stream interpretation should be checked and, if necessary, set first.)
H Identify a stream file for deferred analysis. Files can be selected either
directly from the disk drive or using previously set up shortcuts.
H Identify an input (IP, ASI or SMPTE or DVB Parallel) receiving a stream
and start real-time analysis.
MTS400 Series MPEG Test System User Manual
Page 33

TSCA - Getting Started
Interpreting a Stream
You can set up the stream interpretation standard in the following way:
1. Click Change... in the Open Transport Stream dialog box to open the Stream
Interpretation dialog box.
NOTE. The TSCA software analyzes streams in strict accordance with the
standards defined by the digital television authorities: DVB (Digital Video
Broadcasting), ATSC (Advanced Television Systems Committee), and ISDB
(Integrated Services Digital Broadcasting).
The TSCA software uses preloaded scripts which establish the expected content
and syntax of the analyzed stream. The analyzer is supplied with a comprehensive range of scripts, which, in different combinations, can interpret the full
range of digital television standards.
2. Select the Base Standards and then (if available) select the Region. The
analysis scripts that will be used are displayed in the Script Files pane.
Figure 2−3: Stream Interpretation dialog box
3. Select OK.
MTS400 Series MPEG Test System User Manual
2−7
Page 34

TSCA - Getting Started
4. The stream interpretation is now set. Choose one of the analysis options to
select a file or real-time analysis.
(For details of the Stream Interpretation management, see Script Files on page
2−135.)
NOTE. The selected stream interpretation standard is not implemented until
stream analysis is started. If the Open Transport Stream dialog box is closed
without starting analysis, the stream interpretation settings are lost; they revert
to the settings that were in effect when the application was last closed.
Off-Line (Deferred)
Analysis
Perform the following steps to start analyzing a transport stream file:
1. In the Open Transport Stream dialog box, with File Analysis selected,
browse to a transport stream file.
If necessary, select a file type from the Files of type drop−down list.
Currently, two types are available: MPEG Transport Stream files and PCAP
files.
H MPEG transport stream files contain interlinked tables and coded
identifiers, which separate the programs and the elementary streams
within the programs.
H PCAP files contain raw packets of network data. A PCAP may contain
more than one session. You will need to select a session using the
Browse dialog box.
2. When you select a stream, the stream name appears in the field at the bottom
of the window.
2−8
MTS400 Series MPEG Test System User Manual
Page 35

TSCA - Getting Started
Figure 2−4: TSCA File Analysis (Offline) dialog box
3. Calculating the Transport Rate. To analyze a transport stream correctly, you
must do one of the following:
H Calculate the bit rate from PCRs (Program Clock Reference) carried in
the stream
NOTE. When the TSCA software analyzes a transport stream, it compares the
bit rate of the stream to the expected rate. Errors are reported based on the
expected rate of the stream. To analyze a stream correctly, it is necessary to
know the original bit rate of the stream or to calculate the bit rate from
PCRs (Program Clock Reference) carried in the stream. PCRs are generated
as a stable clock reference and are added to the stream during its generation. During analysis, the PCRs are extracted and synchronized with a local
clock reference.
H Know the original bit rate and enter it manually
H Use timestamps included with the stream
4. After you select the desired stream, select one of the following methods for
calculating the rate of the transport stream:
H Prescan the first nnn PCRs. When you select this method, the TSCA
software calculates the rate of the stream by prescanning the stream for
embedded PCRs. The entry box lists the number of PCRs that the TSCA
MTS400 Series MPEG Test System User Manual
2−9
Page 36

TSCA - Getting Started
software recommends are necessary to determine the stream rate. You
can use the entry box to enter a different number.
H Prescan all PCRs in a file. When you select this method, the TSCA
software calculates the rate of the stream by prescanning the stream for
all of the embedded PCRs.
H Manually set nnnn Mbps. When you select this method, the TSCA
software uses the absolute value (in Mbps) that you enter as the expected
stream rate.
2−10
NOTE. Timestamps, which are added when the stream is generated, will be
used, if present, and if the Use Timestamps checkbox is enabled. Using
timestamps will override the PCR options (Prescan PCRs and Scan entire
file). The manual bit rate setting will override both PCRs and timestamps.
5. If the TSCA software cannot calculate the bit rate from the embedded PCRs,
or timestamps, a message box is displayed. You must enter an estimated bit
rate before the TSCA software can analyze the stream.
If the CaptureVu feature is to be used, the whole file can be captured or
analysis can be stopped either by a previously set CaptureVu breakpoint or at
a specific packet.
6. To stop analysis at a specific packet, enable Stop Analysis at Packet Index
and enter a packet number.
With a file selected and the transport rate calculation set up, you can start the
analysis (see page 2−12).
MTS400 Series MPEG Test System User Manual
Page 37

TSCA - Getting Started
Real Time Analysis
Perform the following steps to start analyzing a transport stream received
through an IP or a hardware interface.
1. In the Open Transport Stream dialog box, with Real-time Analysis selected,
select an interface from the drop-down list.
NOTE. For stand-alone installations, only the IP interface is available.
Figure 2−5: TSCA Real-time Analysis dialog box
Real-time analysis will not be available if the appropriate software key permissions are not found. A warning message is displayed when real-time analysis is
not available.
Make any necessary interface settings. During analysis, the interface selected
will be shown in the status bar. (The IP interface settings are described on
page 2−13.)
MTS400 Series MPEG Test System User Manual
2−11
Page 38

TSCA - Getting Started
Start the Analysis
To start the analysis, follow these steps:
1. After you have selected the interpretation standard and the stream source,
click OK to continue.
The TSCA software starts analyzing the selected stream. During deferred
analysis, a progress bar is displayed. The TSCA starts reporting analysis
results (see Figure 2−6).
2−12
Figure 2−6: TSCA window showing analysis progress
2. When sufficient data has been gathered and the display has stabilized, you
can start using the TSCA to view the analysis.
3. To analyze another stream file or to reanalyze the current stream using
different standards, use the File > Open Transport Stream menu selection.
MTS400 Series MPEG Test System User Manual
Page 39
Setting Up the IP Interface
Two Ethernet interfaces are standard on the MTS400 Series systems (one 10/100
Base T and one 10/100/1000 Base T GigE). A high performance Gigabit
Ethernet interface (1000 Base T GigE) can be acquired as an option; this
provides accurate hardware timestamping, hardware filtering and a variety of
connection options, including copper and optical. These allow for basic detection
and display of all UDP (User Datagram Protocol) traffic on a network. Extraction
of an MPEG over IP stream is possible (if the licensed option is enabled).
H IP multicast addresses are indicated. Note that the TSCA will not automati-
H UDP streams carrying MPEG TS traffic are indicated.
H A selected UDP stream carrying TS traffic may be selected for analysis and
TSCA - Getting Started
cally join a multicast group (see IGMP Group Membership, page 2−14).
recording, in a similar manner to any other physical interface.
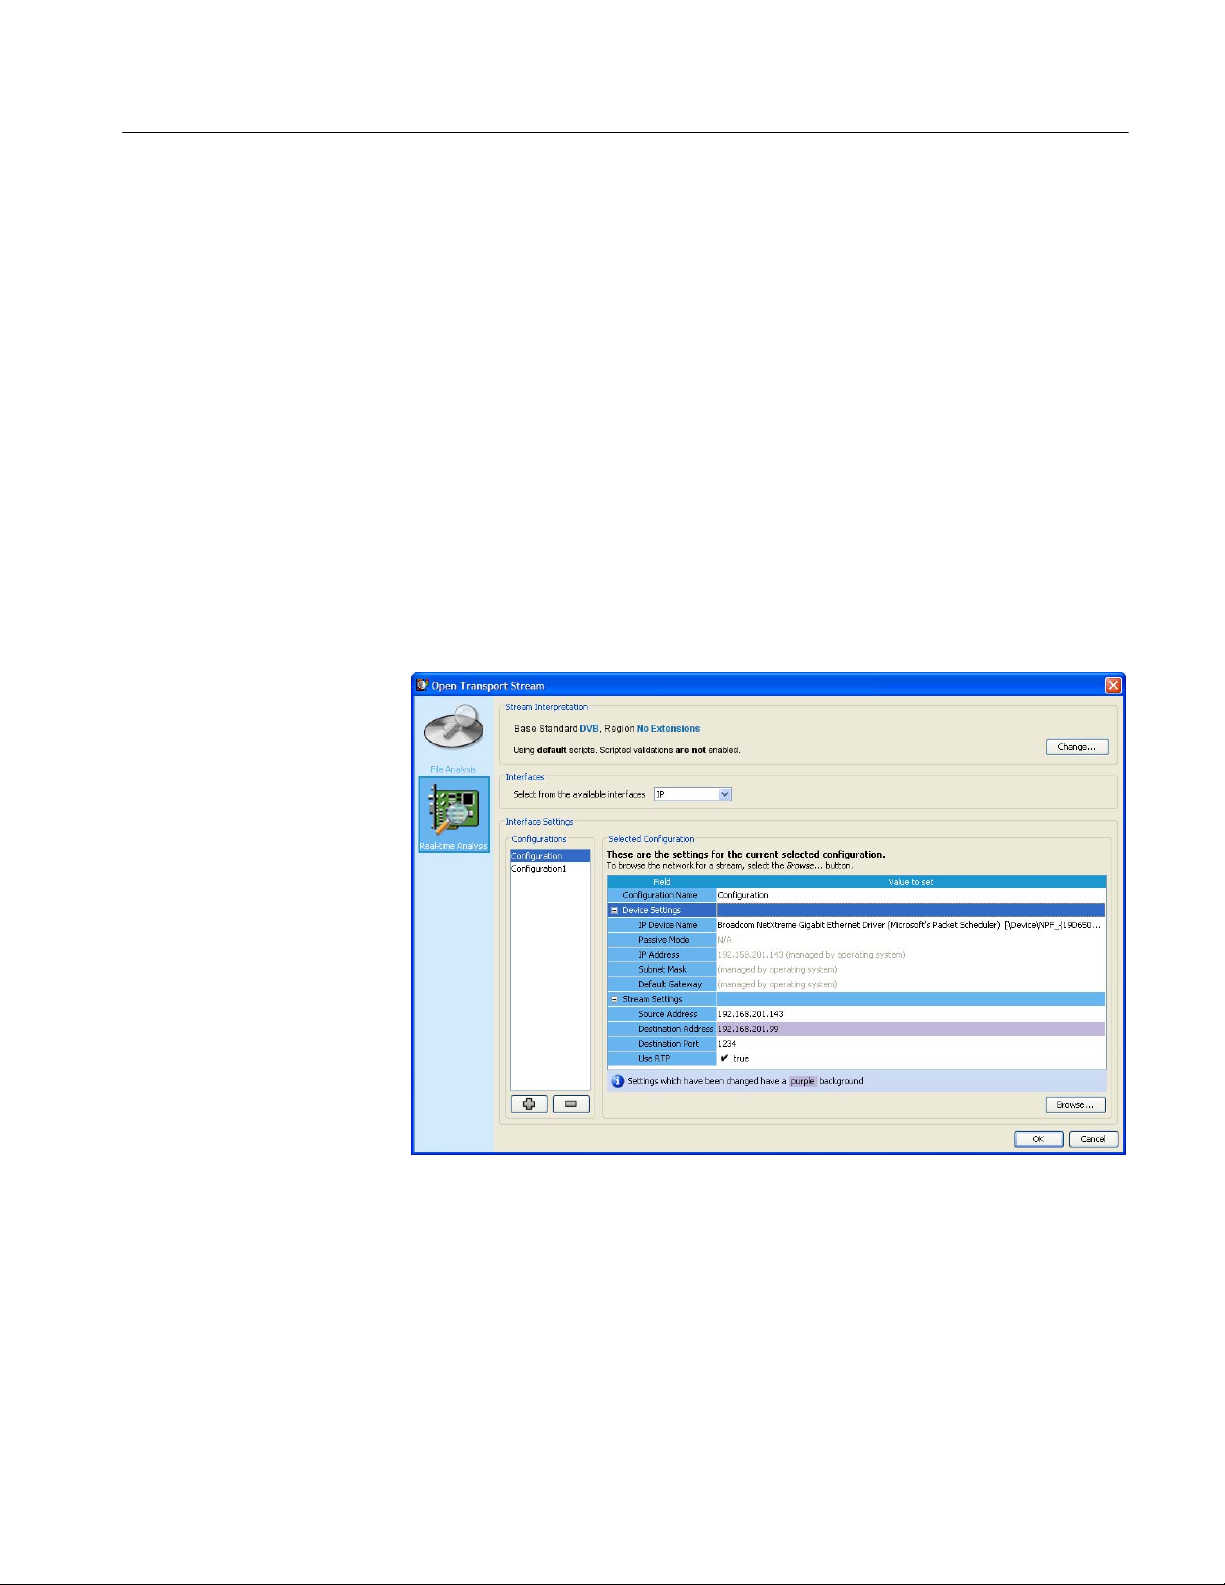
Figure 2−7: Setting up the IP interface
In the Open Transport Stream… dialog box with IP selected in the Select
Interface drop-down menu, the current settings for the selected configuration are
shown. The individual settings are described next.
Select OK to confirm the IP setting and start analysis.
MTS400 Series MPEG Test System User Manual
2−13
Page 40

TSCA - Getting Started
Interface Settings
Configurations
You can save individual IP settings configurations to disk; they can be recalled
when required. Up to 128 configurations can be specified.
The Open Transport Stream − Real-time Analysis dialog box shows the settings
associated with the currently selected configuration.
Different settings can be entered on this screen; the new settings will be used
when OK is selected. The new settings can also be saved as a new configuration
for future use if required.
IGMP Group Membership. Multicast broadcasts can be joined by entering the
multicast address in the IGMP Group Membership field in the Browse dialog
box. The sessions detected will be listed in the dialog box.
Create a New IP Configuration. In the Open Transport Stream − Real-time
Analysis dialog box, select the plus button to create a new configuration.
A default configuration name is allocated and displayed in the IP Configuration
Name field. You can enter a more meaningful name. New values can be entered
as required. This name and the settings associated with it will remain available
for recall.
Alternatively, the streams available can be viewed and a new one selected.
Select New to open the Edit IP Configuration dialog box. Select Browse and the
Browse for UDP flow... dialog box will be displayed (see Figure 2−8).
2−14
MTS400 Series MPEG Test System User Manual
Page 41
TSCA - Getting Started
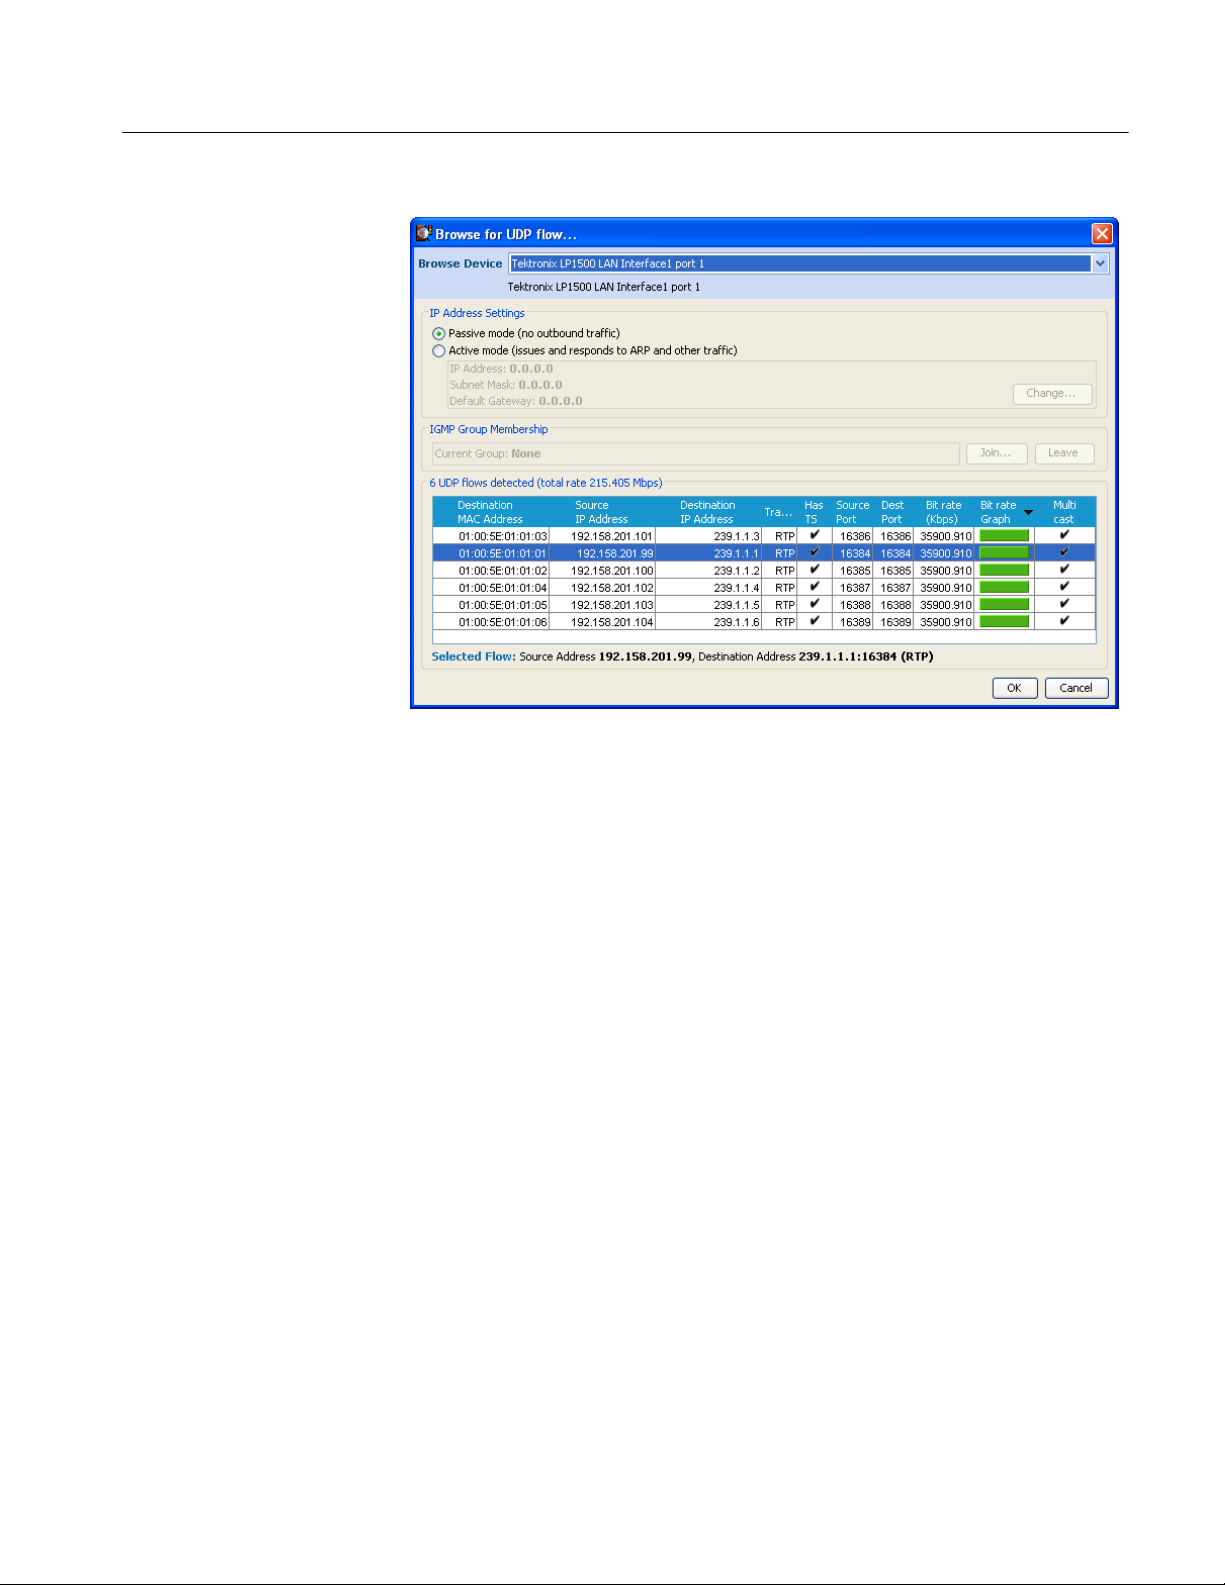
Figure 2−8: UDP flow selection dialog box
The names of any network devices installed in the instrument are displayed in
the Browse Device field. Select the network device required from the drop-down
list. The traffic present on the selected interface is displayed in the bottom half of
the dialog box. A summary of the UDP flows detected is displayed in the table
header. The bit rates given are UDP bit rates, not transport stream bit rates.
The settings (Source and Destination addresses) can be set up in two ways:
H In the Open Transport Stream, Real-time Analysis, Selected Configuration
area, enter data into the Stream Settings fields.
Multicast sessions can be identified by entering the appropriate address in
the IP Destination Address field.
MTS400 Series MPEG Test System User Manual
2−15
Page 42

TSCA - Getting Started
2−16
H In the Browse for UDP Flow dialog box, highlight a session in the current
traffic area; the values are entered automatically in the Selected Configura-
tion, Stream Settings fields. Traffic carrying transport streams will have a
check mark in the Has TS column.
The TSCA should detect whether traffic is transmitted over UDP or RTP; this
will be indicated in the Transport column. The Use RTP check box will be
updated to match the protocol indicated for the selected session; this setting can
be overridden by selecting or clearing the Use RTP setting if it is believed that
the protocol indicated is incorrect.
When the settings are correct, select OK to confirm and save the configuration.
The Edit IP Configuration dialog box closes and the new configuration is
immediately available in the Open Transport Stream dialog box.
Edit an Existing IP Configuration. An existing IP configuration can be modified as
required. Modify the individual fields in the Selected Configuration, Stream
Settings fields or select a new entry in the Browse for IP Flow dialog box.
MTS400 Series MPEG Test System User Manual
Page 43

TSCA - Getting Started
Select an Alternative IP Connection. Select a new configuration from the Interface
Settings drop-down list. Note the change in the Current Settings section of the
window.
Delete an IP Configuration. To delete an IP configuration, ensure that the
configuration to be deleted is displayed in the Open Transport Stream dialog box
and select the minus button. The selected IP configuration is deleted and the next
available IP configuration is displayed.
MTS400 Series MPEG Test System User Manual
2−17
Page 44
TSCA - Getting Started
Setting the Stream Content Font
You can configure the TSCA software to display stream content information in a
user-defined font style or language, such as Japanese or Chinese.
NOTE. How the TSCA displays the text strings carried in the stream itself is
dictated by the TSCA font setting and by the interpretation standard used during
the analysis.
How the TSCA displays entries in the Event Log is dictated by the TSCA font
setting and fonts used by a local computer. For example, if the default language
of the TSCA computer is Japanese, the event log will be displayed in Japanese
characters. You must choose a suitable font for the characters to display
correctly.
Selecting the Display Font
Perform the following steps to set the font that will be used by the TSCA
software to display stream content. You can configure the TSCA software to
display stream content using any font that is installed on your computer.
1. Select Settings > Preferences… to open the Preferences dialog box.
2. Select Font at the left of the Preferences dialog box to display the window
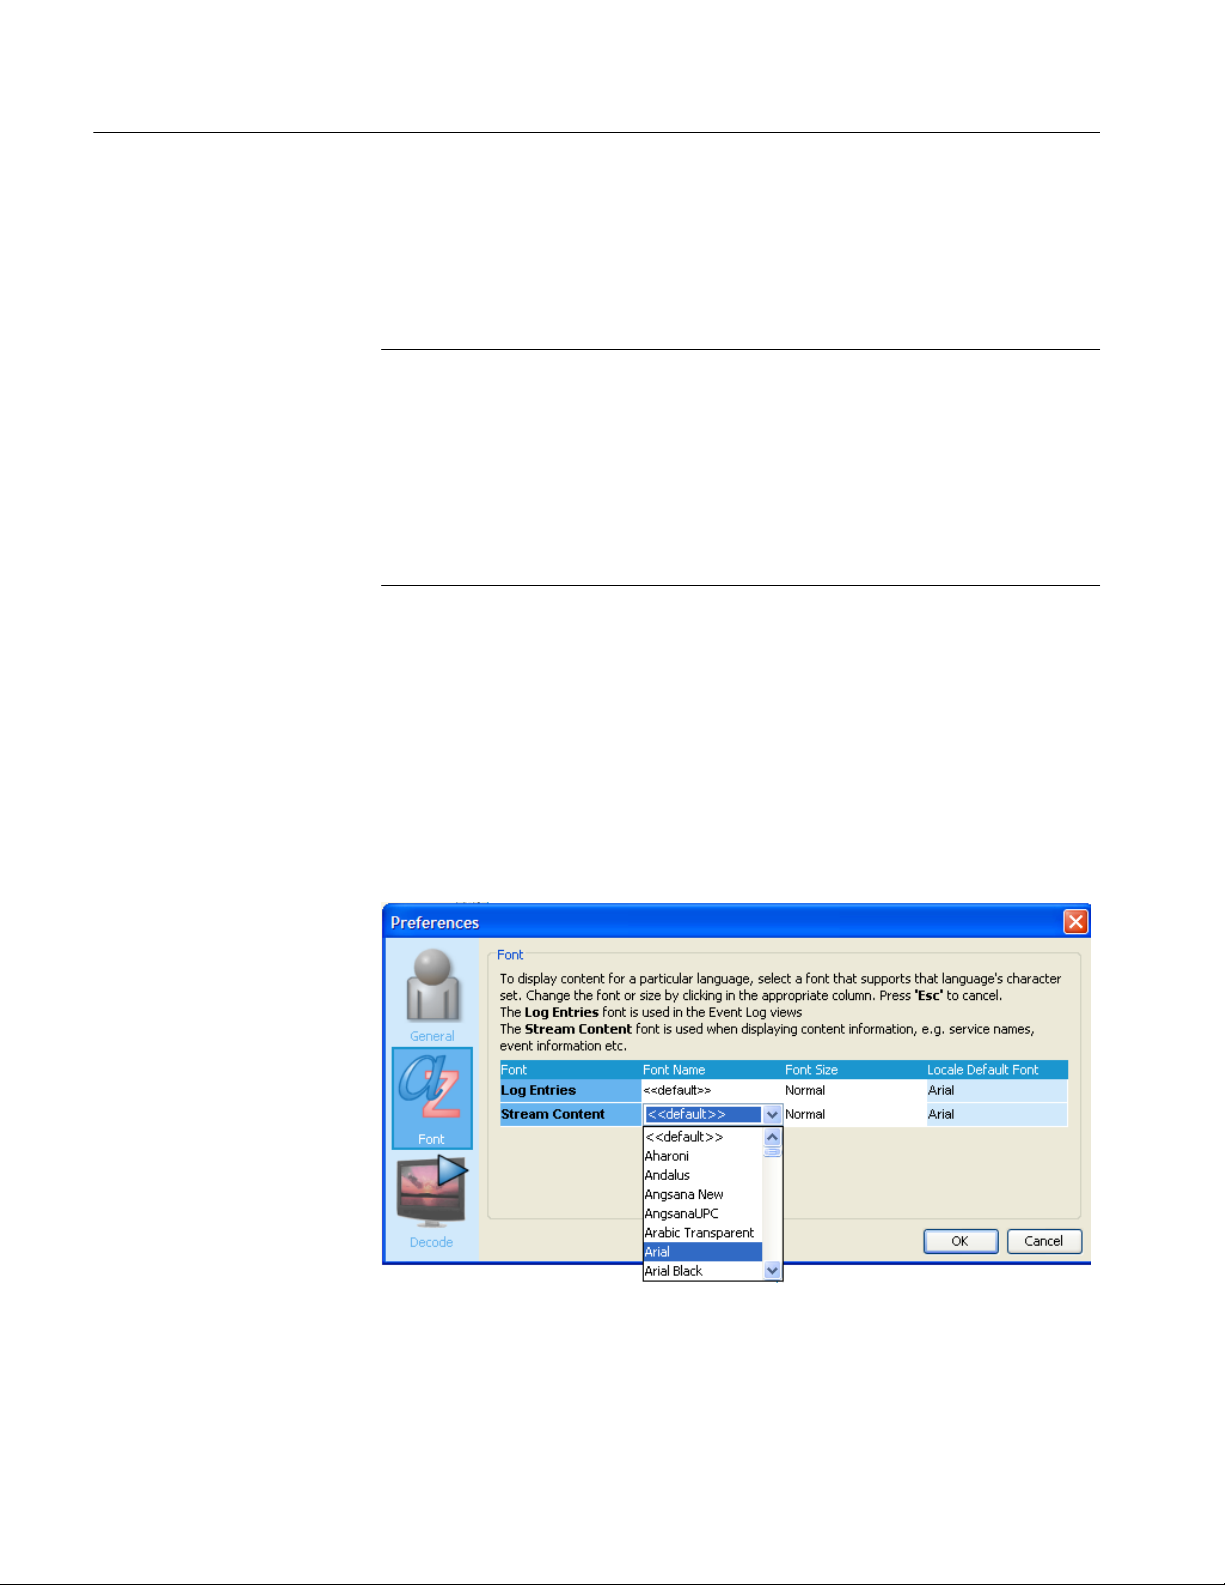
shown in Figure 2−9.
2−18
Figure 2−9: Selecting a display font from the Preferences dialog box
MTS400 Series MPEG Test System User Manual
Page 45

TSCA - Getting Started
3. The dialog box lists the default font used by your computer for the Log
Entries and Stream Content displays on the TSCA software. Use the Font
Name and Font Size drop-down boxes to select a desired font style and size.
4. Click OK to accept and save any changes.
Installing Asian Language
Fonts
Loading a Custom
Extension Font
Computers that are using local versions of MS Windows 2000 (such as Japanese
or Chinese), or MS Windows XP, should have the Asian language fonts already
installed on their systems.
If your computer or MPEG test system does not have Asian fonts installed,
perform the following steps to install the Asian fonts:
1. Insert the MS Windows OS CD-ROM, which was supplied with your
computer or MPEG test system, into the CD-ROM drive.
2. Locate the LangPack directory on the CD-ROM. This directory contains a
number of *.inf files for various languages. For example, you may want to
install japanese.inf and tchinese.inf, for Japanese and Traditional Chinese
language fonts.
3. To install new fonts, right click on each desired font file in the LangPack
directory and select Install.
4. The new fonts you installed should now appear as possible font selections in
the Preferences dialog box. You must select the new font in the Preferences
dialog box before the new font will be used to display stream content.
The ARIB specifications for the ISDB standards make use of private extensions
to the standard Unicode character set [0xE000-0xF8FF]. These extensions allow
you to add additional characters and nonstandard proprietary characters to an
existing font. The extension sets are provided as TrueType Extension files (*.tte).
Any extension sets should be installed using the Private Character Editor which
is supplied as part of the standard MS Windows installation.
To install a font extension set on your computer:
1. Open the MS Windows Private Character Editor.
a. Select Run from the Start menu.
b. Enter eudcedit in the Run dialog box and click OK.
2. After the Private Character Editor opens, close the Select Code dialog box.
3. Select Font Links0 from the File menu.
MTS400 Series MPEG Test System User Manual
2−19
Page 46

TSCA - Getting Started
4. In the Font Links dialog box, select Link with Selected Fonts.
NOTE. If you select Link with All Fonts, the following actions will overwrite any
existing font extension sets.
5. In the Select Fonts box, find and highlight the font to which you are adding
the extension. This font should be the one you selected in the TSCA font
preferences dialog box.
6. After you select the font to which you are adding the extension, click on
Save As….
7. In the Modify Private Character Filename dialog box, browse to the
TrueType extension file you are adding (*.tte) and click Save.
8. In the Font Links dialog box, click OK.
9. Close the Private Character Editor window.
10. To verify that the font extension has been successfully installed, open the
Character Map application.
a. Select Run from the Start menu.
b. Enter charmap in the Run dialog box and click OK.
11. Browse through the font list for the name of the font to which you added the
extension. The term “Private Characters” should follow the font name. When
you select the font name in the list, you can view the extended character set.
12. Close the Character Map application.
The new font extension you installed should now appear as a possible font
selection in the Preferences dialog box. You must select the new font in the
Preferences dialog box before the new font will be used to display stream
content.
2−20
MTS400 Series MPEG Test System User Manual
Page 47

Understanding the Analyzer Window
On start up, you can immediately open and analyze a transport stream
(see Starting the TSCA Software on page 2−6). This will result in a display
similar to that shown in Figure 2−10. This is the working display.
Menu bar
Toolbar
Navigation view
Detail views/panes
Status bar
Figure 2−10: Analyzer window
MTS400 Series MPEG Test System User Manual
2−21
Page 48
TSCA - Understanding the Analyzer Window
TSCA Window Components
The TSCA window contains the following components:
Menu Bar
Toolbar
The Menu Bar provides access to a selection of system options using drop-down
menus (see Menu Bar and Options, page 2−130).
The buttons displayed on the toolbar provide shortcuts to often-used menu
options. Additional buttons displayed during real-time analysis are shown in
Table 2−1:
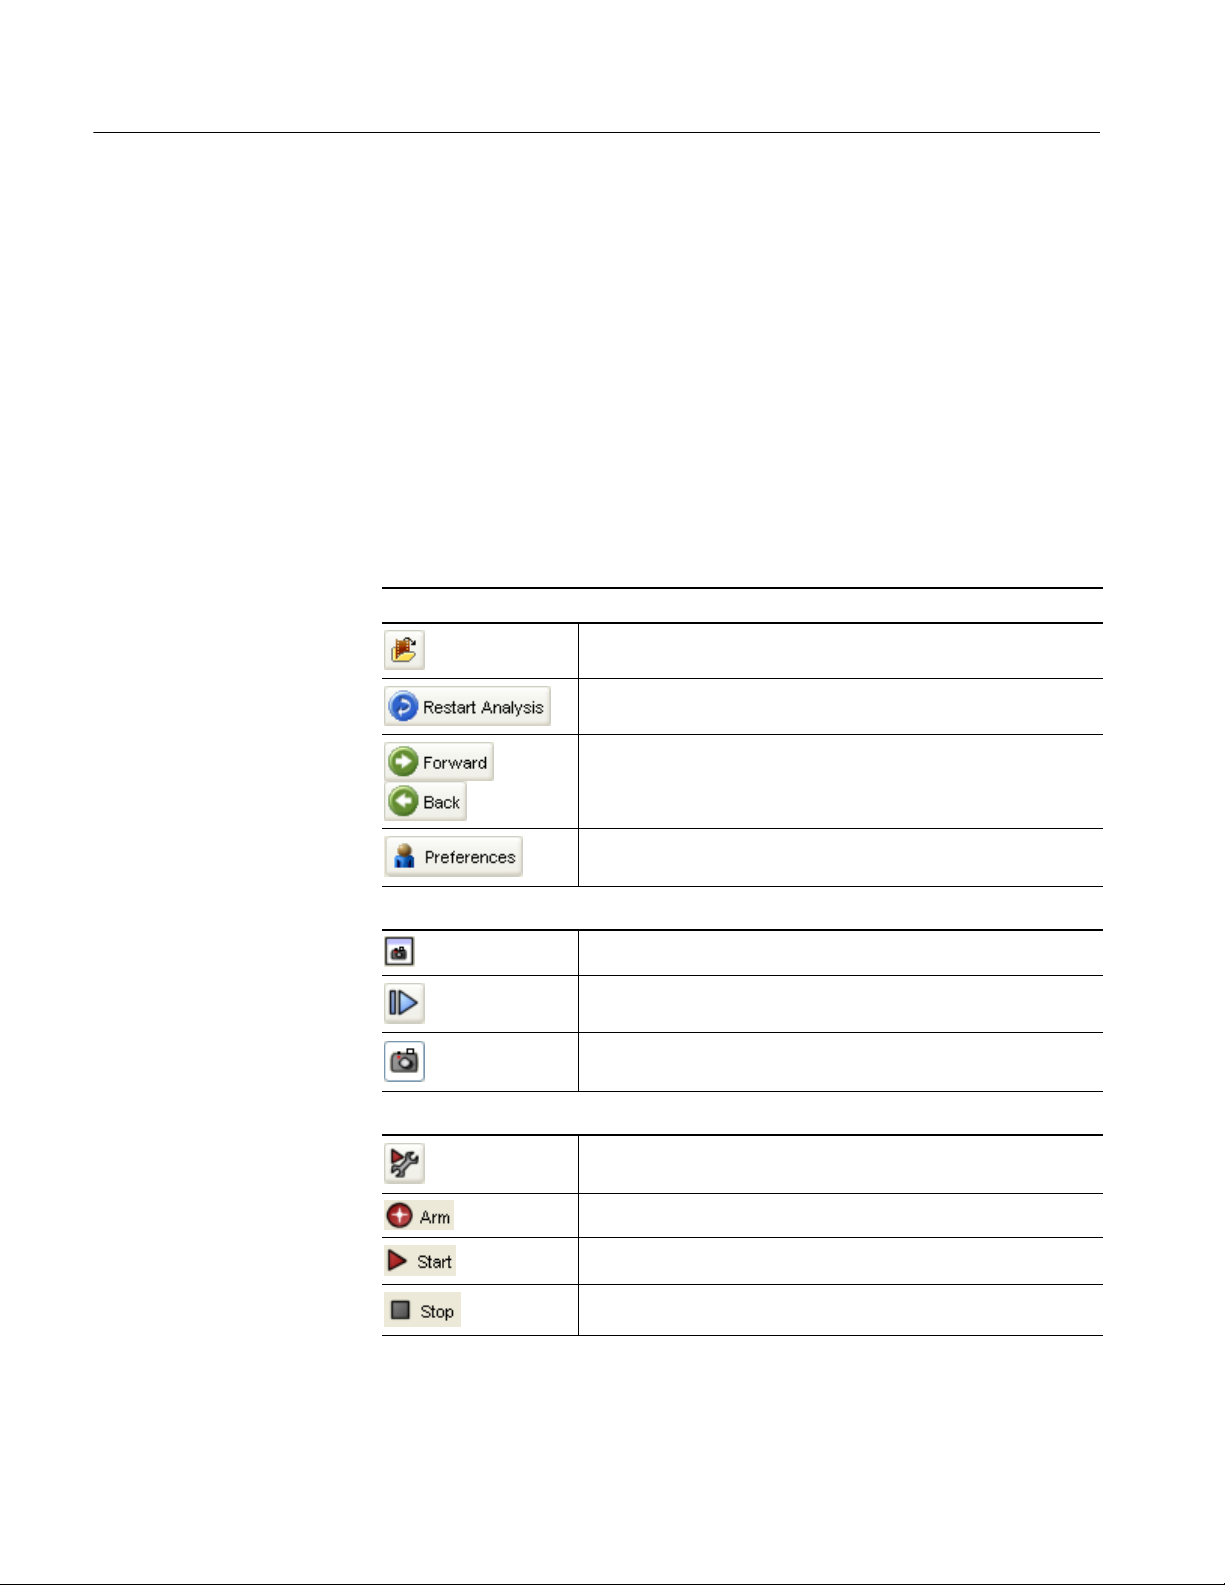
Table 2−1: Toolbar icons
Deferred and Real-time Analysis
Opens the Open Transport Stream dialog box.
Restarts analysis.
User actions are recorded during a session. The forward and back
buttons allow you to step through the actions in order to review or
repeat them.
Opens the Preferences dialog box from which you can set your
preferences.
CaptureVu
2−22
View CaptureVu status.
Resume file analysis.
Stop and capture analysis.
Real-time analysis
View record setting.
Arm record feature.
Start recording.
Stop recording.
MTS400 Series MPEG Test System User Manual
Page 49

TSCA - Understanding the Analyzer Window
Progress bar
Navigation View
Detail View/Panes(s)
The progress bar indicates the progress of processing during deferred analysis of
a stream.
To stop the analysis process, click the Stop button on the toolbar.
The left side pane in the main window is the navigation view and provides the
main analysis information for the transport stream in a number of forms:
Programs, Tests, SI/PSI, PID, Packets and Interface. Views are selected using the
tabs at the top of the pane. The background of each view is color-coded to aid
identification.
The right side pane in the main window is the detail view and provides details
related to the selection made in the current navigation view. The overall view
may be subdivided into one or more panes; you can access individual views in
multiple pane views using tabs.
Status Bar
The status bar, when not hidden, is displayed at the bottom of the main window
and shows a summary of stream statistics.
The fields, from left to right, are as follows:
TS Availability Indicates that either the stream bit rate has fallen below
the minimum value or that synchronization has been lost
(see also Sync below). The minimum stream bit rate is
set using the “Min stream bit rate for processing”
parameter, see Parameter Edit, page 2−104.
Sync Shows the status of the MPEG sync loss test. Loss of
sync during analysis of a stream may mean that analysis
of the complete stream was not possible.
Bit rate Total bit rate of the transport stream.
The packet value (188 or 204) is set using the Preferences feature (see page 2−133).
MTS400 Series MPEG Test System User Manual
2−23
Page 50

TSCA - Understanding the Analyzer Window
Packet Size Packets in a stream can be either 188 or 204 bytes long.
Stream Interpretation, Base Standard
Stream Interpretation, Region
Physical Interface The current interface for real-time analysis.
Partial Reception Availability
This is detected automatically.
This is the set of tests that is being used to analyze the
stream.
This subset of tests modifies the base standard; it may
add tests or modify existing ones.
(Available only for ISDB-T streams.) This icon indicates
the presence of partial reception data in the stream. The
colors indicate the status as follows:
Gray: Partial reception availability is unknown.
Green: Partial reception data is available.
Gray +
red cross:
Processing Throttle Indicator
This icon consists of two adjacent LED indicators which
show the status of the TSCA processing engine. The left
indicator shows the “strained” status; that is whether
throttling is being applied to cut down on the information being processed. The right indicator shows the
“overwhelmed” status; that is whether the processing
engine is able to cope with the amount of information in
the stream even after throttling. The colors indicate the
status as follows (The general color coding scheme is
described in Error Status LEDs, see page 2−26):
Green: OK
Amber: Processing was strained/overwhelmed but is
Red: Processing is currently strained/over-
Partial reception data is not available.
currently OK
whelmed
2−24
White: Processor state is unknown
Gray: Test disabled
MTS400 Series MPEG Test System User Manual
Page 51

TSCA - Understanding the Analyzer Window
Analyzer Window − No
Stream Available
System Log Status
If you choose not to select and analyze a stream, the screen will appear as shown
in Figure 2−11. The analysis structure is present, but with no stream content.
Shows the status of the system log which records
system-wide events, for example, scripting errors. The
color of the LED (in the body of the icon) indicates the
most serious event state in the log. When the top surface
of the icon is gray, it indicates that all entries in the log
have been viewed.
Double-click the icon to view the log.
Gray: The log is empty
Amber: There are entries in the log, but none since
the log was last viewed
Red: There are new entries in the log
Figure 2−11: Analyzer window - no file
MTS400 Series MPEG Test System User Manual
2−25
Page 52

TSCA - Understanding the Analyzer Window
Error Status LEDs
A major feature used throughout the TSCA interface is error status LEDs that
represent the status of the tests applied to associated items, for example,
programs, tests and PIDs. Colors used are as follows:
(Red) Error; test failed
(Yellow) Transient error (error not currently being detected but has
been seen since last reset)
(Green) No error; test passed
(Dark Blue) Warning (Interface tab only)
(Light Blue) Transient warning (warning not current, but has been
detected since last reset) (Interface tab only)
(Gray): Test disabled
(White) Test not applicable or unknown state
(Red) PID referenced but not found in the stream
(Green) PID referenced but not found in the stream.
Applicable test disabled.
When an LED represents a parent node in a tree (for example, a program node is
the parent of elementary stream nodes), the color represents the worst case of all
of its tests and the worst case of all of the tests represented by its child nodes.
Similarly, when an LED representing a parent node in a tree is disabled or
enabled, all subsidiary (or child) nodes are also disabled or enabled to reflect the
state of the parent node. When an LED representing a parent node is reset, all the
child nodes are also reset.
NOTE. The color scheme described here is used throughout the TSCA interface,
for example, the bit rate bars in the navigation views.
2−26
MTS400 Series MPEG Test System User Manual
Page 53

TSCA - Understanding the Analyzer Window
Test Management
Shortcut Menu Options
Shortcut Menus
Tests can be disabled and enabled as required using the shortcut menu associated
with the LED icon. However, it is important to note that the extent of the action
depends on the hierarchical level of the icon chosen. For example, choosing
Disable from a program node shortcut menu will disable all tests in the program
group.
NOTE. In deferred time, if any disabled events are reenabled at the end of
analysis, the LEDs will become green. You will have to restart the analysis if you
wish to see the status of the test when the test is enabled.
Shortcut menus provide an important way of navigating around the TSCA
application. They are available on most displayed objects, for example, program
tree nodes. These menus provide options relevant to the selected object. For
example, after failure, all tests associated with a node can be reset, by selecting
the shortcut menu option Reset All Tests. The shortcut menu options provide
both actions (for example, enable and disable a function) and quick links to
associated objects in other views.
Navigation view tabs
Nodes
Shortcut menu (title bar)
Shortcut menu options
Figure 2−12: Shortcut menu (example)
To view shortcut menus, right-click an object. The menus are associated with
node types (for example, a PID node). Note that node types can be displayed in
more than one view; for example, PID nodes are displayed in the Program view
and the PID view. All shortcut menus have a title bar that indicates the node
selected.
MTS400 Series MPEG Test System User Manual
2−27
Page 54

TSCA - Understanding the Analyzer Window
2−28
MTS400 Series MPEG Test System User Manual
Page 55

Using the Program View
The Program view is displayed when the Program tab is selected in the
navigation tabbed pane. The navigation view initially displays the top node of
the program tree, which represents the analyzed transport stream from a program
perspective.
Figure 2−13: Program view
The detail view shows details of the node highlighted in the navigation view.
With the tree expanded, the navigation view shows the makeup of the stream as
shown in Figure 2−13; the stream display consists of the nodes shown in
Figure 2−14.
MTS400 Series MPEG Test System User Manual
2−29
Page 56

TSCA - Using the Program View
Transport stream node
Program node
Elementary stream node
Figure 2−14: Program view nodes
Table 2−2 shows which information is available for each node.
Table 2−2: Program view tabs
Summary /
Tabs /
Node
Transport
Stream
Program n n − − n n − n n
Elementary
Stream
Summary
n n n n n − − n −
− − − − n n n n n
Now
Playing
IP Graphs
MPE
Sessions
Associated
Tests
Graph Bit Rate
Graph Timing
Event
Log
Parameters
In DVB analysis mode, the MPE tab is always present. However, the MPE view
will be populated only when MPE data is present in the stream (see page 2−11 9) .
Pressing the F3 key on the keyboard (or selecting Go to the next red LED in
current tree from one of the shortcut menus) will highlight the next red LED in
the current view. Only the lowest level nodes will be considered and highlighted
in the search since the parent nodes simply reflect the state of the lowest level
nodes.
2−30
MTS400 Series MPEG Test System User Manual
Page 57

Program Navigation - Transport Stream Node
The transport stream node represents the entire transport stream in terms of the
programs that it contains. The adjacent LED icon represents the status of the
entire transport stream; any status error in the stream will be represented by this
LED. When this node is selected, the detail view displays the transport stream
summary.
The associated detail view provides a program-orientated overview of the
transport stream, allowing you to see the relative data rates of all of the programs
contained within the transport. A summary of the overall stream is also
displayed. The information can be displayed as either a bar chart or as a pie
chart.
TSCA - Using the Program View
The data rate of a program is the cumulative data rate of all the PIDs that are
associated with that particular program, including PCR and ECM PIDs.
NOTE. Components can be shared between programs, so the overall data rate of
all of the programs may appear to be greater than the total data rate of the
transport stream as shown in the status bar.
MTS400 Series MPEG Test System User Manual
2−31
Page 58

TSCA - Using the Program View
Bar Chart
You can display the transport stream bar chart by selecting the bar chart icon.
Each program identified in the stream is allocated one row of the table. Related
information includes the overall program status (icon), the program name,
program number, and the maximum, minimum and average bit rates.
In addition to the basic display, you can associate a maximum and minimum
threshold value with each program in the bar chart (see page 2−111). For deferred
analysis, where these values are set after analysis, the stream must be reanalyzed
for the new values to be applied. In real-time analysis, the new values will take
effect immediately. The color of the bit rate bar indicates that the program has
stayed within the bit rate limits (green) or exceeded the limits (red).
2−32
MTS400 Series MPEG Test System User Manual
Page 59
TSCA - Using the Program View
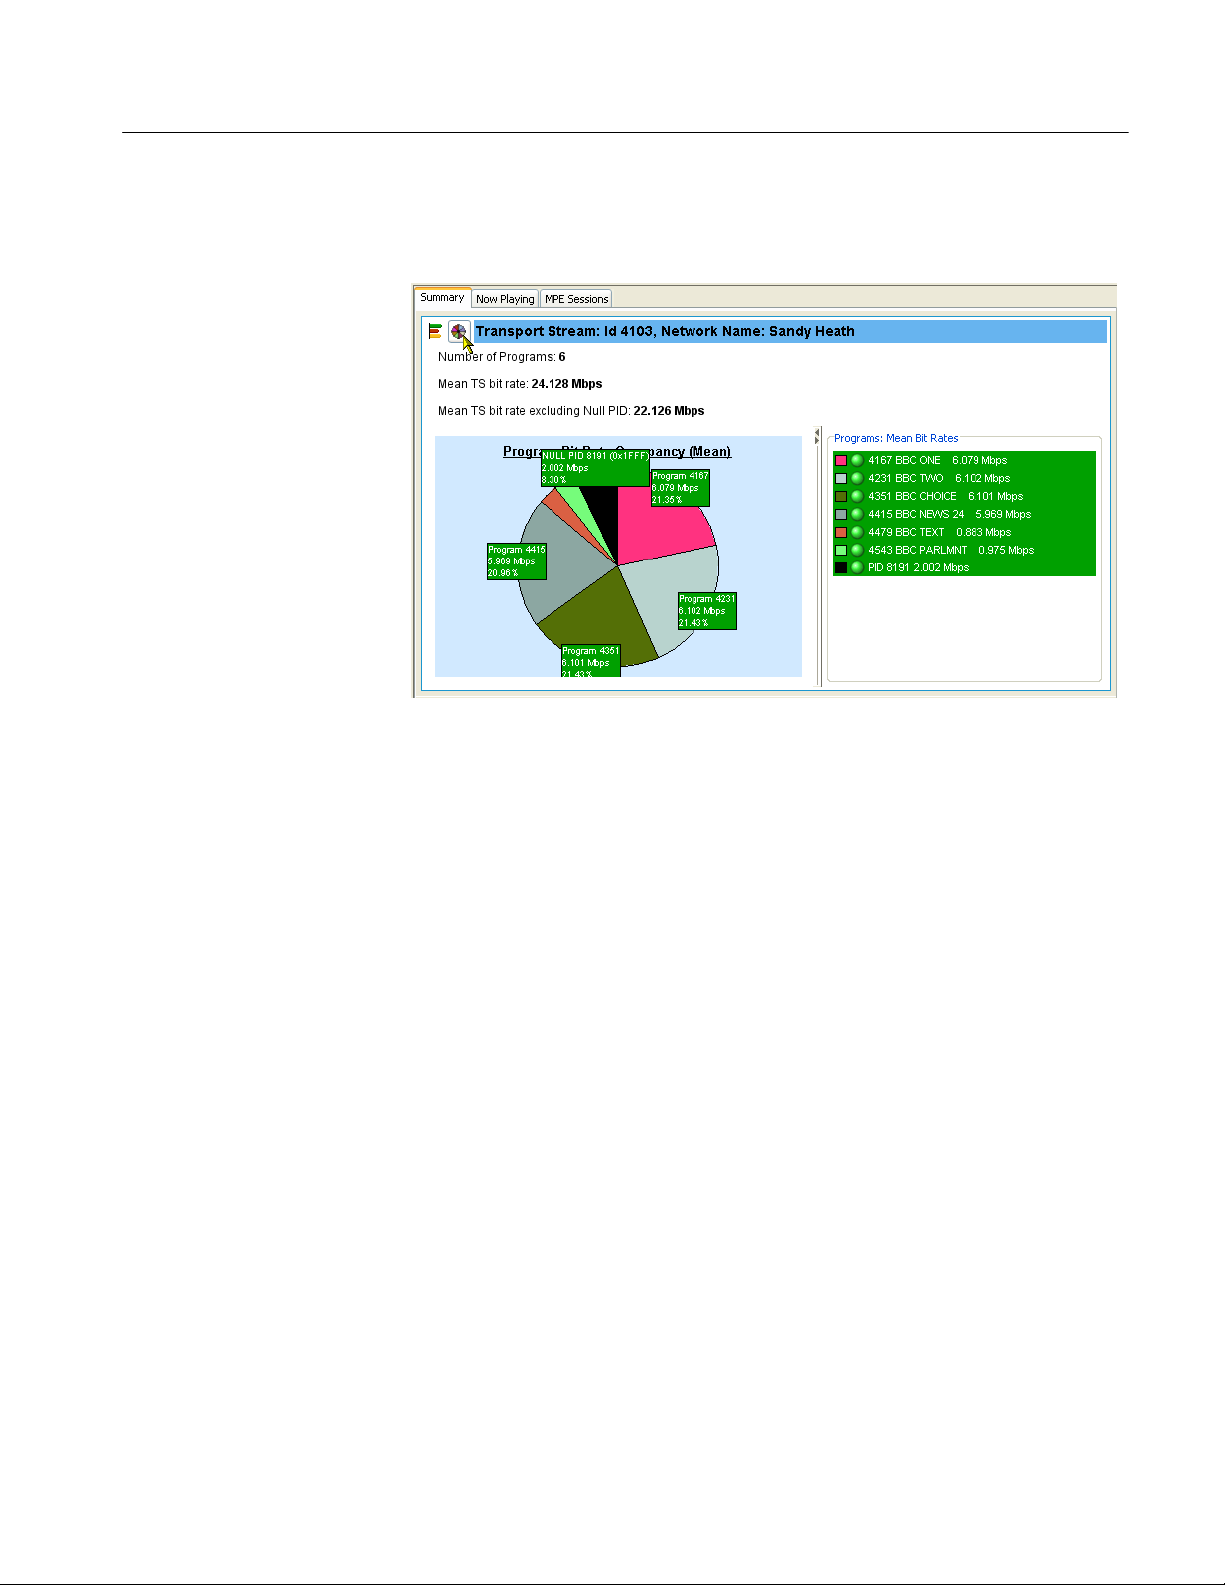
Pie Chart
You can display the transport stream pie chart by selecting the pie chart icon.
The pie chart view is divided into two panes. The left pane shows the pie chart,
and the legend on the right provides a list of the component programs. Each
program is color-coded. Related information given includes the overall program
status (icon), the program name and number, and the bit rate. The values given in
the pie chart labels are bit rates expressed as percentages of the overall bit rate.
The Null PID is shown in this view.
The color of the bit rate labels (and the bit rate values in the legend) reflects the
status of the bit rate measurement, for example, green indicates that the program
has stayed within the bit rate limits, and red indicates that the bit rate has
exceeded the limits.
MTS400 Series MPEG Test System User Manual
2−33
Page 60

TSCA - Using the Program View
Bit Rate Value Display
You can toggle the bit rate displays between the mean bit rate and the current bit
rate by selecting or clearing the Show Mean Values option on the detail view
shortcut menus (see Figure 2−15). A check mark adjacent to the option indicates
that mean values are to be displayed.
Test Status Panes
Figure 2−15: Bit rate values display
NOTE. The bit rate value shown in the Status Bar is always the mean bit rate. It
is unaffected by the mean/current selection.
The lower view pane allows you to see a summary of the states of all the
associated tests as well as the event log for the entire transport stream (an
unfiltered event log). The test tabs available will depend on the interpretation
standard chosen. For example, with the DVB interpretation standard, the
available tabs are TR 101 209 and Other. Other interpretation standards will
generate different tabs and different sets of tests (see SI/PSI Nodes, page 2−157).
When any test in the transport stream has failed (and has not been reset), you can
identify which individual tests have failed by observing the red LEDs.
You can use the shortcut menus to reset and disable tests, to set alarms,
CaptureVu Breakpoints and record flags, and to jump to associated tests.
2−34
MTS400 Series MPEG Test System User Manual
Page 61

TSCA - Using the Program View
Event Log
The Event Log (Figure 2−16) displays the log entries for the whole transport
stream. In deferred mode, the packet generating the error report can be inspected
by highlighting the error and selecting Go to packet from the shortcut menu.
Similarly, in real-time analysis mode, and where an event concerns a PID
carrying a PCR, you can use the shortcut menu to jump to the relevant PCR
graph. Deferred PCAP file analysis enables a shortcut that allows Ethernet
packets to be viewed.
Figure 2−16: Event log
Two buttons are available in the Error Log toolbar:
/ Pin log / Log is Pinned.
Export Log.
The buttons are described in detail in Event Log, page 2−107.
MTS400 Series MPEG Test System User Manual
2−35
Page 62

TSCA - Using the Program View
IP Graphs
The IP graphs available are as follows:
H Packet Interarrival Time (PIT):
Shows the mean interarrival time of IP packets.
H PIT histogram:
Shows the distribution of packet arrival intervals. The X axis contains
accumulators where interval times are collected. The Y axis corresponds to
number of intervals that collect in each accumulator.
H Ethernet flow rate:
Bit rate of the Ethernet flow being analyzed.
H Delay factor:
A measurement which characterizes IP packet cumulative jitter and delay.
(Delay factor is the amount of buffer, in milliseconds, that would be required
to subtract IP packet arrival deviations from the rate determined by the
media payload.)
H Media loss rate:
Media packets lost per second.
The graphs actually available are dependent upon the IP interface options being
used. Unavailable graph names will be grayed out in the selection menu.
2−36
NOTE. Graph management and timing graphs are described in more detail in the
Common User Interface Concepts section of this manual (see page 2−85).
MTS400 Series MPEG Test System User Manual
Page 63
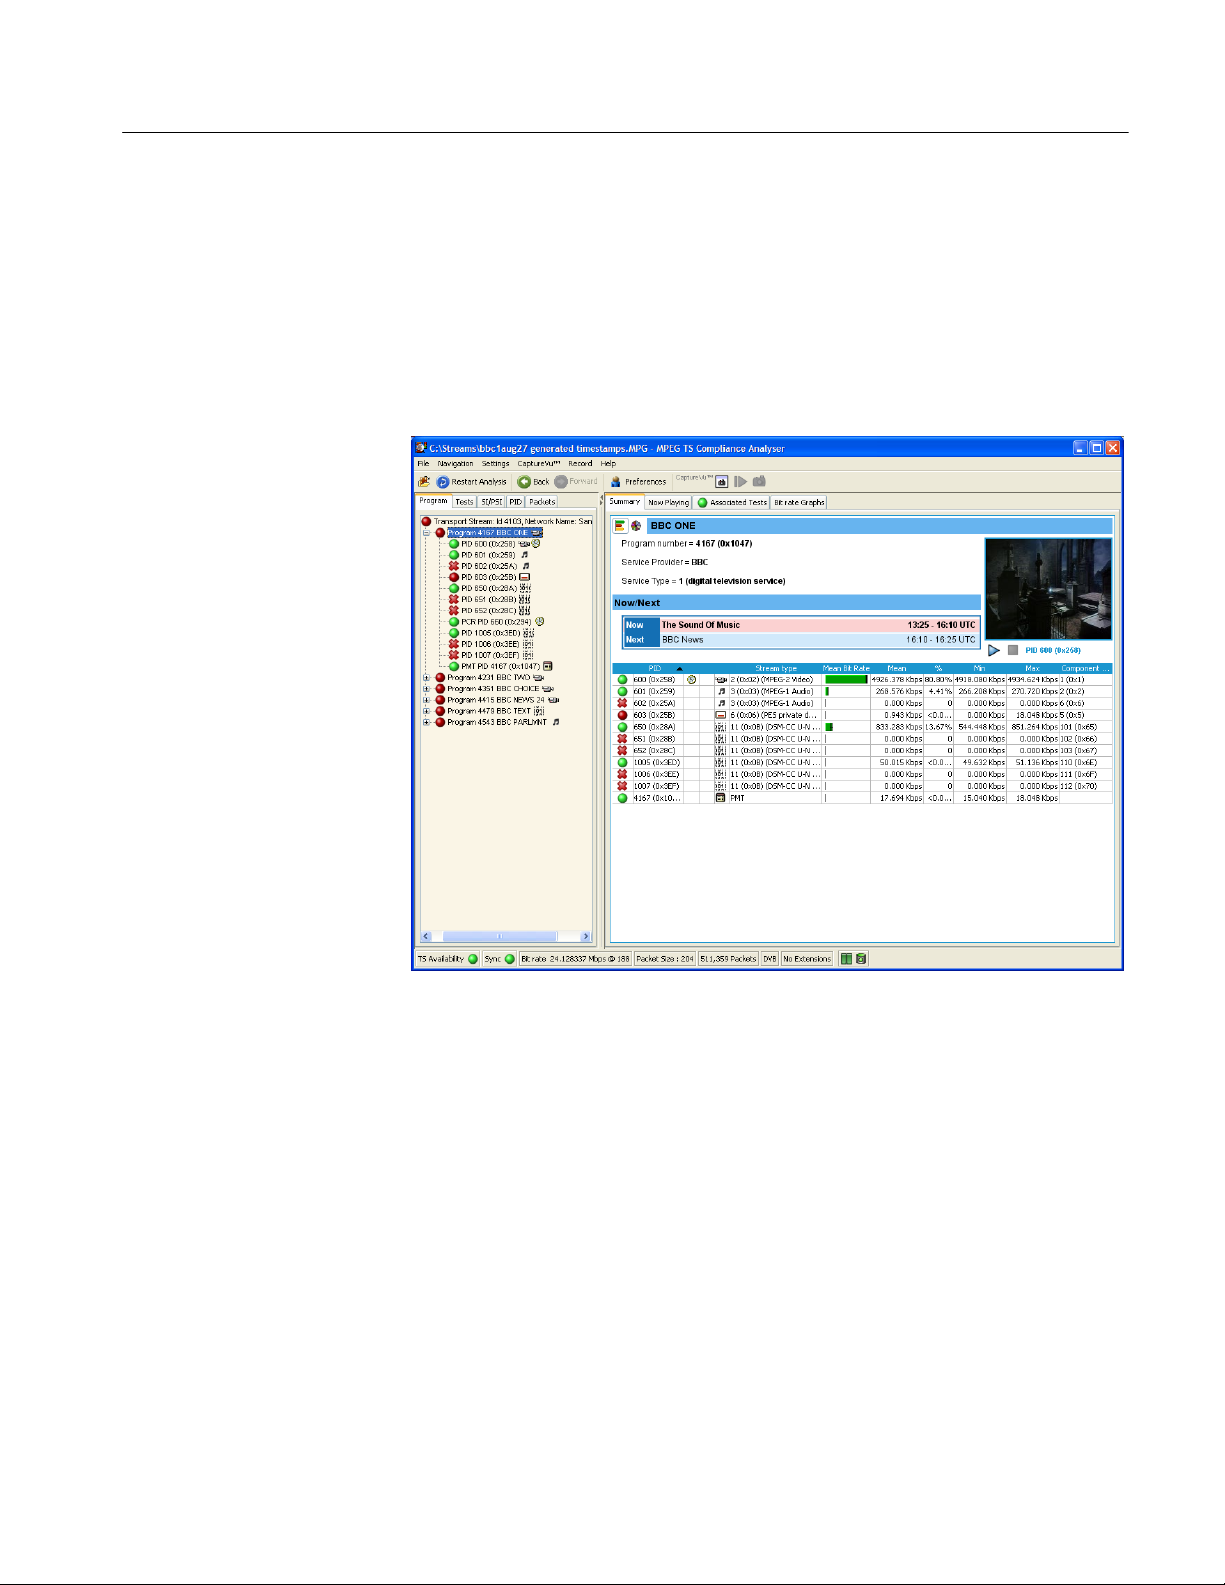
Program Navigation - Program Nodes
Each of the program nodes in the transport stream represents a single program
referenced within the stream. When a program node is selected in the navigation
view, the detail pane displays the details of the program. The LED adjacent to
the program node represents the status of its child nodes (elementary streams)
and the related tests.
TSCA - Using the Program View
The program detail view provides you with an overview of the selected program,
allowing you to see the relative data rates and stream types of all of the PIDs that
are associated with the program (including PCR and ECM PIDs). If the program
contains an MPEG2 or H.264 video stream, it is decoded to produce a thumbnail
picture of the content; this is updated during real time analysis. Similarly, where
EPG information is associated with the program, a summary (Now and Next
program) is displayed. PID content is indicated using icons, which are described
on page 2−87. Bar chart and pie chart views are available.
PID related information is available under the Summary tab.
The Now Playing tab displays details of the streams and thumbnails for each of
the programs (where available). (See also Now Playing Views, page 2−102).
The Associated Test tab shows tests related to the program. Similarly, the Bit
rate Graphs tab displays the program bit rate in graph form.
MTS400 Series MPEG Test System User Manual
2−37
Page 64

TSCA - Using the Program View
The Parameters view displays the parameters associated with the currently
selected test in the Associated Tests pane (if applicable). You can change the
parameter values, as well as display the current, minimum and maximum values
for each of the test parameters. For deferred analysis, where these values are set
after analysis, the stream must be reanalyzed for the new value to be applied. In
real-time analysis, the new values will take effect immediately.
The Event Log shows the errors for the highlighted test. When no tests are
selected, the event log will show the events related to all tests associated with the
elementary stream selected in the program tree.
VLC Media Player
The VLC Media Player is a portable multimedia player for various audio and
video formats. The player allows program content displayed in the TSCA
thumbnails to be played in a larger window. The media player is automatically
accessed from the TSCA when you want to view or listen to the video and audio
content of program streams.
NOTE. The VLC Media Player is not installed as part of the MTS400 Series
system. Installation of the player is described in the MTS400 Series Getting
Started manual (Tektronix part number: 071-1505-xx).
You can find full documentation of VLC on the http://www.videolan.com.
To start the media player, click the start button (below the thumbnail) in the
Program Summary view.
2−38
The VLC Media Player is opened automatically and the selected program
content (video and/or audio) will be played. You can close the player by clicking
the stop button (below the thumbnail). The player will close automatically.
MTS400 Series MPEG Test System User Manual
Page 65

NOTE. The VLC Media Player may open “behind” the TSCA window. Use the
Windows controls to bring it forward.
NOTE. If the VLC Media Player is installed on the MTX100B instrument, the
audio feature in the media player must be disabled. Refer to the MTS400 Series
Getting Started manual (Tektronix part number: 071-1505-xx).
Program Navigation - Elementary Stream Node
Each of the elementary stream nodes in the program tree represents a single
elementary stream referenced by the parent program. When this node is selected,
the view pane displays the Elementary Stream summary view.
TSCA - Using the Program View
In addition, when the cursor hovers over the elementary stream node, a tooltip is
displayed giving stream type and description.
MTS400 Series MPEG Test System User Manual
2−39
Page 66

TSCA - Using the Program View
An LED associated with each elementary stream node indicates the status of the
tests relating to the elementary stream.
When the selected elementary stream PID contains timing information, PCR
trend analysis views are also available, allowing you to display graphs of PCR
accuracy and PCR interval data. When the transport stream contains
timestamped data, the PCR overall jitter, PCR frequency offset, PCR arrival
time, and PCR drift rate graphs are also available.
NOTE. Graph management and timing graphs are described in more detail in the
Common User Interface Concepts section of this manual (see page 2−85).
2−40
Figure 2−17: PCR Graphs view
MTS400 Series MPEG Test System User Manual
Page 67

TSCA - Using the Program View
The Associated Tests tab shows tests related to the elementary stream node.
The Parameters view displays all of the parameters for the currently selected test
in the Associated Tests pane (if applicable). As well as displaying the current,
minimum and maximum values for each of the test parameters, you can change
the parameter value. For deferred analysis, when values are changed, the stream
must be reanalyzed for the new values to be applied. In real time, the changes
will take effect immediately.
Similarly, the Event Log shows the errors for the highlighted test. When no tests
are selected, the event log will show the events related to all tests associated with
the elementary stream selected in the program tree.
MTS400 Series MPEG Test System User Manual
2−41
Page 68

TSCA - Using the Program View
2−42
MTS400 Series MPEG Test System User Manual
Page 69

Using the Tests View
The Tests view displays test information relevant to the transport stream being
analyzed. The view is displayed when the Tests tab is selected in the Navigation
tabbed pane (see Figure 2−18).
Figure 2−18: Tests Navigation view
The view displays a test tree which represents all the tests that have been applied
to the analyzed transport stream. Figure 2−19 shows the nodes available in the
navigation view.
MTS400 Series MPEG Test System User Manual
2−43
Page 70
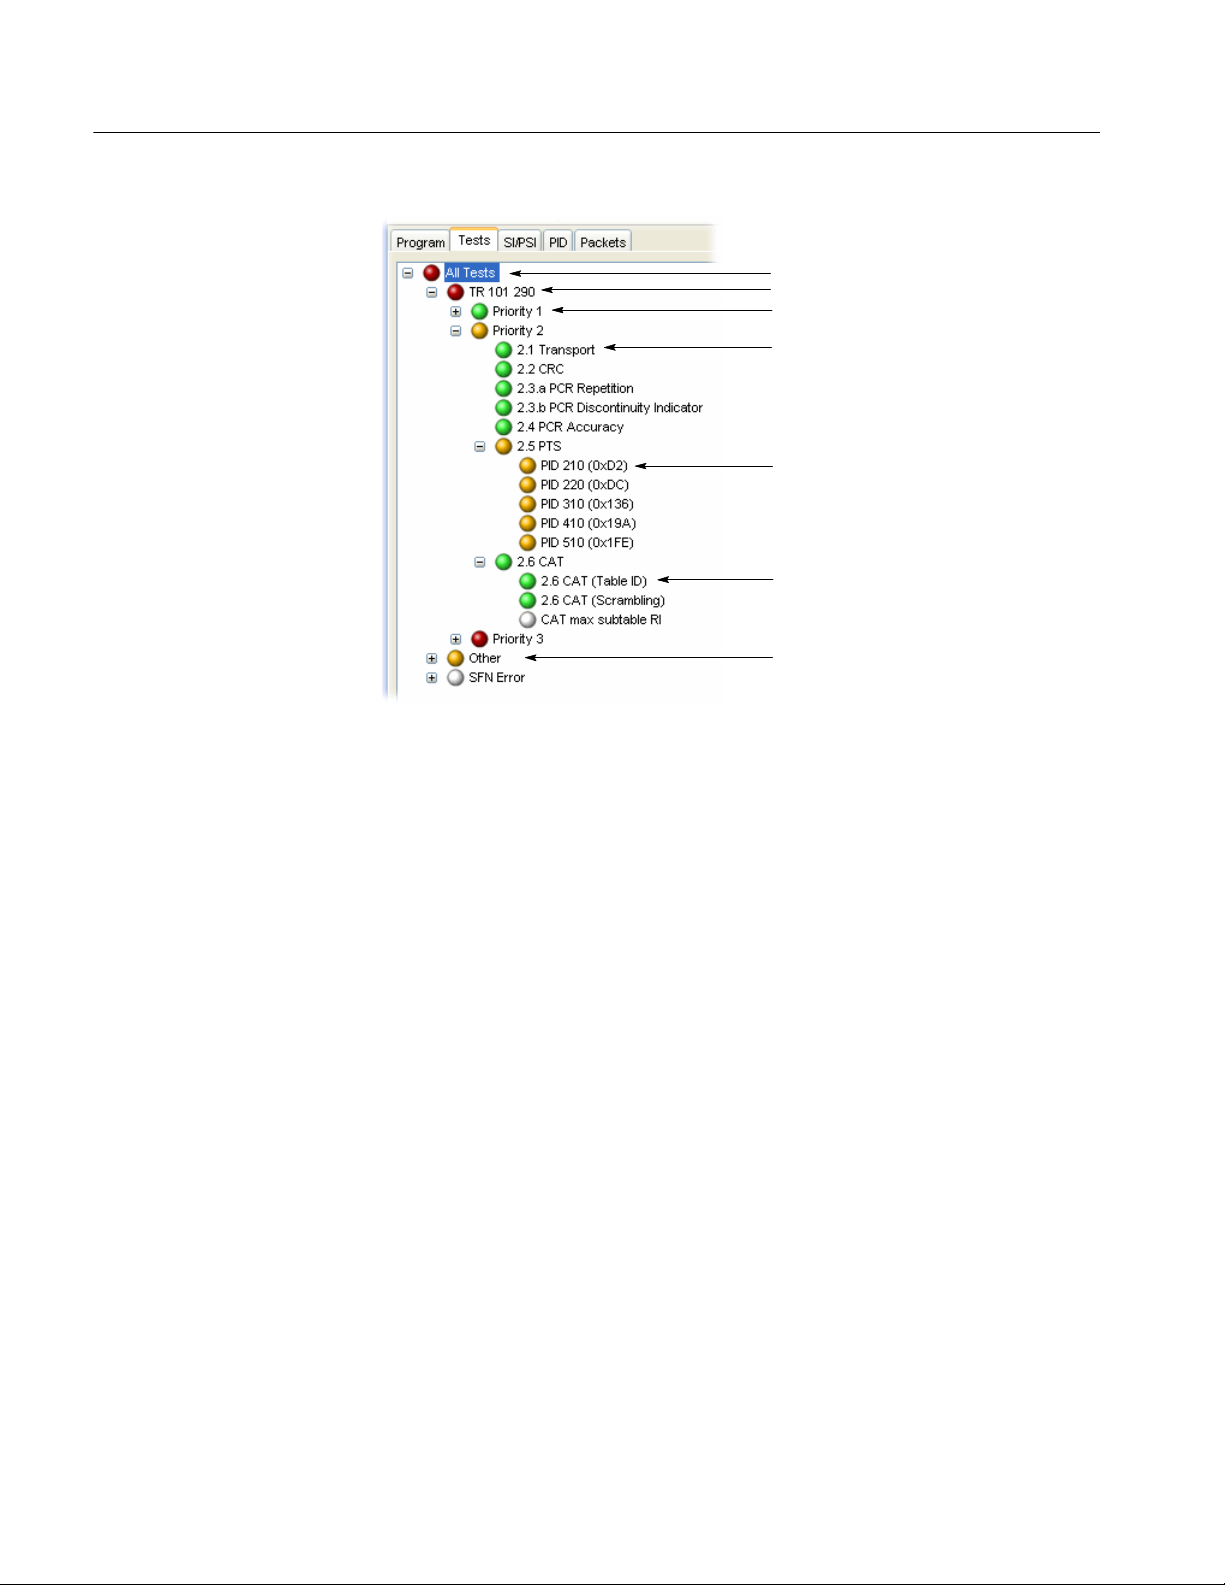
TSCA - Using the Tests View
All Tests
Group
Priority
Test
Associated PIDs
Subset
Group Other"
Figure 2−19: Test view nodes
2−44
MTS400 Series MPEG Test System User Manual
Page 71
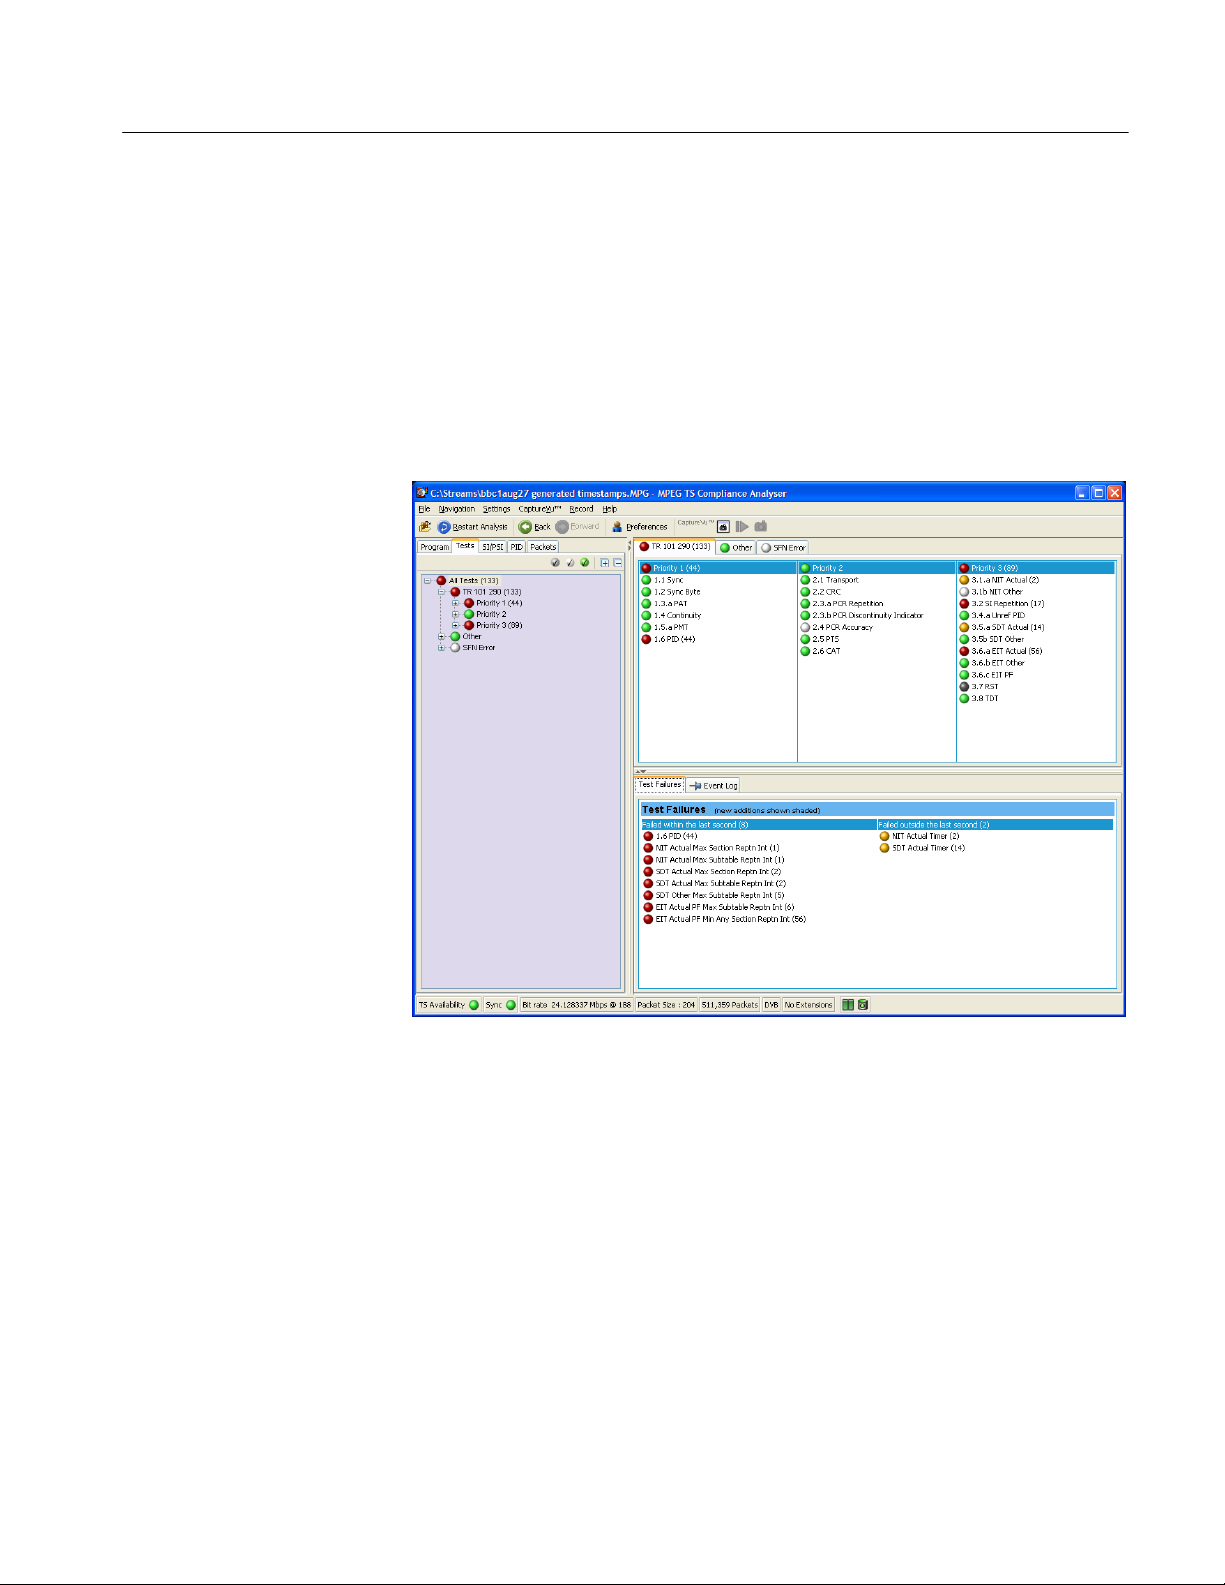
TSCA - Using the Tests View
Test Structure
The test tree structure represents all of the tests that can be applied to a transport
stream complying with a particular digital video standard: MPEG, DVB, ATSC,
ISDB-S, and ISDB-T. The standard must be selected before beginning analysis.
The test tree contains nodes for each test that the analyzer can implement.
An example of a tree structure for a selected standard is the TR 101 290 group of
tests for DVB transport streams (shown in Figure 2−19). The Group node is split
into priority groups: First Priority, Second Priority, and Third Priority. Each of
these priority groups contains a number of individual tests.
Test grouping differs between digital video standards. However, all of the
currently implemented standards contain a subset of the relevant TR 101 290
tests. Note that in standards other than DVB, the tests are not numbered.
Where relevant, PIDs will be associated with a test in the test tree when the test
has either been disabled, or when it has failed.
The LED associated with each node indicates the status of the node and its child
node tests (see Error Status LEDs on page 2−26). Total entries in the Event Log
for each group of tests and for each test are are indicated in parenthesis; resetting
a group of tests or a test restarts the count in parenthesis.
MTS400 Series MPEG Test System User Manual
2−45
Page 72

TSCA - Using the Tests View
Test Filtering
Interpreting theh display of tests can be made easier using the three filter buttons
at the top of the Tests navigation view.
Grey White Green
Figure 2−20: Test filtering buttons
Each button, when selected, will hide a category of tests in the display.
H When you select the grey button, tests that are currently disabled will not be
displayed in the test tree.
H When you select the white button, tests that currently have either unknown
or not applicable status will not be displayed in the test tree.
H When you select the green button, tests that currently have OK status will
not be displayed in the test tree.
2−46
MTS400 Series MPEG Test System User Manual
Page 73
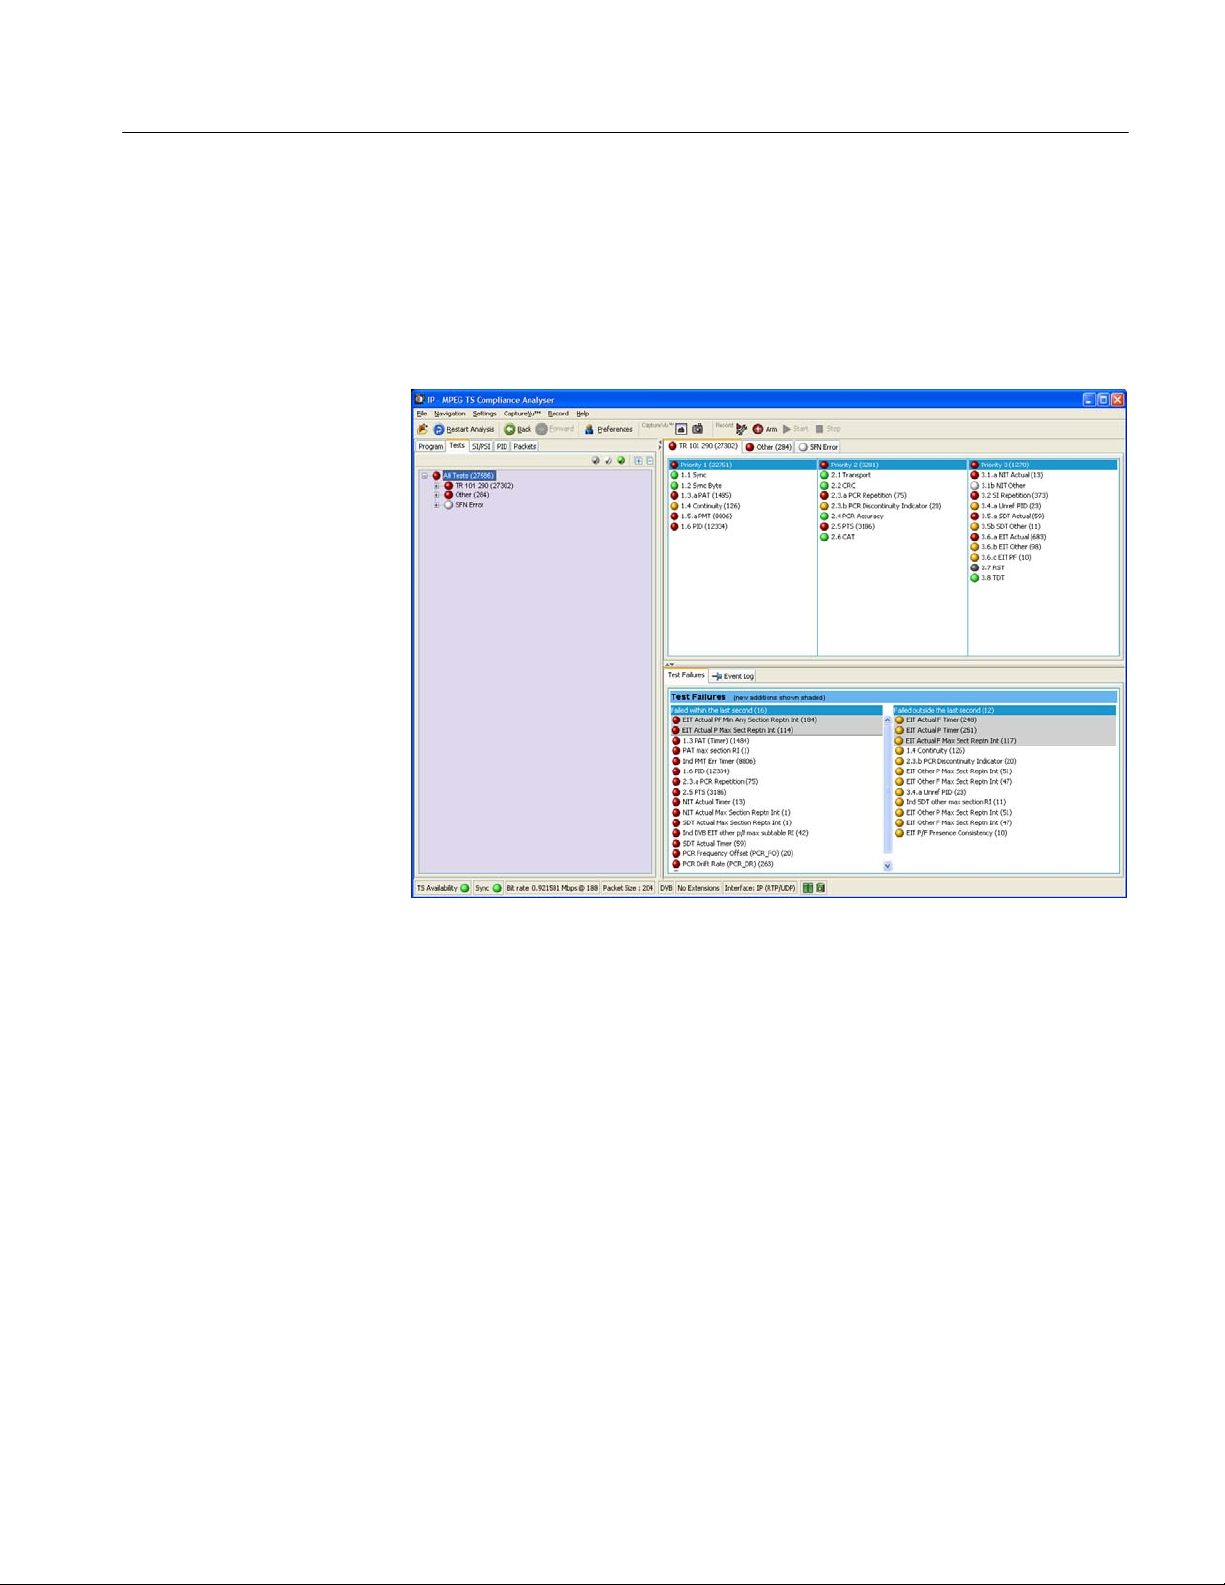
Tests Navigation - All Tests
The detail view when the All Tests node is selected is shown in Figure 2−18 on
page 2−43. In addition to a summary of all tests, the event log shows the most
recent 10000 events that have occurred during analysis of the stream.
Test Failures View
TSCA - Using the Tests View
Figure 2−21: Test Failures screen
The Test Failures view provides an overview of the tests that have failed during
stream analysis. The view is divided into two panes. The left panes shows those
tests that have failed in the last second. The right pane shows those tests that
have failed, not including those that have failed in the last second, and are
displayed on the left side.
If a test fails, it will be displayed on the left side. When it no longer fails, it will
be removed from the left side and listed on the right side as a test that has
previously failed. If the test fails again, it will be removed from the left side and
redisplayed on the right side until it no longer fails.
Additionally, tests that have been listed (in either pane) in the last second are
displayed at the top of the list and shaded.
MTS400 Series MPEG Test System User Manual
2−47
Page 74

TSCA - Using the Tests View
Test Navigation - Test Nodes
When you select a test node, the Associated PIDs pane displays a summary of all
of the PIDs and an event log listing all events that are associated with the test.
Where parameters are applicable to the test, you can modify them under the
Parameters tab.
2−48
MTS400 Series MPEG Test System User Manual
Page 75

Test Navigation - PID Nodes
Where tests have failed, the PIDs affected are listed under the test node in the
Tests navigation view. Selecting a PID will display the Event Log, Parameters
for the PID, and the test in the detail view.
TSCA - Using the Tests View
MTS400 Series MPEG Test System User Manual
2−49
Page 76

TSCA - Using the Tests View
2−50
MTS400 Series MPEG Test System User Manual
Page 77

Using the Tables View
The Tables view (SI/PSI tab) displays service information in tree form, as in the
other navigation views. The tree represents the service information tables that
have occurred in the analyzed stream and which comply with the selected digital
video standard. This includes MPEG program specific information, DVB service
information, ATSC and ISDB program information, and system information
protocol. The tree contains nodes for each table found; tables/nodes are grouped
together by functionality. Figure 2−22 shows an example of the Table navigation
view with DVB stream interpretation selected.
Figure 2−22: Tables view
Every node within the service information tree has a corresponding summary
view. Nodes that represent tables will also provide you with access to the table
structure and hex data (see Tables Detail View - Section View on page 2−53), and
graphical displays of data rates and interval data (see Tables Detail View - SI
Repetition Graphs on page 2−55).
MTS400 Series MPEG Test System User Manual
2−51
Page 78

TSCA - Using the Tables View
Table Summary Pane
Some of the nodes that represent less common tables or table groups may not
have specific summary views available in the analyzer. In these cases, a generic
summary view is used.
The table summary view provides a summary of the table related information for
the analyzed transport stream. There is a table summary view for every node of
the service information. The content is dictated by the selected node.
All summary views for nodes that represent an individual table or subtable will
display the table identity and version number of the table from which the
information is extracted. Where relevant, links (underlined text) are provided to
associated objects, for example, in the programs summary (Figure 2−23), links
are provided to the individual program summary views. Similarly, arrow icons
provide links to the electronic program guide (EPG) tables. Where the section is
carried on a PID, a link is also provided to the PID view.
Figure 2−23 shows an example of the summary pane with the PMT PIDs node
selected in the navigation view.
2−52
Figure 2−23: Tables view - Programs (example)
MTS400 Series MPEG Test System User Manual
Page 79

TSCA - Using the Tables View
EPG Views
A specific departure from the Table Summary view described previously is the
EPG view that is displayed when a section of the EPG table is highlighted. For a
description of the general presentation of the EPG view, see page 2−11 5.
Tables Detail View - Section View
The detailed section view is available when the selected node in the service
information tree represents a table or subtable in the transport stream. During
real-time analysis the view is continually updated.
The subtable identity, version, and section are displayed at the top of the table
pane.
NOTE. In deferred mode, where two or more subtables, versions or sections are
found in the stream, the relevant field is active and an alternative selection can
be made from the drop-down list.
In real-time mode, only the latest version and section can be viewed.
MTS400 Series MPEG Test System User Manual
2−53
Page 80

TSCA - Using the Tables View
The table pane shows all fields that make up a section (for example, PMT). The
fields are arranged in a hierarchical order. The presence of subordinate fields is
indicated using { } bracket symbols adjacent to the container field. The container
can be expanded or collapsed by clicking the + or – icon.
Below the table pane, the data source is displayed. The data pane shows the data
bytes (in both hexadecimal number format and ASCII character format) for the
selected table, version, and section. When a node is selected in the table pane,
the bytes that make up the selected node (including the subordinate nodes) are
highlighted in the hexadecimal data pane (refer to Figure 2−24).
2−54
Figure 2−24: Section payload
If the section is corrupt or empty, the hexadecimal view background is red
instead of blue.
MTS400 Series MPEG Test System User Manual
Page 81

Tables Detail View - SI Repetition Graphs
The section graph view will be available when the selected node in the service
information tree represents a table or subtable in the transport stream. You can
view graphs of the following data:
H Section repetition interval:
This graph displays the interval between two sections of a table on a
particular PID.
H Subtable intersection gap:
This graph displays the interval between sections in a particular subtable.
H Subtable repetition interval:
This graph displays the time between receiving one complete subtable and
receiving the next complete subtable.
NOTE. Not all of the above graph types are relevant to all table types.
TSCA - Using the Tables View
Graph Management is described in more detail in the Common User Interface
Concepts section of this manual (see page 2−85).
MTS400 Series MPEG Test System User Manual
2−55
Page 82

TSCA - Using the Tables View
2−56
MTS400 Series MPEG Test System User Manual
Page 83

Using the PID View
The PID view displays information about all of the PIDs found in the transport
stream being analyzed. The navigation view contains the PID tree structure
representing all of the PIDs that have occurred within the transport stream.
In DVB analysis mode, the MPE tab is always present. However, the MPE view
will only be populated when MPE data is present in the stream (see page 2−11 9) .
MTS400 Series MPEG Test System User Manual
2−57
Page 84

TSCA - Using the PID View
PID View - All PIDs
In the navigation view, PIDs are grouped under the following subordinate nodes:
H Reserved PIDs
H Referenced PIDs
H Unreferenced PIDs
H User PIDs
H Obsolete PIDs (deferred analysis only)
The number of PIDs in each group is shown adjacent to the node. The root node
label shows the total number of PIDs found and the Network Name.
When highlighted, the All PIDs node displays in the detail pane all of the PIDs
found in the analyzed stream.
Each of these subordinate nodes contains PIDs belonging to that group. PIDs are
allocated during analysis, and the number of PIDs is identified for each node.
You can also allocate PID numbers to the User PID node, although User PIDs
may not necessarily have been found in the stream. This feature allows you to
compare the properties of one or more PIDs more easily.
The associated summary view provides a PID-oriented overview of the transport
stream, allowing you to see the relative data rates of all of the PIDs contained
within the transport stream. The information can be displayed as either a bar
chart, or as a pie chart. Columns in the summary views can be sorted in
ascending or descending order by clicking on the column header. PID related
information is available under the PID Information tab.
Each PID is associated with a number of tests. If one or more tests fail, they will
be listed under the relevant PID node in the navigation view. Selecting the PID
node will display a summary, in the detail view, of all associated tests that have
been found. Selecting a specific test in the Associated Tests pane will display the
Event Log and Parameters for only that test.
2−58
MTS400 Series MPEG Test System User Manual
Page 85

PID View - Detail View (All PID and PID Group)
The All PID and PID Group detail view provides you with a PID-oriented
overview of the transport stream. This view is displayed when any of the main
nodes is selected in the navigation pane: All PIDs, Referenced PIDs, Unreferenced PIDs, or User PIDs.
The view shows the relative data rates of all of the PIDs contained within the
selected node. You can display the information in either a bar chart or a pie
format. The associated test states are shown in all views.
TSCA - Using the PID View
Figure 2−25: PID Summary view
The PID Information view (see Figure 2−26) provides PID related information,
for example, PID type stream type, scrambled status and the presence of PCRs.
Layer information is also shown when analyzing ISDB streams. The icons
provide an indication of the PID content (see Icons, page 2−87).
Where a PID carries video or audio, thumbnails are displayed under the Now
Playing tab.
In deferred mode (or during CaptureVu analysis), you can view the packets
carrying a PID by highlighting the PID, and selecting the Go To Packets view
MTS400 Series MPEG Test System User Manual
2−59
Page 86
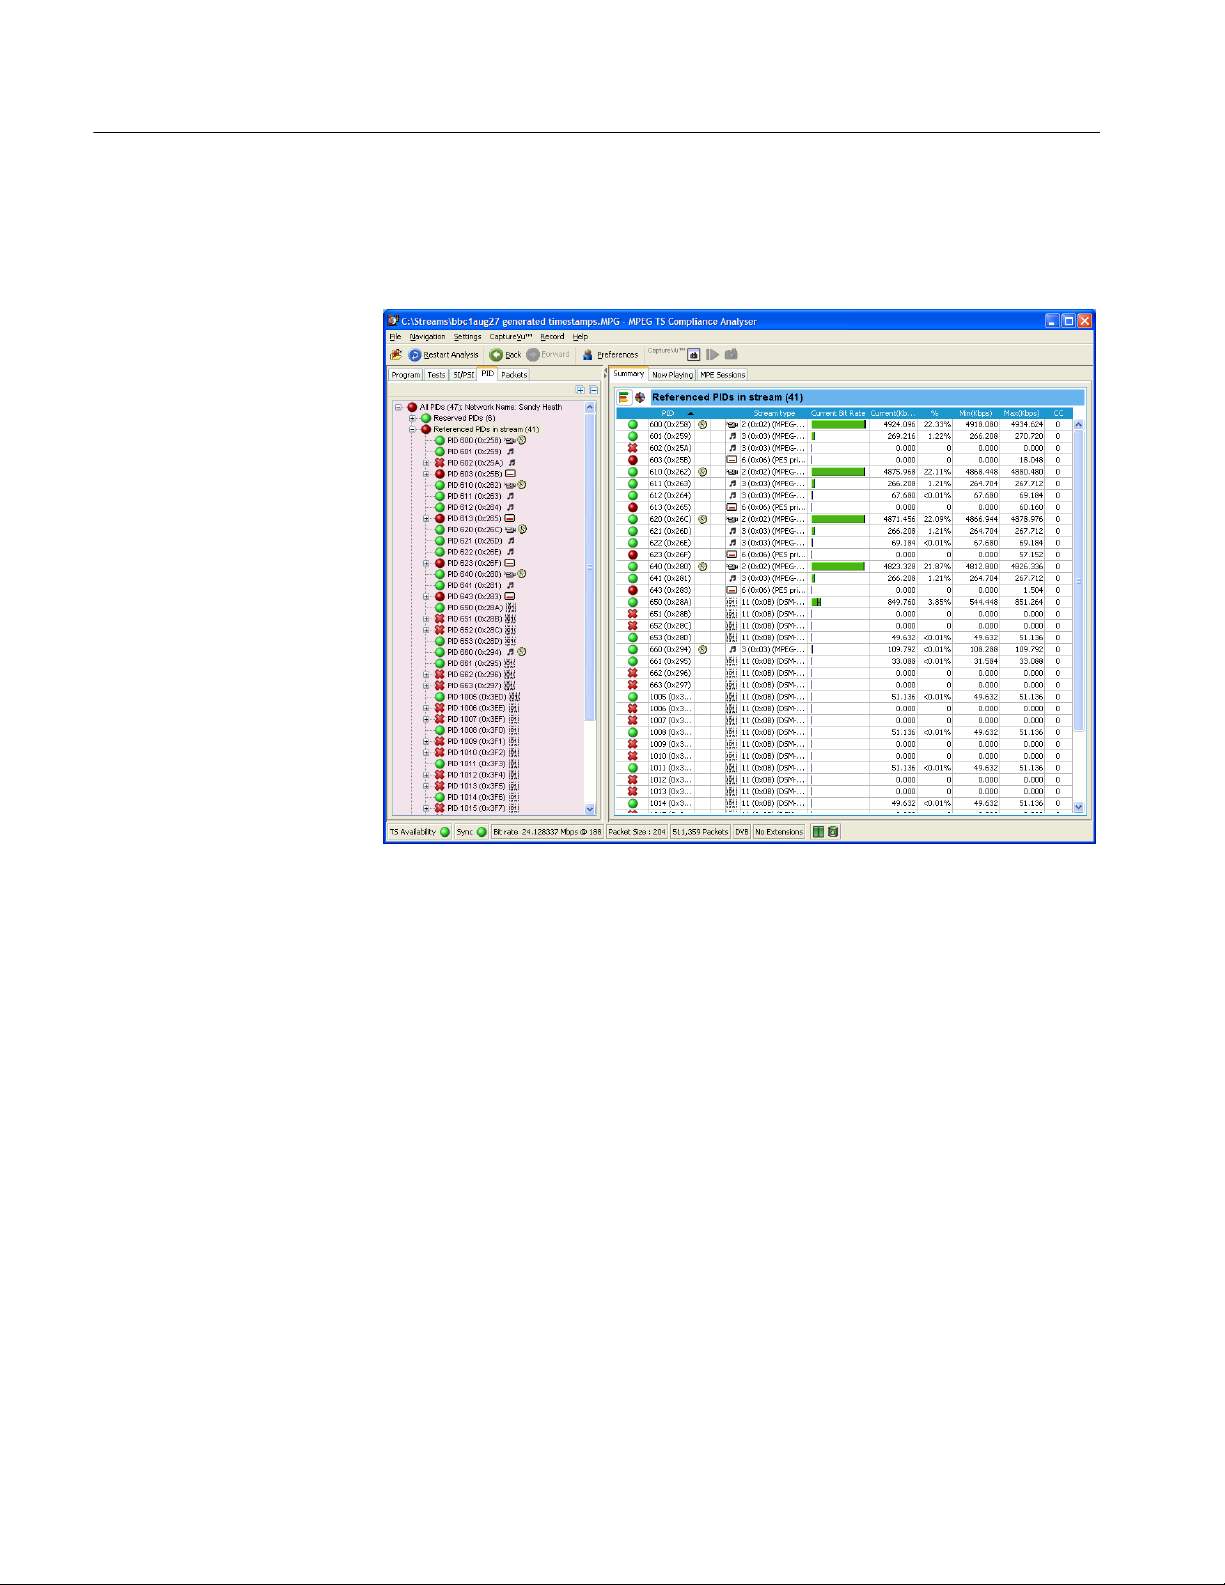
TSCA - Using the PID View
from the shortcut menu. The packet will be added to the PIDs list (in the Packets
view).
Figure 2−26: PID Information view
PID View - Detail View (PIDs)
The individual PID detail view provides you with information about the selected
PID. This view will be visible when you select an individual PID node in the
PID tree. Where a PID has failed a test, one or more test nodes are displayed as
child nodes of the PID.
The combination and detail of the views vary depending on the selected PID type
and node.
During deferred or captured analysis, the packets carrying the PID can be
examined in more detail by highlighting a PID, and selecting the Go to Packets
view from the shortcut menu.
2−60
MTS400 Series MPEG Test System User Manual
Page 87

TSCA - Using the PID View
Ordinary PID Selected
PCR PID Selected
When a PID does not contain PCRs, the main view in the PID pane is the
Associated Tests view. This view lists the tests associated with the selected PID.
The status of the individual tests is indicated with LED icons. Also available are
Bit rate Graphs which show the bit rate of the selected PID in graphical form.
Also on the Associated Tests tab is an event log and a parameters pane. The
event log shows all PID related events. If a test is selected in the PID pane, only
the events associated with that test on that PID are shown. Similarly, when a test
is selected, the Parameters pane shows the parameters associated with that test
(when applicable).
When the selected PID contains PCR information, PCR inaccuracy and PCR
interval data graphs will be displayed in addition to a bit rate graph. When the
transport stream contains time stamped data, the PCR overall jitter, the PCR
frequency offset, and the PCR drift rate graphs will also be available. For
real-time IP analysis, the Packet Interval Timing (PIT) graph is also available
(see page 2−101).
A Presentation Time Stamp (PTS) graph may also be available on PIDs carrying
audio and video information.
(See also Graph Management, page 2−91 and Timing Graphs, page 2−97.)
MTS400 Series MPEG Test System User Manual
2−61
Page 88

TSCA - Using the PID View
2−62
MTS400 Series MPEG Test System User Manual
Page 89

Using the Packets View
NOTE. The Packets view is available only during deferred analysis and
CaptureVu analysis.
Data in the stream is carried in 188- or 204-byte packets. The Packets view
allows you to examine the contents of each packet in the analyzed stream.
The packet navigation view shows a tree structure which represents the packets
within a stream grouped according to content, including PID value, SFN
mega-initialization packets (MIPs) (DVB only), and ISDB-T information packets
(IIPs).
The All Packets, MIP and IIP nodes do not have any child nodes. The All
Packets node represents all of the packets in the transport stream. The MIP node
represents all of the DVB SFN MIPs in the transport stream. The IIP node
represents all of the ISDB-T information packets in the transport stream.
The PIDs node represents all of the PIDs that are of interest. You can add PIDs
in the transport stream to this node, and to PIDs that are contained within the
user PID list.
MTS400 Series MPEG Test System User Manual
2−63
Page 90

TSCA - Using the Packets View
Packet Navigation Bar
Selecting any leaf node in the packet tree will apply a packet filter to the
associated packets. For example, selecting a PID node will only allow packets
carrying that particular PID to be displayed in the associated summary view.
Similarly, selecting the MIP node will only allow MIP information to be
displayed in the associated summary view.
In the packet summary view, you can use the top bar to navigate the packets in
the stream.
The packet position bar shows the position of the selected packet in the stream.
Current packet position
The navigation bar functionality depends on the selection in the packet navigation view. If you select All Packets, the controls will operate on all packets. If
you select a single PID, a filter is in operation, and the controls will work only
for those packets carrying that PID.
Selects the first available packet (in the stream or carrying the selected PID)
Selects the previous available packet (in the stream or carrying the selected PID)
Selects the next available packet (in the stream or carrying the selected PID)
Selects the last available packet (in the stream or carrying the selected PID)
Opens the Go To Packet dialog box
You can also use the packet position bar to navigate through the stream. To do
so, use the cursor to point to and click the next packet to be displayed. Doubleclick the packet number in the bar to open the Go To Packet dialog box. Enter
the required packet number and select OK. For both methods, remember that the
destination packet is dependent on the node selected in the navigation view.
2−64
MTS400 Series MPEG Test System User Manual
Page 91

Packet Navigation - Filter Nodes
The packet filters allow you to view packets carrying PID.
To inspect the sequence of packets carrying a particular PID, you must add the
PID to the PID Filters node in the Packet Navigation view. PIDs carrying
sections can also be viewed. You can add as many PIDs as are required. There
are a number of ways to add a PID to the node; as described in the following
paragraphs.
Adding a PID in the Packet
View
1. In the Packet view, expand the PIDs node by doing one of the following:
H Double-click the child node (double-click to add a PID)
H Select Add PID... from the PIDs node shortcut menu
2. In the Add PID... dialog box, expand the nodes, locate and select the
required PID.
TSCA - Using the Packets View
Removing PIDs
3. Click OK.
The selected PID is added to the PIDs node, and the first occurrence of a
packet carrying the selected PID is displayed in the summary view.
Added PIDs will be stored when the application is closed. They will be
reinstated when the application is reopened. However, if a different stream is
analyzed, the stored PIDs may not be used.
All PIDs previously added to the PID node can be removed by selecting Remove
All from the PIDs node shortcut menu.
MTS400 Series MPEG Test System User Manual
2−65
Page 92

TSCA - Using the Packets View
Packet Detail View
The detail view shows the fields and data that are contained in a packet. The
fields are arranged in a hierarchical order. The presence of subordinate fields is
indicated using { } bracket symbols adjacent to the container field. To expand or
collapse the container, click the + or - icon.
Below the table pane, the data source is displayed. The data pane shows the data
bytes (in both hexadecimal number format and ASCII character format) for the
selected packet. When you select a node in the table pane, the bytes that make up
the selected node (including the subordinate nodes) are highlighted in the
hexadecimal data pane.
2−66
The packet transport header bytes are displayed in red. Similarly, bytes greater
than 188 are displayed in gray. The adaptation field, where present, is displayed
in blue.
If the section is corrupted or empty, the background of the hex view is red
instead of blue.
MTS400 Series MPEG Test System User Manual
Page 93

TSCA - Using the Packets View
ISDB Streams
Figure 2−27 and Figure 2−28 show an example of the packet detail view with an
analyzed ISDB-T stream. Note the IIP tab and the additional TMCC and IIP
nodes.
Figure 2−27: Packet view - ISDB detail -IIP
MTS400 Series MPEG Test System User Manual
2−67
Page 94

TSCA - Using the Packets View
Figure 2−28: Packet view - ISDB detail - Transport packet
2−68
MTS400 Series MPEG Test System User Manual
Page 95
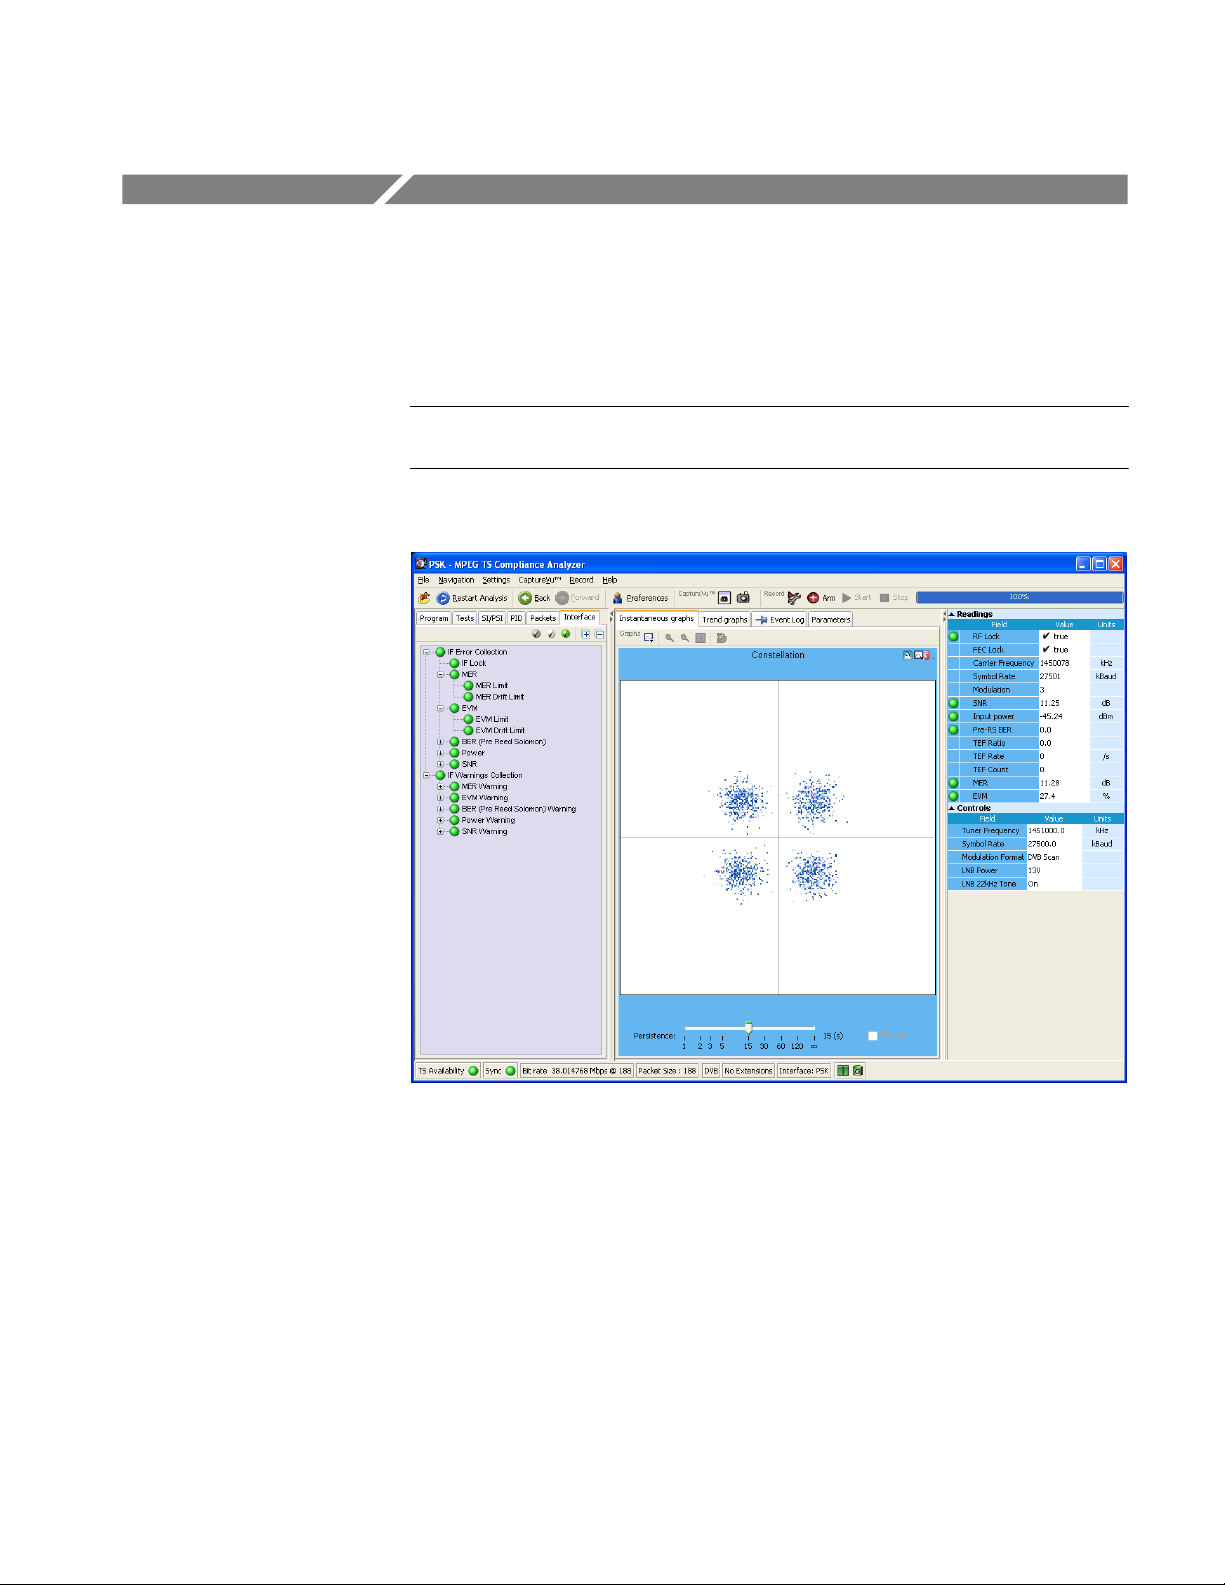
Using the Interface View
If real time analysis using an interface card is invoked, the Interface tab is
displayed in the Navigation view of the TSCA window.
NOTE. The Interface view is available only if an interface card is selected for
real-time analysis.
Figure 2−29: Interface View - Example
Two interface card test nodes are displayed in the navigation view: IF Error
Collection and IF Warning Collection. Each collection contains a range of tests
(see Figure 2−29).
The detail of the interface view is different for each interface type.
MTS400 Series MPEG Test System User Manual
2−69
Page 96

TSCA - Using the Interface View
Detail View Tabs
The detail view contains four tabs: Instantaneous graphs, Trend graphs, Event
Log, and Parameters. This section describes the tabs in general terms. The
following sections describe in detail the tabs associated with each interface type.
Instantaneous Graphs
Trend Graphs
Event Log
Parameters
Readings and Controls
The instantaneous graphs display instantaneous measurements in graphical form.
The trend graphs display trends in measurements in graphical form.
The event log displays a history of the events related to the item selected in the
navigation view.
The parameters tab display the parameters associated with the test highlighted in
the navigation view. Parameter editing is described in the Common User
Interface Concepts section, page 2−104.
The right panel contains Readings and Controls. The Readings area displays
values received from the card itself.
The RF Lock LED conveys different types of information. If full lock onto the
channel is acquired and it is receiving the signal correctly, the LED will light up
green. When a signal is present but no lock is achieved, the indicator is red.
When no signal is found, the indicator is gray.
2−70
In the Readings area, the LED colors are as follows:
Green On
Red Out of range or failed test
Gray Off or not applicable
MTS400 Series MPEG Test System User Manual
Page 97

The Readings background colors are as follows:
White In range
Red Out of range; for example, too much or too little power or out of order packets
Yellow Not recently updated
Gray Not applicable; for example, out of order packets not being available when the
The Controls area contains user controls. Values entered here will be applied to
the card and will affect its performance. These controls correspond exactly with
those on the Open Transport Stream dialog box.
RF Interface Card Overview
TSCA - Using the Interface View
per second being greater than zero
UDP protocol is selected
This section describes the configuration and interpretation of results of the RF
interface cards that may be installed in MTS400 Series MPEG Test Systems.
The interface settings described are as follows:
H QAM (Quadrature Amplitude Modulation) (Annex B II) (see page 2−74)
H COFDM (Coded Orthogonal Frequency Division Multiplexing)
(see page 2−77)
H QPSK/8PSK (Phase Shift Keying) (see page 2−82)
H 8VSB (Vestigial Side Band) (see page 2−80)
(Refer to the MTS400 Series Technical Reference, 071-1724-xx for the interface
technical specifications.)
Only one RF interface card can be installed in the MTS400. All RF interface
measurements and graphs include a constellation diagram with MER rings,
EVM, SNR, and BER measurements. The installed interface can be used
simultaneously with an IP input. All interfaces have dual-level warning and
failure alarms plus RF drift tests for long term trend monitoring.
The input card screen and configuration of the card will depend on which
interface card is installed.
MTS400 Series MPEG Test System User Manual
2−71
Page 98

TSCA - Using the Interface View
RF Interface Card Set Up
The RF interface card configuration is set up when analysis is started using the
Open Transport Stream dialog box. The settings can subsequently be changed
during analysis from the Interface View.
When real-time analysis is selected and an RF interface is selected from the
Interfaces drop-down list. The Firmware Version and the current Interface
Settings of the card are displayed.
2−72
Figure 2−30: Open Transport Stream dialog box
If the firmware version is incorrect, the Update Firmware... button is enabled,
and you will not be able to proceed with the setup and analysis until the
firmware is updated (see page 2−73).
1. In the Open Transport Stream dialog box, select Real-time Analysis.
2. Select the RF interface from the Interfaces drop-down list.
3. Enter the interface settings required (see the following pages for descriptions
of the settings for each RF interface card).
4. Select OK to start the analysis.
The name of the interface selected is displayed in the TSCA status bar.
MTS400 Series MPEG Test System User Manual
Page 99

TSCA - Using the Interface View
RF Interface Card
Firmware Update
If the interface card firmware needs updating, a message will be displayed when
real-time analysis is selected. The Update Firmware... button will also be
enabled.
Update the interface card firmware as follows:
1. Select Update Firmware....
2. In the Update Firmware dialog box, select Start.
Figure 2−31: RF Firmware update
3. The dialog box will display progress of the update. The box will close when
the update is complete.
CAUTION. Removing power from the MTS400 while the firmware upgrade is in
progress can cause fatal corruption of the firmware files.
MTS400 Series MPEG Test System User Manual
2−73
Page 100

TSCA - Using the Interface View
RF Interface View Screens
This section describes the settings and displays associated with the RF interface
cards.
RF Interface -
QAM (Annex B)
The settings and displays of the QAM (Annex B) RF interface card are as
follows: QAM(B) Interface Settings, QAM(B) Instantaneous Graphs, and
QAM(B) Trend Graphs.
2−74
Figure 2−32: Interface View - RF - QAM (Annex B)
QAM(B) Interface Settings. The following QAM (Annex B) settings are available
on the Open Transport Stream - Real Time Analysis dialog box, and also in the
Interface tab - Controls area.
Tuner Frequency (kHz): This value, set in kHz units, is the center frequency of
the channel to be received. Any frequency can be entered. There is no need to follow a channel plan. The
frequency resolution is determined by the tuner step size
of 62.5 kHz.
MTS400 Series MPEG Test System User Manual
 Loading...