


xx
MTS400 Series
MPEG Test Systems
ZZZ
Analyzer Applications
User Manual
*P077020502*
077-0205-02


xx
MTS400 Series
MPEG Test Systems
ZZZ
Analyzer Applications
User Manual
This document supports version 1.9 and above.
www.tektronix.com
077-0205-02

Copyright © Tektronix. All rights reserved. Licensed software products are owned by Tektronix or its subsidiaries
or suppliers, and are protected by national copyright laws and international treaty provisions.
Tektronix products are covered by U.S. and foreign patents, issued and pending. Information in this publication
supersedes that in all previously published material. Specifications and price change privileges reserved.
TEKTRONIX and TEK are registered trademarks of Tektronix, Inc.
CaptureVu and FlexVu Plus are registered trademarks of Tektronix, Inc.
Contacting Tektronix
Tektronix, Inc.
14150 SW Karl Braun Drive
P.O. B o x 5 0 0
Beaverton, OR 97077
USA
For product information, sales, service, and technical support:
In North America, call 1-800-833-9200.
Worl dwid e, vis it www.tektronix.com to find contacts in your area.

Warranty
Tektronix warrants that the media on which this software product is furnished and the encoding of the programs on
the media will be free from defects in materials and workmanship for a period of three (3) months from the date of
shipment. If any such medium or encoding proves defective during the warranty period, Tektronix will provide
a replacement in exchange for the defective m edium. Except as to the media on which this software product is
furnished,
Tektronix does not warrant that the functions contained in this software product will meet Customer ’s requirements
or that the operation of the programs will be uninterrupted or error-free.
In order to obtain service under this warranty, Customer must notify Tektronix of the defect before the expiration
of the warranty period. If Tektronix is unable to provide a replacement that is free from defects in materials and
workmanship within a reasonable time thereafter, Customer may terminate the license for this software product
and return this software product and any associated materials for credit or refund.
THIS WARRANTY IS GIVEN BY TEKTRONIX WITH RESPECT TO THE PRODUCT IN LIEU OF ANY
OTHER WARRANTIES, EXPRESS OR IMPLIED. TEKTRONIX AND ITS VENDORS DISCLAIM ANY
IMPLIED WARRANTIES OF MERCHANTABILITY OR FITNESS FOR A PARTICULAR PURPOSE.
TEKTRO
PAYMENT IS THE SOLE AND EXCLUSIVE REMEDY PROVIDED TO THE CUSTOMER FOR BREACH
OF THIS WARRANTY. TEKTRONIX AND ITS VENDORS WILL NOT BE LIABLE FOR ANY INDIRECT,
SPECIAL, INCIDENTAL, OR CONSEQUENTIAL DAMAGES IRRESPECTIVE OF WHETHER TEKTRONIX
OR THE VENDOR HAS ADVANCE NOTICE OF THE POSSIBILITY OF SUCH DAMAGES.
[W9b – 15AUG04]
this software product is provided “as is” without warranty of any kind, either express or implied.
NIX’ RESPONSIBILITY TO REPLACE DEFECTIVE MEDIA OR REFUND CUSTOMER’S


Table of Contents
General Safety Summary ......................................................................................... xi
Preface ............................................................................................................. xiii
Related Documentation ..................................................................................... xiv
Transport Stream Compliance Analyzer
Transport Stream Compliance Analyzer - Getting Started . . .... . ..... . ..... . ..... . ..... . ..... . ..... . ... . . ... 1-1
TSCA Features............................................................................................... 1-2
File Analysis and Real-Time Modes....................................................................... 1-2
Technical Background....................................................................................... 1-3
User Interface ................................................................................................ 1-3
CaptureVu Feature...................................... ................................ ..................... 1-5
Triggered Recording............................ ................................ ............................. 1-5
Starting the TSCA Software......................... ................................ ....................... 1-6
Interface Card Overview.................................................................................. 1-13
Setting Up the IP Interface. ..... . ... . . . .... . ..... . ..... . ... . . ..... . ..... . ... . . . .... . ..... . ..... . ..... ..... 1-15
Real-Time Interface Presets .............................................................................. 1-28
Starting Analysis........................................................................................... 1-29
Setting the Stream Content Font . ..... . ..... . ... . . ..... . ..... . .... . . .... . ..... . ..... . .... . ..... . ..... . ... 1-30
Understanding the TSCA Window ........................................................................... 1-33
TSCA Top Level Displays............................. ................................ ................... 1-34
TSCA Window Components ............................................................................. 1-34
Error Status LEDs ......................................................................................... 1-38
Context Menus ...... .................................. ................................ ..................... 1-40
Using the Program View....................................................................................... 1-41
Program Navigation - Transport Stream Node .................. .................................. ..... 1-43
Program Navigation - Program Nodes . .................................. ............................... 1-49
Program Navigation - Elementary Stream Node ...... ................................ ................. 1-51
Using the Tests View........................................................................................... 1-54
Tests Navigation - All Tests .............................................................................. 1-58
Test Navigation - Test Nodes ............................................................................. 1-59
Test Navigation - PID Nodes ...... ................................ ................................ ....... 1-60
Using the Tables View ............................ ................................ ............................. 1-61
Table Summary Pane...................................................................................... 1-62
Tables Detail View - Section View ..... .................................. ............................... 1-63
Tables Detail View - SI Repetition Graphs .... . . .... . . .... . ..... . ..... . ..... . ..... . ..... . ..... . ..... . .. 1-65
Export SI/PSI as XML ....................... ................................ ............................. 1-65
Using the PID View ... ................................ .................................. ....................... 1-66
PID View - All PIDs....................................................................................... 1-66
MTS400 Series Analyzer Applications User Manual i

Table of Contents
PIDView-Detai
PID View - Detail View (PIDs) .......................................................................... 1-69
Using the Packets View ..................... ................................ ................................ ... 1-71
Packet Navigation Bar .................................................................................... 1-72
Packet Navigation - Filter Nodes . ..... . ... . . . .... . ..... . ..... . ..... . ..... ..... . ..... . ..... . ..... . ... . . . . 1-73
Packet Detail View ........................................................................................ 1-74
Using the Interface View ...................................................................................... 1-76
Detail View Tabs.................. ................................ ................................ ......... 1-76
Readings and Controls ....................... .................................. ........................... 1-77
RF Interface Views ......................... ................................ ............................... 1-78
IP Video Gigabit Ethernet Interface .. ................................ ................................ ... 1-88
GbE Video over IP Interface ...................... ................................ ....................... 1-97
Common User Interface Concepts............................................................................ 1-98
Windows Management........................... ................................ ......................... 1-98
Icons........................ .................................. ................................ .............. 1-100
Graph Management................... ................................ ................................ .... 1-103
Timing Graphs ........................ ................................ ................................ .... 1-109
Bit Rate Graphs ... ................................ .................................. ...................... 1-112
PIT Graph...................... ................................ .................................. .......... 1-113
RTP Loss Distribution Graph................................ .................................. .......... 1-113
Thumbnail Views ......................................................................................... 1-115
Parameter Edit..................................... .................................. ...................... 1-117
Event Log........................................ ................................ .......................... 1-119
Bit Rates ................................................................................................... 1-122
EPG View................................ ................................ .................................. 1-127
MPE Views.................. .................................. ................................ ............ 1-132
CaptureVu Feature...................................... ................................ .................. 1-132
Triggered Recording...................................................................................... 1-135
Menu Bar and Options ................................................................................... 1-140
Configuration.............................................................................................. 1-142
Script Files... .................................. ................................ ............................ 1-148
Task Examples ................................................................................................. 1-153
Which Tests Have Failed in an Analyzed Stream ..................... ................................ 1-154
How Many PIDs Are There in a Stream? How Many PIDs Are Referenced? How Many Are
Unreferenced? ........................................................................................ 1-156
What Tests Have Been Applied to a Program PID? ............................ ...................... 1-157
Establish the Stream Type of a PID..................................................................... 1-158
How Many Programs Are There in the Stream? ...................................................... 1-159
What Are the Contents Of the Programs? And What Pids Are They On? ......................... 1-160
What is the Bit Rate of Each PID in a Progr
What is the Latest Version Number of the Program Association Table (PAT) in the SI? .... . .... 1-164
l View (All PID and PID Group) .................................................... 1-68
am?...................................................... 1-160
ii MTS400 Series Analyzer Applications User Manual

Table of Contents
ExamineaTrans
SI/PSI Nodes............... ................................ .................................. .................. 1-167
port Packet............................................................................. 1-165
Packetized Elementary Stream Analyzer
Getting Started .... . ..... . ..... . .... . . .... . ..... . ..... . ... . . ..... . ..... . ... . . . .... . ..... . ..... . ... . . ..... . ..... . ... 2-1
Starting the Program......................................................................................... 2-2
Options........................................................................................................ 2-4
Opening a File................................................................................................ 2-7
Menus and Controls ............................................................................................ 2-11
Toolbar ............... ................................ .................................. ..................... 2-11
Status Bar ................................................................................................... 2-12
Slider Bar ................................................................................................... 2-13
Menus and Options ........................................................................................ 2-14
Packet Hex View....... .................................. ................................ ....................... 2-17
Packet Header .............................................................................................. 2-18
Event Log........................................................................................................ 2-20
Packet Selection............................... ................................ ............................. 2-20
Packet Header Interpretation ..... .................................. ................................ ........... 2-23
Program Structure ............................. ................................ ................................ . 2-25
The Diagram ............................ ................................ .................................. . 2-26
Selecting a Packet Type .................. .................................. ............................... 2-27
PTS/DTS Timing Analysis . . ..... . ..... ..... . ..... . .... . . .... . ..... . ... . . ..... . ... . . ..... . ..... . .... . ..... . ... 2-
Access Unit Selection ..................................................................................... 2-30
Scrolling the View . ..... . ..... . ... . . ..... . ..... . ..... . ..... . ..... . ..... . ..... . ... . . . .... . . .... . ..... . ..... . 2-31
Video Streams ........................... .................................. ................................ . 2-32
Audio Streams.............................................................................................. 2-34
AC-3 Audio Streams ...................................................................................... 2-35
AAC Audio Streams....................................................................................... 2-36
28
T-STD Buffer Analyzer
Getting Started .... . ..... . ..... . .... . . .... . ..... . ..... . ... . . ..... . ..... . ... . . . .... . ..... . ..... . ... . . ..... . ..... . ... 3-1
Suitable Streams ........................ ................................ ................................ ..... 3-1
Table Handling ............................................................................................... 3-2
Starting the Program......................................................................................... 3-2
Settings. ..... . ..... . ..... . ..... . ..... . ..... . ..... . ..... . ..... . ..... . ..... . ..... . ..... . ..... . ..... . ..... . ..... . . 3-4
Opening an MPEG File .......................... ................................ ........................... 3-8
Opening a BMR File ........................................................................................ 3-9
Window Layout ............................................................................................ 3-10
Initial Processing of MPEG Files ... . . .... . ..... . ..... . ..... ..... . ..... . ..... . .... . . .... . ..... . ..... . ... . 3-10
Initial Processing of BMR Files. . . ..... . ..... . ..... . ... . . . .... . ..... . ..... . ..... . ..... ..... . ..... . ..... . . 3-11
MTS400 Series Analyzer Applications User Manual iii

Table of Contents
Menus and Contr
Toolbar..................... ................................ ................................ ................. 3-12
Status Bar ................................................................................................... 3-13
Menu Options .............................................................................................. 3-14
Stream List ...................................................................................................... 3-18
Selecting Streams .......................................................................................... 3-19
Processing Streams ... ................................ .................................. ................... 3-20
Event and Message Logs ........................... ................................ ........................... 3-23
Global Event Log .......................................................................................... 3-23
PID Event Log ............................................................................................. 3-23
Trace ........................................................................................................ 3-25
Results Graphs .................................................................................................. 3-29
Common Features ................................ ................................ ......................... 3-29
Elementary Buffer Graph................................................................................. 3-38
Multiplex or Main Buffer Graph . . .... . . .... . . .... . ..... . ..... . ..... . ..... . ..... . ..... . ..... . ..... . ..... . 3-38
Transport Buffer Graph ............ .................................. ................................ ..... 3-39
ols ..... .................................. ................................ ..................... 3-12
Elementary Stream Analyzer
Elementary Stream Analyzer.................................................................................... 4-1
Starting the ES Analyzer.................................................................................... 4-2
Opening an MPEG Stream.................................................................................. 4-3
Understanding the Main Window and Icons.............................................................. 4-5
Tree View and Navigation ............................. ................................ ..................... 4-7
Header, Extension and Hex Displays .................................................................... 4-10
Error Testing Methods and Outputs .......................................................................... 4-13
Run Through Stream Test Mode .... ................................ .................................. ... 4-13
Error Filtering .... . ..... . ..... . ..... . ..... . ..... . ..... . ..... . ..... . ..... . ..... . ..... . ..... . ..... . ..... . ..... 4-14
Status Bar ................................................................................................... 4-20
Regression Testing and Error Log Files ................................................................. 4-21
Reports and Field Selection............................................................................... 4-23
Demultiplexing Transport Streams to PES or Elementary Output Files . . ..... . ..... . ... . . . .... . .... 4-26
Working with Transport and PES Streams.......... ................................ ......................... 4-27
Using Packet View...................................... ................................ ................... 4-27
Understanding PES........................................................................................ 4-28
Working with Video Streams... ................................ ................................ ............... 4-29
Viewing the Sequence Header..................... .................................. ..................... 4-30
Viewing the GOP and Picture Header................................................................... 4-31
Displaying the Slice and Macroblock ...... ................................ ............................. 4-35
Analyzing Picture Quality . . ..... . ..... . ..... . ..... . ..... . ..... . ... . . ..... . ..... . ..... . ..... . ..... . ..... . . 4-38
Using the Video Viewer for Picture Analysis........................................................... 4-49
iv MTS400 Series Analyzer Applications User Manual

Table of Contents
Working with Au
Understanding MPEG Audio Streams...................... .................................. ........... 4-52
Audio Player ............................................................................................... 4-53
Understanding Dolby Digital (AC-3) Audio Streams ................................................. 4-58
Working with Program Streams............................................................................... 4-62
Viewing Pack and System Headers............. ................................ ......................... 4-63
Viewing the
Working with Teletext.......................................................................................... 4-66
VBI (Enhanced Teletext Support)........................................................................ 4-67
Advanced Audio Compression................................................................................ 4-70
ADIF Stream Forms................ ................................ .................................. ..... 4-72
ADTS Stream Forms...................................................................................... 4-79
Closed C
DVB S
aption Analysis....................................................................................... 4-80
Enabling Closed Caption Analysis....................................................................... 4-80
Selecting Closed Caption Analysis Standard.... ................................ ....................... 4-81
CC-EIA608 Support....................................................................................... 4-81
CC-EIA708 Support....................................................................................... 4-83
Dumping Closed Caption Statistics....... ................................ ............................... 4-86
ubtitle Stream Analysis.. . . . .... . . .... . ..... . ..... . ..... . ..... . ..... . ..... . ..... . ..... .... . . ..... . ..... 4-89
DVB Subtitle Data Tab..... . ..... ..... . ..... . ..... . ..... . .... . . .... . ..... . ..... . ..... ..... . ..... . ..... . ... 4-91
Page View Tab ............................................................................................. 4-94
dio Streams ................................................................................. 4-52
Program Stream Map.................................. ................................ ..... 4-63
Index
In
dex
MTS400 Series Analyzer Applications User Manual v

Table of Contents
List of Figure
Figure 1-1: TSCA Program view - Deferred analysis ......................... ............................... 1-1
Figure 1-2: TSCA Start-up - Offline File Analysis ........................................................... 1-6
Figure 1-3: TSCA Start-up - Real-Time Analysis ... ................................ ......................... 1-7
Figure 1-4: Stream Interpretation dialog box.................................................................. 1-9
Figure 1-5: TSCA Open File Analysis (Offline) dialog box............................................... 1-10
Figure 1-6: TSCA Real-time Interface dialog box.......................................................... 1-12
Figure 1-7: Open Transport Stream dialog box ........................ ................................ ..... 1-14
Figure 1-8: Firmware update........... ................................ ................................ ....... 1-15
Figure 1-9: GbE Configure Interface dialog box. ................................ ........................... 1-17
Figure 1-10: Single subscription mode ....................... ................................ ............... 1-22
Figure 1-11: Multicast subscription mode ..... . ..... . ..... . ..... . ..... . ..... . ..... . ..... . ..... . ..... . ..... . . 1-23
Figure 1-12: Setting up the IP interface... . ..... . ..... . ..... . ..... . ..... . ..... . . .... . . .... . . .... . . ... . . . ... . . 1-25
Figure 1-13: UDP flow selection dialog box................................................................ 1-27
Figure 1-14: TSCA window showing analysis progress.... ................................ ............... 1-29
Figure 1-15: Selecting a display font from the Configuration dialog box................................ 1-31
Figure 1-16: FlexVuPlus Window ....................... ................................ ..................... 1-33
Figure 1-17: Analyzer window ............................................................................... 1-34
Figure 1-18: Analyzer window - no file...................................................................... 1-38
Figure 1-19: Context menu (example) ....................................................................... 1-40
Figure 1-20: Program view.................................................................................... 1-41
Figure 1-21: Program view nodes ..................... ................................ ....................... 1-42
Figure 1-22: Historical Multiplex Graph . .... . ..... . ..... . ..... . ..... . ..... . ..... . ..... . ..... . ..... . ..... . .. 1-46
Figure 1-23: Event log......................................................................................... 1-47
Figure 1-24: PCR Graphs view ........ ................................ ................................ ....... 1-53
Figure 1-25: Tests Navigation view . .................................. ................................ ....... 1-54
Figure 1-26: Test view nodes ............................ .................................. ................... 1-55
Figure 1-27: Test fi
Figure 1-28: Test Failures screen ............................................................................. 1-58
Figure 1-29: Tables view ............................... ................................ ....................... 1-61
Figure 1-30: Tables view - Programs (example) ............................................................ 1-62
Figure 1-31: Section payload .. ................................ ................................ ............... 1-64
Figure 1-32: PID Summary view ............................................................................. 1-68
Figure 1-33: PID Information view ..... .................................. ................................ ... 1-69
Figure 1-34: Packet view - ISDB detail -IIP ... . . .... . . .... . ..... . ..... . ..... . ..... . ..... . ..... . ..... . ..... . 1-75
Figure 1-35: Interface View - Example...................................................................... 1-76
Figure 1-36: Interface View - RF - QAM (Annex B) ................... .................................. . 1-78
Figure 1-37: Interface View - RF - COFDM. .................................. ............................. 1-81
Figure 1-38: Interface View - RF - 8VSB .............. .................................. ................... 1-84
s
ltering buttons ............................................................................ 1-57
vi MTS400 Series Analyzer Applications User Manual

Table of Contents
Figure 1-39: In
Figure 1-40: Interface view - IP Video................ .................................. ..................... 1-88
Figure 1-41: IP Traffic view (tear-off view)................................................................. 1-89
Figure 1-42: IP Video interface Readings view (tear-o
Figure 1-43: IP Video interface - Diagnostics............................................................... 1-94
Figure 1-44: IP Video interface graphs (tear-off view)...................... ............................... 1-95
Figure 1-45: GbE interface - IP Graphs......................... ................................ ............. 1-97
Figure 1-46: Window size adjustments ............................. ................................ ......... 1-99
Figure 1-47: Timing graphs .................... ................................ .............................. 1-104
Figure 1-48: Graph toolbar ................................................................................... 1-105
Figure 1-49: Graph context menu ........................................................................... 1-106
Figure 1-50: Out of range indicator ... .................................. ................................ .... 1-108
Figure 1-51: Bit rate graph ................................................................................... 1-112
Figure 1-52: Thumbnail view - Thumbnail view .......................................................... 1-115
Figure 1-53: Now Playing - Summary view.................................. .............................. 1-116
Figure 1-54: Now Playing - Detail view .................................................................... 1-116
Figure 1-55: Test parameters................................................................................. 1-117
Figure 1-56: PID test parameters ............................................................................ 1-118
Figure 1-57: Parameter value - default icon ................ .................................. .............. 1-119
Figure 1-58: Event log - color coding....................................................................... 1-121
Figure 1-59: Event log - context menu - color ............................................................. 1-121
Figure 1-60: Event log - color dialog boxes.......................... ................................ ...... 1-122
Figure 1-61: Bit Rate display selection ............................. ................................ ........ 1-123
Figure 1-62: Bar chart .... ................................ ................................ .................... 1-123
Figure 1-63: Pie chart ......................................................................................... 1-126
Figure 1-64: EPG Summary view ..................................... ................................ ...... 1-128
Figure 1-65: EPG nodes .. ................................ .................................. .................. 1-129
Figure 1-66: MPE view................................. ................................ ...................... 1-132
Figure 1-67: Record Settings dialog box .... . .... . ..... . ..... . ... . . ..... . ..... . .... . ..... . ..... . ... . . ..... . 1-136
Figure 1-68: Record Settings dialog box - Recording in progress . ..... . .... . . .... . ..... . ..... . .... . .... 1-139
Figure 1-69: PID selection ... ................................ .................................. .............. 1-140
Figure 1-70: Configuration - Test Parameters.................. .................................. .......... 1-143
Figure 1-71: PCR parameters - Filter settings.. . ... . . ..... . ..... . ..... . .... . . .... . ..... . ..... . ..... ..... . .. 1-144
Figure 1-72: Configuration - PCR Filters . ..... . ... . . . .... . ..... . ..... . ..... . ..... . ..... . ... . . ..... . ..... . .. 1-144
Figure 1-73: Configuration - Preferences ............................. ................................ ...... 1-145
Figure 1-74: Configuration - Preferences - Font ........................................................... 1-147
Figure 1-75: Configuration - Preferences - Decode ....................................................... 1-147
Figure 1-76: Stream Interpretation dialog box............................................................. 1-149
Figure 1-77: Failed tests - example........................ ................................ .................. 1-154
Figure 1-78: Program count .................. ................................ ................................ 1-159
Figure 1-79: PID count ....................................................................................... 1-160
terface View - RF - QPSK/8PSK ........................................................... 1-86
ff view) ........................................... 1-91
MTS400 Series Analyzer Applications User Manual vii

Table of Contents
Figure 1-80: Pr
Figure 1-81: Program PID bit rate - pie chart .............................................................. 1-162
Figure 1-82: Bit rate graph ..................................... ................................ .............. 1-163
Figure 1-83: Table Identity and Version (summary view) .... . ..... . ..... . ..... . ..... . ..... . ... . . ..... . .. 1-164
Figure 1-84: Table Identity and Version (section view) . . . .... . . .... . . .... . . .... . . .... . . .... . . .... . ..... . . 1-165
Figure 1-85: Primary SI/PSI nodes (DVB example) ...................................................... 1-167
Figure 4-1:
Figure 4-2: ADIF header Information............................... .................................. ....... 4-72
Figure 4-3: ADIF raw data Information ..................................................................... 4-73
Figure 4-4: Single channel element Information............................. ............................... 4-74
Figure 4-5: Coupling pair element information ............................................................. 4-74
Figure 4-6: Coupling channel element information ..... ................................ ................... 4-75
Figure 4
Figure 4-8: Data stream element information............................................................... 4-76
Figure 4-9: Program configuration element information................................................... 4-76
Figure 4-10: Fill element information......................... ................................ ............... 4-77
Figure 4-11: ADIF channels (non-standard) information ..................... ............................. 4-77
Figure 4-12: ADIF channels (standard) information ....................................................... 4-78
Figu
-7: Low frequency element channel information ................................................. 4-75
re 4-13: ADTS header information........................................... ........................... 4-79
ogram PID bit rate - bar chart .............................................................. 1-161
Icon Function Availability (Enabled/Disabled) Menu Bar equivalent ..... . ..... ..... . ..... . . 4-7
viii MTS400 Series Analyzer Applications User Manual

List of Tables
Table i: Overview of MTS400 Series analyzer applications........................ ......................... xiii
Table ii: MTS400 Series related documentation ........... ................................ ................... xiv
Table 1-1: MTS400 Series IP interface comparisons............ ................................ ........... 1-15
Table 1-2: Toolbar icons....................................................................................... 1-35
Table 1-3: Field descriptions, from left to right.................. .................................. ......... 1-36
Table 1-4: Program view tabs .................. ................................ ............................... 1-42
Table 1-5: Event log buttons .................................................................................. 1-47
Table 1-6: QAM(B) Settings .. . ..... . ..... . .... . ..... . ..... . ..... ..... . ..... . ..... . .... . ..... . ..... . ..... ..... 1-79
Table 1-7: COFDM Settings .... . .... . ..... . ..... . .... . ..... . .... . . .... . ..... . ... . . ..... . ... . . ..... . ..... . .... 1-82
Table 1-8: 8VSB settings ...................................................................................... 1-85
Table 1-9: QPSK/8PSK settings .............................................................................. 1-87
Table 1-10: IP Traffic view column descriptions ...... .................................. ................... 1-89
Table 1-11: IP Video interface readings...................................................................... 1-92
Table 1-12: Object identification icons...................................... ................................ 1-100
Table 1-13: Interface management icons ................................................................... 1-101
Table 1-14: Quick link icons ................................................................................. 1-102
Table 1-15: Timing measurement graphs ................................................................... 1-109
Table 1-16: Record settings ..... . ..... . ..... . ..... . ..... . ..... . ..... . ..... . ..... . ..... . ..... . ..... . ..... . .... 1-136
Table 1-17: Analysis menu options.............................. ................................ ............ 1-140
Table 1-18: View menu options................ ................................ .............................. 1-141
Table 1-19: Navigation menu options....................................................................... 1-141
Table 1-20: Settings menu options ...... ................................ ................................ .... 1-141
Table 1-21: CaptureVu menu options ....................................................................... 1-141
Table 1-22: Record menu options ........................................................................... 1-142
Table 1-23: Help menu options .................................. ................................ ............ 1-142
Table 1-24: PCR settling times ..... . ..... . ..... . ..... . ..... . ..... . ..... . ..... . ..... . ..... . ..... . ..... . ... . . . 1-145
Table 1-25: Bit r at
Table 1-26: MPEG SI/PSI ...................... ................................ .............................. 1-167
Table 1-27: DVB SI/PSI ............................ ................................ .......................... 1-168
Table 1-28: ATSC SI/PSI ..................................................................................... 1-169
Table 1-29: ISDB-S SI/PSI nodes ........................................................................... 1-170
Table 1-30: ISDB-T and -TB SI/PSI nodes................................................................. 1-171
Table 2-1: File menu options.................................................................................... 2-3
Table 2-2: View menu options .................................................................................. 2-3
Table 2-3: Settings menu options .. . ..... . .... . ..... . ..... . .... . . .... . ..... . ..... . .... . ..... . ..... . .... . . .... . .. 2-4
Table 2-4: Options menu options ...... ................................ .................................. ....... 2-4
Table 2-5: File menu options.................................................................................. 2-15
Table 2-6: Edit menu options .. ................................ .................................. ............. 2-15
Table of Contents
e views .................................... ................................ ................ 1-160
MTS400 Series Analyzer Applications User Manual ix

Table of Contents
Table 2-7 : View
Table 2-8: Options menu options.......... ................................ ................................ ... 2-16
Table 2-9: Window menu options ............................................................................ 2-16
Table 2-10: Help menu options .................................... ................................ ........... 2-16
Table 3-1: File menu options.................................................................................... 3-3
Table 3-2: View menu options .................................................................................. 3-4
Table 3-3 : F
Table 3-4: Edit menu options .................................. .................................. ............. 3-15
Table 3-5: View menu options ................................................................................ 3-15
Table 3-6: Options menu options.......... ................................ ................................ ... 3-15
Table 3-7: Process menu options ...... ................................ .................................. ..... 3-16
Table 3-8: Trace menu options................................................................................ 3-16
Table 3-
Table 3-10: Help menu options .................................... ................................ ........... 3-17
Table 4-1: Tool Bar icons........................................................................................ 4-6
Table 4-2: Navigation icons................ ................................ ................................ ..... 4-8
Table 4-3: Header icons........................................................................................ 4-10
Table 4-4: Hex Headers Display .............................................................................. 4-12
9: Window menu options ............................................................................ 3-17
menu options ................................................................................ 2-15
ile menu options.................................................................................. 3-14
x MTS400 Series Analyzer Applications User Manual

General Safety Summary
General Safet
To Avoid Fire or Personal
Injury
ySummary
Review the fo
this product or any products connected to it.
To avoid pot
Only qualified personnel should perform service procedures.
While using this product, you may need to access other parts of a larger system.
Read the safety sections of the other component manuals for warnings and
cautions r
Use proper power cord. Use only the power cord specified for this product and
certified for the country of use.
Connect and disconnect properly. Do not connect or disconnect probes or test
leads while they are connected to a voltage source.
Ground the product. This product is grounded through the grounding conductor
of the power cord. To avoid electric shock, the grounding conductor must be
connected to earth ground. Before making connections to the input or output
terminals of the product, ensure that the product is properly grounded.
llowing safety precautions to avoid injury and prevent damage to
ential hazards, use this product only as specified.
elated to operating the system.
Observe all terminal ratings. To avoid fire or shock hazard, observe all ratings
and markings on the product. Consult the product manual for further ratings
information b efore making connections to the product.
Do not apply a potential to any terminal, including the common terminal, that
exceeds the maximum rating of that terminal.
Power disconnect. The power cord disconnects the product from the power source.
Do not block the power cord; it must remain accessible to the user at all times.
Do not operate without covers. Do not operate this product with covers or panels
removed.
Do not operate with suspected failures. If you suspect that there is damage to this
product, have it inspected by qualified service personnel.
Avoid exposed circuitry. Do not touch exposed connections and components when
power is present.
Use proper fuse. Use only the fuse type and rating specified for this product.
Wear eye protection. Wear eye protection if exposure to high-intensity rays or
laser radiation exists.
MTS400 Series Analyzer Applications User Manual xi

General Safety Summary
TermsinThisManual
Do not operate i
Do not operate in an explosive atmosphere.
Keep product surfaces clean and dry.
Provide prop
details on installing the product so it has proper ventilation.
These terms may appear in this manual:
WARNING.
in injury or loss of life.
CAUTION
damage to this product or other property.
n wet/damp conditions.
er ventilation. Refer to the manual’s installation instructions for
Warning statements identify conditions or practices that could result
. Caution statements identify conditions or practices that could result in
xii MTS400 Series Analyzer Applications User Manual

Preface
The MTS400 Series MPEG systems applications are described in three user
manuals. The full list of applications can be found in the MTS400 Series Quick
Start User Ma
applications are available on the following MTS400 Series products:
MTS415
MTS430
MTS4SA
MTS400P
MTX100B (where installed)
Table i: Overview of MTS400 Series analyzer applications
Application Desktop Icon
Transport Stream Compliance Analyzer (TSCA) Real-time and deferred transport stream analysis with
user-selectable MPEG-2, DVB, ATSC and ISDB conformance tests. Shows transport structure, header
contents, hexadecimal packet contents, PCR timing /transport rate graphs and error message logs.
nual. This manual describes the analysis related applications. All
Packetized Elementary Stream (PES) Analyzer PES analysis with selectable test options. Shows PES
program structure, header contents, packet contents, PTS/DTS timing graphs and analysis reports.
Transport Stream - System Target Decoder (T-STD) Buffer Analyzer Analyzes program streams modeling
their behavior in, and their conformance to, the MPEG-2 T-STD Buffer Model. Includes a trace facility.
Elementary Stream Analyzer Elementary Stream analysis at video picture and audio level. This includes
vector graphs and macroblock picture quality.
MTS400 Series Analyzer Applications User Manual xiii

Preface
Related Documentation
The following table lists the documentation available for your MTS400 Series
instrument:
Table ii: MTS400 Series related documentation
Title Tektronix part number Location
MTS400 Series Quick Start User
Manual Engl
ish and Japanese
071-2607-xx
071-2608-xx
MTS400 Series Analyzer
Application User Manual (This
manual)
MTS400 Ser
Applications User Manual
MTS400 Series Carousel
Applicat
MTS400 Series Programmer
Manual
MTS400 S
MTS4EA
Elementary Stream Analyzer User
Manual
MTS4CC Elementary Stream
Compli
MTS400P Quick Start User Manual
English Japanese
ies Generator
ions User Manual
eries Release Notes
Compressed Video
ance Checker User Manual
077-0205-x
077-0204-xx
077-0203-xx
077-0206
077-0200-xx
071-1641-xx
071-2075-xx
071-2
071-2611-xx
-xx
610-xx
x
xiv MTS400 Series Analyzer Applications User Manual

Transport Stream Compliance Analyzer


Transport Stream Compliance Analyzer - Getting Started
The MTS400 Series MPEG Transport Stream Compliance Analyzer (TSCA)
enables you to monitor and interpret the contents of real-time, previously
recorded, or
and ISDB standards.
synthesized transport streams using the latest MPEG, DVB, ATSC,
The TSCA is s
problems within a transport stream using a minimum number of clicks. By
quickly identifying the problem areas, the TSCA software helps you s ave time
during the development and test of equipment, networks, and services. You can
configure the TSCA software to display stream information in user-selected fonts.
This feature enables you to view stream information in your local language or to
use cust
The TSCA software will run stand-alone on computers with Microsoft Windows
2000 or Windows XP operating systems.
om fonts.
pecifically designed to enable you to quickly locate and identify
Figure 1-1: TSCA Program view - Deferred analysis
MTS400 Series Analyzer Applications User Manual 1–1

Transport Stream Compliance Analyzer - Getting Started
TSCA Features
Industry’s fastest analysis engine enables reduced analysis time, rapid
development, evaluation, deployment, and diagnostics of next generation
DTV and IPTV s
Support for a wide range of DTV standards, including MPEG, DVB, ATSC,
including A
information (SI) for terrestrial, cable, and satellite, plus regional variations of
these standards are also supported
A range of interfaces and analysis capabilities provide the necessary
connectivity to diagnose problems anywhere in the network environment,
whether that is in transmission links (RF or IP layer) or content processing
(TS layer)
Connection to both IP version 4 and 6 networks, including those using IGMP
and MLD multicast protocols respectively (IP version 6 is only available with
the IP Video Gigabit Ethernet interface)
Constant and variable bit rate stream analysis (CBR and VBR)
ystems and services
78 and SCTE 142, ISDB, and ISDB-TB (Brazil). Specific service
CaptureVu technology captures and analyzes system events in real time and
deferred time to debug the intermittent and complex problems that traditional
analyzers miss
Innovative program-centric user interface brings expert power to the novice
user
File Analysis and Real-Time Modes
The TSCA can be run in offline (or deferred) File Analysis or Real-Time Analysis
de.
mo
The offline File Analysis mode is available on a ny recommended p latform
including the your own PC). In offline File Analysis mode, a static stream can be
(
analyzed and displayed; the content can then be inspected at leisure.
The Real-time Analysis mode, with which a live stream can be analyzed, is
available when the TSCA is installed on a Tektronix MTS400 Series instrument or
an MTX100B with an Option 7 interface card. Real-time streams can be paused
for detailed offline analysis and then when the issue has been found, real-time
analysis can be resumed. Real-time monitoring of Video over IP (internet
protocol) is also available as a standalone application on a your own PC.
1–2 MTS400 Series Analyzer Applications User Manual

Technical Background
Transport Stream Compliance Analyzer - Getting Started
The analyzer has a client-server architecture. Every time the analyzer opens, it
starts two processes: tsca.exe, which is the client, and MpegCore.exe, which is the
MPEG analysis engine. Additionally, when the analyzer opens for the first time,
another single process, CoreManager.exe, is started. CoreManager.exe forms an
intermedia
The tsca.exe, MpegCore.exe, and CoreManager.exe processes use SNMP (Simple
Network Ma
communicate. The port numbers used for communication are read from a
configuration file, CoreInfo.xml. In a default installation, the path to the file is
C:\program files\tektronix\mpeg\mts400\apps\tsca\xml\.The
default port range is 15700-15800. You can change these values if they conflict
with other applications.
ry between TSCA clients and MPEG cores.
nagement Protocol) and HTTP (Hypertext Transfer Protocol) to
User Interface
On the MTS400 platform, another process,
This process controls shared access to the MTS400 Series hardware by the
er and player.
analyz
You must have local administrator rights to be able to use IP analysis. If you need
nge your rights, please consult your system administrator.
to cha
SCA software displays two primary views selected using tabs: FlexVuPlus
The T
and Analysis.
ng the FlexVuPlus window, you can assemble up to four views that you select
Usi
from the Analysis window. This allows you to customize the view by selecting
the views that are most relevant to the analysis task. The FlexVuPlus window is
described in detail in the MTS400 Series Quick Start User Manual.
TheAnalysiswindowusesasinglemainprogram summary window with different
context sensitive views contained within tabbed frames. This provides the
maximum amount of useful information, while keeping the screen from appearing
cluttered. From the main window, you can access the following views: Program,
Tests, Tables,PID, Packets, and Interface.
mint.exe, runs from system startup.
Program View
MTS400 Series Analyzer Applications User Manual 1–3
The Program view provides a fast overview of the transport stream contents
in terms of program content, bit rate use by each program, and TR 101 290
test results. Red, amber, and green LEDs highlight errors associated with each
program, or element of a program, within the transport stream. Red LEDs indicate
that there are current errors in the stream, amber LEDs indicate that errors have
occurred but are now clear, and green LEDs indicate that no errors have been
detected.

Transport Stream Compliance Analyzer - Getting Started
Tests View
SI/PSI (Tables) View
PID View
Errors that are
up to the highest level. This allows you to monitor all of the programs in the
stream at a high level and then quickly go to lower levels as necessary to locate a
problem.
The Tests view enables you to isolate errors to the specific tests that have been
applied to the transport stream. The error log is automatically filteredbythe
selected test, and can also be filteredbyPacketIdentifier (PID). In addition to the
standard first, second, and third priority tests included in TR 101 290 standard,
tests are available for Program Clock Reference (PCR) jitter and program/PID bit
rate. A va
PID, and there are many tests that are specific to ISDB-T and ISDB-S streams.
The SI/PSI (Tables) view displays the service information tables that have
occurre
standard. This includes MPEG-specific program information, DVB service
information, and ATSC, ISDB program, and system protocol information. The
tables are grouped together by function and hyperlinks enable you to quickly
access related information within other tables.
The PID view displays information about all of the PIDs found in the transport
stream. When you select the t ransport stream, the associate d summary view
provides a PID-oriented overview of the transport stream, displaying the relative
data rates of all of the PIDs contained within the stream. The information can be
dis
selection and links.
d in the analyzed stream that comply with the selected digital video
played as either a bar chart or as a pie chart. Pop-up menus enable fast limit
detected at lower levels in the program stream hierarchy propagate
riability test enables you to test the changes in the bit rate of a specific
Packets View
ch PID is associated with a number of tests. W hen one or more tests fail, each
Ea
failed test will be listed under the relevant PID. Select a specific PID to display
a summary of all the associated tests. Select a specific test to display the Event
Log and Parameters for only that test.
The Packets view displays information about all of the packets found in the
transport stre am grouped according to content. These groups include PID value,
SFN mega-initialization packets (MIPs) (DVB only), and ISDB-T and ISDB-TB
information packets (IIPs). When you select a specific PID or MIP, only packets
carrying that particular PID or MIP are displayed. A section view is also available.
Deferred analysis of PCAP files allows you to see the ethernet packets.
The Packets view is not available in real-time mode. However, you can examine
packets in a real-time stream by using the CaptureVu feature.
1–4 MTS400 Series Analyzer Applications User Manual

Transport Stream Compliance Analyzer - Getting Started
Interface View
CaptureVu Feature
The Interface v
and IP interface cards (where installed):
Test results
Graphical re presentation of specific RF and IP readings
RF and IP readings and control settings
The graphical views display a selection of graphs of instantaneous measurements
and measurement trends. Also available are an Event Log and a Parameter view.
The Interface tab is displayed only when an interface is installed.
The CaptureVu feature captures a snapshot of system events in real and deferred
time, and allows you to debug the intermittent and complex problems that
traditional analyzers miss. You can initiate CaptureVu either manually or
automa
breakpoint is detected, either manual or automatic, the stream is paused and an
in-depth deferred time analysis can be performed on stored data. This powerful
debug mode enables fast debugging of troublesome intermittent problems.
tically by associating a CaptureVu Breakpoint with any test event. When a
iew provides a central location for information related to the RF
Triggered Recording
During real-time analysis, stream information can only be held for a finite time
- eventually it will be overwritten by more up-to-date information. Triggered
recording allows a portion of a stream to be recorded and subsequently anal yzed
etail.
in d
The following trigger sources and conditions apply:
Any test event
External input; (TTL) edge specifiable
Date and time
Recorded file size can be specified
Pretrigger buffer size can be specified as a percentage of the overall file size
range from 0 - 100%
MTS400 Series Analyzer Applications User Manual 1–5

Transport Stream Compliance Analyzer - Getting Started
Starting the T
Opening the TSCA
SCA Software
The TSCA can analyze transport streams in either real-time or fi le analysis mode.
From the Windows Desktop, select Start > Programs > Tektronix MTS400 >
Analyzers > TS Compliance Analyzer.
The TSCA is opened, initially overlaid with either the Open File Analysis or the
Select Real-time Interface dialog box as shown in the following figures. The
applicati
on opens the dialog box that was last opened.
Figure 1-2: TSCA Start-up - Offline File Analysis
1–6 MTS400 Series Analyzer Applications User Manual

Transport Stream Compliance Analyzer - Getting Started
Figure 1-3: TSCA Start-up - Real-Time Analysis
MTS400 Series Analyzer Applications User Manual 1–7

Transport Stream Compliance Analyzer - Getting Started
Interpreting a Stream
The opening dia
Select the interpretation standard to be used for analysis. See step 2 in the
Interpreting
standard before starting analysis.
and
Identify a stream file for off-line analysis. See step 1 in the Off-Line File
Analysis se
using shortcuts that you have defined.
or
Identify an input (IP, RF, ASI, SMPTE, or DVB Parallel) receiving a stream
and start
You can set up the stream interpretation standard in the following way:
1. Click Change in the opening dialog box to open the Standard dialog box.
NOTE. The TSCA software analyzes streams in strict accordance with the
standards defined by the digital television authorities: DVB (Digital Video
casting), ATSC (Advanced Television Systems Committee), and ISDB
Broad
(Integrated Services Digital Broadcasting).
log boxes a llow you to:
aStreamsection. You should always set the stream interpretation
ction. Files can be selected either directly from the disk drive or
real-time analysis.
SCA software uses preloaded scripts that establish the expected content and
The T
syntax of the analyzed stream. The analyzer is supplied with a comprehensive
range of scripts, which, in different combinations, can interpret the full range
of digital television standards.
2. Select the Base Standards and then (if available) select the Region.The
analysis scripts that will be used are displayed in the Script Files pane.
1–8 MTS400 Series Analyzer Applications User Manual

Transport Stream Compliance Analyzer - Getting Started
Figure 1-4: Stream Interpretation dialog box
Off-Line File Analysis
3. Select OK.
4. The stream interpretation is now set. Select OK to close the Standard dialog
box and return to the opening dialog box. (See page 1-148, Script Files.)
NOTE. The selected stream interpretation standard is not implemented until
stream analysis is started. If the Open Transport Stream dialog box is closed
without starting analysis, the stream interpretation settings are lost; they revert to
ttings that were in effect when the application was last closed.
the se
Perform the following steps to start analyzing a transport stream file:
1. In the Open File Analysis dialog box, browse to a transport stream file.
If necessary, select a file type from the Files of type drop-down list. Currently,
two types are available: MPEG Transport Stream files and PCAP files.
MPEG transport stream files contain interlinked tables and coded
identifiers, which separate the programs and the elementary streams
within the programs.
PCAP files contain raw packets of network data. A PCAP may contain
more than one session. You will need to select a session using the Browse
dialog box.
2. When you select a stream, the stream name appears in the File Name field at
the bottom of the window.
MTS400 Series Analyzer Applications User Manual 1–9

Transport Stream Compliance Analyzer - Getting Started
Figure 1-5: TSCA Open File Analysis (Offline) dialog box
3. Calculating the Stream Bit Rate: To analyze a transport stream correctly,
you must do one of the following:
Calculate the bit rate from PCRs (Program Clock Reference) carried in
the stream
NOTE.
bit rate of the stream to the expected rate. Errors are reported based on the
expected rate of the stream. To analyze a stream correctly, it is necessary to
know the original bit rate of the stream or to calculate the bit rate from PCRs
(Program Clock Reference) carried in the stream. PCRs are generated as a
stable clock reference and are added to the stream during its generation.
Du
reference.
When the TSCA software analyzes a transport stream, it compares the
ring analysis, the PCRs are extracted and synchronized with a local clock
now the original bit rate and enter it manually
K
Use timestamps included with the stream
1–10 MTS400 Series Analyzer Applications User Manual

Transport Stream Compliance Analyzer - Getting Started
4. After you select the desired stream, select one of the following methods for
calculating the rate of the transport stream:
Prescan first nnn PCRs. The TSCA software calculates the rate of the
stream by prescanning the stream for embedded PCRs. The entry box lists
the num
to determine the stream rate. You can use the entry box to enter a different
number.
Prescan all PCRs in a file. The TSCA software calculates the rate of the
stream by prescanning the stream for all of the embedded PCRs.
Manually set nnnn Mbps. The TSCA software uses the absolute value (in
Mbps) that you enter as the expected stream rate.
NOTE. If either the ’Use Arrival Timestamps’ or the ’Use TTS Timestamps’ check
box is selected, timestamps, which may have been added when the stream was
generated, will be used, in the analysis of the stream.
Using timestamps will override the PCR options (’Prescan first nnn PCRs’ and
’Prescan all PCR in file’).
A manually entered bit rate will override both PCRs and timestamps in the stream.
ber of PCRs that the TSCA software recommends are necessary
5. If the TSCA software cannot calculate the bit rate from the embedded PCRs,
or timestamps, a message box is displayed. You must enter an estimated bit
rate before the TSCA software can analyze the stream.
MTS400 Series Analyzer Applications User Manual 1–11

Transport Stream Compliance Analyzer - Getting Started
Real Time Analysis
6. If the CaptureV
analysis can be paused either by a previously set CaptureVu breakpoint or at a
specificpacket.
7. To pause analysis at a specific packet, enable Pause Analysis at Packet
Index and enter a packet number.
With a file selected and the transport rate calculation set up, you can start the
analysis. (See page 1-29, Starting Analysis.)
To start an
interface, sel ect Real-time from the toolbar and, in the Select Real-time Interface
dialog box, select an interface from the Interfaces drop-down list.
Only installed interfaces will be shown in the drop-down list. For stand-alone
installations, only the IP interface is available.
alyzing a transport stream received through an IP or a hardware (RF)
u feature is to be used, the whole file can be captured or
Figure 1-6: TSCA Real-time Interface dialog box
1–12 MTS400 Series Analyzer Applications User Manual

Transport Stream Compliance Analyzer - Getting Started
Interface
Card Overview
Real-time anal
permissions are not found. A warning message is displayed when real-time
analysis is not available.
Make any necessary interface settings. Either select and apply a preset (a
predefined set of interface settings) or modify the individual interface settings.
During analysis, the interface selected will be shown in the status bar. (See
page 1-15, Setting Up the IP Interface.)
This section describes the configuration and interpretation of results of the RF
and IP Video interface cards that you can install in MTS400 Series MPEG test
systems.
firmware upgrading.
The inte
QAM (Quadrature Amplitude Modulation) (Annex B II) (See page 1-78, RF
Interf
COFDM (Coded Orthogonal Frequency Division Multiplexing) (See
page 1
ysis will not be available if the appropriate software key
The c ards all use a common interface protocol for data handling and
rface settings described are as follows:
ace - QAM (Annex B).)
-81, RF Interface - COFDM.)
Interface Card Set Up
QPSK/8PSK (Phase Shift Keying) (See page 1-86, RF Interface -
/8PSK.)
QPSK
8VSB (Vestigial Side Band) (See page 1-84, RF Interface - 8VS B.)
IP Video Gigabit Ethernet (See page 1-88, IP Video Gigabit Ethernet
Interface.)
Refer to the MTS400 Series Specification and Performance Verification Technical
Reference, 077-0207-xx for the interface technical specifications.
Only one of these interface cards can be installed in the MTS400. All RF interface
measurements and graphs include a constellation diagram with MER rings, EVM,
NR, and BER measureme nts. The installed interface can be used simultaneously
S
with a GbE interface and the internal NIC (network interface card) input. All
interfaces have dual-level warning and failure alarms, and graphs for long term
trend monitoring.
The input card screen and configuration of the card will depend on which interface
card is installed. (See the following pages.)
The interface card con figuration is set up when analysis is started u sing the Open
Transport Stream dialog box. The settings can subsequently be changed during
analysis from the Interface View.
MTS400 Series Analyzer Applications User Manual 1–13

Transport Stream Compliance Analyzer - Getting Started
When real-time
drop-down list. The Firmware Version and the current Interface Settings of the
card are displayed.
analysis is se lected and an interface is selected from the Interfaces
Interface Card Firmware
Update
Figure 1-7: Open Transport Stream dialog box
If the firmware version is incorrect, the Update Firmware button is enabled, and
you will not be able to proceed with the setup and analysis until the firmware is
updated. (See page 1-14, Interface Card Firmware Update.)
1. In the Open Transport Stream dialog box, select Real-time Analysis.
2. Select the interface from the Interfaces drop-down list.
3. Enter the interface settings required. for Descriptions of the settings for each
interface card. (See page 1-78, RF Interface Views.)
4. Select OK to start the analysis.
The name of the selected interface is displayed in the TSCA status bar.
If the interface card firmware needs to be updated, a message will be displayed
when real-time analysis is selected. The U pdate Firmware button will also be
enabled.
Update the interface card firmware as follows:
1. Select Update Firmware.
2. In the Update Firmware dialog box, select Start.
1–14 MTS400 Series Analyzer Applications User Manual

Transport Stream Compliance Analyzer - Getting Started
Figure 1-8
3. The dialog
: Firmware update
box will display progress of the update. The box will close when
the update is complete.
CAUTION. Removing power from the MTS400 while the firmware upgrade is in
progress can cause fatal corruption of the firmware files.
Setting Up the IP Interface
Two Ethernet interfaces are standard on the network interface cards installed in
MTS40
Two high performance Gigabit Etherne t interfaces can be acquired as options;
only
The following table lists important comparisons between the IP interfaces.
le 1-1: MTS400 Series IP interface comparisons
Tab
GigE video over IP
ture
Fea
Bitrate
terface type
In
Number of ports (SFP - small
format pluggable)
Supported IP version
Communications protocols IGMP v2 & v3 IGMP v2 & v3 and MLD v2 IGMP v2 & v3
Sessions (maximum)
Variable bit rate (VBR)
PIT histograms and instantaneous
PIT measurements
int
1G
10
4 x optical or electrical SFP 1 x optical SFP; 1 x RJ45
Version 4 Version 4 and 6 Version 4
1 500 1
Yes Yes Yes
Yes Yes No
0 Series systems; one 10/100 Base-T and one 10/100/1000 Base-T GigE.
one can be installed at a time.
Network interface
card (NIC)
415/MTS430/MTS4SA
MTS
bps (total)
1M
/100 Base-T 10/100/1000
10
Base-T GigE
xRJ45
2
erface: (GbE Interface)
bps (maximum)
00 Base-T, -SX, -LX, -ZX
IP video Gigabit Ethernet
interface: (IP Video
erface)
Int
bps (maximum)
1G
/100/1000 Base-T; 1000
10
Base-T, -SX, -LX, -ZX
MTS400 Series Analyzer Applications User Manual 1–15

Transport Stream Compliance Analyzer - Getting Started
Table 1-1: MTS400 Series IP interface comparisons (cont.)
IP video Gigabit Ethernet
GigE video over IP
Feature
PIT measurement (average)
IP packet inspection view
Recording
PCR_OJ, _DR, _FO
PCR_AC
TR 101 290 Yes Yes - selected session only Yes
interface: (GbE Interface)
Yes Yes Yes
Yes - linked for error log
TS and PCAP (single
session only)
Yes Yes - selected session only No
Yes Yes - selected session only Yes
interface: (IP Video
Interface)
No
TS TS
Network interface
card (NIC)
MTS415/MTS430/MTS4SA
Yes - linked for error log
1–16 MTS400 Series Analyzer Applications User Manual

Transport Stream Compliance Analyzer - Getting Started
IP Video Interface Setup
In the Select Re
drop-down menu, the current settings for the selected configuration are shown.
al-time Interface dialog box with GigE selected in the Interfaces
Figure 1-9: GbE Con fi gure Interface dialog box
The following configuration settings are available for the IP Video interface card.
(See Figure 1-9.)
Preset Name
MTS400 Series Analyzer Applications User Manual 1–17
The name allocated to a preset interface configuration setup.

Transport Stream Compliance Analyzer - Getting Started
Interface Card
Configuration
These settings
Connection Type: Select the line speed and type of the physical connection
from the drop(Copper), Force 1000 (Optical), Force 1000 (Optical Rx), Auto 10/100/1000
(Copper), and Auto 1000 (Optical).
The term Force means that the IP Video interface card will not negotiate a line
speed; the linked device will have to be set in the specified forced speed mode for
this to work. For the Auto 10/100/1000 (Copper) mode, the IP Video interface
card will attempt to negotiate with the linked device for the fastest available speed
denoted by the number following the word Auto.
NOTE. The
connecting to a hub can cause undesired effects.
Two type
optical. The copper interface supports speed settings at 10 Mbps, 100 Mbps, and
1000 Mbps. The optical interface supports 1000 Mbps only.
deal with the physical and network settings:
down list: Force 10 (Copper), Force 100 (Copper), Force 1000
GbE interface card does not support hubs under any speed setting;
s of interface are available on the IP Video interface card: copper and
1–18 MTS400 Series Analyzer Applications User Manual

Transport Stream Compliance Analyzer - Getting Started
The Force 1000 (
with a network splitter. In this mode, the receive laser needs to be connected into a
valid optical link between two other devices using an optical splitter. This enables
the IP Video interface card to monitor the communication between other devices.
MAC Address: Enter the MAC address of the IP Video interface card, for
example, 01-0a-02-0b-03-0c-04. The card is set with a unique MAC address
in the factory; do not change this. The MAC address of your instrument can
befoundonalabelaffixed to the cover of the instrument.
Network Interaction: Select the way that the instrument interacts with
the connected network: Passive is equivalent to listening, where no
interact
network to receive traffic, such as identifying specific sources or pinging
other instrument, select Active. Selecting IPv4 and/or IPv6 in active mode
will depend on your intended data sources.
The following selections are available:
Passive (IPv4 and IPv6) - If you select this option, IPv6 Addressing fields
are not used.
Active IPv4 only - If you select this option, complete only the
IPv4 Address field.
Active IPv6 only - If you select this option, complete only the
IPv6 Addressing fi elds.
Optical Rx) m ode is a special mode that can work in conjunction
ion with the network is required. If you require interaction with the
Active (IPv4 and IPv6) - If you select this option, complete all of the
IPv4 Address and IPv6 Addressing fields.
IPv4 Address: Enter the IP address of the IP Video interface card. This
address w ill be allocated by your network administrator. The null value is
0.0.0.0.
IPv4 addresses are normally written as four octets in decimal separated by periods,
for example, 192.0.2.235.
IPv6 Addressing: If you have selected the active IPv6 network
administration, use this field to select the means by which the IP address of
the instrument can be discovered by the network.
Stateless only - The interface card will use its MAC address and an address
prefix used in periodic advertisement messages generated by the local router
to automatically calculate an IPv6 address (RFC 4862).
Manual - Enter an address that has been assigned by your network
administrator in the IPv6 Address field.
DHCPv6 (Dynamic Host Configuration Protocol version 6) - The interface
card will attempt to contact a DHCPv6 server on the network, which will
supply an IPv6 address for the card (RFC 3315).
MTS400 Series Analyzer Applications User Manual 1–19

Transport Stream Compliance Analyzer - Getting Started
If you selected
field.
IPv6 addresse
digits, where each group is separated by a colon (:). For example,
2001:0db8:85a3:0000:0000:8a2e:0370:7334. To shorten the writing and
presentation of addresses, several simplifications to the notation are permitted.
Your network administrator will be able to advise you.
A Link Local address is automatically assigned to allow your instrument to
communicate with the nearest network router or switch.
ASI Output - Set the output format:
As Received - The IP data is supplied in bursts as they are received directly
to the ASI output port. The data can then be looped to the processor card
for analysis.
Smoothed - The incoming IP data is bufferedinanattempttosmooththebit
rate before supplying it to the ASI output port.
VBR to CBR (Variable bit rate to Constant bit rate) - The incoming IP data
is received at a varying bit rate. Null packets are inserted into the stream to
achieve a c onstant bit rate output. The result can be recorded and played
back w
manual IPv6 addressing, enter the address in the IPv6 Address
s are normally written as eight groups of four hexadecimal
ith the timing preserved.
ion Selection Criteria
Sess
VBR Detection - Enhances VBR detection.
These settings target which stream is sent for analysis. Typically these settings are
extracted from the session that is selected in the IP trafficscreen. Notallfields
need be completed; just enough to uniquely identify a session.
VLAN Selection: (Virtual Local Area Network) A logical grouping of two
or more network nodes, which are not necessarily on the same physical
etwork segment, but which share the same network number. With the VLAN
n
Selection turned on, if the packet carrying the transport stream contains a
VLAN identity, the system will attempt to extract the transport stream from
the first IP stream that fits the current control settings.
Tag: The desired VLAN ID in hex number format.
NOTE. There may be more than one network session on the monitored networks.
Using the following MAC, IP, and Port selections, a single session can be
identified. If all selections are set to Off, no stream will be received.
MAC Selection: Select the MAC Selection filter: None, Source, Destination,
or All. When a value other than None is selected, the system will extract the
1–20 MTS400 Series Analyzer Applications User Manual

Transport Stream Compliance Analyzer - Getting Started
transport stre
settings.
Source:Enter
Destination: Enter the destination MAC address to filter.
Example MAC address: 01-0a-02-0b-03-0c-04.
IP Selection:
Source: Enter the source IP address to filter.
Destination: Enter the destination IP address to filter.
Example I
Port Selection:
Source: Enter the source port address to filter.
Destination: Enter the destination port address to filter.
Input port number in integers between 0 and 65535.
Protocol: Select the session protocol: Don’t Care, UDP (User Datagram
Protocol), or RTP (Real-time Transport Protocol).
am from the first IP stream that fits the Source and/or Destination
thesourceMACaddresstofilter.
P address: 128.181.39.3.
Multicast Configuration
icasting allows you to subscribe to and monitor single or multiple streams on
Mult
the network. To configure the use of multicasting, click the Configure Multicast
button on the Configure Interface dialog box. The content and layout of the
Configure Multicast dialog box will depend on the multicast subscription mode
selected. The subscription mode also affects the layout of the IP Tables tab of the
interface analysis view. The three modes are Off, Single, and Multicast Database:
Subscription Mode - Off No subscription information will be used for the
current preset.
Subscription Mode - Single The single subscription mode allows you to
enter a single subscription for the current preset. The subscription’s multicast
ddress and optional source address is displayed along with an Edit button.
a
Clicking the edit button will display the Edit Current Subscription dialog.
Subscription Mode - Multicast Database The multicast subscription mode
allows entry and management of multiple subscriptions. The subscriptions
are displayed in the form of a table - the Multicast Database. This allows
you to add, remove, join and leave multicasts as well as import and export
subscriptions. This database is common to all presets but each preset can
choose whether to use it for GigE trafficoruseSingleorOff.
MTS400 Series Analyzer Applications User Manual 1–21

Transport Stream Compliance Analyzer - Getting Started
In all modes the
is visible to the network card.
Figure 1-10: Single subscription mode
IP Traffic table will be displayed showing all the trafficthat
Selecting the single subscription option, displays the Edit Current Subscription
edit button. Use the settings in the Edit Current Subscription dialog box to identify
the multicast p rotocol to be used, IGMP (IPv4) (Internet Group Management
Protocol) or MLD (IPv6) (Multicast Listener Discovery), and the specific
multicast source address required.
Use the Set Supported Protocols button to select the multicast protocol version
that is to be supported. The version labeled as auto-fallback allows the card to
matically switch to the version actually detected on the network.
auto
1–22 MTS400 Series Analyzer Applications User Manual
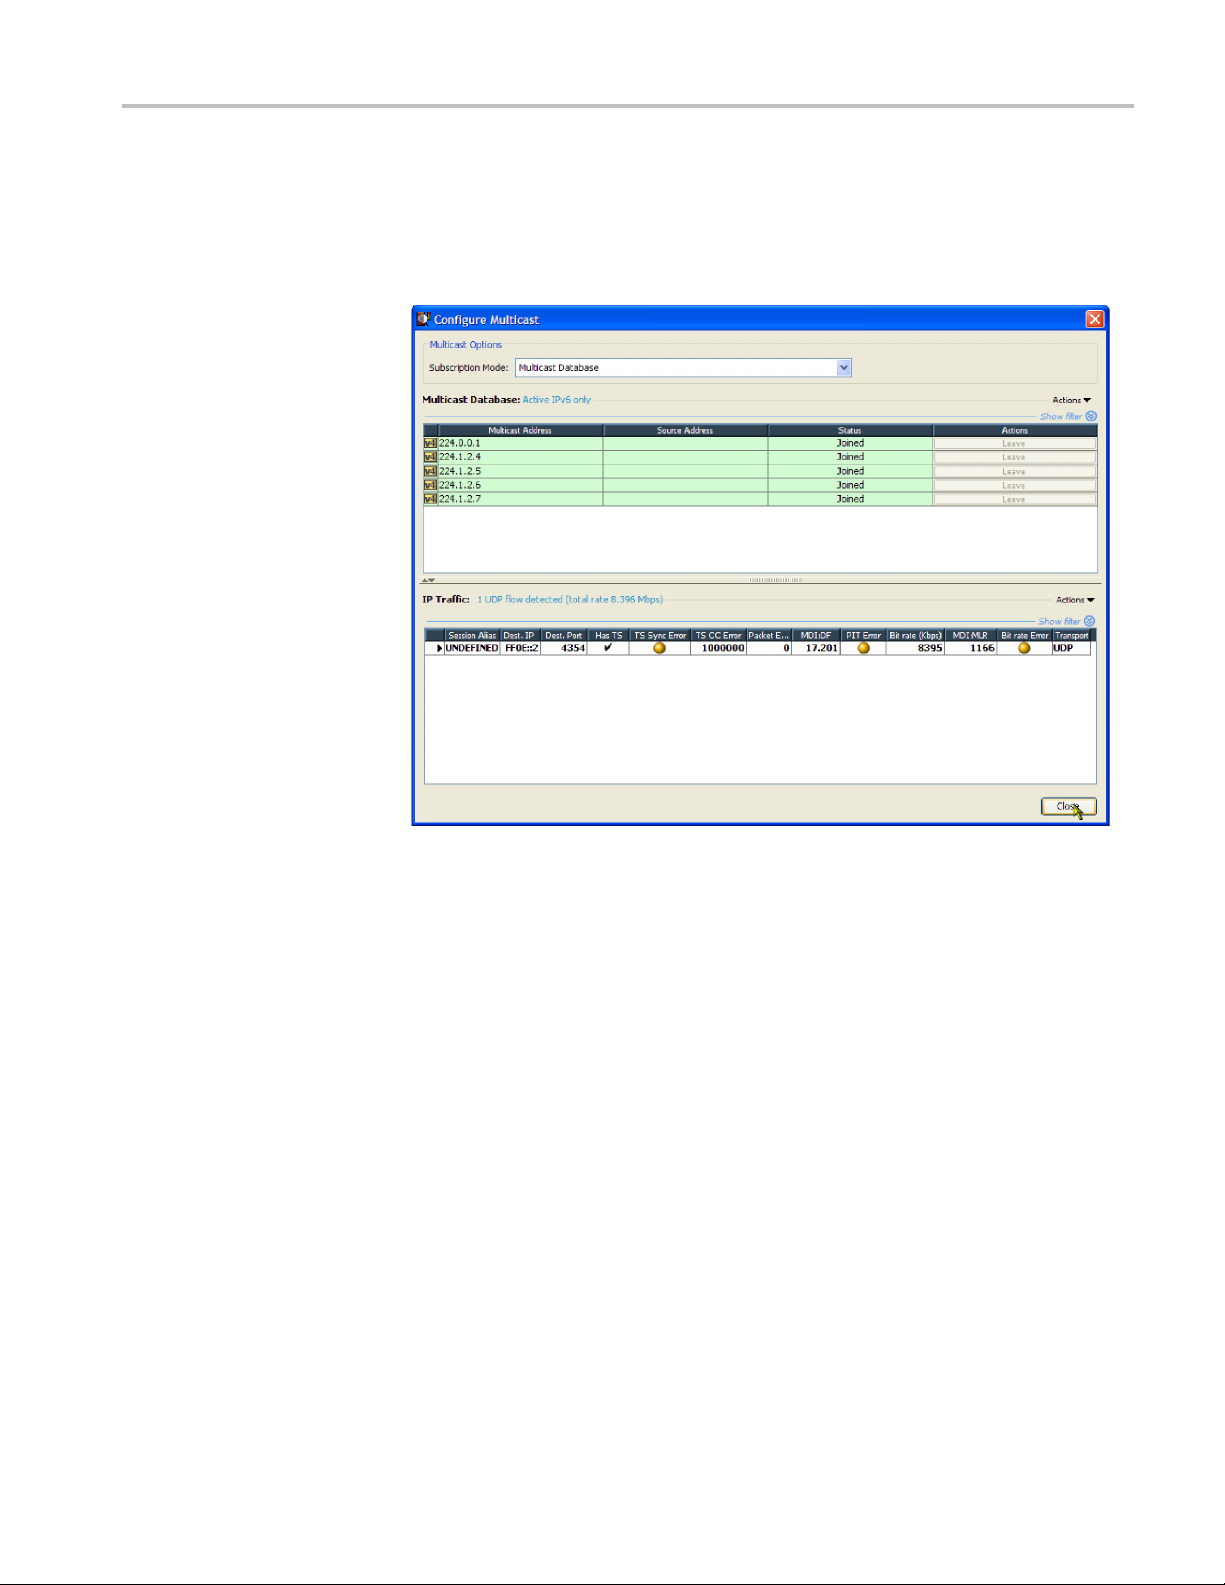
Transport Stream Compliance Analyzer - Getting Started
Subscription M
The multicast subscription mode displays all of the multicast subscriptions that
are currently added to the multicast database and allows you to add, remove,
join and leav
ode - Multicast.
e multicasts.
Edit Current Subscription
Figure 1-11: Multicast subscription mode
If the multicast database subscription mode is selected, two tables are displayed:
cast Database and IP Traffic.
Multi
The m ulticast database lists the sources of traffic sessions that are available on
etwork.
the n
The IP traffic table lists the sessions available from the sources that have been
ned.
joi
The Edit Current Subscription dialog box allows you to edit the subscription that
is used in Single Subscription mode. The parameters for a subscription are its
lticast protocol (IGMP or MLD), its multicast address, and its optional source
mu
specific address if you are using Source Specific Mode. To automatically join
the subscription upon closure of the dialog box, enable the Join this multicast
checkbox. Also accessible on this dialog box is the Set Supported Protocols
button, which allows you to change the supported protocol version for either MLD
or IGMP. Usually these can be left at the default setting, but there may be times
when you want to force the use of a particular version.
MTS400 Series Analyzer Applications User Manual 1–23

Transport Stream Compliance Analyzer - Getting Started
Multicast Data
base Table. The Multicast Database Table displays the contents of
the multicast database stored in the MTM400A. The entries in the database are
color-coded according to the state of the subscription; the states are as follows:
Not Joined No request to join this subscription has been sent, or a Leave
request has been sent for a previously joined subscription.
Processing The Join or Leave request is currently being sent to the network.
Join Request
Joined
ed
A Join reques
traffic has been detected.
Traffic matching the subscription has been detected on the
network. A session will only cause a match if the destination IP
address is
the subscription also specifies a Source Specific address, this
must match the session’s source IP address.
t has been sent out on the network but no matching
the same as the subscription’s multicast address. If
The Actions button on the right of the Multicast Database table, lists all the
available actions. These include joining, leaving, subscription management,
and setting the supported protocols. It is also possible to populate the database
automatically according to the detected traffic using the Mimic Current Sessions
option; this will not overwrite the current subscriptions but will add to them.
Additionally, the context menu for the table includes the option to copy the table
or selected row contents in CSV format to the clipboard. Double-clicking a row in
the table is equivalent to clicking its Join/Leave button. Double-clicking on the
empty space at the bottom of the table will open the Add Subscription dialog box.
The current Network Interaction setting is displayed above the table. This setting
dictates whether the network card will send outgoing traffic, for example, IGMP
Join messages. Consequently if IPv4 (or IPv6) is set to passive, no IGMP (or
MLD) or Ping messages will be sent by the interface card, and actions that would
produce outgoing traffic will be disabled on the context menus.
In Multicast Database mode, editing an existing subscription is not supported. The
Add Current Subscription dialog box must be used to create a new subscription;
this can then be edited. The Add dialog box is identical in contents to the Edit
Current Subscription dialog box.
IP TrafficTable. This table shows the sessions or "flows" detected by the network
card.
The number of sessions and the total bitrate are displayed above the table. The
currently selected session being routed for deeper analysis is shown highlighted
(and is marked in the Active column, if visible). Additionally, the context menu
for the traffic table includes the option to copy the table or row contents in CSV
format to the clipboard.
Double clicking on a row in the table is the equivalent of selecting that session
for deeper analysis. Double clicking on the empty space at the bottom of the
table will open the Add/Update Session Alias dialog box. Note that selecting a
session will automatically set the Session Selection Criteria parameters on the
Configure Interface dialog box.
1–24 MTS400 Series Analyzer Applications User Manual

Transport Stream Compliance Analyzer - Getting Started
GigE Video over IP
Interface Setup
Aliases. To be t
create a list of "aliases", which are names up to 32 characters in length.
An alias will b
address, the optional destination port, and the optional source address. Aliases
will be displayed in the Session Alias column. For adding multiple aliases, it is
recommended to download the Session Aliases list for manual editing in a text or
XML editor. This list can then be uploaded to overwrite the previous list.
In the Select Real-time Interface dialog box with IP selected in the Interfaces
drop-down menu, the current settings for the selected configuration are shown.
ter distinguish the sessions in the traffic table, it is possible to
e assigned to a session if it matches the specified destination
Figure 1-12: Setting up the IP interface
The following configuration settings are available:
reset Name
P
MTS400 Series Analyzer Applications User Manual 1–25
The name allocated to a preset interface configuration setup.

Transport Stream Compliance Analyzer - Getting Started
Device Settings
Stream Settings
Creating a New IP
Config
uration
IP Device Name:
Passive Mode: Select true (passive mode) or false (active mode). In passive
mode, the devi
requested from a specified source.
IP Address:
necessary, obtain the subnet mask and gateway addresses from your network
administrator.
The Source
automatically filled when a traffic flow is selected in the Browse for UDP flow
dialog box.
In active mode
IGMP Pro
protocol.
IGMP SS
multicast mode.
In the Select Real-time Interface dialog box, select the plus button to duplicate the
ing configuration.
exist
Address, Destination Address and Port, and Use RTP settings are
tocol Version: (Active mode only) Select the required IGMP
MMode: (Active mode only) Select the required source-specific
Select the input device from the drop-down list.
ce monitors traffic on the network. In active mode, trafficis
(Active mode only) Enter the IP address of the device. If
A default configuration name is allocated and displayed in the Presets Name field.
an enter a more meaningful name. New values can be entered as required.
You c
This name and the settings associated with it will remain available for recall.
ernatively, the streams available can be viewed and a new one selected.
Alt
1–26 MTS400 Series Analyzer Applications User Manual

Transport Stream Compliance Analyzer - Getting Started
Select Browse f
Figure 1-13.)
ortheBrowseforUDPflow dialog box to be displayed. (See
Figure 1-13: UDP flow selection dialog box
The names of any installed network devices in the instrument are displayed in the
Browse
The traffic that is present on the selected interface is displayed in the bottom half
of the dialog box. A s ummary of the detected UDP flows is displayed in the table
header. The bit rates given are UDP bit rates, not transport stream bit rates.
The settings (Source and Destination addresses) can be set up in two ways:
Multicast sessions can be identified by entering the appropriate address in the
IP Destination Address field.
The TSCA should detect whether traffic is transmitted over UDP or RTP; this will
be indicated in the Transport column. The Use RTP check box will be updated
to match the protocol indicated for the selected session; this setting can be
overridden by selecting or clearing the Use RTP setting if it is believed that the
indicated protocol is incorrect.
Device field. Select the required network device from the drop-down list.
In the Open Transport Stream, Real-time Analysis, Selected Configuration
area, you can enter data into the Stream Settings fields.
In the Browse for UDP Flow dialog box, highlight a session in the current
traffic area; the values are entered automatically in the Selected Configuration,
Stream Settings fields. Traffic carrying transport streams will have a check
mark in the Has TS column.
MTS400 Series Analyzer Applications User Manual 1–27

Transport Stream Compliance Analyzer - Getting Started
When the settin
box closes and the new configuration is immediately available in the Select
Real-time Interface dialog box.
Real-Time Interface Presets
You can save individual real-time interface configurations as presets; they can be
recalled when required. Up to 128 configurations can be specified.
The Select Real-time Interface dialog box shows the settings associated with
the currently selected configuration.
Different settings can be entered on this screen; the new settings will be used
when OK is selected. The new settings can also be saved as a new configuration
for future use if required.
gs are correct, select OK to confirm the configuration. The dialog
1–28 MTS400 Series Analyzer Applications User Manual

Transport Stream Compliance Analyzer - Getting Started
Starting Anal
ysis
To start the analysis, follow these steps:
1. After you have selected the file for analysis or set up the real-time interface,
click OK to continue.
The TSCA software starts analyzing the selected stream. During deferred
analysis, a
results. (See Figure 1-14.)
progress bar is displayed. The TSCA starts reporting analysis
Figure 1-14: TSCA window showing analysis progress
2. When sufficient data has been gathered and the display has stabilized, you can
start using the TSCA to view the analysis.
3. To restart analysis of a strea m, select Analysis > Restart Analysis.
4. To analyze another stream, open the Open File Analysis dialog box or to select
another real-time interface, open the Select Real-time Interface dialog box.
MTS400 Series Analyzer Applications User Manual 1–29

Transport Stream Compliance Analyzer - Getting Started
Setting the St
Selecti
ng the Display Font
ream Content Font
You c a n configure the TSCA software to display stream content information in a
user-defined font style or language, such as Japanese or Chinese.
NOTE. How th
dictated by the TSCA font setting and by the interpretation standard that is used
during the analysis.
How the TSCA displays entries in the Event Log is dictated by the TSCA font
setting and fonts that used by a your local computer. For example, if the default
language of the TSCA computer is Japanese, the event log will be displayed
in Japanese characters. You must choose a suitable font for the characters to
display correctly.
Perform the following steps to set the font that will be used by the TSCA software
to display stream content. You can configure the TSCA software to display stream
content using any font that is installed on your computer.
1. Select Settings > Configur ation to open the Configuration dialog box.
2. Select Preferences > Font in the configuration navigation tree to display the
Font pane. (See Figure 1-15.)
e TSCA displays the text strings carried in the stream itself is
3. The dialog box lists the default font that is used by your computer for the Log
Entries and Stream Content displays on the TSCA UI. Use the Font Name and
Font Size drop-down boxes to select a desired font style and size.
4. Click OK to accept and save any changes.
1–30 MTS400 Series Analyzer Applications User Manual

Transport Stream Compliance Analyzer - Getting Started
Installing Asian Language
Fonts
Figure 1-15: Selecting a display font from the Configuration dialog box
Comput
or Chinese), or MS Windows XP, should have the Asian language fonts already
installed on their systems.
If your computer or MPEG test system does not have Asian fonts installed,
perform the following steps to install the Asian fonts:
1. Insert the MS Windows OS CD-ROM, which was supplied with your
2. Locate the LangPack directory on the CD-ROM. This directory contains a
3. To install new fonts, right-click on each desired font file in the LangPack
4. The new fonts you installed should now appear as possible font selections
ers that are using local versions of MS Windows 2000 (such as Japanese
computer or MPEG test system, into the CD-ROM drive.
number of *.inf files for various languages. For example, you may want to
install japanese.inf and tchinese.inf, for Japanese and Traditional Chinese
language fonts.
directory and select Install.
in the Configuration dialog box. You must select the new font in the
Configuration dialog box before the new font will be used to display stream
content.
MTS400 Series Analyzer Applications User Manual 1–31

Transport Stream Compliance Analyzer - Getting Started
Loading a Custom
Extension Font
The ARIB specifi
standard Unicode character set [0xE000-0xF8FF]. These extensions allow you to
add additional characters and nonstandard proprietary characters to an existing
font. The extension sets are provided as TrueType Extension files (*.tte). Any
extension sets should be installed using the Private Character Editor, supplied as
part of the standard MS Windows installation.
To install a font extension set on your computer:
1. Open the MS Windows Private Character Editor.
a. Select Run from the Start menu.
b. Enter eudcedit in the Run dialog box and click OK.
2. After the Private Character Editor opens, close the Select Code dialog box.
3. Select Font Links… from the File menu.
4. In the Font Links dialog box, select Link with Selected Fonts.
NOTE. If you select Link with All Fonts, the following actions will overwrite
any existing font extension sets.
5. In the Select Fonts box, find and highlight the font to which you are adding
the e xtension. This font should be the one you selected in the TSCA font
preferences dialog box.
cations for the ISDB standards use private extensions to the
6. After you select the font to which you are adding the extension, click Save As.
7. In the Modify Private Character Filename dialog box, browse to the TrueType
extension file that you are adding (*.tte) and click Save.
8. In the Font Links dialog box, click OK.
9. Close the Private Character Editor window.
10. To verify that the font extension has been successfully installed, open the
Character Map application.
a. Select Run from the Start menu.
b. Enter charmap in the Run dialog box and click OK.
11. Browse through the font list for the name of the font to which you added the
extension. The term "Private Characters" should follow the font name. When
you select the font name in the list, you can view the extended character set.
12. Close the Character Map application.
The new font extension you installed should now appear as a font selection in the
Configuration dialog box. You must select the new font in the Configuration
dialog box before the new font will be used to display stream content.
1–32 MTS400 Series Analyzer Applications User Manual

Understanding the TSCA Window
Understandin
g the TSCA Window
On start up, y
page 1-6, Starting the TSCA Software.)
ou can immediately open and analyze a transport stream. (See
Figure 1-16: FlexVuPlus Window
MTS400 Series Analyzer Applications User Manual 1–33

Understanding the TSCA Window
The analyzer wi
the Analyzer tab is selected.
ndow as shown in the following figure will be displayed when
Figure 1
-17: Analyzer window
TSCA Top Level Displays
The TSCA has two top level tabs: FlexVuPlus and Analysis.
The Fl
single incoming stream. The display allows you to select up to four concurrent
views of a monitored stream and provides the ability to configure each of the
four views independently. Setting up and configuring the FlexVuPlus display is
described in the MTS400 Series Quick Start User Manual.
The remainder of this section describes elements in the Analyzer window.
TSCA Window Components
The TSCA window contains the following components:
Menu Bar
The Menu Bar provides access to a selection of system options using drop-down
menus. (See page 1-140, Menu Bar and Options.)
exVuPlus display enables the TSCA to perform like a 4-in-1 monitor on a
1–34 MTS400 Series Analyzer Applications User Manual

Understanding the TSCA Window
Toolbar
The buttons dis
played on the toolbar provide shortcuts to often-used menu
options. Additional buttons displayed during real-time analysis are shown in
the following table:
Table 1-2: Toolbar icons
Deferred and Real-time Analysis
Opens the Open Transport Stream dialog box.
Restarts analysis.
User actions are recorded during a session. The forward and
back buttons allow you to step through the actions in order to
review or repeat them.
Opens the Preferences dialog box from which you can set your
preferences.
CaptureVu
View CaptureVu status.
Resume file analysis.
Stop and capture analysis.
Progress bar
Real-time analysis
View record setting.
ecord feature.
Arm r
Start recording.
Stop recording.
The p rogress bar indicates the progress of processing during deferred analysis
astream.
of
To stop the analysis process, click the Stop button on the toolbar.
MTS400 Series Analyzer Applications User Manual 1–35

Understanding the TSCA Window
Navigation View
Detail View/Panes(s)
Status Ba
The left side pa
ne in the main window is the navigation view and provides
the main analysis information for the transport stream in a number of forms:
Programs, Tests, SI/PSI, PID, Packets and Interface. Views are selected using
the tabs at the top of the pane. The background of each view is color-coded to
aid identification.
The right side pane in the main window is the detail view and provides details
related to the selection made in the current navigation view. The overall view
may be subdivided into one or more panes; you can access individual views in
multiple pane views using tabs.
The status bar, when not hidden, is displayed at the bottom of the main window
r
and shows a summary of stream statistics.
Table 1-3: Field descriptions, from left to right
Field Description
TS Availability Indicates either that the stream bit rate has fallen below the
minimum value or that synchronization has been lost. (See
page 1-36.) The minimum stream bit rate is set using the "Min
stream bit rate for processing" parameter.
(See page 1-117, Parameter Edit.)
Sync Shows the status of the MPEG sync loss test. Loss of sync
during analysis of a stream may mean that analysis of the
complete stream was not possible.
Bit rate
Packet Size
Stream Interpretation,
Base Standard
Stream Interpretation,
Region
Physical Interface The current interface for real-time analysis.
Partial Reception
Availability
Total bit rate of the transport stream. The packet value (188 or
204) is set using the Preferences feature.
(See page 1-122, Bit Rates.)
Packets in a stream can be either 188 or 204 bytes long. This is
detected automatically.
This is the set of tests that is being used to analyze the stream.
This subset of tests modifies the base standard; it may add
tests or modify existing ones.
(Available only for ISDB-T streams.) This icon indicates the
presence of partial reception data in the stream. T he colors
indicate the status as follows:
Gray:
Green:
Gray + red cross:
Partial reception availability is unknown.
Partial reception data is available.
Partial reception data is not available.
1–36 MTS400 Series Analyzer Applications User Manual

Understanding the TSCA Window
Table 1-3: Field descriptions, from left to right (cont.)
Field Description
Processing Throttle
Indicator
System Log Status
This icon consists of three adjacent LED indicators which
show the status of the TSCA processing engine. The left
indicator shows the "strained" status (whether throttling is being
applied to cut down on the information being processed). The
central indicator shows the "overwhelmed" status (whether the
processing engine is able to cope with the amount of information
in the stream even after throttling). The right indicator shows
the status of the processing of SI tables even after throttling.
The colors indicate the status as follows:
(See page 1-38, Error Status LEDs.)
Green: OK
Amber:
Red: Processing is currently
White: Processor state is unknown
Gray:
Shows the status of the system log, which records system-wide
events, for example, scripting errors. The color of the LED (in
the body of the icon) indicates the most serious event state in
the log. When the top surface of the icon is gray, it indicates
that all entries in the log have been viewed. Double-click the
icon to view the log.
Gray:
Amber: There are entries in the log, but none
Red: There are new entries in the log
Processing was strained/overwhelmed,
but is currently OK
strained/overwhelmed
Test disabled
The log is empty
since the log was last viewed
MTS400 Series Analyzer Applications User Manual 1–37

Understanding the TSCA Window
Analyzer Window - No
Stream Available
If you choose no
t to select and analyze a stream, the screen will appear as shown in
the following figure. The analysis struct ure is present, but with no st ream content.
Error Status LEDs
Figure 1-18: Analyzer window - no file
Error status LEDs are used throughout the TSCA interface to represent the status
of the tests applied to associated items, such as programs, tests, and PIDs. Colors
used are as follows:
(Red) Error; test failed
(Yellow) Transient error (error not currently being detected but has been seen
since last reset)
(Green) No error; test passed
(Dark Blue) Warning (Interface tab only)
(Light Blue) Transient warning (warning not current, but has been detected
since last reset) (Interface tab only)
(Gray): Test disabled
(White) Test not applicable or unknown state
1–38 MTS400 Series Analyzer Applications User Manual

Understanding the TSCA Window
(Red) PID referenced but not found in the stream
(Green) PID referenced but not found in the stream. Applicable test disabled.
When an LED represents a parent node in a tree (for example, a program node is
the parent of elementary stream nodes), the color represents the worst case of all
of its tests and the worst case of all of the tests represented by its child nodes.
Similarly, when an LED representing a parent node in a tree is disabled or
enabled, all subsidiary (or child) nodes are also disabled or enabled to reflect the
state of the parent node. When an LED representing a parent node is reset, all
the child
nodes are also reset.
NOTE. The color scheme described here is used throughout the TSCA interface,
for example, the bit rate bars in the navigation views.
Test Management Context
Menu Options
Tests can be disabled and e nabled as required using the context menu associated
with the LED icon. However, it is important to note that the extent of the action
depends on the hierarchical level of the icon chosen. For example, choosing
Disable from a program node context menu will disable all tests in the program
group.
. In offline file analysis, if any disabled events are reenabled at the end of
NOTE
analysis, the LEDs will become green. You will have to restart the analysis if you
want to see the status of the test when the test is enabled.
MTS400 Series Analyzer Applications User Manual 1–39

Understanding the TSCA Window
Context Menus
Context menus provide an important way of navigating around the TSCA
application. They are available on most displayed objects, for example, program
tree nodes. T
example, after failure, all tests associated with a node can be reset, by selecting
the context menu option Reset All Tests. The context menu options provide both
actions (for example, enable and disable a function) and quick links to associated
objects in other views.
hese menus provide options relevant to the selected object. For
e 1-19: Context menu (example)
Figur
w context menus, right-click an object. The menus are associated with node
To vie
types (for example, a PID node). Node types can be displayed in more than one
view; for example, PID nodes are displayed in the Program view and the PID
view. All context menus have a title bar that indicates the selected node.
1–40 MTS400 Series Analyzer Applications User Manual

Using the Program View
The Program view is displayed when the Program tab is selected in the navigation
tabbed pane. The navigation view initially displays the top node of the program
tree, which r
epresents the analyzed transport stream from a program perspective.
Using the Program View
Figure 1-20: Program view
The detail view shows details of the node highlighted in the navigation view.
MTS400 Series Analyzer Applications User Manual 1–41

Using the Program View
Table 1-4: Program view tabs
With the tree ex
panded, the navigation view shows the makeup of the stream.
(See Figure 1-20.) The stream display consists of the nodes as shown in the
following figure.
Figure 1-21: Program view nodes
The foll
owing table shows which information is available for each node.
Tab s /
Node Summary
Transport
Stream
Program
Elementary
Stream
----
Now
Playing
Summary
/
IP
Graphs
-- -
MPE
Sessions
Associated
Tests
Graph Bit Rate
-- -
Graph Timing
Event
Log Parameters
In DVB analysis mode, the MPE tab is always present. However, the MPE view
will be populated only when MPE data is present in the stream. (See page 1-132,
MPE Views.)
Pressing the F3 key on the keyboard (or selecting Go to the next red LED in
current tree from one of the shortcut menus) will highlight the next red LED in
the curre
nt view. Only the lowest level nodes will be considered and highlighted in
the search since the parent nodes simply reflect the state of the lowest level nodes.
1–42 MTS400 Series Analyzer Applications User Manual

Using the Program View
Program Navig
ation - Transport Stream Node
The transport stream node represents the entire transport stream in terms of the
programs that it contains. The adjacent LED icon represents the status of the entire
transport st
When this node is selected, the detail view displays the transport stream summary.
The associated detail view provides a program-orientated overview of the
transport stream, allowing you to see the relative data rates of all of the programs
contained within the transport. A summary of the overall stream is also displayed.
The information can be displayed as either a bar chart or as a pie chart.
ream; any status error in the stream will be represented by this LED.
ThedatarateofaprogramisthecumulativedatarateofallthePIDsthatare
associated with that particular program, including PCR and ECM PIDs.
NOTE. Components can be shared between programs, so the overall data rate
of all of the programs may appear to be greater than the total data rate of the
ransport stream as shown in the status bar.
t
MTS400 Series Analyzer Applications User Manual 1–43

Using the Program View
Bar Chart
You can display
Each program identified in the stream is allocated one row of the table. Related
information includes the overall program status (icon), the program name,
program number, and the maximum, minimum and average bit rates.
In addition to the basic display, you can associate a maximum and minimum
threshold value with each program in the bar chart. (See page 1-123, Bar Charts.)
For deferre d analysis, where these values are set after analysis, the stream must
be reanalyzed for the new values to be applied. In real-time analysis, the new
values
program has stayed within the bit rate limits (green) or exceeded the limits (red).
will take effect immediately. The color of the bit rate bar indicates that the
the transport stream bar chart by selecting the bar chart icon.
1–44 MTS400 Series Analyzer Applications User Manual

Using the Program View
Pie Chart
You can display
The pie chart view is divided into two panes. The left pane shows the pie chart,
and the legend on the right provides a list of the component programs. Each
program is color-coded. The overall program status (icon), the program name
and number, and the bit rate are also provided. The values given in the pie chart
labels are bit rates expressed as percentages of the overall bit rate. The Null PID
wn in this view.
is sho
the transport stream pie chart by selecting the pie chart icon.
The color of the bit rate labels (and the bit rate values in the legend) reflects
tatus of the bit rate measurement, for example, green indicates that the
the s
program has stayed within the bit rate limits, and red indicates that the bit rate
has exceeded the limits.
Click and hold one of the pie chart segments to temporarily display an information
label. Double-click anywhere in the pie chart to toggle the display of all of the
segment labels.
MTS400 Series Analyzer Applications User Manual 1–45

Using the Program View
Historical Multiplex Graph
The historical
the historical multiplex graph, and the legend on the right provides a list of the
component programs. Each program is color-coded. Related information given
includes the overall program status, the program name and number.
multiplex view is divided into two panes. The left pane shows
Test Status Panes
1-22: Historical Multiplex Graph
Figure
me Period drop-down list allows you to select a range of X-axis time
The Ti
periods.
The lower view pane allows you to see a summary of the states of all the associated
s as well as the event log for the entire transport stream (an unfiltered event
test
log). The test tabs that are available will depend on the interpretation standard that
you choose. For example, with the DVB interpretation standard, the available tabs
are TR 101 209 and Other. Other interpretation standards will generate different
tabs and different sets of tests. (See page 1-167, SI/PSI Nodes.)
When any test in the transport stream has failed (and has not been reset), you can
identify which individual tests have failed by observing the red LEDs.
You can use the shortcut menus to reset and disable tests, to set alarms, CaptureVu
Breakpoints and record flags,andtojumptoassociatedtests.
1–46 MTS400 Series Analyzer Applications User Manual

Using the Program View
Event Log
The Event Log sc
reen displays the log entries as shown in the following figure
for the whole transport stream. In deferred mode, the packet generating the error
report can be inspected by highlighting the error and selecting Go to packet
from the shortcut menu. Similarly, in real-time analysis mode, and where an
event concerns a PID carrying a PCR, you can use the shortcut menu to jump to
the relevant PCR graph. Deferred PCAP file analysis enables a shortcut that
allows Ethe
rnet packets to be viewed.
Figure 1-23: Event log
IP Graphs
Three buttons are available in the Error Log toolbar: (See page 1-119, Event Log.)
Table 1-5: Event log buttons
Icon Description
Pin log / Log is pinned
/
Export log
Clear log
The IP graphs, where available, are as follows:
Packet Interarrival Time (PIT): Shows the mean interarrival time of IP packets.
PIT histogram: Shows the distribution of packet arrival intervals. The X
is contains accumulators where interval times are collected. The Y axis
ax
corresponds to number of intervals that collect in each accumulator.
thernet flow rate: Bit rate of the Ethernet flow being analyzed.
E
Delay factor: A measurement that characterizes IP packet cumulative jitter
and delay. (Delay factor is the amount of buffer, in milliseconds, that would
MTS400 Series Analyzer Applications User Manual 1–47

Using the Program View
be required to s
by the media payload.)
Media loss rat
The available graphs vary, depending on which IP interface options being used.
Unavailable graph names will be grayed out in the selection menu.
ubtract IP packet arrival deviations from the rate determined
e: Media packets lost per second.
NOTE. G
Common User Interface Concepts section of this manual. (See page 1-103, Graph
Management.) (See page 1-109, Timing Graphs.)
raph management and timing graphs are described in more detail in the
1–48 MTS400 Series Analyzer Applications User Manual

Program Navigation - Program Nodes
Each of the program nodes in the transport stream represents a single program
referenced within the stream. When a program node is selected in the navigation
view, the detail pane displays the details of the program. The LED adjacent to the
program node represents the status of its child nodes (elementary streams) and
the related
tests.
Using the Program View
The program detail view provides you with an overview of the selected program,
allowing you to see the relative data rates and stream types of all of the PIDs that
are associated with the program (including PCR and ECM PIDs). If the program
contains an MPEG2 or H.264 video stream, it is decoded to produce a thumbnail
picture of the content; this is updated during real time analysis. Similarly, where
EPG information is associated with the program, a summary (Now and Next
program) is displayed. PID content is indicated using icons. (See page 1-100,
Icons.) Bar chart and pie chart views are available.
PID related information is available under the Summary tab.
The Thumbnails tab displays thumbnails and details of the streams for each of the
programs (where available). (See page 1-115, Thumbnail Views.)
The Program Tests tab shows tests related to the program. Similarly, the Bit rate
Graphs tab displays the program bit rate in graph form.
Many tests have associated parameters; these parameters are set by the selected
standard, but you can modify the settings. (See page 1-117, Parameter Edit.)
MTS400 Series Analyzer Applications User Manual 1–49

Using the Program View
VLC Media Player
The Event Log sh
selected, the event log will show the events related to all tests associated with the
elementary stream selected in the program tree.
The VLC Media
video formats. The player allows program content displayed in the TSCA
thumbnails to be played in a larger window. The media player is automatically
accessed from the TSCA when you choose to view or listen to the video and audio
content of program streams.
NOTE. The VLC Media Player is not installed as part of the MTS400 Series
system. I
Start User Manual (Tektronix part number: 071-2607-xx). You can find full
documentation of VLC on the Videolan Web site, http://www.videolan.org.
To start the media player, click the start button (below the thumbnail) in the
Program Summary view.
nstallation of the player is described in the MTS400 Series Quick
ows the errors for the highlighted test. When no tests are
Player is a portable multimedia player for various audio and
The VLC Media Player opens and the selected program content (video and/or
audio) plays. To close the player, click the stop button (below the thumbnail).
NOTE. The VLC Media Player may open "behind"the TSCA window. Use the
ndows controls to bring it forward. If the VLC Media Player is installed on
Wi
the MTX100B / RTX100B / MTX130B instrument, the audio feature in the media
player must be disabled.
1–50 MTS400 Series Analyzer Applications User Manual

Using the Program View
Elementary Stream
Analysis
The elementary
using the MTS4CC Elementary Stream Compliance Checker or the MTS4EA
Elementary Stream Analyzer. Select the ES icon below each thumbnail picture.
streams in the selected program can be examined in more detail
Program Navigation - Elementary Stream Node
Each of the elementary stream nodes in the program tree represents a single
element
the view pane displays the Elementary Stream summary view.
ary stream referenced by the parent program. When this node is selected,
MTS400 Series Analyzer Applications User Manual 1–51

Using the Program View
When you hold th
stream type and description.
An LED associated with each elementary stream node indicates the status of the
tests relating to the elementary stream.
When the selected elementary stream PID contains timing information, PCR
trend analysis views are also available, allowing you to display graphs of PCR
accuracy and PCR interval data. When the transport stream contains timestamped
data, th
drift rate graphs are also a vailable.
NOTE. Graph management and timing graphs are described in more detail in the
Common User Interface Concepts section of this manual. (See page 1-103, Graph
Management.) (See page 1-109, Timing Graphs.)
e PCR overall jitter, PCR frequency offset, PCR arrival time, and PCR
e cursor over the elementary stream node, a tooltip provides the
1–52 MTS400 Series Analyzer Applications User Manual

Using the Program View
Figure 1-24: PCR Graphs view
The Associated Tests tab shows tests related to the elementary stream node.
Many tests have associated parameters; these parameters are set by the selected
standard, but you can modify the settings. (See page 1-117, Parameter Edit.)
Similarly, the Event Log shows the errors for the highlighted test. When no tests
are selected, the event log will show the events rel ated to all tests associated with
the elementary stream that is selected in the program tree.
MTS400 Series Analyzer Applications User Manual 1–53

Using the Tests View
Using the Tests View
The Tests view displays test information that is relevant to the transport stream
being analyzed. The view is displayed when the Tests tab is selected in the
Navigation t
abbed pane. (See Figure 1-25.)
Figure 1-25: Tests Navigation view
1–54 MTS400 Series Analyzer Applications User Manual
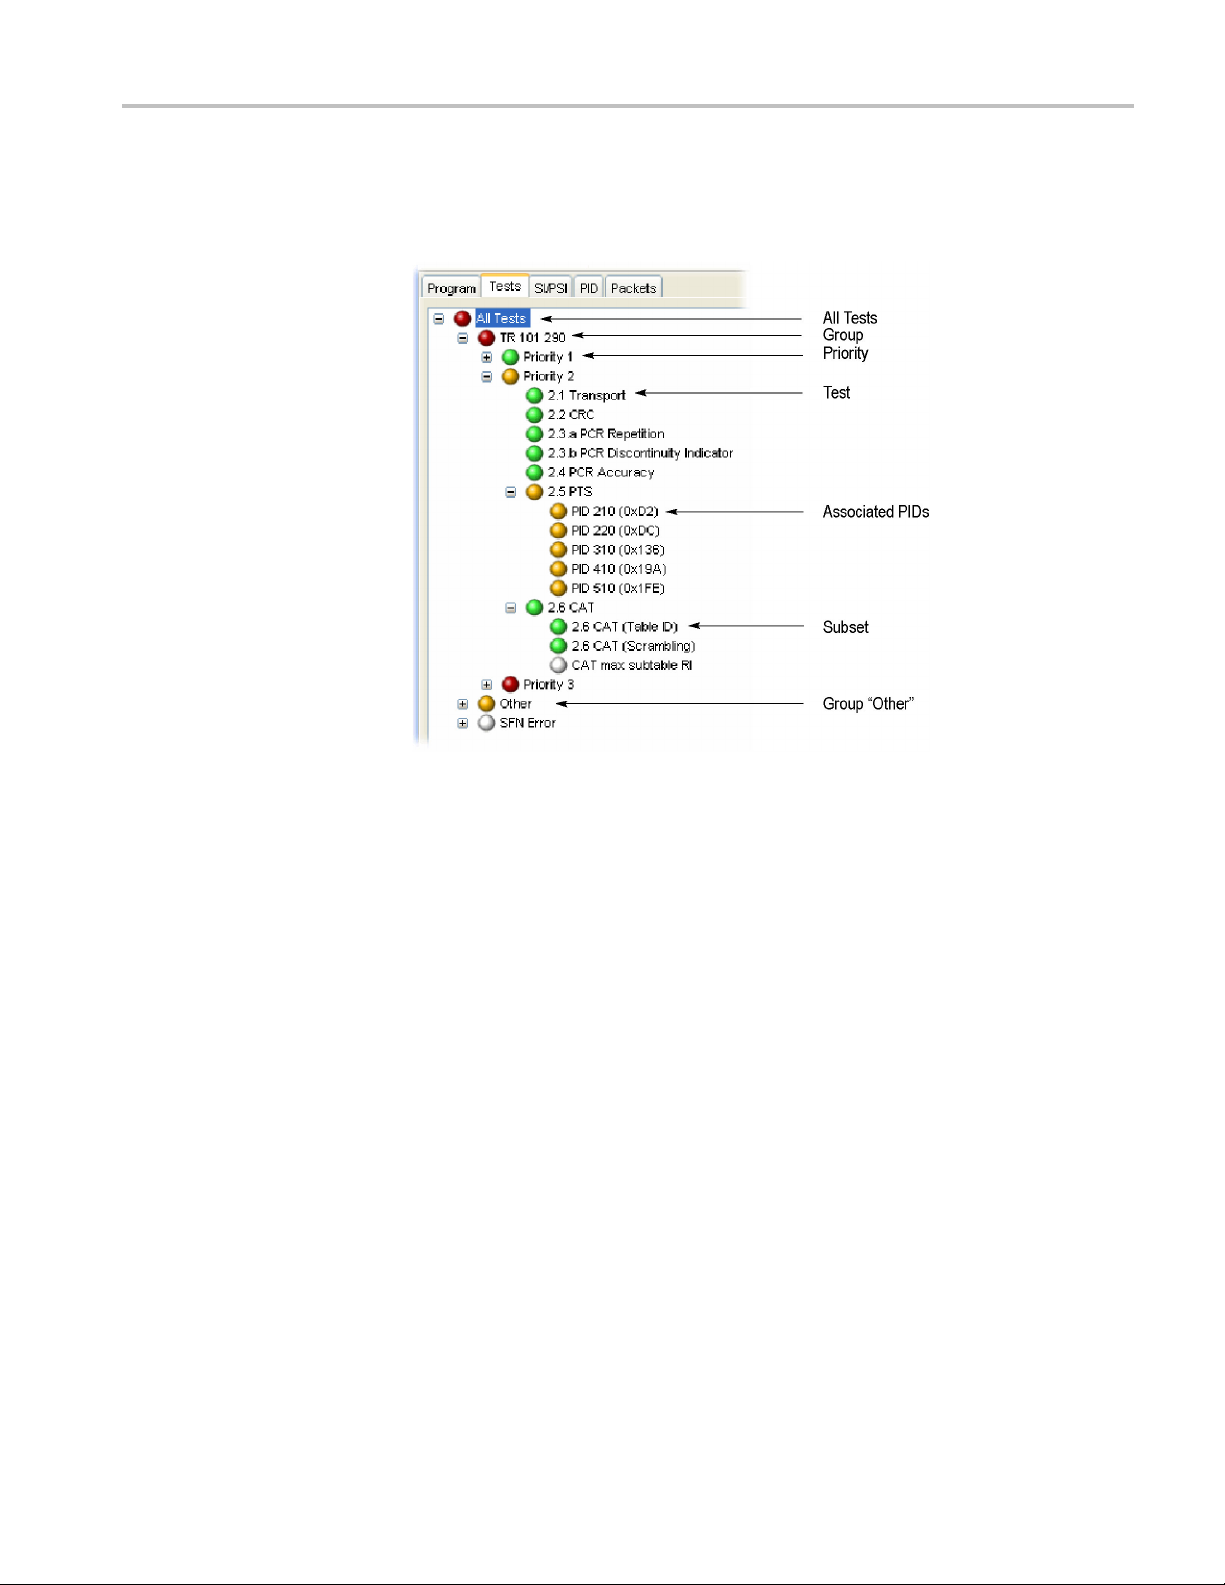
Using the Tests View
The view displa
to the analyzed transport stream. The following figure shows the nodes available
in the navigation view.
ys a test tree, which represents all the tests that have been applied
Test Structure
Figure 1-26: Test view nodes
The tes
stream complying with a particular digital video standard: MPEG, DVB, ATSC,
and ISDB. The standard must be selected before beginning analysis. The test tree
contains nodes for each test that the analyzer can implement.
t tree structure represents all of the tests that can be applied to a transport
MTS400 Series Analyzer Applications User Manual 1–55

Using the Tests View
An example of a t
tests for DVB transport streams. (See Figure 1-26.) The Group node is split into
priority groups: First Priority, Second Priority, and Third Priority. Each of these
priority groups contains a number of individual tests.
ree structure for a selected standard is the TR 101 290 group of
Test gr
currently implemented standards contain a subset of the relevant TR 101 290 tests.
Note that in standards other than DVB, the tests are not numbered.
Where relevant, PIDs will be associated with a test in the te st tree when the test
has e ither been disabled, or when it has failed.
The LED associated with eac h node indicates the status of the node and its child
nodetests. (Seepage1-38,Error Status LEDs.) Total entries in the Event Log
for each group of tests and for each test are indicated in parenthesis; resetting a
group of tests or a test restarts the count in parenthesis.
ouping differs between digital video standards. However, all of the
1–56 MTS400 Series Analyzer Applications User Manual

Using the Tests View
Test Filtering
Interpreting t
the top of the Tests navigation view.
Figure 1-27: Test filtering buttons
When a button is selected, it hides a category of tests in the test tree display, as
follows:
Grey - hides disabled tests
White - hides tests with unknown or not applicable status
Green - hides tests with OK status
he display of tests can be made easier using the three filter buttons at
MTS400 Series Analyzer Applications User Manual 1–57

Using the Tests View
Tests Navigation - All Tests
The detail view when the All Tests node i s selected. (See Figure 1-25.) In addition
to a summary of all tests, the event log shows the most recent 10000 events that
have occurred during analysis of the stream.
Test Failures View
Figure 1-28: Test Failures screen
The Test Failures view provides an overview of the tests that have failed during
stream analysis. The view is divided into two panes. The left panes shows those
tests that have failed in the last second. The right pane shows those tests that have
failed, not including those that have failed in the last second, and are displayed on
the left side.
If a test fails, it will be displayed on the left side. When it no longer fails, it will be
removed from the left side and listed on the right side as a test that has previously
iled. If the test fails again, it will be removed from the left side and redisplayed
fa
on the right side until it no longer fails.
ditionally, tests that have been listed (in either pane) in the last second are
Ad
displayed at the top of the list and shaded.
1–58 MTS400 Series Analyzer Applications User Manual

Test Navigation - Test Nodes
When you select a test node, the Associated PIDs pane displays a summary of
all of the PIDs and an event log listing all events that are associated with the
test. Where parameters are applicable to the test, you can modify them under
the Parameters tab.
Using the Tests View
MTS400 Series Analyzer Applications User Manual 1–59

Using the Tests View
Test Navigation - PID Nodes
Where tests have failed, the PIDs affected are listed under the test node in the Tests
navigation view. Selecting a PID will display the Event Log in the detail view.
NOTE. The screenshot also shows the Edit Parameters dialog box, which is
available from the PID node context menu. (See page 1-117, Parameter Edit.)
1–60 MTS400 Series Analyzer Applications User Manual

Using the Tables View
The Tables view (SI/PSI tab) displays service information in tree form, as in the
other navigation views. The tree represents the service information tables that
have occurre
video standard. This includes MPEG program specific information, DVB service
information, ATSC and ISDB program information, and system information
protocol. The tree contains nodes for each table that is found; tables/nodes are
grouped together by functionality. The following figure shows an example of the
Table navigation v iew with DVB stream interpretation selected.
Using the Tables View
d in the analyzed stream and which comply with the selected digital
Figure 1-29: Tables view
Every node within the service information tree has a corresponding summary
view. Nodes that represent tables will also provide you with access to the table
structure and hex data. (See page 1-63, Tables Detail View - Section View.) (See
ge 1-65, Tables Detail View - SI Repetition Graphs.)
pa
Some of the nodes that represent less common tables or table groups may not
ave specific summary views available in the analyzer. In these cases, a generic
h
summary view is used.
MTS400 Series Analyzer Applications User Manual 1–61

Using the Tables View
Table Summary
Pane
The table summary view provides a summary of the table related information for
the analyzed transport stream. There is a table summary view for every node of
the service i
All summary views for nodes that represent an individual table or subtable
will displa
information is extracted. Where relevant, links (underlined text) are provided to
associated objects, for example, in the programs summary, links are provided to
the individual program summary views. Similarly, arrow icons provide links to
the electronic program guide (EPG) tables. (See Figure 1-30.) Where the section
is carried on a PID, a link is also provided to the PID view.
The foll
selected in the navigation view.
nformation. The content is dictated by the selected node.
y the table identity and version number of the table from which the
owing shows an example of the summary pane with the PMT PIDs node
Figure 1-30: Tables view - Programs (example)
EPG Views
1–62 MTS400 Series Analyzer Applications User Manual
Aspecific departure from the Table Summary view described previously is the
EPG view that is d isplayed when a section of the EPG table is highlighted. For
a description of the general presentation of the EPG view. (See page 1-127,
EPG View.)
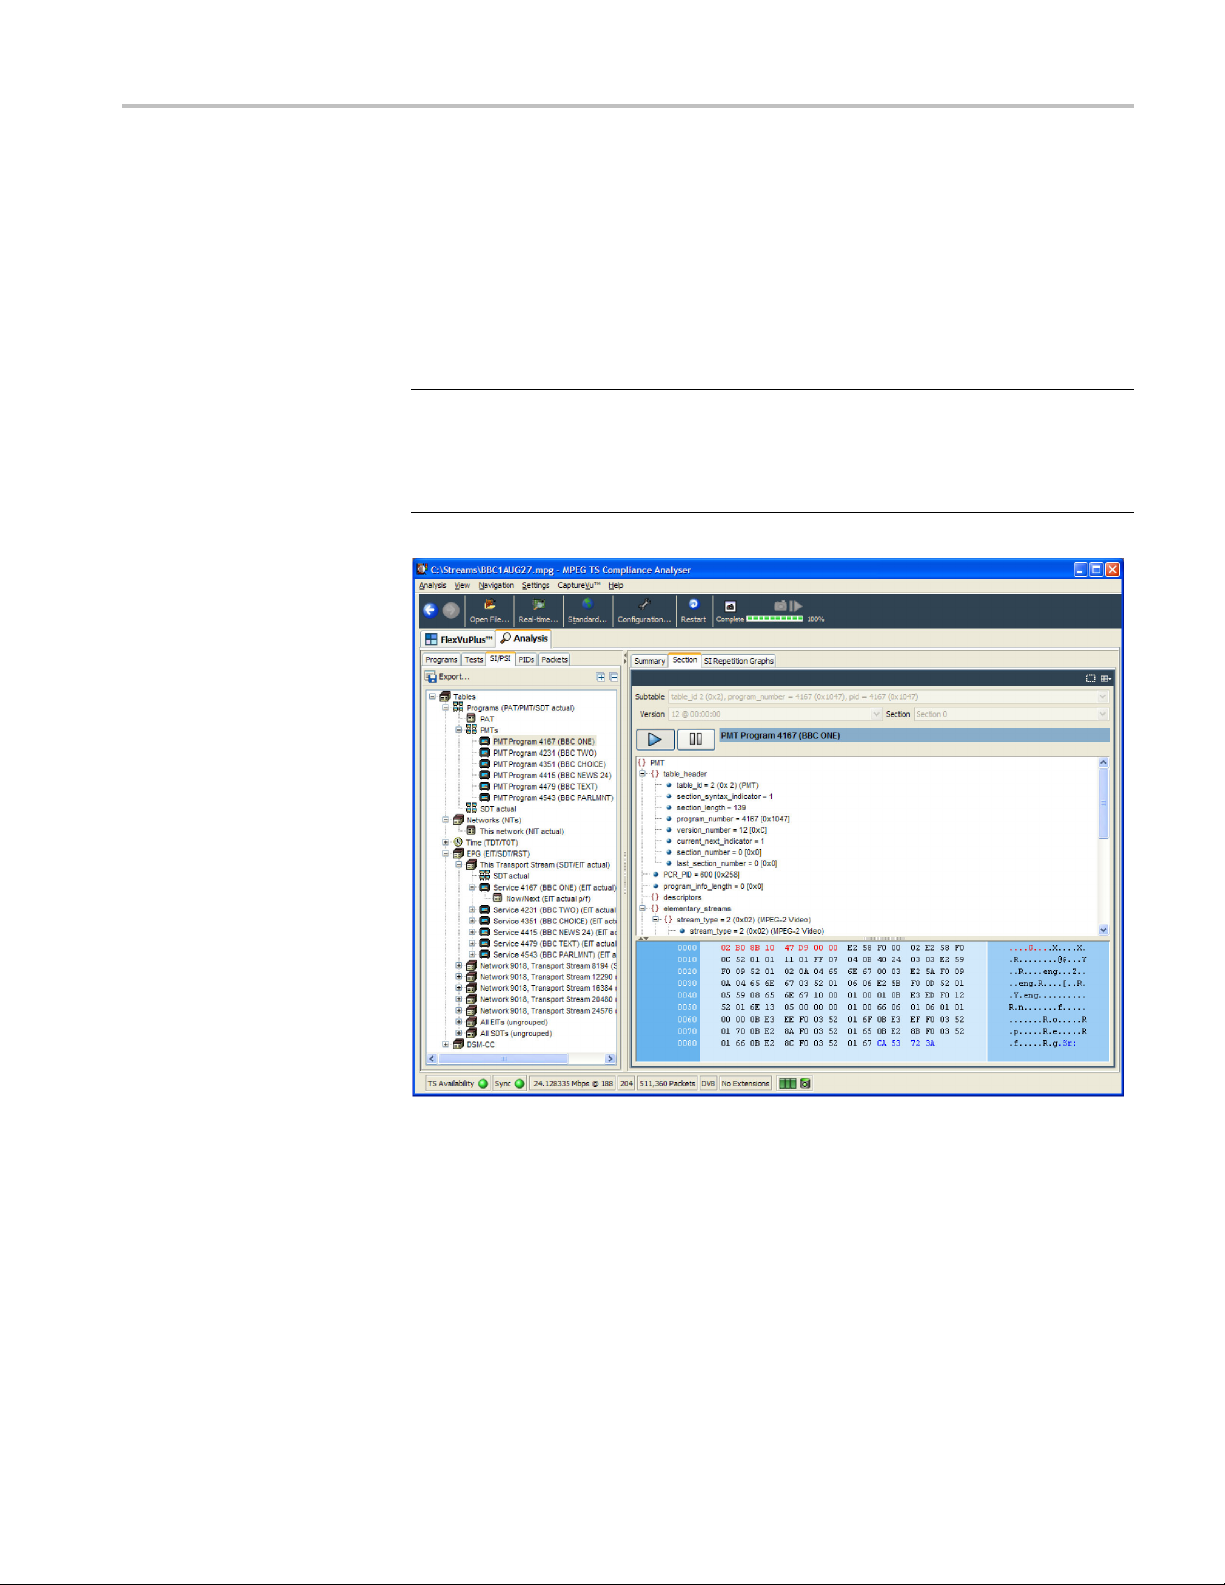
Using the Tables View
Tables Detail
View - Section View
The detailed section view is available when the selected node in the service
information tree represents a table or subtable in the transport stream. During
real-time an
The subtable identity, version, and section are displayed at the top of the table
pane.
NOTE. In deferred mode, where two or more subtables, versions or sections are
found in the stream, the relevant field is active, and a n alternative selection can be
made from the drop-down list.
In real-time mode, only the latest version and section can be viewed.
alysis, the view is continually updated.
The table pane shows all fields that make up a section (for example, PMT). The
fields are arranged in a hierarchical order. The presence of subordinate fields is
indicated using { } bracket symbols adjacent to the container field. The container
can be expanded or collapsed by clicking the + or - icon.
MTS400 Series Analyzer Applications User Manual 1–63

Using the Tables View
Below the table
bytes (in both hexadecimal number format and ASCII character format) for the
selected table, version, and section. When a node is selected in the table pane,
the bytes that make up the selected node (including the subordinate nodes) are
highlighted in the hexadecimal data pane as shown in the following figure.
pane, the data source is displayed. The data pane shows the data
Figure 1-31: Section payload
If the section is corrupt or empty, the hexadecimal view background is red instead
ue.
of bl
The pause button in the detail window title bar allows real time section data to be
sed (or frozen), so that it can be examined in detail. The play button resumes
pau
the real time display of section data.
1–64 MTS400 Series Analyzer Applications User Manual

Using the Tables View
Tables Detail
Export
SI/PSI as XML
View - SI Repetition Graphs
The section graph view is available when the selected node in the service
information tree represents a table or subtable in the transport stream. You can
view graphs o
Section repetition interval: This graph displays the interval between two
sections of
Subtable intersection gap: This graph displays the interval between sections
in a partic
Subtable repetition interval: This graph displays the time between receiving
one compl
NOTE. Not all of the above graph types are relevant to all table types. (See
page 1-103, Graph Management.)
The export control in the top left corner of the SI/PSI navigation pane opens the
Export SI/PSI as XML dialog box. Enter an output file name (and path) and
t the required options.
selec
f the following data:
a table on a particular PID.
ular subtable.
ete subtable and receiving the next complete subtable.
MTS400 Series Analyzer Applications User Manual 1–65

Using the PID View
Using the PID View
The PID view displays information about all of the PIDs found in the transport
stream being analyzed. The navigation view contains the PID tree structure
representin
g all of the PIDs that have occurred within the transport stream.
In DVB analysis mode, the MPE tab is always present. However, the MPE view
will only be populated when MPE data is present in the stream. (See page 1-132,
MPE Views.)
PID View - All PIDs
In the navigation view, PIDs are grouped under the following subordinate nodes:
Reserved PIDs
Referenced PIDs
Unreferenced PIDs
SI/PSI PIDs
User PIDs
Obsolete PIDs (deferred analysis only)
1–66 MTS400 Series Analyzer Applications User Manual

Using the PID View
The number of PI
label shows the total number of PIDs found and the Network Name.
When highligh
that are found in the analyzed stream.
Each of thes
allocated during analysis, and the number of PIDs is identified for each node. You
can also allocate PID numbers to the U ser PID node, although User PIDs may not
necessarily have been found in the stream. This feature allows you to compare the
properties of one or more PIDs more easily.
The associated summary view provides a PID-oriented overview of the transport
stream, allowing you to see the relative data rates of all of the PIDs contained
within the transport stream. The information can be displayed as e ither a bar chart,
or as a pi
descending order by clicking on the column header. PID related information is
available under the PID Information tab.
Each PID is associated with a number of tests. If one or more tests fail, they will
be listed under the relevant PID node in the navigation view. Selecting the PID
node will display a summary, in the detail view, of all associated tests that have
been found. Selecting a specific test in the A ssociated Tests pane will display the
Event Log and Parameters for only that test.
e chart. Columns in the summary views can be sorted in ascending or
Ds in each group is shown adjacent to the node. The root node
ted, the All PIDs node displays in the detail pane all of the PIDs
e subordinate nodes contains PIDs belonging to that group. PIDs are
MTS400 Series Analyzer Applications User Manual 1–67
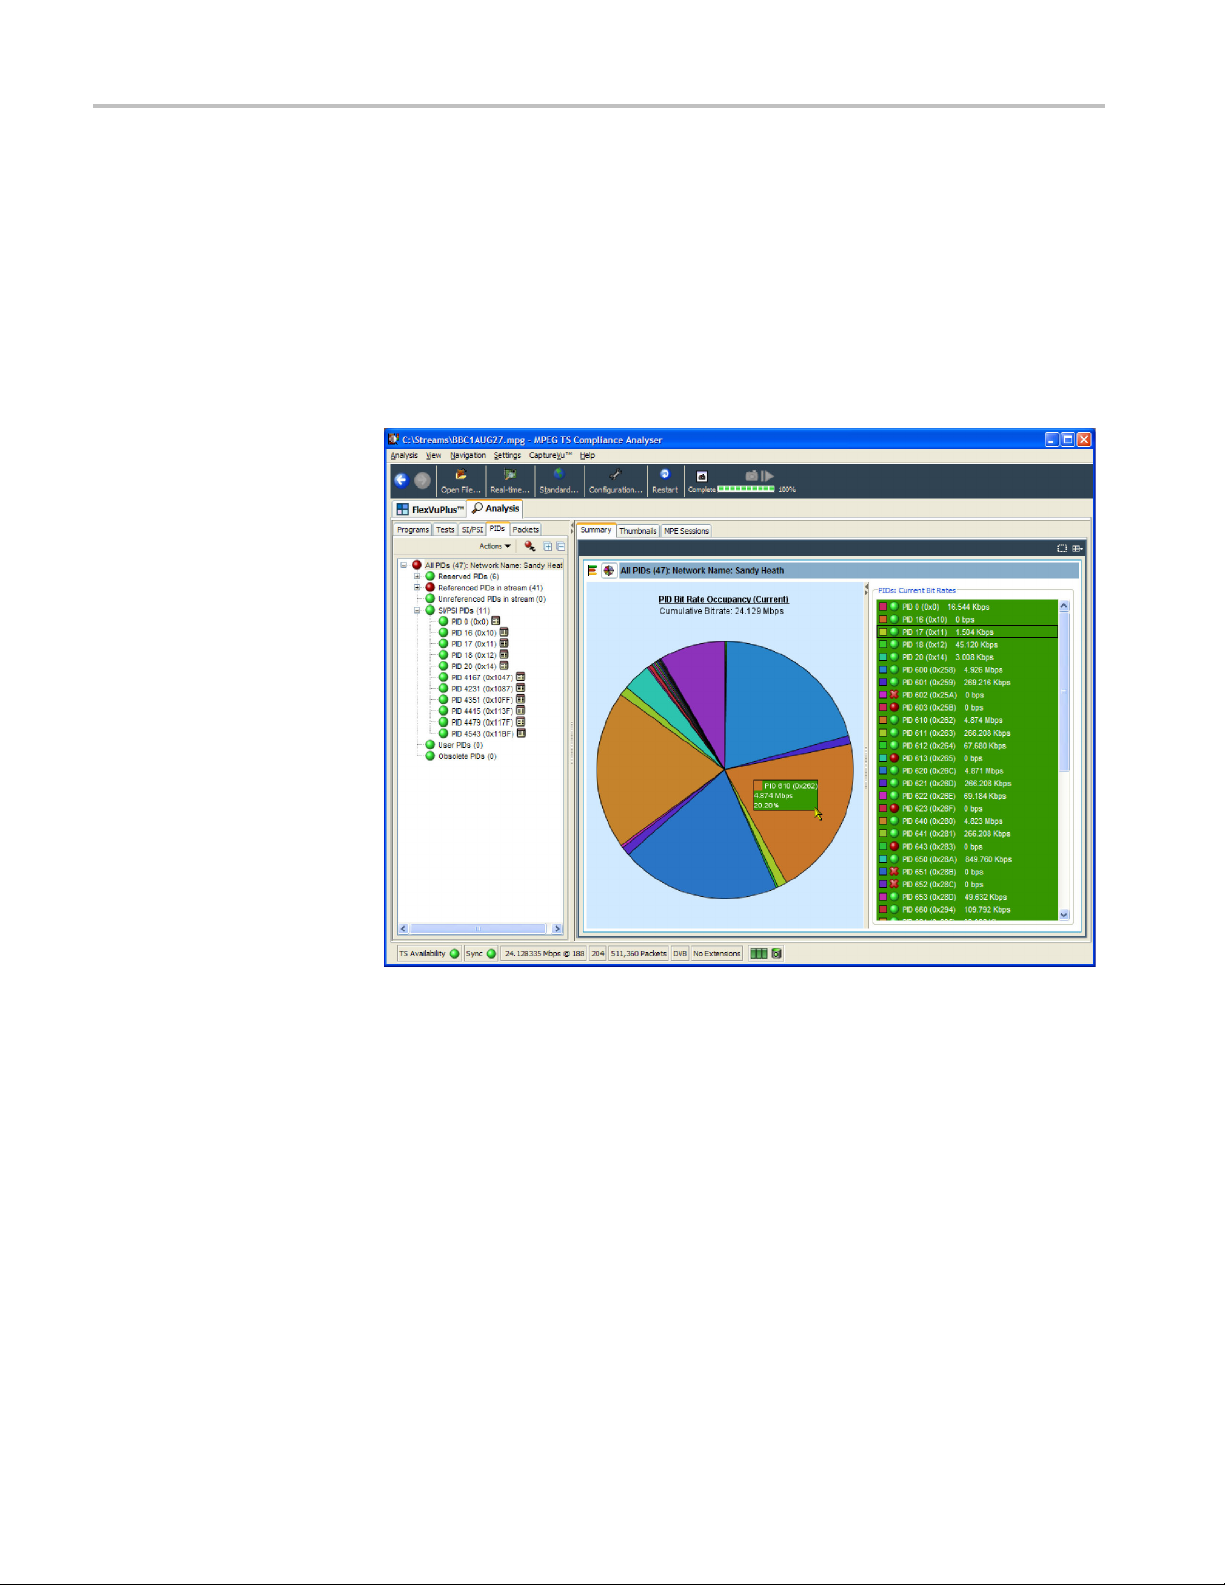
Using the PID View
PID View - Deta
il View (All PID and PID Group)
The All PID and PID Group detail view provides you with a PID-oriented
overview of the transport stream. This view is displayed when any of the
main nodes is
Unreferenced PIDs, or User PIDs.
The view shows the relative data rates of all of the PIDs contained within the
selected node. You can display the information in either a bar chart or a pie
format. The associated test states are shown in all views.
selected in the navigation pane: All PIDs, Referenced PIDs,
Figure 1-32: PID Summary view
The PID Information view provides PID related information, for example, PID
type stream type, scrambled status and the presence of PCRs. Layer information is
also shown when analyzing ISDB streams. (See Figure 1-33.) The icons provide
indication of the PID content. (See page 1-100, Icons.)
an
Where a PID carries video or audio, thumbnails are displayed under the Now
laying tab.
P
1–68 MTS400 Series Analyzer Applications User Manual

Using the PID View
In deferred mod
carrying a PID by highlighting the PID, and sele cting the Go To Packets v iew from
the shortcut menu. The packet will be added to the PIDs list (in the Packets view).
e (or during CaptureVu analysis), you can view the packets
PID Vi
ew - Detail View (PIDs)
Ordinary PID Selected
Figure 1-33: PID Information view
The individual PID detail view provides you with information about the selected
PID. This view will be visible when you select an individual PID node in the
ree. If a PID has failed a test, one or more test nodes are displayed as child
PID t
nodes of the PID.
combination and detail of the views vary depending on the selected PID
The
type and node.
ring deferred or captured analysis, the packets carrying the PID can be
Du
examined in more detail by highlighting a PID, and selecting the Go to Packets
view from the shortcut menu.
hen a PID does not contain PCRs, the main view in the PID pane is the
W
Associated Tests view. This view lists the tests associated with the selected PID.
The status of the individual tests is indicated with LED icons. Also available are
Bit rate Graphs, which show the bit rate of the selected PID in graphical form.
MTS400 Series Analyzer Applications User Manual 1–69
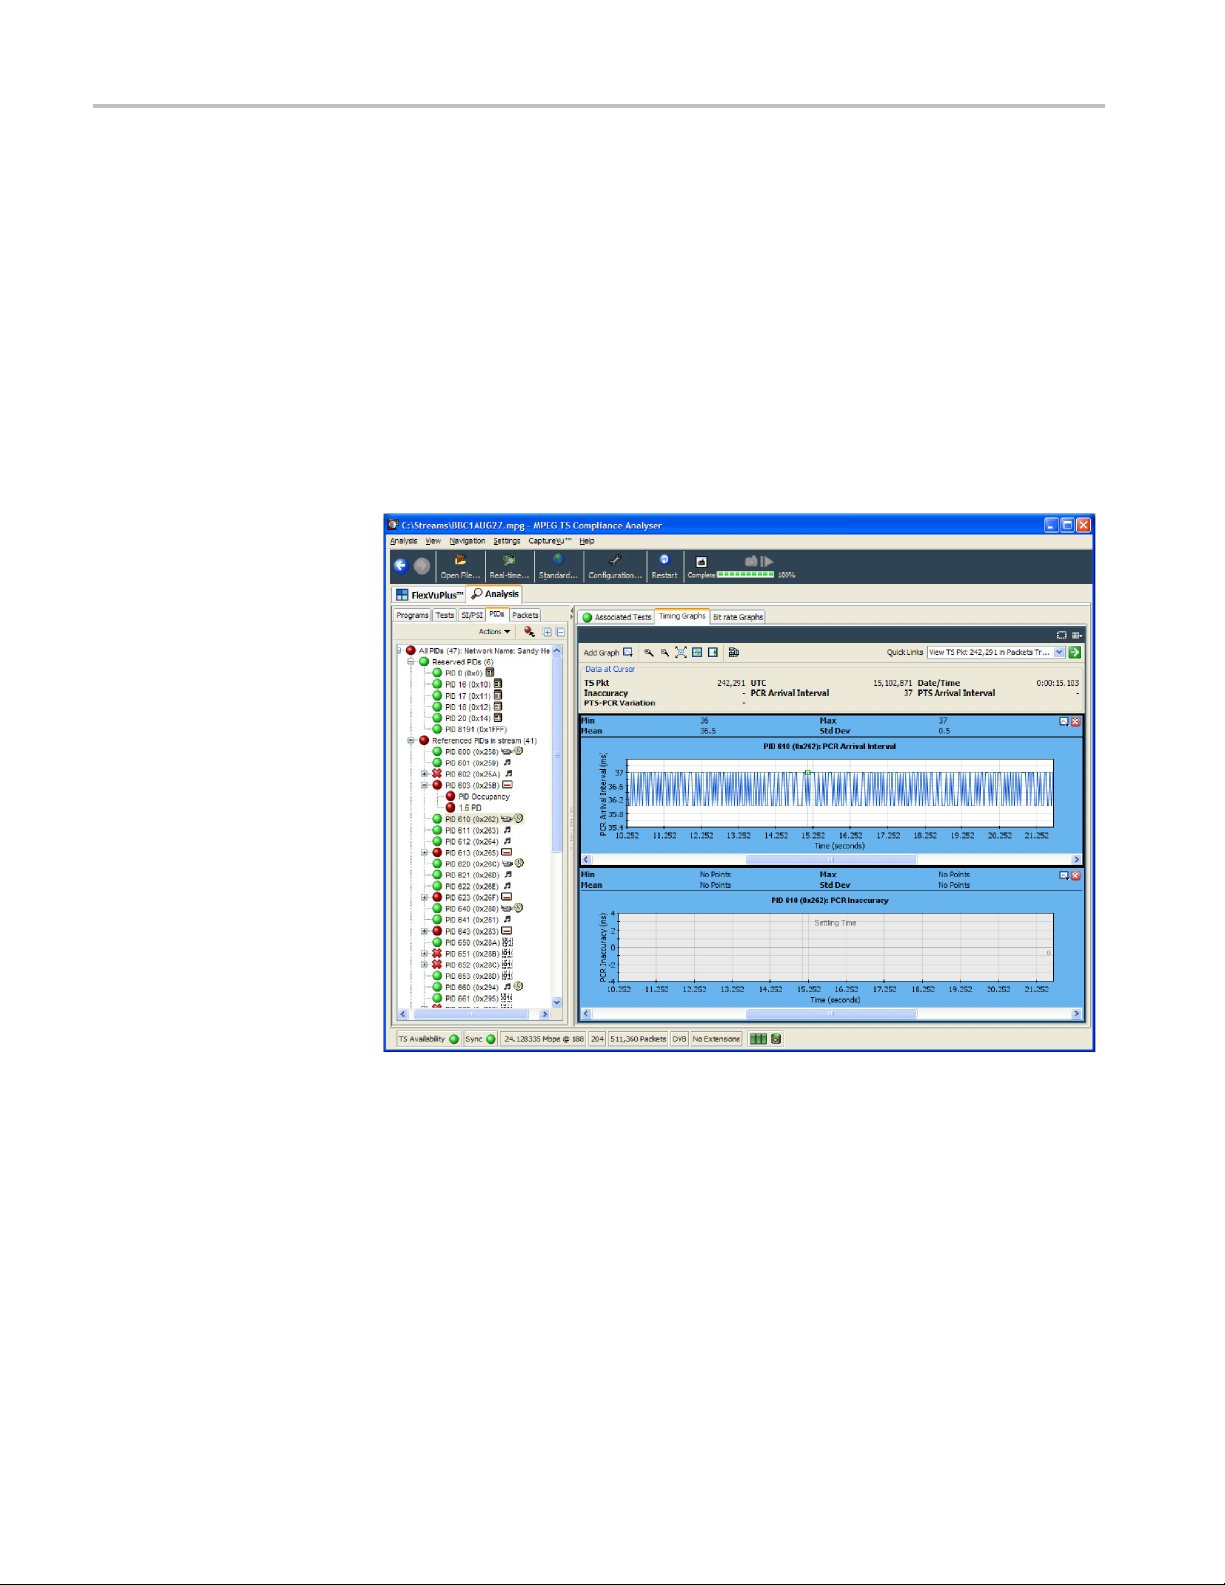
Using the PID View
PCR P ID Selected
Also on the Asso
event log shows all PID related events. If a test is selected in the PID pane, only
the events associated with that test on that PID are shown. Similarly, when a
test is selected, the Parameters pane shows the parameters associated with that
test (when applicable).
When the selected PID contains PCR information, PCR inaccuracy and PCR
interval data graphs will be displayed in addition to a bit rate graph. When
the transport stream contains time stamped data, the PCR overall jitter, the
PCR frequency offset, and the PCR drift rate graphs will also be available. For
real-tim
(See page 1-113, PIT Graph.)
e IP analysis, the Packet Interval Timing (PIT) graph is also available.
ciated Tests tab is an event log and a parameters pane. The
A Presentation Time Stamp (PTS) graph may also be available on PIDs carrying
audio and video information. And a PTS-PCR graph showing the variation
tween the PTS and PCR values; this can help detect buffering issues.
be
(See page 1-103, Graph Management.) (See page 1-109, Timing Graphs.)
1–70 MTS400 Series Analyzer Applications User Manual

Using the Packets View
NOTE. The Packets view is available only during deferred analysis and CaptureVu
analysis.
Data in the stream is carried in 188- or 204-byte packets. The Packets view allows
you to exami
Using the Packets View
ne the contents of each packet in the analyzed stream.
The packet navigation view shows a tree structure which represents the packets
within a stream grouped according to content, including PID value, SFN
mega-initialization packets (MIPs) (DVB only), and ISDB-T information packets
Ps).
(II
The All Packets, MIP and IIP nodes do not have any child nodes. The All Packets
de represents all of the packets in the transport stream. The MIP node represents
no
all of the DVB SFN MIPs in the transport stream. The IIP node represents all of
the ISDB-T information packets in the transport stream.
The PIDs node represents all of the PIDs that are of interest. You can add PIDs
in the transport stream to this node, and to PIDs that are contained within the
user PID list.
MTS400 Series Analyzer Applications User Manual 1–71

Using the Packets View
Packet Nav
igation Bar
Selecting any l
packets. For example, selecting a PID node will only allow packets carrying
that particular PID to be displayed in the associated summary view. Similarly,
selecting the MIP node will only allow MIP information to be displayed in the
associated summary view.
Double-clicking the Custom Packet Search node opens a dialog box in which
you can specify strings to search for.
In the packet summary view, you can use the top bar to navigate the packets
in the stream.
The pac
eaf node in the packet tree will apply a packet filter to the associated
ket position bar shows the position of the selected packet in the stream.
The navigation bar functionality depends on the selection in the packet navigation
view. If you select All Packets, the controls will operate on all packets. If you
select a single PID, a filter is in operation, and the controls will work only for
those packets carrying that PID.
Selects the first available packet (in the stream or carrying the
selected PID)
Selects the previous available packet (in the stream or carrying
the selected PID)
Selects the next available packet (in the stream or carrying the
selected PID)
Selects the last available packet (in the stream or carrying the
selected PID)
Opens the Go To Packet dialog box
You can also use the packet position bar to navigate through the stream. To do so,
use the cursor to point to and click the next packet to be displayed. Double-click
the packet number in the bar to open the Go To Packet dialog box. Enter the
required packet number and select OK. For both methods, remember that the
destination packet is dependent on the node selected in the navigation view.
1–72 MTS400 Series Analyzer Applications User Manual

Packet Navigation - Filter Nodes
The packet filters allow you to view packets carrying PID.
To inspect the sequence of packets carrying a particular PID, you must add the PID
to the PID Filters node in the Packet Navigation view. PIDs carrying sections can
also be viewed. You can add as many PIDs as are required. There are a number of
ways to add a PID to the node, as described in the following paragraphs.
Using the Packets View
Adding a PID in the Packet
View
Removing PIDs
1. In the Packet view, expand the PIDs node by doing one of the following:
Double-click the child node (double-click to add a PID).
Select Ad
2. In the Add PID... dialog box, expand the nodes, locate and select the required
PID.
3. Click OK.
The selected PID is added to the PIDs node, and the first occurrence of a packet
carrying the selected PID is displayed in the summary view.
Added PIDs will be stored when the application is closed. They will be reinstated
when the application is reopened. However, if a different stream is analyzed, the
ed PIDs may not be used.
stor
All PIDs previously added to the PID node can be removed by selecting Remove
All from the PIDs node shortcut menu.
d PID... from the PIDs node shortcut menu.
MTS400 Series Analyzer Applications User Manual 1–73

Using the Packets View
Packet Detail View
The detail view shows the fields and data that are contained in a packet. The
fields are arranged in a hierarchical order. The presence of subordinate fields is
indicated using { } bracket symbols adjacent to the container field. To expand or
collapse the container, click the + or - icon.
Below the ta
bytes (in both hexadecimal number format and ASCII character format) for the
selected packet. When you select a node in the table pane, the bytes that make
up the selected node (including the subordinate nodes) are highlighted in the
hexadecimal data pane.
ble pane, the data source is displayed. The data pane shows the data
packet transport header bytes are displayed in red. Similarly, bytes greater
The
than 188 are displayed in gray. The adaptation field, where present, is displayed
in blue.
If the section is corrupted or empty, the background of the hex view is red instead
of blue.
1–74 MTS400 Series Analyzer Applications User Manual

Using the Packets View
ISDB Streams
The following fi
ISDB-T stream. Note the IIP tab a nd the additional TMCC and IIP nodes.
gure shows an example of the p acket detail view with an analyzed
Figure
1-34: Packet view - ISDB detail -IIP
MTS400 Series Analyzer Applications User Manual 1–75

Using the Interface View
Using the Inte
rface View
If real time a
displayed in the Navigation view of the TSCA window.
NOTE. The Interface view is available only if an interface card is selected for
real-time analysis.
nalysis using an interface card is invoked, the Interface tab is
Figure 1-35: Interface View - Example
Two interface card test nodes are displayed in the navigation view: IF Error
Collection and IF Warning Collection. Each collection contains a range of tests.
(See Figure 1-35.)
The detail of the interface view is different for each interface type.
Detail View Tabs
The detail view contains four tabs: Instantaneous graphs, Trend graphs, Event
Log, and Parameters. This section describes the tabs in general terms. The
following sections describe in detail the tabs associated with each interface type.
Instantaneous Graphs
1–76 MTS400 Series Analyzer Applications User Manual
The instantaneous graphs display instantaneous measurements in graphical form.

Using the Interface View
Trend Graphs
Event Log
Parameters
Readings and Controls
The trend graph
s display trends in measurements in graphical form.
The event log displays a history of the events related to the item selected in the
navigation view.
The paramet
ers tab display the parameters associated with the test highlighted in
the navigation view. Parameter editing is described in the Common User Interface
Concepts.(Seepage1-117,Parameter Edit.)
The right panel contains Readings and Controls. The Readings area displays
values received from the card itself.
The RF Lock LED conveys different types of information. If full lock onto the
channel is acquired and it is receiving the signal correctly, the LED will light up
green. When a signal is present but no lock is achieved, the indicator is red. When
no signal is found, the indicator is gray.
In the R
eadingsarea,theLEDcolorsareasfollows:
Green On
Red
Gray Off or not applicable
Out of range or failed test
The R eadings background colors are a s follows:
White In range
Red
Yellow Not recently updated
Gray Not applicable; for example, out of order packets not being
Out of range; for example, too much or too little power or out of
order packets per second being greater than zero
available when the UDP protocol is selected
The Controls area contains user controls. Values entered here will be applied to
the card and will affect its performance. These controls correspond exactly with
those on the Open Transport Stream dialog box.
MTS400 Series Analyzer Applications User Manual 1–77

Using the Interface View
RF Interface V
RF Interface
- QAM (Annex
iews
This section describes the settings and displays associated with the RF interface
cards.
The settings and displays of the QAM (Annex B) RF interface card are as follows:
QAM(B) Interface Settings, QAM(B) Instantaneous Graphs, and QAM(B) Trend
B)
Graphs.
re 1-36: Interface View - RF - QAM (Annex B)
Figu
1–78 MTS400 Series Analyzer Applications User Manual
 Loading...