


User Manual
MTS400 Series
MPEG Test Systems
Carousel Applications
077-0203-00
This document applies to firmware version 1.7
and above.
www.tektronix.com

Copyright © Tektronix. All rights reserved. Licensed software products are owned by Tektronix or its subsidiaries or
suppliers, and are protected by national copyright laws and international treaty provisions.
Tektronix products are covered by U.S. and foreign patents, issued and pending. Information in this publication supercedes
that in all previously published material. Specifications and price change privileges reserved.
TEKTRONIX and TEK are registered trademarks of Tektronix, Inc.
Contacting Tektronix
Tektronix, Inc.
14200 SW Karl Braun Drive
P.O. Box 500
Beaverton, OR 97077
USA
For product information, sales, service, and technical support:
H In North America, call 1-800-833-9200.
H Worldwide, visit www.tektronix.com to find contacts in your area.

Warranty 9(b)
Tektronix warrants that the media on which this software product is furnished and the encoding of the programs on
the media will be free from defects in materials and workmanship for a period of three (3) months from the date of
shipment. If any such medium or encoding proves defective during the warranty period, Tektronix will provide a
replacement in exchange for the defective medium. Except as to the media on which this software product is
furnished, this software product is provided “as is” without warranty of any kind, either express or implied.
Tektronix does not warrant that the functions contained in this software product will meet Customer’s
requirements or that the operation of the programs will be uninterrupted or error-free.
In order to obtain service under this warranty, Customer must notify Tektronix of the defect before the expiration
of the warranty period. If Tektronix is unable to provide a replacement that is free from defects in materials and
workmanship within a reasonable time thereafter, Customer may terminate the license for this software product
and return this software product and any associated materials for credit or refund.
THIS WARRANTY IS GIVEN BY TEKTRONIX WITH RESPECT TO THE PRODUCT IN LIEU OF ANY
OTHER WARRANTIES, EXPRESS OR IMPLIED. TEKTRONIX AND ITS VENDORS DISCLAIM ANY
IMPLIED WARRANTIES OF MERCHANTABILITY OR FITNESS FOR A PARTICULAR PURPOSE.
TEKTRONIX’ RESPONSIBILITY TO REPLACE DEFECTIVE MEDIA OR REFUND CUSTOMER’S
PAYMENT IS THE SOLE AND EXCLUSIVE REMEDY PROVIDED TO THE CUSTOMER FOR BREACH OF
THIS WARRANTY. TEKTRONIX AND ITS VENDORS WILL NOT BE LIABLE FOR ANY INDIRECT,
SPECIAL, INCIDENTAL, OR CONSEQUENTIAL DAMAGES IRRESPECTIVE OF WHETHER TEKTRONIX
OR THE VENDOR HAS ADVANCE NOTICE OF THE POSSIBILITY OF SUCH DAMAGES.


Table of Contents
Carousel Analyzer
General Safety Summary vii. . . . . . . . . . . . . . . . . . . . . . . . . . . . . . . . . . . . . . . . . .
Preface ix. . . . . . . . . . . . . . . . . . . . . . . . . . . . . . . . . . . . . . . . . . . . . . . . . . .
Related Documentation x. . . . . . . . . . . . . . . . . . . . . . . . . . . . . . . . . . . . . . . . . . .
Carousel Analyzer - Getting Started 1−1. . . . . . . . . . . . . . . . . . . . . . . . . .
Data Broadcasting Overview 1−3. . . . . . . . . . . . . . . . . . . . . . . . . . . . . . . . . . . . . . .
Starting the Program 1−4. . . . . . . . . . . . . . . . . . . . . . . . . . . . . . . . . . . . . . . . . . . . . .
Menus and Controls 1−13. . . . . . . . . . . . . . . . . . . . . . . . . . . . . . . . . . . . . . .
Menu Options 1−13. . . . . . . . . . . . . . . . . . . . . . . . . . . . . . . . . . . . . . . . . . . . . . . . . . .
Toolbars 1−17. . . . . . . . . . . . . . . . . . . . . . . . . . . . . . . . . . . . . . . . . . . . . . . . . . . . . . .
Transport Packet Bar 1−19. . . . . . . . . . . . . . . . . . . . . . . . . . . . . . . . . . . . . . . . . . . . .
Status Bar 1−20. . . . . . . . . . . . . . . . . . . . . . . . . . . . . . . . . . . . . . . . . . . . . . . . . . . . . .
Workspace 1−21. . . . . . . . . . . . . . . . . . . . . . . . . . . . . . . . . . . . . . . . . . . . . . . . . . . . . .
Views 1−27. . . . . . . . . . . . . . . . . . . . . . . . . . . . . . . . . . . . . . . . . . . . . . . . . . . .
Programs/Services View 1−30. . . . . . . . . . . . . . . . . . . . . . . . . . . . . . . . . . . . . . . . . . .
Object Carousel View 1−34. . . . . . . . . . . . . . . . . . . . . . . . . . . . . . . . . . . . . . . . . . . . .
U-N-Download View 1−41. . . . . . . . . . . . . . . . . . . . . . . . . . . . . . . . . . . . . . . . . . . . .
Data Carousel (DVB) View 1−45. . . . . . . . . . . . . . . . . . . . . . . . . . . . . . . . . . . . . . . .
Data Carousel (ARIB) View 1−46. . . . . . . . . . . . . . . . . . . . . . . . . . . . . . . . . . . . . . . .
Resource View 1−50. . . . . . . . . . . . . . . . . . . . . . . . . . . . . . . . . . . . . . . . . . . . . . . . . .
Structure Views 1−52. . . . . . . . . . . . . . . . . . . . . . . . . . . . . . . . . . . . . . . . . . . . . . . . . .
Bitrate View 1−55. . . . . . . . . . . . . . . . . . . . . . . . . . . . . . . . . . . . . . . . . . . . . . . . . . . .
Repetition View 1−58. . . . . . . . . . . . . . . . . . . . . . . . . . . . . . . . . . . . . . . . . . . . . . . . .
PID View 1−61. . . . . . . . . . . . . . . . . . . . . . . . . . . . . . . . . . . . . . . . . . . . . . . . . . . . . . .
Log View 1−64. . . . . . . . . . . . . . . . . . . . . . . . . . . . . . . . . . . . . . . . . . . . . . . . . . . . . .
Cycle Times View 1−67. . . . . . . . . . . . . . . . . . . . . . . . . . . . . . . . . . . . . . . . . . . . . . .
Application Support 1−71. . . . . . . . . . . . . . . . . . . . . . . . . . . . . . . . . . . . . . .
Application Management 1−71. . . . . . . . . . . . . . . . . . . . . . . . . . . . . . . . . . . . . . . . . .
Application Definition 1−73. . . . . . . . . . . . . . . . . . . . . . . . . . . . . . . . . . . . . . . . . . . .
Application Timing 1−78. . . . . . . . . . . . . . . . . . . . . . . . . . . . . . . . . . . . . . . . . . . . . .
MHP Support 1−91. . . . . . . . . . . . . . . . . . . . . . . . . . . . . . . . . . . . . . . . . . . . .
Application Lifetimes 1−93. . . . . . . . . . . . . . . . . . . . . . . . . . . . . . . . . . . . . . . . . . . . .
Reference 1−95. . . . . . . . . . . . . . . . . . . . . . . . . . . . . . . . . . . . . . . . . . . . . . . . .
Script Files 1−95. . . . . . . . . . . . . . . . . . . . . . . . . . . . . . . . . . . . . . . . . . . . . . . . . . . . .
Error Checking 1−96. . . . . . . . . . . . . . . . . . . . . . . . . . . . . . . . . . . . . . . . . . . . . . . . . .
References 1−97. . . . . . . . . . . . . . . . . . . . . . . . . . . . . . . . . . . . . . . . . . . . . . . . . . . . .
Carousel Generator
Carousel Generator - Getting Started 2−1. . . . . . . . . . . . . . . . . . . . . . . . .
Data Broadcasting Overview 2−1. . . . . . . . . . . . . . . . . . . . . . . . . . . . . . . . . . . . . . .
Carousel Generator Overview 2−2. . . . . . . . . . . . . . . . . . . . . . . . . . . . . . . . . . . . . .
Starting the Application 2−6. . . . . . . . . . . . . . . . . . . . . . . . . . . . . . . . . . . . . . . . . . .
Version 00e
MTS400 Series Carousel Applications User Manual
i

Table of Contents
Carousel Wizard 2−9. . . . . . . . . . . . . . . . . . . . . . . . . . . . . . . . . . . . . . . . . .
Step 1: Select Carousel 2−11. . . . . . . . . . . . . . . . . . . . . . . . . . . . . . . . . . . . . . . . . . . .
Step 2: Carousel Properties 2−12. . . . . . . . . . . . . . . . . . . . . . . . . . . . . . . . . . . . . . . .
Step 3: Carousel Contents 2−13. . . . . . . . . . . . . . . . . . . . . . . . . . . . . . . . . . . . . . . . .
Step 4: Collection Contents 2−15. . . . . . . . . . . . . . . . . . . . . . . . . . . . . . . . . . . . . . . .
Step 5: Imported Elementary Streams 2−18. . . . . . . . . . . . . . . . . . . . . . . . . . . . . . . .
Step 6: Program Entry 2−20. . . . . . . . . . . . . . . . . . . . . . . . . . . . . . . . . . . . . . . . . . . .
Step 7: Output Stream Properties 2−21. . . . . . . . . . . . . . . . . . . . . . . . . . . . . . . . . . . .
Step 8: Congratulations 2−22. . . . . . . . . . . . . . . . . . . . . . . . . . . . . . . . . . . . . . . . . . .
Menus and Controls 2−23. . . . . . . . . . . . . . . . . . . . . . . . . . . . . . . . . . . . . . .
Menus Options 2−23. . . . . . . . . . . . . . . . . . . . . . . . . . . . . . . . . . . . . . . . . . . . . . . . . .
Toolbars 2−27. . . . . . . . . . . . . . . . . . . . . . . . . . . . . . . . . . . . . . . . . . . . . . . . . . . . . . .
Log Window 2−30. . . . . . . . . . . . . . . . . . . . . . . . . . . . . . . . . . . . . . . . . . . . . . . . . . . .
Status Bar 2−31. . . . . . . . . . . . . . . . . . . . . . . . . . . . . . . . . . . . . . . . . . . . . . . . . . . . . .
Properties Window (List Control) 2−31. . . . . . . . . . . . . . . . . . . . . . . . . . . . . . . . . . .
Carousel Generation 2−33. . . . . . . . . . . . . . . . . . . . . . . . . . . . . . . . . . . . . . .
Setting Overall Carousel Generator Properties 2−33. . . . . . . . . . . . . . . . . . . . . . . . .
Creating a Session 2−39. . . . . . . . . . . . . . . . . . . . . . . . . . . . . . . . . . . . . . . . . . . . . . .
Selecting the Carousel Type 2−41. . . . . . . . . . . . . . . . . . . . . . . . . . . . . . . . . . . . . . . .
Modifying the Carousel Properties 2−42. . . . . . . . . . . . . . . . . . . . . . . . . . . . . . . . . . .
Carousel Contents 2−51. . . . . . . . . . . . . . . . . . . . . . . . . . . . . . . . . . . . . . . . . . . . . . . .
Collections 2−66. . . . . . . . . . . . . . . . . . . . . . . . . . . . . . . . . . . . . . . . . . . . . . . . . . . . .
Programs 2−70. . . . . . . . . . . . . . . . . . . . . . . . . . . . . . . . . . . . . . . . . . . . . . . . . . . . . . .
Output Stream Generation 2−79. . . . . . . . . . . . . . . . . . . . . . . . . . . . . . . . . . . . . . . . .
Carousel Definition File 2−79. . . . . . . . . . . . . . . . . . . . . . . . . . . . . . . . . . . . . . . . . . .
PSI and SI in the Carousel Generator Output Stream 2−81. . . . . . . . . . .
PSI/SI Mode Settings 2−81. . . . . . . . . . . . . . . . . . . . . . . . . . . . . . . . . . . . . . . . . . . . .
MPEG PSI tables 2−82. . . . . . . . . . . . . . . . . . . . . . . . . . . . . . . . . . . . . . . . . . . . . . . .
DVB SI Tables 2−89. . . . . . . . . . . . . . . . . . . . . . . . . . . . . . . . . . . . . . . . . . . . . . . . . .
Summary 2−103. . . . . . . . . . . . . . . . . . . . . . . . . . . . . . . . . . . . . . . . . . . . . . . . . . . . . . .
Version 00e
ii
MTS400 Series Carousel Applications User Manual

List of Figures
Table of Contents
Figure 1−1: Main window - Intial appearance 1−4. . . . . . . . . . . . . . . . . .
Figure 1−2: DVB programs/services view (typical) 1−30. . . . . . . . . . . . . .
Figure 1−3: ARIB programs/services view (typical) 1−31. . . . . . . . . . . . . .
Figure 2−1: MPEG PSI 2−74. . . . . . . . . . . . . . . . . . . . . . . . . . . . . . . . . . . . .
Figure 2−2: DVB SI 2−74. . . . . . . . . . . . . . . . . . . . . . . . . . . . . . . . . . . . . . . .
Version 00e
MTS400 Series Carousel Applications User Manual
iii

Table of Contents
List of Tables
Table i: Overview of MTS400 Series carousel applications ix. . . . . . .
Table ii: MTS400 Series related documentation x. . . . . . . . . . . . . . . .
Table 1−1: File menu options 1−5. . . . . . . . . . . . . . . . . . . . . . . . . . . . . . . .
Table 1−2: View menu options 1−5. . . . . . . . . . . . . . . . . . . . . . . . . . . . . . .
Table 1−3: Analysis menu options 1−5. . . . . . . . . . . . . . . . . . . . . . . . . . . .
Table 1−4: File menu options 1−13. . . . . . . . . . . . . . . . . . . . . . . . . . . . . . . .
Table 1−5: Edit menu options 1−13. . . . . . . . . . . . . . . . . . . . . . . . . . . . . . .
Table 1−6: View menu options 1−14. . . . . . . . . . . . . . . . . . . . . . . . . . . . . . .
Table 1−7: Graph menu options 1−15. . . . . . . . . . . . . . . . . . . . . . . . . . . . .
Table 1−8: Window menu options 1−16. . . . . . . . . . . . . . . . . . . . . . . . . . . .
Table 1−9: Help menu options 1−17. . . . . . . . . . . . . . . . . . . . . . . . . . . . . . .
Table 1−10: Key to tree nodes 1−28. . . . . . . . . . . . . . . . . . . . . . . . . . . . . . .
Table 1−11: Script files - General 1−95. . . . . . . . . . . . . . . . . . . . . . . . . . . .
Table 1−12: Script files - Carousel Analyzer 1−96. . . . . . . . . . . . . . . . . . .
Table 2−1: File menu options 2−23. . . . . . . . . . . . . . . . . . . . . . . . . . . . . . . .
Table 2−2: Edit menu options 2−24. . . . . . . . . . . . . . . . . . . . . . . . . . . . . . .
Table 2−3: View menu options 2−24. . . . . . . . . . . . . . . . . . . . . . . . . . . . . . .
Table 2−4: Session menu options 2−25. . . . . . . . . . . . . . . . . . . . . . . . . . . . .
Table 2−5: Player menu options 2−26. . . . . . . . . . . . . . . . . . . . . . . . . . . . .
Table 2−6: Tools menu options 2−26. . . . . . . . . . . . . . . . . . . . . . . . . . . . . .
Table 2−7: Help menu options 2−26. . . . . . . . . . . . . . . . . . . . . . . . . . . . . . .
Table 2−8: Generator toolbar icons 2−27. . . . . . . . . . . . . . . . . . . . . . . . . . .
Table 2−9: Player toolbar icons 2−28. . . . . . . . . . . . . . . . . . . . . . . . . . . . . .
Table 2−10: Session icons 2−29. . . . . . . . . . . . . . . . . . . . . . . . . . . . . . . . . . .
Table 2−11: Program Association Table (PAT) 2−82. . . . . . . . . . . . . . . . .
Table 2−12: Program Map Table (PMT) 2−83. . . . . . . . . . . . . . . . . . . . . .
Table 2−13: DSM-CC object carousels -
Carousel identifier descriptor 2−84. . . . . . . . . . . . . . . . . . . . . . . . . . . .
Table 2−14: DSM-CC object carousels - Association tag descriptor 2−85
Table 2−15: DVB object carousels - Private_data_byte syntax 2−86. . . .
Table 2−16: DVB object carousels - Descriptors 2−86. . . . . . . . . . . . . . . .
Table 2−17: DTT object carousels 2−87. . . . . . . . . . . . . . . . . . . . . . . . . . . .
Table 2−18: MHP object carousels - Application signaling 2−88. . . . . . .
Version 00e
iv
MTS400 Series Carousel Applications User Manual

Table of Contents
Table 2−19: MHP object carousels - ID selector 2−88. . . . . . . . . . . . . . . . .
Table 2−20: Network information table 2−89. . . . . . . . . . . . . . . . . . . . . . .
Table 2−21: Service Description Table (SDT) 2−91. . . . . . . . . . . . . . . . . .
Table 2−22: Service descriptor 2−92. . . . . . . . . . . . . . . . . . . . . . . . . . . . . . .
Table 2−23: Data broadcast descriptor 2−92. . . . . . . . . . . . . . . . . . . . . . . .
Table 2−24: DVB object carousel 2−93. . . . . . . . . . . . . . . . . . . . . . . . . . . .
Table 2−25: DTT object carousel 2−94. . . . . . . . . . . . . . . . . . . . . . . . . . . . .
Table 2−26: Event Information Table (EIT) 2−95. . . . . . . . . . . . . . . . . . .
Table 2−27: Short event descriptor 2−96. . . . . . . . . . . . . . . . . . . . . . . . . . .
Table 2−28: Time and date table 2−97. . . . . . . . . . . . . . . . . . . . . . . . . . . . .
Table 2−29: Application information table 2−98. . . . . . . . . . . . . . . . . . . . .
Table 2−30: Application descriptor 2−99. . . . . . . . . . . . . . . . . . . . . . . . . . .
Table 2−31: Application name descriptor 2−100. . . . . . . . . . . . . . . . . . . . . .
Table 2−32: Transport protocol descriptor 2−101. . . . . . . . . . . . . . . . . . . . .
Table 2−33: Java application descriptor 2−101. . . . . . . . . . . . . . . . . . . . . . .
Table 2−34: Java application location descriptor 2−102. . . . . . . . . . . . . . .
Table 2−35: HTML application descriptor 2
Table 2−36: HTML application location descriptor 2−103. . . . . . . . . . . . .
−102. . . . . . . . . . . . . . . . . . . .
Version 00e
MTS400 Series Carousel Applications User Manual
v

Table of Contents
Version 00e
vi
MTS400 Series Carousel Applications User Manual

General Safety Summary
Review the following safety precautions to avoid injury and prevent damage to
this product or any products connected to it.
To avoid potential hazards, use this product only as specified.
Only qualified personnel should perform service procedures.
While using this product, you may need to access other parts of a larger system.
Read the safety sections of the other component manuals for warnings and
cautions related to operating the system.
To Avoid Fire or
Personal Injury
Use Proper Power Cord. Use only the power cord specified for this product and
certified for the country of use.
Connect and Disconnect Properly. Do not connect or disconnect probes or test
leads while they are connected to a voltage source.
Ground the Product. This product is grounded through the grounding conductor
of the power cord. To avoid electric shock, the grounding conductor must be
connected to earth ground. Before making connections to the input or output
terminals of the product, ensure that the product is properly grounded.
Observe All Terminal Ratings. To avoid fire or shock hazard, observe all ratings
and markings on the product. Consult the product manual for further ratings
information before making connections to the product.
Do not apply a potential to any terminal, including the common terminal, that
exceeds the maximum rating of that terminal.
Power Disconnect. The power cord disconnects the product from the power
source. Do not block the power cord; it must remain accessible to the user at all
times.
Do Not Operate Without Covers. Do not operate this product with covers or panels
removed.
Do Not Operate With Suspected Failures. If you suspect there is damage to this
product, have it inspected by qualified service personnel.
Avoid Exposed Circuitry. Do not touch exposed connections and components
when power is present.
Use Proper Fuse. Use only the fuse type and rating specified for this product.
Wear Eye Protection. Wear eye protection if exposure to high-intensity rays or
laser radiation exists.
Do Not Operate in Wet/Damp Conditions.
Version 00e
MTS400 Series Carousel Applications User Manual
vii

General Safety Summary
Do Not Operate in an Explosive Atmosphere.
Keep Product Surfaces Clean and Dry.
Provide Proper Ventilation. Refer to the manual’s installation instructions for
details on installing the product so it has proper ventilation.
Terms in this Manual
These terms may appear in this manual:
WARNING. Warning statements identify conditions or practices that could result
in injury or loss of life.
CAUTION. Caution statements identify conditions or practices that could result in
damage to this product or other property.
viii
Version 00e
MTS400 Series Carousel Applications User Manual

Preface
The MTS400 Series MPEG systems applications are described in three user
manuals. The full list of applications can be found in the MTS400 Series Quick
Start User Manual. This manual describes the carousel related applications. All
applications are available on the following MTS400 Series products:
H MTS415
H MTS430
H MTS4SA
H MTS400P
H MTX100B (where installed)
Table i: Overview of MTS400 Series carousel applications
Application Desktop Icon
Carousel Analyzer - Data analysis showing structure, bit rate, repetition rate,
syntax and semantics of data items.
Carousel Generator - Provides in-depth, off-line generation of MPEG-2, DVB
transport streams containing a range of data broadcast protocols.
Version 00e
MTS400 Series Carousel Applications User Manual
ix
Preface
Related Documentation
Table ii lists the documentation available for your MTS400 Series instrument:
Table ii: MTS400 Series related documentation
Title Tektronix part number Location
MTS400 Series Quick Start User Manual
English
Japanese
MTS400 Series Analyzer Application User Manual
(This manual)
MTS400 Series Generator Applications User Manual 077-0204-xx
MTS400 Series Carousel Applications User Manual 077-0203-xx
MTS400 Series Programmer Manual 077-0206-xx
MTS400 Series Release Notes 077-0200-xx
MTS4EA Compressed Video Elementary Stream
Analyzer User Manual
MTS4CC Elementary Stream Compliance Checker
User Manual
MTS400P Quick Start User Manual
English
Japanese
071-2607-xx
071-2608-xx
077-0205-xx
071-1641-xx
071-2075-xx
071-2610-xx
071-2611-xx
+
+
+
+
+
+
+
+
+
+
+
+
Version 00e
x
MTS400 Series Carousel Applications User Manual

Carousel Analyzer


Carousel Analyzer - Getting Started
The Digital Storage Media Command and Control (DSM-CC) protocol was
originally developed to provide a VCR-like control mechanism for program
material delivered in an MPEG2 transport stream. Since then, the standard has
evolved to encompass a wide variety of applications including data broadcasting
and interactive television. DSM-CC forms a core part of a variety of both closed
and open standards such as the DVB MHP (Multimedia Home Platform)
standard for European Interactive Television.
The following DTV standards are supported:
(See page 1−97 for details of all references in this section.)
H ISO/IEC 13818-6 Information technology - Generic coding of moving
pictures and associated audio information - Part 6: Extension for Digital
Storage Media Command and Control [MPEG] (Reference [2])
H EN 301 192 Specification for data broadcasting [DVB] (Reference [4])
H ARIB STD - B24 Data Coding and Transmission Specification for Digital
Broadcasting (Reference [11])
H Multimedia Home Platform [DVB] (Reference [12])
A bibliography of DTV standards documentation is given in the Reference
section.
The Carousel Analyzer has been developed to meet the specific need to analyze
and display the content and structure of data broadcasts. The tool provides a
variety of ways of looking at a transport stream and its contents including
displaying the bit rate, repetition rates, structure, syntax, and semantics of data
items.
Version 00e
MTS400 Series Carousel Applications User Manual
1−1

Carousel Analyzer - Getting Started
The program view shows the various services in the transport stream and their
associated PIDs and data streams. Object or data (one or two layer) carousels and
U-U or U-N messages such as DSM-CC Download can also be displayed with
options to view associated, sections, carrier modules, or transport packets for
each version as required.
An object carousel in the stream can be viewed by contents as a directory
structure containing the underlying objects such as Java classes, picture, or text
files. If an object is associated with an installed application then a double-click
will launch that program, providing, for example, an easy and quick way to view
the contents of a picture file or read a text file.
The structure of the U-N download messages can be viewed showing the
relationship between DII, modules and blocks. The associated DSI and DII
messages contained in the U-N-Download tables can also be viewed in interpreted or hex fashion; these indicate where to find and view the BIOPs that
contain a required object in the stream.
The timing relationships between the various components can also be easily
shown because the bit rates or the repetition rates of blocks, modules, objects,
U-N messages or SI tables can be shown together in a single graphical display.
1−2
Version 00e
MTS400 Series Carousel Applications User Manual

Data Broadcasting Overview
Data Broadcasting allows data to be transmitted in asimilar way to the way in
which video and audio services are delivered to end users. Object and Data
Carousels are intended for the periodic transmission of information in a transport
stream. DVB Data Carousels contain modules of data of unspecified content.
ARIB Data Carousels and Object Carousels contain identifiable data objects, for
example, JPEG files, text files, and application software. Multimedia Home
Platform (MHP) is also supported because the Application Information Table
(AIT) and Object Carousels (as specified in the MHP standard) can be viewed.
The diagram below shows how information carried by data and object carousels
is subdivided and ultimately carried by the transport stream.
Carousel Analyzer - Getting Started
Object Carousel:
BIOP Messages
Download Data
Carousel:
Modules and
Blocks
DSM−CC Sections
Transport Packets
BIOP 1 BIOP 2 BIOP 3 BIOP 4
Module 1
Block 1 Block 2 Block 3 Block 4 Block 5
Section 1 Section 2 Section 3 Section 4 Section 5
Headers are
shown shaded.
BIOP messages contain a message header, a message sub-header and the
message body which contains data. The message body may contain complete
data objects.
BIOP messages are broadcast in Modules. A Module is formed from one or more
concatenated, complete BIOP messages.
Each Module is fragmented into one or more Download Data Blocks which are
in turn transmitted in corresponding DSM-CC Sections.
Sections are transmitted in packets in the Transport Stream.
The Carousel Analyzer enables each layer of the protocol stack to be analyzed
and inspected. The following sections provide an overview of how the Carousel
Analyzer can be used to locate messages and packets of interest.
Version 00e
MTS400 Series Carousel Applications User Manual
1−3

Carousel Analyzer - Getting Started
Starting the Program
The program can be started by selecting Start > Programs > Tektronix
MTS400 > Analyzers > Carousel Analyzer or by double clicking on the
Carousel Analyzer shortcut on the desktop.
Menu bar
Toolbars
Workspace
Transport
packet bar
Status bar
Initial Appearance
When the program has started and is ready for use, it will open the Main
window, as shown in Figure 1−1:
Figure 1−1: Main window - Intial appearance
Elements of the main window can be hidden during a session, but will be
restored at start-up.
The Menu Bar contains all options available to the application; disabled options
are visible but grayed out. The Toolbars provide shortcuts to the more important
menu options; similarly, disabled buttons are visible but grayed out. The
Transport Packet Bar provides controls to locate and jump to transport packets.
The Status Bar shows stream information and the cursor message field.
1−4
DTV standard
Version 00e
MTS400 Series Carousel Applications User Manual

Carousel Analyzer - Getting Started
Initial Menu Options
The Carousel Analyzer presents different menus and options depending upon
whether or not a stream is open for analysis. The menu options available when
no stream is open are as follows:
File Menu Options. Table 1−1 lists the options in the initial File menu.
Table 1−1: File menu options
Option Function
Open... Opens an MPEG transport stream for analysis. The program
opens the file selection dialogue allowing the user to choose
the required file.
Print Setup... Opens a dialog for selecting which printer and associated
options to use.
1 <<filename>>
2 <<filename>>
3 <<filename>>
4 <<filename>>
Exit Finishes running the program.
A list of the four most recently analyzed files. If the program
has recently been installed, the list may be empty or hold less
than four files.
Selecting a filename opens that file for analysis.
Stream Interpretation
View Menu Options. Table 1−2 lists the options in the initial View menu.
Table 1−2: View menu options
Option Function
Toolbars > Submenu shows or hides the toolbar.
Transport Packet Bar Shows or hides the Transport Packet Bar.
Status Bar Shows or hides the status bar.
Analysis Menu Options. Table 1−3 lists the options in the initial Analysis menu.
Table 1−3: Analysis menu options
Option Function
Set Interpretation > Select the Digital TV standard to be used for stream analysis.
Settings... Displays a dialog for selecting scripts to be used during
analysis.
The DTV standard to be used for analysis must be selected before any streams
are opened.
Version 00e
MTS400 Series Carousel Applications User Manual
1−5

Carousel Analyzer - Getting Started
Select the required standard from the submenu.
Script Selection And
Manipulation
Scripts are available to the Carousel Analyzer to enable structures to be analyzed
successfully.
If any script is not selected or enabled, the stream will not fail to be analyzed,
but any data normally interpreted by that script would be ignored.
Scripts can only be selected and enabled when no files are open. The option is
not available when a file is open.
Handling Script Files. To open the Analysis Settings dialog box, select Settings
from the Analysis menu.
1−6
Version 00e
MTS400 Series Carousel Applications User Manual

The dialog box shown below is displayed:
Carousel Analyzer - Getting Started
In the Analysis Settings dialog, the left window shows a tree structure of the test
protocols available. The right window shows the scripts currently allocated to the
test protocol; in the example, the listed scripts are associated with the DVB Section protocol. The right window also contains the controls needed to
manipulate the scripts.
Note that across the standards, the scripts are not hierarchical; that is, each DTV
standard must be self-contained in terms of the scripts that it uses.
The currently available script files are listed in the Reference section
(page 1−97).
The following paragraphs describe the available script manipulation activities.
The activities are applied to the currently selected test protocol.
Version 00e
MTS400 Series Carousel Applications User Manual
1−7

Carousel Analyzer - Getting Started
Adding a Script file.
1. With the required test protocol highlighted, select the Add New Script button
2. If the script path/name is known, enter it into the blank field.
(Shortcut key: Insert).
If the script name is unknown, use the browse button at the right side of the
blank field to display a standard Windows file Open dialog box.
3. The new script file name will be added at the bottom of the script list. Note
that script files are parsed in the order that they are listed, because the file
may require moving up in the list – see Moving Script files in the List below.
Removing a Script File.
1. Highlight the file to be deleted and select the Delete Script button (Shortcut
key: Delete).
1−8
Version 00e
MTS400 Series Carousel Applications User Manual

Carousel Analyzer - Getting Started
Moving Script Files in the List Script files are parsed in the order that they are
listed; the file may require moving up in the list
1. Highlight the file to be moved and select either the Move Up or Move Down
button (Shortcut keys:
or down one place for each press of the button.
Alt-Y and Alt-B respectively). The file will move up
Syntax Checking Options
A number of options are available from the Analysis Settings dialog that allow
strict syntax checking to be enabled and disabled.
If any option is not enabled, the relevant syntax will not fail to be checked, but
will be interpreted more loosely.
Syntax Checking Options can only be selected and enabled when no files are
open. The option is not available when a file is open.
Currently, three syntax checking options are available:
Strict private data length/Message length checking. Object: U-U Object Carousel
Disabling this option allows the privateDataLength field where it exists in the
DSI to be set to zero. The application will calculate it when required, using the
total message length and the position of the private data in the message.
(See reference [2], sections 2 and 7.3.6.)
Strict association tag checking. Object: U-U Object Carousel
The association tag field in the stream_identifier_descriptor is an 8-bit value,
while the same field in an object carousel is a 16-bit value. When comparing
these two values, the MSB of the 16-bit value should be zero. Disabling this
option allows it to take other values.
(See reference [4], 9.3 paragraph 3 and [6], paragraph 4.7.7.3.)
Version 00e
MTS400 Series Carousel Applications User Manual
1−9

Carousel Analyzer - Getting Started
Strict CRC/Checksum checking. Object: DSM-CC Section
section_syntax_indicator and private_indicator fields should be the complement
of each other to determine whether a CRC or checksum is in use. Disabling this
option allows them to be the same and allows the application to work out which
method should be applied.
(See reference [2], section 9.2.2 paragraphs 3 and 4.)
Enabling a Syntax Checking Option. To open the Analysis Settings dialog box
select Settings... from the Analysis menu.
Select the Options tab. The dialog shown below is displayed:
In the Analysis Settings dialog box, the left window shows a tree structure of the
test protocols available. The right window shows the options currently allocated
to the test protocol; note that currently, options are only applicable to DSM-CC
Sections and U-U Object Carousels. Available options are applicable to all
standards, for example, an option set in the DVB DSM-CC Section will be
applied in the MPEG and ARIB protocols.
1−10
Version 00e
MTS400 Series Carousel Applications User Manual

Carousel Analyzer - Getting Started
Opening a Stream File
Any Transport Stream file can be opened for browsing by the Carousel Analyzer.
However, only those streams containing Data and/or Carousel Objects will
provide meaningful results. Tektronix Transport Stream Compliance Analyzer
should be used for normal stream analysis. Only one file can be opened at a time.
To open a file, select File > Open. If the required file is in the list of recently
analyzed files, then it can be opened from the list to save using the open file
dialog box.
Alternatively, use the Ctrl+O keyboard shortcut.
There is a shortcut button available on the Toolbar for opening a file, which uses
the standard file open symbol:
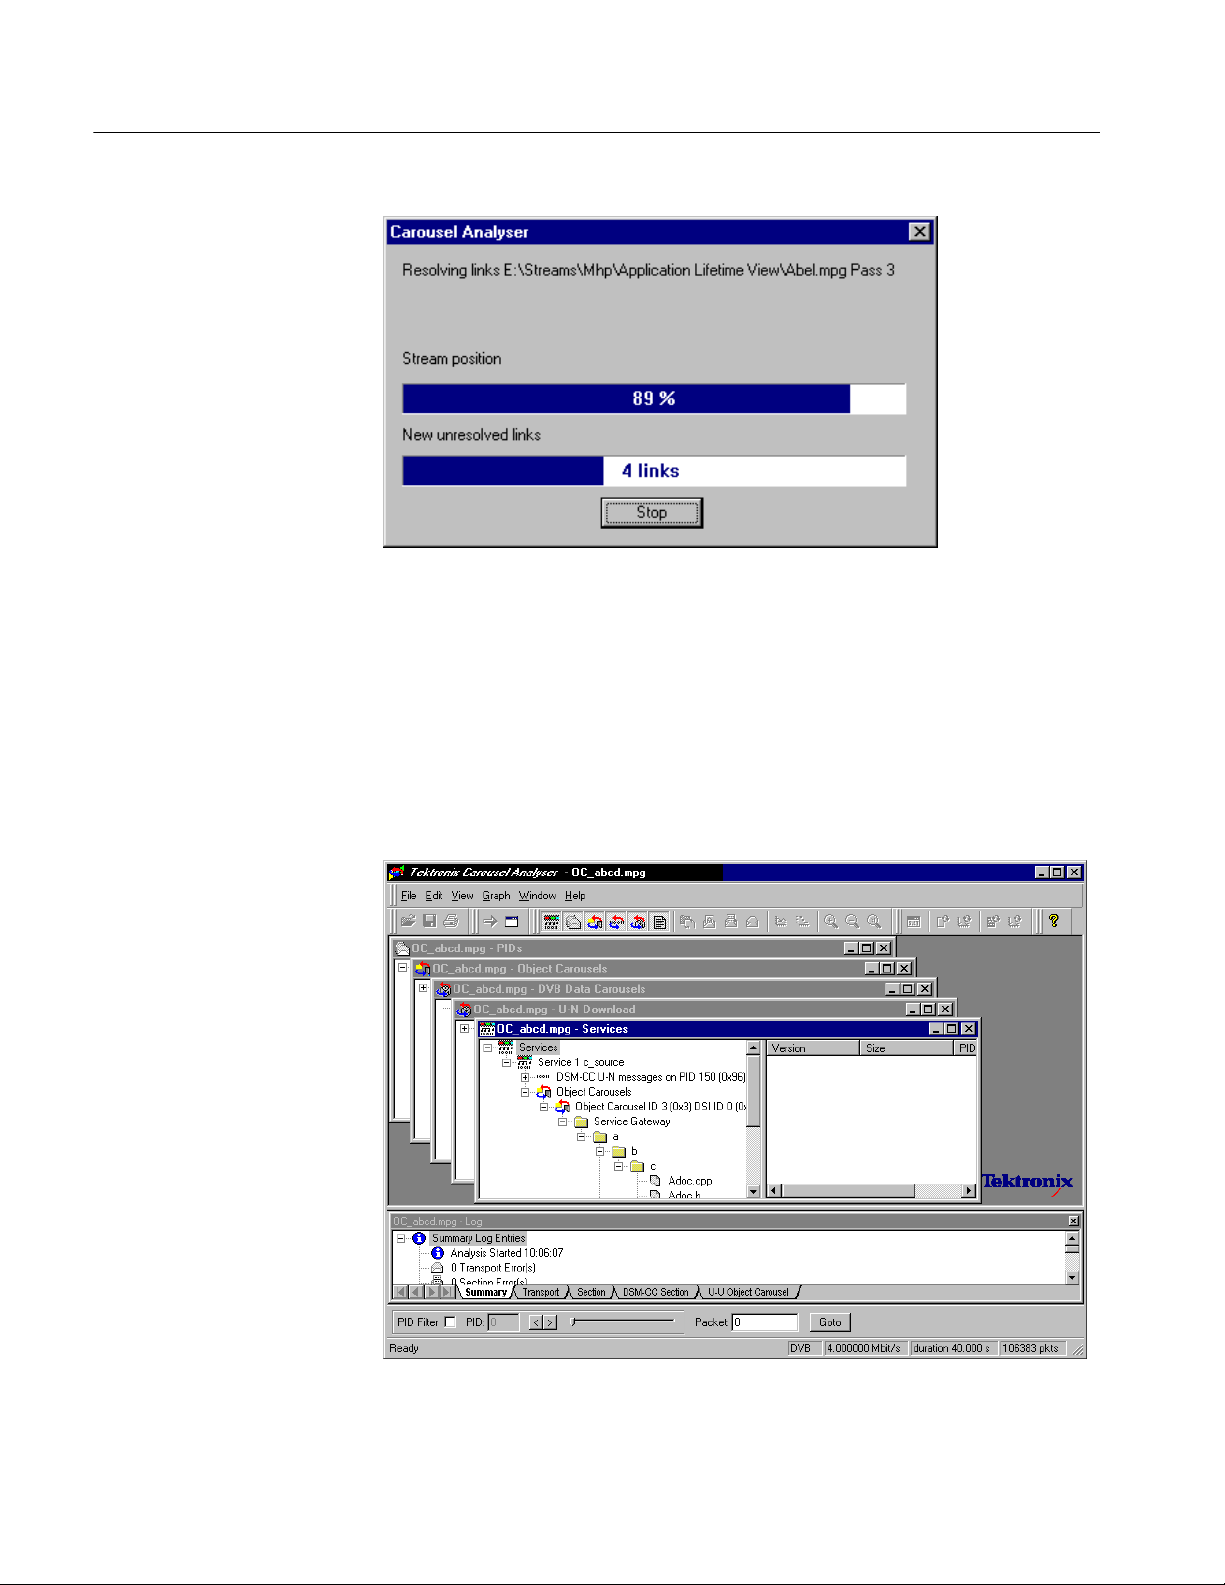
As the file opens, a progress bar is displayed; analysis may require more than
one pass through the transport stream file. The current pass number is shown in
the title line. After the first pass, a second progress bar (new resolved links)
shows the number of unresolved links at each pass.
Version 00e
MTS400 Series Carousel Applications User Manual
1−11
Carousel Analyzer - Getting Started
Analysis can be halted at any time by selecting the Stop button in the dialog
box; the stream is still opened, but only the elements that have been analyzed so
far will be displayed.
By default, the Services window and the Log window open as soon as a stream
file opens. Further windows can be opened by using the View Menu or the
Toolbar. Note that although the options on the View menu remain the same, they
are enabled or disabled according to which protocol element is highlighted at the
time.
1−12
Version 00e
MTS400 Series Carousel Applications User Manual

Menus and Controls
The following pages contain descriptions of the menu options, toolbar controls,
status bars, and methods for managing the workspace.
Menu Options
The following pages describe all of the menu options. Since many of the options
are context sensitive, they will be available only when their function is appropriate for the selected window or display element. When a menu option is not
available, the option is grayed out.
File Menu Options. Table 1−4 shows the options available in the File menu.
Table 1−4: File menu options
Command Function
Open... Open an MPEG transport stream for analysis. The program
opens the file selection dialogue box allowing the user to
choose the required file.
Close Closes the current file.
Save As... Saves the file to a new file name.
Print Opens the Print dialog.
Print Preview Opens the Print Preview dialog.
Print Setup... Opens the Print Setup dialog.
Exit Closes any file that is open and terminates execution of the
program.
Edit Menu Options. Table 1−5 shows the options available in the Edit menu.
Table 1−5: Edit menu options
Command Function
Applications Opens the Application Management dialog.
Go To Next Jumps to next occurrence of the structure being viewed. The
Packet field in the Transport Packet bar will reflect the change
of packet.
Version 00e
MTS400 Series Carousel Applications User Manual
1−13

Carousel Analyzer - Menus and Controls
View Menu Options. Table 1−6 shows the options available in the View menu.
NOTE. An active (depressed) button next to an option indicates that the window
or toolbar is currently visible; an inactive button means that it is hidden.
Table 1−6: View menu options
Command Function
Toolbars > Submenu shows or hides the toolbar.
Transport Packet Bar Shows or hides the Transport Packet Bar.
Status Bar Shows or hides the Status Bar.
The remaining options in this menu open and close the associated window. The
options and windows are described elsewhere in this section.
H Program/Services, U-N Download, Object Carousels, Data Carousels, PIDs
and Log.
H BIOP Message, U-N Message, Section, Transport Packet, Transport Packet
List, Hex Dump, Timing, Carrier and Resources.
H Repitition and Bitrate.
1−14
Version 00e
MTS400 Series Carousel Applications User Manual
Carousel Analyzer - Menus and Controls
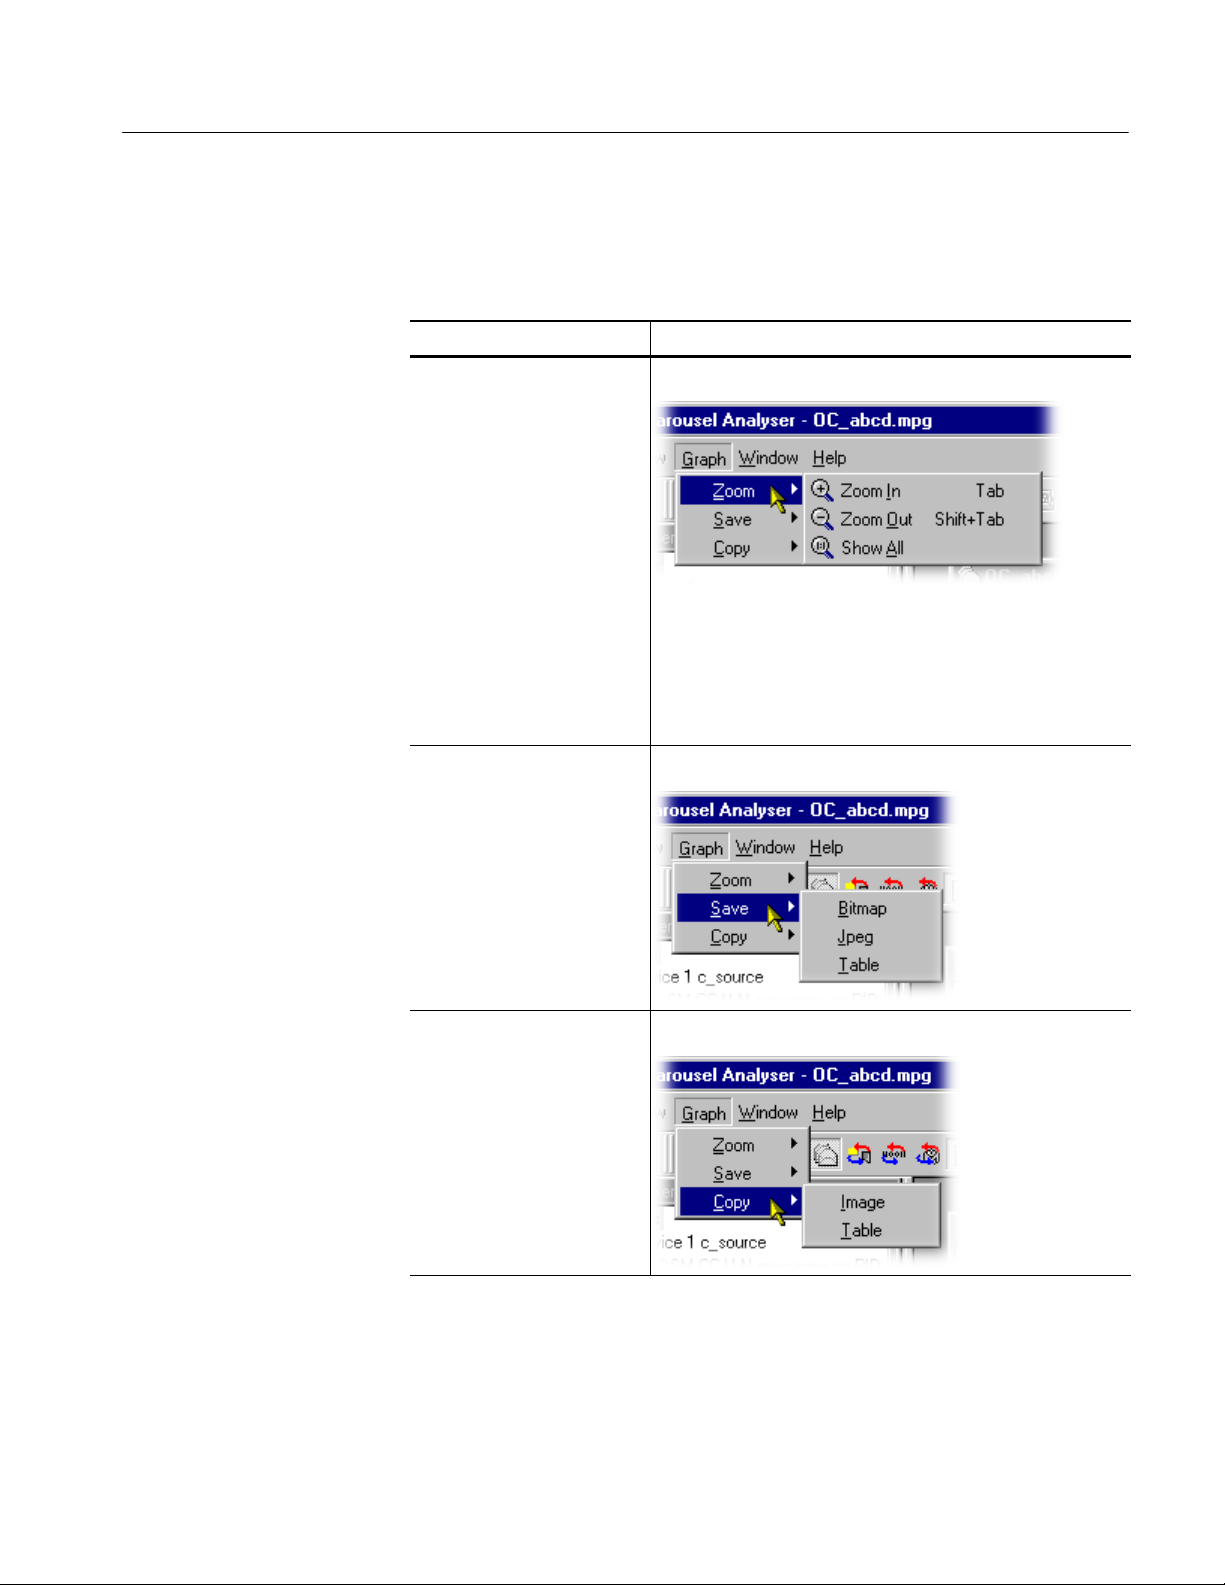
Graph Menu Options. Table 1−7 shows the options available in the Graph menu.
Table 1−7: Graph menu options
Command Function
Zoom Applies to Bitrate and Repetition views only.
Zoom In: Maximizes the central 50% (x-axis) of the current
graph.
Zoom Out: Takes one step back in the Zoom sequence.
Show All: Resets the graph to show all points.
Save Saves the graph in the selected format.
Copy Copies the graph to the clipboard in the selected format.
Version 00e
MTS400 Series Carousel Applications User Manual
1−15
Carousel Analyzer - Menus and Controls
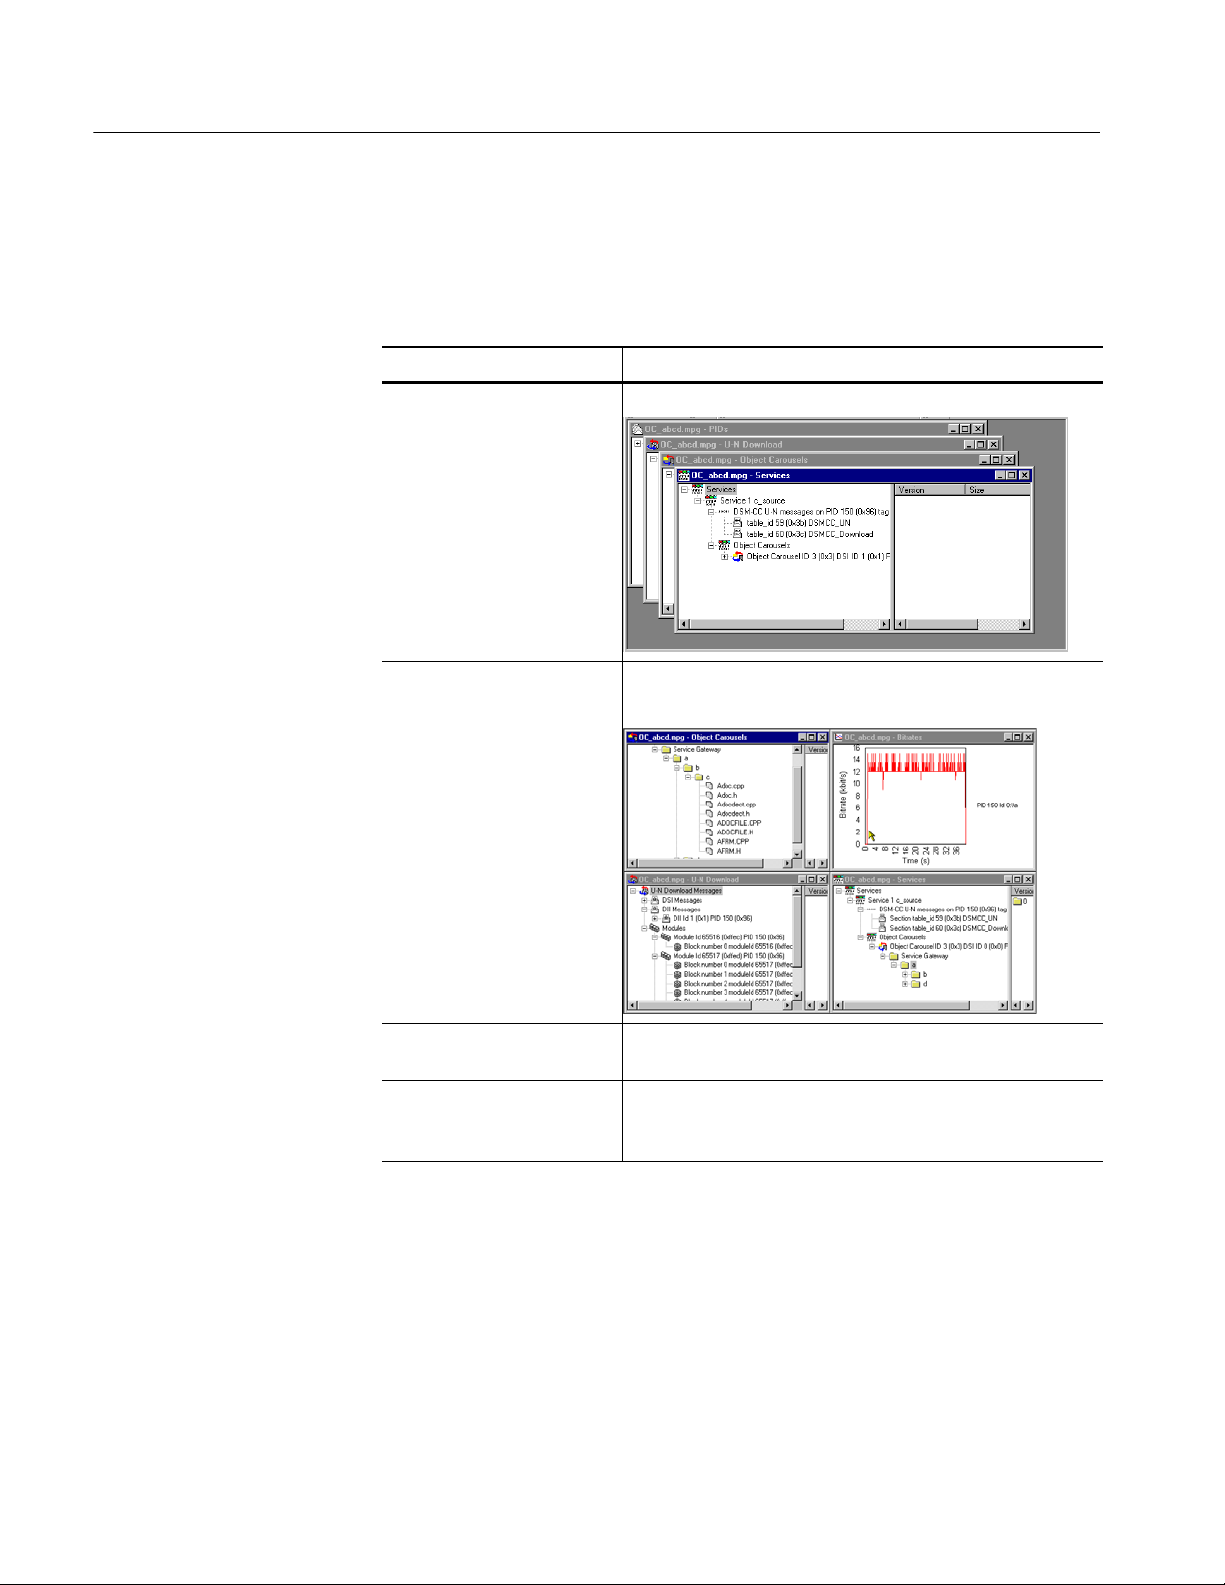
Window Menu Options. Table 1−8 shows the options available in the Window
menu.
Table 1−8: Window menu options
Command Function
Cascade Rearranges the windows like this:
Tile Tiles the windows. For example, four windows would be tiled
like this:
1−16
Arrange Icons Aligns icons of any minimized windows at the bottom of the
program’s main window.
1 <<window title>>
2 <<window title>>
3...etc
Makes the named window active, putting it on top of any
windows that had been hiding all or part of it.
Version 00e
MTS400 Series Carousel Applications User Manual

Toolbars
Carousel Analyzer - Menus and Controls
Help Menu Options. Table 1−9 shows the options available in the Help menu.
Table 1−9: Help menu options
Command Function
Quick Help Opens the Quick Help browser window.
About Carousel Analyzer Opens a message box that displays the program version
number and license number. This information will be required if
Tektronix Technical Support is contacted.
Quick access buttons are divided between several toolbars: File, Edit, View and
Help.
A number of the toolbar functions are context-sensitive; which window is open
and which element is highlighted will dictate which buttons are enabled and
disabled.
File Toolbar
Edit Toolbar
Open a file. This button is disabled when a file is open.
Save As… - BIOP file messages can be saved to separate files.
Structures can also be saved to a separate file.
Print – only available for bit rate and repetition views.
Jumps to next occurrence of the structure being viewed.
Version 00e
MTS400 Series Carousel Applications User Manual
1−17

Carousel Analyzer - Menus and Controls
View Toolbar
Timing Toolbar
The buttons in this toolbar open and close the associated windows. The windows
are described elsewhere in this manual.
View Programs/Services View Section
View PIDs View Transport Packet
View Object Carousels View Bitrate
View Data Carousels View Repetition Rate
View U-N Download Messages
View Log Zoom In
View BIOP Message Zoom Out
View U-N Message Show All
View Lifetime
Help Toolbar
Edit Application Timing View Carousel Cycle Time
View Entity Cycle Time View Carousel Cycle Time
Graph
View Entity Cycle Time
Graph
About Carousel Analyzer: Opens a dialog box which displays the
program version number and license number. This information will be
required if a Tektronix Technical Support is contacted.
1−18
Version 00e
MTS400 Series Carousel Applications User Manual

Transport Packet Bar
Carousel Analyzer - Menus and Controls
The Transport Packet bar provides a quick method of locating and navigating to
transport packets PIDs.
Packet: To locate a particular Transport Packet, enter the Trans-
port Packet number and select Goto.
PID Filter enable: The PID navigation feature can be enabled by selecting
the checkbox (as shown).
To navigate to a specific packet: with the PID Filter disabled, enter the packet
number and select either the Previous or Next Packet button. If a PID structure
view is now requested from a View, the search for the PID will commence with
the transport packet number displayed.
Similarly, with the PID Filter enabled, each press of either the Previous/Next
button will display the previous/next transport packet containing the PID number
displayed in the PID Number field. If a PID structure view is now requested
from a View, the search for the PID will commence with the transport packet
number displayed.
NOTE. When a Transport Packet is viewed, the number in the Packet field will
increment by one.
The Transport Packet bar can be hidden from view by using the View menu
Toolbars option.
Version 00e
MTS400 Series Carousel Applications User Manual
1−19

Carousel Analyzer - Menus and Controls
Status Bar
The Status bar provides information about the stream that is currently being
displayed. A message field gives a description of the button, menu or option that
the cursor is resting on; other non-critical messages may also be shown.
Message field
DTV analysis
standard
Stream
bit rate
Transport
packet total
Stream
length
1−20
Version 00e
MTS400 Series Carousel Applications User Manual

Workspace
Carousel Analyzer - Menus and Controls
Window Management
In addition to the generic Cascade and Tile options available from the window
menu, management of individual windows is provided through a submenu
available by right-clicking the title bar of the individual window.
Right-click window title bar:
Each window within the workspace can be designated as Docked, Floating, or as
an MDI Child.
Docked. When docked, a window will be automatically placed against one of the
four sides of the workspace.
For example, selecting Docked > Top will dock the selected window at the top
of the workspace.
Version 00e
MTS400 Series Carousel Applications User Manual
1−21

Carousel Analyzer - Menus and Controls
Floating. Designating a window as floating allows it to be moved around on the
monitor desktop independently of the Carousel Analyzer interface.
For example, selecting Floating will allow the window to be moved anywhere on
the desktop:
MDI Child. Designating a window as an MDI Child allows it to be moved
anywhere within the workspace.
The MDI Child submenu allows the window to be designated as Restored,
Minimized or Maximized.
1−22
NOTE. When a window is “docked” it can be dragged (and dropped) around the
workspace; when it is at an edge it will adopt a docked position. MDI Children
do not attempt to dock with the edges of the workspace.
Version 00e
MTS400 Series Carousel Applications User Manual

Carousel Analyzer - Menus and Controls
Version/Size Pane Display
Most of the views described later use a split-pane arrangement to display the
view data and related version, file size and PID information. The information is
displayed in the right pane. However, the default arrangement when opening the
view is that the right pane is closed. To open the pane, pass the cursor over the
right edge of the view until it changes to the split pane cursor, then move the
dividing bar to the desired position.
Content Management
The principles employed in displaying the information in each workspace
window are applicable to all windows, although the content will vary from
window to window.
Tree Structure. Structures are represented by tree diagrams, with the “root node”
or highest level component at the top. Components that contain more information underneath them in the structure are indicated by a + box. Clicking on the +
box will display the structure underneath the node. Similarly, if a - box is
adjacent to the node, the level of detail immediately below it is already displayed; this detail can be hidden by clicking on the - box. Components that are
connected to a branch of the tree without a square box are leaf nodes; they
display the lowest and finest level of detail.
Right-clicking on a tree node may open a context sensitive menu.
Component Selection. Components can be selected (or highlighted) either singly
or in groups. When selected, the views available from the View menu (or a
right-click menu) will be those that can be applied to all of the selected
components.
Version 00e
MTS400 Series Carousel Applications User Manual
1−23

Carousel Analyzer - Menus and Controls
Single component selection
Selected by clicking on a component.
Range selection
Selected by highlighting the first
component in the required selection
and, while holding the Shift key on
the keyboard, clicking on the last
component. The selected range will be
highlighted.
Multiple component selection
Selected by holding the Control key
(CTRL) on the keyboard and clicking
the required components.
1−24
Node selection
Selected by holding the Alt key on the
keyboard and clicking the required
node; all subcomponents will be
selected.
Version 00e
MTS400 Series Carousel Applications User Manual

Carousel Analyzer - Menus and Controls
Saving Components. Selected (or highlighted) components can be saved through
the right-click menu. However, the manner in which the components were
selected (see previous paragraphs) will affect the file structure of the saved
components.
If a Node Selection has been made, the directory structure is recreated at the
specified location and the subcomponents are saved to their equivalent directories.
If a Range or Multiple selection has been made, all files will be duplicated in the
root directory at the specified location in addition to recreating the directory
structure and saving the sub-components to their equivalent directories.
Hex Displays. Hex displays follow a common format.
The eight-digit number in the left column is the address of the first (that is, left)
byte in the row. The addresses themselves are shown in hexadecimal format.
The center column displays the contents of the structure in hex format.
The right column displays the contents of the structure in ASCII format.
Version 00e
MTS400 Series Carousel Applications User Manual
1−25

Carousel Analyzer - Menus and Controls
1−26
Version 00e
MTS400 Series Carousel Applications User Manual

Views
The Carousel Analyzer provides three types of view as a means of inspecting and
analyzing information carried in a transport stream.
Static Views:
(Programs/Services, Object Carousel, U-N Download, Data Carousel, PID, Log)
Static views display information derived from the transport stream when it is
opened.
Structure Views:
(Transport Packet, U-N Messages, Module, Section, BIOP Messages)
Structure views use Tektronix scripting technology to analyze structures that
appear in the transport stream, for example, tp, and BIOP messages. For repeated
structures, this view allows all occurrences to be visited.
Chart Views:
(Bitrate, Repetition Rate)
Chart views present timing information in graphical form about one or more
structure in the stream.
View Page View Page
Programs/Services View 1−30 Structure Views 1−52
Object Carousel View 1−34 Bitrate View 1−55
U-N-Download View 1−41 Repetition View 1−58
Data Carousel (DVB) View 1−45 PID View 1−61
Data Carousel (ARIB) View 1−46 Log View 1−64
Resource View 1−50 Cycle Times View 1−67
In the following sections, each view is described together with the information
accessible from that view.
Version 00e
MTS400 Series Carousel Applications User Manual
1−27

Carousel Analyzer - Views
The nodes displayed in the views relate to the protocol layers as shown in the
diagram below:
Table 1−10: Key to Tree Nodes
Service/Program Active PIDs/PIDs
Download Block BIOP Object Directory / ARIB
Directory
U-N Message BIOP Object / ARIB Resource
Download Module Table
Compressed Download Module Transport Packet
Data Carousel Audio Stream
Object Carousel Video Stream
Stream Object Data/Other Stream
Stream Event Object MHP Applications
Java Application HTML Application
1−28
Version 00e
MTS400 Series Carousel Applications User Manual

Carousel Analyzer - Views
Key to Node Overlays. Overlays are used to signify additional information about
nodes; the overlays may be used individually or in combination.
Absent Objects:
Objects referenced but not found, for example, directory object not found.
The path in which the absent object is recognized is also marked.
Unresolved Objects:
When an object is found during analysis, but its key is not referred to in the
Service Gateway, it is displayed under an Unresolved Objects node.
Boot Class Objects:
Boot class items are identified. The path in which the boot class resides is
also indicated.
Manual Signaling:
Indicates that a PID has been subjected to the manual signaling process;
used in the carousel and PID views only.
Version 00e
MTS400 Series Carousel Applications User Manual
1−29

Carousel Analyzer - Views
Programs/Services View
Menu Bar: View > Program/Services Toolbar:
The Programs/Services view gives a static, DVB/ARIB service (or MPEG
program) centric view of the transporst stream contents. Each program is listed
together with the service name (for DVB/ARIB). Expanding a program item will
reveal its elemental PIDs and any object (or data) carousels associated with it.
1−30
Figure 1−2: DVB programs/services view (typical)
Version 00e
MTS400 Series Carousel Applications User Manual

Carousel Analyzer - Views
Figure 1−3: ARIB programs/services view (typical)
The diagram below indicates the primary nodes that are accessible from the
Program/Services view.
Service/Program node
Elementary
PID node
See
Table node
Object/Data
Carousel View
Version 00e
MTS400 Series Carousel Applications User Manual
1−31

Carousel Analyzer - Views
Service/Program Node
Elementary PID Node
This node represents a specific program or service (DVB or ARIB) in a
transport stream. If a name for the program is available in the SDT (Service
Description Table), it is displayed. Each Elementary PID listed in the PMT
(Program Map Table) will have a corresponding node displayed as a child node
of the Services/Program node. Similarly, any Object or Data Carousels associated with the Services/Program node are listed as child nodes.
Right-Click Menu Options.
View PMT Opens the Section Table view for the PMT.
View Bitrate Activates or creates a bit rate view of the sum of the ele-
mentary streams that are listed in the PMT for this program.
This node represents a PID referenced by a program. If the PID
carries Sections, these are represented as Table nodes.
Right-Click Menu Options.
View Transport Packet
Displays a structure view of the next transport packet
encountered on this PID from the current stream position (as indicated by the Transport Packet number that is
displayed in the Transport Packet Bar).
1−32
View Cycle Time " Allows either cycle time statistics or graphical view to
be selected.
View Repetition Activates or creates a view of the repetition rate of this
PID in the transport stream.
View Bitrate Activates or creates a bit rate view of this PID.
Version 00e
MTS400 Series Carousel Applications User Manual

Carousel Analyzer - Views
Table Node
This node represents the stream of sections present on a specific PID with a
specific table identity.
Right-Click Menu Options.
View Section Displays a structure view of the next section with this
PID and table identity that can be formed from the current stream position onwards (as indicated by the Transport Packet number displayed in the Transport Packet
Bar).
View Cycle Time " Allows either cycle time statistics or graphical view to
be selected.
View Repetition Activates or creates a view of the repetition rate of this
PID with this PID and table identity.
View Bitrate Activates or creates a bit rate view of sections with this
PID and table identity.
Version 00e
MTS400 Series Carousel Applications User Manual
1−33
Carousel Analyzer - Views
Object Carousel View
Menu Bar: View > Object Carousels Toolbar:
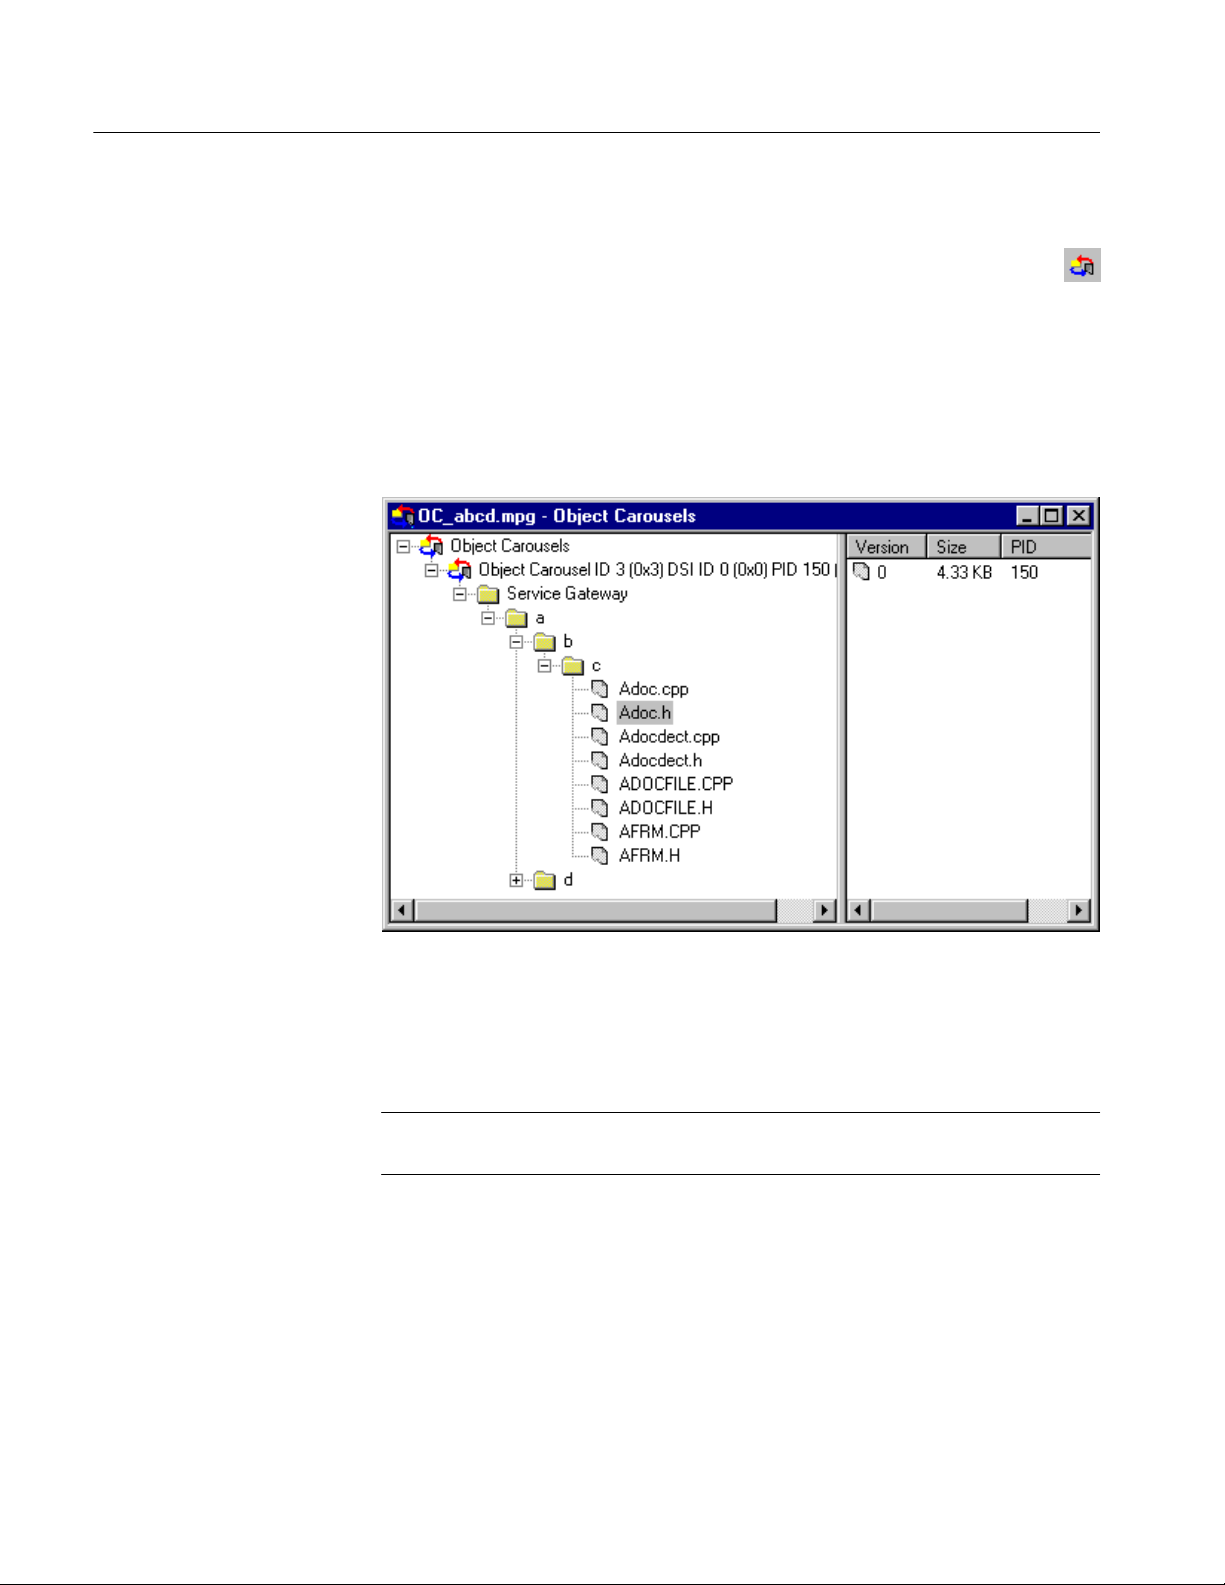
The Object Carousel view shows a static view of every object carousel in the
transport stream.
The view is in the style of Windows Explorer. The left pane shows the directory
structure of the object carousels, and the right pane lists the versions of the BIOP
message currently selected in the left pane.
1−34
Double-clicking a file BIOP message can bring up an appropriate viewer
application if the operating system can find one (file associations can be set
through the Windows Explorer Options). File BIOP messages can also be saved
to disk by selecting File > Save As....
NOTE. The version number of the BIOP messages represents the version number
of the module that carries the BIOP message.
Version 00e
MTS400 Series Carousel Applications User Manual

Carousel Analyzer - Views
The following diagram indicates the nodes accessible from the Object Carousels
view:
Object Carousel node
BIOP Message node
Object Carousel node
BIOP Message node
This node indicates that an object carousel has been signaled in the PSI/SI.
Right-Click Menu Options.
View Application Timing
Opens the Application Management dialog.
View DSI Carrying Carousel IOR
Displays a structure view showing the U-N DSI message
that carries the service gateway IOR for this carousel.
This node represents a specific BIOP Message. If the node represents a
BIOP directory, the directory entries appear as child nodes.
Right-Click Menu Options.
Open View the message in its native format. This only works
for file messages that have an associated viewer application on the PC.
Save As
… Save the BIOP message to a separate file.
View BIOP Message Displays a structure view of the next appearance of this
BIOP message that can be formed from the current
stream position onwards (as indicated by the Transport
Packet number displayed in the Transport Packet Bar).
Version 00e
MTS400 Series Carousel Applications User Manual
1−35

Carousel Analyzer - Views
View Carrier Module Activates or creates the U-N download view and high-
lights the module that carries this BIOP message.
View Cycle Time " Allows either cycle time statistics or graphical view of
the carousel to be selected.
View Repetition Activates or creates a view of the repetition of this BIOP
message.
View Bitrate > This BIOP message: Activates or creates a view of
the bit rate of this BIOP message.
> Including nested messages: View the sum of the bit
rates for this BIOP message and all descendant messages
(that is, all children and their children). These options
are only available for BIOP directory messages.
NOTE. If a Service Gateway is viewed in the Bitrate, Repetition, or Structure
view, its name in these views reflects the DSI transaction ID and PID in which it
was carried.
1−36
Version 00e
MTS400 Series Carousel Applications User Manual
Carousel Analyzer - Views
MHP Applications
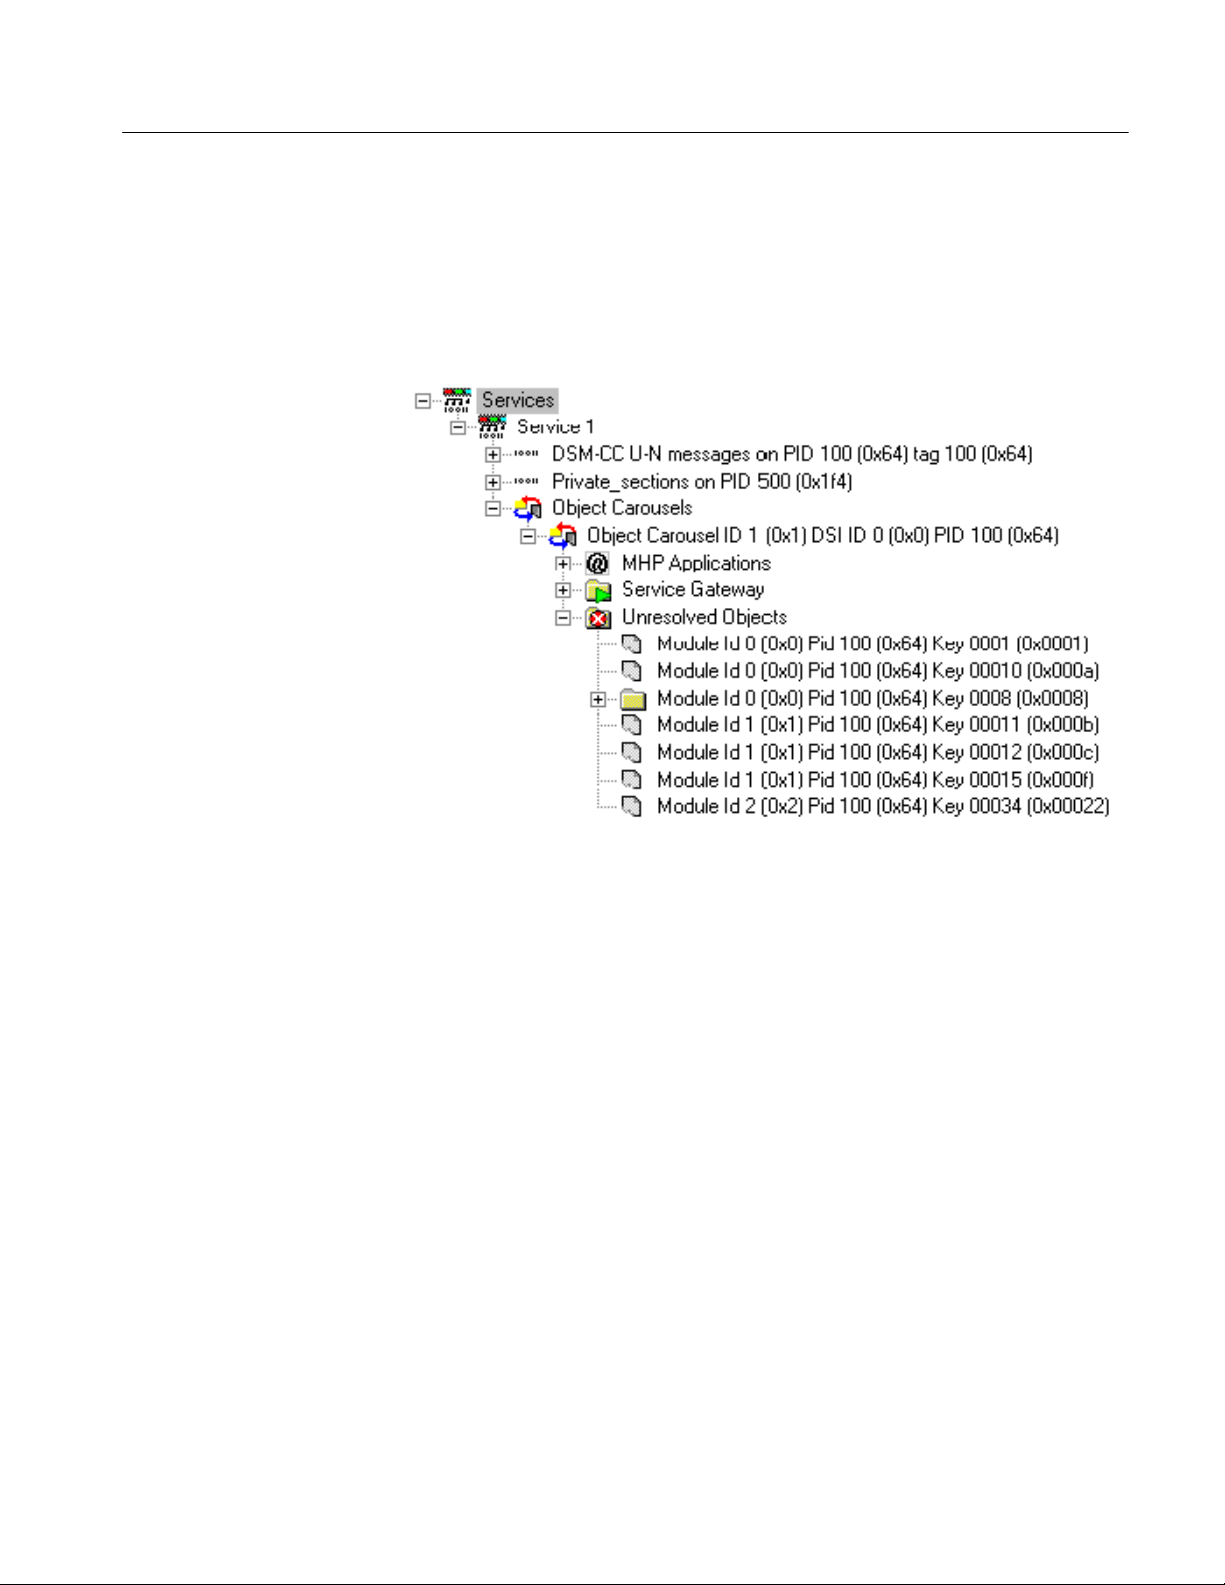
Unresolved Objects
(See MHP Support, page 1−91.)
When an object is found during analysis, but its key is not referred to in the
Service Gateway, it is displayed under an Unresolved Objects node.
However, when a directory object is found, the keys of its child nodes can be
resolved and its tree structure built correctly, even though the directory object
itself may still be unresolved.
Version 00e
MTS400 Series Carousel Applications User Manual
1−37

Carousel Analyzer - Views
Absent Objects
Objects referenced but not found are identified, for example, - directory
object not found. The path in which the absent object is recognized is also
marked (
).
1−38
Version 00e
MTS400 Series Carousel Applications User Manual
Carousel Analyzer - Views
Manual Signaling
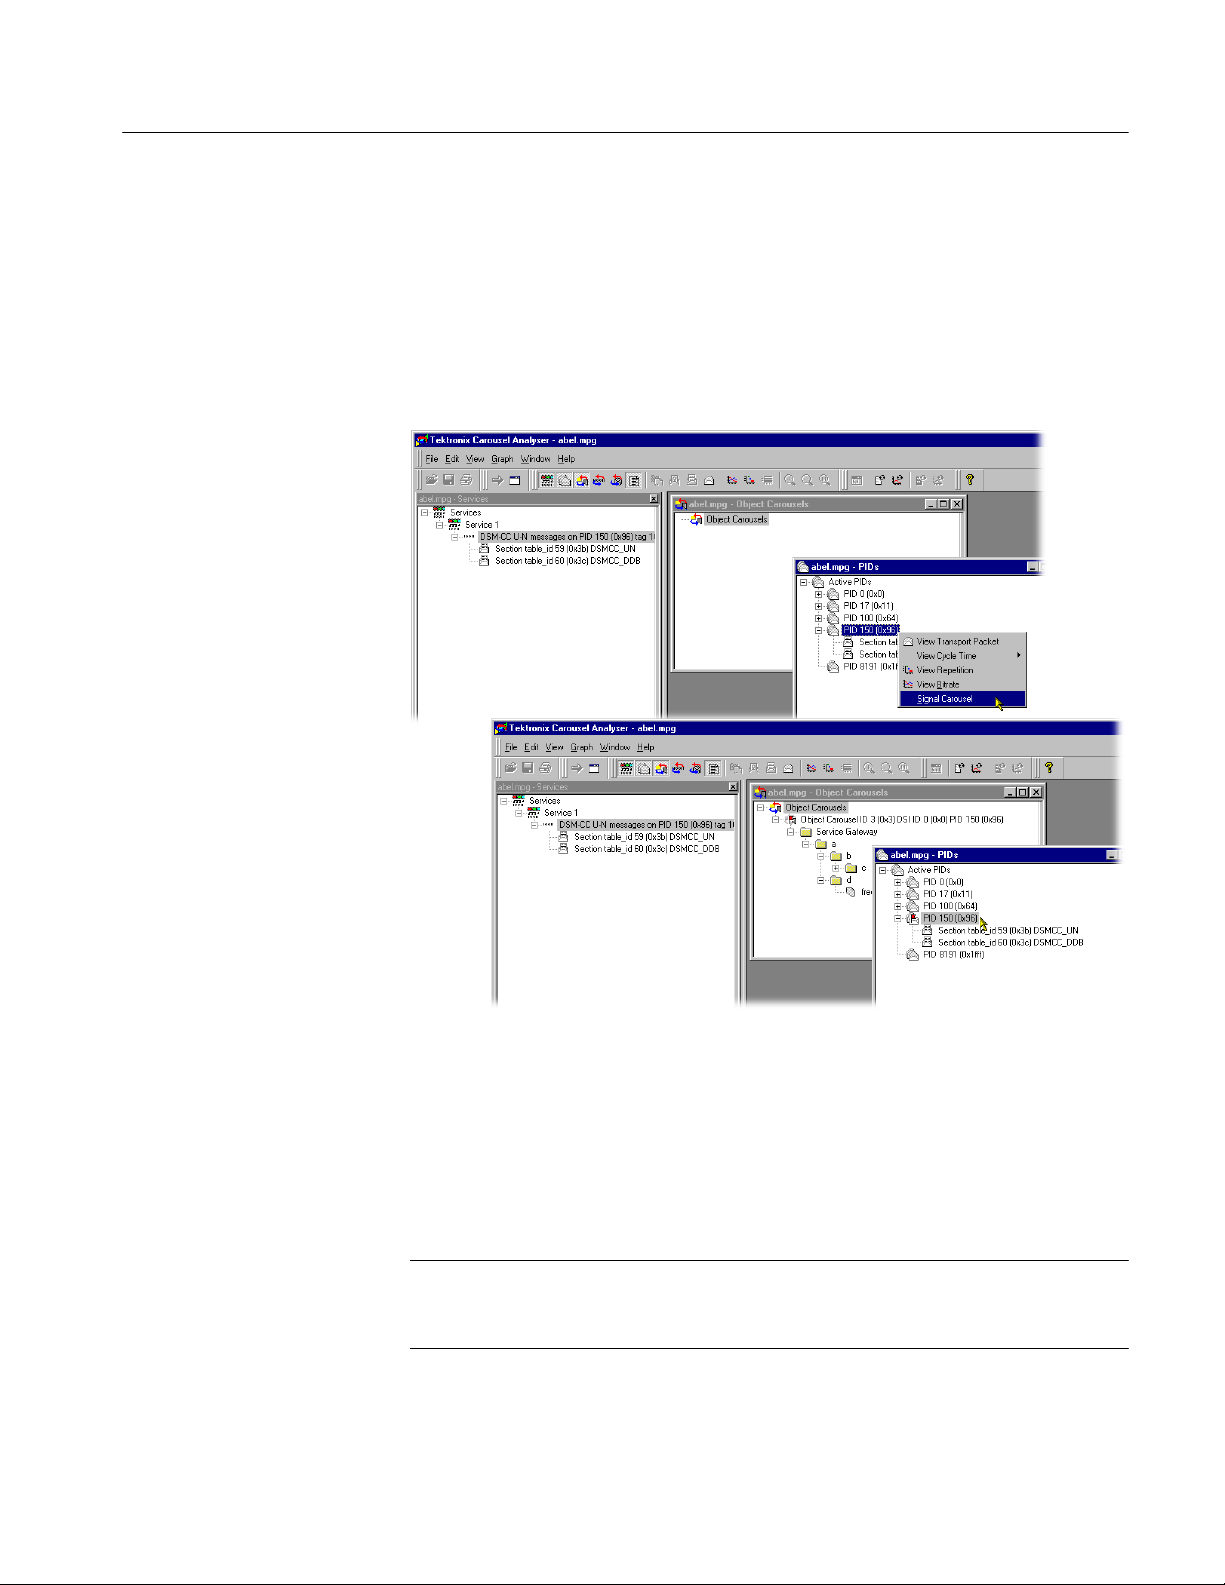
If a carousel is present in a stream, but has not been found during analysis, it can
be identified with Manual Signaling from the related PID node.
The Signal Carousel command can be found on the right-click menu associated
with each PID node. When this command is selected, the stream will be
reprocessed. During processing, only the DSM-CC tables on the selected PID
will be analyzed.
The user interface is updated when the stream has been processed. Any carousels
that have been identified are added to the Carousel view. The signal icon, used
inly in the carousel and PID views, indicates that the PID has been subjected to
the manual signaling process.
The PID view will display a list of the table types that were detected during
processing.
NOTE. Carousels that span multiple PIDs will be only partially analyzed.
The PID must contain a Service Gateway for any Object Carousel view to be
displayed.
The Log view is refreshed by describing the most recent action, for example,
Added Manually Signalled PID150.
Version 00e
MTS400 Series Carousel Applications User Manual
1−39

Carousel Analyzer - Views
Any feedback from the Manual Signaling will be displayed in the Summary log.
1−40
Version 00e
MTS400 Series Carousel Applications User Manual

U-N-Download View
Carousel Analyzer - Views
Menu Bar: View > U-N-Download Toolbar:
This static view shows all the U-N-download (DSM-CC data carousel scenario)
messages in the transport stream.
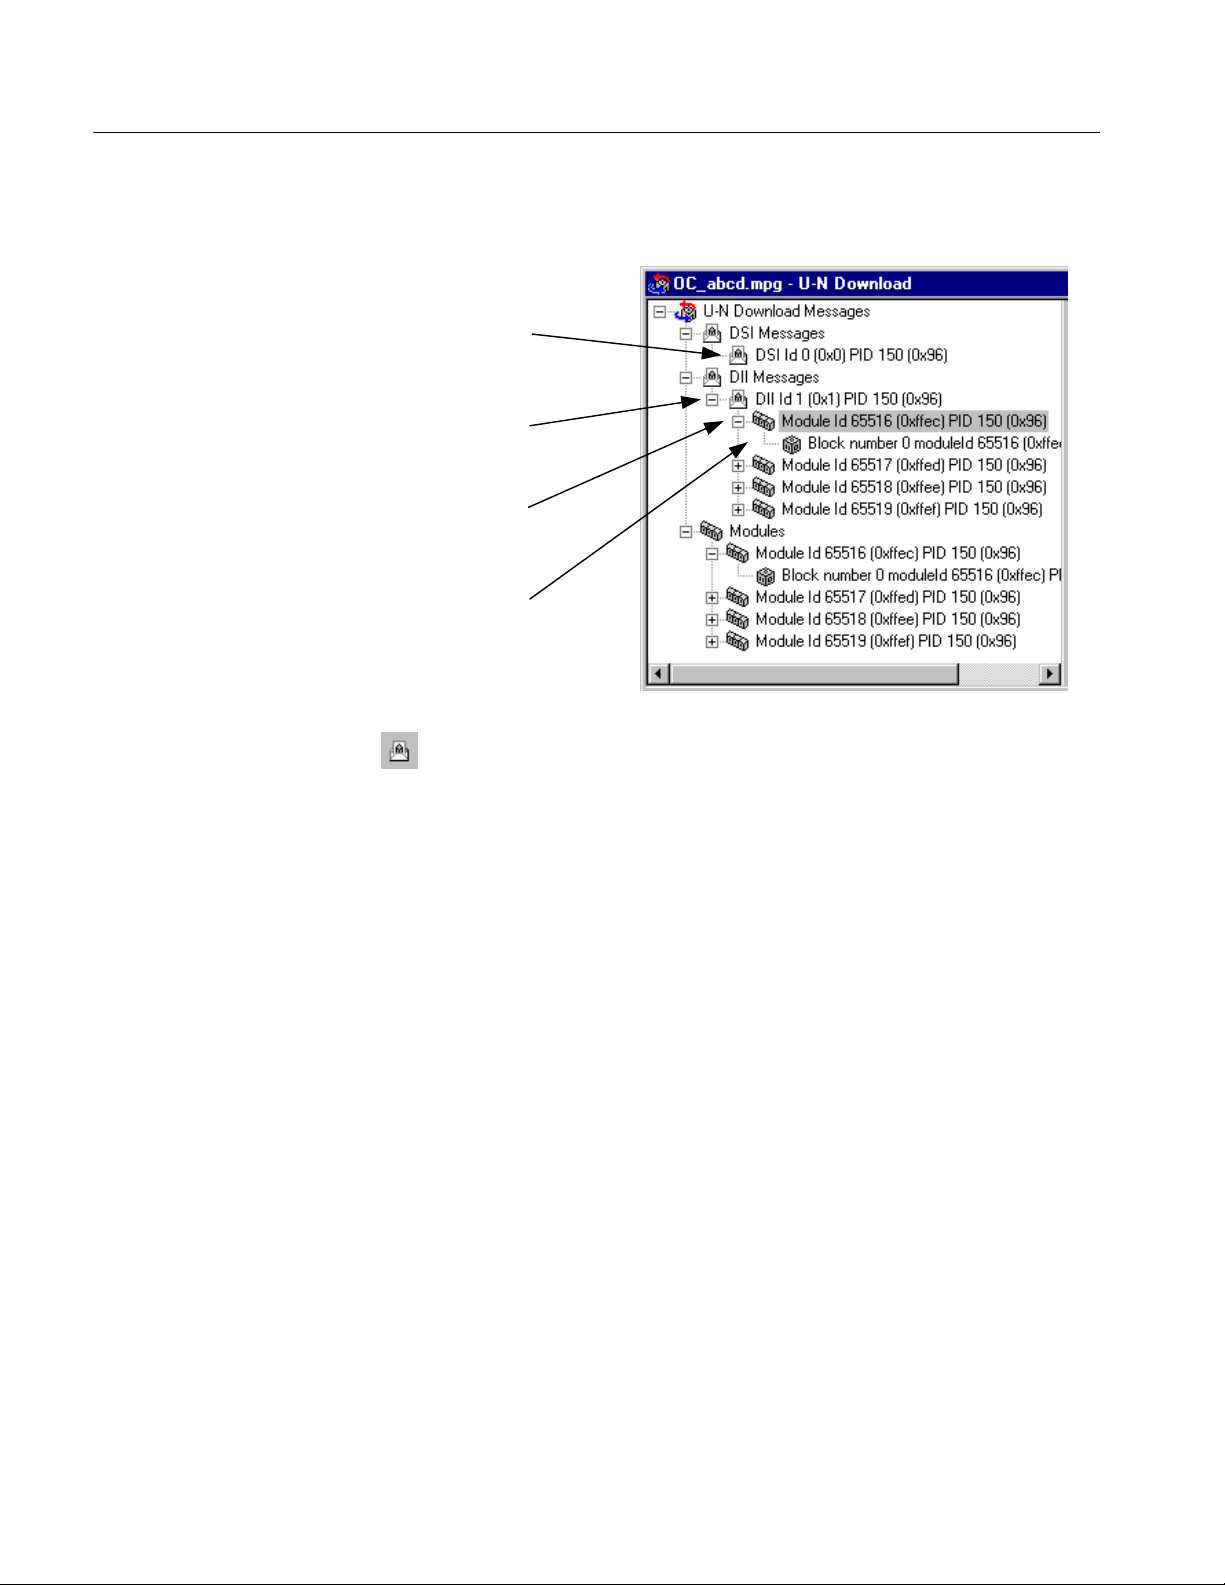
The view is in the style of Windows Explorer. The left pane contains a hierarchical pane on the left and a version pane on the right. The version pane will list the
versions of the U-N download message selected in the left pane.
DII items contain module items that the DII message references. All modules are
also listed under the “Modules” item.
Modules may be in compressed form; the version of the compressed icon is
displayed in the Version column of the right pane.
Modules are listed independently of DII messages in case the DII does not
reference the module correctly; for a compliant stream, each module is listed as a
child of the DII node and within the Modules node.
Version 00e
MTS400 Series Carousel Applications User Manual
1−41
Carousel Analyzer - Views
The following illustration indicates the nodes that are accessible from the U-N
Download view.
U−N Message
(DSI) node
U-N Message
(DII) node
Download
Module node
Download
Block node
U-N Message (DSI) Node
This node represents a Download Server Initiate message.
Right-Click Menu Options.
View U-N Message Displays a structure view of the next appearance of this
DSI message that can be formed from the current stream
position onwards (as indicated by the Transport Packet
number displayed in the Transport Packet Bar).
View Carrier Section Displays a structure view of the next appearance of the
section that carries this DSI message.
View Cycle Time > Allows either cycle time statistics or graphical view of
the object to be selected.
View Repetition Activates or creates a repetition view of the DSI mes-
sage.
View Bitrate Activates or creates a bit rate view of the DSI message.
1−42
Version 00e
MTS400 Series Carousel Applications User Manual

Carousel Analyzer - Views
U-N Message (DII) Node
Download Module Node
This node represents a Download Information Indication message. A DII
message may reference modules. If the module reference can be resolved, the DII
tree node will contain child Module nodes.
Right-Click Menu Options.
View U-N Message Displays a structure view of the next appearance of this
DII message that can be formed from the current stream
position onwards (as indicated by the Transport Packet
number displayed in the Transport Packet Bar).
View Carrier Section Displays a structure view of the next appearance of the
section that carries this DII message.
View Cycle Time > Allows either cycle time statistics or graphical view of
the object to be selected.
View Repetition Activates or creates a repetition view of the DII mes-
sage.
View Bitrate Activates or creates a bit rate view of the DII message.
This node represents a U-N Download Module. The download blocks
that constitute the module are listed as child nodes.
Right-Click Menu Options.
View Hex Dump Displays a data view of the next appearance of this mod-
ule that can be formed from the current stream position
onwards (as indicated by the Transport Packet number
displayed in the Transport Packet Bar).
View Cycle Time > Allows either cycle time statistics or graphical view of
the object to be selected.
View Repetition Activates or creates a repetition view of the module.
View Bitrate Activates or creates a bit rate view of the module.
Version 00e
MTS400 Series Carousel Applications User Manual
1−43

Carousel Analyzer - Views
Block Node
This node represents a U-N Download Data Block (DDB).
Right-Click Menu Options.
View U-N Message Displays a structure view of the next appearance of this
DDB message that can be formed from the current
stream position onwards (as indicated by the Transport
Packet number displayed in the Transport Packet Bar).
View Carrier Section Displays a structure view of the next appearance of the
section that carries this DDB message.
View Cycle Time > Allows either cycle time statistics or graphical view of
the object to be selected.
View Repetition Activates or creates a repetition view of the DDB mes-
sage.
View Bitrate Activates or creates a bit rate view of the DDB message.
1−44
Version 00e
MTS400 Series Carousel Applications User Manual

Data Carousel (DVB) View
Menu Bar: View > Data Carousel Toolbar:
This static view shows all the data carousels in the DVB transport stream. The
view is in the explorer style with a hierarchical view in the left pane and a
version view in the right.
Carousel Analyzer - Views
Version 00e
MTS400 Series Carousel Applications User Manual
1−45

Carousel Analyzer - Views
Data Carousel (ARIB) View
Menu Bar: View > Data Carousel Toolbar:
This static view shows all the data carousels in the ARIB transport stream. The
view is in the explorer style with a hierarchical view in the left pane and a
version view in the right.
The diagram below indicates the nodes that are accessible from the Data
Carousel (ARIB) view.
Carousel node
Download
Module node
Resource node
1−46
Version 00e
MTS400 Series Carousel Applications User Manual

Carousel Analyzer - Views
Carousel Node
Download Module Node
This node represents a single Data Carousel in the ARIB data carousel
structure.
Right-Click Menu Options.
View U-N Message Displays a structure view of the next appearance of this
DII message that can be formed from the current stream
position onwards (as indicated by the Transport Packet
number displayed in the Transport Packet Bar).
View Carrier Section Displays a structure view of the next appearance of the
section that carries this DII message.
View Cycle Time > Allows either cycle time statistics or graphical view of
the object to be selected.
View Repetition Activates or creates a repetition view of the DII mes-
sage.
View Bitrate Activates or creates a bit rate view of the DII message.
This node contains all of the resources available to a module.
Right-Click Menu Options.
View Resources Displays the Resource view of the selected module.
Save Resources Saves the resource files to a selected location. The head-
er information is not saved.
View Cycle Time > Allows either cycle time statistics or graphical view of
the object to be selected.
View Repetition Activates or creates a repetition view of the module.
View Bitrate Activates or creates a bit rate view of the module.
(See also ARIB Module Versions, page 1−49.)
Version 00e
MTS400 Series Carousel Applications User Manual
1−47

Carousel Analyzer - Views
Resource Node
Each Resource node is a leaf node containing one resource file.
Right-Click Menu Options.
Open Opens the resource in an associated application to allow
it to be viewed. If no association has been made with the
file type on the host computer, a message is displayed.
Save Saves the resource file to a selected location. The header
information is not saved.
View Displays the Resource view. The selected resource is
highlighted in the Resource view.
1−48
Version 00e
MTS400 Series Carousel Applications User Manual

Carousel Analyzer - Views
ARIB Module Versions
Note that there may be multiple versions of a single ARIB module. Each version
of the same module can potentially contain different resources. For example,
Version 1 may contain resources A, B, and C and Version 2 may contain
resources C, D, and E.
When viewing the resources in Data Carousel and Service/Program views, the
resources listed under the Module node will be all resources across all versions,
for example, A, B, C, D and E. When opening or saving any of these resources
from Data Carousel or Service/Program views, the operation will work on the
first version encountered in the stream (A, B, and C will come from Version 1
and D and E will come from Version 2). Basically, these two views contain a
summary of all the resources encountered in that module regardless of version.
The ARIB Resource view will show only the resources contained in an
individual module version - to view resources from different module versions,
the user must use the Go To Next command or open a different version in ARIB
Resource view.
Version 00e
MTS400 Series Carousel Applications User Manual
1−49

Carousel Analyzer - Views
Resource View
Resources
node
Resource
node
Data
Menu Bar: View > Resources
The ARIB Resources view displays a hierarchical and raw data interpretation of
the resource structure in Data Carousels. The raw data is presented in hexadecimal and ASCII form in the adjacent pane.
Resources Node
This Resources node displays a header and the resources associated with
one Module.
Right-Click Menu Options.
Go To Next Displays the next occurrence of the Resource node in the
transport stream (note the change of Packet number in
the Status bar).
Save Saves the resource files to a selected location. The head-
er information is not saved.
1−50
Version 00e
MTS400 Series Carousel Applications User Manual

Carousel Analyzer - Views
Resource Node
Data
Each Resource node displays header information and a resource.
Right-Click Menu Options.
Open Opens the resource in an associated application to allow
it to be viewed. If no association has been made with the
file type on the host computer, a message is displayed.
Save Saves the resource file to a selected location. The header
information is not saved.
Represents the currently selected tree node.
Right-Click Menu Options.
Save As… Saves the Module Resource data to a selected location.
Go To Next Displays the next occurrence of the Resource node in the
transport stream (Note the change of Packet number in
the Status bar).
View Transport Packet List
Displays the Transport Packet Contributions view
which lists the transport packets that have contributed to
the resources in the module (See Structure Views,
page 1−52).
Version 00e
MTS400 Series Carousel Applications User Manual
1−51

Carousel Analyzer - Views
Structure Views
Structure views display a hierarchical and raw data interpretation of a structure
(BIOP Message, U-N Message, Module, Section, or Transport Packet). The
hierarchical view is based on a script from the script files that are loaded (see
Script Selection and Manipulation, page 1−6). Raw data is presented in
hexadecimal and ASCII format in the lower pane.
Highlighting an element in the table window will automatically highlight the
section of the hexadecimal code that contains the selected information.
The view will bring up the first appearance of a particular message in the
transport stream reading from the current packet position. To view the next
appearance, select Edit > Go to Next. This will display the next repetition of the
message in the open structure view window; if necessary, it will wrap to the first
occurrence.
For example, in the screenshot below, the PAT first appears in transport packet 0.
Selecting Go to Next and viewing the section again will show the next repetition
of the PAT on transport packet 532 and so on.
1−52
Version 00e
MTS400 Series Carousel Applications User Manual

Carousel Analyzer - Views
Since the structure view is based on a script, the script can be edited and the
presentation of the packet or message changed.
Right-clicking on the any item in the structure view will open this menu:
Using the Save As… option, the structure can be saved to a separate file.
The Go To Next option moves the structure view to the next repetition of the
same item. If the current view is the last in the stream, the option will loop back
to the first repetition in the stream.
Version 00e
MTS400 Series Carousel Applications User Manual
1−53

Carousel Analyzer - Views
The information displayed by the structure view may be carried in one or more
transport packets. By right-clicking the item and selecting View Transport
Packet List, a list of the transport packets carrying the information will be
displayed. Highlighting a Packet Number and selecting View will display the
selected transport packet structure. Several structure views can be opened in this
way but the views are not enabled until the Transport Packet Contributions
dialog is closed.
The Low and High Index entries in the Transport Packet Contributions dialog
box indicate the first and last byte respectively of the packet that contributes to
the structure.
The screenshots below illustrate an example of this sequence of actions:
1−54
Version 00e
MTS400 Series Carousel Applications User Manual

Bitrate View
Carousel Analyzer - Views
Menu Bar: View > Bitrate Toolbar:
This structure view charts the bit rate of a set of transport entities (for example,
BIOP message, PID, module). The bit rate calculation is a rolling average. For
any transport entity the sum of the transport packets that contribute to that entity
in each 100 ms time-slice are summed. The average is calculated every 100 ms
using the last 10 time-slices (that is, the bit rate is the average over the last
second).
In some cases a choice is offered between displaying the bit rate of the selected
element or a composite bit rate of the selected element and its subsidiary (nested)
elements.
NOTE. In calculating bit rates, Carousel Analyzer returns to the stream file. For
large files, the calculation may take an appreciable amount of time.
Version 00e
MTS400 Series Carousel Applications User Manual
1−55

Carousel Analyzer - Views
The y-axis is automatically scaled to accommodate the maximum bit rate. The
name of the element from which the bit rate is derived and the related graph are
linked by color; a line (of the same color) is displayed to the right of the element
name.
If the bit rate for a second element is requested, it is displayed on the same
graph, as shown in the following illustration:
1−56
Any number of element bit rates can be displayed; each will be a separate color.
Version 00e
MTS400 Series Carousel Applications User Manual

Carousel Analyzer - Views
Inspecting Bitrates
It is possible to zoom in on an area of the graph in order to inspect the bit rate in
detail.
To zoom in on the central 50% of the displayed graph, use the Graph > Zoom
> Zoom In menu option (or the Toolbar button:
; or tab key). This action can
be repeated.
To zoom in on any area of the bit rate graph, drag the mouse while holding the
left-button, to highlight the area required. When the mouse button is released, the
highlighted area will be enlarged to fill the graph area.
Saving/Copying
The menu option Graph > Zoom > Zoom Out (Toolbar: ; or shift-tab key)
will zoom out one step at a time; a step being the previous zoom in actions.
The menu option Graph > Zoom > Show All (Toolbar:
) will redisplay the
graph with no zoom factor applied.
The graph can be saved or copied in text format or as a picture file (JPEG or
bitmap).
Menu Option Description
Graph > Save Save the graph to a user defined location.
> Bitmap Size the graph window before saving.
> JPEG Size the graph window before saving.
> Table Tab delimited format.
Graph > Copy Copy to clipboard, from where it can be pasted into a suitable
application:
> Image
> Table Tab delimited format.
Version 00e
MTS400 Series Carousel Applications User Manual
1−57
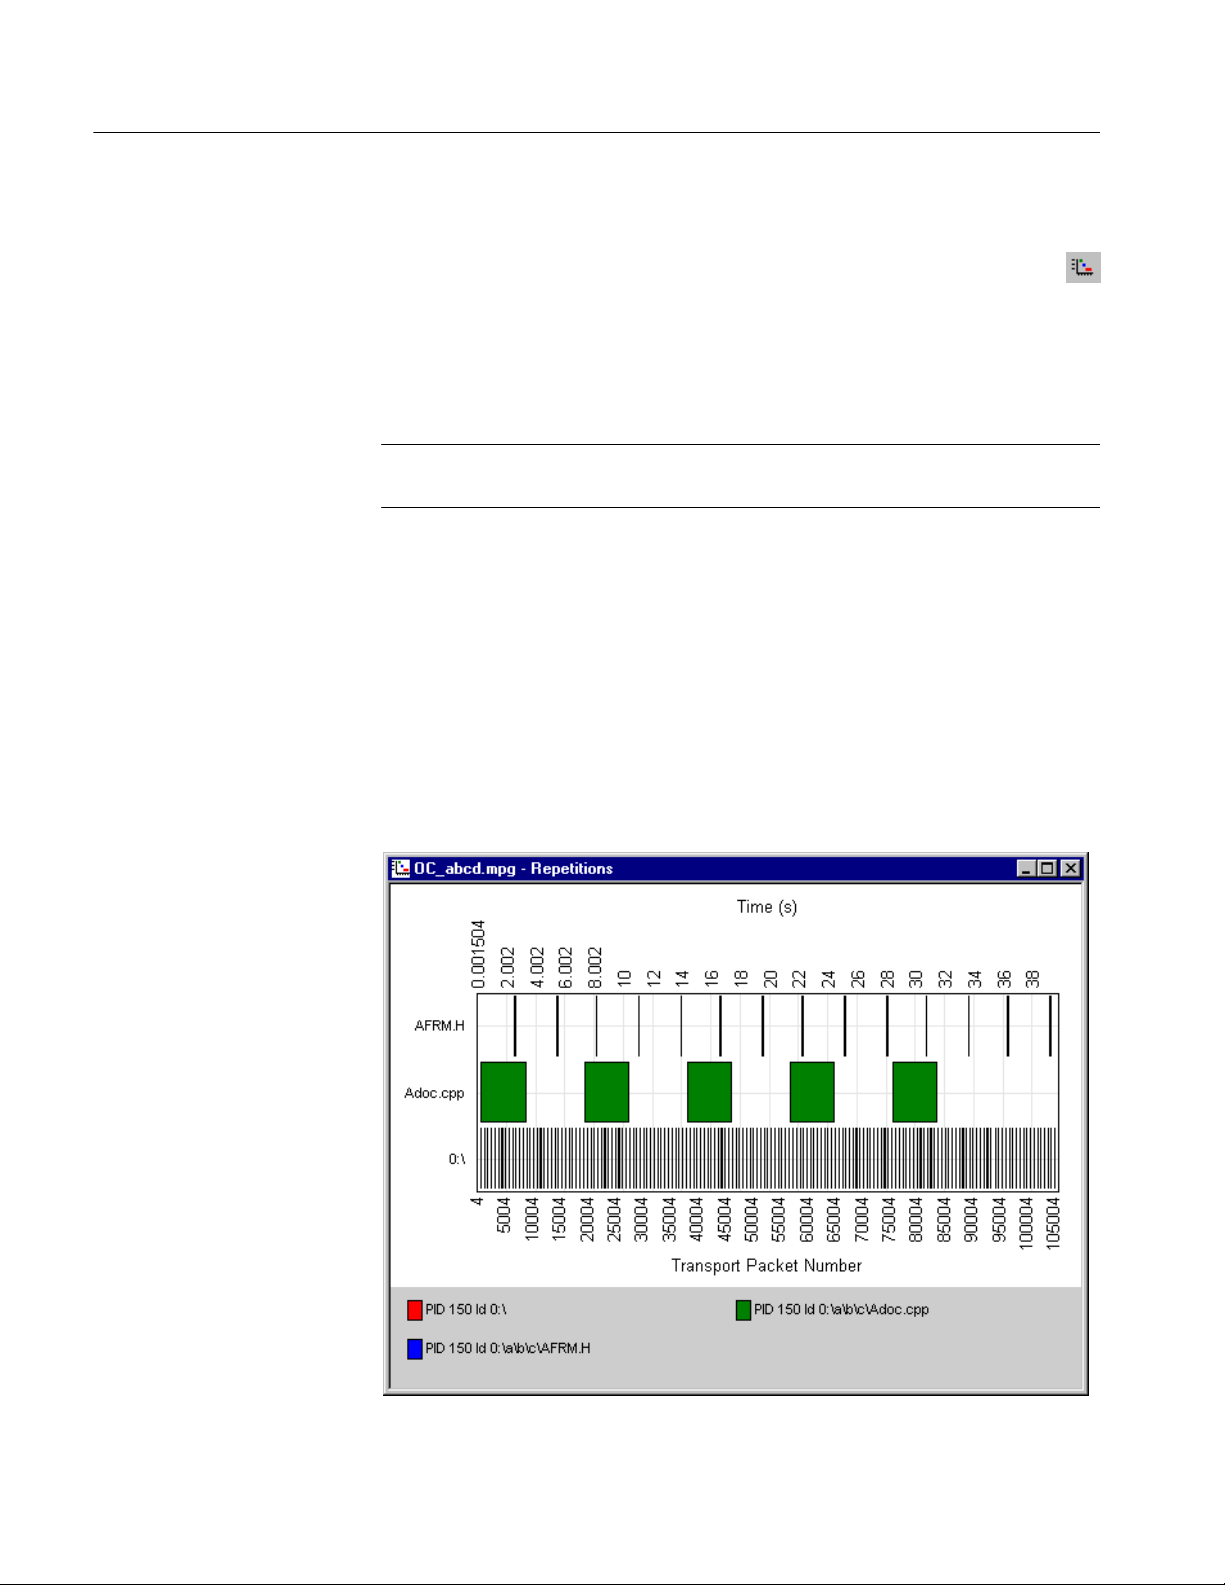
Carousel Analyzer - Views
Repetition View
Menu Bar: View > Repetition Toolbar:
This structure view charts the repetition of a set of data broadcast entities. This
Gantt style graph displays a row for each transport entity (for example, BIOP
message, U-N message etc) selected. A colored block on the row indicates the
presence of the message at that point in the transport stream.
NOTE. In calculating repetition rates, Carousel Analyzer returns to the stream
file. For large files, the calculation may take an appreciable amount of time.
Inspecting Repetition
Rates
It is possible to zoom in on an area of the graph in order to inspect the repetition
rate in detail.
To zoom in on the central 50% of the displayed graph, use the View > Zoom >
Zoom In menu option (or the Toolbar button). This action can be repeated.
To zoom in on any area of the repetition rate graph, drag the mouse while
holding the left-button, to highlight the area required. When the mouse button is
released, the highlighted area will be enlarged to fill the graph area.
1−58
Version 00e
MTS400 Series Carousel Applications User Manual

Carousel Analyzer - Views
Version 00e
MTS400 Series Carousel Applications User Manual
1−59

Carousel Analyzer - Views
The View > Zoom > Zoom Out menu option (Toolbar: or shift-tab key)
will zoom out one step at a time; a step being the previous zoom in actions.
Saving/Copying
The View > Zoom > Show All menu option (Toolbar:
) will redisplay the
graph with no zoom factor applied.
Tooltips: When the cursor is placed over a block, a tooltip provides the PID,
time, and packet number.
The graph can be saved or copied in text format or as a picture file (JPEG or
bitmap).
Menu Option Description
Graph > Save Save the graph to a user defined location.
> Bitmap Size the graph window before saving.
> JPEG Size the graph window before saving.
> Table Tab delimited format.
Graph > Copy Copy to clipboard, from where it can be pasted into a suitable
application.
> Image Copy image.
> Table Tab delimited format.
1−60
Version 00e
MTS400 Series Carousel Applications User Manual

PID View
Carousel Analyzer - Views
Menu Bar: View > PIDs Toolbar:
This static view displays all the active PIDs within the transport stream. A PID
carrying sections will have nested items, which detail the table types on that PID.
The structure, bit rate, and repetition of transport packets and sections are
available from this view.
The following diagram indicates the nodes accessible from the PIDs view.
Active PIDs node
PID node
Table node
Version 00e
MTS400 Series Carousel Applications User Manual
1−61

Carousel Analyzer - Views
Active PIDs Node
PID Node
This node represents all the PIDs found in the current transport stream; the
PIDs are listed as child items.
Right-Click Menu Options.
View Transport Packet
Displays a structure view of the packet at the current
stream position (as indicated by the Transport Packet
number displayed in the Transport Packet Bar).
Represents all the transport packets with a particular PID. If the PID carries
sections then the PID tree node will have child table tree nodes.
Right-Click Menu Options.
View Transport Packet
Displays a structure view of the next transport packet
encountered on this PID from the current stream position (as indicated by the Transport Packet number displayed in the Transport Packet Bar).
View Cycle Time > Allows either cycle time statistics or graphical view to
be selected.
View Repetition Activates or creates a view of the repetition of this PID
in the transport stream.
View Bitrate Activates or creates a view of the bit rate of this PID.
1−62
Version 00e
MTS400 Series Carousel Applications User Manual

Carousel Analyzer - Views
Table Node
This node represents the stream of sections present on a specific PID with a
specific table identity.
Right-Click Menu Options.
View Section Displays a structure view of the next section with this
PID and table identity that can be formed from the current stream position onwards (as indicated by the Transport Packet number displayed in the Transport Packet
Bar).
View Cycle Time > Allows either cycle time statistics or graphical view to
be selected.
View Repetition Activates or creates a view of the repetition rate of this
PID with this PID and table identity.
View Bitrate Activates or creates a bit rate view of sections with this
PID and table identity.
Signal Carousel (See Manual Signaling, page 1−39.)
Version 00e
MTS400 Series Carousel Applications User Manual
1−63

Carousel Analyzer - Views
Log View
Menu Bar: View > Log Toolbar:
The log view is a tabbed window with each tab representing information about a
particular MPEG-2 layer. Each tab contains any miscellaneous information about
the transport stream that has been analyzed. For example, packets that have the
transport_error_bit set will have an entry in the transport log tab.
The diagram below indicates the information that is accessible from the Log
view.
This view provides a summary of the transport stream analysis.Summary
1−64
Version 00e
MTS400 Series Carousel Applications User Manual

Carousel Analyzer - Views
Transport Packet Log
View
This view displays the errors that have been logged in transport packets
during analysis of the stream.
Right-Click Menu Options.
View Transport Packet Displays a structure view of the highlighted
transport packet.
Version 00e
MTS400 Series Carousel Applications User Manual
1−65

Carousel Analyzer - Views
Section Log View
DSM-CC Section Log View
U-U Object Carousel
This view displays the errors that have been logged in sections during
analysis of the stream.
Right-Click Menu Options.
View Section Displays a view of the highlighted section.
This view displays the errors that have been logged in DSM-CC sections during
analysis of the stream.
Right-Click Menu Options.
View Section Displays a view of the highlighted DSM-CC section.
This view displays the warnings that have been logged in U-U Object sections
during analysis of the stream.
1−66
Version 00e
MTS400 Series Carousel Applications User Manual

Cycle Times View
Carousel Analyzer - Views
Cycle times can be calculated for either a carousel (given a starting point) or an
entity in the transport stream.
In the following diagram, a carousel is shown carrying objects A, B and C.
In this example, object B is identified as the starting point for both carousel and
entity cycle timing. The cycle time of a carousel is the time taken to receive all
of the objects within the carousel given a specified starting point in the carousel.
The cycle time of any given entity in the transport stream (including Section,
BIOP Object, PID and U-N Message) is the time taken from the start of an
instance to the start of the next instance.
The cycle times calculated give the maximum, minimum and mean times for the
occurrences of an object in a transport stream in seconds; standard deviation and
number of cycles found will also be displayed. The statistics can also displayed
in graphical format.
Version 00e
MTS400 Series Carousel Applications User Manual
1−67

Carousel Analyzer - Views
Carousel Cycle Times
Statistics
The cycle time of an object carousel is the time taken for all components of the
carousel to be received starting with a selected component of the carousel.
Selecting one or more BIOP objects from a carousel and View Carousel Cycle
Time from the right-click menu generates the Carousel Cycle Times statistics
window. The information can also be displayed in graphical form by selecting
View Carousel Cycle Time Graph.
1−68
In the Carousel Cycle Times window, the BIOP Object column identifies the
PID, Carousel ID and Object that the user identified as a starting point for the
test.
The information can also be displayed in graphical form.
Version 00e
MTS400 Series Carousel Applications User Manual

Carousel Analyzer - Views
Entity Cycle Times
Statistics
Similarly, the cycle time of any entity (object) in the transport stream is the time
between the start of an instance of the entity and the start of the next instance.
Selecting one or more entities in any view and View Entity Cycle Time from
the right-click menu generates the Entity Cycle Times statistics window. The
information can also be displayed in graphical form by selecting View Entity
Cycle Time Graph.
The Entity column identifies the PID, Carousel ID and Object that the user
identified as a starting point for the test.
In both Carousel and Entity statistics windows, further cycle time statistics will
be added to the bottom of the list while the window remains active.
Similarly, with one or more entries in a Cycle Times window selected, the
right-click menu allows the user to display a graph of the cycle times or export
cycle time statistics to a text file.
Version 00e
MTS400 Series Carousel Applications User Manual
1−69

Carousel Analyzer - Views
1−70
Version 00e
MTS400 Series Carousel Applications User Manual

Application Support
Carousel Analyzer provides a means of testing the effects of associating
applications with Object Carousels. An application consists of a “boot class” and
“assets”. Typically, a boot class will comprise a Java or HTML class; assets may
be images or text required by the boot class.
A comprehensive range of tests and measurements is provided in addition to
application management tools.
A single Object Carousel may be timed with several applications in the Carousel
Analyzer.
Application Management
The Application management dialog shows the applications currently defined
and allows the user to manage them. The user can also create new applications.
When defining an application, it may be done by adding application tree nodes
manually using context menus, or by moving parts of currently available object
carousels over to the application. It is also possible to move over sub-trees from
the hard disk to the application definition.
If an asset is specified as a wildcard, the timing will wait for that asset and all
child assets that are found in the transport stream. This means that a directory
can be specified as a wildcard asset and any content found underneath it in the
transport stream will be treated as an asset, for example, specify \bin\startup.class as the boot class, and \images\ as a wildcard directory asset. Any
content in the \images\ directory in the carousel will be treated as an asset.
Version 00e
MTS400 Series Carousel Applications User Manual
1−71

Carousel Analyzer - Application Support
To open the Applications management dialog, select Edit > Applications. The
following dialog box is displayed:
In the Applications management dialog, the main list displays those applications
that have already been created. Application data is stored locally in the file
C:\Program Files\Tektronix\DataTestSystem\applications.dat; this is the
installation directory but it may have been modified by the user. This data file
can be copied to other Carousel Analyzer installations if required.
A summary of the highlighted application is displayed below the list; the user
should enter this summary when the application is created.
The dialog button functions are described as follows:
New Allows a new application to be defined in the New Ap-
plication Definition dialog box.
Keyboard shortcut: Insert.
Copy Creates a copy of the highlighted application. The new
application is allocated a modified name (Copy of).
… Allows the highlighted application to be edited in the
Edit
Edit Application Definition dialog box.
Shortcut: Double-click application name.
Rename… Allows the highlighted application to be renamed.
Keyboard shortcut: F2.
1−72
Delete Deletes the highlighted application after receiving con-
firmation from the user.
Keyboard shortcut: Delete.
Version 00e
MTS400 Series Carousel Applications User Manual
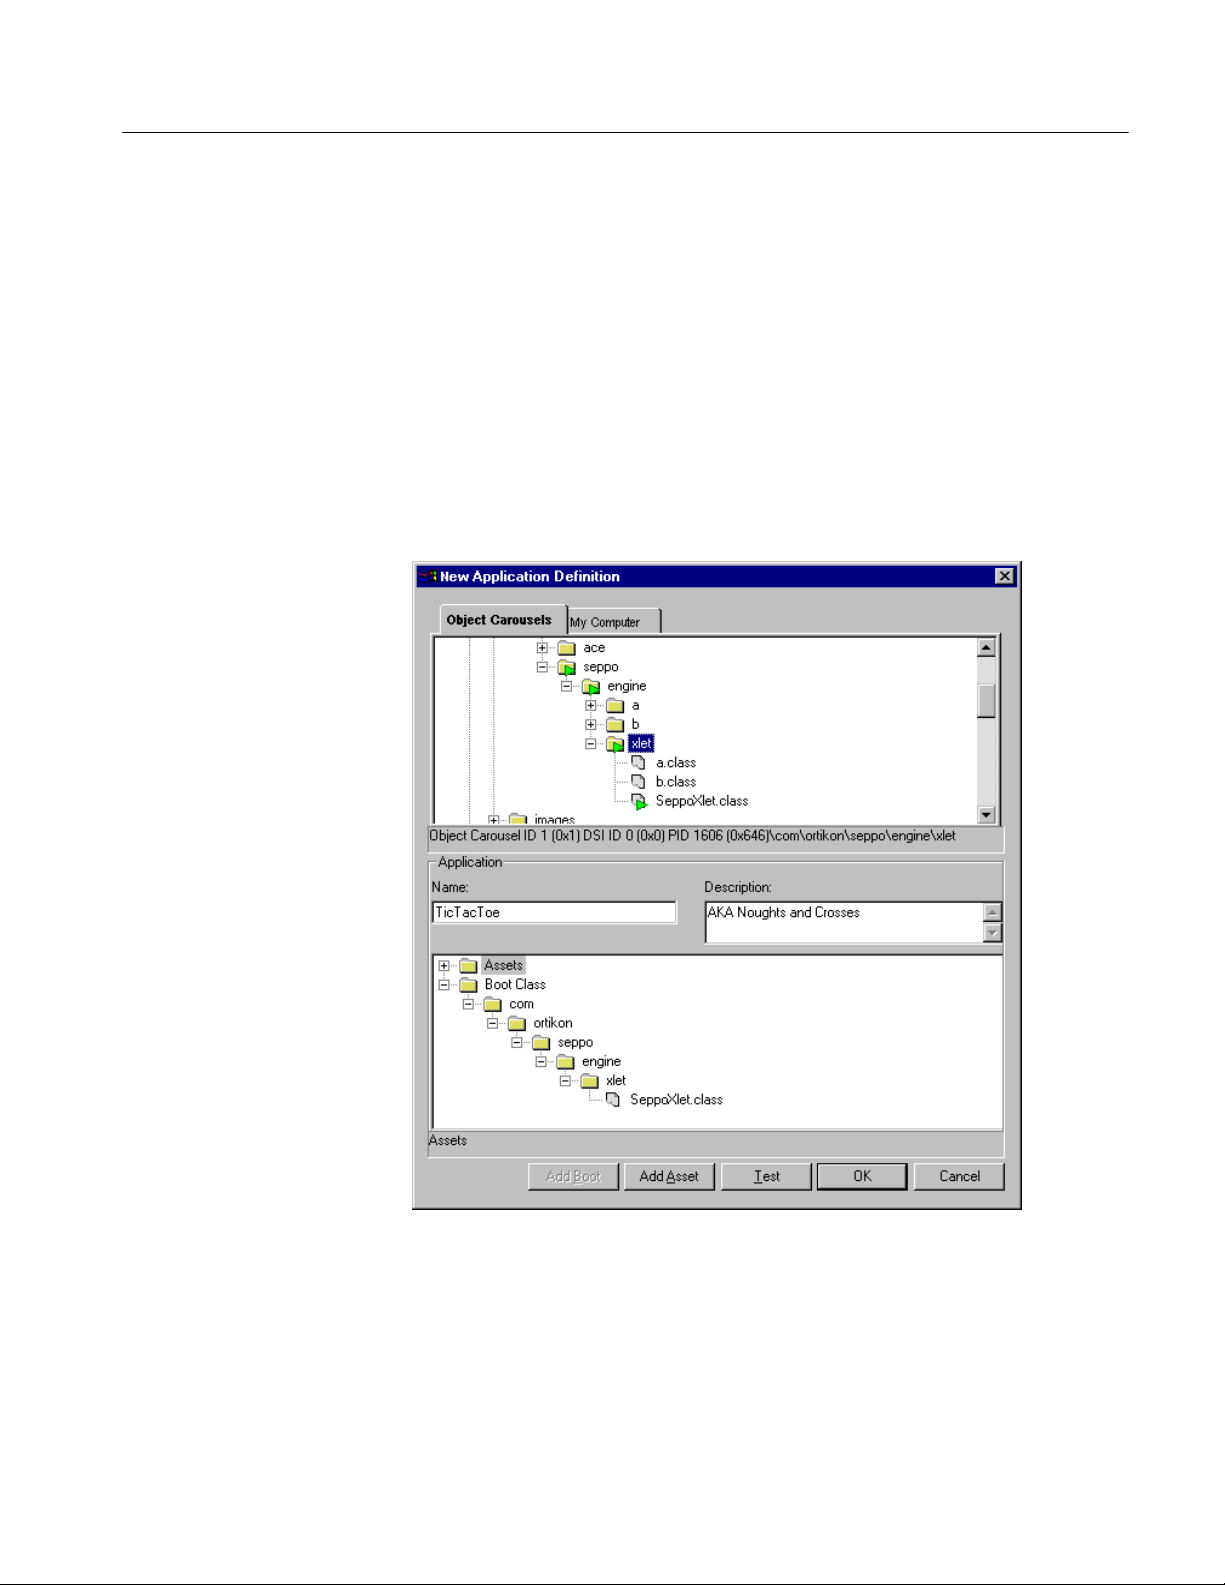
Application Definition
Carousel Analyzer - Application Support
Auto Create Creates an application definition for each MHP applica-
tion that is found in the stream. The boot class for each
application is also set up.
Select OK to close the dialog box. All of the buttons, except New, are disabled
unless an application is highlighted; New is always enabled.
Applications are defined using the New Application Definition dialog as shown
in the following illustration:
(Initially the Application panes will be empty except for the root nodes (Boot
Class and Assets)).
Version 00e
MTS400 Series Carousel Applications User Manual
1−73
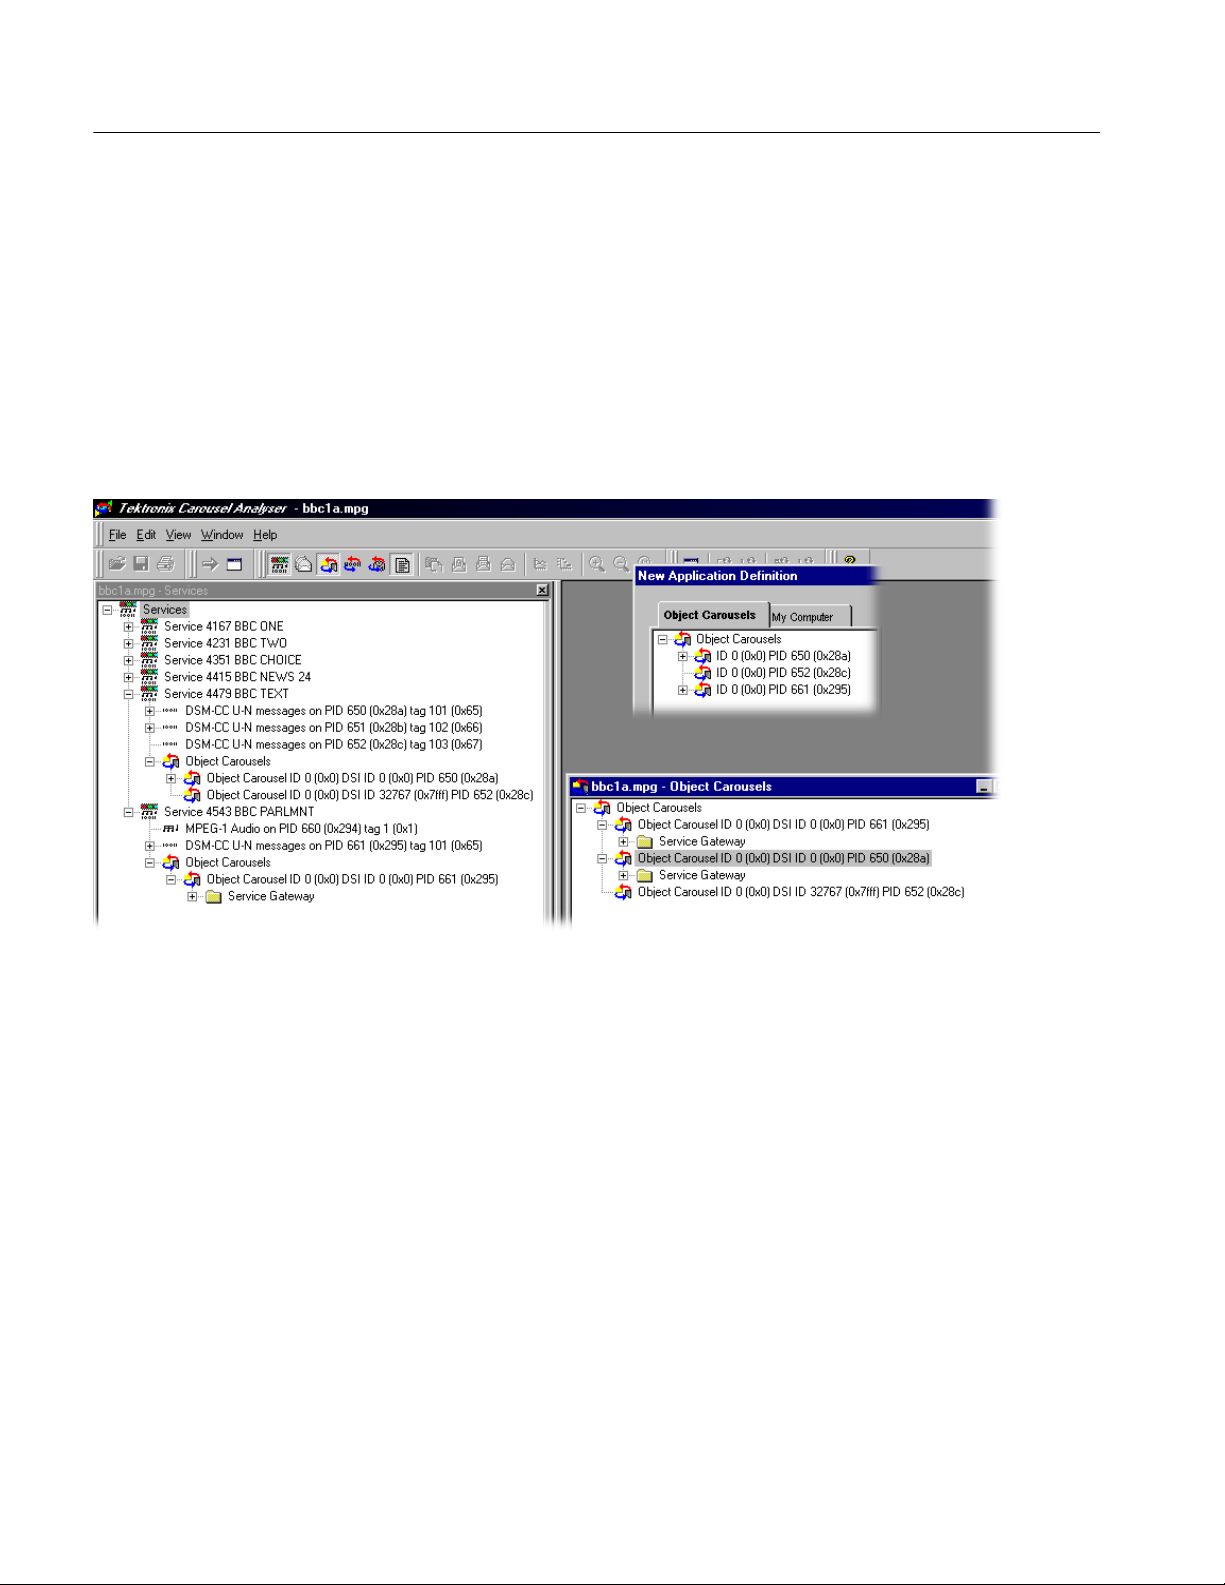
Carousel Analyzer - Application Support
The elements of the New Application Definition dialog box are as follows:
Object Carousels tab: This displays all of the object carousels in the current
transport stream. Note that if the current transport stream
carries no object carousels, then none will be displayed
here.
The example screenshot below shows the Object Carousels displayed in the New Application Definition dialog
box overlaid onto the standard Object Carousel views.
1−74
Name Enter the name of the application.
Description An optional field that allows a brief description of the
application to be entered.
The boot class and the assets are displayed as parts of a tree structure in the
lower pane. The boot class is the object that must be loaded first in an application (an executable image). Assets are data objects to be used by the Boot Class
in the same carousel (for example, picture files, and text files).
Version 00e
MTS400 Series Carousel Applications User Manual
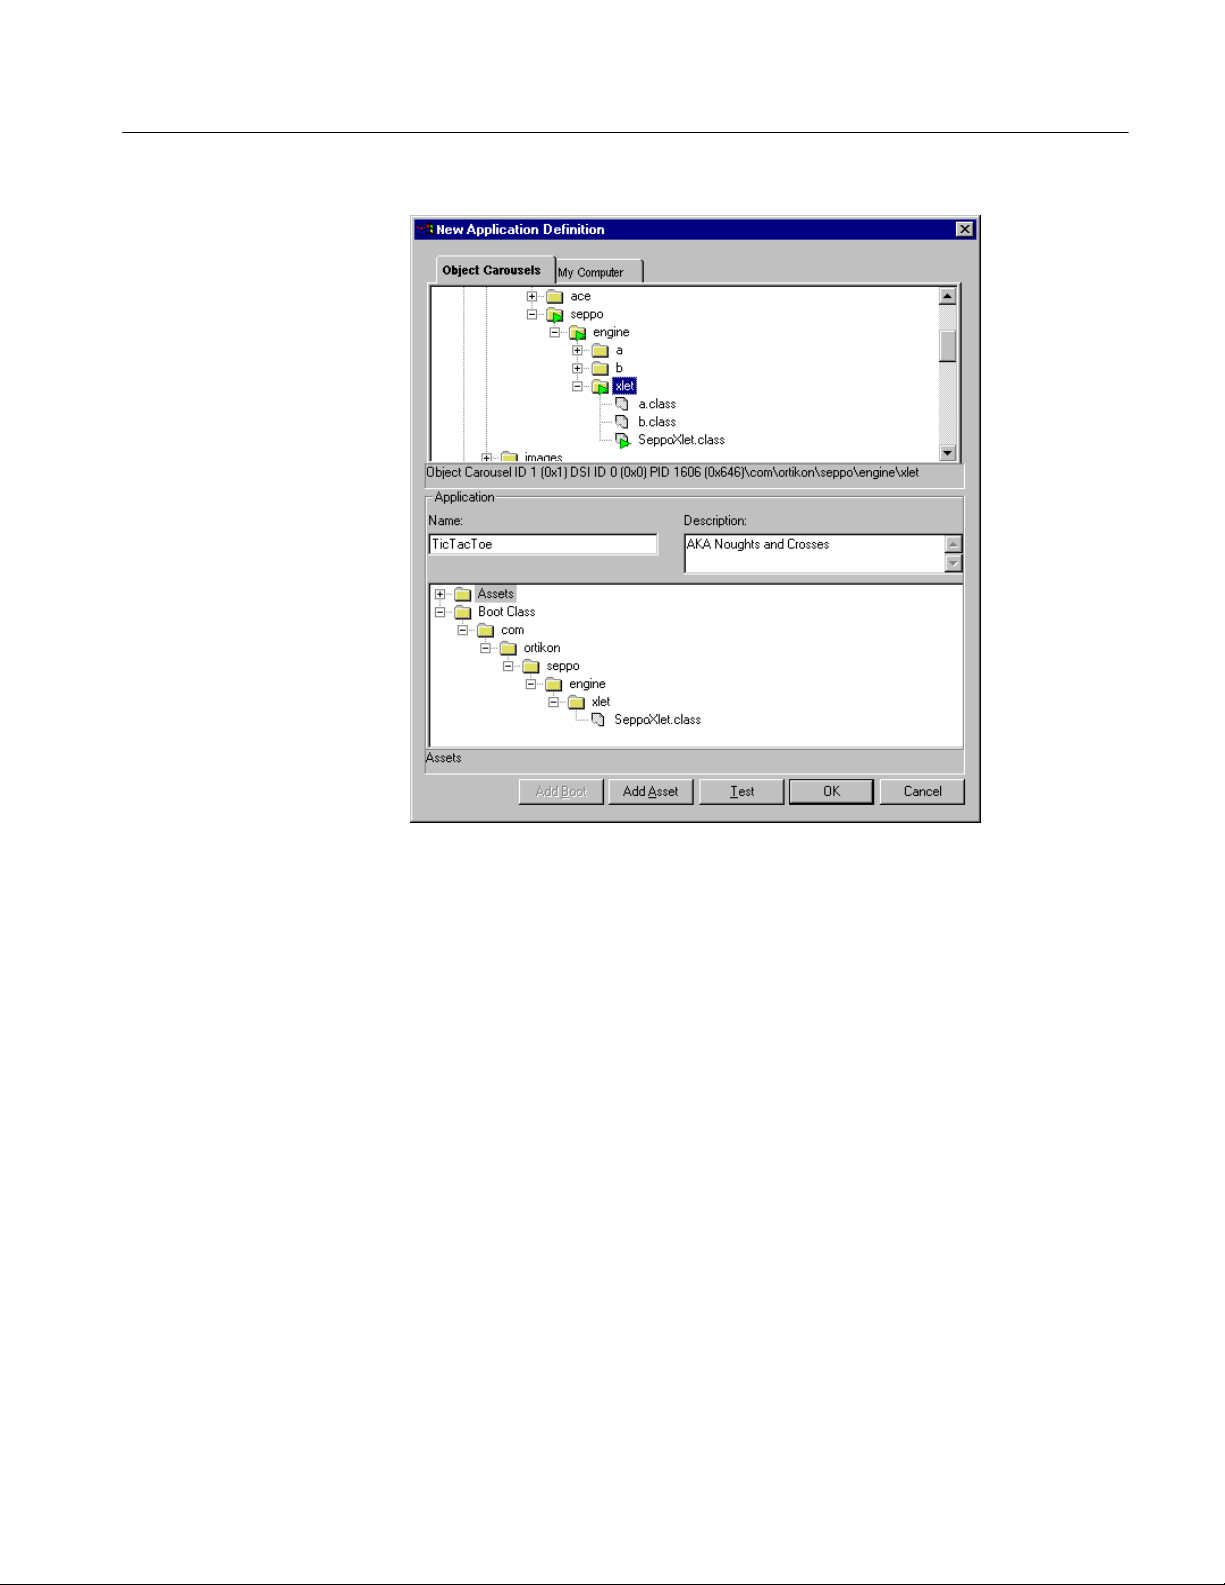
Carousel Analyzer - Application Support
Selecting the OK button closes the dialog box and stores the new application
data. The action will be refused if a boot class object has not been specified. If a
duplicate application name has been entered, it must be renamed.
The boot class must be in the associated carousel; if it is not, the timing test
cannot be performed. An asset is a BIOP object in the carousel that is used by
the boot class. If the asset is not in the associated carousel, the user will be
warned that the assets could not be found and the tests will be performed as if
those assets had not been defined.
Selecting the Cancel button closes the dialog and discards the new application
data.
Version 00e
MTS400 Series Carousel Applications User Manual
1−75

Carousel Analyzer - Application Support
Testing an Application
Test button at the bottom of the application dialog box allows items in the
The
application to be tested against the currently selected carousel. This can be used
to ensure that the correct carousel has been selected for the application and that
all of the objects are present. The results of the test are displayed in the
Application Test dialog.
Adding Objects to the
Application
Objects are moved from the Object Carousel pane to the Boot Class or Asset
panes using the Add Asset button. T do this, highlight the object in the Object
Carousel pane, select Add Asset, and note that the object is added to the adjacent
application structure.
H Making a node that has children an asset will automatically include all the
children as assets. To include every object in a carousel, add the carousel
root node to the application.
H The boot class can only contain one object; it may be at any depth in the
directory structure.
H Adding an object to the Boot Class will displace any existing object.
H Moving assets from the Object Carousel will automatically recreate the
directory structure from the object carousel.
H Moving assets from the hard disk directory tree will only recreate the
structure below the source tree node. When moving assets from the directory
tree, highlight a node in the asset tree as a target.
H A right-click context menu is available at all nodes in the application
structure; available options will depend on the node type.
1−76
Version 00e
MTS400 Series Carousel Applications User Manual

Carousel Analyzer - Application Support
The context menu options operate on the currently highlighted node in the
application structure as follows:
Add Child Adds a child node. It can be subsequently renamed to
indicate an object.
Rename Allows a node to be renamed.
Delete Deletes the node.
Editing an Application
Toggle Wildcard Asset directory nodes can be identified as wildcard en-
tries. A wildcard directory indicates that the directory
and all of its children at the time of analysis are defined
as assets.
Application editing is similar to creating a new application.
Version 00e
MTS400 Series Carousel Applications User Manual
1−77
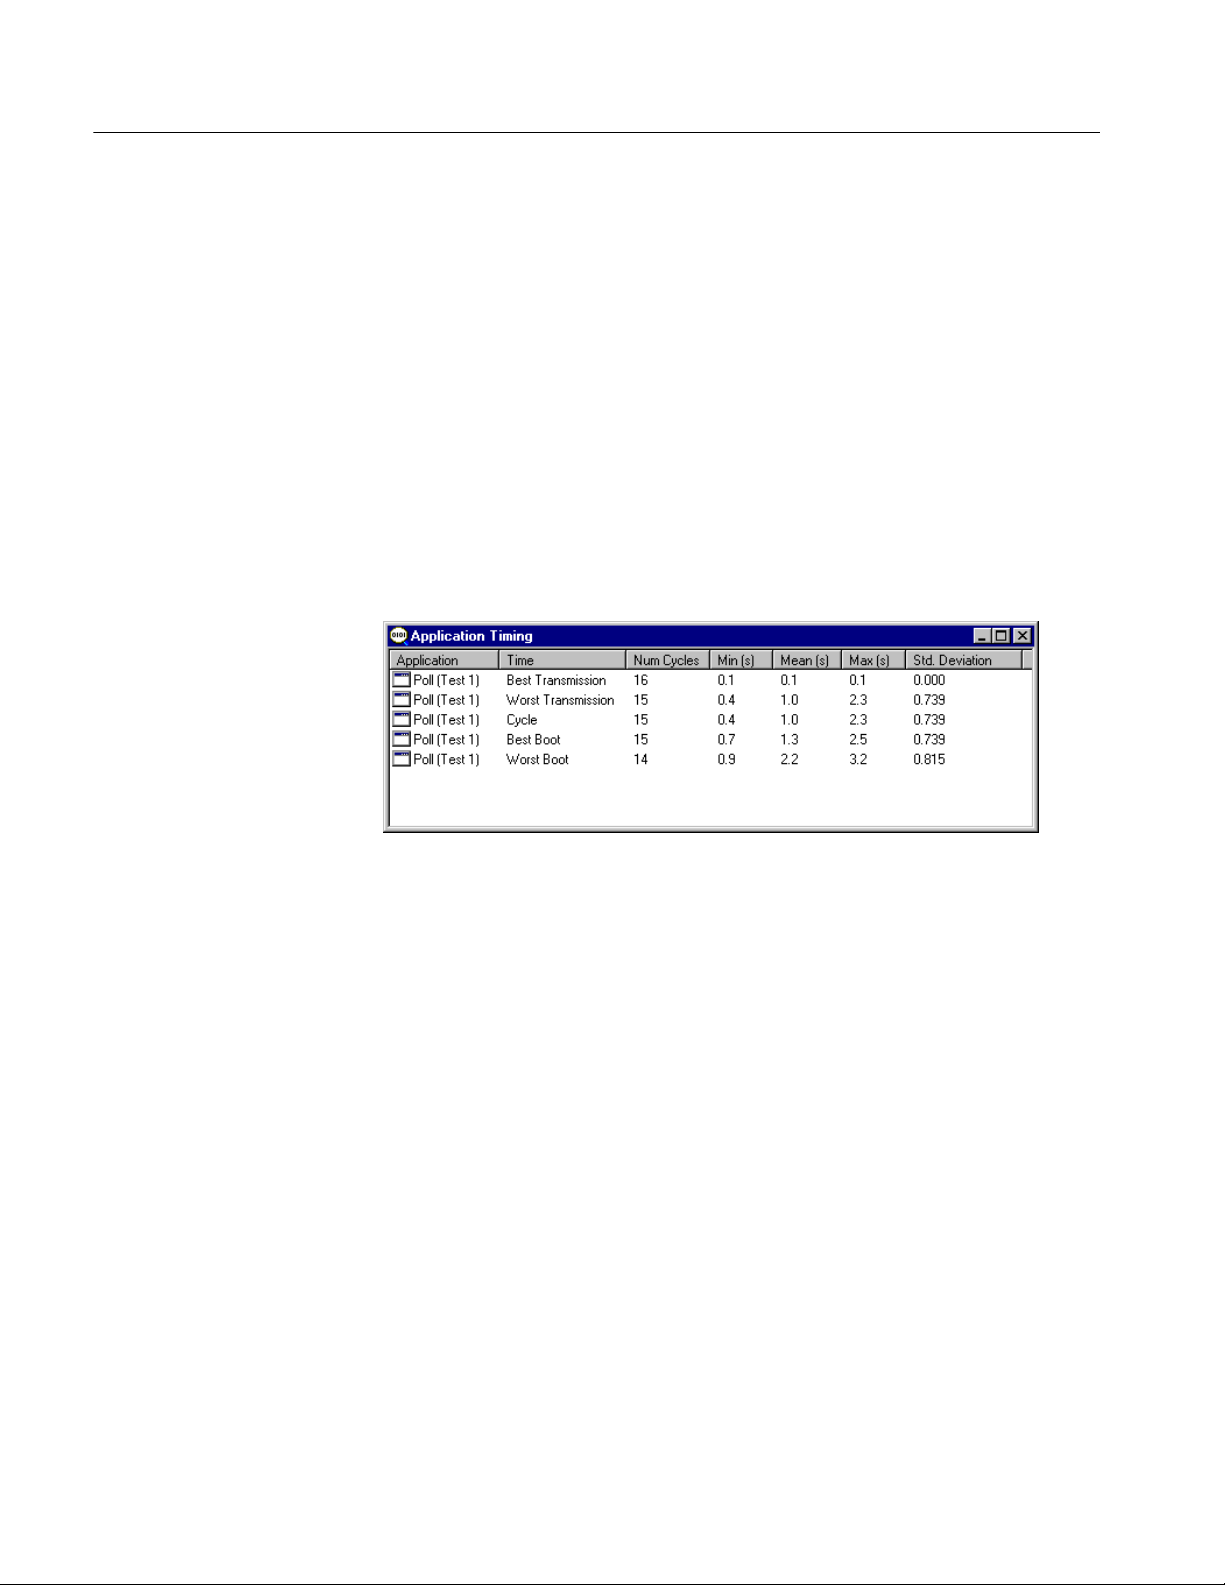
Carousel Analyzer - Application Support
Application Timing
The Application Timing feature allows the user to observe the effect in terms of
download time of one or more applications being timed with an object carousel.
In practice, an object carousel is identified and one or more applications are
selected from the current application list to be timed with it. As each application
is selected, the software will check the availability of the Boot Class and Assets.
If the Boot Class cannot be found, the timing operation will fail. If Assets cannot
be found, the timing tests can still be performed, but they will not represent the
true effect of the application on a particular carousel.
Progress bars are displayed while the tests are being performed.
The results of the application timing tests are presented in tabular form.
1−78
Version 00e
MTS400 Series Carousel Applications User Manual
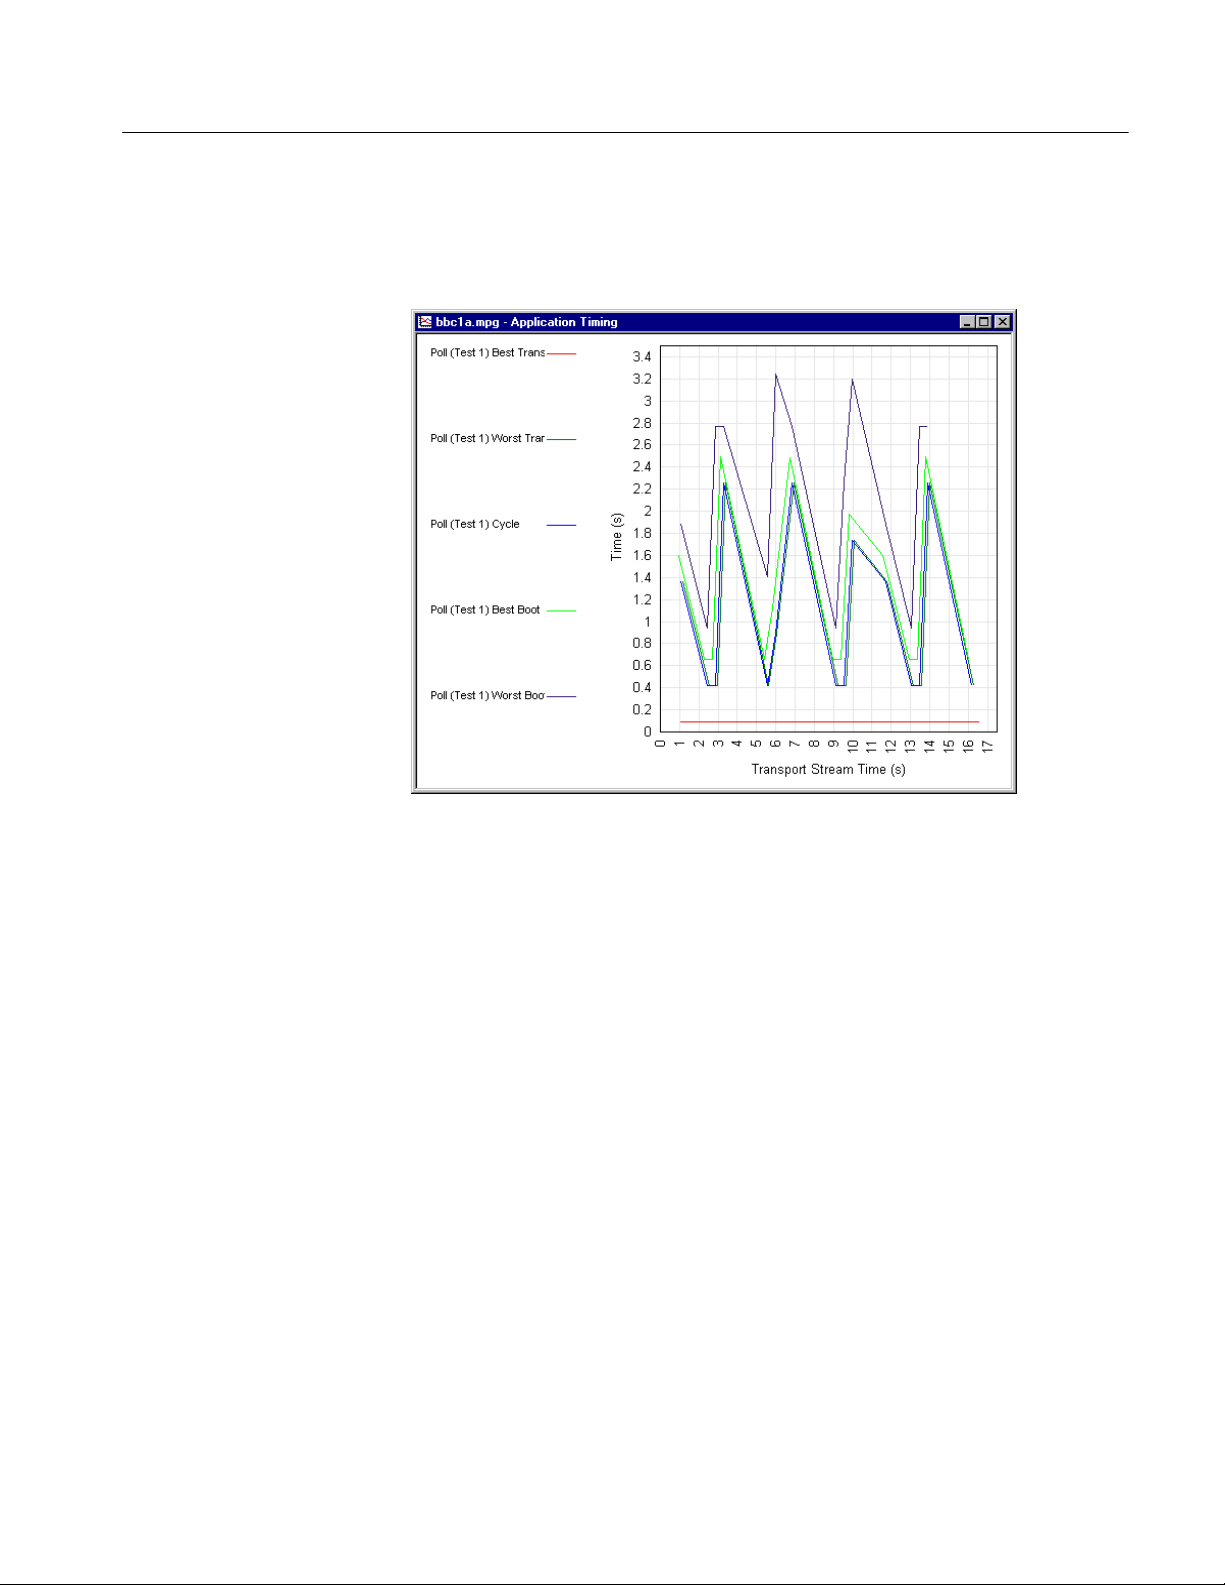
Carousel Analyzer - Application Support
Data displayed in tabular form can be displayed in graphical form or exported to
a tab separated file.
Version 00e
MTS400 Series Carousel Applications User Manual
1−79

Carousel Analyzer - Application Support
Explanation of Timing
Tests
This section gives a graphical explanation of each of the application timing tests.
The calculations assume that control information (DSI/DII; that is, SI/PSI
information, for example, PAT, PMT) has been cached.
The boot class must be received before any of the assets can be received. This
simulates the STB not knowing which carousel objects the boot class depends on
until it has completely received and processed it.
Best Transmission Time. From the start of a boot class to the end of the last asset.
The true application load time is the transmission time plus the time taken by the
set-top box (STB) to load the application. The time taken by the STB to load the
application is not included in these tests.
1−80
Version 00e
MTS400 Series Carousel Applications User Manual

Carousel Analyzer - Application Support
Worst Transmission Time. From the end of a boot class, through the next boot
class, to the end of the last asset.
The true application load time is the transmission time plus the time taken by the
set-top box (STB) to load the application. The time taken by the STB to load the
application is not included in these tests.
Version 00e
MTS400 Series Carousel Applications User Manual
1−81

Carousel Analyzer - Application Support
Cycle Time. From the start of a boot class, through the last asset, to the start of
the next boot class.
Best Boot Time. From the start of a service gateway, through the next boot class,
to the end of the last asset.
1−82
Version 00e
MTS400 Series Carousel Applications User Manual

Carousel Analyzer - Application Support
Worst Boot Time. From the end of a service gateway, through the next service
gateway, through the next boot class, to the end of the last asset.
Version 00e
MTS400 Series Carousel Applications User Manual
1−83
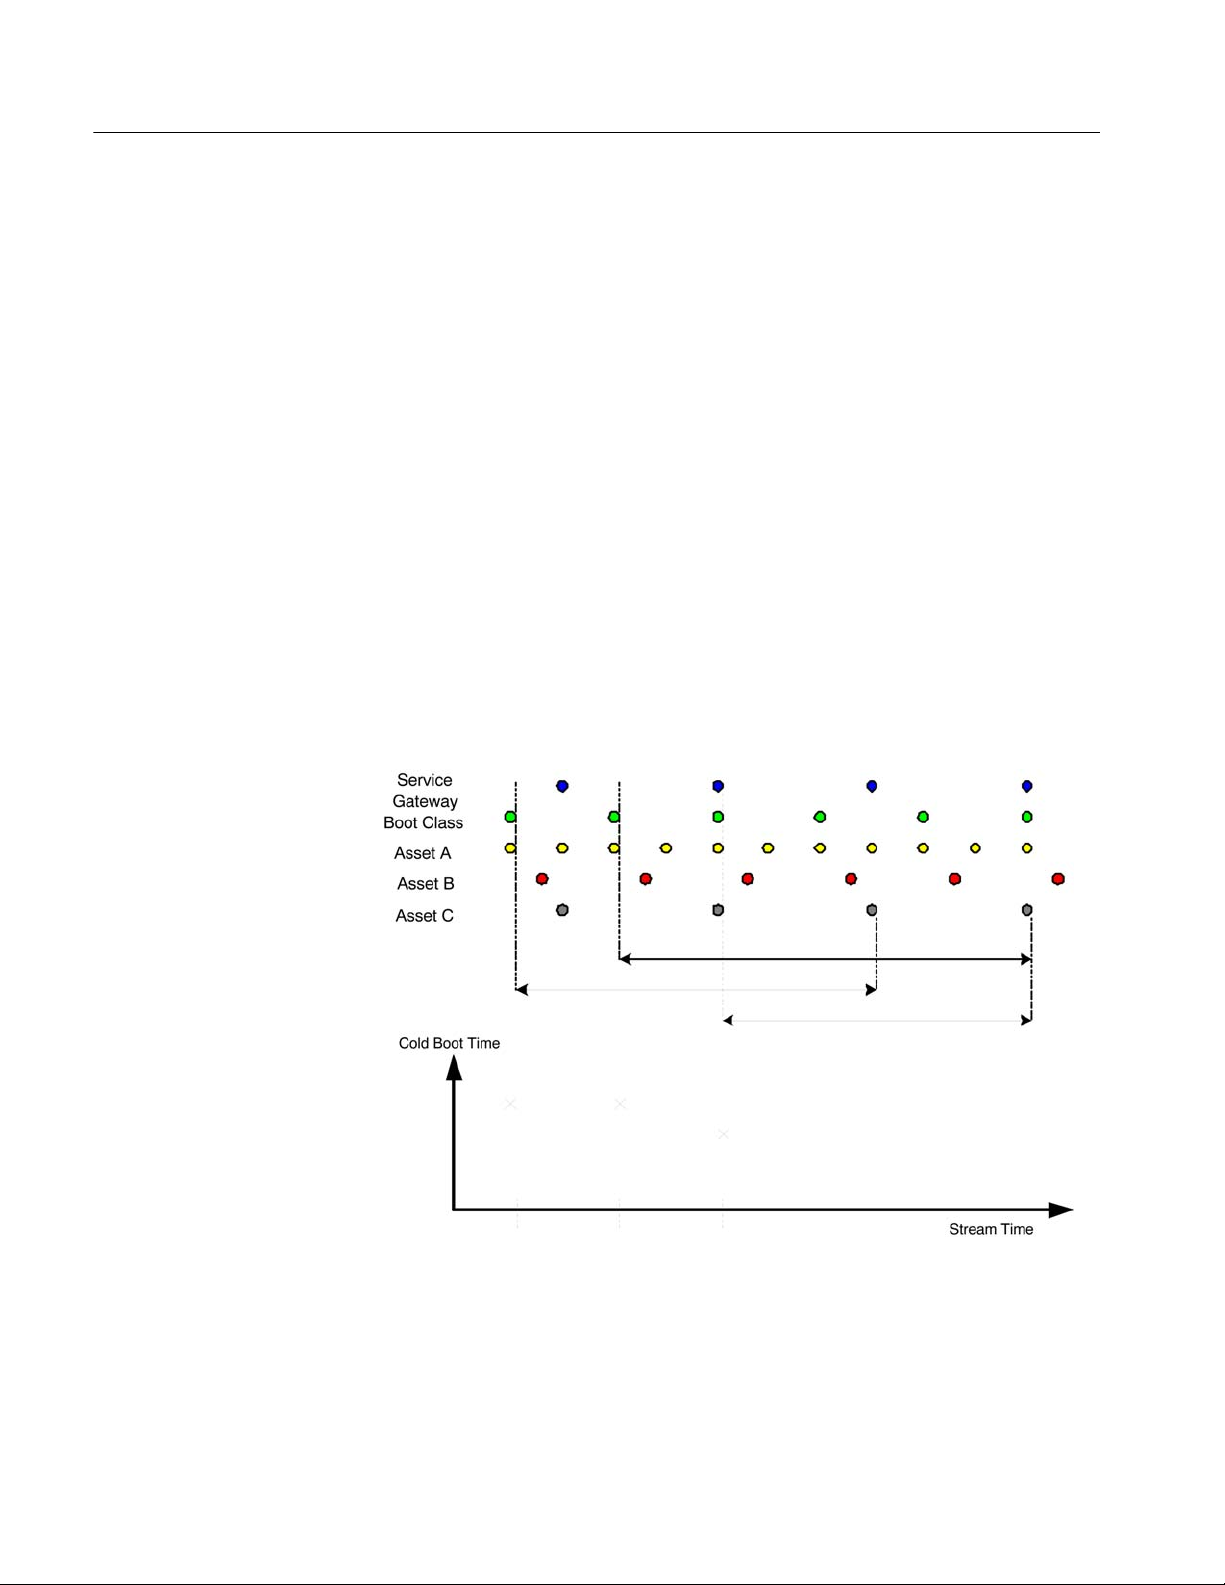
Carousel Analyzer - Application Support
Cold Boot Time. Whereas the other timing methods assume that control
information (PAT, PMT, DSM-CC section, etc.) has been cached, this method
does not.
The user defines a sampling frequency, which is timed to start the download and
observe how long it takes to signal the carousel and download the service
gateway, the boot class and all of the assets. For example, in a 60-second stream,
a Start Point (on the Cold Boot Time Settings dialog) of five seconds will
sample the download time twelve times. The result is added to the Application
Timing results table and graph.
The boot class must be received before any of the assets can be received. This
simulates the STB, not knowing which carousel objects the boot class depends
on until it has completely received and processed it.
Directories must be received before any child objects can be received in this
case. This is because this timing method assumes no signaling caching.
The end of each cycle will be the end of the module containing the last asset.
This is an important distinction because an asset may not be the only one in that
module.
1−84
Version 00e
MTS400 Series Carousel Applications User Manual
 Loading...