

Page 1

User Manual
MTS300 MPEG Test System
Real-Time Analysis
071-0658-03
This document applies to MPEG Test System
version 6.1 firmware.
www.tektronix.com
Page 2

Copyright © Tektronix, Inc. All rights reserved. Licensed software products are owned by Tektronix or its suppliers and
are protected by United States copyright laws and international t reaty provisions.
Use, duplication, or disclosure by the Government is subject to restrictions as set forth in subparagraph (c)(1)(ii) of the
Rights in Technical Data and Computer Software clause at DFARS 252.227-7013, or subparagra phs (c)(1) and (2) of the
Commercial Computer Software -- Restricted Rights clause at FAR 52.227-19, as applicable.
Tektronix products are covered by U.S. and foreign patents, issued and pending. Information in this publication supercedes
that in all previously published material. Specifications and price change privileges reserved.
Tektronix, Inc., P.O. Box 500, Beaverton, OR 97077
TEKTRONIX and TEK are registered trademarks of Tektronix, Inc.
Page 3

Hardware Warranty
Tektronix warrants that the products that it manufactures and sells will be free from defects in materials and
workmanship for a period of one (1) year from the date of shipment. If a product proves defective during this
warranty period, Tektronix, at its option, either will repair the defective product without charge for parts and labor,
or will provide a replacement in exchange for the defective product.
In order to obtain service under this warranty, Customer must notify Tektronix of the defect before the expiration
of the warranty period and make suitable arrangements for the performance of service. Customer shall be
responsible for packaging and shipping the defective product to the service center designated by Tektronix, with
shipping charges prepaid. Tektronix shall pay for the return of the product to Customer if the shipment is to a
location within the country in which the Tektronix service center is locat ed. Customer shall be responsible for
paying all shipping charges, duties, taxes, and any other charges for products returned to any other locations.
This warranty shall not apply to any defect, failure or damage caused by improper use or improper or inadequate
maintenance and care. Tektronix shall not be obligated to furnish service under this warranty a) to repair damage
resulting from attempts by personnel other than Tektronix representatives to install, repair or service the product;
b) to repair damage resulting from improper use or connection to incompatible equipment; c) to repair any
damage or malfunction caused by the use of non-Tektronix supplies; or d) to service a product that has been
modified or integrated with other products when the effect of such modification or integration increases the time
or difficulty of servicing the product.
THIS W ARRANTY IS GIVEN BY TEKTRONIX IN LIEU OF ANY OTHER W ARRANTIES, EXPRESS
OR IMPLIED. TEKTRONIX AND ITS VENDORS DISCLAIM ANY IMPLIED WARRANTIES OF
MERCHANTABILITY OR FITNESS FOR A PARTICULAR PURPOSE. TEKTRONIX’
RESPONSIBILITY TO REPAIR OR REPLACE DEFECTIVE PRODUCTS IS THE SOLE AND
EXCLUSIVE REMEDY PROVIDED TO THE CUSTOMER FOR BREACH OF THIS WARRANTY.
TEKTRONIX AND ITS VENDORS WILL NOT BE LIABLE FOR ANY INDIRECT, SPECIAL,
INCIDENTAL, OR CONSEQUENTIAL DAMAGES IRRESPECTIVE OF WHETHER TEKTRONIX OR
THE VENDOR HAS ADVANCE NOTICE OF THE POSSIBILITY OF SUCH DAMAGES.
Page 4

Software Warranty
Tektronix warrants that the media on which this software product is furnished and the encoding of the programs on
the media will be free from defects in materials and workmanship for a period of three (3) months from the date of
shipment. If a medium or encoding proves defective during the warranty period, Tektronix will provide a
replacement in exchange for the defective medium. Except as to the media on which this software product is
furnished, this software product is provided “as is” without warranty of any kind, either express or implied.
Tektronix does not warrant that the functions contained in this software product will meet Customer’s
requirements or that the operation of the programs will be uninterrupted or error-free.
In order to obtain service under this warranty, Customer must notify Tektronix of the defect before the expiration
of the warranty period. If Tektronix is unable to provide a replacement that is free from defects in materials and
workmanship within a reasonable time thereafter, Customer may terminate the license for this software product
and return this software product and any associated materials for credit or refund.
THIS W ARRANTY IS GIVEN BY TEKTRONIX IN LIEU OF ANY OTHER W ARRANTIES, EXPRESS
OR IMPLIED. TEKTRONIX AND ITS VENDORS DISCLAIM ANY IMPLIED WARRANTIES OF
MERCHANTABILITY OR FITNESS FOR A PARTICULAR PURPOSE. TEKTRONIX’
RESPONSIBILITY TO REPLACE DEFECTIVE MEDIA OR REFUND CUSTOMER’SPAYMENTIS
THE SOLE AND EXCLUSIVE REMEDY PROVIDED TO THE CUSTOMER FOR BREACH OF THIS
WARRANTY. TEKTRONIX AND ITS VENDORS WILL NOT BE LIABLE FOR ANY INDIRECT,
SPECIAL, INCIDENTAL, OR CONSEQUENTIAL DAMAGES IRRESPECTIVE OF WHETHER
TEKTRONIX OR THE VENDOR HAS ADVANCE NOTICE OF THE POSSIBILITY OF SUCH
DAMAGES.
Page 5

Table of Contents
Getting Started
Operating Basics
General Safety Summary xi...................................
Service Safety Summary xiii....................................
Preface xv...................................................
Manual Structure xvi................................................
Manual Conventions xvii..............................................
Related Documents xix...............................................
Software Version xx.................................................
Related Applications xx.............................................
Other Information Sources xxiv.........................................
Contacting Tektronix xxv.............................................
Getting Started 1-1............................................
MTS300 System Overview 1-2........................................
Rear Panel Connectors 1-11............................................
Starting the MTS300 System 1-15.......................................
Shutting Down the MTS300 System 1-20.................................
Reference
Operating Basics 2-1..........................................
Functional Overview 2-1.............................................
Tutorial 2-15..................................................
Preliminary Setup 2-15................................................
Starting and Configuring the Master Client 2-16............................
Assigning Servers and Generating a Transport Stream 2-19...................
Monitoring a Transport Stream Input 2-20.................................
Configuring the Analysis Server 2-23....................................
Configuring the Data Logging Function 2-26..............................
Analyzing a Transport Stream 2-27......................................
Recording a Transport Stream Input 2-30.................................
Reference 3-1.................................................
MPEG Overviews 3-2................................................
Client-Server Overview 3-8...........................................
Master Client Reference 3-11....................................
Master Client Application Window 3-11..................................
Master Client Toolbars and Icons 3-17....................................
Master Client Menus 3-22.............................................
Workspace Dialog Box 3-26............................................
Workspace Tasks 3-29................................................
Error Reporting Tasks 3-37.............................................
MTS300 MPEG Test System Real-Time Analysis User Manual
i
Page 6

Table of Contents
Analyses Reference 3-39........................................
Analysis Servers 3-39.................................................
Default Analyses 3-40.................................................
User Controlled Analyses (Probes) 3-41..................................
ETR 290 Probe Descriptions 3-46.......................................
Multiplex Probe Descriptions 3-62.......................................
Syntax Probe Descriptions 3-68.........................................
Private Syntax Probe Descriptions 3-69...................................
Transport Syntax Probe Descriptions 3-70.................................
Section Syntax Probe Descriptions 3-74..................................
Mega Frame Syntax Probe Descriptions 3-76..............................
Timing Probe Descriptions 3-78.........................................
Transport Rate Probe Descriptions 3-81...................................
Section Rate Probe Descriptions 3-82....................................
Mega Frame Rate Probe Descriptions (DVB-T only) 3-84....................
TMCC Probe Descriptions 3-85.........................................
Expert Client Reference 3-89....................................
Expert Client Display Elements 3-90.....................................
Expert Client Menus 3-96..............................................
Manually Capturing a Transport Stream 3-100..............................
Configuring the Expert Client Views 3-102.................................
Using the Hierarchic View 3-107.........................................
Using the Report View 3-113............................................
Using the Client Area 3-129.............................................
Configuration Client Reference 3-157..............................
Changing Configurations 3-158..........................................
Saving and Restoring Configurations 3-159.................................
Managing Remote MTS300 Systems 3-161.................................
Data Logging 3-163...................................................
Configuration Client Display Elements 3-165...............................
Configuration Settings 3-169............................................
Stream Recorder Reference 3-207.................................
Stream Recorder System Limits 3-207.....................................
Starting the Stream Recorder 3-208.......................................
Stream Recorder Display 3-208..........................................
Recording a Transport Stream 3-212......................................
Stream Player Reference 3-215....................................
Stream Player System Limits 3-215.......................................
Starting the Stream Player 3-216.........................................
Stream Player Display 3-216............................................
Playing Back a Transport Stream File 3-220................................
TMCC Expert Client Reference 3-223..............................
Using the TMCC Expert Client Display Elements 3-224......................
Manually Capturing a TMCC Transport Stream 3-230........................
TMCC Configuration Client Reference 3-233........................
Changing Configurations 3-234..........................................
Saving and Restoring Configurations 3-235.................................
TMCC Configuration Client Display Elements 3-236.........................
TMCC Configuration Settings 3-239......................................
ii
MTS300 MPEG Test System Real-Time Analysis User Manual
Page 7

Appendices
Table of Contents
Appendix A: What to Do if an Application Locks Up A-1............
Appendix B: Cleaning and Maintenance B-1......................
General Care B-1....................................................
Preventive Maintenance B-1...........................................
In Case of Problems B-3..............................................
Repackaging for Shipment B-5........................................
Appendix C: Networking C-1...................................
Network Requirements C-1............................................
Network Installation C-2..............................................
Network Troubleshooting C-8..........................................
Appendix D: Using the Private Syntax Interpreter D-1..............
Private Syntax Interpreter Interface D-2..................................
Editing Private Syntax Definitions D-12...................................
Compiling Private Syntax Definitions D-21................................
Analyzing Private Syntax with the Expert Client D-21.......................
Private Data Reference D-23............................................
Appendix E: ATSC Program Paradigm E-1.......................
Glossary
Index
MTS300 MPEG Test System Real-Time Analysis User Manual
iii
Page 8

Table of Contents
List of Figures
Figure 1-1: MTS300 MPEG Test System 1-1......................
Figure 1-2: Typical MTS300 system rear panel 1-11.................
Figure 1-3: MTS300 inputs and outputs 1-13.......................
Figure 1-4: On/Stby switch 1-15..................................
Figure 2-1: The Master client application window 2-2...............
Figure 2-2: The Expert client application window 2-3...............
Figure 2-3: The Configuration client application window 2-5........
Figure 2-4: The Stream Player client application window 2-6........
Figure 2-5: Stream Recorder client application window 2-7..........
Figure 2-6: TMCC Expert Client display 2-10......................
Figure 2-7: TMCC Configuration Client display 2-11................
Figure 2-8: Front-panel elements 2-12.............................
Figure 2-9: Initial setup for the tutorial 2-16.......................
Figure 2-10: Initial Master Client application window 2-17...........
Figure 2-11: Master Client connected to the local Server Manager 2-17.
Figure 2-12: Changing the analysis display options 2-18..............
Figure 2-13: Assigning servers to I/O ports 2-19.....................
Figure 2-14: Stream Player client 2-20.............................
Figure 2-15: Monitoring a transport stream 2-21....................
Figure 2-16: Services panel details view 2-22.......................
Figure 2-17: Configuration Client display 2-23.....................
Figure 2-18: Setting ETR290 probes 2-24..........................
Figure 2-19: Changing the message level 2-25.......................
Figure 2-20: Data Logging configuration panel 2-26.................
Figure 2-21: Launching the Expert Client 2-27.....................
Figure 2-22: Expert Client display showing errors 2-28..............
Figure 2-23: ETR290 view panel in the Expert Client 2-29............
Figure 2-24: Stream Recorder client application window 2-30.........
iv
MTS300 MPEG Test System Real-Time Analysis User Manual
Page 9

Table of Contents
Figure 3-1: Master Client application window 3-12..................
Figure 3-2: Details view of the Services panel 3-15...................
Figure 3-3: Graphics panel of the Workspace dialog box 3-26.........
Figure 3-4: Sound panel of the Workspace dialog box 3-28...........
Figure 3-5: Report Message Level panel in the
Configuration Client 3-37....................................
Figure 3-6: Multiplex Analysis panel, Probe Type list box 3-42........
Figure 3-7: Expert Client display elements 3-90.....................
Figure 3-8: View panel in the Settings window 3-103..................
Figure 3-9: Report View configuration window 3-103.................
Figure 3-10: Graphics View configuration window 3-105..............
Figure 3-11: PID Allocation View configuration window 3-106.........
Figure 3-12: Expert Client hierarchic display 3-107..................
Figure 3-13: Specific information displayed for transport
stream items 3-108...........................................
Figure 3-14: Report view display 3-113.............................
Figure 3-15: Report view display modes 3-117.......................
Figure 3-16: Analysis Results area of the Report view 3-118............
Figure 3-17: Hierarchy levels in the Analysis Results area 3-120........
Figure 3-18: Error Graph panel for the Program report mode 3-121....
Figure 3-19: Message panel for the Program report mode 3-121........
Figure 3-20: Error Graph panel for the ETR 290 report mode 3-122....
Figure 3-21: Error Graph panel for the Advanced report mode 3-124...
Figure 3-22: Error Graph panel for the Error report mode 3-125.......
Figure 3-23: Program Allocation panel (Current Rate mode) 3-132.....
Figure 3-24: Reading the Program Allocation panel bar graphs 3-134...
Figure 3-25: PID Allocation panel (current rate mode) 3-135...........
Figure 3-26: Continuity Counter panel 3-138........................
Figure 3-27: Type Allocation panel 3-139...........................
Figure 3-28: TP (Transport Packet) Error Indicator panel 3-140........
Figure 3-29: Unsynchronized Packets panel 3-141....................
Figure 3-30: ASI/M2S Distribution panel 3-142......................
Figure 3-31: ETR 290 view (DVB mode) 3-143.......................
Figure 3-32: Section Analysis view 3-145............................
Figure 3-33: Section Rate view 3-147...............................
Figure 3-34: PCR Analysis view 3-148..............................
Figure 3-35: PTS/DTS Analysis view 3-151..........................
Figure 3-36: MIP Packet Analysis view 3-152........................
Figure 3-37: IP Monitoring view 3-155.............................
MTS300 MPEG Test System Real-Time Analysis User Manual
v
Page 10

Table of Contents
Figure 3-38: Data logging directory hierarchy 3-163..................
Figure 3-39: Data logging file structure 3-164........................
Figure 3-40: Configuration Client display elements 3-165.............
Figure 3-41: Hardware configuration panel 3-170....................
Figure 3-42: Analysis configuration panel 3-171......................
Figure 3-43: ETR 290 configuration panel 3-173.....................
Figure 3-44: Multiplex Analysis configuration panel 3-174.............
Figure 3-45: Syntactic Analysis configuration panel 3-176.............
Figure 3-46: Transport Syntactic Analysis configuration panel 3-178....
Figure 3-47: Section Syntactic Analysis configuration panel 3-180......
Figure 3-48: Mega Frame Syntactic Analysis configuration panel 3-182..
Figure 3-49: PCR Timing Analysis configuration panel 3-184..........
Figure 3-50: PTS/DTS Timing Analysis configuration panel 3-186......
Figure 3-51: Mega Frame Timing Analysis configuration panel 3-188...
Figure 3-52: Transport Rate Analysis configuration panel 3-189........
Figure 3-53: Section Rate Analysis configuration panel 3-190..........
Figure 3-54: Mega Frame Rate Analysis configuration panel 3-192......
Figure 3-55: Report configuration panel 3-193.......................
Figure 3-56: Report Message Level configuration panel 3-195..........
Figure 3-57: Event Configuration configuration panel 3-197...........
Figure 3-58: Event Settings dialog box 3-201........................
Figure 3-59: Filtering configuration panel 3-203.....................
Figure 3-60: Data Logging configuration panel 3-204.................
Figure 3-61: Security configuration panel 3-205......................
Figure 3-59: Stream Recorder display elements 3-208.................
Figure 3-60: Minimized Stream Recorder display 3-21 1...............
Figure 3-61: Stream Player display elements 3-216...................
Figure 3-62: Minimized Stream Player display 3-219.................
Figure 3-63: TMCC Expert Client display elements 3-224.............
Figure 3-64: Data storage event configuration dialog box 3-231.........
Figure 3-65: TMCC Configuration Client display elements 3-236.......
Figure 3-66: TMCC Input configuration panel 3-240.................
Figure 3-67: TMCC Analysis configuration panel 3-241...............
Figure 3-68: TMCC Data Storage configuration panel 3-243...........
Figure 3-69: Data Storage Event Configuration dialog box 3-246.......
Figure B--1: Repackaging the instrument (new packaging) B--6.......
Figure B--2: Repackaging the instrument (old packaging) B--8........
Figure B-- 3: Placement of bottom spacer pad in inner shipping box B--9
vi
MTS300 MPEG Test System Real-Time Analysis User Manual
Page 11

Table of Contents
Figure C-1: Network dialog box showing TCP/IP Protocol item C-3...
Figure C-2: IP tab parameters C-4...............................
Figure C-3: DNS tab parameters C-5.............................
Figure C-4: Incorrect IP address C-9.............................
Figure C-5: Incorrect subnet mask C-10...........................
Figure C-6: Incorrect default gateway IP address C-11...............
Figure C-7: Ping.exe command window C-13.......................
Figure C-8: Tracert.exe command window C-14.....................
Figure C-9: Command prompt with nslookup results C-15............
MTS300 MPEG Test System Real-Time Analysis User Manual
vii
Page 12

Table of Contents
List of Tables
T able i: Tektronix MPEG Test System version 6.1 applications xxi...
Table 1-1: Rear-panel connectors 1-12............................
Table 1-2: Default user names and passwords 1-16..................
Table 2-1: Front panel-key controls 2-13..........................
Table 2-2: Touch screen techniques 2-14...........................
Table 3-1: Master Client toolbar buttons 3-17......................
Table 3-2: Master Client Port Manager and Services panel icons 3-18..
Table 3-3: Error icons 3-19......................................
Table 3-4: Error severity gauge icons 3-19.........................
Table 3-5: Detail panel error icons with an input selected 3-20........
T able 3-6: Detail panel error icons with a service selected 3-20........
T able 3-7: Windows NT system tray icons 3-21.....................
T able 3-8: Master Client Master menu 3-22........................
T able 3-9: Master Client Workspace menu 3-22....................
Table 3-10: Master Client View menu 3-23........................
Table 3-11: Master Client Help menu 3-23.........................
Table 3-12: Port Manager panel shortcut menu 3-23................
T able 3-13: Services panel shortcut menu 3-25.....................
Table 3-14: ETR 290 tests 3-47..................................
Table 3-15: Overview of service information defined in
ETS 300 468 3-58..........................................
Table 3-16: SI repetition rates according to DVB 3-59...............
Table 3-17: Multiplex analyses 3-62..............................
Table 3-18: Table ID analyses 3-64...............................
Table 3-19: Transport syntax analyses 3-70........................
Table 3-20: Section syntax analyses 3-74..........................
Table 3-21: Section syntax analyses 3-76..........................
Table 3-22: Section rate analyses 3-83.............................
Table 3-23: Functions of the View Toolbar buttons 3-92.............
Table 3-24: Functions of the Report View Toolbar buttons 3-93.......
Table 3-25: Expert Client Active View menu commands 3-96.........
Table 3-26: Expert Client Session menu commands 3-97.............
Table 3-27: Expert Client View menu commands 3-98...............
viii
MTS300 MPEG Test System Real-Time Analysis User Manual
Page 13

Table of Contents
Table 3-28: Expert Client View menu commands 3-98...............
Table 3-29: Expert Client Window menu commands 3-99............
Table 3-30: Expert Client Help menu commands 3-99...............
Table 3-31: Mouse and keyboard actions in the Hierarchic view 3-109..
Table 3-32: Hierarchic view icon identification 3-110.................
Table 3-33: Hierarchic view menu commands 3-112..................
Table 3-34: Functions of the Report View Toolbar buttons 3-114.......
Table 3-35: Report view shortcut menu 3-117.......................
Table 3-36: Error graph symbols 3-119............................
Table 3-37: Icons used in the Report view Analysis Results area 3-120..
Table 3-38: Message view column descriptions (Program mode) 3-122..
Table 3-39: Message view column descriptions (ETR 290 mode) 3-123..
Table 3-40: Message view column descriptions (Advanced mode) 3-125.
Table 3-41: Message view column descriptions (Error mode) 3-126.....
Table 3-42: Configuration Client Session menu commands 3-166.......
Table 3-43: Configuration Client Help menu commands 3-167.........
Table 3-44: Functions of the Configuration Client
Toolbar buttons 3-167.......................................
Table 3-45: Multiplex analysis probes 3-175........................
Table 3-46: Transport syntax probes 3-179.........................
Table 3-47: Section syntax probes 3-181............................
Table 3-48: Mega Frame syntax probes 3-183.......................
Table 3-49: Functions of the TMCC Expert Client
toolbar buttons 3-225........................................
T able 3-50: Color for each TMCC Expert Client
modulation mode 3-226......................................
Table 3-51: TMCC data syntax 3-227..............................
Table 3-52: Syntax view LED icons and error conditions 3-228........
Table 3-53: Functions of the TMCC Configuration Client
Toolbar buttons 3-237.......................................
Table B-1: Troubleshooting power-on failures B-3..................
T able D-1: Menu bar File menu D-4.............................
T able D-2: Menu bar Edit menu D-4.............................
T able D-3: Menu bar View menu D-5............................
Table D-4: Menu bar Window menu D-5.........................
Table D-5: Menu bar Help menu D-5............................
Table D-6: Private Syntax Interpreter toolbar buttons D-6..........
MTS300 MPEG Test System Real-Time Analysis User Manual
ix
Page 14

Table of Contents
Table D-7: Hierarchic view icons and label descriptions D-7.........
Table D-8: Hierarchy position of added items D-14..................
T able D-9: Default parameters for added private syntax fields D-15....
Table D-10: Private syntax data type definitions D-16................
Table D-11: Private syntax expression operators and terminals D-16...
Table D-12: Private syntax example interpretation expressions D-17...
Table D-13: Private section D-24.................................
Table D-14: Private descriptor D-26..............................
T able E-1: PID assignment for the elementary streams of
a program E-1............................................
Table E-2: Program paradigm errors E-2.........................
x
MTS300 MPEG Test System Real-Time Analysis User Manual
Page 15

General Safety Summary
Review the following safety precautions to avoid injury and prevent damage to
this product or any products connected to it. To avoid potential hazards, use this
product only as specified.
Only qualified personnel should perform service procedures.
While using this product, you may need to access other parts of the system. Read
the General Safety Summary in other system manuals for warnings and cautions
related to operating the system.
ToAvoidFireor
Personal Injury
Use Proper Power Cord. Use only the power cord specified for this product and
certified for the country of use.
Ground the Product. This product is grounded through the grounding conductor
of the power cord. To avoid electric shock, the grounding conductor must be
connected to earth ground. Before making connections to the input or output
terminals of the product, ensure that the product is properly grounded.
Observe All Terminal Ratings. To avoid fire or shock hazard, observe all ratings
and markings on the product. Consult the product manual for further ratings
information before making connections to the product.
Do not apply a potential to any terminal, including the common terminal, that
exceeds the maximum rating of that terminal.
Do Not Operate Without Covers. Do not operate this product with covers or panels
removed.
Use Proper Fuse. Use only the fuse type and rating specified for this product.
Avoid Exposed Circuitry. Do not touch exposed connections and components
when power is present.
Wear Eye Protection. Wear eye protection if exposure to high-intensity rays or
laser radiation exists.
Do Not Operate With Suspected Failures. If you suspect there is damage to this
product, have it inspected by qualified service personnel.
Do Not Operate in Wet/Damp Conditions.
Do Not Operate in an Explosive Atmosphere.
Keep Product Surfaces Clean and Dry.
Provide Proper Ventilation. Refer to the manual’s installation instructions for
details on installing the product so it has proper ventilation.
MTS300 MPEG Test System Real-Time Analysis User Manual
xi
Page 16

General Safety Summary
Symbols and Terms
Terms in this Manual. These terms may appear in this manual:
WARNING. Warning statements identify conditions or practices that could result
in injury or loss of life.
CAUTION. Caution statements identify conditions or practices that could result in
damage to this product or other property.
Terms on the Product. These terms may appear on the product:
DANGER indicates an injury hazard immediately accessible as you read the
marking.
WARNING indicates an injury hazard not immediately accessible as you read the
marking.
CAUTION indicates a hazard to property including the product.
Symbols on the Product. The following symbols may appear on the product:
CAUTION
Refer to Manual
Protective Ground
(Earth) Terminal
xii
MTS300 MPEG Test System Real-Time Analysis User Manual
Page 17

Service Safety Summary
Only qualified personnel should perform service procedures. Read this Service
Safety Summary and the General Safety Summary before performing any service
procedures.
Do Not Service Alone. Do not perform internal service or adjustments of this
product unless another person capable of rendering first aid and resuscitation is
present.
Disconnect Power. To avoid electric shock, switch off the instrument power, then
disconnect the power cord from the mains power.
Use Care When Servicing With Power On. Dangerous voltages or currents may
exist in this product. Disconnect power, remove battery (if applicable), and
disconnect test leads before removing protective panels, soldering, or replacing
components.
To avoid electric shock, do not touch exposed connections.
MTS300 MPEG Test System Real-Time Analysis User Manual
xiii
Page 18

Service Safety Summary
xiv
MTS300 MPEG Test System Real-Time Analysis User Manual
Page 19

Preface
This document describes how to use the following Tektronix MTS300 MPEG
Test System components:
H Master Client
H Expert Client
H Configuration Client
H TMCC Expert Client
H TMCC Configuration Client
H Stream Player Client and Server
H Stream Recorder Client and Server
H Server Manager
H Analysis Server
H Private Syntax Interpreter
MTS300 MPEG Test System Real-Time Analysis User Manual
xv
Page 20

Preface
Manual Structure
This Real-Time Analysis user manual is organized into the following sections:
Getting Started. This section provides brief overviews of the MTS300 and client
applications, descriptions of the rear panel connectors, procedures for starting
and logging onto the MTS300 system (including enabling/disabling Auto
Logon), and procedures for shutting down the MTS300 system and applications.
Operating Basics. This section describes the MTS300 system interface and
provides a brief tutorial that shows how the client modules are used to monitor
and analyze transport streams.
Reference. This section provides detailed descriptions and procedures for using
each of the MTS300 client modules. It also provides a reference for all user-controlled analyses (called probes) enabled by the MTS300 system.
Appendix A: What to Do if an Application Locks Up. Appendix A describes how to
recover if the MTS300 system locks up.
Appendix B: Cleaning and Maintenance. This appendix describes how to perform
periodic user maintenance. This section does not include repair or replacement
procedures. For these procedures, see the MTS300 MPEG Test System Service
Manual, which is an optional accessory.
Appendix C: Networking. This appendix contains information you might need to
set your system up in a TCP/IP environment and to troubleshoot basic
networking problems.
Appendix D: Private Syntax Interpreter. This appendix describes how to create and
compile private syntax definitions for use with the MTS300 MPEG Test System.
Appendix E: ATSC Program Paradigm. This appendix describes the ATSC program
paradigm, which is the method used for allocating the values of the Packet
Identifier (PID) field of the transport packet header in a systematic manner for
ATSC transport streams.
Glossary. The Glossary contains definitions of new, uncommon, and/or unique
terms used in this manual.
Index. The Index provides a comprehensive alpha-numeric reference to the topics
covered in this manual.
xvi
MTS300 MPEG Test System Real-Time Analysis User Manual
Page 21

Manual Conventions
Preface
Throughout this manual the following typographic, symbolic, and terminology
conventions apply:
Typographic Conventions
H Bold terms are found in procedures and denote interface items that you need
to select in order to cause an event to occur. For instance, to configure
default directories the procedure would read as follows:
Select Directories from the Options menu.
In this example, even though the Options menu is an interface element, the
Directories selection is the element that displays the needed dialog box
(causes an event to occur) and is the only bold term. When interface items
are referred to outside of procedures, the terms are not boldface.
H Manual names, manual section names, and words that are defined in the text
are italicized.
H Specific input that you need to make is indicated in the text using
mono-spaced font. Unless otherwise stated, do not enter punctuation at
the end of a mono-spaced font entry.
MTS300 MPEG Test System Real-Time Analysis User Manual
xvii
Page 22

Preface
Symbols and Terminology
Conventions
This manual uses symbols and terminology consistent with the following
publications:
H For PSI elements, ISO/IEC Standard 11172 and 13818 (parts 1, 2, and 3)
H For DVB elements, ETSI Publication ETS 300 468
H For DVB-T elements, ETSI Publication TS 101 191 V1.2.1
H For ATSC elements, ATSC Document A/65
H For Windows elements, The Microsoft Manual of Style for Technical
Publications, 2nd ed.
The following ARIB and ITU-R standards were used to develop the added ARIB
and TMCC enhancements to the MTS300 system:
H ARIB STD-B10 (1.2), 1999, Service Information for Digital Broadcasting
System
H ARIB STD-B16 (1.1), 1999, Digital Receiver Commonly Used for Digital
Satellite Broadcasting Services Using Communication Satellite
H ARIB STD--B20 (1.1), Digital Broadcasting System and Related Operation-
al Guidelines for Broadcasting Satellites
H ITU-R BO. 1408, Transmission System for Advanced Multimedia Services
Provided by Integrated Services Digital Broadcasting in A Broadcasting
Satellite Channel
In cases where terms, symbols, or references are or may be ambiguous, check the
Glossary located at the back of this manual for definitions. Also, refer to the
Glossary for definitions unique to the MTS300 test system and applications.
Refer to the Windows NT online Help for definitions and explanations of
Windows NT specific terminology.
xviii
MTS300 MPEG Test System Real-Time Analysis User Manual
Page 23

Related Documents
Preface
For additional information about using MTS300 application software to monitor,
analyze, and generate MPEG-2, DVB, and A TSC data streams, refer to the
following manuals:
The MTS300 MPEG Test System Stream Creation Applications User Manual,
Tektronix part number 071-0778-XX, contains information about using the
deferred-time and real-time multiplexers, the table editors, and three smaller
applications, the Jitter Adder, DVB Coder/Decoder, and Error Injector.
The MTS300 MPEG Test System MPEG-2 DVB/ATSC System Analyzer User
Manual, Tektronix part number 071-0659-XX, contains information about using
the deferred-time MPEG-2 System Analyzer.
The MTS300 MPEG Test System Program Stream Analyzer User Manual,
Tektronix part number 071-0662-XX, contains information about using the
deferred-time Program Stream Analyzer application.
The MTS300 MPEG Test System Dolby Digital Audio Stream Analyzer User
Manual, Tektronix part number 071-0661-XX, contains information about using
the deferred-time AC-3 Audio Stream Analyzer application.
The MTS300 MPEG Test System MPEG Audio Stream Analyzer User Manual,
Tektronix part number 071-0663-XX, contains information about using the
deferred-time MPEG Audio Stream Analyzer application.
The MTS300 MPEG Test System Video Stream Analyzer User Manual, Tektronix
part number 071-0664-XX, contains information about using the deferred-time
MPEG Video Stream Analyzer application.
The MTS300 MPEG Test Options User Manual, Tektronix part number
1000-3031, contains information about using the Data Broadcast Carousel
Analyzer application, the Elementary Stream Analyzer application, and the
Multiplexer application.
The MTS300 MPEG Test System Service Manual, Tektronix part number
071-0668-XX, contains information about servicing the MTS300 system.
Refer to the MTS300 MPEG Test System Hardware and Software Installation
Technical Reference Manual (Tektronix part number 071-0667-XX) that is
delivered with each MTS300 system for the following information:
H Hardware and software installation procedures
H Instrument option, accessory, and upgrade lists
H First time operation and functional check procedures
H MTS300 system specifications and compliances
MTS300 MPEG Test System Real-Time Analysis User Manual
xix
Page 24

Preface
Software Version
Related Applications
The version numbers for the MTS300 system applications supported by this
manual are listed in a Readme.txt file located in the following two locations:
H In the root directory of the MTS300 application CD-ROM (063-3325-XX)
H In the C:\MTS300 directory on the hard drive of the MTS300 system
To verify an application version number, select About from the Help menu of
the application.
The real-time applications described in this manual are part of the suite of
software and hardware components that comprise the Tektronix MTS300 MPEG
Test System. T able i shows the program icons for each MTS300 application,
briefly describes the purposes for each application, and lists the manual name
and number that you should look to for information about that test system
component.
The applications that appear in version 6.1 Tektronix MPEG Test System
program group and Start menu depend on the system configuration and its
installed options. Table i summarizes all test system applications available in
release 6.1.
xx
MTS300 MPEG Test System Real-Time Analysis User Manual
Page 25

Table i: Tektronix MPEG Test System version 6.1 applications
Icon Application title Function User document
Master Client Continuously monitor an input bitstream for
compliance with the MPEG-2, DVB-SI, ATSC
PSIP, and ISDB/ARIB digital television
standards. Use this client to start or assign to an
input/output the following real-time applications
and servers:
AnalysisServers, MPEG and TMCC, used to
perform real-time analysis on a transport stream
input.
Expert Client, used display the results of
real-time transport stream analysis performed by
an MPEG analysis server.
Configuration Client, used to configure MPEG
analysis servers for specific errors.
MTS300 MPEG Test System
Real-Time Analysis User Manual
071-0658-XX
Preface
TMCC Expert Client, used to display the results
of real-time transport stream analysis performed
by a TMCC analysis server.
TMCC Configuration Client, used to configure
TMCC analysis servers for specific errors.
Stream Player, used to generate transport
streams from a local file.
Stream Recorder, used to capture transport
stream input.
OpenMux, used to configure and generate
transport streams from local transport st ream
and elementary stream files.
Hardware Diagnostic Perform onboard self-tests for the MPEG Test
System.
Private Syntax Interpreter Create table definitions used by the Real-Time
Analyzer to interpret private syntax sections.
MTS300 MPEG Test System
Hardware and Software Installation
Technical Reference 071-0667-XX
(Information repeated in both
manuals)
MTS300 MPEG Test System Real-Time Analysis User Manual
xxi
Page 26

Preface
Table i: Tektronix MPEG Test System version 6.1 applications (Cont.)
Icon User documentFunctionApplication title
MPEG-2 DVB/ATSC
System Analyzer
Analyze transport streams and packetized
elementary streams saved to the system disks.
MTS300 MPEG Test System
MPEG-2 DVB/ATSC System
Analyzer User Manual 071-0659-XX
TMCC Deferred--Time
Analyzer
DVB Channel Coding
and Decoding
Program Stream Analyzer Analyze MPEG program stream files. MTS300 MPEG Test System
MPEG Video Stream
Analyzer
MPEG Audio Stream
Analyzer
Dolby Digital Audio Stream
Analyzer
Analyze and save TMCC transport streams
Code and decode transport stream files to DVB
specifications.
Analyze MPEG-1 and MPEG-2 video elementary
streams files or streams extracted from the
MPEG-2 System Analyzer or Program Stream
Analyzer.
Analyze MPEG-1 and MPEG-2 audio elementary
streams files or streams extracted from the
MPEG-2 System Analyzer or Program Stream
Analyzer.
Analyze Dolby Digital (AC-3) audio elementary
stream files or streams extracted from the
MPEG-2 System Analyzer.
MTS300 MPEG Test System
Stream Creation Applications User
Manual 071-0778-XX
(Information repeated in both
manuals)
Program Stream Analyzer User
Manual 071-0662-XX
MTS300 MPEG Test System Video
Stream Analyzer User Manual
071-0664-XX
MTS300 MPEG Test System Audio
Stream Analyzer User Manual
071-0663-XX
MTS300 MPEG Test System Dolby
Digital Audio Stream Analyzer User
Manual 071-0661-XX
xxii
MPEG-2 Transport Stream
Multiplexer
TMCC Combiner The TMCC Combiner (MTS300 Option TM or
DVB Table Editor Create and edit PSI and DVB SI tabl e fi les for
ATSC Table Editor Create and edit PSI ad ATSC PSIP table files for
Create transport stream files from PSI/SI/PSIP
table files, elementary stream files, and data
files.
MTS3FTM) is a wizard that guides you through
creating a single- and multiple-stream transport
stream files for ISDB-S environments.
use with the transport stream multiplexer.
use with the transport stream multiplexer.
MTS300 MPEG Test System Real-Time Analysis User Manual
MTS300 MPEG Test System
Stream Creation Applications User
Manual 071-0778-XX
Page 27

Table i: Tektronix MPEG Test System version 6.1 applications (Cont.)
anua
X
X
Manual0710778XX
Icon User documentFunctionApplication title
ARIB Table Editor Create and edit ARIB table files for use with the
transport stream multiplexer.
Preface
Jitter Adder Add jitter to PCR data in MPEG-2 transport
stream files.
Error Injector Insert or correct errors in transport stream
packets.
Data Broadcast Carousel
Analyzer
Elementary Stream Analyzer
Multiplexer Multiplex (off-line) ATSC, MPEG --2 and DVB
ScriptPad Edit scripts to enable use of custom descriptors
Make Seamless Wizard Enable creation of seamless rransport streams.
Analyze the protocol and contents contained
within carousels. Multimedia Home Platform
(MHP) is supported through analysis of the
Application Information Table (AIT).
Analyze MPEG audio and video elementary
streams in depth. Analyze closed captions, DVB
subtitles, AAC and Dolby Digital (AC3).
transport streams.
in SI tables.
Available with Data Broadcast Carousel Analyzer
and Multiplexer applications only.
MTS300 MPEG Test System
Stream Creation Applications User
M
l 071-0778-
MTS300 MPEG Test Options User
Manual 1000-3031
Available with Multiplexer application only.
Tektronix Software
Protection
MPEG2_Part1
(ISO/IEC 13818-1)
Uninstall MTS Remove MPEG Test System software from the
MTS300 MPEG Test System Real-Time Analysis User Manual
Enter or reenter the general password to enable
licensed applications.
The international MPEG-2 system standard in
Windows Help format.
system disk.
Read This First, MTS300 MPEG
Test System Software V6.1
071-0666-XX
none
MTS300 MPEG Test System User
Manuals
xxiii
Page 28

Preface
Other Information Sources
For information about the Windows NT operating system, see the Windows NT
online Help on the MTS300 system.
For the latest information about MTS300 Real-Time Analysis features and bugs,
refer to the MTS300 Series Software Version 6.1 Read This First document that
accompanied your Tektronix MPEG Test System product.
Two sources of online information are provided with the MTS300 MPEG Test
System Stream Creation Applications. The first is the online help that accompanies each application.
H Access help topics by selecting Contents from the Help menu.
The second source of online information is the MPEG-2 stand-alone Help file.
This help file, called MPEG-2 Help, is the MPEG-2, Part 1 (Systems), standard.
The help file is installed when you install the software and an icon is placed in
your Tektronix MPEG Test System program group window.
H To display the help, double click the MPEG-2 icon in the Tektronix MPEG
Test System program group window.
xxiv
MTS300 MPEG Test System Real-Time Analysis User Manual
Page 29

Contacting Tektronix
Preface
Phone 1-800-833-9200*
Address Tektronix, Inc.
Department or name (if known)
14200 SW Karl Braun Drive
P.O. Box 500
Beaverton, OR 97077
USA
Web site www.tektronix.com
Sales support 1-800-833-9200, sel ect option 1*
Service support 1-800-833-9200, select option 2*
Technical support Email: techsupport@tektronix.com
1-800-833-9200, select option 3*
6:00 a.m. -- 5:00 p.m. Pacific time
* This phone number is toll free in North America. After office hours, please leave a
voice mail message.
Outside North America, contact a Tektronix sales office or distributor; see the
Tektronix web site for a list of offices.
MTS300 MPEG Test System Real-Time Analysis User Manual
xxv
Page 30

Preface
xxvi
MTS300 MPEG Test System Real-Time Analysis User Manual
Page 31

Getting Started
This section contains the following information to help you get started using
your Tektronix MTS300 MPEG Test System:
H Overviews of the MTS300 system and client applications
H Descriptions of the rear-panel connectors
H Procedures for starting and logging onto the MTS300 system (including
enabling/disabling Auto Logon)
H Procedures for shutting down the MTS300 system and applications
NOTE. Refer to the MTS300 MPEG Test System Hardware and Software
Installation Technical Reference manual (Tektronix part number 071-0667-XX)
that is delivered with each MTS300 system for the following information:
H Hardware installation procedures
H Instrument option, accessory, and upgrade lists
H First time operation and functional check procedures
H MTS300 system specifications and compliances
H Software installation and recovery procedures
MPEG Test System
Figure 1- 1: MTS300 MPEG Test System
MTS300 MPEG Test System Real-Time Analysis User Manual
1- 1
Page 32

Getting Started
MTS300 System Overview
The MTS300 MPEG Test System is a component of the Video Quality of
Service (VQoS) products offered by Tektronix. The MTS300 system (see
Figure 1--1) is a high-performance MPEG protocol diagnostic and analysis tool
that provides you with innovative solutions to meet the challenges of designing,
verifying, and characterizing products and systems using MPEG-2 technology.
The MTS300 system offers powerful acquisition and computational capabilities
for analyzing designs based on MPEG, DVB, ATSC, and ISDB standards. These
flexible and expandable capabilities include real-time monitoring, data rate
analysis, and Tektronix-exclusive timing analysis to help diagnose the most
challenging problems and characterize real-time performance.
NOTE. Refer to the MPEG-2, DVB, ATSC, and ISDB-S/ARIB standards for
detailed information about the syntax and semantics of each system.
The deferred-time (off-line) analysis provided by the MTS300 system helps you
fully verify compliance to standards and diagnose problems in complex transport
streams. Easy-to-use transport stream capture, playout, and on-line storage lets
you build extensive suites of test streams, and then use these streams to exercise
your designs. Additional stream editing capability, with error and jitter injection
and real--time multiplexing, gives you the ability to create and playout test
sequences that fully stress and characterize design parameters.
Primary Applications
Each test system can monitor up to two transport stream inputs simultaneously
and accepts inputs in the following electrical formats:
H ASI/M2S (the test system automatically detects the format)
H SPI (LVDS parallel); available when you order the MTS3FLV upgrade
H DHEI (GI Digicipher II): available when you order the MTS3FDE upgrade
H SSI (SMPTE 310M); available when you order the MTS3FSS upgrade
The MTS300 system was designed for the following applications:
H Evaluation and verification of MPEG, DVB, ATSC and ISDB designs
Design and verification of digital-video set-top boxes (STBs)
H
H Stress and characterization of electrical circuits and ICs developed for
products using MPEG-2 compressed digital-video technology
1- 2
MTS300 MPEG Test System Real-Time Analysis User Manual
Page 33

Getting Started
Key Features
The MTS300 system provides the following key features:
H Real-time monitoring and compliance testing of MPEG, DVB, ATSC and
ISDB transport streams for complete application flexibility
H Dolby Digital AC--3 compliance testing and AAC stream monitoring for
testing advanced audio capabilities
H Tektronix-exclusive PCR overall jitter, drift and offset measurements allow
you to diagnose the most challenging real--time performance problems
H Real-time analysis of transport streams used in data broadcasting applica-
tions based on ISO/IEC 13818-6 (DSM-CC) and EN 301 192 standards
H Analysis of Mega-frame Initialization Packets (MIPs), specified in the DVB
TS 101 191 standard
H Detailed off-line analysis of transport streams, program streams and
elementary streams available to fully verify design performance
H Logging of user-selected analysis events to tab-delimited text files for record
keeping and further analysis
H ASI/M2S, SPI (LVDS), SMPTE310M, and DHEI interfaces available to
support a variety of design configurations
H SNMP agent allows you to control the instrument from a remote location
H Private syntax table editor allows you to describe the syntax of a private
table
H Optional real-time multiplexing of elementary and transport streams
provides flexible real-time manipulation of stream content and parameters
H Optional off-line multiplexing of ATSC, MPEG-2 and DVB transport
streams
H Optional TMCC data testing and transport stream creation for ISDB
environments
H Optional analysis of the protocol and contents contained within carousels;
Multimedia Home Platform (MHP) is supported through analysis of the
Application Information Table (AIT)
H Optional in-depth analysis of MPEG audio and video elementary streams,
closed captions, DVB subtitles, AAC and Dolby Digital (AC3)
H Capture (manual and triggered), playback, and on-line storage of transport,
program and elementary streams
MTS300 MPEG Test System Real-Time Analysis User Manual
1- 3
Page 34

Getting Started
H Optional editing capability allows you to create custom transport streams and
inject errors or jitter to fully stress your design
H Modular architecture allows you to easily upgrade in the future
H Rackmount configuration kit (drawer-style) included; an optional rackmount
cabinet is available
H Microsoft NT operating system provides robust networking, performance
and functionality
System Architecture
The MTS300 system uses a client/server architecture consisting of a Server
Manager, two Analysis Server pairs (each pair consists of one MPEG analysis
server and one TMCC analysis server), and the following client applications:
Master Client, Expert Client, Configuration Client, Stream Recorder, Stream
Player, TMCC Expert Client, and TMCC Configuration Client
Combined, these client/server modules enable you to monitor multiple transport
stream inputs simultaneously, perform in-depth analyses on one transport stream
input, and to configure the monitoring and reporting parameters. The system is
tightly integrated, making it easy to use for experts and non-experts alike.
Server Manager. The Server Manager is the process that makes the results of the
Analysis Servers and other real-time application servers available to Master
Clients. The Server Manager starts automatically when you start the transport
monitor. Only one Server Manager can run on a test system.
The Server Manager process interacts with the following entities:
H The Analysis Server sends analysis results (called traps)totheServer
Manager.
H The Stream Player, Stream Recorder, and optional OpenMux (MTS300,
Option OM) servers send state traps to the Server Manager.
1- 4
H The Master Client displays the data collected by the Server Manager .
MTS300 MPEG Test System Real-Time Analysis User Manual
Page 35

Getting Started
Analysis Servers. The Analysis Server is the process that actually analyzes
transport stream inputs. Each Analysis Server process consists of one MPEG
Analysis Server and one TMCC Analysis Server. Each MTS300 system can
support up to two Analysis Server processes of each type simultaneously.
The Analysis Server processes interact with the following entities:
H The Server Manager collects the Analysis Server results (called traps).
H The Expert Client displays the results of the MPEG Analysis Server directly.
Likewise, the TMCC Expert Client displays the results of the TMCC
Analysis Server .
H The Configuration Client sets the monitoring and analysis parameters for
each MPEG Analysis Server process operating on the inputs to the MTS300
system. Likewise, the TMCC Configuration Client sets the monitoring and
analysis parameters for each TMCC Analysis Server process.
Master Client. The Master Client application provides an intuitive interface for
controlling and monitoring the status of the I/O ports on the MTS300 system.
You can run only one Master Client on each MTS300 system. In a network
environment, if a remote MTS300 system has a Master Client open, you must
shut down the remote Master Client before you can connect your local Master
Client to the Server Manager running on the system.
NOTE. Each MTS300 system is limited to operating two Analysis Server
processes of each type at a time, and can run only one Stream Player, one Stream
Recorder, and one OpenMux application at a time. In addition, the MTS300
system is limited to an aggregate data rate of 140 Mbs between all operating
applications.
From the Master Client, you can perform the following tasks:
H Monitor and analyze MPEG transport streams in real time using the Expert
Client and Configuration client applications.
H Monitor and analyze single- and multi-program TMCC transport streams in
real time using the TMCC Expert Client and TMCC Configuration Client
applications.
H Record and playback MPEG and TMCC transport streams using the Stream
Recorder and Stream Player applications.
H Generate multiplexed transport streams in real time using the OpenMux
application (MTS300, Option OM).
MTS300 MPEG Test System Real-Time Analysis User Manual
1- 5
Page 36

Getting Started
The Master Client uses three areas to display different type of information:
H The I/O Port Manager panel displays icons representing real-time application
servers and the input and output ports configured on your test system.
H The Services panel displays icons for the services (also called programs)
encoded in the transport stream you are monitoring.
H The Details panel displays icons indicating the type, status, and severity of
errors on a transport stream or service.
Expert Client. The Expert Client application allows you to analyze a single
MPEG transport stream in greater detail. You will use the Expert Client as your
primary tool to help troubleshoot errors in your digital transmission system.
The Expert Client characteristics are shown in the following list:
H Graphical displays that show the structure (hierarchy) of the input transport
stream and display characteristics of each component of the input stream
(for example: PID and type allocation, section rate analyses, and timing
analyses).
H Report views that indicate the types of errors recorded by the Analysis
Server and the characteristics of the input stream.
H Error views that show specific errors recorded for the various components
of the transport stream; for instance, PMT section rate errors and ETR290
errors.
The Expert Client can display the results of only one MPEG Analysis Server
(input) at a time.
Configuration Client. The Configuration Client allows you to perform the
following tasks:
H Specify to which standard you are testing: MPEG-2, DVB, ATSC, or ISDB.
H Set, remove, or modify the probes that test transport streams for valid syntax
and semantics and rates.
H Specify the way in which errors are reported in both the Expert and Master
Clients. You can configure each probe to report an error as Critical, Major,
Minor, Warning, or as information only.
H Specify the types of transport stream events that are recorded using the Data
Logging function. You can also set the maximum file size and time period of
each log file.
1- 6
MTS300 MPEG Test System Real-Time Analysis User Manual
Page 37

Getting Started
H Stop and restart an MPEG Analysis Server running on a MTS300 system.
H Set passwords on specific inputs that prevent others from changing the
Analysis Server configuration for that input.
H Set parameters for capturing part of an input transport stream.
Stream Recorder Client. The Stream Recorder application allows you to record a
transport stream onto the hard drive of the MTS300 system using a VTR-like
interface. You can specify the stream format, duration, file name, and location of
the recorded file.
The Stream Recorder is governed by the following MTS300 system limits:
H Only one Stream Recorder can be launched at a time on each MTS300
system.
H The Stream Recorder can only record transport stream files with data rates
between 1 Mbs and 140 Mbs onto the hard drive of the MTS300 system on
which the application was launched. You cannot record remote transport
stream files or use a remote Stream Recorder to record a local transport
stream file.
NOTE. It is recommended that you store transport stream files on the SCSI hard
drives (E: drive) of the MTS300 system. The response time of the C: drive on the
MTS300 system is limited and may affect the performance of the Stream
Recorder and Stream Player applications when you try to capture or play back
streams with bitrates greater than 30 Mbs.
H If the SCSI hard drives (E:) are 90% or more full, it is recommended that
you use a defrag utility to defragment the SCSI drives. You can use any
defrag utility that is compatible with the Microsoft Windows NT 4.0
operating system.
H The MTS300 system is limited to an aggregate data rate of 140 Mbs between
all operating applications. You may have to shut down other MTS300
applications if you need to record a transport stream with high data rates.
MTS300 MPEG Test System Real-Time Analysis User Manual
1- 7
Page 38

Getting Started
Stream Player Client. The Stream Player application allows you to play back
transport streams saved on the hard disk of the MTS300 system using a
VTR-like interface. You can specify which portion of the transport stream to play
back, the rate of the transport stream (you can also apply an external clock to set
the rate), the format (ASI or M2S) of the transport stream, and the playback
mode (one time or loop).
The Stream Player is governed by the following MTS300 system limits:
H Only one Stream Player can be launched at a time on each MTS300 system.
H The Stream Player can only play back transport stream files with data rates
between 1 Mbs and 140 Mbs stored on the hard drive of the MTS300 system
on which the application was launched. You cannot play back remote
transport stream files or use a remote Stream Player to play back a local
transport stream file.
NOTE. It is recommended that you store transport stream files on the SCSI hard
drives (E: drive) of the MTS300 system. The response time of the C: drive on the
MTS300 system is limited and may affect the performance of the Stream
Recorder and Stream Player applications when you try to capture or play back
streams with bitrates greater than 30 Mbs.
H If the SCSI hard drives (E:) are 90% or more full, it is recommended that
you use a defrag utility to defragment the SCSI drives. You can use any
defrag utility that is compatible with the Microsoft Windows NT 4.0
operating system.
H The MTS300 system is limited to an aggregate data rate of 140 Mbs between
all operating applications. You may have to shut down other MTS300
applications if you need to play back a transport stream with high data rates.
1- 8
MTS300 MPEG Test System Real-Time Analysis User Manual
Page 39

Getting Started
TMCC Expert Client. The TMCC (Transmission and Multiplexing Configuration
Control) Expert Client application allows you analyze the TMCC data of an
ISDB-S/ARIB-compliant transport stream input in real time. You can also
analyze an ISDB-S/ARIB-compliant transport stream file stored on your local
disk.
The TMCC Expert client has the following characteristics:
H Indicates the presence of sync bytes (0x47 for TMC C basic streams and W1,
W2, or W3 sync bytes for TMCC data streams)
H Displays the syntax of TMCC data
H Displays Slot, TSID, TS Name, and Modulation mode information
H Displays information, warning, and error messages
H Indicates the presence of TMCC alarm and update flags in the transport
stream
H Displays the overall stream rate
The TMCC Expert Client displays the results of only one TMCC Analysis
Server (input) at a time. You can connect more than one TMCC Expert Client to
the same TMCC Analysis Server input from your own instrument, or you can
connect to an Analysis Server from a remote MTS300 system.
MTS300 MPEG Test System Real-Time Analysis User Manual
1- 9
Page 40

Getting Started
TMCC Configuration Client. The TMCC (Transmission and Multiplexing
Configuration Control) Configuration Client is used to configure the analyses
performed by the TMCC Analysis Server. The results of the analyses are
displayed in the TMCC Expert Client.
NOTE. Only one TMCC Configuration Client at a time can set parameters on a
TMCC Analysis Server. If a TMCC Configuration Client is already connected to
a TMCC Analysis Server, you can view the current settings, but you cannot
change them.
The settings in the TMCC Configuration Client only configure the measurements
made by the TMCC Analysis Server, which are displayed in the TMCC Expert
Client application. The TMCC Configuration Client settings do not affect the
configuration settings in the Configuration Client, which is used to configure the
measurements made by the MPEG Analysis Server.
The TMCC Configuration Client has the following characteristics:
SNMP Capabilities
H Uses multiple configuration panels to group related configuration functions.
H Uses a hierarchic navigation panel to select one of the multiple configuration
panels.
H Configures the TMCC Analysis Servers to operate in either TMCC basic or
TMCC data stream modes
H Enables you to specify a transport stream ID to analyze using the MPEG-2
Analysis Server (only in the TMCC data stream mode)
The MTS300 system includes SNMP management information bases (MIB)
installed at the following directory location: C:\Mib\. The Tektronix MIB is a
textual description of the Analysis Server objects (functions and parameters) that
can be monitored and controlled via SNMP. Refer to Appendix C: Networking
for more information about the networking requirements of the MTS300 system.
The MIB files are used by the real-time analysis applications and the Stream
Player, Stream Recorder, and OpenMux (MTS300, Option OM only)
applications.
The MIB file pairs for each application, for example, the RTAv1.mib and
RTAv2.mib files, are used for SNMPv1 and SNMPv2 systems respectively.
1- 10
The operations in SNMP are limited to retrieving the value of management
information, modifying the value of management information, and reporting an
event.
MTS300 MPEG Test System Real-Time Analysis User Manual
Page 41
Rear Panel Connectors
Power
Getting Started
Refer to the MTS300 MPEG Test System Hardware and Software Installation
T echnical Reference manual (Tektronix part number 071-0667-XX) that came
with the instrument for hardware and software installation procedures.
This section describes the rear-panel input and output connectors. Refer to Front
Panel on page 2--12 for a description of the front-panel controls.
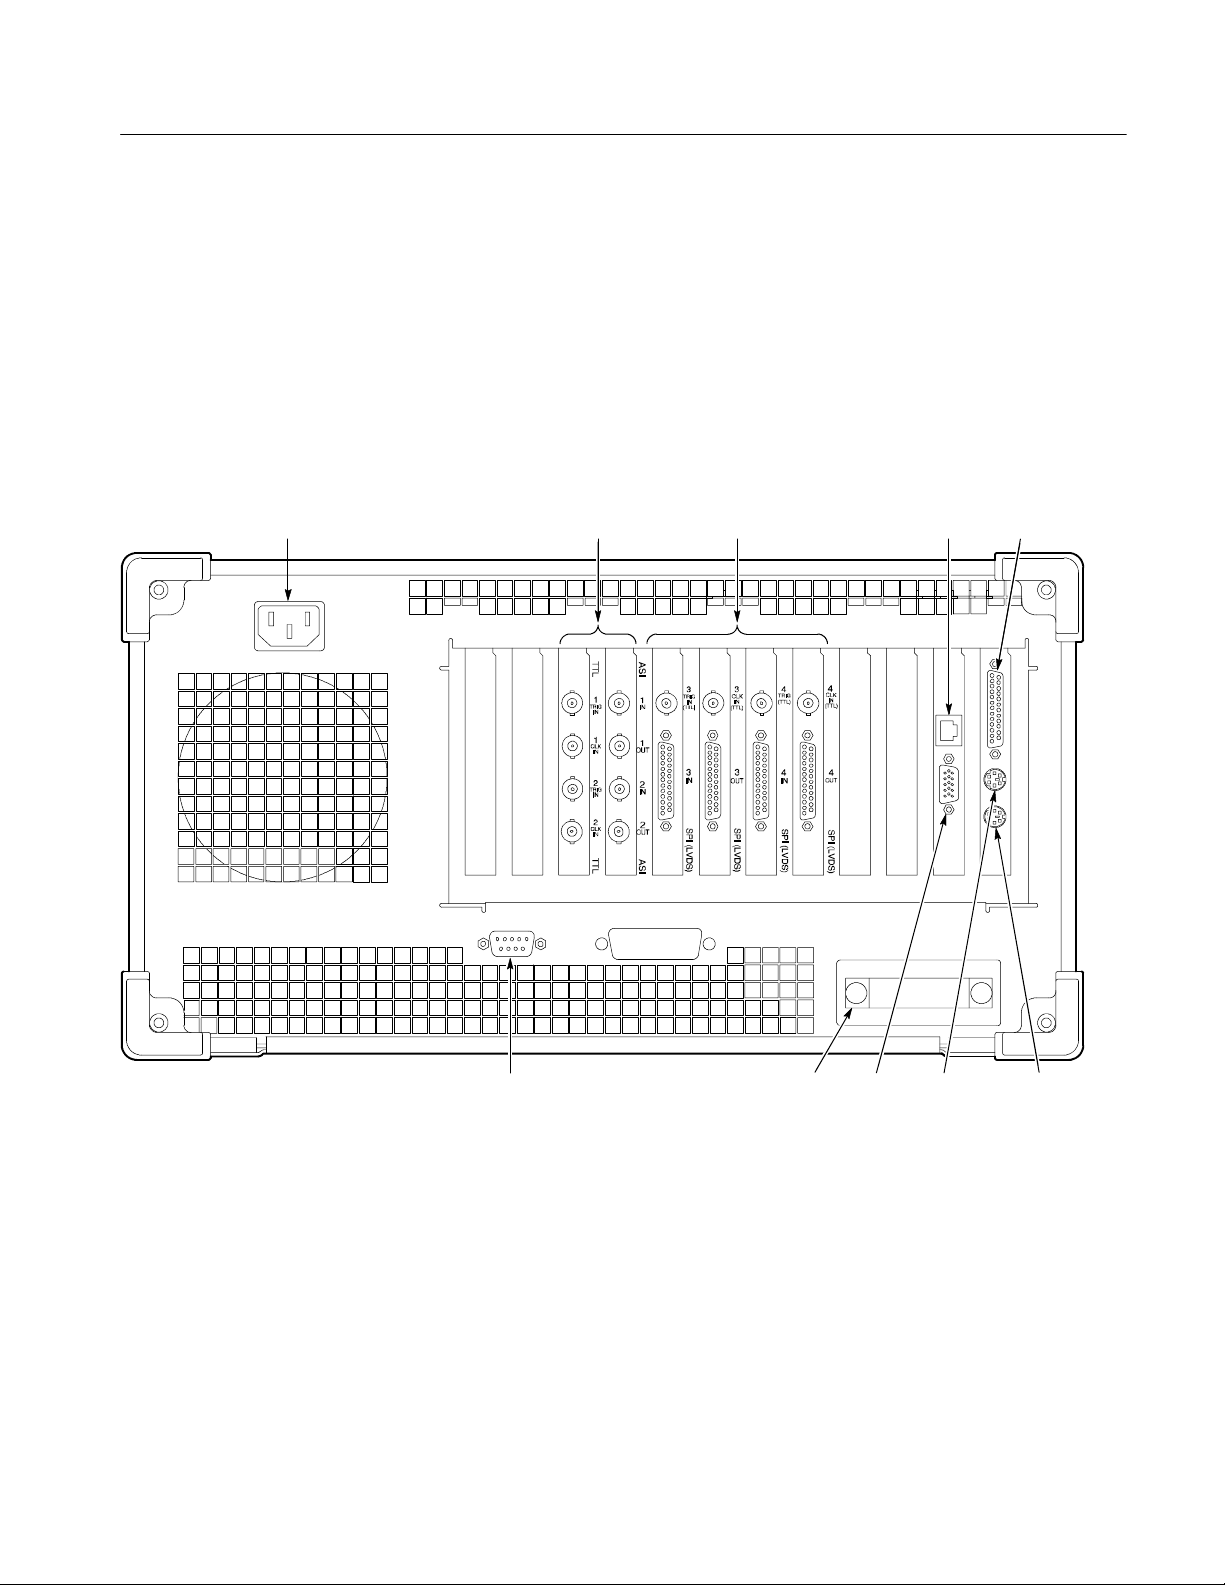
Figure 1--2 shows the locations of the connectors on the MTS300 rear panel.
SPI (LVDS) I/O
ASI I/O
(Option MTS3FLV)
Ethernet
Parallel Port
RS-232
COM Port 1
Figure 1- 2: Typical MTS300 system rear panel
MTS300 MPEG Test System Real-Time Analysis User Manual
SCSI
MouseKeyboardSVGA
1- 11
Page 42

Getting Started
Table 1--1 describes the transport stream, network, and peripheral device
connectors.
Table 1- 1: Rear-panel connectors
Connector Description
Transport stream input / output
75 Ω BNC connectors for the following signal formats:
ASI Input/Output
LVDS Input/Output
DHEI Input/Output
SSI Input/Output
Monitor 15-pin female high density-D-sub connector for SVGA monitor
Keyboard Mini-DIN connectors for PS2 compatible keyboard (on rear
Mouse Mini-DIN connectors for PS2 compatible mouse (on rear and
Printer 25-pin sub-D connector for parallel communication
LAN (Ethernet) 10 Base-T/100 Base-T, RJ45 connector for Ethernet
RS-232/422 9-pin D-sub type connector for serial communication
SCSI Standard, PC compatible Ultra-Wide SCSI port, 68 Pins
Standard configuration accepts both Burst and Packet mode
ASI formats and M2S input
LVDS, DHEI, and SSI I/O interfaces can be ordered as an
upgrade to the standard configuration
Each output is an active loop-through of the corresponding
input or Stream Player/Stream Recorder output
and side panels)
side panels)
communications
1- 12
MTS300 MPEG Test System Real-Time Analysis User Manual
Page 43

Getting Started
Figure 1--3 shows the input and output (I/O) connectors. A description of each
connector follows the illustration. Use the I/O ports suited for your operating
environment and signal sources.
SPI (LVDS) I/O
ASI I/O
(Option MTS3FLV)
Figure 1- 3: MTS300 inputs and outputs
MTS300 MPEG Test System Real-Time Analysis User Manual
1- 13
Page 44

Getting Started
Input
Output
Trigger Input
The MTS300 system accepts ASI (M2S) serial input. The MTS300 system
automatically detects the source type. Optionally, you can purchase SPI (LVDS),
DHEI (Digicipher II), and SSI (SMPTE 310M) input interfaces.
The MTS300 system can output all or part of the input stream through the
parallel and serial (ASI) connectors.
With data input through the ASI connector, the serial output can be enabled or
disabled. The Analysis Server or Stream Recorder can enable/disable the loop
through.
The Serial output stream is always equivalent to the input stream and is not
affected by filtering selections made on the Filtering configuration panel of the
MTS300 system Configuration Client.
The trigger input accepts a TTL level (0 to +5 V) signal you can use to control
capture of the MTS300 system input stream to the data storage system. You can
configure the system to start/stop data capture on either the rising edge (low to
high transition) or the falling edge (high to low transition) of the trigger signal.
Refer to Event Configuration Panel on page 3--197 for further information on
capturing transport stream inputs.
Clock Input
Refer to Manually Capturing a Transport Stream on page 3--100 for information
on manually capturing transport stream input using the Expert Client.
Each output port has a corresponding clock input which can be used to clock the
transport stream output when you are using Stream Player . The clock rate is at
the byte rate of the transport stream for ASI and SPI signal formats, and at the bit
rate for DHEI and SSI signal formats.
1- 14
MTS300 MPEG Test System Real-Time Analysis User Manual
Page 45

Starting the MTS300 System
Perform the following procedure to power on the MTS300 system:
1. Connect the power cord to the rear-panel power connector.
2. Press the On/Stby switch to power on the instrument. Figure 1--4 shows the
switch location.
Getting Started
MPEG Test System
On/Stby switch
Figure 1- 4: On/Stby switch
3. The Windows NT initialization process takes up to two minutes. Under
normal circumstances, no action is required until the Begin Logon message
appears.
4. When the Begin Logon message appears, simultaneously press the
CTRL + ALT + Delete keys to open the Logon Information dialog box.
5. Perform the procedure in Logging On startingonpage1--16.
MTS300 MPEG Test System Real-Time Analysis User Manual
1- 15
Page 46

Getting Started
Logging On
The MTS300 system provides three user name/password combinations you can
use to logon to the instrument. Table 1--2 lists the default user name and
passwords supplied with the MTS300 system.
Table 1- 2: Default user names and passwords
User name Password Description
MTS300 No password Intended for the standard user and for normal instrument
operation. Users logging on as “MTS300” have full access to
files and applications.
Guest No password Intended for users with limited system knowledge. Users
logging on as “Guest” have limited access to files and
applications.
Administrator MPEG2 Intended for the master user responsible for software
upgrades or reinstallations. Users logging on as “Administrator” have full administrative rights to all system files and
applications. You must use this user name and password to
perform any software upgrades or reinstallations.
CAUTION. To prevent potential network conflicts, it is strongly recommended that
you do not use the Administrator user name and password for normal instrument
operation. The administrator user logon includes all administrative privileges
and may allow administrative access within the network.
To log on to the test system the first time, use these steps:
1. Enter MTS300 in the User name box.
2. Leave the Password box blank, and press ENTER (these are the default
values set at the factory). Use this user name for most of your work.
Changing the Passwords. After you logon to the MTS300 system using a user
name and password combination, you can change the password for that user
name. Refer to the Windows NT online help for instructions.
Refer to Setting, Resetting, and Disabling Auto Logon on page 1--17 if you want
to enable automatic logon to Windows NT when you power-on the instrument.
1- 16
MTS300 MPEG Test System Real-Time Analysis User Manual
Page 47

Getting Started
Setting, Resetting, and
Disabling Auto Logon
The Auto Logon option allows you to select a user name and password that the
MTS300 system will use to automatically log on to Windows NT when you
power-on the instrument. This section contains two procedures. The first
procedure initializes the Auto Logon option and changes an existing Auto Logon
user name and password. The second procedure disables the Auto Logon option
(requiring the entry of a user name and password each time the instrument is
powered on).
Setting and Resetting Auto Logon. Perform the following procedure to set or reset
the automatic logon option:
1. Boot up the MTS300 system (without a recovery CD in the CD-ROM drive).
2. Select Run from the Windows NT Start menu, and then click Browse in the
Run dialog box.
3. The Auto Logon utility is located in two directory locations:
H D:\Tools\Autologn.exe of the MTS300 MPEG Test System Operating
System Recovery CD
H C:\Mts300\Bin\AutoLogon.exe on the MTS300 system
4. In the Browse dialog box, specify one of the directory paths shown above,
andthenclickOpen.
5. Click OK in the Run dialog box to run the selected Auto Logon utility. The
Auto Logon dialog box will open.
CAUTION. If the MTS300 system is already setup to Auto Logon, entering a new
user name and password will overwrite the existing user name and password
used by the MTS300 system to Auto Logon.
T o prevent potential network conflicts, it is strongly recommended that you do
not use the Administrator user name and password for Auto Logon.
6. Use the Auto Logon dialog box to enter the user name and password that the
MTS300 system will use to automatically logon to Windows NT when the
instrument boots.
7. Click OK to apply the Auto Logon setting. The next time the MTS300
system boots, the new Auto Logon settings will be used.
MTS300 MPEG Test System Real-Time Analysis User Manual
1- 17
Page 48

Getting Started
Disabling Auto Logon. Perform the following procedure to disable Auto Logon
(requiring the entry of a user name and password each time the instrument is
powered on):
1. Boot up the MTS300 system (without a recovery CD in the CD-ROM drive).
2. Select Run from the Windows NT Start menu.
3. Enter regedt32 in the Run dialog box, and then click Open. This opens the
Registry Editor window.
4. In the Registry Editor window, select the HKEY_LOCAL_MACHINE on
Local Machine panel.
5. In the HKEY_LOCAL_MACHINE on Local Machine panel, select
Winlogon in the following directory path:
HKEY_LOCAL_MACHINE\SOFTWARE\Microsoft\Windows NT\CurrentVersion
6. After you select Winlogon, the right pane of the HKEY_LOCAL_MACHINE on Local Machine panel displays the contents of the file. Highlight
the line in the right pane that starts DefaultUserName:, and then select
Edit | Delete from the menu.
7. Click Yes in the Warning message box.
8. Highlight the line in the right pane that starts DefaultPassword:,andthen
select Edit | Delete from the menu.
9. Click Yes in the Warning message box.
10. Select Registry | Exit from the menu to close the Registry Editor window.
11. The next time the MTS300 system boots, Auto Logon will be disabled and
the user will be asked for user name and password to logon to Windows NT.
CAUTION. To prevent the loss of data, if you change the default user names and
passwords, secure the new names in a safe place. If you forget your user-defined
user names and passwords and cannot logon to the MTS300 system, you will
have to reinstall the operating system software which will result in the loss of all
data on the hard drives of the MTS300 system.
1- 18
MTS300 MPEG Test System Real-Time Analysis User Manual
Page 49

Getting Started
Starting MTS300 System
Applications
After you have logged on, the Tektronix MPEG Test System program group
window appears as shown below. Double-click the appropriate application icon
to launch the desired application.
NOTE. The example below shows an MTS300 system program group with most of
the available options installed. Depending on which options you ordered with
your MTS300 system, your program group may not contain all of the application
icons shown below.
NOTE. You must open the Master Client application to access the Expert Client,
Configuration Client, Stream Recorder, and Stream Player applications.
See the Tutorial beginning on page 2--15 for procedures on connecting to a
Server Manager and configuring a workspace, or see related procedures in
Master Client Reference beginning on page 3--11.
MTS300 MPEG Test System Real-Time Analysis User Manual
1- 19
Page 50

Getting Started
Shutting Down the MTS300 System
This section contains information about how to exit MTS300 system applications and how to shutdown the MTS300 system.
Exiting MTS300 System
Applications
Shutting Down the
MTS300 System
To exit an program monitor application, select Exit/Quit from the File menu or
click the close button in the upper-right corner of the application window.
Close
button
There are three methods to shut down the MTS300 system: soft power down,
standard Windows NT power down, and hard power down. For the standard and
hard power-down methods, it is strongly recommended that you exit all MTS300
applications prior to initiating an instrument power down.
Soft Power Down. The MTS300 system is shipped from the factory with a soft
power-down capability enabled. The soft power-down capability allows you to
directly exit Windows NT without closing the MTS300 applications first. The
MTS300 system will automatically close all open applications and put the
instrument into standby mode.
To soft power-down the MTS300 system, perform the following steps:
1. Press and release the On/Stby switch to initiate the soft power-down
process. Some applications will prompt you to save unsaved data before
exiting.
1- 20
2. After the MTS300 system goes into standby mode, you can restart the
instrument by pressing the On/Stby switch.
3. To completely remove power to the instrument, disconnect the power cord at
the rear panel.
NOTE. If the soft power-down feature does not work properly, you can restore the
Soft Power-Off Driver by performing the procedure located in the MTS 300
MPEG Test System Hardware and Software Installation Technical Reference
manual (Tektronix part number 071-0667-XX) supplied with the MTS300 system.
MTS300 MPEG Test System Real-Time Analysis User Manual
Page 51

Getting Started
Standard Windows NT Power Down. To power down the MTS300 system during
normal instrument operations, perform the following standard Windows NT
power down procedure:
1. Exit all open MTS300 applications.
CAUTION. To prevent data loss, exit all open MTS300 applications before
powering down the instrument. Some applications will prompt you to save
unsaved data before exiting.
2. After the MTS300 applications are closed, shut down Windows NT by
selecting Shut Down from the Windows NT Start menu as shown below.
CAUTION. To prevent data loss and possible system problems during subsequent
Windows NT initializations, always exit Windows NT before you power dow n the
MTS300 system. Wait until the message “It is now safe to turn off your computer” appears before you press the On/Stby switch.
3. Select Shut down the computer? in the resulting Shut Down Windows
dialog box shown below, and then click Yes.
4. After the Shutdown Computer window appears with the message “It is now
safe to turn off your computer,” press the On/Stby switch to put the MTS300
system into standby mode.
5. After the MTS300 system goes into standby mode, you can restart the
instrument by pressing the On/Stby switch.
6. To completely remove power to the instrument, disconnect the power cord at
the rear panel.
MTS300 MPEG Test System Real-Time Analysis User Manual
1- 21
Page 52

Getting Started
Hard Power Down. You can use the hard power-down capability to immediately
power-down the MTS300 system in an emergency situation such as fire.
CAUTION. To prevent data loss and the corruption or deletion of application and
system files, do not perform this procedure. Use the following procedure only if
all other attempts to shut down the MTS300 system have failed.
Using this hard power down procedure will likely cause file problems. When you
use this method to power down the MTS300 system, the next time the instrument
is powered on, the operating system will use the Scan Disk utility to perform a
check for missing or corrupt files. You may be prompted to reinstall the
operating system or application software.
To hard power-down the MTS300 system, perform the following steps:
1. Press and hold the On/Stby button for about 3 or 4 seconds.
2. After the MTS300 system goes into standby mode, you can restart the
instrument by pressing the On/Stby switch. Read the power-on messages for
information about possible missing or corrupted files.
3. To completely remove power to the instrument, disconnect the power cord at
the rear panel.
1- 22
MTS300 MPEG Test System Real-Time Analysis User Manual
Page 53

Operating Basics
Functional Overview
NOTE. If you are not familiar with the Windows NT 4.0 operating system, review
the Windows NT online help.
This section provides a functional overview of the MTS300 MPEG Test System
client modules and a tutorial that will show you how the modules work together.
The rear-panel connectors are described more completely in the MTS300 MPEG
Test System Hardware and Software Installation Technical Reference. A brief
description of the I/O connectors is provided in Getting Started beginning on
page 1--11.
Functional Overview describes the following MTS300 applications:
H The Master Client application monitors transport page 2--2
stream inputs at various levels of detail.
H The Expert Client application analyzes in detail the page 2--3
characteristics of a transport stream input and the
errors occurring on that input.
H The Configuration Client application sets analysis page 2--5
probes on transport stream inputs.
H The Stream Player Client application outputs a transport page 2--6
stream using the MTS300 rear-panel outputs.
H The Stream Recorder Client application captures part page 2--7
of a transport stream to the SCSI drives.
H The TMCC Expert Client application analyzes in detail the page 2--9
characteristics of a TMCC transport stream input and the
errors occurring on that input.
H The TMCC Configuration Client application sets analysis page 2--11
probes on TMCC transport stream inputs.
H Front Panel describes the front-panel controls. page 2--12
MTS300 MPEG Test System Real-Time Analysis User Manual
2- 1
Page 54

Operating Basics
Master Client
The Master client views and elements enable you to monitor the results of the
analyses being performed by Analysis Servers one or two transport stream
inputs. See Figure 2--1.
Address bar
Selection
Indicator bar
Port Manager
panel
Services panel
Error gauge
Details panel
Figure 2- 1: The Master client application window
Note the following characteristics of the Master client window in Figure 2--1:
H The Port Manager panel shows the inputs configured for the test system to
which you are connected. In Figure 2--1, an Analysis Server is on I/O#1 is
monitoring a transport stream being generated by the Stream Player on
I/O#2.
H The Address bar shows that the Master client is connected to the Server
Manager running on carnac.
H The Selection Indicator bar shows the currently selected items in the Port
Manager and Services panels.
H The Services panel shows the services encoded on the input selected in the
Multiplex panel.
2- 2
MTS300 MPEG Test System Real-Time Analysis User Manual
Page 55

Operating Basics
H The Details panel shows the status, types, and severity of errors occurring on
the currently selected service or multiplex.
H The Error gauge displays the severity of the most recent error for the service
(or multiplex) displayed in the Details panel.
See Master Client Reference for more detailed instruction on using the Master
client. See the tutorial later in this section for an introduction to using the Master
client.
Hierarchic
view
Client
area
Report view
toolbar
Expert Client
The Expert client views and elements show the detailed results of analyses being
performed on one transport stream input. See Figure 2--2.
Address bar
Hierarchic panel of
the Report view
Figure 2- 2: The Expert client application window
MTS300 MPEG Test System Real-Time Analysis User Manual
Messages panel of
the Report view
2- 3
Page 56

Operating Basics
Note the following characteristics of the Expert Client window in Figure 2--2:
H The Hierarchic view shows the structure of the transport stream you are
monitoring. The hierarchy shown is based on the transport stream elements.
For instance, since the Program Map Table (PMT), and the program
elements the PMT references, are referenced by the Program Allocation
Table (PAT), the PMT icons are shown subordinate to the PAT icon.
H The Address bar shows that the Expert client is connected to the Analysis
Server analyzing the transport stream being input through I/O#1 on novo2.
H The Client area is displays the Program Allocation panel, which is one of the
panel in the Statistics view. The Statistics view panels display statistical
information about the input stream to which the Expert client is connected.
Other views can also be displayed in the Client area. These views are
accessed using shortcut menus displayed when you right-click an icon in the
Hierarchic view.
H The Messages panel of the Report view shows the errors occurring on the
input selected in the Hierarchic panel of the Report view. You can display
more detail about a specific error by double-clicking the line on which the
error is reported.
H The Hierarchic panel of the Report view allows you to select different ways,
or modes, of displaying errors or statistics about the transport stream being
analyzed. The mode of the Report view is determined using the toolbar to
the left. The current mode is Program and FUN TV is selected.
H The Report view toolbar allows you to change the mode of the Report view.
Using this toolbar you can display errors grouped in one of four logical
modes: by program, ETR290 priority, error type, or error severity.
2- 4
MTS300 MPEG Test System Real-Time Analysis User Manual
Page 57

Operating Basics
Configuration Client
Navigation
panel
Configuration
panel
The Configuration client views and elements allow you to quickly and easily set,
modify, and remove probes for analyzing and monitoring transport stream inputs.
See Figure 2--3.
Address bar
Selection Indicator bar
Figure 2- 3: The Configuration client application window
Note the following characteristics of the Configuration client window in
Figure 2--3:
H The Navigation panel allows you to quickly choose the category of error for
which you want the Analysis Server to probe.
H The Address bar shows that the Configuration client is connected to the
Analysis Server that is analyzing the transport stream being input through
I/O#2 on oxford6.
H The Selection Indicator bar shows the item currently selected in the
Navigation panel.
H The Configuration panel allows you to specify probes or configure analyses
for the Analysis Server indicated in the address bar. This panel changes
depending on the item selected in the Navigation panel.
MTS300 MPEG Test System Real-Time Analysis User Manual
2- 5
Page 58
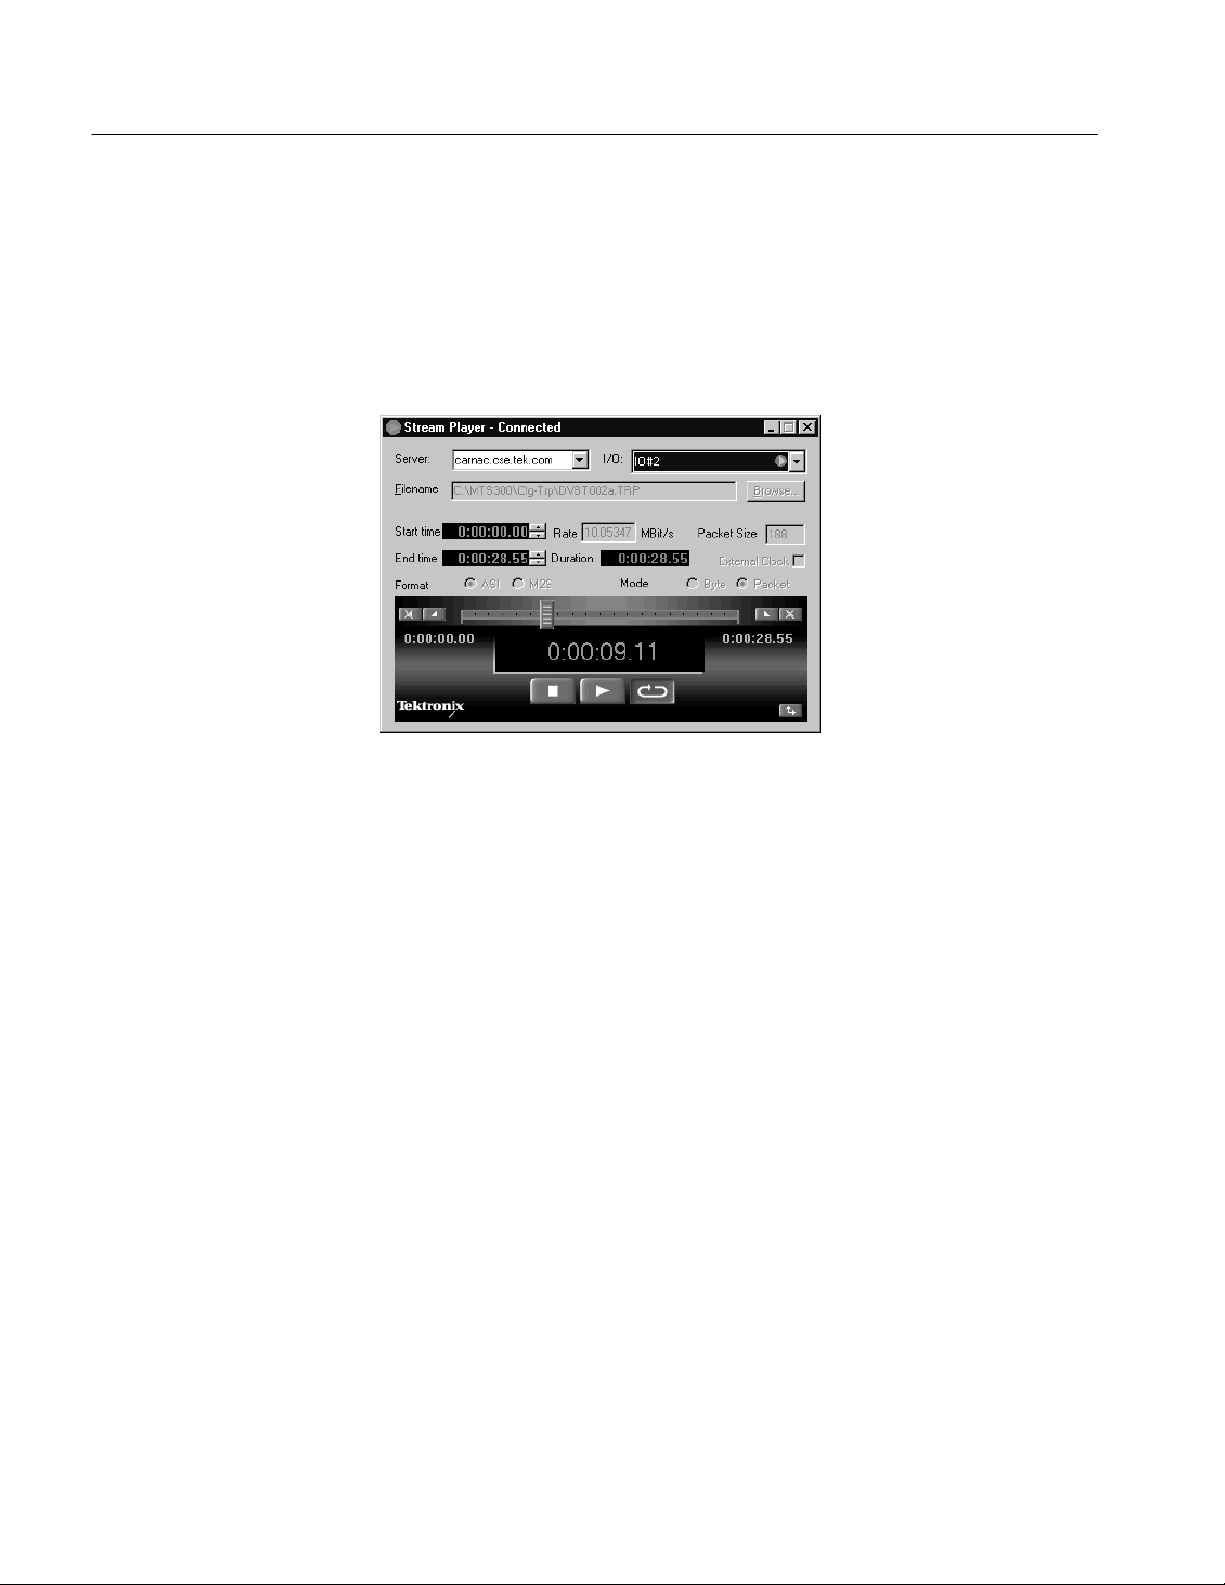
Operating Basics
Stream Player Client
The Stream Player application allows you to play back transport streams saved
on the hard disk of the MTS300 system using a VTR-like interface. See
Figure 2--4. You can specify which portion of the transport stream to play back,
the rate of the transport stream (you can also apply an external clock to set the
rate), the format (ASI or M2S) of the transport stream, and the playback mode
(single play or loop play).
Figure 2- 4: The Stream Player client application window
Note the following characteristics of the Stream Player client window in
Figure 2--4:
H The Server address boxes contain the name or IP address of the server and
the I/O port number to which the Stream Player is connected. You can use
the text boxes to connect to a different MTS300 system or to a different I/O
port number.
H The Filename indicates the name and location of the transport stream file
currently being output.
H The Start Time and End Time are editable fields that you can use to limit the
part of the transport stream file that you will output. The default is to output
the complete file.
H The Duration indicates how long the specified section will play.
2- 6
MTS300 MPEG Test System Real-Time Analysis User Manual
Page 59
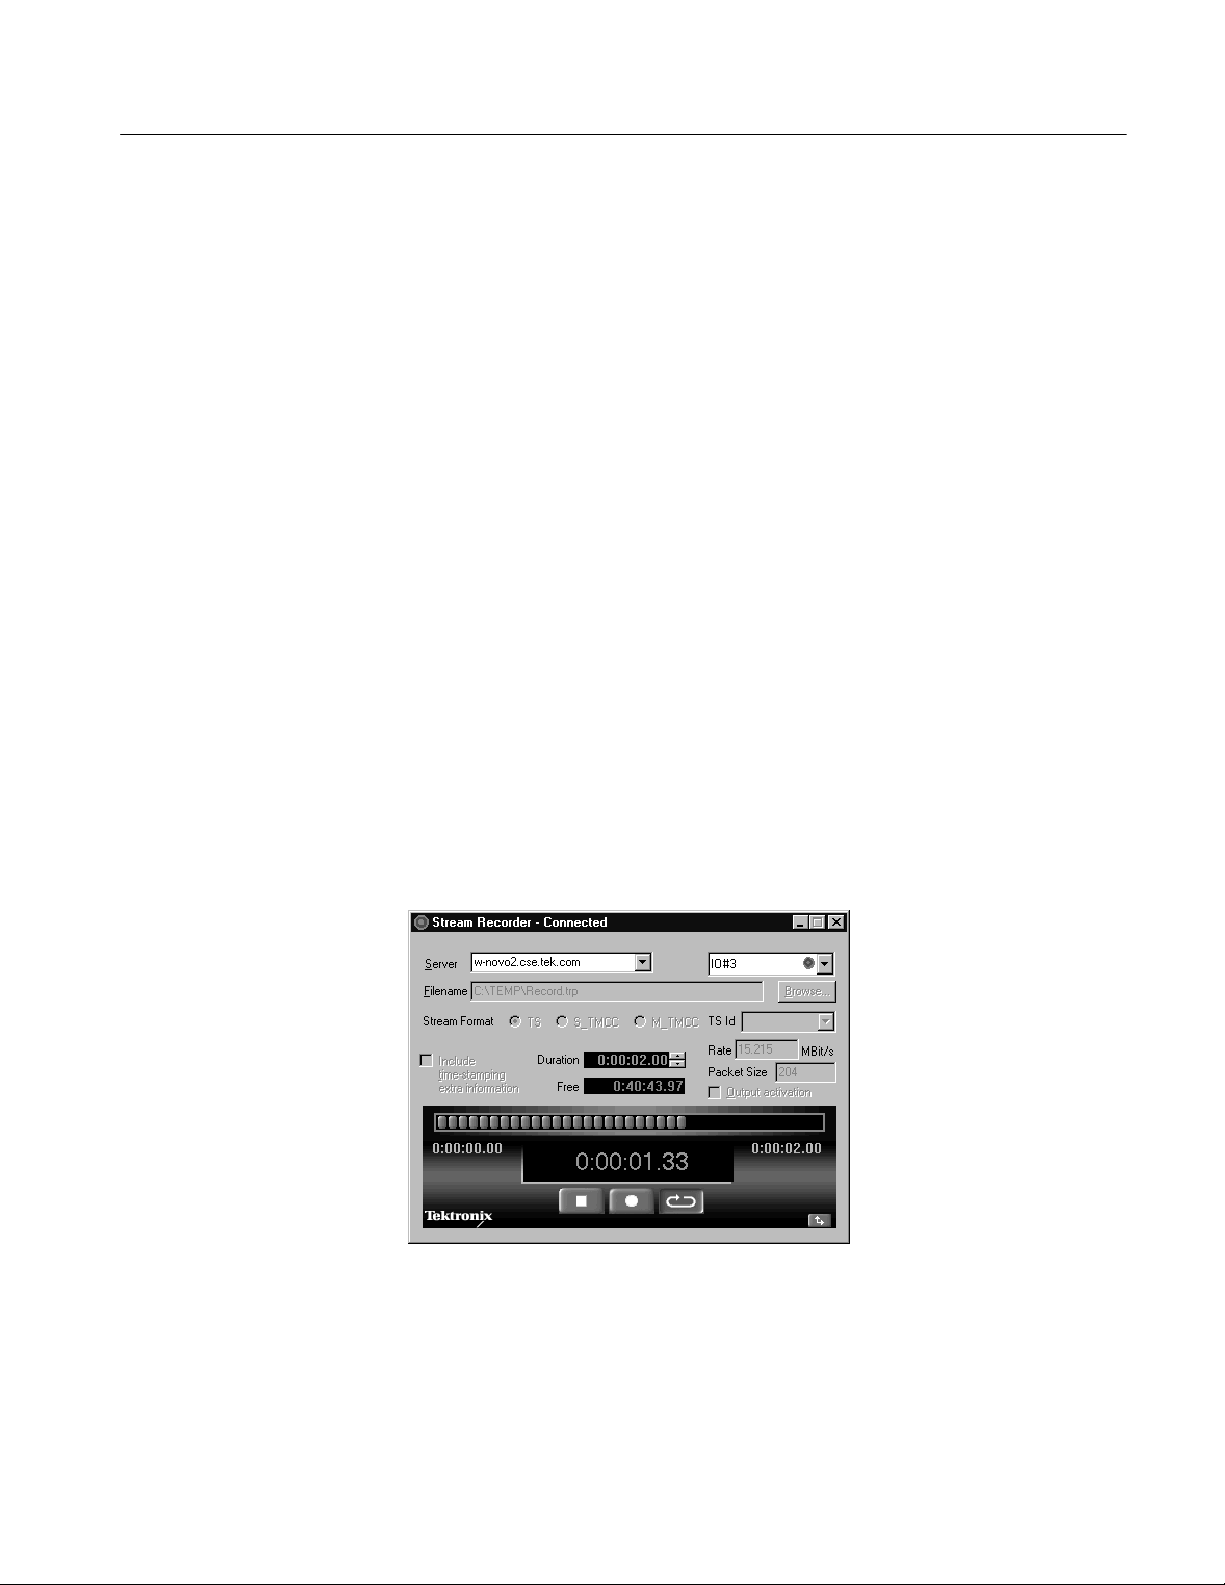
Operating Basics
H The Rate, Packet Size, and the Format and Mode are extracted from the
transport stream file. If you change the Start or End time, you can edit the
Rate field.
When you select the External Clock option, the Rate box displays EXT
CLK. To reset the rate, browse to the transport stream file and reselect it.
H The Slide Bar and Selector Buttons allow you to control which portion of the
file will be played back.
H Playback Time. When a stream output is in progress, the Stream Player
displays the current position in time (hours, minutes, seconds, and
hundredths of a second) of the output in progress.
H Control Buttons. The three Control buttons (from left to right: Stop, Play,
and Loop Play) allow you to control the stream output. Click on a Control
button to perform the desired task.
Stream Recorder Client
The Stream Recorder application provides a VTR-like display that allows you to
control the recording of a transport stream input. The display includes the
following items:
The Stream Recorder application allows you to record an MPEG transport
stream onto the hard drive of the MTS300 system using a VTR-like interface.
You can specify the stream format, duration, file name, and location of the
recorded file. See Figure 2--5.
Figure 2- 5: Stream Recorder client application window
MTS300 MPEG Test System Real-Time Analysis User Manual
2- 7
Page 60

Operating Basics
Note the following characteristics of the Stream Recorder client window:
H Server Address. If you launch the Stream Recorder from the Master Client,
the Server address boxes contain the name or IP address of the server and the
I/O port number to which the Stream Recorder is connected. You can use the
text boxes to connect to a different MTS300 system or to a different I/O port
number.
NOTE. Store transport stream files on the E: drive of the MTS300 system. The
response time of the MTS300 system C: drive is limited and may affect the
performance of the Stream Recorder and Stream Player when you try to capture
or playback streams with bitrates greater than 30 Mbps.
H Filename. The Filename box list the directory path and filename of the file
you will capture with the Stream Recorder.
H Stream Format. Select the format you will record the input in:
H Select TS to record MPEG--2, DVB, or ATSC transport streams.
H Select S_TMCC for single transport stream TMCC multiplexes.
H Select M_TMCC for multiple transport stream TMCC multiplexes.
When M_TMCC is selected, you can choose to acquire the whole stream
by selecting All in the list box to the right, or you can select only an
MPEG-2 stream of the multiplex. To record only a portion of the
multiple stream format, select the appropriate TS ID from the TS ID list
box.
H Duration and Free. Use the Duration box to set the size of the transport
stream file you are capturing. You can set the duration time (hours, minutes,
seconds, and hundredths of a second) to any value not exceeding the value
listed in the Free box.
The Free box displays the amount of memory available (hours, minutes,
seconds, and hundredths of a second) to record a transport stream file on the
hard drive you selected in the Filename box.
H Rate and Packet Size. The bitstream rate and the packet size of the input
transport stream are displayed in these boxes.
H Output Activation. When you select the Output Activation option, the
transport stream on the I/O port input to which the Stream Recorder is
connected is looped through to the output connector of that I/O port.
2- 8
MTS300 MPEG Test System Real-Time Analysis User Manual
Page 61

Operating Basics
H Progress Bar. The Progress bar displays the progress of an active recording
process. The display elements in the Progress bar light up from left to right
to indicate how far the capture process of the Stream Recorder has
proceeded.
H Recording Time. When a stream capture is in progress, the Stream Recorder
displays the beginning time (0:00:00.00), the ending time (as set in the
Duration box), and the current duration of the recording in progress.
H Control Buttons. The three Control buttons (from left to right: Stop, Record,
and Loop Record) allow you to control the stream capture. Click a Control
button to perform the desired task.
H Minimize/Maximize Button. Click the Minimize/Maximize button to remove
or add the setup portion of the Stream Recorder display. When you minimize
the Stream Recorder setup display, the Stream Recorder appears as shown
below.
TMCC Expert Client
The TMCC (Transmission and Multiplexing Configuration Control) Expert
Client application allows you analyze the TMCC data of an ARIB-compliant
transport stream input real time. See Figure 2--6. You can also analyze an
ARIB-compliant transport stream file stored on your local disk.
Note the following characteristics of the TMCC Expert Client window:
H Address Bar. The Address bar shows that the TMCC Expert client is
connected to the Analysis Server analyzing the transport stream being input
through I/O#2A on oxford6.
H Slots View. The Slots view displays the properties of each slot using three
columns. The first column lists the slot numbers (1 through 48). The second
column shows the TSID (transport stream identifier) associated with each
slot. The third column lists the modulation mode for each slot and the
number of effective slots. Each modulation mode is represented by a
different color (see Table 3--50 on page 3 --226).
NOTE. When the modulation mode and the number of slots are not consistent, the
Modulation column information is displayed in red.
H Syntax View. The Syntax view displays the content of the TMCC data in a
hierarchic list, including the length, value, and description of the hierarchic
item. Each hierarchic item is represented by a colored icon. A green icon
indicates the field value is correct or that all fields of a group are correct. A
red icon indicates an error exists in the field value of the item or in one of the
subitems of a group.
MTS300 MPEG Test System Real-Time Analysis User Manual
2- 9
Page 62
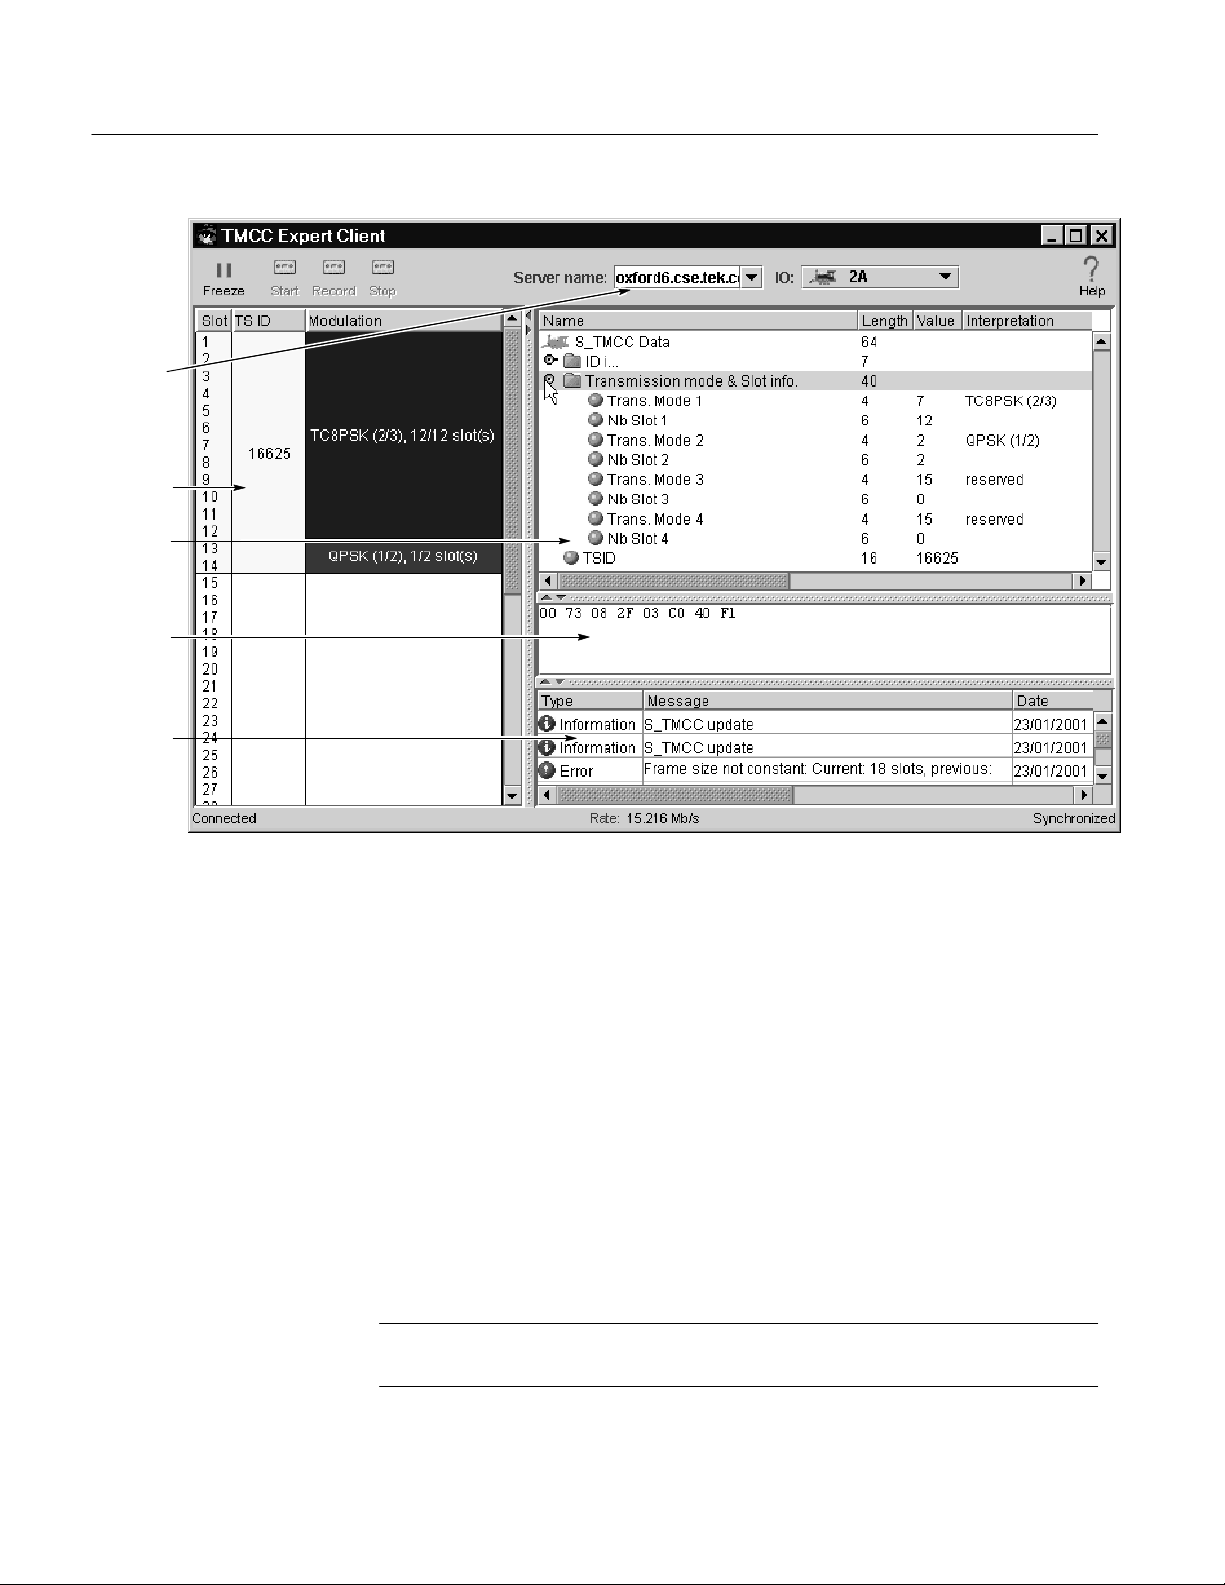
Operating Basics
Address
bar
Slots
view
Syntax
view
Raw data
view
Message
view
Figure 2- 6: TMCC Expert Client display
Raw Data View
The Raw Data view displays the hexadecimal values of the TMCC data. You can
use standard Windows NT methods for selecting and copying the data to a text
file.
Message View
The Message view displays error, warning, and information messages for the
TMCC analysis in progress. The messages include the message type (error,
warning, and information), the message content, and the time of the message.
The maximum number of displayed messages is 1000. Additional messages are
handled on a first in first out basis.
You can right-click in the Message view to open a dialog box where you can sort
and clear messages, and set the number of lines allowed for each message. You
can set the Message view for 1, 2, or 3 lines per message.
2- 10
NOTE. Some messages are too long to display within three lines; in this case,
double-click the message to display a window containing the complete message.
MTS300 MPEG Test System Real-Time Analysis User Manual
Page 63
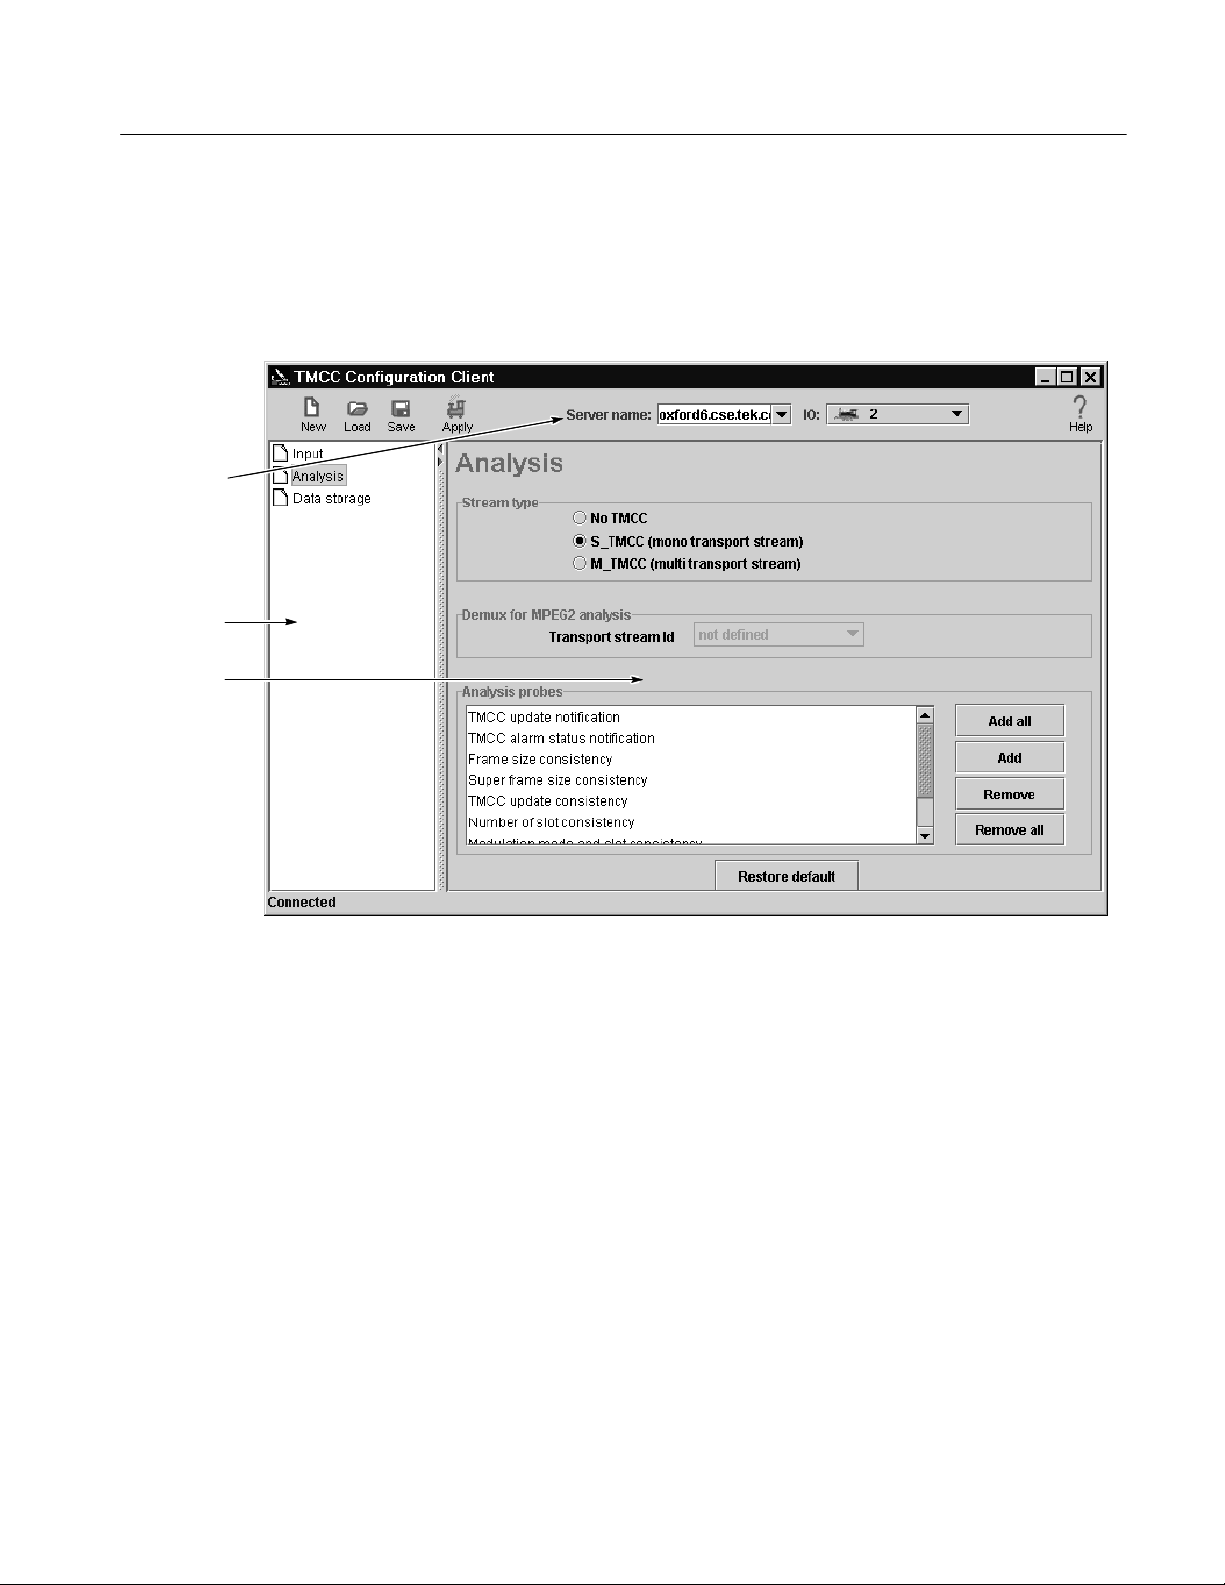
Operating Basics
TMCC Configuration
Address
bar
Navigation
panel
Configuration
panel
Client
The TMCC (Transmission and Multiplexing Configuration Control) Configuration Client is used to configure the analyses performed by the TMCC Analysis
Server. See Figure 2--7. The results of the analyses are displayed in the TMCC
Expert Client and the Master Client.
Figure 2- 7: TMCC Configuration Client display
Note the following characteristics of the TMCC Configuration client window:
H The Address bar shows that the TMCC Configuration client is connected to
the Analysis Server that is analyzing the transport stream being input
through I/O#2 on oxford6.
H The Navigation panel allows you to quickly choose the category of error for
which you want the Analysis Server to probe.
H The Configuration panel allows you to specify probes or configure analyses
for the Analysis Server indicated in the address bar. This panel changes
depending on the item selected in the Navigation panel.
MTS300 MPEG Test System Real-Time Analysis User Manual
2- 11
Page 64
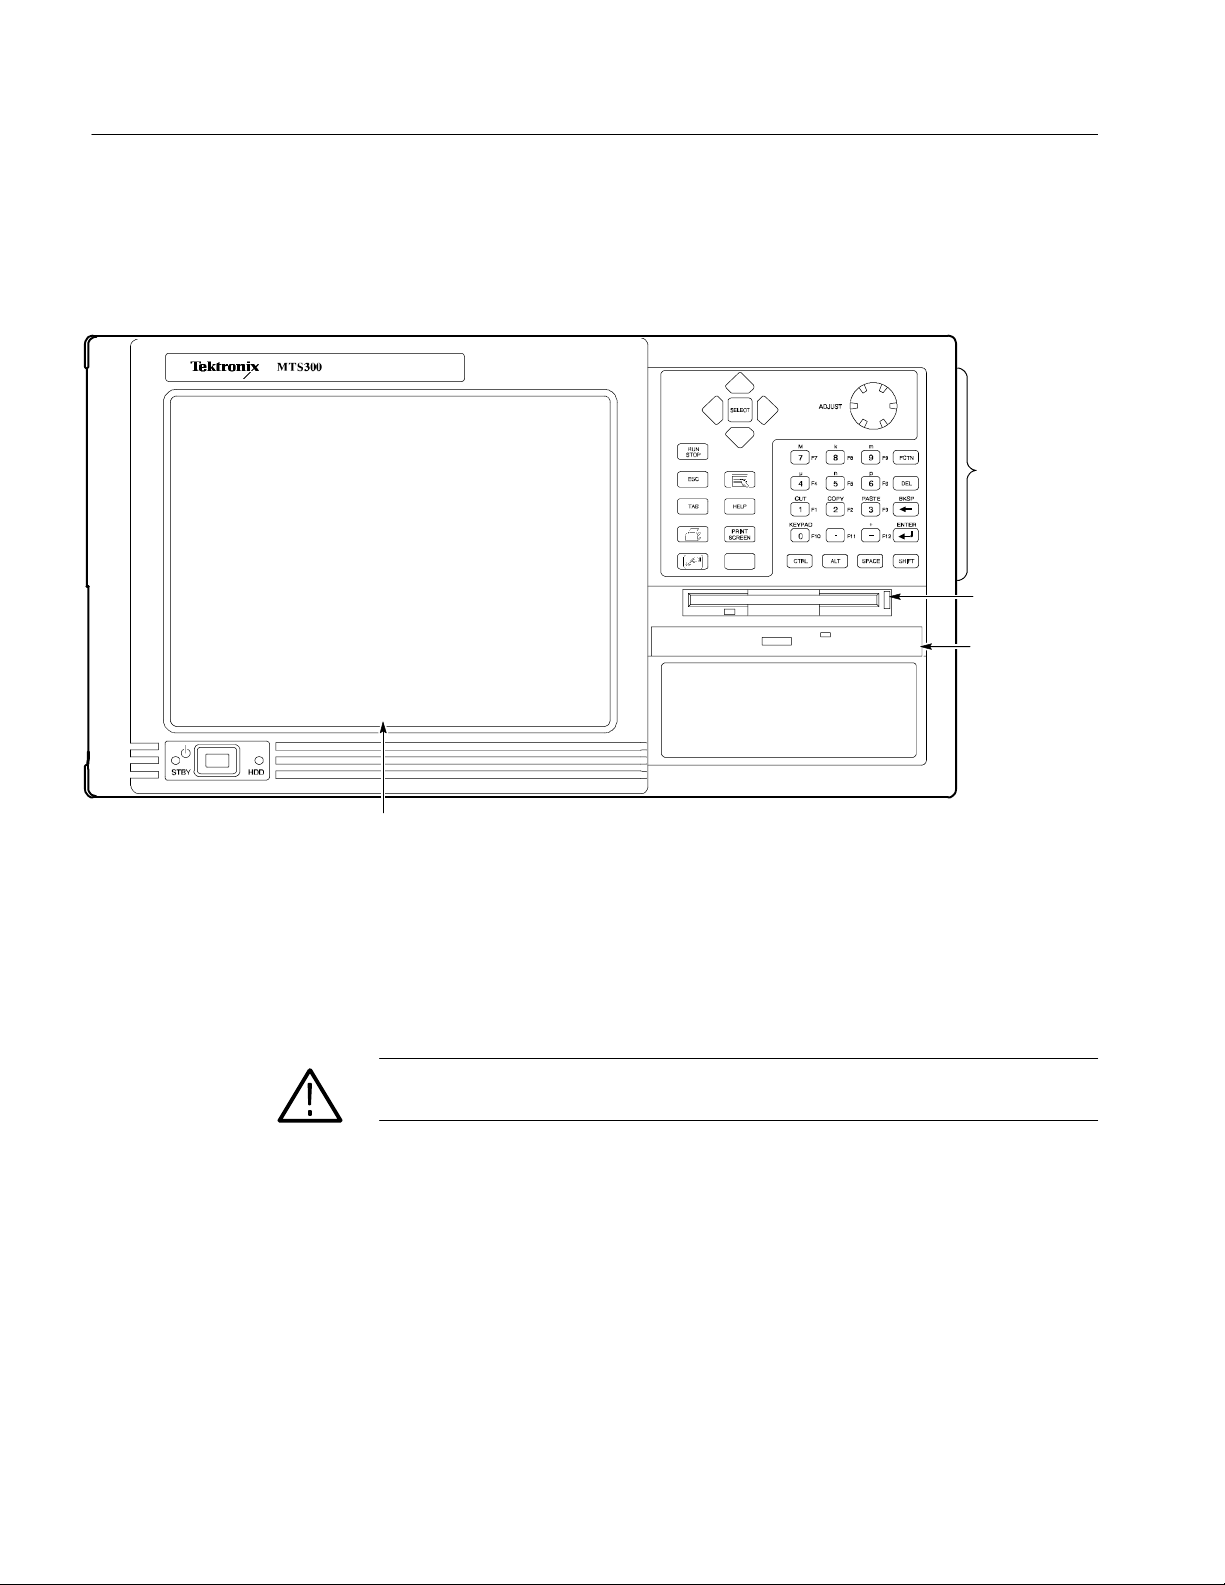
Operating Basics
Front Panel
The MTS300 MPEG Test System front-panel controls allow you to control the
MTS300 applications using either the keypad or the touch screen when a
keyboard and mouse are not available. See Figure 2--8.
MPEG Test System
Keypad
Floppy disk drive
(standard)
CD-ROM drive
(standard)
Touch screen
Figure 2- 8: Front-panel elements
This section shows how to use the touch screen features. Table 2--1 describes the
keypad controls, Table 2--2 lists touch screen techniques for working with the
Master client. Use similar techniques for the other client applications.
CAUTION. Do not use sharp or abrasive objects to perform operations using the
touch screen. Using sharp or abrasive objects can damage the LCD display.
Included as a standard accessory with all test systems is a stylus that gives you
more precise control over the items you touch on the touch screen.
2- 12
MTS300 MPEG Test System Real-Time Analysis User Manual
Page 65

Operating Basics
Table 2- 1: Front panel-key controls
Control name Mechanism Description
Up Arrow Button Use to navigate and change focus from
Left Arrow Button
Right Arrow Button
Down Arrow Button
Select Button Same as the space key.
Adjust Knob Knob (Rotary encoder) Not enabled.
Run/Stop Button Not enabled.
Esc Button Standard Escape key.
Tab Button Standard Tab key.
Print Button Prints the current display.
Touch Button (w/hand icon) Toggle function not enabled. The touch
onewindow function toanother.
screen is always on.
Menu (Application key) Button (w/pointer icon) Displays shortcut menus for selected
items.
Help Button Opens the Help contents. Standard F1 key.
Print Screen Button (w/printer icon) Copies the screen to the clipboard. Alt plus
Print Screen copies the active window.
START Key Button (w/Windows logo) Opens the Windows Start menu.
Numbers 0 to 9, . (period), and -- (minus)
Fctn ButtonwithLED Modifier for numeral keys to create keys
Del Button Deletes selected text or object.
Ctrl ButtonwithLED Control key. LED indicates when keypad is
Alt ButtonwithLED Alternate key. LED indicates when keypad
Space Button Use it like a keyboard space bar or use it
Buttons Standard number keys, most have second
(Shift) and third (Function) functions.
F1 through F12. LED indicates when
active.
Button Backspace key.
Button Enter key.
in control mode.
is in alternate mode.
as mouse button 1.
Shift ButtonwithLED Shift key. LED indicates when keypad is in
MTS300 MPEG Test System Real-Time Analysis User Manual
shift mode. Locked mode key feature.
2- 13
Page 66

Operating Basics
NOTE. Some of the functions of the Expert and Configuration clients require the
use of an external keyboard and mouse.
Table 2- 2: Touch screen techniques
Task Action
Highlighting an item Touch the item.
Selecting an item
Making a menu selection Touch the menu name, and then touch the menu item.
Moving a window Touch and drag the title bar of the window without lifting the
stylus from the touch screen.
Displaying shortcut menus Touch an icon that has a shortcut menu associated with it (for
instance, a multiplex or service icon) and press the Menu
button from the keypad.
Checking or clearing option
boxes
Entering values in text boxes Touch the text box unt il a cursor appears in the text box, and
Scrolling through a list Touch the scrolling list until a cursor appears in the list, and
Scrolling a window Touch and drag a scroll bar without lifting the stylus from the
Resizing windows Touch and drag the lower right corner of the window to the
Following links in the online
help
Expanding or collapsing a
hierarchy
Copying text or other values Touch and drag over the area you want to copy, and then press
Pasting text or other values Touch the area into which you want to paste the contents of the
Touch the option name or check box.
then enter values using the keypad. (Only numeric values and
the letters M, k, m, u, n, and p can be entered from the
keypad.)
then press the Down Arrow button from the keypad.
touch screen.
desired size without lifting the stylus from the touch screen.
Touch the link text.
Double-tap the touch screen item at the point you want to
expand or collapse a hierarchical display, or touch the
Expand/Collapse control next to the item name.
the Shift button followed by the Copy button on the keypad.
clipboard, and then press the Shift button foll owed by the
Paste button on the keypad.
2- 14
MTS300 MPEG Test System Real-Time Analysis User Manual
Page 67

Tutorial
This tutorial will introduce you to the capabilities and features of the MTS300
system client modules. Refer to the Reference section for detailed operating
information for each client module.
Perform this tutorial with your own input stream, and then spend some time
experimenting with the various monitoring, configuration, and analysis options.
The sections of the tutorial begin on the following pages:
H Preliminary Setup page 2--15
H Starting and Configuring the Master Client page 2--16
H Assigning Servers and Generating a Transport Stream page 2--19
H Monitoring a Transport Stream Input page 2--20
H Configuring the Analysis Server page 2--23
H Configuring the Data Logging Function page 2--26
H Analyzing a Transport Stream page 2--27
Preliminary Setup
H Recording a Transport Stream Input page 2--30
NOTE. If you are not familiar with the Windows NT 4.0 operating system, review
the Windows NT online help.
1. Connect the output of I/O port 2 to the input of I/O port 1 using a 75 Ω BNC
cable as shown in Figure 2--9.
2. Power up and log on to the MTS300 system as described in Starting the
MTS300 System on page 1--15.
MTS300 MPEG Test System Real-Time Analysis User Manual
2- 15
Page 68

Tutorial
Input on
I/O port 1
Figure 2- 9: Initial setup for the tutorial
75 ohm
BNC cable
Output on
I/O port 2
Starting and Configuring the Master Client
Use the following procedure to start and configure the Master Client:
1. From the Windows NT start menu, select Programs | Tektronix MPEG
Test System | Master Client. An empty Master Client window is displayed
as shown in Figure 2--10.
You can also start the Master Client by double-clicking the Master Client
icon in the Tektronix MPEG Test System program group.
Before you can start monitoring inputs, you must connect the Master Client to a
Server Manager. The Server Manager (represented by the life preserver icon in
the system tray) collects the information generated by the Analysis Servers about
the transport stream errors and statistics. There are several methods you can use
to connect to a local Server Manager, but for this tutorial, use the simplest
technique:
2. Click the Home button on the Master Client toolbar as shown in Figure
2--10. The toolbar changes and the Server Manager to which you are
connected is displayed in the Address bar (see Figure 2--11).
2- 16
MTS300 MPEG Test System Real-Time Analysis User Manual
Page 69

Tutorial
Figure 2- 10: Initial Master Client application window
Address bar
Selection
Indicator bar
Port Manager
panel
Services panel
Details panel
Error gauge
Figure 2- 11: Master Client connected to the local Server Manager
MTS300 MPEG Test System Real-Time Analysis User Manual
2- 17
Page 70

Tutorial
Using the Workspace dialog box, you can specify the manner in which the
Master Client reports errors and displays icons.
3. Select Edit from the Workspace menu to open the Workspace dialog box.
4. Select Graphics in the Navigation panel to open the Graphics panel.
5. Change the Analysis display options to show only Critical and Major errors
as shown in Figure 2--12.
6. Click OK to apply your changes and return to the Master Client. After
creating a workspace, the Master Client window should look similar to
Figure 2--11.
Experiment with the other options available in the Workspace dialog box.
Return to the Master Client when you are ready to continue with the tutorial.
Analysis display options
Figure 2- 12: Changing the analysis display options
2- 18
MTS300 MPEG Test System Real-Time Analysis User Manual
Page 71

Assigning Servers and Generating a Transport Stream
In this part of the tutorial, you will assign servers to specific I/O ports, and then
you will generate a transport stream that you will monitor and analyze later in
this tutorial. These steps assume you have performed the steps in the Starting
and Configuring the Master Client procedure starting on page 2--16.
1. Right click the Free icons in the Port Manager panel, and then assign an
Analysis Server to I/O#1 and the Stream Player to I/O#2 as shown in
Figure 2--13.
Tutorial
Figure 2- 13: Assigning servers to I/O ports
2. Click on the icons and white space in the Port Manager panel and notice how
the Details panel and Selection Indicator bar change.
3. Right-click the Stream Player icon and select Launch Stream Player Client
from the shortcut menu. The Stream Player client is displayed and will look
similar to Figure 2--14 on page 2--20.
4. Click the Browse button, and then navigate to and open a suitable MPEG-2,
DVB, or ATSC transport stream file. You can select any transport stream file
on your local MTS300 system to output using the Stream Player.
5. When you return to the Stream Player client, accept all of the default settings
and click the Loop Play button to begin generating the transport stream in
loop mode. In Figure 2--14, the file DVBT002a.trp is playing in loop mode
and is 9.11 seconds into a 28.55 second loop.
6. Minimize the Stream Player client and return to the Master Client. Notice the
change in the Stream Player client icon appearance.
MTS300 MPEG Test System Real-Time Analysis User Manual
2- 19
Page 72

Tutorial
Figure 2- 14: Stream Player client
Monitoring a Transport Stream Input
Browse
button
Loop button
In this part of the tutorial you will learn how to interpret the icons used by the
Master Client, and you will learn how the different Master Client panels allow
you to see different levels of error details. These steps assume you have
performed the steps in the Assigning Servers and Generating a Transport Stream
procedure starting on page 2--19.
1. Right-click the Analysis Server icon (the train icon) and select Start
Analysis from the shortcut menu. The Services panel (to the right of the Port
Manager panel) should update showing the services that are part of the
transport stream you are now monitoring. The display should now look
similar to Figure 2--15.
2. Experiment with the icons by right-clicking each and familiarizing yourself
with the contents of the shortcut menus.
If your input is displaying any critical or major errors, you will see error icons
overlaying the icons in the Port Manager and Services panels. Table 3--3 on
page 3--19 describes the different states of the error icons.
3. Select one of the icons in the Port Manager panel. Notice the changes to the
Details panel and the Selection Indicator bar. Notice also that when you
select an icon in the Port Manager panel that the Error gauge changes.
The Error gauge shows you the severity of errors being recorded on the
selected item. Table 3--4 on page 3--19 describes the states of the Error
gauge. In step 5 on page 2--18, you set the Master Client workspace to show
only critical or major errors. So, your error gauge should like the first,
second, or last icons in Table 3--4.
2- 20
MTS300 MPEG Test System Real-Time Analysis User Manual
Page 73

Analysis
Server icon
Stream Player
server icon
Tutorial
Figure 2- 15: Monitoring a transport stream
4. Click one of the icons in the Services panel experiencing errors. As you roll
your cursor over an icon in the Services panel, a tool tip is displayed
showing you the transport stream ID and service ID pair for the service.
Notice the changes to the Details panel and the Selection Indicator bar. The
Details panel shows a different set of icons than those that were displayed
when an Multiplex icon was selected.
5. Right-click an icon in the service panel, and then select Associate Logo
from the shortcut menu as shown below.
6. Navigate to the Logos folder (C:\MTS300\Bin\Logos) and choose a *.jpg
or *.bmp file that you want to associate with the selected service.
MTS300 MPEG Test System Real-Time Analysis User Manual
2- 21
Page 74

Tutorial
7. Click OK. You are returned to the Master Client, and the logo is displayed in
place of the default service icon.
NOTE. Some service providers do not allow their logos to be used without
permission. Check with the service provider before you use their logo.
You can also go to the following URL to download logos for satellite
services: http://www.satlogo.com/. This link was valid as of June, 2000.
Refer to Restoring the Default Logo to a Service Icon on page 3--33 for
information about restoring the default service icon to a service.
8. Right-click again in the service panel and choose Details from the shortcut
menu. The Services panel changes to show a tabular display that lists the
more information about each service. See Figure 2--16.
9. Click and drag the left border of the Services panel to display all of the
columns in the Details view. You can sort the inputs shown in this view by
clicking on the column headers.
2- 22
Figure 2- 16: Services panel details view
10. Experiment with some of the other Services panel shortcut menu items, and
then set the Services panel to display Large Icons when you are finished and
ready to proceed with the tutorial.
11. Select the Analysis Server icon and notice again the change to the Details
panel. The icons in this panel indicate the types, severity, and status of errors
occurring on the multiplex at the transport stream level. Table 3--5 on
page 3--20 describes the icons displayed in the Details panel when a
Multiplex icon is selected.
12. Select a Services panel icon and note again the changes to the Details panel.
When a Services icon is selected the Details panel icons show the type,
severity, and status of the errors occurring on the multiplex at the service, or
program level. Table 3--6 on page 3--20 describes the icons displayed in the
Details panel when a Services panel icon is selected.
MTS300 MPEG Test System Real-Time Analysis User Manual
Page 75
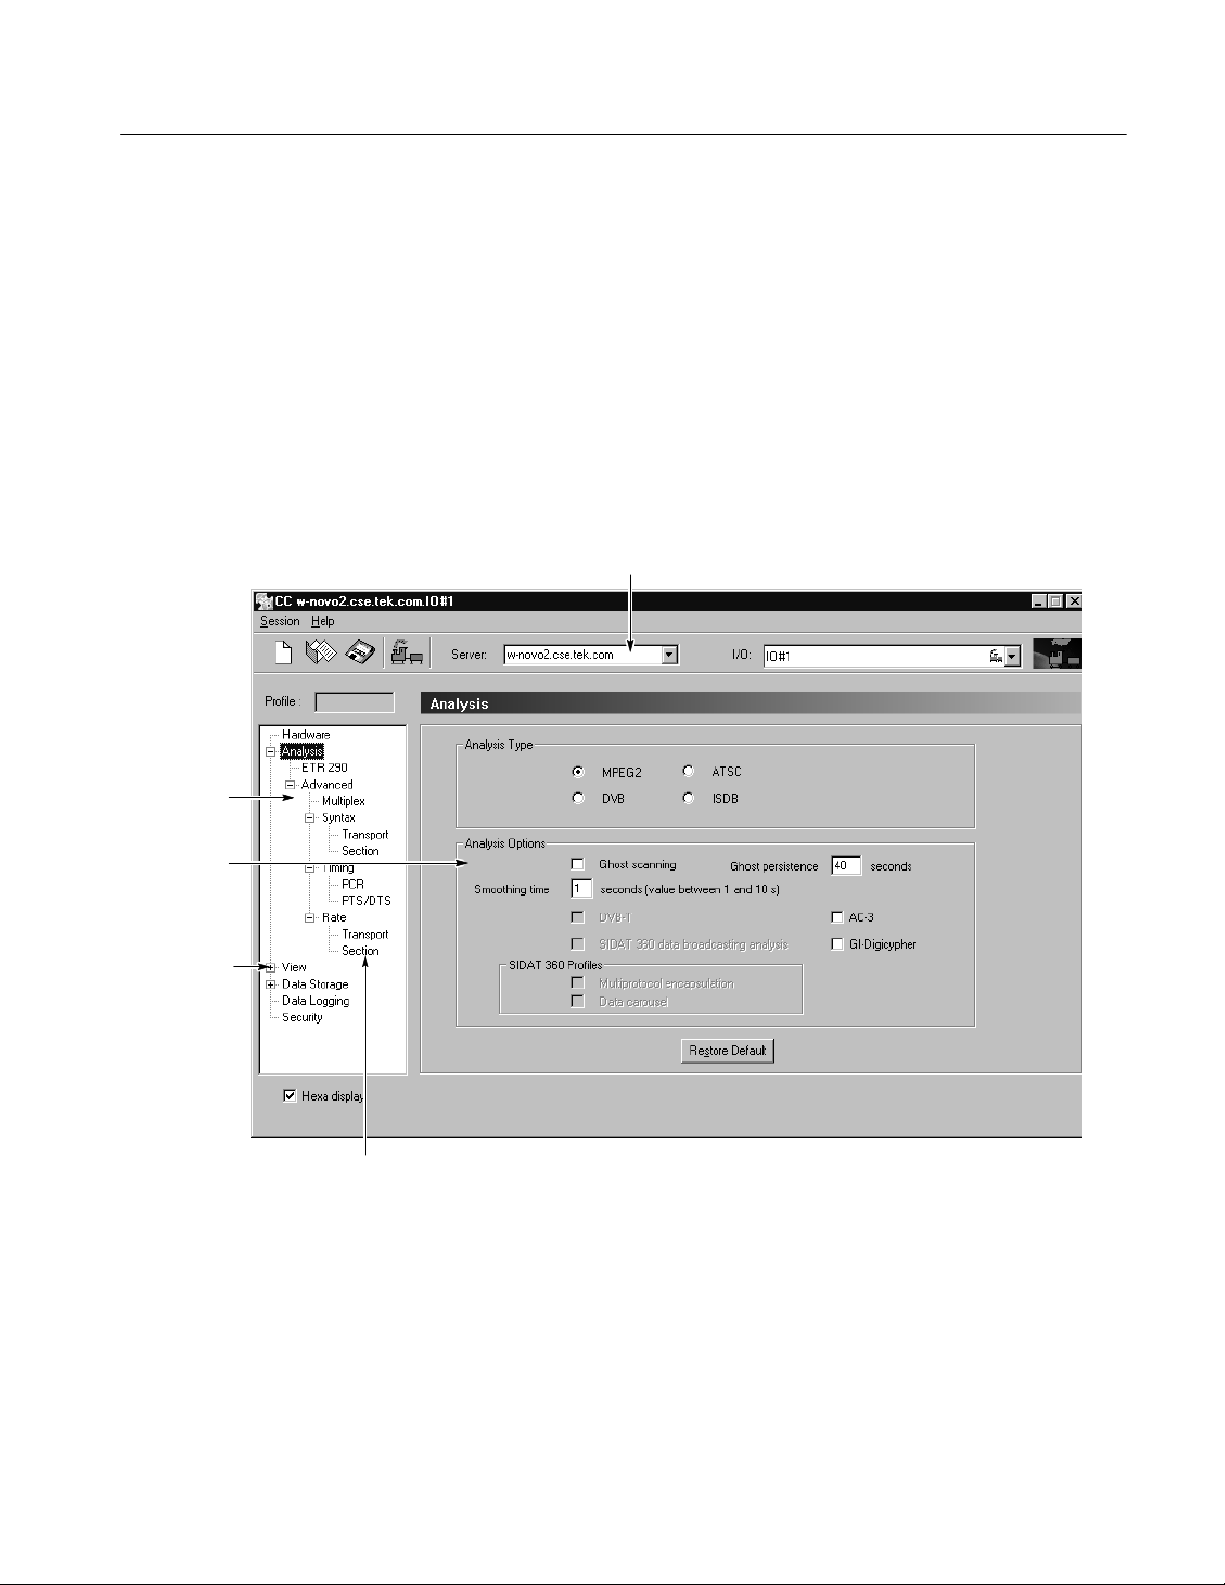
Configuring the Analysis Server
In this part of the tutorial, you will learn how to start the Configuration Client
from the Master Client and how to change the configuration of the Analysis
Server on the input selected in the Master Client. These steps assume you have
performed the steps in the Monitoring a Transport Stream Input procedure
startingonpage2--20.
1. Right-click an Analysis Server icon in the Port Manager panel and select
Configuration Client from the shortcut menu. The Configuration Client is
displayed and is connected to the Analysis Server you selected in the Master
Client. See Figure 2--17.
Tutorial
Address bar
Navigation
panel
Analysis
panel
Expand/
Collapse boxes
Configuration panel
names
Figure 2- 17: Configuration Client display
See Configuration Client on page 2-- 5 for an overview of the Configuration
Client display elements. See Configuration Client Reference beginning on
page 3--157 for detailed information about the Configuration Client instructions
for setting probes.
MTS300 MPEG Test System Real-Time Analysis User Manual
2- 23
Page 76

Tutorial
Apply button
2. Expand the hierarchy in the Navigation panel so that it looks similar to
Figure 2--17 by clicking the expand/collapse boxes next to the Configuration
panel names.
3. Highlight Analysis, and then select MPEG-2, DVB, ATSC, or ISDB in the
Analysis panel as appropriate for the sample stream you are analyzing.
4. Highlight ETR 290 in the Navigation panel to display the ETR 290 panel.
This panel includes probes for the ETR 290 recommendations.
5. Click Add All and notice the change to the Probe List selection box.
6. In the Probe List selection box, remove all ETR290 priority 3 probes by
double-clicking the probe name.
7. Click Apply to apply the changes you have made to the Analysis Server,
which in the case of Figure 2--18 is analyzing I/O#1 on carnac.
ETR290 probes list
selection box
Figure 2- 18: Setting ETR290 probes
8. Expand the View hierarchy in the Navigation panel, and then select Message
9. Scroll down the list of probes in the Report Message Level panel and
10. Right-click in the Message level column on the highlighted row as shown in
2- 24
level.
highlight Continuity counter.
The default for this display is to show the probes in alphabetical order by
probe name. You can change this sort order by clicking one of the column
headers.
Figure 2--19, and then select Major from the shortcut menu. This changes
the level at which a continuity counter error is displayed in the Master Client
and in the Report view of the Expert Client.
MTS300 MPEG Test System Real-Time Analysis User Manual
Page 77

Figure 2- 19: Changing the message level
Tutorial
11. Change all Critical errors to Major errors using the following procedure:
a. Click the Report Level column header. This will sort all of the probes
by error severity (the level the errors are reported by the Analysis
Servers).
b. Left-click on all of the Critical error icons in the Report Level column.
Each click steps through the list of error levels. Since you are clicking
the Critical errors, the report level changes to Major errors.
12. Click the Apply toolbar button to apply your changes to the Configuration
Client (do not close it yet).
13. Click the Master Client window to display the application.
14. Select Edit from the Workspace menu, and then highlight Graphics in the
Workspace Navigation panel.
15. Deselect Major in the Analysis Display group, and then click OK.
16. Click the Acknowledge Errors button on the Master Client toolbar. Any
error indicators in the Master Client should go away.
17. Return to the Configuration Client and restore the factory-default settings by
clicking Restore Default at the bottom of the Report Message Level panel.
Do not forget to apply your changes before minimizing the Configuration
Client (do not close it yet if you are continuing with the Tutorial).
MTS300 MPEG Test System Real-Time Analysis User Manual
2- 25
Page 78
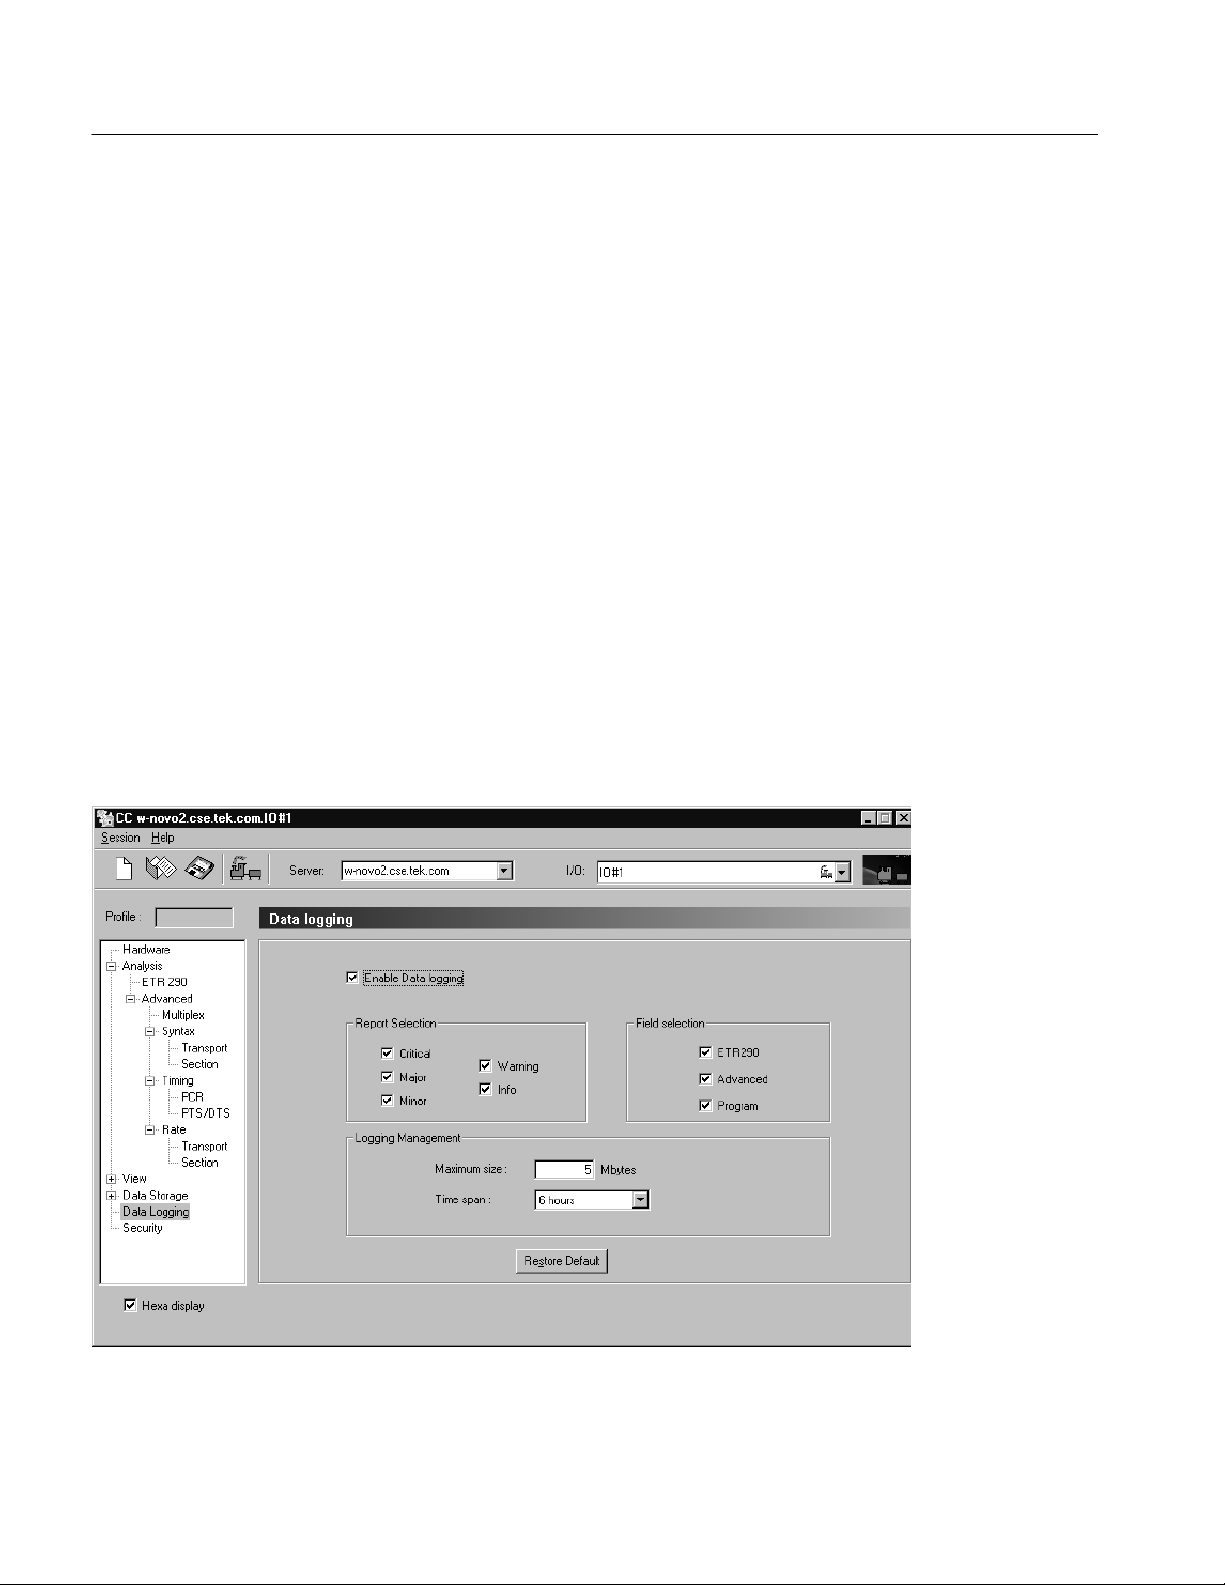
Tutorial
Configuring the Data Logging Function
The Data Logging function allows you to write a record of selected analysis
events to tab-delimited text files on the instrument hard drive. The Configuration
Client enables and sets the parameters of the events that are recorded. Refer to
Data Logging on page 3--163 for more information.
1. Open the Configuration Client from the Master Client window.
2. Select Data Logging in the Navigation Panel of the Configuration Client to
open the Data Logging panel shown in Figure 2--20.
3. Click on Enable Data logging to enable the Data Logging function.
4. Click on the various Report Selection and Field Selection boxes to select
which type of analysis events will trigger a log entry.
5. Use the Logging Management boxes to set the maximum size of each log
file and to set the time span for each log file.
6. Click the Apply button to apply your changes. Your specified transport
stream events will now be written to a text file in the following directory:
C:\MTS300\DataLogging.
Figure 2- 20: Data Logging configuration panel
2- 26
MTS300 MPEG Test System Real-Time Analysis User Manual
Page 79

Analyzing a Transport Stream
The Expert Client allows you to examine a specific input in more detail than is
possible using the Master Client. See Expert Client on page 2--3 for an overview
of the Expert Client. See Expert Client Reference beginning on page 3--89 for
more detailed information about the Expert Client and how to use it to analyze
transport stream inputs. These steps assume you have performed the steps in the
Configuring the Analysis Server procedure starting on page 2--23.
1. Click the Analysis Server icon in the Port Manager panel, and then
right-click a service icon in the Services panel. If possible, select a service
icon that is displaying errors as shown in Figure 2--21.
Tutorial
Service
icon
Figure 2- 21: Launching the Expert Client
2. Select Expert Client from the shortcut menu. The Expert Client is displayed
showing the errors occurring on the selected service (if any). See
Figure 2--22.
Your Expert Client display will look different in the details, but there are
several items to note as you look at the Expert Client:
H The Address bar shows which Analysis Server you are connected to.
H The Hierarchic panel of the Report view indicates which service
(program) you selected when you started the Expert Client.
H The Messages panel of the Report view displays the errors that are
occurring on the service indicated in the Hierarchic panel.
MTS300 MPEG Test System Real-Time Analysis User Manual
2- 27
Page 80

Tutorial
ETR290 view button
Report view
(error on Program 65534)
Figure 2- 22: Expert Client display showing errors
2- 28
Error messages for
Program 65534
MTS300 MPEG Test System Real-Time Analysis User Manual
Page 81
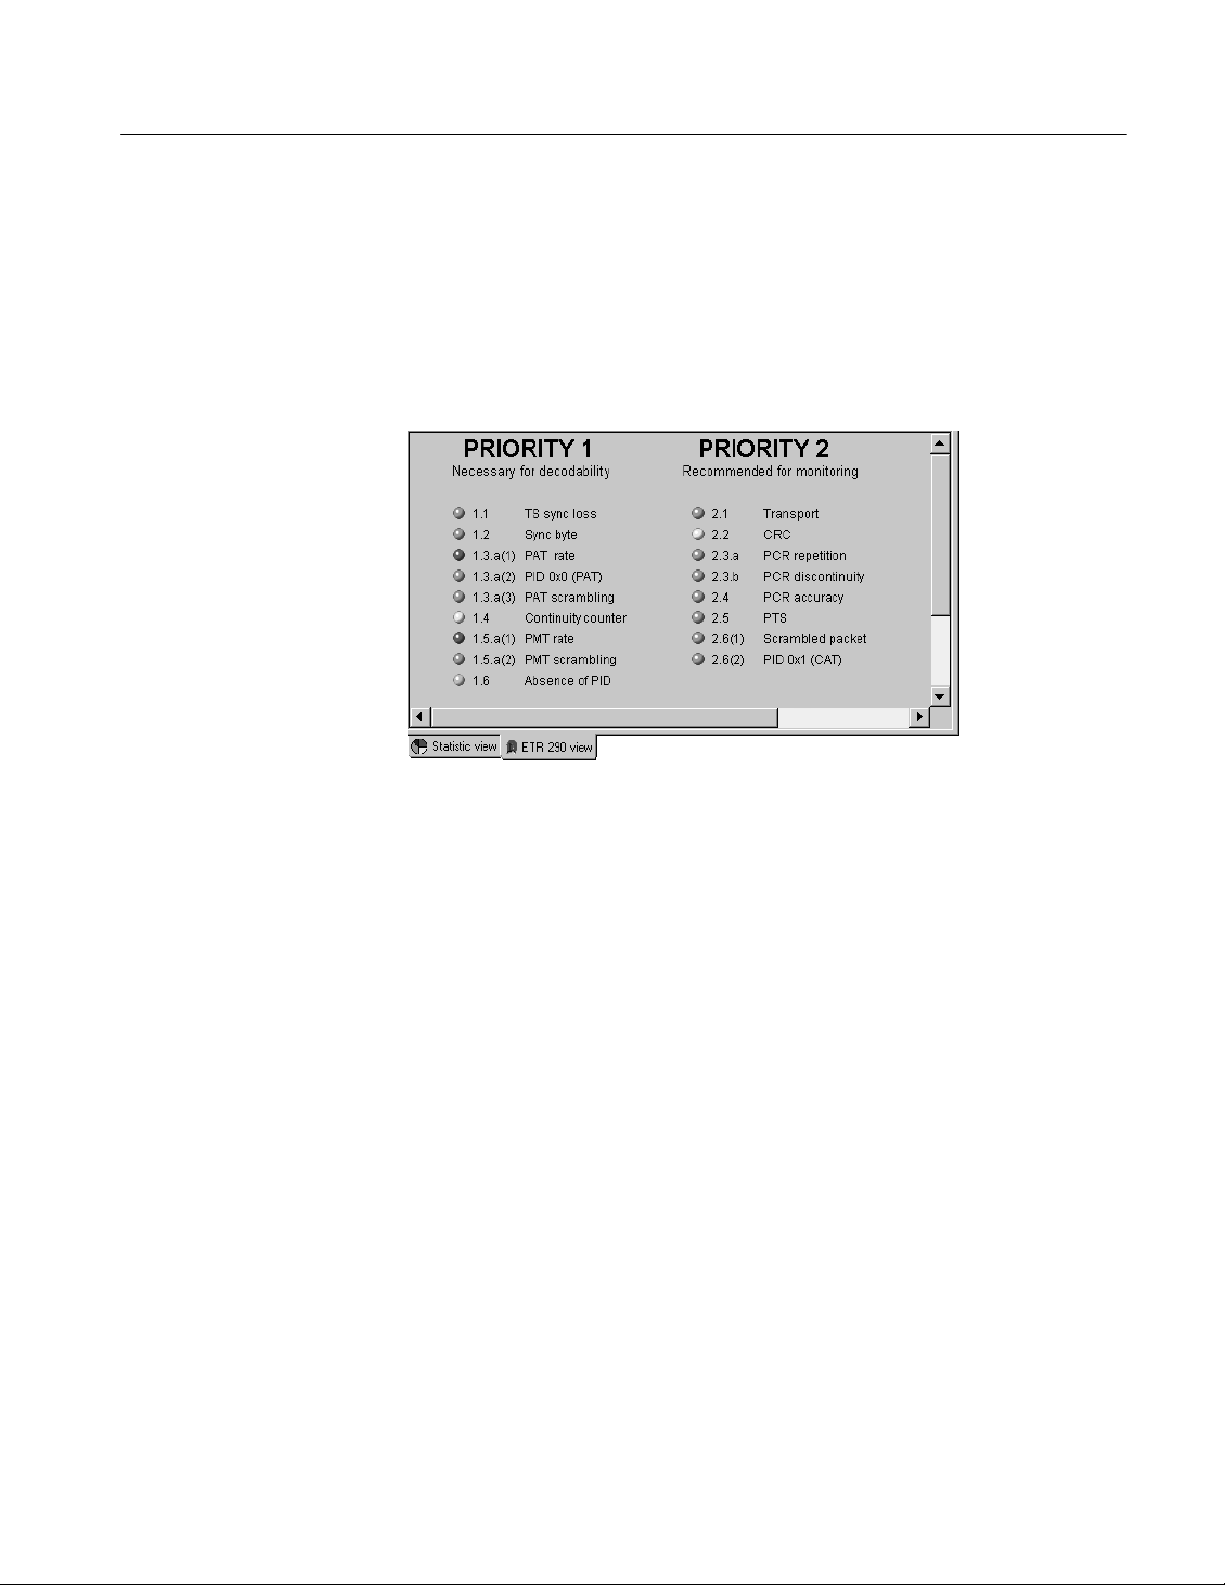
Tutorial
3. Click the ETR290 view button to display the ETR290 view in the Client area
(see Figure 2--23).
Note any error LEDs displayed. If you had chosen an MPEG-2 standard,
there would not be a Priority 3 column for this display, as shown in
Figure 2--23; for ATSC, the Priority 3 column probes address ATSC PSIP
tables rather than DVB SI tables.
Figure 2- 23: ETR290 view panel in the Expert Client
4. Return to the Configuration Client, and then select ETR290 in the Navigation panel to display the ETR290 configuration panel.
5. Click Restore Default. This removes all ETR290 probes on the input.
6. Click Apply in the Configuration Client and return to the Expert Client.
Notice that all of the ETR290 recommendations are grayed out, with the
exception of TS_sync_loss, which is the only probe always set in the Expert
Client.
7. Exit the Expert Client.
MTS300 MPEG Test System Real-Time Analysis User Manual
2- 29
Page 82

Tutorial
Recording a Transport Stream Input
In this part of the tutorial, you will record a portion of the stream you have been
analyzing using the Stream Recorder Client. You can manually capture input
using the Configuration Client and Expert Clients. See Manually Capturing a
Transport Stream on page 3--100 for more details about manually capturing
input.
These steps assume you have performed the steps in the Analyzing a Transport
Stream procedure starting on page 2--27.
1. Right-click the Analysis Server icon in the Master Client and select Stop
Analysis from the shortcut menu.
2. Right-click the Analysis Server icon again and select Free I/O from the
shortcut menu. The I/O port icon will change to Free.
3. Right-click the Free icon and select Assign Server | Stream Recorder from
the shortcut menu.
4. Right-click the Stream Recorder icon and select Launch Stream Recorder
from the shortcut menu. The application looks very similar to the Stream
Player. See Figure 2--24.
Browse
button
Stop Record
button
Loop Record
button
Figure 2- 24: Stream Recorder client application window
2- 30
The default file name and path for the .TRP file you will record is shown in the
Filename text box. You can change this by clicking the Browse button and
specifying a different file name and path for the transport stream file. For this
tutorial, use the default name and path.
MTS300 MPEG Test System Real-Time Analysis User Manual
Page 83

Tutorial
5. Select the format of the stream you are going to record. For this tutorial,
select TS stream format.
6. Enter a duration in the Duration box that is less than the value in the Free
box. Both boxes use the following format:
Hours: Minutes: Seconds. hundredths
7. Ensure that the Output activation box is not selected, and then click the
Loop Record button.
8. Watch as the Stream Recorder syncs to the signal being input on I/O#1, and
records the input.
9. Click the Stop Record button and then exit the Stream Player client.
10. Reassign I/O#1 to the Analysis Server (free the I/O first); output the new
transport stream file using the Stream Player, and monitor and analyze the
transport stream using the techniques you learned earlier in this tutorial.
11. Stop generating a transport stream and stop the analysis on the input.
12. Exit all of the client applications, saving the Master Client workspace if you
wish.
This completes the tutorial.
MTS300 MPEG Test System Real-Time Analysis User Manual
2- 31
Page 84

Tutorial
2- 32
MTS300 MPEG Test System Real-Time Analysis User Manual
Page 85

Reference
This section is a complete reference to the MTS300 MPEG Test System client
modules: Master Client, Expert Client, Configuration Client, Stream Recorder,
Stream Player, TMCC Expert Client, and TMCC Configuration Client. The
information in this section is organized as indicated in the following list:
H This Reference section explains why monitoring transport stream inputs is
important and briefly describes the terms MPEG-2, DVB, and ATSC. This
section also explains client-server computing as it relates to the MTS300
system software modules and describes the two server modules enabled by
the MTS300 system software.
H The Master Client Reference (see page 3--11) provides procedures for
monitoring transport stream inputs. It also describes the Master Client views,
panels, menus, icons, and toolbar buttons.
H The Analyses Reference (see page 3--39) describes all of the MTS 300 system
analyses performed by the Analysis Servers. This section also provides
procedures for setting, modifying, and removing the user-controlled
analyses, called probes.
H The Expert Client Reference (see page 3--89) provides procedures for
displaying and analyzing errors on transport stream inputs. It also describes
the Expert Client views, panels, menus, icons, and toolbar buttons.
H The Configuration Client Reference (see page 3--157) provides procedures
for setting, modifying, and removing probes on transport stream inputs. This
section also describes the Configuration Client panels, menus, icons, and
toolbar buttons.
H The Stream Recorder Reference (see page 3--207) provides procedures for
using the Stream Recorder application to record a transport stream input onto
the hard drive of the MTS300 system. This section also describes the
VTR-like controls of the Stream Recorder.
H The Stream Player Reference (see page 3--215) provides procedures for using
the Stream Player application to play back a transport stream, or a portion of
a stream, stored on the hard drive of the MTS300 system. This section also
describes the VTR-like controls of the Stream Player.
H The TMCC Expert Client Reference (see page 3--223) describes the TMCC
Expert Client panels, icons, and toolbar buttons.
H The TMCC Configuration Client Reference (see page 3--233) provides
descriptions of the TMCC Configuration Client panels, icons, and toolbar
buttons.
MTS300 MPEG Test System Real-Time Analysis User Manual
3- 1
Page 86

Reference
MPEG Overviews
See Operating Basics for basic operating procedures for starting, logging on to,
and stopping the MTS300 system.
See Tutorial on page 2--15 for a tutorial that enables you to quickly become
familiar with the use of the five client modules .
See Front Panel on page 2--12 for information about the using the keypad and
touch screen.
See Appendix C: Networking for information about installing MTS300 systems
in networked environments and basic network troubleshooting procedures.
Finally, see the MTS300 MPEG Test System Hardware and Software Installation
T echnical Reference manual for hardware and software installation procedures,
for complete electrical, mechanical, and environmental specifications, and for the
safety compliance information for the MTS300 MPEG Test System.
MPEG Operational
Monitoring
This section provides some brief overviews of MPEG monitoring and the types
of transport streams monitored and analyzed by the MTS300 system.
In today’s compressed digital TV environments you can think about operational
monitoring requirements in terms of layers:
H Information layer. Is the information correct and of suitable quality?
Monitoring the information layer is an extension of picture quality
measurements in the compressed digital realm.
H Transmission layer. Does the signal itself conform to standards?
Monitoring the transmission layer is standard practice in all transmission
systems: cable, terrestrial, and satellite.
H Protocol layer. Can the transmitted data be decoded at the destination?
Monitoring the protocol layer is a new requirement of MPEG transmission
systems. The protocol layer is monitored by the Master Client.
3- 2
MTS300 MPEG Test System Real-Time Analysis User Manual
Page 87

Reference
The protocol layer provides the following functionality:
H Metadata. Metadata refers to information about the transport stream that is
carried by the transport stream such as PSI and SI or PSIP tables. This
information describes the multiplex and the transmission environment
completely so that the IRD (integrated receiver/decoder) can decode the
transport stream correctly. Metadata is specified in the appropriate MPEG,
DVB, and ATSC standards.
H Timing information. Timing information is used by the IRD to decode and
present the data correctly (at the right times and in the right sequence).
Timing information is carried in both the transport stream layer and the
elementary stream layer.
MPEG monitoring is used to verify that the transport stream you are transmitting
conforms to the appropriate MPEG-2, DVB, ATSC, and ISDB-S/ARIB
standards. The following list describes operational monitoring requirements that
you may have for your environment:
H Ensure that transmitted data is free of defects and can be decoded
appropriately at the destination. This monitoring task is performed by the
Master client.
H Identify specific errors so you can isolate the source of errors quickly. This
analysis task is performed by the Expert Clients.
H Specify monitoring parameters for transport streams in ways that make sense
to you. This configuration task is performed by the Configuration Clients.
MTS300 MPEG Test System Real-Time Analysis User Manual
3- 3
Page 88

Reference
MPEG-2
MPEG stands for Motion Picture Experts Group. Among the standards
developed by this ISO body are the set of standards describing Transport Stream
System Target Decoders (T-STD) with defined behaviour when handling video,
audio, or data elementary streams or when handling PSI (Program Specific
Information) packets. By defining a T-STD, the output of encoders and
multiplexers is implied. Consequently, the output of any valid MPEG-2 encoder
or multiplexer can be used as input to another manufacturer’s decoder or
multiplexer.
MPEG-2 transport streams are two layer structures: the Compression layer (for
encoded audio, video, and data elementary streams) and the System layer (for
timing and describing different elements of the multiplexed transport stream and
the network over which it is carried).
Valid MPEG-2 transport streams require certain information that describes the
content and organization of transport streams and certain characteristics of the
network over which the transport stream is carried. This information is called
Program Specific Information (PSI) and is carried in table structures:
H Conditional Access Table (CA T)
H Network Information Table (NIT)
H Program Association T able (PAT)
H Program Map Table (PMT)
H Transport Stream Descriptor Table (TSDT)
See the MPEG-2 standards documents for more specific information about
encoding elementary streams, multiplexing transport stream elements, and these
transport stream structures.
One of the strengths of the MPEG standards is that they are generic and can be
adapted to different broadcast environments. Three groups, the Digital Video
Broadcasters (DVB), the Advanced Television Systems Committee (ATSC), and
the Association of Radio Industries and Business (ARIB) have created MPEG-2
compliant standards that are used in DVB, ATSC, and ISDB-S/ARIB markets.
3- 4
MTS300 MPEG Test System Real-Time Analysis User Manual
Page 89

Reference
DVB
DVB stands for Digital Video Broadcasting. DVB standards define MPEG-2
compatible transport streams used in DVB markets. The DVB standards define
baseline systems for cable (DVB-C), terrestrial (DVB-T), and satellite (DVB-S)
transmission environments.
Like the MPEG standards, the DVB standards describe both the compression
layer (for encoded audio, video, and data elementary streams) and the system
layer (for timing and describing different elements of the multiplexed transport
stream and the network over which it is carried) of DVB transport streams.
The DVB standards define additional service information (SI) used to describe
the network, transport stream, and services carried by the transport stream. This
additional information is provided by the following table structures:
H Bouquet Association Table (BAT)
H Event Information Table (EIT)
H Network Information Table (NIT)
H Running Status Table (RST)
H Service Description Table (SDT)
H Time and Date Table (TDT)
H Time Offset Table (TOT)
H Discontinuity Information Table (DIT)
H Selection Information Table (SIT)
See the DVB standards documents for more specific information about these
transport stream structures.
MTS300 MPEG Test System Real-Time Analysis User Manual
3- 5
Page 90

Reference
ATSC
ATSC stands for Advanced Television Systems Committee. ATSC standards
were developed by the ATSC Technology Group on Distribution (T3). These
standards define baseline systems for cable and terrestrial environments. ATSC
transport streams are valid MPEG-2 transport streams.
Like the MPEG standards, the ATSC standards describe both the compression
layer and the system layer for ATSC transport streams. The compression layer
refers to the encoded audio, video, and data elementary streams; the system layer
refers to timing information and descriptions of different elements of the
multiplexed transport stream and the network over which it is carried.
The ATSC standards define additional information required for ATSC environments. This information is carried in the following program and system
information protocol (PSIP) table structures:
H Event Information Table
H Extended Text Table
H Master Guide Table
H System Time Table
H Rating Region Table
H Virtual Channel Table
See the ATSC standards documents for more specific information about these
transport stream structures. One of the ATSC standard documents (ATSC
Document A/58) describes how to ensure that valid ATSC transport streams are
also valid DVB transport streams (conforming to DVB standards).
3- 6
MTS300 MPEG Test System Real-Time Analysis User Manual
Page 91

Reference
ARIB/ISDB Overview
ARIB stands for the Association of Radio Industries and Business. ARIB
standards define elements (carried in table structures) for managing ARIB-compliant transport streams (these are the ARIB structures analyzed by the MTS300
system):
H Broadcaster Information Table
H Download Control Table
H Download Table
H Software Download Trigger Table
ISDB-S/ARIB transport streams are MPEG-2 compliant streams that conform to
the ITU-R standard for ISDB-S (Integrated Service Digital Broadcasting,
Satellite) multiplexing. An ISDB stream uses TMCC (Transmission and
Multiplexing Configuration Control) data multiplexed in the first eight bytes of
the 16 Reed-Solomon bytes of 204 byte MPEG-2 transport streams. TMCC
information is used to manage the modulation parameters of the transponders in
digital broadcast environments that include multiple broadcasters and types of
services with different transmission requirements.
MTS300 MPEG Test System Real-Time Analysis User Manual
3- 7
Page 92

Reference
Client-Server Overview
This section briefly describes client-server software architecture and the two
server modules enabled by the MTS300 system software.
Client-Server
The client-server software architectural model allows software to be developed
into two or more modules:
H The server module performs CPU intensive operations, runs in the back-
ground (or remotely), and responds to requests from clients. Usually requests
are due to some action you have taken.
H The client module is often a graphical user interface that allows you to
configure or display the status of the server module.
The MTS300 system uses six servers (Server Manager, MPEG Analysis Server,
TMCC Analysis Server, Stream Recorder and Stream Player servers, and
Real-Time Multiplexer Server) to control any of the following client applications
you operating::
H Master Client
H Expert Client
H Configuration client
H Stream Recorder
H Stream Player
H TMCC Expert Client
3- 8
H TMCC Configuration Client
H OpenMux (MTS300, Option OM only)
Combined, the client and server modules enable you to monitor multiple
transport stream inputs simultaneously; perform in-depth analyses of one
transport stream input; configure the monitoring and reporting parameters of the
monitored inputs; and to create, generate, and capture transport streams.
MTS300 MPEG Test System Real-Time Analysis User Manual
Page 93

Reference
Analysis Servers
Server Manager
The Analysis Servers are the processes that perform the actual analyses on
transport stream inputs. Each Analysis Server process consists of an MPEG
Analysis Server and a TMCC Analysis Server. Each MTS300 system can
support up to two Analysis Server processes of each type simultaneously. The
Analysis Server sends analysis results to the Server Manager .
Each Analysis Server interacts with the following entities as described:
H The Master client displays the analysis results that are collected by the
Server Manager.
H The Expert clients display the results of the Analysis Servers directly.
H The Configuration clients set the monitoring and analysis parameters for
each input.
H The Server Manager collects the Analysis Server results (called traps).
The Server Manager is the process that allows the MTS300 system to be
managed over a network. The Server Manager also makes the results of the
Analysis Servers available to Master clients. Only one Server Manager can run
on an MTS300 system.
The Server Manager process is available to or responds to the following two
entities:
H The Master client, which displays the data collected by the Server Manager .
H The Analysis Server, which sends messages (or traps) to the Server Manager.
NOTE. Only one Master Client can be connected to a Server Manager at any
given time.
MTS300 MPEG Test System Real-Time Analysis User Manual
3- 9
Page 94

Reference
3- 10
MTS300 MPEG Test System Real-Time Analysis User Manual
Page 95

Master Client Reference
The Master Client interface elements are described in this section, followed by a
description of the tasks you perform when monitoring transport stream inputs.
The following list shows the contents and page references of the Master Client
Reference:
H Master Client Application Window page 3--11
H Master Client Toolbars and Icons page 3--17
H Master Client Menus page 3--22
H Workspace Dialog Box page 3--26
H Workspace Tasks page 3--29
H Error Reporting Tasks page 3--37
NOTE. An individual MTS300 system is limited to operating two Analysis Servers
at a time, and can launch only one Stream Player, one Stream Recorder, and one
OpenMux application at a time. In addition, the MTS300 system is limited to an
aggregate data rate of 140 Mbs between all operating applications.
Master Client Application Window
When you first start the Master Client application, the panels of the application
workspace are empty. Before you can monitor inputs or generate a transport
stream output, you must first connect the Master Client to a Server Manager and
then assign the I/O ports to an Analysis Server or application. After you connect
to an Analysis Server, the Master Client workspace displays the current status of
the I/O ports on the MTS300 system to which you are connected.
The status displayed for each I/O port depends on which application is assigned
to the I/O port. The status of a monitored program stream depends on the
analyses being performed by an Analysis Server . The Analysis Server sends error
messages or traps to the local Server Manager. This error information is
presented using the interface elements of the Master Client.
MTS300 MPEG Test System Real-Time Analysis User Manual
3- 11
Page 96

Master Client Reference
Title bar
Menu bar
Toolbar
Selection
indicator
bar
Port
Manager
panel
The Master Client application window (see Figure 3--1) includes three primary
panels: Port Manager, Services, and Details. This section describes each of the
elements of the Master Client workspace.
You can resize the Master Client application window using standard Windows NT techniques.
Address bar
Services
panel
Details
panel
Status bar
Figure 3- 1: Master Client application window
Title Bar
The Title bar is a standard Windows NT title bar:
H Clicking the application icon in the upper left-hand corner of the application
window displays a Windows NT Control menu.
H The application name is followed by the name of the open workspace file.
H The upper right-hand corner uses standard window control buttons to
minimize, maximize, or close the Master Client window.
3- 12
Menu Bar
The Menu bar contains menu for performing various monitoring functions. See
Master Client Menus on page 3--22 for information regarding the Master Client
menus and menu selections.
MTS300 MPEG Test System Real-Time Analysis User Manual
Page 97

Master Client Reference
Status Bar
Toolbar
Address Bar
Selection Indicator Bar
The Status bar is located at the bottom of the Master Client window and displays
brief messages about selected menu items. The Status bar also displays the
number of inputs and services being monitored.
The toolbar buttons shown in Figure 3--1 provide shortcuts to the following
menu selections: Disconnect (from the Master menu), Edit (from the W orkspace
menu), and Acknowledge Past Errors (from the Master menu). See Table 3--1 on
page 3--17 for more information about the Master Client toolbar buttons.
The Address bar indicates the name or IP address of the MTS300 system running
the Server Manager to which you are connected. You can enter the name or IP
address directly or you can use the selection box to choose a remote machine
name. The selection box is available only when the Master Client is disconnected from a Server Manager.
The selection box keeps a record of the MTS300 systems to which you have
successfully connected. So, rather than entering a host name or IP address each
time you connect to a remote machine, you can choose the name from the list.
You can choose to display or hide the Address bar using the View menu.
The Selection Indicator bar shows you which Master Client workspace items are
currently selected. In Figure 3--1 on page 3-- 12, the Selection Indicator bar shows
the name of the input (Analysis Server), and service (TSID 0) selected.
Port Manager Panel
The Port Manager panel is located at the left of the Master Client window. The
Port Manager panel displays icons representing the I/O ports for the Server
Manager to which you are connected. Each I/O port icon represents one
input/output channel pair. You can only assign one Analysis Server or
application to one I/O pair at a time.
Initially the I/O ports are represented by icons labeled Free. The Free icon shows
that the server for that particular I/O port has not been assigned to an Analysis
Server or application.
Before you can monitor a transport stream input or generate a stream output, you
must assign the I/O port to an Analysis Server or application using the shortcut
menu, which is accessed by right-clicking a Free I/O icon.
You can configure icons in the Port Manger panel to be shown as large or small
icons, and to be sorted by error (multiplexes with errors are displayed before
multiplexes without errors), by MTS300 system name, or by TSID.
You can resize the height and/or width of the Port Manger panel by clicking and
dragging the lower or right-panel border.
MTS300 MPEG Test System Real-Time Analysis User Manual
3- 13
Page 98

Master Client Reference
When you select a Port Manager panel Analysis Server icon, the Services panel
and the Details panel both change:
H The Services panel changes to show icons for the services that you are
monitoring on that input.
H The Details panel changes to show icons indicating the error type and
severity of MPEG, DVB, or ATSC transport stream level errors.
Error Icons. The error icons that overlay the input icons in the Port Manager
panel are used to show the status of errors on the input:
H Red error icons indicate that transport stream, or one or more services in the
transport stream are experiencing an error.
H Orange error icons indicate that the transport stream, or one or more services
in the transport stream, recorded one or more errors, but that the error
condition no longer exists.
H Yellow error icons indicate that a warning condition exists for one or more
services in the transport stream.
Services Panel
Shortcut Menus. Right-click an icon in the Port Manager panel open a shortcut
menu. The selections available in the shortcut menu depend on the type of icon
selected in the Port Manager panel. You will use the shortcut menus to assign
I/O ports to applications and to start the Expert Client or Configuration Client
for an Analysis Server. See Port Manager Panel Shortcut Menus on page 3--23
for a description of the shortcut menu commands.
The Services panel displays icons for the selected input and is located to the right
of the Master Client window. You can resize the width of the Service panel by
clicking and dragging the left panel border, and you can resize the height by
dragging the lower panel border.
A default service icon is used to display each monitored service in the selected
Multiplex. You can also assign a custom icon to each service (see Assigning a
Logo to a Service Icon on page 3--33).
By selecting an Analysis Server icon in the Port Manager panel, and then
double-clicking an icon in the Services panel, you can start the Expert Client.
The Expert Client will be connected to the Analysis Server on the selected input.
When the Expert Client is displayed, the Report view will be in the Program
mode showing the error messages for the selected service.
3- 14
MTS300 MPEG Test System Real-Time Analysis User Manual
Page 99

Master Client Reference
The Services panel has three modes of display that you can select from the
shortcut menu:
H Large Icons
H Small Icons
H Details
The first two are basic views: you can view the service icons as either small or
large icons. In both cases, if the transport stream encodes the name for the
service, the name appears with the icon. If no name is provided, the service icon
is identified by the Transport Stream ID | Service ID (TSID | SID) pair. You can
display the TSID | SID pair by pausing your cursor over a service icon; a tool tip
is displayed showing the TSID | SID pair.
The Details view of the Services panel is shown in Figure 3--2. Display this view
by right-clicking in the Services panel and selecting Details from the shortcut
menu.
Figure 3- 2: Details view of the Services panel
The Details view provides the following information in tabular format (listed
from left to right):
H Service Name. Displays an icon for each program or service and lists the
service name for each input (if service names are provided in the transport
stream)
H TSID. Displays the TSID for the selected I/O port.
H Service ID. Displays the SID for the program or service.
H Host name. Displays the name of the MTS300 system to which you are
connected.
H IP Address. Displays the IP address of the MTS300 system to which you are
connected.
MTS300 MPEG Test System Real-Time Analysis User Manual
3- 15
Page 100

Master Client Reference
H Input name. Displays the I/O port number on the MTS300 system to which
you are connected (I/O#1, I/O#2, I/O#3, or I/O#4).
H Error level. Displays the error-severity level of the current error (if there is
no current error, the report is “no error”).
You can sort the icons in the Service panel by name, error, TSID, or SID using
the Services panel shortcut menu.
Error Icons. When you select a service experiencing an error in any of the
Services panel views, the Details panel updates to display more information
about the errors detected for that service.
The error icons that overlay the icons in the Service panel are used to show the
status of errors on the input:
H Red error icons indicate that an error is detected for the monitored service.
H Orange error icons indicate that the service recorded one or more errors, but
that the error condition no longer exists.
Details Panel
H Yellow error icons indicate that a warning condition exists for the monitored
service.
The Details panel displays icons representing error status, types, and levels for a
selected service or multiplex. You can resize the height of the Details panel by
clicking and dragging the top panel border.
The Details panel contains icons only if you have selected a multiplex or service
icon that has an error associated with it. If the selected multiplex or service icon
has no errors (past or present), or if you click in the white space of the Multiplex
or Service panel, the Details panel goes blank.
From left to right in the Details panel, you will see the types of icons indicated in
the following list (see Master Client Toolbars and Icons beginning on page 3--17
for more information about these elements):
H Error severity gauge indicating the highest error level, current or past, for the
selected item (multiplex or service)
H Icons that represent the selected multiplex or service
H Icons indicating the service error types, current or past, for the selected
service
3- 16
H Icons indicating the multiplex error type, current or past, for the selected
multiplex
The last two list items are mutually exclusive: the Details panel displays one or
the other, not both at the same time.
MTS300 MPEG Test System Real-Time Analysis User Manual
 Loading...