

Page 1

User Manual
MTS 100
MPEG Test System
Software Version 2.1
070-9376-06
Page 2

Copyright T ektronix, Inc. All rights reserved. Licensed software products are owned by Tektronix or its suppliers and
are protected by United States copyright laws and international treaty provisions.
Portions Copyright 1994–1995 Blue Sky Software Corporation. All rights Reserved.
Use, duplication, or disclosure by the Government is subject to restrictions as set forth in subparagraph (c)(1)(ii) of the
Rights in T echnical Data and Computer Software clause at DFARS 252.227-7013, or subparagraphs (c)(1) and (2) of the
Commercial Computer Software – Restricted Rights clause at F AR 52.227-19, as applicable.
T ektronix products are covered by U.S. and foreign patents, issued and pending. Information in this publication supercedes
that in all previously published material. Specifications and price change privileges reserved.
Microsoft, MS, MS-DOS, Windows, Windows NT, and Win 32 are registered trademarks of Microsoft Corporation.
HASP is a registered trademark of Aladdin Knowledge System Ltd.
Matra is a trademark of Matra Communication
Printed in the U.S.A.
T ektronix, Inc., P.O. Box 1000, Wilsonville, OR 97070–1000
TEKTRONIX and TEK are registered trademarks of T ektronix, Inc.
Page 3

WARRANTY
T ektronix warrants that this product will be free from defects in materials and workmanship for a period of one (1) year
from the date of shipment. If any such product proves defective during this warranty period, T ektronix, at its option, either
will repair the defective product without charge for parts and labor, or will provide a replacement in exchange for the
defective product.
In order to obtain service under this warranty, Customer must notify Tektronix of the defect before the expiration of the
warranty period and make suitable arrangements for the performance of service. Customer shall be responsible for
packaging and shipping the defective product to the service center designated by T ektronix, with shipping charges prepaid.
T ektronix shall pay for the return of the product to Customer if the shipment is to a location within the country in which the
T ektronix service center is located. Customer shall be responsible for paying all shipping charges, duties, taxes, and any
other charges for products returned to any other locations.
This warranty shall not apply to any defect, failure or damage caused by improper use or improper or inadequate
maintenance and care. T ektronix shall not be obligated to furnish service under this warranty a) to repair damage resulting
from attempts by personnel other than T ektronix representatives to install, repair or service the product; b) to repair
damage resulting from improper use or connection to incompatible equipment; or c) to service a product that has been
modified or integrated with other products when the effect of such modification or integration increases the time or
difficulty of servicing the product.
THIS WARRANTY IS GIVEN BY TEKTRONIX WITH RESPECT TO THIS PRODUCT IN LIEU OF ANY
OTHER WARRANTIES, EXPRESSED OR IMPLIED. TEKTRONIX AND ITS VENDORS DISCLAIM ANY
IMPLIED WARRANTIES OF MERCHANTABILITY OR FITNESS FOR A PARTICULAR PURPOSE.
TEKTRONIX’ RESPONSIBILITY TO REPAIR OR REPLACE DEFECTIVE PRODUCTS IS THE SOLE AND
EXCLUSIVE REMEDY PROVIDED TO THE CUST OMER FOR BREACH OF THIS WARRANTY. TEKTRONIX
AND ITS VENDORS WILL NOT BE LIABLE FOR ANY INDIRECT , SPECIAL, INCIDENTAL, OR
CONSEQUENTIAL DAMAGES IRRESPECTIVE OF WHETHER TEKTRONIX OR THE VENDOR HAS
ADVANCE NOTICE OF THE POSSIBILITY OF SUCH DAMAGES.
Page 4

Page 5

Table of Contents
Getting Started
Operating Basics
General Safety Summary xiii. . . . . . . . . . . . . . . . . . . . . . . . . . . . . . . . . . . .
Product Description 1–1. . . . . . . . . . . . . . . . . . . . . . . . . . . . . . . . . . . . . . . . .
Overview 1–1. . . . . . . . . . . . . . . . . . . . . . . . . . . . . . . . . . . . . . . . . . . . . . . . . . . . . . .
Applications 1–1. . . . . . . . . . . . . . . . . . . . . . . . . . . . . . . . . . . . . . . . . . . . . . . . . . . . .
Accessories 1–5. . . . . . . . . . . . . . . . . . . . . . . . . . . . . . . . . . . . . . . . . . . . . . . .
Installation 1–7. . . . . . . . . . . . . . . . . . . . . . . . . . . . . . . . . . . . . . . . . . . . . . . .
Assembling the MTS 100 System 1–7. . . . . . . . . . . . . . . . . . . . . . . . . . . . . . . . . . . .
Power Mains 1–9. . . . . . . . . . . . . . . . . . . . . . . . . . . . . . . . . . . . . . . . . . . . . . . . . . . . .
Parallel Port 1–11. . . . . . . . . . . . . . . . . . . . . . . . . . . . . . . . . . . . . . . . . . . . . . . . . . . . .
MTS 100 I/O 1–12. . . . . . . . . . . . . . . . . . . . . . . . . . . . . . . . . . . . . . . . . . . . . . . . . . . .
Cables and Mating Connectors for MTS 100 Inputs/Outputs 1–17. . . . . . . . . . . . . . .
Adapters 1–18. . . . . . . . . . . . . . . . . . . . . . . . . . . . . . . . . . . . . . . . . . . . . . . . . . . . . . . .
First Time Operation 1–19. . . . . . . . . . . . . . . . . . . . . . . . . . . . . . . . . . . . . . .
Logging In 1–19. . . . . . . . . . . . . . . . . . . . . . . . . . . . . . . . . . . . . . . . . . . . . . . . . . . . . .
The Initial Window 1–20. . . . . . . . . . . . . . . . . . . . . . . . . . . . . . . . . . . . . . . . . . . . . . .
Additional Support 1–20. . . . . . . . . . . . . . . . . . . . . . . . . . . . . . . . . . . . . . . . . . . . . . . .
Operating Basics 2–1. . . . . . . . . . . . . . . . . . . . . . . . . . . . . . . . . . . . . . . . . . .
Running the Software 2–1. . . . . . . . . . . . . . . . . . . . . . . . . . . . . . . . . . . . . . . . . . . . . .
Tutorials and Reference Sections 2–2. . . . . . . . . . . . . . . . . . . . . . . . . . . . . . . . . . . . .
Getting Elementary Bit Stream Files 2–2. . . . . . . . . . . . . . . . . . . . . . . . . . . . . . . . . .
Tutorial: Analyze a Signal 2–7. . . . . . . . . . . . . . . . . . . . . . . . . . . . . . . . . . .
Terms 2–7. . . . . . . . . . . . . . . . . . . . . . . . . . . . . . . . . . . . . . . . . . . . . . . . . . . . . . . . . .
Getting Help 2–7. . . . . . . . . . . . . . . . . . . . . . . . . . . . . . . . . . . . . . . . . . . . . . . . . . . . .
Starting the Analyzer Application 2–8. . . . . . . . . . . . . . . . . . . . . . . . . . . . . . . . . . . .
Opening an Existing Transport Stream File 2–10. . . . . . . . . . . . . . . . . . . . . . . . . . . . .
The Hierarchic View 2–11. . . . . . . . . . . . . . . . . . . . . . . . . . . . . . . . . . . . . . . . . . . . . .
Additional Information from the TS Icon 2–13. . . . . . . . . . . . . . . . . . . . . . . . . . . . . .
Additional Information from the Transport Packet Icon 2–19. . . . . . . . . . . . . . . . . . .
Additional Information from the PAT Icon 2–21. . . . . . . . . . . . . . . . . . . . . . . . . . . . .
Additional Information from the PMT Icon 2–23. . . . . . . . . . . . . . . . . . . . . . . . . . . .
Additional Information from the PES Packet Icon 2–30. . . . . . . . . . . . . . . . . . . . . . .
Viewing PSI/SI Data 2–36. . . . . . . . . . . . . . . . . . . . . . . . . . . . . . . . . . . . . . . . . . . . . .
Automatic Analysis 2–38. . . . . . . . . . . . . . . . . . . . . . . . . . . . . . . . . . . . . . . . . . . . . . .
Quitting the Analyzer 2–43. . . . . . . . . . . . . . . . . . . . . . . . . . . . . . . . . . . . . . . . . . . . . .
Tutorial: Creating an MPEG-2 Transport Stream 2–45. . . . . . . . . . . . . . . .
Terms 2–45. . . . . . . . . . . . . . . . . . . . . . . . . . . . . . . . . . . . . . . . . . . . . . . . . . . . . . . . . .
Start the Multiplexer 2–45. . . . . . . . . . . . . . . . . . . . . . . . . . . . . . . . . . . . . . . . . . . . . .
Making a Simple Transport Stream File 2–46. . . . . . . . . . . . . . . . . . . . . . . . . . . . . . .
Making a Complex Transport Stream File 2–60. . . . . . . . . . . . . . . . . . . . . . . . . . . . . .
Sending a Transport Stream 2–75. . . . . . . . . . . . . . . . . . . . . . . . . . . . . . . . . . . . . . . . .
MTS 100 MPEG Test System User Manual
i
Page 6

Table of Contents
Reference
Tutorial:
Creating Transport Stream Files with DVB Information 2–83. . . . . . .
Using the Analyzer 3–1. . . . . . . . . . . . . . . . . . . . . . . . . . . . . . . . . . . . . . . . .
Overview 3–1. . . . . . . . . . . . . . . . . . . . . . . . . . . . . . . . . . . . . . . . . . . . . . . . . . . . . . .
T erms 3–2. . . . . . . . . . . . . . . . . . . . . . . . . . . . . . . . . . . . . . . . . . . . . . . . . . . . . . . . . .
Analyzer Application Window 3–3. . . . . . . . . . . . . . . . . . . . . . . . . . . . . . . . . . . . . . .
Opening a File 3–12. . . . . . . . . . . . . . . . . . . . . . . . . . . . . . . . . . . . . . . . . . . . . . . . . . .
The Hierarchic View 3–13. . . . . . . . . . . . . . . . . . . . . . . . . . . . . . . . . . . . . . . . . . . . . .
The Interpreted View 3–17. . . . . . . . . . . . . . . . . . . . . . . . . . . . . . . . . . . . . . . . . . . . . .
Hexadecimal and Binary Views 3–21. . . . . . . . . . . . . . . . . . . . . . . . . . . . . . . . . . . . . .
Multiplex Analyses 3–22. . . . . . . . . . . . . . . . . . . . . . . . . . . . . . . . . . . . . . . . . . . . . . .
Check CRC 3–24. . . . . . . . . . . . . . . . . . . . . . . . . . . . . . . . . . . . . . . . . . . . . . . . . . . . . .
Syntax Analysis 3–25. . . . . . . . . . . . . . . . . . . . . . . . . . . . . . . . . . . . . . . . . . . . . . . . . .
Consistency Check 3–26. . . . . . . . . . . . . . . . . . . . . . . . . . . . . . . . . . . . . . . . . . . . . . . .
PSI/SI Rate Analysis 3–29. . . . . . . . . . . . . . . . . . . . . . . . . . . . . . . . . . . . . . . . . . . . . .
Timing Analyses 3–30. . . . . . . . . . . . . . . . . . . . . . . . . . . . . . . . . . . . . . . . . . . . . . . . .
Semantic Analysis 3–37. . . . . . . . . . . . . . . . . . . . . . . . . . . . . . . . . . . . . . . . . . . . . . . .
Dynamic Analysis 3–38. . . . . . . . . . . . . . . . . . . . . . . . . . . . . . . . . . . . . . . . . . . . . . . .
Automatic Analysis 3–44. . . . . . . . . . . . . . . . . . . . . . . . . . . . . . . . . . . . . . . . . . . . . . .
Filters 3–46. . . . . . . . . . . . . . . . . . . . . . . . . . . . . . . . . . . . . . . . . . . . . . . . . . . . . . . . . .
Extracting and Saving Stream Elements 3–53. . . . . . . . . . . . . . . . . . . . . . . . . . . . . . .
The Options Menu 3–55. . . . . . . . . . . . . . . . . . . . . . . . . . . . . . . . . . . . . . . . . . . . . . . .
Using the Multiplexer 3–59. . . . . . . . . . . . . . . . . . . . . . . . . . . . . . . . . . . . . . .
Overview 3–59. . . . . . . . . . . . . . . . . . . . . . . . . . . . . . . . . . . . . . . . . . . . . . . . . . . . . . .
Starting the Multiplexer 3–61. . . . . . . . . . . . . . . . . . . . . . . . . . . . . . . . . . . . . . . . . . . .
The Application Window 3–62. . . . . . . . . . . . . . . . . . . . . . . . . . . . . . . . . . . . . . . . . . .
The Hierarchic View 3–67. . . . . . . . . . . . . . . . . . . . . . . . . . . . . . . . . . . . . . . . . . . . . .
The Dynamic View 3–71. . . . . . . . . . . . . . . . . . . . . . . . . . . . . . . . . . . . . . . . . . . . . . .
The Multiplexer Environment 3–73. . . . . . . . . . . . . . . . . . . . . . . . . . . . . . . . . . . . . . .
Creating and Editing a Configuration File 3–79. . . . . . . . . . . . . . . . . . . . . . . . . . . . . .
Generating a Multiplex 3–98. . . . . . . . . . . . . . . . . . . . . . . . . . . . . . . . . . . . . . . . . . . .
An Example Configuration File 3–99. . . . . . . . . . . . . . . . . . . . . . . . . . . . . . . . . . . . . .
Using the PSI and SI Table Editor 3–103. . . . . . . . . . . . . . . . . . . . . . . . . . . . .
Edit Table Application Window 3–104. . . . . . . . . . . . . . . . . . . . . . . . . . . . . . . . . . . . . .
T able File Operations 3–110. . . . . . . . . . . . . . . . . . . . . . . . . . . . . . . . . . . . . . . . . . . . . .
T able Sections 3–113. . . . . . . . . . . . . . . . . . . . . . . . . . . . . . . . . . . . . . . . . . . . . . . . . . .
Coherence Analysis 3–115. . . . . . . . . . . . . . . . . . . . . . . . . . . . . . . . . . . . . . . . . . . . . . .
Adding T able Items 3–116. . . . . . . . . . . . . . . . . . . . . . . . . . . . . . . . . . . . . . . . . . . . . . .
T able Item Parameters 3–120. . . . . . . . . . . . . . . . . . . . . . . . . . . . . . . . . . . . . . . . . . . . .
Learning More About T able Items 3–146. . . . . . . . . . . . . . . . . . . . . . . . . . . . . . . . . . . .
Global View 3–148. . . . . . . . . . . . . . . . . . . . . . . . . . . . . . . . . . . . . . . . . . . . . . . . . . . . .
Creating Files with Complex Associations (Tutorial) 3–150. . . . . . . . . . . . . . . . . . . . .
Using the Data Store Administrator 3–161. . . . . . . . . . . . . . . . . . . . . . . . . . .
Terms 3–161. . . . . . . . . . . . . . . . . . . . . . . . . . . . . . . . . . . . . . . . . . . . . . . . . . . . . . . . . .
Special Features of the Data Store Disks 3–162. . . . . . . . . . . . . . . . . . . . . . . . . . . . . . .
Starting the Application 3–163. . . . . . . . . . . . . . . . . . . . . . . . . . . . . . . . . . . . . . . . . . . .
The Application Window 3–164. . . . . . . . . . . . . . . . . . . . . . . . . . . . . . . . . . . . . . . . . . .
Menus 3–165. . . . . . . . . . . . . . . . . . . . . . . . . . . . . . . . . . . . . . . . . . . . . . . . . . . . . . . . . .
T oolbar Command Buttons 3–166. . . . . . . . . . . . . . . . . . . . . . . . . . . . . . . . . . . . . . . . .
ii
MTS 100 MPEG Test System User Manual
Page 7

Appendices
Table of Contents
Using File Menu Commands 3–167. . . . . . . . . . . . . . . . . . . . . . . . . . . . . . . . . . . . . . . .
Using Acq/Gen Menu Commands 3–171. . . . . . . . . . . . . . . . . . . . . . . . . . . . . . . . . . . .
Using Service Menu Commands 3–179. . . . . . . . . . . . . . . . . . . . . . . . . . . . . . . . . . . . .
Changing MSB/LSB Order 3–183. . . . . . . . . . . . . . . . . . . . . . . . . . . . . . . . . . . . . . . . .
MTS 100 to MTS 100 Transfers 3–184. . . . . . . . . . . . . . . . . . . . . . . . . . . . . . . . . . . . . .
Problems 3–185. . . . . . . . . . . . . . . . . . . . . . . . . . . . . . . . . . . . . . . . . . . . . . . . . . . . . . . .
Using the Packet Jitter Application 3–189. . . . . . . . . . . . . . . . . . . . . . . . . . . .
Application 3–189. . . . . . . . . . . . . . . . . . . . . . . . . . . . . . . . . . . . . . . . . . . . . . . . . . . . . .
T erms 3–189. . . . . . . . . . . . . . . . . . . . . . . . . . . . . . . . . . . . . . . . . . . . . . . . . . . . . . . . . .
Starting the Packet Jitter Application 3–190. . . . . . . . . . . . . . . . . . . . . . . . . . . . . . . . . .
Menu Commands 3–190. . . . . . . . . . . . . . . . . . . . . . . . . . . . . . . . . . . . . . . . . . . . . . . . .
T oolbar 3–197. . . . . . . . . . . . . . . . . . . . . . . . . . . . . . . . . . . . . . . . . . . . . . . . . . . . . . . . .
Using DVB Channel Coding & Decoding 3–199. . . . . . . . . . . . . . . . . . . . . . .
Starting the Application 3–200. . . . . . . . . . . . . . . . . . . . . . . . . . . . . . . . . . . . . . . . . . . .
Menu Commands 3–201. . . . . . . . . . . . . . . . . . . . . . . . . . . . . . . . . . . . . . . . . . . . . . . . .
Coding 3–214. . . . . . . . . . . . . . . . . . . . . . . . . . . . . . . . . . . . . . . . . . . . . . . . . . . . . . . . .
Appendix A: Specifications A–1. . . . . . . . . . . . . . . . . . . . . . . . . . . . . . . . . . .
Performance Conditions A–1. . . . . . . . . . . . . . . . . . . . . . . . . . . . . . . . . . . . . . . . . . . .
Hardware Electrical Specifications A–2. . . . . . . . . . . . . . . . . . . . . . . . . . . . . . . . . . .
Power Specifications A–13. . . . . . . . . . . . . . . . . . . . . . . . . . . . . . . . . . . . . . . . . . . . . .
Mechanical (Physical) Characteristics A–13. . . . . . . . . . . . . . . . . . . . . . . . . . . . . . . . .
Environmental Characteristics A–13. . . . . . . . . . . . . . . . . . . . . . . . . . . . . . . . . . . . . . .
Appendix B: What to Do if an Application Locks Up B–1. . . . . . . . . . . . .
Appendix C: Software Repair C–1. . . . . . . . . . . . . . . . . . . . . . . . . . . . . . . .
Creating and Using an Emergency Repair Disk C–1. . . . . . . . . . . . . . . . . . . . . . . . .
Reinstalling the MTS 100 Software C–3. . . . . . . . . . . . . . . . . . . . . . . . . . . . . . . . . . .
Files Included with the MTS 100 C–14. . . . . . . . . . . . . . . . . . . . . . . . . . . . . . . . . . . . .
Appendix D: Analyzer Tests D–1. . . . . . . . . . . . . . . . . . . . . . . . . . . . . . . . . .
Compliance at the Transport Stream Level D–1. . . . . . . . . . . . . . . . . . . . . . . . . . . . .
Compliance at the PES Packet Level D–6. . . . . . . . . . . . . . . . . . . . . . . . . . . . . . . . . .
Compliance at the PSI level D–8. . . . . . . . . . . . . . . . . . . . . . . . . . . . . . . . . . . . . . . . .
Compliance for the Descriptors D–12. . . . . . . . . . . . . . . . . . . . . . . . . . . . . . . . . . . . . .
Appendix E: Functional Check E–1. . . . . . . . . . . . . . . . . . . . . . . . . . . . . . .
Required Equipment E–1. . . . . . . . . . . . . . . . . . . . . . . . . . . . . . . . . . . . . . . . . . . . . . .
Procedure E–2. . . . . . . . . . . . . . . . . . . . . . . . . . . . . . . . . . . . . . . . . . . . . . . . . . . . . . .
Appendix F: Repackaging F–1. . . . . . . . . . . . . . . . . . . . . . . . . . . . . . . . . . .
Glossary Index
MTS 100 MPEG Test System User Manual
iii
Page 8

Table of Contents
List of Figures
Figure 1–1: The rear panel of the MTS 100 server 1–9. . . . . . . . . . . . . . .
Figure 1–2: MTS100 HASP 1–11. . . . . . . . . . . . . . . . . . . . . . . . . . . . . . . . . .
Figure 1–3: The MTS 100 signal I/O ports 1–12. . . . . . . . . . . . . . . . . . . . . .
Figure 1–4: Turning on the MTS 100 MPEG Test System 1–19. . . . . . . . .
Figure 1–5: The Tektronix MTS 100 V2.1 submenu 1–20. . . . . . . . . . . . . .
Figure 2–1: Starting the MPEG-2 Help utility 2–7. . . . . . . . . . . . . . . . . . .
Figure 2–2: Starting the Analyzer 2–8. . . . . . . . . . . . . . . . . . . . . . . . . . . . .
Figure 2–3: The Analyzer application window 2–8. . . . . . . . . . . . . . . . . . .
Figure 2–4: Command buttons on the upper toolbar 2–9. . . . . . . . . . . . .
Figure 2–5: Command buttons on the lower toolbar 2–10. . . . . . . . . . . . . .
Figure 2–6: Using the status bar 2–10. . . . . . . . . . . . . . . . . . . . . . . . . . . . . .
Figure 2–7: The Open dialog box 2–10. . . . . . . . . . . . . . . . . . . . . . . . . . . . . .
Figure 2–8: The hierarchic view of the SAMPLE.TRP stream 2–11. . . . .
Figure 2–9: Hierarchic view shortcut menus 2–13. . . . . . . . . . . . . . . . . . . .
Figure 2–10: The TS icon shortcut menu 2–13. . . . . . . . . . . . . . . . . . . . . . .
Figure 2–11: The interpreted view of the first transport packet 2–14. . . . .
Figure 2–12: Command buttons on the lower toolbar 2–14. . . . . . . . . . . . .
Figure 2–13: Double-click for an explanation of the field 2–15. . . . . . . . . .
Figure 2–14: Help information for the packet field value 2–15. . . . . . . . . .
Figure 2–15: Press F2 to toggle numeric base 2–16. . . . . . . . . . . . . . . . . . . .
Figure 2–16: The View Type submenu 2–16. . . . . . . . . . . . . . . . . . . . . . . . .
Figure 2–17: Hexadecimal view of a transport packet 2–16. . . . . . . . . . . .
Figure 2–18: The TS icon shortcut menu 2–17. . . . . . . . . . . . . . . . . . . . . . .
Figure 2–19: The PID map of SAMPLE.TRP packets 1 to 100 2–17. . . . .
Figure 2–20: The Multiplex Allocation document window 2–18. . . . . . . . .
Figure 2–21: Double-click on the PID 21 icon 2–19. . . . . . . . . . . . . . . . . . .
Figure 2–22: Interpreted view of the first PID 21 transport packet 2–19. .
Figure 2–23: The last PID 21 packet in SAMPLE.TRP 2–20. . . . . . . . . . . .
Figure 2–24: The View Type submenu 2–20. . . . . . . . . . . . . . . . . . . . . . . . .
Figure 2–25: The binary view of PID 21 item 14 2–21. . . . . . . . . . . . . . . . .
Figure 2–26: The PAT icon shortcut menu 2–21. . . . . . . . . . . . . . . . . . . . . .
Figure 2–27: The PAT section interpreted view 2–22. . . . . . . . . . . . . . . . . .
Figure 2–28: The CRC Analysis dialog box 2–22. . . . . . . . . . . . . . . . . . . . .
Figure 2–29: The PMT shortcut menu 2–23. . . . . . . . . . . . . . . . . . . . . . . . .
iv
MTS 100 MPEG Test System User Manual
Page 9

Table of Contents
Figure 2–30: The PMT interpreted view 2–23. . . . . . . . . . . . . . . . . . . . . . . .
Figure 2–31: Choosing Syntaxic from the Analysis menu 2–24. . . . . . . . . .
Figure 2–32: The Syntax Analysis message window 2–24. . . . . . . . . . . . . .
Figure 2–33: A message window listing syntax errors 2–25. . . . . . . . . . . . .
Figure 2–34: Choosing Check CRC from the Analysis menu 2–25. . . . . . .
Figure 2–35: CRCs in all sections are correct 2–26. . . . . . . . . . . . . . . . . . . .
Figure 2–36: The PMT shortcut menu 2–26. . . . . . . . . . . . . . . . . . . . . . . . .
Figure 2–37: The PCR analysis display 2–26. . . . . . . . . . . . . . . . . . . . . . . . .
Figure 2–38: Double-click on the clock icon to list clock values 2–27. . . . .
Figure 2–39: The PCR View Type submenu 2–27. . . . . . . . . . . . . . . . . . . . .
Figure 2–40: The PCR values display 2–28. . . . . . . . . . . . . . . . . . . . . . . . . .
Figure 2–41: Visual TSTD and LTW selected 2–28. . . . . . . . . . . . . . . . . . . .
Figure 2–42: Choosing T-STD Analysis from the shortcut menu 2–29. . . .
Figure 2–43: The T-STD Buffering Simulation window 2–29. . . . . . . . . . .
Figure 2–44: The T-STD error list 2–30. . . . . . . . . . . . . . . . . . . . . . . . . . . . .
Figure 2–45: The drop-down menu for the PES icon 2–30. . . . . . . . . . . . .
Figure 2–46: The PES packet interpreted view 2–31. . . . . . . . . . . . . . . . . .
Figure 2–47: The PES Packet with the errors circled 2–31. . . . . . . . . . . . .
Figure 2–48: Double-click for information about the field 2–32. . . . . . . . .
Figure 2–49: Double-click for information for the field value 2–32. . . . . .
Figure 2–50: The PID 50 PES shortcut menu 2–33. . . . . . . . . . . . . . . . . . . .
Figure 2–51: The PTS/DTS diagram 2–33. . . . . . . . . . . . . . . . . . . . . . . . . . .
Figure 2–52: PTS/DTS diagram from a correctly encoded stream 2–34. .
Figure 2–53: Information about the first arrival time 2–35. . . . . . . . . . . . .
Figure 2–54: Information about the first access unit 2–36. . . . . . . . . . . . . .
Figure 2–55: The check mark indicates that DVB is selected 2–36. . . . . . .
Figure 2–56: The PSI/SI Selection dialog box 2–37. . . . . . . . . . . . . . . . . . . .
Figure 2–57: The NIT section interpreted view 2–37. . . . . . . . . . . . . . . . . .
Figure 2–58: Double-click for an ASCII decode of the descriptor 2–38. . .
Figure 2–59: The automatic analysis Options dialog box 2–39. . . . . . . . . .
Figure 2–60: The automatic analysis window 2–40. . . . . . . . . . . . . . . . . . . .
Figure 2–61: Double-click for error details 2–40. . . . . . . . . . . . . . . . . . . . . .
Figure 2–62: The list of syntax errors found in SAMPLE.TRP 2–41. . . . .
Figure 2–63: Interpreted view of a PES packet with syntax errors 2–41. .
Figure 2–64: The Multiplexer application window 2–46. . . . . . . . . . . . . . .
Figure 2–65: The New configuration file dialog box 2–46. . . . . . . . . . . . . .
Figure 2–66: The default configuration in the application window 2–47. .
Figure 2–67: The Stream to Add dialog box 2–50. . . . . . . . . . . . . . . . . . . . .
MTS 100 MPEG Test System User Manual
v
Page 10

Table of Contents
Figure 2–68: The hierarchy with a video icon added to program 1 2–50. .
Figure 2–69: The hierarchy with the audio and data icons added 2–51. . .
Figure 2–70: The Video Stream dialog box 2–51. . . . . . . . . . . . . . . . . . . . . .
Figure 2–71: The Video Stream Selection dialog box 2–52. . . . . . . . . . . . .
Figure 2–72: Click OK and select another (.mp2) file 2–52. . . . . . . . . . . . .
Figure 2–73: Details of the selected video elementary stream 2–53. . . . . . .
Figure 2–74: The display after a video file is associated 2–54. . . . . . . . . . .
Figure 2–75: The Audio Stream dialog box 2–54. . . . . . . . . . . . . . . . . . . . .
Figure 2–76: The Audio Stream Selection dialog box 2–55. . . . . . . . . . . . .
Figure 2–77: Details of the selected audio elementary stream 2–55. . . . . .
Figure 2–78: The display after an audio file is associated 2–56. . . . . . . . . .
Figure 2–79: The Data Stream dialog box 2–57. . . . . . . . . . . . . . . . . . . . . .
Figure 2–80: Click Yes to delete the data stream icon 2–57. . . . . . . . . . . . .
Figure 2–81: The hierarchy with the Data icon deleted 2–58. . . . . . . . . . . .
Figure 2–82: The Multiplex Output File dialog box 2–59. . . . . . . . . . . . . .
Figure 2–83: Transport stream creation is complete 2–60. . . . . . . . . . . . . .
Figure 2–84: The hierarchy with programs 2 and 3 added 2–61. . . . . . . . .
Figure 2–85: Elementary streams added to program 2 2–62. . . . . . . . . . . .
Figure 2–86: The rate gauge shows an overflowed multiplex 2–62. . . . . . .
Figure 2–87: The dynamic view of the complex.cfg configuration file 2–63
Figure 2–88: The Program Parameters dialog box for program 2 2–64. . .
Figure 2–89: The dynamic view after you delay programs 2 and 3 2–64. .
Figure 2–90: Moving the timing cursor 2–65. . . . . . . . . . . . . . . . . . . . . . . . .
Figure 2–91: The timing cursor is in the space between the programs 2–66
Figure 2–92: The default PSI Period dialog box 2–66. . . . . . . . . . . . . . . . .
Figure 2–93: The PSI period is changed to 0.01 seconds 2–67. . . . . . . . . . .
Figure 2–94: The configuration file after changing the PSI period 2–67. .
Figure 2–95: The Program Specific Information dialog box 2–68. . . . . . . .
Figure 2–96: PID Modification dialog box 2–68. . . . . . . . . . . . . . . . . . . . . .
Figure 2–97: The Edit Table application with complex.pmt loaded 2–69. .
Figure 2–98: Section 2 (program 2) of the PMT 2–70. . . . . . . . . . . . . . . . . .
Figure 2–99: The Descriptors Selection dialog box 2–71. . . . . . . . . . . . . . .
Figure 2–100: Registration selected 2–71. . . . . . . . . . . . . . . . . . . . . . . . . . . .
Figure 2–101: A registration descriptor added to PMT section 2 2–72. . . .
Figure 2–102: The information for the Video Stream descriptor field 2–72
Figure 2–103: The descriptor at the Elementary Stream level 2–73. . . . . .
Figure 2–104: The complex.cfg after table editing 2–74. . . . . . . . . . . . . . . .
Figure 2–105: The Multiplex Output File dialog box 2–75. . . . . . . . . . . . .
vi
MTS 100 MPEG Test System User Manual
Page 11

Table of Contents
Figure 2–106: The Data Store Administrator application window 2–76. .
Figure 2–107: Find the command under the File menu 2–77. . . . . . . . . . .
Figure 2–108: The File Write to CARB dialog box 2–77. . . . . . . . . . . . . . .
Figure 2–109: The Windows NT 4.0 Open dialog box 2–77. . . . . . . . . . . . .
Figure 2–110: The dialog box with a file selected 2–78. . . . . . . . . . . . . . . . .
Figure 2–111: Click OK to acknowledge data transfer 2–78. . . . . . . . . . . .
Figure 2–112: The Generation dialog box 2–79. . . . . . . . . . . . . . . . . . . . . . .
Figure 2–113: The dialog box with all parameters entered 2–80. . . . . . . . .
Figure 2–114: Transport stream generation in progress 2–80. . . . . . . . . . .
Figure 2–115: Transport stream generation is finished 2–81. . . . . . . . . . . .
Figure 3–1: How the data store disks manage their files 3–162. . . . . . . . . . .
Figure 3–2: Starting the Data Store Administrator 3–163. . . . . . . . . . . . . . .
Figure 3–3: The Data Store Administrator application window 3–164. . . .
Figure 3–4: The FAT Information display 3–167. . . . . . . . . . . . . . . . . . . . . .
Figure 3–5: The File Read from CARB dialog box 3–168. . . . . . . . . . . . . . .
Figure 3–6: The Save As dialog box 3–168. . . . . . . . . . . . . . . . . . . . . . . . . . . .
Figure 3–7: The File Write to CARB dialog box 3–169. . . . . . . . . . . . . . . . .
Figure 3–8: Selecting a file to delete 3–170. . . . . . . . . . . . . . . . . . . . . . . . . . .
Figure 3–9: The Warning dialog box 3–170. . . . . . . . . . . . . . . . . . . . . . . . . . .
Figure 3–10: The last file is removed immediately 3–171. . . . . . . . . . . . . . . .
Figure 3–11: Selecting a file to undelete 3–171. . . . . . . . . . . . . . . . . . . . . . . .
Figure 3–12: The ACQUISITION dialog box 3–172. . . . . . . . . . . . . . . . . . . .
Figure 3–13: Examples of the Interface group 3–173. . . . . . . . . . . . . . . . . . .
Figure 3–14: Examples of the Synchronization group 3–174. . . . . . . . . . . . .
Figure 3–15: Examples of the Control Port group 3–175. . . . . . . . . . . . . . . .
Figure 3–16: The Generation dialog box 3–177. . . . . . . . . . . . . . . . . . . . . . . .
Figure 3–17: The Resource Parameters dialog box 3–180. . . . . . . . . . . . . . .
Figure 3–18: The Partitioning dialog box 3–181. . . . . . . . . . . . . . . . . . . . . . .
Figure 3–19: The Compress confirmation dialog box 3–181. . . . . . . . . . . . .
Figure 3–20: The Disks Motor control submenu 3–182. . . . . . . . . . . . . . . . .
Figure 3–21: Specifying automatic motor control parameters 3–182. . . . . .
Figure 3–22: The Msb first option 3–183. . . . . . . . . . . . . . . . . . . . . . . . . . . . .
Figure 3–23: Starting the Set CARB application 3–183. . . . . . . . . . . . . . . . .
Figure 3–24: The Data Store Setup window 3–184. . . . . . . . . . . . . . . . . . . . .
Figure 3–25: The Multiplex Transport File dialog box 3–191. . . . . . . . . . . .
Figure 3–26: The List of Programs window 3–191. . . . . . . . . . . . . . . . . . . . .
Figure 3–27: The PCR Clock Selection dialog box 3–192. . . . . . . . . . . . . . . .
Figure 3–28: The Jitter Type dialog box 3–193. . . . . . . . . . . . . . . . . . . . . . . .
MTS 100 MPEG Test System User Manual
vii
Page 12

Table of Contents
Figure 3–29: Illustration of the square jitter function 3–194. . . . . . . . . . . . .
Figure 3–30: Illustration of the sine jitter function 3–194. . . . . . . . . . . . . . .
Figure 3–31: The Output File dialog box 3–195. . . . . . . . . . . . . . . . . . . . . . .
Figure 3–32: The display during jitter calculation 3–196. . . . . . . . . . . . . . . .
Figure 3–33: PCR analysis of a “jittered” transport stream file 3–197. . . .
Figure 3–34: The initial Coding/Decoding application window 3–200. . . . .
Figure 3–35: The Coding Chain dialog box 3–202. . . . . . . . . . . . . . . . . . . . .
Figure 3–36: The Open dialog box for the Chain command 3–203. . . . . . . .
Figure 3–37: The Energy Dispersal Open dialog box 3–204. . . . . . . . . . . . .
Figure 3–38: The Reed Solomon dialog box 3–205. . . . . . . . . . . . . . . . . . . . .
Figure 3–39: The Reed-Solomon Configuration dialog box 3–205. . . . . . . .
Figure 3–40: The Open dialog box for Interleaver coding 3–206. . . . . . . . .
Figure 3–41: The Viterbi dialog box 3–207. . . . . . . . . . . . . . . . . . . . . . . . . . .
Figure 3–42: The Open dialog box for Viterbi coding 3–207. . . . . . . . . . . . .
Figure 3–43: The Decoding Chain dialog box 3–208. . . . . . . . . . . . . . . . . . . .
Figure 3–44: The Open dialog box for the Deinterleaver 3–209. . . . . . . . . .
Figure 3–45: The Open dialog box for Reed-Solomon decoding 3–210. . . .
Figure 3–46: The Open dialog box for Energy Dispersal Removal 3–210. .
Figure 3–47: The Save As dialog box for the Pattern command 3–211. . . .
Figure 3–48: Enter the number of bytes in the pattern 3–212. . . . . . . . . . . .
Figure 3–49: The Composition Motif 3–212. . . . . . . . . . . . . . . . . . . . . . . . . .
Figure 3–50: Set the number of pattern repetitions 3–212. . . . . . . . . . . . . . .
Figure 3–51: The Transport Packets dialog box 3–213. . . . . . . . . . . . . . . . . .
Figure 3–52: The Number of Packets dialog box 3–213. . . . . . . . . . . . . . . . .
Figure 3–53: The Save As dialog box 3–214. . . . . . . . . . . . . . . . . . . . . . . . . . .
Figure 3–54: The MPEG-2 Transport packet 3–214. . . . . . . . . . . . . . . . . . . .
Figure 3–55: The Scrambler/Descrambler schematic for the PRBS 3–215.
Figure 3–56: The output after Energy Dispersal coding 3–215. . . . . . . . . . .
Figure 3–57: The transport packet after Reed-Solomon coding 3–216. . . . .
Figure 3–58: The conceptual diagram of the Interleaver coder 3–216. . . . .
Figure 3–59: The Interleaved transport packets 3–217. . . . . . . . . . . . . . . . .
Figure 3–60: Viterbi 1/2 Punctured coding 3–217. . . . . . . . . . . . . . . . . . . . . .
viii
Figure A–1: Pulse specification for a G.703 8.448 MHz pulse A–3. . . . . .
Figure A–2: Pulse specification for G.703 34.368 MHz A–5. . . . . . . . . . . .
Figure A–3: Timing diagram for the ECL serial port A–8. . . . . . . . . . . . .
Figure A–4: ECL Timing diagram with control port A–9. . . . . . . . . . . . .
Figure A–5: Timing for the TTL port and the separate clock input A–10.
Figure A–6: Timing diagram for the 10 Mbit Serial port A–11. . . . . . . . . .
MTS 100 MPEG Test System User Manual
Page 13

Table of Contents
Figure C–1: The Repair Disk dialog box C–2. . . . . . . . . . . . . . . . . . . . . . . .
Figure C–2: All data on the disk will be erased C–2. . . . . . . . . . . . . . . . . .
Figure C–3: Uninstall the software C–4. . . . . . . . . . . . . . . . . . . . . . . . . . . .
Figure C–4: Run d:\setup to reinstall the software C–5. . . . . . . . . . . . . . .
Figure C–5: The MTS100 software installation dialog box C–5. . . . . . . .
Figure C–6: Specifying the destination directory C–6. . . . . . . . . . . . . . . . .
Figure C–7: The Select Program Folder dialog box C–6. . . . . . . . . . . . . . .
Figure C–8: The progress dialog box and activity gauges C–7. . . . . . . . . .
Figure C–9: Check HASP installation C–7. . . . . . . . . . . . . . . . . . . . . . . . . .
Figure C–10: Click OK; you will reboot later C–8. . . . . . . . . . . . . . . . . . .
Figure C–11: Indicate the slot that the Data Store board occupies C–8. .
Figure C–12: The Restart Windows NT dialog box C–9. . . . . . . . . . . . . . .
Figure C–13: Choose Taskbar from the Settings submenu C–9. . . . . . . . .
Figure C–14: Choose Advanced Start menu settings C–10. . . . . . . . . . . . . .
Figure C–15: The Exploring – Start Menu window C–10. . . . . . . . . . . . . . .
Figure C–16: Open the
c:\Winnt\Profiles\Start Menu\Programs folder C–11. . . . . . . . . . . . . . .
Figure C–17: Move the Tektronix MTS100 V2.1 folder
to the Start menu C–11. . . . . . . . . . . . . . . . . . . . . . . . . . . . . . . . . . . . . . . .
Figure C–18: Copy the Tektronix MTS100 V2.1 folder
onto the Desktop C–12. . . . . . . . . . . . . . . . . . . . . . . . . . . . . . . . . . . . . . . .
Figure C–19: The Tektronix MTS100 V2.1 program group window C–12.
Figure C–20: The correct Tektronix MTS100 V2.1 submenu C–13. . . . . . .
Figure E–1: Initial connections for the functional check E–1. . . . . . . . . . .
Figure E–2: Starting the Data Store Administrator E–2. . . . . . . . . . . . . .
Figure E–3: Setup for measuring the G.703 34.368 Mbit/s output E–3. . .
Figure E–4: Setup for measuring the TTL 50 ohm clock I/O port E–4. . .
Figure E–5: Setup for measuring the TTL 50 ohm data I/O port E–5. . .
Figure F–1: Repackaging the MTS100 server F–2. . . . . . . . . . . . . . . . . . .
MTS 100 MPEG Test System User Manual
ix
Page 14

Table of Contents
List of Tables
Table 1–1: Power cord identification 1–10. . . . . . . . . . . . . . . . . . . . . . . . . .
Table 1–2: ECL control port pinout 1–13. . . . . . . . . . . . . . . . . . . . . . . . . . .
Table 1–3: ECL parallel data pinout 1–14. . . . . . . . . . . . . . . . . . . . . . . . . .
Table 1–4: ECL serial data pinout 1–15. . . . . . . . . . . . . . . . . . . . . . . . . . . .
Table 1–5: 10 Mbit serial port pinout 1–16. . . . . . . . . . . . . . . . . . . . . . . . . .
Table 1–6: Estimated maximum cable lengths 1–17. . . . . . . . . . . . . . . . . .
Table 2–1: MTS 100 applications 2–1. . . . . . . . . . . . . . . . . . . . . . . . . . . . .
Table 2–2: Icons used in the hierarchic view 2–12. . . . . . . . . . . . . . . . . . . .
Table 2–3: PTS/DTS graphic view icons 2–34. . . . . . . . . . . . . . . . . . . . . . .
Table 2–4: The icons in the multiplexer hierarchic view 2–48. . . . . . . . . .
Table 3–1: Icons used in the PSI hierarchic view 3–13. . . . . . . . . . . . . . . .
Table 3–2: Special hierarchic view symbols 3–14. . . . . . . . . . . . . . . . . . . . .
Table 3–3: Icons used in the SI hierarchic view 3–16. . . . . . . . . . . . . . . . . .
Table 3–4: PSI consistency error symbols 3–27. . . . . . . . . . . . . . . . . . . . . .
Table 3–5: SI consistency error abbreviations 3–28. . . . . . . . . . . . . . . . . . .
Table 3–6: Information in the PSI/SI rate table 3–29. . . . . . . . . . . . . . . . . .
Table 3–7: PTS/DTS graphic view icons 3–35. . . . . . . . . . . . . . . . . . . . . . .
Table 3–8: Multiplex rate bar colors 3–66. . . . . . . . . . . . . . . . . . . . . . . . . .
Table 3–9: Hierarchic view icons 3–68. . . . . . . . . . . . . . . . . . . . . . . . . . . . .
Table 3–10: The default multiplexer settings 3–78. . . . . . . . . . . . . . . . . . . .
Table 3–11: Using the Add command 3–80. . . . . . . . . . . . . . . . . . . . . . . . . .
Table 3–12: Functions available from the tool bars 3–108. . . . . . . . . . . . . .
Table 3–13: Icons used in the Edit Table application 3–109. . . . . . . . . . . . .
Table 3–14: Frequencies available for each port 3–173. . . . . . . . . . . . . . . . .
Table 3–15: How synchronization works 3–175. . . . . . . . . . . . . . . . . . . . . . .
Table 3–16: DefaultAlwaysDialogBox registry parameter values 3–176. . .
Table 3–17: The parameters available from each port 3–178. . . . . . . . . . . .
Table 3–18: DefaultAlwaysDialogBox registry parameter values 3–179. . .
Table 3–19: MTS 100 to MTS 100 transfer results 3–184. . . . . . . . . . . . . . .
Table 3–20: Packet Jitter menu commands 3–190. . . . . . . . . . . . . . . . . . . . .
Table 3–21: Commands available from the Packet Jitter toolbar 3–197. . .
Table 3–22: Expected input file types 3–199. . . . . . . . . . . . . . . . . . . . . . . . . .
Table 3–23: Commands from DVB Channel Coding & Decoding 3–201. . .
x
MTS 100 MPEG Test System User Manual
Page 15

Table of Contents
Table A–1: G.703 — 8.448 MHz A–2. . . . . . . . . . . . . . . . . . . . . . . . . . . . . .
Table A–2: G.703 — 34.368 MHz A–4. . . . . . . . . . . . . . . . . . . . . . . . . . . . .
Table A–3: ECL parallel, serial, and control ports A–6. . . . . . . . . . . . . . .
Table A–4: ECL parallel data pinout A–7. . . . . . . . . . . . . . . . . . . . . . . . . .
Table A–5: ECL serial data pinout A–8. . . . . . . . . . . . . . . . . . . . . . . . . . . .
Table A–6: ECL control port pinout A–9. . . . . . . . . . . . . . . . . . . . . . . . . . .
Table A–7: 50 W TTL I/O A–10. . . . . . . . . . . . . . . . . . . . . . . . . . . . . . . . . . .
Table A–8: 10 Mbit serial port (RS-422 levels I/O Port) A–10. . . . . . . . . .
Table A–9: 10 Mbit serial port pinout A–11. . . . . . . . . . . . . . . . . . . . . . . . .
Table A–10: Clock Port A–12. . . . . . . . . . . . . . . . . . . . . . . . . . . . . . . . . . . . .
Table A–11: PLL A–12. . . . . . . . . . . . . . . . . . . . . . . . . . . . . . . . . . . . . . . . . . .
Table A–12: Power requirements A–13. . . . . . . . . . . . . . . . . . . . . . . . . . . . .
Table A–13: MTS 100 mechanical characteristics A–13. . . . . . . . . . . . . . . .
Table A–14: MTS 100 environmental characteristics A–13. . . . . . . . . . . . .
Table A–15: Safety standards A–14. . . . . . . . . . . . . . . . . . . . . . . . . . . . . . . .
Table A–16: Safety certification compliance A–14. . . . . . . . . . . . . . . . . . . .
Table A–17: Certifications and compliances A–15. . . . . . . . . . . . . . . . . . . .
Table D–1: Compliance for the Transport Packet Header D–1. . . . . . . . .
Table D–2: Compliance for the Adaptation Field (AF) D–3. . . . . . . . . . .
Table D–3: Compliance for the PES packet header D–6. . . . . . . . . . . . . .
Table D–4: Compliance for the PAT sections D–8. . . . . . . . . . . . . . . . . . . .
Table D–5: Compliance for the PMT sections D–9. . . . . . . . . . . . . . . . . . .
Table D–6: Compliance for the CAT section D–10. . . . . . . . . . . . . . . . . . . .
Table D–7: Compliance for the NIT sections D–11. . . . . . . . . . . . . . . . . . . .
Table D–8: Compliance for the private sections D–11. . . . . . . . . . . . . . . . .
Table D–9: Compliance for all descriptors D–12. . . . . . . . . . . . . . . . . . . . .
Table D–10: Video stream descriptor D–12. . . . . . . . . . . . . . . . . . . . . . . . . .
Table D–11: Audio stream descriptor D–13. . . . . . . . . . . . . . . . . . . . . . . . . .
Table D–12: Hierarchy descriptor D–13. . . . . . . . . . . . . . . . . . . . . . . . . . . .
Table D–13: Registration descriptor D–14. . . . . . . . . . . . . . . . . . . . . . . . . . .
Table D–14: Data stream alignment descriptor D–14. . . . . . . . . . . . . . . . . .
Table D–15: Target background grid descriptor D–14. . . . . . . . . . . . . . . . .
Table D–16: Video window descriptor D–15. . . . . . . . . . . . . . . . . . . . . . . . .
Table D–17: CA descriptor D–15. . . . . . . . . . . . . . . . . . . . . . . . . . . . . . . . . .
Table D–18: ISO 639 language descriptor D–15. . . . . . . . . . . . . . . . . . . . . .
Table D–19: System clock descriptor D–16. . . . . . . . . . . . . . . . . . . . . . . . . .
Table D–20: Multiplex buffer utilization descriptor D–16. . . . . . . . . . . . . .
Table D–21: Copyright descriptor D–16. . . . . . . . . . . . . . . . . . . . . . . . . . . .
MTS 100 MPEG Test System User Manual
xi
Page 16

Table of Contents
Table D–22: Maximum bitrate descriptor D–17. . . . . . . . . . . . . . . . . . . . . .
Table D–23: Private data indicator descriptor D–17. . . . . . . . . . . . . . . . . .
Table D–24: Smoothing buffer descriptor D–17. . . . . . . . . . . . . . . . . . . . . .
Table D–25: STD descriptor D–17. . . . . . . . . . . . . . . . . . . . . . . . . . . . . . . . .
Table D–26: IBP descriptor D–18. . . . . . . . . . . . . . . . . . . . . . . . . . . . . . . . . .
Table F–1: Packaging material F–1. . . . . . . . . . . . . . . . . . . . . . . . . . . . . . .
xii
MTS 100 MPEG Test System User Manual
Page 17

General Safety Summary
Review the following safety precautions to avoid injury and prevent damage to
this product or any products connected to it.
Only qualified personnel should perform service procedures.
While using this product, you may need to access other parts of the system. Read
the General Safety Summary in other system manuals for warnings and cautions
related to operating the system.
Injury Precautions
Use Proper Power Cord. To avoid fire hazard, use only the power cord specified
for this product.
Avoid Electric Overload. To avoid electric shock or fire hazard, do not apply a
voltage to a terminal that is outside the range specified for that terminal.
Avoid Overvoltage. To avoid electric shock or fire hazard, do not apply potential
to any terminal, including the common terminal, that varies from ground by
more than the maximum rating for that terminal.
Avoid Electric Shock. To avoid injury or loss of life, do not connect or disconnect
probes or test leads while they are connected to a voltage source.
Ground the Product. This product is grounded through the grounding conductor
of the power cord. To avoid electric shock, the grounding conductor must be
connected to earth ground. Before making connections to the input or output
terminals of the product, ensure that the product is properly grounded.
Do Not Operate Without Covers. To avoid electric shock or fire hazard, do not
operate this product with covers or panels removed.
Use Proper Fuse. To avoid fire hazard, use only the fuse type and rating specified
for this product.
Do Not Operate in Wet/Damp Conditions. To avoid electric shock, do not operate
this product in wet or damp conditions.
Do Not Operate in an Explosive Atmosphere. To avoid injury or fire hazard, do not
operate this product in an explosive atmosphere.
Product Damage
Precautions
MTS 100 MPEG Test System User Manual
Use Proper Power Source. Do not operate this product from a power source that
applies more than the voltage specified.
Use Proper V oltage Setting. Before applying power, ensure that the line selector is
in the proper position for the power source being used.
xiii
Page 18

General Safety Summary
Provide Proper Ventilation. To prevent product overheating, provide proper
ventilation.
Do Not Operate With Suspected Failures. If you suspect there is damage to this
product, have it inspected by qualified service personnel.
Symbols and Terms
T erms in this Manual. These terms may appear in this manual:
WARNING. Warning statements identify conditions or practices that could result
in injury or loss of life.
CAUTION. Caution statements identify conditions or practices that could result in
damage to this product or other property.
T erms on the Product. These terms may appear on the product:
DANGER indicates an injury hazard immediately accessible as you read the
marking.
WARNING indicates an injury hazard not immediately accessible as you read the
marking.
CAUTION indicates a hazard to property including the product.
Symbols on the Product. The following symbols may appear on the product:
Certifications and
CSA Certified Power
xiv
Compliances
Cords
DANGER
High Voltage
Protective Ground
(Earth) T erminal
ATTENTION
Refer to Manual
Double
Insulated
Refer to the specifications section for a listing of certifications and compliances
that apply to this product.
CSA Certification includes the products and power cords appropriate for use in
the North America power network. All other power cords supplied are approved
for the country of use.
MTS 100 MPEG Test System User Manual
Page 19

Page 20

Product Description
This section describes the capabilities and components of MTS 100 MPEG Test
System.
Overview
The MTS 100 hardware and software makes it possible to create, generate,
acquire, and analyze MPEG-2 transport streams and DVB multiplexes.
From a single program with one elementary stream to multiple programs with
many video, audio, and data elementary streams, the MTS 100 can create an
extensive variety of transport streams.
Elementary stream files containing both stationary test signals and motion
sequences are provided on the Bit Stream CD ROM. With the MTS100
Multiplexer and Table Editor applications, you can create a variety of transport
stream files that contain one or more of the provided test signals and motion
sequences.
The Data Store system enables output and acquisition of transport streams at
rates from 1 Mbit/s to 55 Mbit/s. Based on the standard 8 Gbytes of hard disk
(18 Gbytes in instruments with serial number B060000 and later) space
available, the MTS 100 can store transport stream data equivalent to over 20
minutes of acquisition or output at 55 Mbits/s. You can also use end-to-start
looping to continuously (and indefinitely) acquire or output up to 8 Gbytes of
transport stream data. Data Store I/O can be through a variety of hardware
connections, including TTL serial, ECL parallel, ECL serial, G.703, and RS-422.
You can analyze transport stream data (acquired by the Data Store System) with
the Analyzer application. The Analyzer provides a graphical view of MPEG and
DVB transport stream; the graphical view gives access to each field—and each
bit, if you wish, in the transport packets, PES packets, and the various PSI and
SI tables.
The platform for the MTS 100 is a Windows NT workstation. The whole system
arrives at your site fully configured and ready to use; it includes the Data Store
System (hardware and software) and five application programs.
Applications
The five MTS 100 MPEG Test System applications are the Analyzer, the
Multiplexer, the PSI and SI Table Editor, the Channel Coder, and Packet Jitter.
MTS 100 MPEG Test System User Manual
1–1
Page 21

Product Description
Analyzer
The Analyzer displays transport stream data in several ways, including the
Hierarchic view, the Interpreted view, and two types of timing display.
Hierarchic View . The hierarchic view provides a diagram of the data components
carried by the transport stream. Icons are used to identify the PAT (Program
Association Table), NIT (Network Information Table), PMT (Program Map
Table), PES (Packetized Elementary Stream), packets, and the three types of
elementary streams (video, audio, and data). Additional icons indicate the PID
(Packet Identification) number for each data component.
Interpreted View. The interpreted view shows every field in the selected transport
packet, table section, or PES (packetized elementary stream) packet. Any packet
in the file may be accessed. Search for errors in this view.
Timing Displays. Two types of timing displays are available: PCR (Program
Clock Reference) contained in the transport packet headers and PTS/DTS
(Presentation/Display Time Stamp) contained in PES packet headers. The PCRs
are shown in a graphical form indicating their arrival time. The graphical display
of the PTS/DTS shows a time line for each access unit (such as a video frame)
indicating data arrival and value of each time stamp.
Multiplexer
PSI and SI Table Editor
Channel Coder
The Multiplexer provides the means to develop a limitless variety of MPEG
transport stream files, using the elementary streams provided.
Transport streams are produced by the software in non-real time, typically 10 to
100 times the play time of the resulting file. A hierarchy display, similar to the
Analyzer, displays the structure of the transport stream.
Up to 20 programs, with 10 elementary streams each, may be included in one
transport stream file.
Data necessary for the DVB IRD (Digital Video Broadcasting Integrated
Receiver Decoder) to automatically configure itself is available in the MPEG2
Program Specific Information (PSI). Digital Video Broadcasting Specific
Information (DVB-SI) adds information that enables DVB IRDs to automatically
tune to a particular service and allows services to be grouped into categories with
relevant schedule information.
The PSI and SI Table Editor allows the user to enter and change the data in the
SI and PSI tables to fit requirements.
The European Digital Broadcasting Project (DVB) has specified a baseline
system for satellite broadcasting. The Channel Coding portion of the specification has the following coding flow:
1–2
MTS 100 MPEG Test System User Manual
Page 22

Product Description
MPEG2 Transport stream file (Multiplexer)
Energy Dispersal — randomizing
Outer Coder RS (204, 188) — for byte error correction
Interleaver — better burst error correction
Inner Coder (Viterbi p/q) — bit error correction
QPSK Modulator
This application provides the defined channel coding for the transport stream file
and also provides the decoding to return the coded file to a standard transport
stream file.
Packet Jitter
In addition to creating error-free transport streams, the MTS100 can also create
transport stream files with known errors.
The Packet Jitter application allows you to create transport stream files with
simulated timing errors that affect the clocks derived from the transport file. This
allows you to test the robustness of decoders under various conditions.
MTS 100 MPEG Test System User Manual
1–3
Page 23

Product Description
1–4
MTS 100 MPEG Test System User Manual
Page 24

Accessories
The following accessories are shipped with the MTS 100. All items except the
monitor are in the box containing the server.
Tektronix 17 inch monitor and monitor cable (monitor power cord is shipped
in the MTS 100 accessories package)
Compaq server with the Data Store Board and Data Store Disks already
installed (referred to as the MTS 100 server)
Keyboard
Mouse
Tower pedestal
Server door
Software enable key (HASP) for the parallel port (installed on the server
parallel port)
MTS 100 MPEG Test System User Manual
Compaq documentation and back-up copies of the Compaq software
Windows NT software (already installed) and documentation package
(backup software is provided in case the loaded version becomes corrupted)
Emergency repair disk (use this disk as described in the Windows NT
System Guide)
MTS 100 Installation Software CD-ROM (provided for reinstalling the
MTS 100 software in case it becomes corrupted)
CD-ROM containing the MPEG2 Elementary Streams for MTS 100.
Two power cords (one each for the MTS 100 server and the monitor)
Six SMB to BNC adaptors (three with 50 W cables and three with 75 W
cables)
One 9–pin cable (use this cable to meet EMI requirements)
One 25–pin cable (use this cable to meet EMI requirements)
MTS 100 MPEG Test System User Manual
1–5
Page 25

Accessories
1–6
MTS 100 MPEG Test System User Manual
Page 26

Installation
The installation of the MTS 100 involves selecting an installation site, installing
the server tower pedestal and door, and connecting all the cabling. Once all items
have been unpacked, the assembly of the individual items making up the system
should only require a few minutes. The shipping carton and all the inserts must
be saved for use if reshipment of the MTS 100 server becomes necessary. See the
repackaging instructions in Appendix F.
CAUTION. To avoid damage to the MTS 100 during shipping, retain the original
shipping carton. Shipping the MTS 100 in any other packaging may void the
warranty.
Assembling the MTS100 System
Before you begin to assemble the MTS 100, please make sure that you have
selected an appropriate location. A good site, as specified by Compaq, includes
the following features:
A sturdy, level site that includes dedicated and properly grounded circuits,
air conditioning equipment, and static electricity protection
A 3 inch (7.6 cm) clearance at the front and back of the computer for proper
ventilation (You will probably want additional access to the rear panel for
connecting signals.)
A separate electrical circuit for the MTS 100
A place where no heavy electrical equipment will be located near the server
Once a good site has been selected, begin assembling the MTS 100 using the
procedure given below. (An illustration of the rear panel is shown in Figure 1–1.)
WARNING. Be careful lifting and moving the MTS 100 server. It is heavy.
1. Install the pedestal on the MTS 100 server.
a. Carefully set the server on its top.
b. Align the post on the pedestal with the slots in the server case.
c. Slide the pedestal into the slots until the retaining clip on the pedestal
snaps into place on the server base.
d. Carefully turn the server over to set it upright on the pedestal.
MTS 100 MPEG Test System User Manual
1–7
Page 27

Installation
2. Install the door on the front of the server.
a. Line up the hinge pins of the two hinges on the right side of the server
door with the hinge pin holes in the server chassis.
b. Lower the hinge pins into the hinge pin holes and close the door.
3. Connect the keyboard to the keyboard port on the rear panel of the MTS 100
server.
4. Connect the mouse to the mouse port on the rear panel of the MTS 100
server.
5. Verify the software key (HASP) is attached to the parallel port on the rear
panel of the MTS 100 server. See Figures 1–1 and 1–2. (It should already be
connected.)
NOTE. If you need to use the parallel port for another function, connect that
cable through the HASP.
6. If the MTS 100 is being connected to a network, connect it now. Two types
of ethernet ports are provided: an AUI port and an RJ45 port. See
Figure 1–1. The ethernet ports do not require termination.
7. Connect the monitor cable to the monitor and to the rear of the MTS 100
server at the video port.
NOTE. Although the MTS 100 is based on a standard computer configuration, do
not use the MTS 100 for any other purpose or install boards not provided or
recommended by Tektronix. These actions may cause your system to operate in
an unexpected manner. However, you may connect it to an appropriate network.
8. Connect the power cord to the monitor and to a power source.
9. Connect the power cord to the MTS 100 server and to a power source.
1–8
MTS 100 MPEG Test System User Manual
Page 28
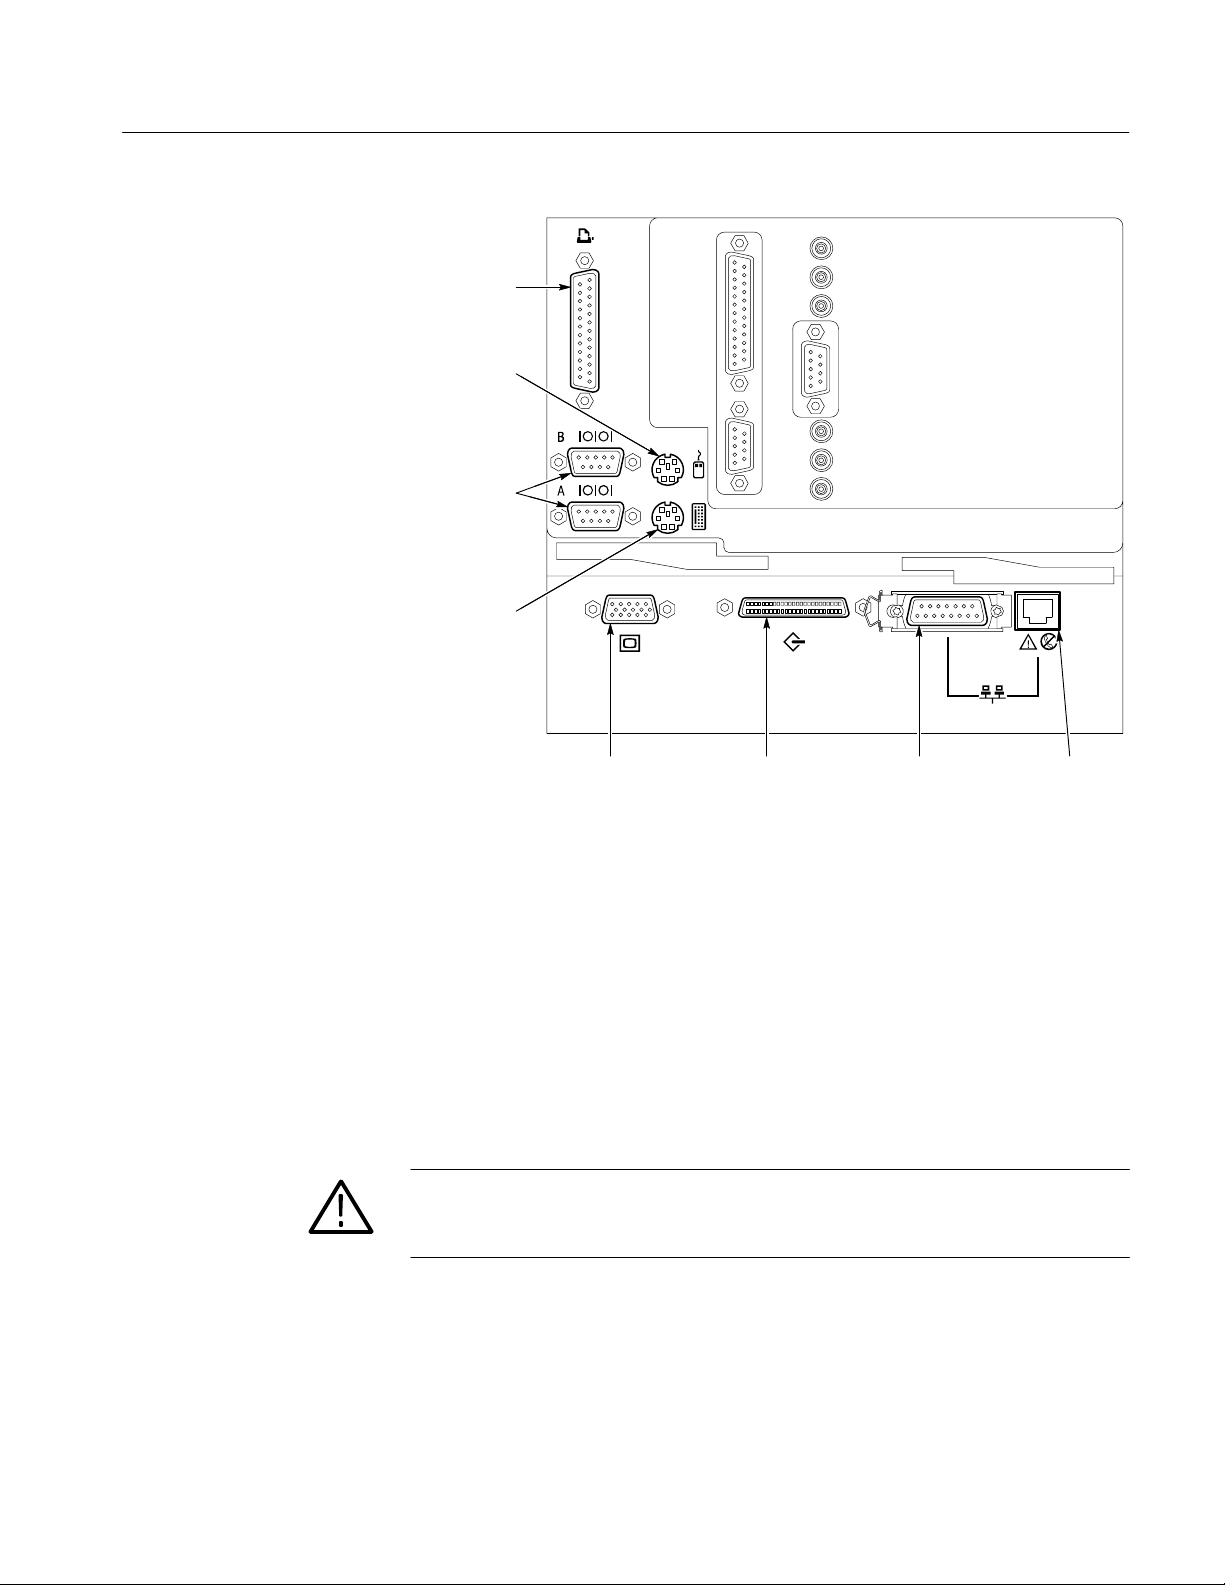
Parallel port
(where HASP
is installed)
Mouse port
Serial ports
Keyboard port
Installation
Power Mains
Mains Voltage Range
Video
port
SCSI
connector
AUI Ethernet
port
RJ45-Ethernet
port
Figure 1–1: The rear panel of the MTS 100 server
The MTS 100 server and monitor are designed to operate from a single-phase
power source having one of its current-carrying conductors at or near earth
ground (the neutral conductor). Systems that have both current-carrying
conductors live with respect to ground, such as phase-to-phase or multiphase
systems, are not recommenced as power sources. A protective ground connection, by way of the grounding conductor, in the power cord is essential for safe
operation.
WARNING. This equipment is designed for connection to a earth-grounded AC
outlet. The grounding plug is an important safety feature. To avoid risk of
electrical shock or damage to your equipment, do not disable this feature.
The MTS 100 server (the ProLiant 2500) operates from 100 VAC to 230 VAC
power mains.
The monitor operates on either 115 VAC or 230 VAC source also without having
to set a voltage selection switch.
MTS 100 MPEG Test System User Manual
1–9
Page 29

Installation
Mains Frequency
Power Cord Options
The ProLiant server and the monitor both operate on either 50 or 60 Hz line
frequencies.
CAUTION. To prevent damage to the MTS 100 server, you should protect the
instrument from power fluctuations and temporary interruptions with a
regulating uninterruptable power supply (UPS). This device protects the
hardware from damage caused by power surges and voltage spikes. In addition,
it keeps the system in operation during a power failure.
The server and monitor are delivered from the factory with a 60 Hz/117 VAC
power cord, unless one of the power cord options was ordered. Table 1–1
provides a description of the power cord options.
T able 1–1: Power cord identification
Plug Configuration Normal Usage Option Number
North America
115 V
Standard
Europe
230 V
United Kingdom
230 V
A1
A2
1–10
MTS 100 MPEG Test System User Manual
Page 30
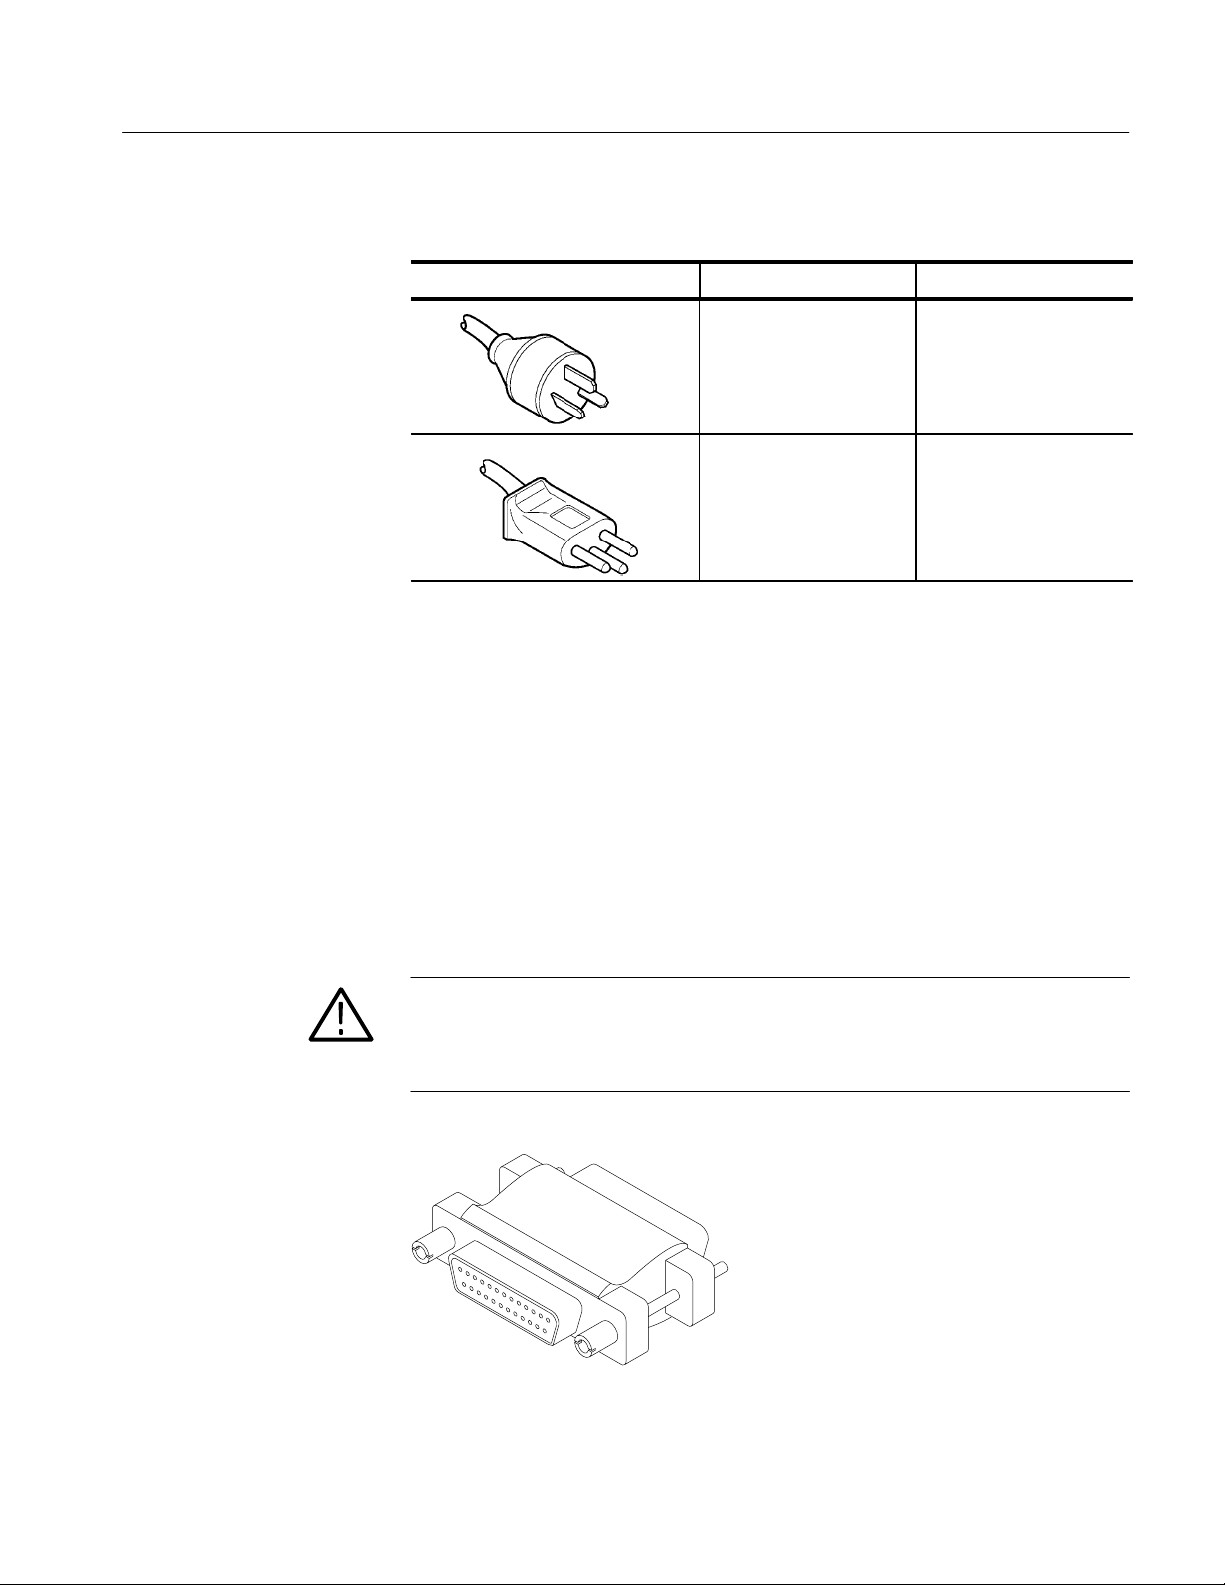
T able 1–1: Power cord identification (cont.)
Plug Configuration Option NumberNormal Usage
Installation
Parallel Port
HASP
Australia
240 V
Switzerland
230 V
A3
A5
The parallel port must have the software enable key (HASP) installed to operate.
The software is enabled by a software enable key which is referred to as a HASP
(see Figure 1–2). It comes installed on the parallel port and is transparent to
parallel port applications, such as connection to a printer. The HASP must be in
place on the ProLiant parallel port for the MTS 100 to operate. Do not lose the
HASP. The software enabler (HASP) should remain with the MTS 100 at all
times. If the entire instrument is returned for service, ship the HASP with the
server.
CAUTION. Do not lose the HASP (software enable key). The MTS100 will not
operate without it being installed on the parallel port. The software enabler key
(HASP) also is required by the Tektronix Service Center if the ProLiant server is
returned for repair.
Figure 1–2: MTS100 HASP
MTS 100 MPEG Test System User Manual
1–11
Page 31

Installation
MTS100 I/O
The MTS 100 rear panel input/output connectors (I/O) are located in two EISA
slots on the ProLiant server rear panel. Specification of the I/O ports are in
Appendix A, Specifications. Figure 1–3 shows the arrangement of the I/O
connectors. A detailed description of each of the connectors follows the
illustration.
ECL parallel/serial
I/O port
TTL 50 serial
port (Clk I/O)
TTL 50 serial
port (Data I/O)
External clock
input (Clk In)
10 Mbit serial
port (RS-422
levels I/O port)
G.703 input
G.703 output
(34.368 Mbits/s)
G.703 output
(8.448 Mbits/s)
1–12
ECL Control Port
ECL control port
Figure 1–3: The MTS 100 signal I/O ports
The bidirectional differential control port adds flexibility to the ECL Parallel and
Serial Ports. Adding the three control signals provides two more operating
modes. (Using this port is optional.) The ECL control port pinout is shown in
Table 1–2.
MTS 100 MPEG Test System User Manual
Page 32

T able 1–2: ECL control port pinout
1
5
9
ECL control port Pin Function
1 CHCLK (Channel Clock)
2 Ground
3 CHSYNC (Channel Sync)
6
2
2
3
4
Asserted Low differential signal.
4 CHCLKEN (Channel Clock Enable)
7
5 Shield
8
6 CHCLK (Channel Clock)
7 Ground
8 CHSYNC (Channel Sync)
9 CHCLKEN (Channel Clock Enable)
Installation
ECL Parallel/Serial I/O Port
The ECL Parallel/Serial I/O port receives and transmits MPEG-2 transport
streams at ECL levels. It is a differential, bidirectional port that operates
independently or in conjunction with the ECL Control Port. The port transmits
or receives either parallel or serial data depending on settings made in the Data
Store Administrator application.
Operating Modes. When the ECL Parallel/Serial I/O port is used independently of
the ECL Control Port there are three operating modes:
Slave acquisition. Captures input signals using the clock signal on the ECL
Parallel/Serial I/O port as the timing source.
Master generation. Outputs signals using the MTS 100 internal clock.
Master generation with external clock. Outputs signals using a timing signal
applied to the external clock input (Clk In).
When the ECL Parallel/Serial I/O port is used in conjunction with the control
port, there are three additional operating modes:
Master acquisition. Captures input signals using control signals from the
ECL Control Port to drive the signal source.
Master acquisition with external clock. As above, but uses a timing signal
applied to the external clock input (Clk In) as the clock source.
Slave generation. Outputs signals using the ECL control port inputs as the
timing source.
MTS 100 MPEG Test System User Manual
1–13
Page 33

Installation
14
15
4
16
5
6
6
19
1
9
1
1
11
4
1
5
NOTE. Master — The unit provides the clock for data transmission.
Slave — The unit does not generate the data clock. The unit returns the clock
provided by an external source.
Parallel Pinout. The parallel data pinout of the ECL Parallel/Serial I/O port is
shown in Table 1–3.
T able 1–3: ECL parallel data pinout
ECL parallel port Pin Function Pin Function
1 DCLK 14 DCLK
1
2
3
7
8
0
12
13
2 ground 15 ground
3 DATA 7 16 DA TA 7
4 DATA 6 17 DA TA 6
16
17
5 DATA 5 18 DA TA 5
18
6 DATA 4 19 DA TA 4
7 DATA 3 20 DA TA 3
20
8 DATA 2 21 DA TA 2
2
2
9 DATA 1 22 DA TA 1
22
23
10 DATA 0 23 DATA 0
2
11 DV ALID 24 DVALID
2
12 PSYNC 25 PSYNC
13 shield
Asserted Low differential signal.
Serial Pinout. The serial data pinout of the ECL Parallel/Serial I/O port is shown
in Table 1–4.
1–14
MTS 100 MPEG Test System User Manual
Page 34

T able 1–4: ECL serial data pinout
14
15
4
16
5
6
6
19
1
9
1
1
11
1
5
ECL serial port Pin Function
1 DCLK
1
2
3
7
8
0
12
13
2 ground
3 - 9 Not Managed
10 DATA 0
16
17
11 DVALID
18
12 PSYNC
13 shield
20
14 DCLK
2
2
15 ground
22
23
16 – 22 Not Managed
24
23 DATA 0
2
24 DVALID
25 PSYNC
Installation
G.703 Output
(8.448 and 34.368 Mbit/s)
and G.703 Input
Asserted Low differential signal.
This serial interface complies with the electrical characteristics of ITU-T
Recommendation G.703 (HDB3 code) for 8.448 Mbit/s and 34.368 Mbit/s.
There are two modes of operation:
Acquisition. Locks to incoming signal and is self clocking.
Generation (internal clock source). Uses an internal clock source.
This interface uses three Data Store circuit board mounted SMB connectors. One
connector is a dedicated input for both bit rates. The other two connectors are
dedicated outputs, one for the 34.368 Mbit/s output and the other for the
8.443 Mbit/s output. To reduce spurious emissions, only the output currently
being used should be connected.
NOTE. Do not leave an SMB-to-BNC adaptor cable on an unused G.703 output.
It will cause the MTS 100 to exceed EMI emission requirements.
MTS 100 MPEG Test System User Manual
1–15
Page 35

Installation
1
5
9
10 Mbit Serial Port
(RS-422 Levels I/O Port)
The 10 Mbit Serial port can transmit and receive MPEG transport signals. It has
bidirectional clocks and data pairs. The maximum operating frequency is
10 Mbit/sec. It uses RS-422 voltage levels, with line-to-line input termination of
110 W. The pinout is shown in Table 1–5.
T able 1–5: 10 Mbit serial port pinout
10 Mbit serial port Pin Function
1 DATA IN
2 CLK IN
3 DATA OUT
6
2
2
3
4
Asserted Low differential signal.
4 CLK OUT
7
5 ground
8
6 DATA IN
7 CLK IN
8 DATA OUT
9 CLK OUT
The 10 Mbit Serial port uses the following signals:
Clock Input
Data In and Data Out. These are MPEG serial bit streams.
Clock In and Clock Out. These are continuous data transmission clocks.
You can choose from three modes of operation:
Acquisition. Captures an input signal using external timing reference.
Internal generation. Generates an output signal using the MTS 100 internal
clock as the timing reference.
External generation. Generates an output signal using the Clock input as the
timing reference.
The Clk In connector provides optional timing input for the ECL Serial, ECL
Parallel, TTL and 10 Mbit Serial outputs. Its maximum operating frequency is
45 MHz.
1–16
MTS 100 MPEG Test System User Manual
Page 36

Installation
TTL 50 Serial Port
(Data & Clock I/O)
The TTL 50 W Serial Port receives and transmits at TTL levels. It consists of
clock and data inputs with dedicated connectors. The Data signal is a serial bit
stream, and the Clock signal is a continuous data transmission clock. The
maximum operating frequency is 45 Mbits/s.
There are three modes of operation:
Acquire. Captures an input signal.
Internal Generation. Generates a signal that is locked to the internal clock.
External Generation. Generates a signal locked to an external reference (the
Clock Input).
Cables and Mating Connectors for MTS100 Inputs/Outputs
The MTS 100 comes with adapters for connecting the SMB connectors on the
Data Store to standard BNC connectors. It may be necessary to acquire or
assemble other signal connecting cables and adapters in order to install the
MTS 100 in your facility.
The maximum usable cable length for the various ports, on the MTS 100, are a
function of data rate, cable type, and ambient environment. See Table 1–6. Low
data rates can stand longer cable lengths than high data rates. Low-loss coaxial
cable and low-capacitance properly pair-twisted cable can support longer
transmission paths than miniature coaxial cable or ribbon cable. Excess RF noise
can induce noise in the cable which will reduce the usable length.
The only ports designed as a transmission system are the G.703 I/Os. The others
are basically short-range interconnects. Note that most ports must control cable
delay matching, to maintain clock to data timing margin, or data integrity will
suffer.
T able 1–6: Estimated maximum cable lengths
Port Rate, Mbits/s Maximum length Cable type Comments
G.703 8.448 275 meters Belden 8281 4 dB atten at
G.703 34.368 125 meters Belden 8281 4 dB atten at
10 MBit
(RS422)
10 MBit
(RS422)
MTS 100 MPEG Test System User Manual
1 100 meters 24 AWG
unshielded
twisted pair
10 15 meters 24 AWG
unshielded
twisted pair
4.224 MHz
17.18 MHz
Ref. ANSI/TIA/
EIA-422-B-1994
Ref. ANSI/TIA/
EIA-422-B-1994
1–17
Page 37

Installation
T able 1–6: Estimated maximum cable lengths (cont.)
Port CommentsCable typeMaximum lengthRate, Mbits/s
TTL 10 50 meters RG58 type Calculated Value
TTL 50 25 meters RG58 type Calculated Value
Adapters
ECL
Parallel
ECL Serial 45 5 meters Belden 8112 Calculated Value
1 50 meters Belden 8112 Calculated Value
The MTS 100 comes with six SMB-to-BNC adapter cables. Three of the adapters
are 75 W to match the impedance of the G.703 inputs and outputs. The other
three adapters are 50 W for use with the TTL Serial Port (Clock and Data) and
Clock Inputs.
Do not leave an SMB-to-BNC adapter cable on an unused G.703 output. It will
cause the MTS 100 to exceed EMI emission requirements.
1–18
MTS 100 MPEG Test System User Manual
Page 38

First Time Operation
Once you have installed the MTS 100, it is ready to operate. Turn on the power
switch located on the front of the MTS 100 server. Slide the power switch cover
plate to the right as shown in Figure 1–4 and press in the power switch.
Whenever you power on the MTS 100, it goes through the Windows NT
initialization process. (For more information on the Windows NT initialization
process, please see the Windows NT documentation.) When it is finished, press
CTRL + ALT + Delete, as instructed by the message box. This displays the login
dialog box.
Power switch
Slide power switch
cover plate
Figure 1–4: Turning on the MTS100 MPEG Test System
Logging In
Enter “MTS100” as the Username and no password (just press return) to log into
the MTS 100. These are the default values set at the factory. This is the login
where you should do most of your work.
MTS 100 MPEG Test System User Manual
1–19
Page 39

First Time Operation
The Initial Window
There are two other logins and passwords available. The first is “guest” with no
password. This level has only limited access to files and applications. The
second is “administrator” with “MPEG2” as the password. This user has
administrator privileges. You are required to use this login when performing any
software upgrades.
CAUTION. The administrator user has all the privileges of an administrator. If
you are connected to a network, you may have more privileges than you realize
within the network. It is recommended that you do not perform normal operations while logged in as administrator.
You may change the passwords. If you change any of the passwords, be sure to
create a new emergency repair disk. (See page C–1.)
Once you have logged in, you will have access to the MTS 100 submenu shown
in Figure 1–5.
Additional Support
1–20
Figure 1–5: The Tektronix MTS100 V2.1 submenu
This manual explains how to use the six Tektronix MTS 100 applications. If you
need information on any application other than those found in the MTS 100
submenu, consult the Windows NT documentation.
Additional support for the MTS 100 can be obtained from the Tektronix support
number. The support number is available from North America. Call 1-800-TEK
WIDE (1-800-835-9433) and ask for MTS 100 support.
MTS 100 MPEG Test System User Manual
Page 40

Page 41

Operating Basics
Á
Á
Á
Á
Á
Á
Á
Á
Á
Á
Á
Á
Á
Á
Á
Á
There are eight applications provided with the MTS 100. Their names and
functions are given in Table 2–1.
T able 2–1: MTS 100 applications
Icon Application Name Function
Analyzer
БББББББББ
(MPEG2 System Analyzer application)
Data Store Control
БББББББББ
(Data Store Administrator)
БББББББББ
DVB Channel Coding and Decoding
(Coder/Decoder application)
БББББББББ
Multiplexer
(MPEG2 Transport Multiplex Generator)
БББББББББ
Packet Jitter
БББББББББ
Table Editor
БББББББББ
(Edit Table application)
БББББББББ
Analyze transport stream files and packe-
ББББББББББ
tized elementary streams.
Manage the Data Store Disks. It also
ББББББББББ
controls acquisition and generation of
ББББББББББ
MPEG-2 transport streams.
Code and decode transport stream files to
DVB specifications.
ББББББББББ
Create transport stream files from PSI and
SI table files, elementary stream files, and
ББББББББББ
data files.
Add jitter to the PCR data in the transport
ББББББББББ
stream file.
Create and edit PMT, NIT, SDT, BAT, and
ББББББББББ
EIT files.
ББББББББББ
Error Injector Insert or correct errors in transport stream
packets.
Set Carb Set parameters of the Data Store system.
Running the Software
Start any of the applications by clicking its name in the Tektronix MTS 100 V2.1
submenu. The HASPR (parallel port software key) must be installed for any of
the applications to operate. If the Data Store board is not installed, the Data Store
Control will not initialize correctly and you will receive an error message.
NOTE. This manual is written assuming a basic level of familiarity with the
Windows 95 or the Windows NT 4.0 operating system. If you are not comfortable
with either operating system, review the Windows NT documentation.
MTS 100 MPEG Test System User Manual
2–1
Page 42

Operating Basics
Tutorials and Reference Sections
Tutorials and reference information are provided to help familiarize you with the
six software applications in the MTS 100. The first of three tutorials begins on
page 2–7. The Reference section begins on page 3–1.
The tutorials step you through both analyzing transport stream files and creating
(multiplexing) MPEG2 transport streams files and transport streams. They are
presented in a step-by-step manner and designed so that you can follow along
using your own MTS 100. The files required for these exercises are shipped with
the MTS 100.
The Reference section explains all of the commands available from each of the
six applications that are part of the MTS 100 package. The explanations are
given in the following order: Menu Bar commands, Command Buttons, and
finally commands that can only be accessed through “mouse-clicks”.
Getting Elementary Bit Stream Files
CD ROM
The standard configuration of the MTS 100 MPEG Test System contains several
video and audio elementary stream files and a sample transport stream file.
These files contain pictures, common industry test signals, and sample signals in
MPEG-2 format. They may be used for the following tutorials and for constructing your own transport streams.
There are two sources of additional elementary stream files: a CD ROM (part
number 063-1914-0x) that is supplied with the instrument and the Tektronix
FTP site.
To use files from the CD ROM, either copy the files to the appropriate directories on the MTS 100 system disk (drive C) or leave the CD ROM in drive D.
2–2
MTS 100 MPEG Test System User Manual
Page 43

Operating Basics
Audio Files. The CD ROM contains the following audio files in the Audio
directory:
15kz–064.mp2
15kz–128.mp2
15kz–192.mp2
15kz–256.mp2
1kz–064.mp2
1kz–128.mp2
1kz–192.mp2
1kz–256.mp2
400–064.mp2
400–128.mp2
400–192.mp2
400–256.mp2
The file names indicate the elementary stream bit rate. The file 15kz–256.mp2,
for example, contains a 15 kHz audio tone at 0.256 Mbits/s.
Video Files. The CD ROM contains the following video files. The Video\525
directory contains streams with 525-line video; the Video\625 directory contains
streams with 625-line video. Both directories contain all listed files.
100b_015.mp2
100b_060.mp2
100b_120.mp2
Bbc3_015.mp2
Bbc3_060.mp2
Bbc3_120.mp2
Cact_015.mp2
Cact_060.mp2
Cact_120.mp2
Mobl_015.mp2
Mobl_060.mp2
Mobl_120.mp2
Mulb_015.mp2
Mulb_060.mp2
4kz–064.mp2
4kz–128.mp2
4kz–192.mp2
4kz–256.mp2
Music064.mp2
Music128.mp2
Music192.mp2
Music256.mp2
Sync–064.mp2
Sync–128.mp2
Sync–192.mp2
Sync–256.mp2
Mulb_120.mp2
Pulb_015.mp2
Pulb_060.mp2
Pulb_120.mp2
Sync_015.mp2
Sync_060.mp2
Sync_120.mp2
Tens_015.mp2
Tens_060.mp2
Tens_120.mp2
V700_015.mp2
V700_060.mp2
V700_120.mp2
The file names indicate the elementary stream bit rate. The file 100b_060.mp2,
for example, contains a video elementary stream with a bit rate of 6.0 Mbits/s.
MTS 100 MPEG Test System User Manual
2–3
Page 44

Operating Basics
Examples. The CD ROM also contains the following files in the Examples
directory:
The MTS100 FTP Site
10khz.mp2
1khz.mp2
Demo_060.mp2
Sample.trp
Demo_015.mp2
A second way to access these same signals (and any new bit streams that may
become available), is via anonymous FTP from the Tektronix MTS 100 FTP site,
. Log in as “anonymous” and use your email address as the the
password. MPEG files are available in subdirectories of /tv/test/streams/Element.
Each directory contains a Readme.txt file that describes the contents of the
directory.
If you have no access to FTP, please contact Tektronix at 1-800-TEK-WIDE and
ask for MTS100 support. An engineer will be glad to help you get the data. If
you have Internet access but are having trouble accessing the site, contact your
system administrator for assistance.
The following script illustrates the procedure for connecting to the MTS 100 FTP
site. Your entries are indicated with bold face type.
% ftp ftp.tek.com
Connected to inet1.tek.com.
220 inet1 FTP server (Version wu–2.4(1) Sun Jan 29 12:29:00 GMT
1995) ready.
2–4
Name (ftp.tek.com:user): anonymous
331 Guest login ok, send your complete e–mail address as password.
Password: enter your email address
230–
230– T E K T R O N I X F T P A R C H I V E
230– /
230–
230 Guest login ok, access restrictions apply.
ftp> cd /tv/test/streams/Element
250 CWD command successful.
ftp> get README.TXT
MTS 100 MPEG Test System User Manual
Page 45

Operating Basics
The data included in this distribution, on the FTP site, is available to the user on
an “as-is” basis. Tektronix disclaims any and all warranties, whether express,
implied, or statuary, including any implied warranties of merchantability or of
fitness for a particular purpose.
MTS 100 MPEG Test System User Manual
2–5
Page 46

Operating Basics
2–6
MTS 100 MPEG Test System User Manual
Page 47

Tutorial: Analyze a Signal
This section is intended to introduce you to the features and capabilities of the
MPEG-2 System Analyzer. This “guided tour” uses step-by-step procedures and
a standard MTS 100 sample transport stream file so you can follow along with
your own system.
NOTE. To help you follow along with your own MTS 100, all steps that require
your action are numbered.
Terms
Wherever possible, this manual uses terminology consistent with Microsoft
WindowsT and MPEG standards. Refer to the Windows documentation
(included with the MTS 100 MPEG Test System) for definitions and explanations of Windows terminology. Refer to the Glossary at the back of this manual
for definitions of terms unique to MPEG or the test system; refer to the Index,
also at the back of this manual, to locate other mentions of any subject.
Getting Help
As you follow the procedures in this section, remember that additional information about almost every aspect of MPEG-2/DVB bit streams and analyzer
operation is available from three convenient sources:
H The Reference section of this manual. Using the Analyzer begins on
page 3–1.
H The analyzer Help menu
H The MPEG-2 Help utility, which contains applicable MPEG-2 standards in
Windows Help format. Start this utility from the Tektronix MTS100 V2.1
submenu.
Figure 2–1: Starting the MPEG-2 Help utility
MTS 100 MPEG Test System User Manual
2–7
Page 48

Tutorial: Analyze a Signal
Starting the Analyzer Application
Start the Analyzer by clicking on the Analyzer name in the Tektronix MTS100 V2.1 submenu.
Figure 2–2: Starting the Analyzer
The Analyzer starts with the Tektronix/Matra background in the application
window. Note the location of the features named in Figure 2–3.
Menu bar
Upper toolbar
2–8
Lower toolbar
Status bar
Figure 2–3: The Analyzer application window
MTS 100 MPEG Test System User Manual
Page 49

Tutorial: Analyze a Signal
Menu Bar
There are seven main analyzer menus:
File. File menu commands control the analyzer/disk interface and printing.
Edit. Use Edit menu commands to move among items (transport packets,
elementary stream packets, PSI or SI DVB table sections) of the type displayed
in the selected document window.
Selection. Use Selection menu commands to control extractions from a transport
stream file.
Analysis. Analysis menu commands provide access the stream analysis functions.
Options. Use Options menu commands to select analyzer configuration options.
Window. Use Window menu commands to manage the various open document
windows.
Help. The Help menu provides access to various forms of help.
Upper Toolbar
Figure 2–4 shows the functions available from the upper toolbar.
Open Save As Hierarchic View Add View
Figure 2–4: Command buttons on the upper toolbar
To display a reminder of the button function in the status bar (at the bottom of
the application window) at any time, position the mouse cursor over the
command button.
MTS 100 MPEG Test System User Manual
2–9
Page 50

Tutorial: Analyze a Signal
Lower Toolbar
Figure 2–5 shows the functions available from the lower toolbar. These
commands duplicate those in the Edit menu; they are available only when the
active window contains one of a possible series of items.
First
Figure 2–5: Command buttons on the lower toolbar
Again, position the cursor over a command button as shown in Figure 2–6 to
display a button function reminder in the status bar.
Figure 2–6: Using the status bar
Previous Go To Next Last Number of items Find next error
Opening an Existing Transport Stream File
Your MTS 100 has the sample transport stream file SAMPLE.TRP to assist in
following the tutorial.
1. From the File menu, choose Open. This brings up the Open dialog box as
shown in Figure 2–7.
Figure 2–7: The Open dialog box
2–10
MTS 100 MPEG Test System User Manual
Page 51

Tutorial: Analyze a Signal
2. Select Stream from the list of File Types.
3. Select SAMPLE.TRP from the file name list.
4. Choose OK. Figure 2–8 shows the resulting document window. This is the
hierarchic view of the multiplex encoded in the sample transport stream.
NOTE. The Analyzer cannot generate a hierarchic view if the stream does not
contain a PAT (program allocation table, PID 0) or PMT (program map table).
The hierarchic view that appears when you first open a file is based on the first
versions of the PAT and PMT tables found in the stream. You can use the Next
command in the Edit menu or click on the Next command button (in the lower
toolbar) to go to the next PSI version, if any, in the stream.
Figure 2–8: The hierarchic view of the SAMPLE.TRP stream
The Hierarchic View
The hierarchic view allows you to select an icon that represents a particular
element in the stream and make a more detailed analysis. When selected, an icon
displays in reverse video. After selection, all the extraction and analysis
functions are available through the toolbars and menus.
Table 2–2 identifies the icons used in the hierarchic view.
MTS 100 MPEG Test System User Manual
2–11
Page 52

Tutorial: Analyze a Signal
Á
Á
Á
Á
Á
Á
Á
Á
Á
Á
Á
Á
Á
Á
Á
Á
Á
Á
Á
Á
Á
T able 2–2: Icons used in the hierarchic view
Icon Element Type
Multiplex transport packets. This icon represents all (188- and 204-byte) transport
ББББББББББББББББББББ
packets that make up the stream. If you visualize the transport stream as a train, this
icon represents every car in the train, regardless of its configuration (flat car, boxcar,
ББББББББББББББББББББ
or hopper for example) and what it contains.
Transport packets of a particular PID (Program ID). Other elements (tables, clocks,
ББББББББББББББББББББ
PES packets) are the “payload” contained within transport packets or are constructed
ББББББББББББББББББББ
from the payload of several transport packets that have the same PID. The PID
number appears under the icon.
ББББББББББББББББББББ
ББББББББББББББББББББ
In the hierarchic view, the icon to the right of this icon represents the payload of
packets with this PID.
ББББББББББББББББББББ
Transport Packets that contain independent PCR clocks. The PID appears under the
icon.
ББББББББББББББББББББ
PAT (Program Association Table) sections. Always contained in PID0 transport
packets.
ББББББББББББББББББББ
PMT (Program Map Table) sections.
ББББББББББББББББББББ
ББББББББББББББББББББ
NIT (Network Information Table) Provides access to SI Tables through the PSI/SI
ББББББББББББББББББББ
command from the Selection menu. Also used for Private sections.
ББББББББББББББББББББ
When the DVB option (in the Options menu) is selected, this icon can also represent
ББББББББББББББББББББ
SDT, BAT, EIT, and TDT sections.
Packetized Elementary Stream (PES). This icon represents all packets that, together,
contain a given elementary stream. Individual PES packets are assembled from the
ББББББББББББББББББББ
payloads of several transport packets.
ББББББББББББББББББББ
Video elementary stream
ББББББББББББББББББББ
Audio elementary stream
ББББББББББББББББББББ
ББББББББББББББББББББ
Data elementary stream
ББББББББББББББББББББ
ББББББББББББББББББББ
ECM (Entitlement Control Message) sections
2–12
EMM (Entitlement Management Message) sections
MTS 100 MPEG Test System User Manual
Page 53

Tutorial: Analyze a Signal
Icon menus. Each type of hierarchic view icon has a context-specific shortcut
menu that allows quick access to the functions available specifically for the
chosen element. Figure 2–9 shows the shortcut menus for the common icons.
Display this menu by clicking the right mouse button on the icon. Hold the
mouse button down, highlight the desired command, and release the button to
select the command.
NOTE. In all cases, you can select the first command on the shortcut menu (or
the only command in one-item menus) by double-clicking on the icon. For all but
elementary stream icons, this will open an “interpreted view” of the packet or
section. Please continue with this tutorial to learn more about interpreted views.
Figure 2–9: Hierarchic view shortcut menus
Additional Information from the TS Icon
1. Click on the TS icon with the right mouse button and hold the button down
to open the TS shortcut menu, as shown in Figure 2–10.
Figure 2–10: The TS icon shortcut menu
2. Highlight Transport Packets and release the button. This opens an interpreted
view of the first complete transport packet in the stream, as shown in
Figure 2–11.
MTS 100 MPEG Test System User Manual
2–13
Page 54

Tutorial: Analyze a Signal
Item data
Header fields
Packet (item)
contents
Figure 2–11: The interpreted view of the first transport packet
NOTE. You can also open the same interpreted view simply by double-clicking on
the TS icon.
The Interpreted View
The interpreted view shows the structure of the transport packet and provides
access to all the information contained in the packet header and payload. The
transport packet display shows one transport packet at a time.
1. Use the command buttons on the lower toolbar to quickly scroll among the
transport packets. Notice that the Item number changes as you scroll through
the transport packets.
First
Previous Go To Next Last Number of items Find next error
Figure 2–12: Command buttons on the lower toolbar
The transport stream in SAMPLE.TRP consists of 9300 transport packets, as
indicated by the item number (Item 1/9300) at the top of the display. Many
interpreted views do not indicate the total number of items when the view is
first opened; click on either the Number of Items or the Last command
button to add the information to the item data.
2–14
Since this is an analysis program, you should be looking for errors in the stream.
2. Find the next error in the stream by clicking the Next Error button. The
program will search forward in the stream until it either finds an error or
reaches the end of the file. If it finds an error, the interpreted view automatically displays the transport packet that contains the error.
MTS 100 MPEG Test System User Manual
Page 55

Tutorial: Analyze a Signal
3. Double-click on any packet field name for more information about the field,
as shown in Figure 2–13.
Figure 2–13: Double-click for an explanation of the field
Now see what it has to say about the value of the PID.
4. Click anywhere in the interpreted view outside of the PID message box to
dismiss the message. Then double-click on the PID value (0), to display help
information about the value, as shown in Figure 2–14. In this case, the
message reminds you that PID 0 always identifies the PAT.
Figure 2–14: Help information for the packet field value
Sometimes you can learn more by looking at field values displayed in hexadecimal base. Now change the display to show hexadecimal values.
5. Choose Base from the Options menu, select the Hexadecimal option button
in the Base dialog box, and click OK. Or simply press the F2 function key to
MTS 100 MPEG Test System User Manual
2–15
Page 56

Tutorial: Analyze a Signal
toggle field values (and values in the hierarchic view) between decimal and
hexadecimal base.
Figure 2–15: Press F2 to toggle numeric base
The Hexadecimal View
The hexadecimal view shows all bytes that make up the current item. An
MPEG-2 transport packet consists of 188 or 204 bytes.
1. To open a hexadecimal view, first click the Add View command button—on
the upper toolbar—to open the View Type submenu, as shown in Figure 2–16.
Figure 2–16: The View Type submenu
2. Choose Hexadecimal from the submenu. This produces the hexadecimal
dump shown in Figure 2–17.
2–16
Figure 2–17: Hexadecimal view of a transport packet
Notice that the first few bytes appear in blue characters on the MTS 100
display to indicate that they are required header information for the type of
MTS 100 MPEG Test System User Manual
Page 57

Tutorial: Analyze a Signal
item. A transport packet has four required bytes. The blue, required bytes
may be followed by several bytes shown in gray (for an example, use the
command buttons to go to item three of SAMPLE.TRP). These gray bytes
are optional or variable header information. The remaining bytes, displayed
with black characters, are the payload or data bytes.
3. Close both transport packet windows (interpreted and hexadecimal views) so
you are ready to look at a PID map of the sample transport stream.
PID Map
The PID map can help you quickly locate the stream location and exact packet
(item) number of a particular table section
1. Click on the hierarchic view TS icon with the right mouse button. Hold the
button down to reveal the shortcut menu, as shown in Figure 2–18.
Figure 2–18: The TS icon shortcut menu
2. Choose PID Map from the menu. This creates the window shown in
Figure 2–19.
Figure 2–19: The PID map of SAMPLE.TRP packets 1 to 100
MTS 100 MPEG Test System User Manual
2–17
Page 58

Tutorial: Analyze a Signal
The PID map represents every transport packet in the stream with its PID
(for uniformity, every PID is listed in a four digit field). In the map, each
unique PID is color-coded according to the type of element it identifies. For
example, the PIDs of packets that contain PAT sections are displayed in light
green characters. The black numbers down the left side of the window
indicate the packet number of the first packet of every row. Notice that the
first PAT section is in packet one.
Multiplex Allocation
3. Click the Next command button (you remember: the one with the “
"” on it)
repeatedly until you see the next light green PID. The second PAT section in
SAMPLE.TRP is in packet 334.
4. Close the PID map so you are ready to look at Multiplex Allocation in the
sample transport stream.
You can use the Multiplex Allocation view to discover what fraction of the
transport stream multiplex is used by each PID.
1. Once again, click on the hierarchic view TS icon with the right mouse button
to open the shortcut menu. This time, choose Multiplex Allocation to create
the window shown in Figure 2–20.
2–18
Figure 2–20: The Multiplex Allocation document window
The multiplex allocation pie chart is useful in determining which PIDs are
present in the transport stream and in confirming that each PID is using the
expected amount of the multiplex.
NOTE. PID 8191 is the stuffing PID; it is not shown in the hierarchic view.
MTS 100 MPEG Test System User Manual
Page 59

2. Close the multiplex allocation window so you are ready to look at the
transport packets of a particular PID with a minimum of clutter.
Additional Information from the Transport Packet Icon
The transport packet (rail car) icon represents transport stream packets that are
identified with a particular PID. Other elements (such as table sections or PES
packets) are the payload contained within these transport packets; the elements
may be fully contained within one packet or constructed from the payload of
several packets with the same PID. The PID number appears under the transport
packet icon. In the hierarchic view, the icon immediately to the right of a
transport packet icon represents the payload.
1. Press function key F2, if necessary, to display hierarchic view values in
decimal base.
2. Double-click on the PID 21 transport packet icon, as shown in Figure 2–21.
Tutorial: Analyze a Signal
Figure 2–21: Double-click on the PID 21 icon
The analyzer opens a window similar to Figure 2–22.
Figure 2–22: Interpreted view of the first PID 21 transport packet
MTS 100 MPEG Test System User Manual
2–19
Page 60

Tutorial: Analyze a Signal
You can search for errors and get additional information about the fields and
field values just as you did with the transport packet at the TS level. The
difference is that now you are looking at only the packets of PID 21, which
contain PMT sections describing program one.
3. Click the Last command button in the lower toolbar to go to the last PID 21
packet in the transport stream (if you have forgotten which button to use,
move the cursor slowly over all buttons in the lower toolbar while watching
the messages in the status bar, immediately below). Notice—by looking at
the item data near the top of the window as shown in Figure 2–23—that
there are only 14 transport packets of the 9300 in the SAMPLE.TRP stream
that are identified with PID 21.
Item data
Figure 2–23: The last PID 21 packet in SAMPLE.TRP
By the way, the item position is the number of the first byte in the packet relative
to the beginning (byte 0) of the transport stream file. In other words, there are
1625260 bytes in the file (and stream) before this packet.
As with the TS interpreted view, you can open a hexadecimal view of the packet
through the Add View command button. Another way to look at the packets is in
a binary view.
1. Click on the Add View button as shown in Figure 2–24.
Figure 2–24: The View Type submenu
2. Select Binary from the View Type submenu. The analyzer opens a window
similar to Figure 2–25.
Notice that the first eight-bit byte, which corresponds to the sync byte (see
the interpreted view in Figure 2–22), is 01000111. Not surprisingly, this is
the binary equivalent of 71 decimal and 0x47 hex. The next three bits
correspond to the following three packet fields, and the 13 bits after that (to
the end of the third byte) correspond to the PID. Sure enough,
00000 00010101 equals 21 decimal.
2–20
MTS 100 MPEG Test System User Manual
Page 61

Tutorial: Analyze a Signal
Figure 2–25: The binary view of PID 21 item 14
3. Close the PID 21 interpreted and binary view windows before you proceed.
Additional Information from the PAT Icon
The PAT icon represents PAT (Program Association Table) sections. PAT
sections are always contained in PID 0 transport packets.
1. Click on the hierarchic view PAT icon with the right mouse button. Hold the
button down to reveal the shortcut menu, as shown in Figure 2–26.
Figure 2–26: The PAT icon shortcut menu
2. Choose Section from the shortcut menu to open an interpreted view of the
PAT (Program Association Table). The window resembles Figure 2–27.
NOTE. You can also open the same interpreted view simply by double-clicking on
the PAT icon.
MTS 100 MPEG Test System User Manual
2–21
Page 62

Tutorial: Analyze a Signal
Item data
Header fields
Program 0
information
Program 1
information
Section CRC
Figure 2–27: The P AT section interpreted view
You can do all the same things at the PAT section level that you can at the
transport packet level. You can search for errors, get information on the fields
and field values, and scroll among the PAT sections contained in the stream.
3. Close this window before you proceed.
The analyzer automatically calculates and checks the CRC of the first PAT
section when opening a transport stream file. Select the second PAT shortcut
menu command, Check CRC, to calculate the CRC (cyclic redundancy code) of
every PAT section in the stream and compare it to the number coded into the
section’s CRC field.
4. Click on the PAT icon with the right mouse button and hold the button down
to show the PAT shortcut menu. Highlight the Check CRC command and
release the button. If no erroneous CRCs are found, the analyzer creates the
dialog box shown in Figure 2–28.
2–22
Figure 2–28: The CRC Analysis dialog box
5. Click OK to close the dialog box and then close the PAT interpreted view to
continue with the tutorial.
MTS 100 MPEG Test System User Manual
Page 63

Additional Information from the PMT Icon
The PMT (Program Map Table) icon, like all others in the hierarchic view, has
its own shortcut menu. As with most other icons, you can double-click on the
PMT icon to open an interpreted view of PMT sections.
Tutorial: Analyze a Signal
Section
1. Click on the PMT icon with the right mouse button and hold the button
down to take a look at the PMT shortcut menu, as shown in Figure 2–29.
Figure 2–29: The PMT shortcut menu
2. Choose Section from the menu or release the right mouse button and
double-click with the left button to open an interpreted view similar to
Figure 2–30.
Figure 2–30: The PMT interpreted view
MTS 100 MPEG Test System User Manual
2–23
Page 64

Tutorial: Analyze a Signal
Syntax Analysis
Perform a Syntax Analysis on this PMT section.
1. From the Analysis menu choose Syntaxic, as shown in Figure 2–31.
Figure 2–31: Choosing Syntaxic from the Analysis menu
Syntax analysis checks all PMT sections in the stream for errors and variations
from the standard. It searches for errors that are within the PMT itself and
relative to the other tables (NIT and SDT for example). The example does not
have any PMT syntax errors, as shown in Figure 2–32.
2–24
Figure 2–32: The Syntax Analysis message window
2. Click OK to close the Syntax Analysis message window.
Now, the fact that no syntax errors were found in any of the PMT sections does
not guarantee that there are no such errors in the entire stream. Let’s widen the
search.
3. Click anywhere on the hierarchic view window to select it. (Or minimize the
PMT interpreted view window; the remaining, hierarchic view window is
then automatically selected.)
4. Once again, choose Syntaxic from the Analysis menu. This time, the
analyzer searches the entire stream for errors. If it finds any (and it does in
SAMPLE.TRP), it opens a window similar to Figure 2–33.
MTS 100 MPEG Test System User Manual
Page 65

Tutorial: Analyze a Signal
Figure 2–33: A message window listing syntax errors
Each line in the message window represents one syntax error. You can doubleclick on a line to open an interpreted view of the item that contains the error.
Notice that in this case all errors are in one PES packet. Let’s wait until the
discussion of the PES icon to talk about these errors.
5. Close the syntax error message window before you proceed.
Check CRC
You can check the CRCs in all PMT sections through the shortcut menu just as
you did with the PAT sections.
You can also check every CRC in the transport stream just like you checked the
syntax of all items in the stream:
1. Select the hierarchic view again.
2. Choose Check CRC from the Analysis menu, as shown in Figure 2–34.
Figure 2–34: Choosing Check CRC from the Analysis menu
If CRC errors are found, the analyzer lists the errors in a window similar to
Figure 2–33. Because SAMPLE.TRP contains no CRC errors, however, the
analyzer displays the message window shown in Figure 2–35.
MTS 100 MPEG Test System User Manual
2–25
Page 66

Tutorial: Analyze a Signal
Figure 2–35: CRCs in all sections are correct
3. Click OK (or press Enter) to dismiss the CRC analysis message window and
close the interpreted view window before proceeding.
PCR Analysis
PCR (Program Clock Reference) analysis allows you to see a graphical
representation of the PCRs versus time.
1. Click on the PMT icon with the right mouse button and hold the button
down to open the PMT shortcut menu, as shown in Figure 2–36.
Figure 2–36: The PMT shortcut menu
2. Choose PCR Analysis from the menu to open a PCR diagram window
similar to Figure 2–37. This diagram shows the first ten clocks in the
program.
2–26
Figure 2–37: The PCR analysis display
MTS 100 MPEG Test System User Manual
Page 67

Tutorial: Analyze a Signal
3. Double-click on the third clock icon. This brings up the PCR value window
as shown in Figure 2–38.
Figure 2–38: Double-click on the clock icon to list clock values
You can also display the values of all of ten diagrammed PCRs at once.
4. Click the Add View command button in the upper toolbar.
5. Choose PCR Values from the View type submenu, as shown in Figure 2–39.
The analyzer creates a window, similar to Figure 2–40, that lists the values
for all ten PCRs in the diagram.
Figure 2–39: The PCR View Type submenu
MTS 100 MPEG Test System User Manual
2–27
Page 68

Tutorial: Analyze a Signal
Figure 2–40: The PCR values display
You can navigate among the program PCRs with the command buttons on the
lower toolbar.
6. Click the Next command button to show the values of the next ten PCRs
(numbers 11 through 20) in the stream.
T-STD Analysis
7. Select the PCR diagram window again—the window title says: PCR of
SAMPLE.TRP (PID 50, Program 1):1—and notice that the diagram also
shows PCRs 11 through 20.
8. Close all windows except the hierarchic view before continuing with the
tutorial.
T-STD analysis checks the selected program against the (transport stream system
target) decoder model that is defined in the MPEG-2 standard.
1. Select the Options menu and make sure that Visual TSTD and LTW is
selected as shown in Figure 2–41.
Figure 2–41: Visual TSTD and LTW selected
2. Choose T-STD Analysis from the PMT shortcut menu, as shown in
Figure 2–42.
2–28
MTS 100 MPEG Test System User Manual
Page 69

Tutorial: Analyze a Signal
Figure 2–42: Choosing T-STD Analysis from the shortcut menu
Because visual mode is selected, the analyzer opens a Buffering Simulation
window similar to Figure 2–43. The window contains dynamic bar graphs of the
video, audio, and system buffers; the graphs show how full each buffer is at a
given point in decoding and change color from blue to yellow to red as buffer
overflow approaches and occurs. Notice that the simulation is not real-time and
may take several minutes. If you have the time, do watch to see what happens, as
SAMPLE.TRP will cause buffer overflows and have errors to report when the
simulation in done.
Figure 2–43: The T-STD Buffering Simulation window
3. If you don’t have the time to let the simulation finish on its own, click the
Abort button in the lower-right of the simulation window. The simulation
pauses and you can choose to resume analysis or close the window.
Buffer overflows occur near the end of SAMPLE.TRP, and the analyzer opens
the window shown in Figure 2–44. Each line of text in the window represents
one error. As the analyzer discovers additional errors, it adds them to the bottom
of the list. At the end of analysis, all activity in the Buffer Simulation window
stops.
MTS 100 MPEG Test System User Manual
2–29
Page 70

Tutorial: Analyze a Signal
Figure 2–44: The T-STD error list
4. Close all windows except the hierarchic view before continuing with the
tutorial.
Additional Information from the PES Packet Icon
The PES (Packetized Elementary Stream) packet icon represents all packets that,
together, contain a given elementary stream. Individual PES packets are
assembled from the payloads of several transport packets. You can learn more
about the PES packets and their PTS/DTS (Presentation and Decode Time
Stamps) through this icon.
Interpreted View
1. Click on the PID 50 PES icon with the right mouse button and hold the
button down to take a look at the PES shortcut menu, as shown in Figure 2–45.
Figure 2–45: The drop-down menu for the PES icon
2. Choose PES Packets from the menu (or release the right mouse button and
double-click with the left button) to open an interpreted view similar to
Figure 2–46.
Notice that the item data (near the top of the window) now includes a Time:
entry. This is the time that the first byte of the packet appears in the transport
stream, relative to the beginning of the stream. The time is included in all
interpreted views that you open after performing an analysis that involve a
multiplex rate calculation. Both the PCR analysis and the T-STD analysis,
performed while looking at the PMT icon, involve a “mux rate” calculation.
2–30
MTS 100 MPEG Test System User Manual
Page 71

Tutorial: Analyze a Signal
Figure 2–46: The PES packet interpreted view
This interpreted view offers all of the same options as were given in the previous
discussions. Remember the syntax errors the analyzer reported when you
performed a “Syntaxic” analysis of the entire stream? They are in a PID 50 PES
packet.
3. Click the Next Error button on the lower toolbar. The program checks each
packet in the stream for errors. If it finds an error, it automatically jumps to
the transport packet containing the error. There are several errors in the last
PID 50 PES packet in SAMPLE.TRP, as shown in Figure 2–47. The errors
are highlighted in red on the MTS 100 display.
Figure 2–47: The PES Packet with the errors circled
You can find out more about any error by double-clicking on the field name and
its value.
MTS 100 MPEG Test System User Manual
2–31
Page 72

Tutorial: Analyze a Signal
4. Double-click on the “packet start code prefix” box, as shown in Figure 2–48,
to learn more about the field.
Figure 2–48: Double-click for information about the field
5. Read about the field and then click on the field box once to dismiss the
message window.
PTS/DTS
6. Double-click on the field, as shown in Figure 2–49, to reveal the value
help/error message.
Figure 2–49: Double-click for information for the field value
7. Close the interpreted view window.
PTS/DTS analysis extracts the presentation and decode time stamps embedded in
the elementary stream and shows their relative time positions in a graphical
display window. Through this display, you can check that all of the time stamps
“make sense” (PTS must be later than DTS, and both must be after the
associated data arrives) and check for the existence of B fields, which have no
DTS.
1. Click on the PID 50 PES icon with the right mouse button and hold the
button down to open the PES packet shortcut menu, as shown in
Figure 2–50.
2–32
MTS 100 MPEG Test System User Manual
Page 73

Tutorial: Analyze a Signal
Figure 2–50: The PID 50 PES shortcut menu
2. Highlight PTS/DTS and release the button. This opens a window containing
a diagram of the first four PTS/DTS “events” in the elementary stream, as
shown in Figure 2–51.
Figure 2–51: The PTS/DTS diagram
NOTE. The diagram in Figure 2–51 reveals some errors in the SAMPLE.TRP
PID 50 elementary stream:
Three of the arrival times do not coincide with the start of the associated
access unit.
Two of the PTS/DTS events involve more than one access unit.
Both of these errors suggest problems in the encoding process. See Figure 2–52
for an example of a diagram from a correctly encoded stream.
MTS 100 MPEG Test System User Manual
2–33
Page 74

Tutorial: Analyze a Signal
Figure 2–52: PTS/DTS diagram from a correctly encoded stream
Table 2–3 lists and explains the icons used in the PTS/DTS diagram.
T able 2–3: PTS/DTS graphic view icons
Icon Represents Double-click for
PCR (program clock reference) V alue
Location in transport stream (TS packet number)
Arrival time of the PTS/DTS Value
Time since the previous PTS/DTS arrived
Location in elementary stream (PES packet number)
DTS (decode time stamp) V alue
Location in elementary stream (PES packet number)
PTS (presentation time stamp) V alue
Location in elementary stream (PES packet number)
AU (access unit) Begin time
End time
Size in bytes
Type of frame (intra, predicted, or bidirection)
Reference time
The example timing diagram illustrates several features of a correctly encoded
MPEG-2 video stream:
2–34
Access units arrive one after another, as you can see from the left (“early”)
side of the diagram.
The order of access unit decoding and presentation is visible in the right
(later) portion of the diagram.
MTS 100 MPEG Test System User Manual
Page 75

Tutorial: Analyze a Signal
Intra (I) and predicted (P) pictures must be decoded before presentation and
therefore have both DTS and PTS. B (bidirection) frames are decoded and
presented at the same time and therefore have only presentation time stamps.
B frames use information in an associated P frame; the P frame must be
decoded before the B frame(s), but is presented after. In the example, then,
the order of frame decoding is IPBB, but the order of presentation is IBBP.
As the Table 2–3 heading indicates, you can get more information about the
various objects in the diagram by double-clicking on the icon.
3. Double-click on the first arrival icon to reveal its values, as shown in
Figure 2–53.
Figure 2–53: Information about the first arrival time
4. Click within the PTS/DTS diagram window, but outside of the Arrived value
window, to dismiss the value window.
5. Double-click on the first AU icon, as shown in Figure 2–54, to learn more
about the access unit.
MTS 100 MPEG Test System User Manual
2–35
Page 76

Tutorial: Analyze a Signal
Figure 2–54: Information about the first access unit
Viewing PSI/SI Data
Just as you did with interpreted views, you can navigate among the time stamps
of an elementary stream with the lower toolbar command buttons (and the
equivalent commands in the Edit menu).
6. If you wish, experiment using the lower toolbar command buttons to move
among all the time stamps in the elementary stream (or at least the part of the
stream that was saved in SAMPLE.TRP).
7. When you are ready, close all windows but the hierarchic view of
SAMPLE.TRP and continue with the tutorial.
1. If possible, open a DVB (Digital Video Broadcast) transport stream file. If
you do not have such a file available, continue with the original file,
SAMPLE.TRP.
2. Select the Options menu and choose DVB if it isn’t already check-marked
(✓), as shown in Figure 2–55.
2–36
Figure 2–55: The check mark indicates that DVB is selected
MTS 100 MPEG Test System User Manual
Page 77

Tutorial: Analyze a Signal
3. Select the hierarchic view, if necessary, and then choose PSI/SI from the
Selection menu. The dialog box shown in Figure 2–56 appears.
Figure 2–56: The PSI/SI Selection dialog box
NOTE. Annuler is the Cancel button for this dialog box.
4. Click NIT as shown in Figure 2–56.
5. Click OK to open an interpreted view of the first NIT section in the stream
as shown in Figure 2–57. The exact appearance of the view will depend on
the configuration of your particular DVB stream.
NOTE. You can also open this view by double-clicking on the NIT icon or by
selecting Section from the icon shortcut menu.
Figure 2–57: The NIT section interpreted view
MTS 100 MPEG Test System User Manual
2–37
Page 78

Tutorial: Analyze a Signal
6. Double-click on a descriptor field, if the NIT contains them, as shown in
Figure 2–58. The resulting descriptor message box contains an ASCII
decode of the network information associated with the transport stream.
Figure 2–58: Double-click for an ASCII decode of the descriptor
Automatic Analysis
You can use the same technique to view descriptor information in any DVB table
in the stream.
7. Close the NIT section window.
In the course of this tutorial, you have used the MPEG-2 System Analyzer to
perform several kinds of analysis on various stream elements. The analyzer also
has an automatic analysis feature that simplifies evaluation of the entire transport
stream, yet still permits detailed analysis of many types of error.
The following procedure assumes that you still have the hierarchic view of
SAMPLE.TRP open on your MTS 100 display. If you closed that window to
view a DVB stream in the last section of this tutorial, open SAMPLE.TRP again
before you continue.
1. Choose Automatic analysis from the Options menu. The dialog box shown
in Figure 2–59 appears.
2–38
MTS 100 MPEG Test System User Manual
Page 79

Tutorial: Analyze a Signal
Figure 2–59: The automatic analysis Options dialog box
2. By default, automatic analysis includes all the listed tests. Automatic
analysis takes several seconds to several minutes, depending on the size and
complexity of the file, speed of your MTS 100, and the number and type of
analyses selected through this dialog box. Dynamic analysis, the last
selection in the dialog box, takes much longer than all other tests combined.
If you are following this exercise to familiarize yourself with the analyzer,
click on the Dynamic check-box to de-select Dynamic analysis.
NOTE. The MPEG-2 System Analyzer can conduct three kinds of Dynamic
analysis: T-STD (transport stream target decoder), LTW (legal time window),
and Smoothing Buffer. Automatic analysis includes only T-STD analysis; the
remaining dynamic analyses must be performed manually. Refer to the Reference
section of this manual for more information about Dynamic analysis.
3. Choose OK to confirm the selections and close the dialog box.
4. Choose Automatic from the Analysis menu. The window shown in
Figure 2–60 appears. This Automatic analysis window contains a table that
shows the progress and results of the various tests. As the analysis sequence
proceeds, cells in the Status column change from blank to Running to
Completed. As each test is completed, either OK or Errors (in red) appears in
the corresponding Result cell, depending on the results of the analysis.
If you wish to end the analysis at any time, click Abort after current task, at
the bottom of the window.
MTS 100 MPEG Test System User Manual
2–39
Page 80

Tutorial: Analyze a Signal
Figure 2–60: The automatic analysis window
5. When all analyses are complete, the Automatic analysis window provides
access to detailed information about each detected error. For a list of the
syntax errors in SAMPLE.TRP, for example, double-click in the Syntaxic
Result cell, as shown in Figure 2–61. A window that lists the errors appears
in the Analyzer application window; the window listing the syntax errors in
SAMPLE.TRP is similar to Figure 2–62.
2–40
Figure 2–61: Double-click for error details
MTS 100 MPEG Test System User Manual
Page 81

Tutorial: Analyze a Signal
Figure 2–62: The list of syntax errors found in SAMPLE.TRP
Double-clicking on a listed syntax, PCR, PTS/DTS, or semantic error leads to
even more information about the error.
6. Double-click on a syntax error, as shown in Figure 2–62, to open a window
resembling Figure 2–63. This window contains an interpreted view of the
section (in this case, a PES packet) that contains the error. Red characters (on
the PC monitor) indicate syntax errors.
Figure 2–63: Interpreted view of a PES packet with syntax errors
MTS 100 MPEG Test System User Manual
2–41
Page 82

Tutorial: Analyze a Signal
This is a good opportunity to review some of the techniques you can use to learn
more from an interpreted view.
Each “block” in the interpreted view represents a field of data. The field
value (or number of bytes in a data field) appears below the field name. Press
F2 key to toggle the value between decimal base and hexadecimal base.
the
F2
Double-click on a field name for more information about the field.
Double-click on a data field name to add a byte-by-byte hexadecimal view of
the interpreted view.
2–42
MTS 100 MPEG Test System User Manual
Page 83

Tutorial: Analyze a Signal
Double-click on the field value/size to reveal additional information about
the value and error, if any.
7. Return to step 5 and double-click in the remaining “Error” results cells. The
type of display and information available is the same as when the individual
analysis is conducted manually (by selecting it from the Analysis menu).
Refer to the Reference section for more information about each type of
analysis.
Quitting the Analyzer
This completes the tutorial for the MPEG-2 System Analyzer. Exit the application by choosing Exit from the File menu.
MTS 100 MPEG Test System User Manual
2–43
Page 84

Tutorial: Analyze a Signal
2–44
MTS 100 MPEG Test System User Manual
Page 85

Tutorial: Creating an MPEG-2 Transport Stream
This section explains how to create an MPEG-2 transport stream. First, you will
make a simple transport stream file, then a significantly more complex one.
Finally, this section gives a brief introduction of how to send the signal that you
created out one of the ports on the MTS 100 rear panel as an actual transport
stream. There is an optional tutorial following this one that explains how to build
a transport stream file that contains DVB (Digital Video Broadcast) information.
This section steps you through the Multiplexer, Edit Table, and Disk Manager
applications. These procedures are “step-by-step,” so you can follow along with
your own instrument. You will use files provided with the MTS 100.
NOTE. To aid in following along with your own MTS 100, all steps requiring
action are numbered.
Terms
Start the Multiplexer
There are two specific terms used in this section that are not interchangeable:
transport stream and transport stream file.
A transport stream is the signal that comes out (or in) one of the connectors on
the rear panel of the MTS 100.
A transport stream file is a file on a disk. When the MTS 100 sends this file out
one of the rear-panel connectors (properly timed), it becomes a transport stream.
Click on the Multiplexer name in the Tektronix MTS100 V2.1 submenu. This
starts the Multiplexer application as shown in Figure 2–64.
MTS 100 MPEG Test System User Manual
2–45
Page 86

Tutorial: Creating an MPEG-2 Transport Stream
Title bar
Menu bar
Tool bar
Status bar
Figure 2–64: The Multiplexer application window
Making a Simple Transport Stream File
1. Choose New from the File menu or the New command button from the tool
bar. This results in the New configuration file box shown in Figure 2–65.
2–46
Figure 2–65: The New configuration file dialog box
MTS 100 MPEG Test System User Manual
Page 87

Tutorial: Creating an MPEG-2 Transport Stream
Notice that you are not going to make a transport stream file right away, but
rather a configuration file. Since transport stream files can be huge, they are not
generated immediately. Instead, configuration files (*.cfg) are created first. These
contain all of the information required to make the transport stream. (For more
information on how they work, please see File Conventions, beginning on
page 3–59.)
2. Enter the name “simple” in the File Name text box (the *.cfg extension is
added automatically).
3. Choose OK. The Multiplexer application now displays the default configura-
tion file. (See Figure 2–66.)
Rate gauge
Duration gauge
Multiplex window
Figure 2–66: The default configuration in the application window
The Multiplex application window has three parts: the Duration gauge, the Rate
gauge, and the Multiplex window.
The Duration gauge gives the status of the multiplex operation. The gauge sits at
0% until you tell the application to create the transport stream file. Since this
process often takes some time, the Duration gauge tells what percentage of the
operation is complete.
MTS 100 MPEG Test System User Manual
2–47
Page 88

Tutorial: Creating an MPEG-2 Transport Stream
Á
Á
Á
Á
Á
Á
Á
Á
Á
Á
Á
Á
Á
Á
Á
Á
Á
Á
Á
The Rate gauge shows the percentage of the available transport stream currently
used. Above the rate gauge bar the target multiplex rate. Below the rate gauge is
the amount currently in use, the actual rate. The actual rate is calculated with the
following formula:
Rate = PSI rate + SI rate + Video rate + Audio rate + Data rate
Below the actual rate is the time period when the highest multiplex rate occurs.
The Multiplex window displays the current configuration file in hierarchic form.
Several icons appear in the Multiplex window to represent specific elements of
the transport stream multiplex. Table 2–4 explains these icons.
T able 2–4: The icons in the multiplexer hierarchic view
Icon Meaning
Multiplex — the main icon for the configuration file.
БББББББББББББББББББ
Required.
Program Specific Information (PSI) — contains the data that allows the
БББББББББББББББББББ
demultiplexing of the programs by decoders.
БББББББББББББББББББ
Required.
БББББББББББББББББББ
Program Association Table (PAT) — This is the main PSI table. It links the
program numbers and the Program Map Table (PMT) PID.
БББББББББББББББББББ
Every transport stream must have a PAT that is always PID0. This table is
БББББББББББББББББББ
required to identify the PID numbers for the table(s) defining each program.
БББББББББББББББББББ
Required.
БББББББББББББББББББ
Program Map Table (PMT) — Specifies the PID values and describes the
program components.
БББББББББББББББББББ
There is a PMT for every program in the transport stream. The table states the
БББББББББББББББББББ
PID for each elementary stream associated with a specific program. There are
БББББББББББББББББББ
no specific PID values for PMT s, however certain transmission systems (such
as Grand Alliance and DVB) require specific values.
БББББББББББББББББББ
БББББББББББББББББББ
Required.
Service Information (SI) — provides information on services and events carried
by different multiplexes or even on other networks. It has up to four tables below
БББББББББББББББББББ
it: NIT, BAT, SDT, and EIT.
БББББББББББББББББББ
Required if using DVB.
БББББББББББББББББББ
Network Information Table (NIT) — provides information about the physical
network.
БББББББББББББББББББ
Required. It is found under PSI if not in DVB mode and under SI if in DVB
БББББББББББББББББББ
mode.
БББББББББББББББББББ
2–48
MTS 100 MPEG Test System User Manual
Page 89

Tutorial: Creating an MPEG-2 Transport Stream
Á
Á
Á
Á
Á
Á
Á
Á
Á
Á
Á
Á
Á
Á
Á
T able 2–4: The icons in the multiplexer hierarchic view (Cont.)
Icon Meaning
Bouquet Association Table (BAT) — provides information regarding bouquets (a
БББББББББББББББББББ
collection of services marketed as a single entity).
БББББББББББББББББББ
Optional (for DVB).
Service Description Table (SDT) — contains data describing the services in the
БББББББББББББББББББ
system, for example, names of services, the service provider, etc.
БББББББББББББББББББ
Optional (for DVB).
Event Information Table (EIT) — contains data concerning events and programs
БББББББББББББББББББ
(a concatenation of one or more events under the control of a broadcaster),
БББББББББББББББББББ
such as event name, start time, duration, etc.
БББББББББББББББББББ
Optional (for DVB).
Program
БББББББББББББББББББ
Required — Each transport stream is required to have at least one program with
БББББББББББББББББББ
one elementary stream.
Add Elementary Streams
Video Elementary Stream
БББББББББББББББББББ
Optional (must be at least one elementary stream in the program).
БББББББББББББББББББ
Audio Elementary Stream
БББББББББББББББББББ
Optional (must be at least one elementary stream in the program).
БББББББББББББББББББ
Data Elementary Stream
БББББББББББББББББББ
Optional (must be at least one elementary stream in the program).
БББББББББББББББББББ
The simplest transport stream possible would have one program with one
elementary stream in it. In this example, you will put two elementary streams in
one program.
Add an elementary stream to program 1.
1. Select the program 1 icon.
2. Click the Add (+) command from the tool bar (or choose the Add command
from the Edit menu). This opens the dialog box shown in Figure 2–67.
MTS 100 MPEG Test System User Manual
2–49
Page 90

Tutorial: Creating an MPEG-2 Transport Stream
Figure 2–67: The Stream to Add dialog box
3. Select the Video option button and click OK (you will eventually add one
elementary stream of each type). This adds a Video icon to program 1 as
shown in Figure 2–68.
2–50
Figure 2–68: The hierarchy with a video icon added to program 1
4. Repeat this procedure (click the Add button, select a type of stream, and
click OK) twice to add an Audio icon and a Data icon to the hierarchy. The
application window resembles Figure 2–69 when you are done.
MTS 100 MPEG Test System User Manual
Page 91

Tutorial: Creating an MPEG-2 Transport Stream
Figure 2–69: The hierarchy with the audio and data icons added
Next, associate elementary stream files with the video, audio, and data icons.
5. Double-click on the video icon. This opens the Video Stream dialog box
shown in Figure 2–70.
Figure 2–70: The Video Stream dialog box
MTS 100 MPEG Test System User Manual
2–51
Page 92

Tutorial: Creating an MPEG-2 Transport Stream
6. Click the Browse button. This allows you to select a video elementary
stream from existing files throught the Video Stream Selection dialog box.
(See Figure 2–71.)
Figure 2–71: The Video Stream Selection dialog box
7. Select c:\mts100\video\625\MOBL_060.MP2, as shown in Figure 2–71.
8. Click OK.
NOTE. The List Files of Type box in the Video Stream Selection dialog box does
not specify the .mp2 file extension. However, you may not select “just any file”
for use as a video elementary stream file. If you select an unacceptable file, you
will see the message box shown in Figure 2–72.
Figure 2–72: Click OK and select another (.mp2) file
All the information about the video elementary stream file loads automatically
into the Video Stream dialog box, as shown in Figure 2–73.
2–52
MTS 100 MPEG Test System User Manual
Page 93

Tutorial: Creating an MPEG-2 Transport Stream
Figure 2–73: Details of the selected video elementary stream
Only four parameters (Elementary Stream Rate, PES Packet Size, Elementary
Stream Initial Delay, and Offset DTS) are editable. If you would like more
information on these fields, please refer to Selecting a Video Stream, beginning
on page 3–91 of this manual.
9. Click OK to accept the settings and close the dialog box. The lower portion
of the Multiplexer application window now resembles Figure 2–74. Notice
that mobl_060.mp2 is now associated with the video icon. Note too, that the
Multiplex Rate gauge is beginning to fill.
MTS 100 MPEG Test System User Manual
2–53
Page 94

Tutorial: Creating an MPEG-2 Transport Stream
Figure 2–74: The display after a video file is associated
Now associate an Audio elementary stream file with the Audio icon.
10. Double-click on the audio icon. This opens the Audio Stream dialog box
shown in Figure 2–75.
2–54
Figure 2–75: The Audio Stream dialog box
MTS 100 MPEG Test System User Manual
Page 95

Tutorial: Creating an MPEG-2 Transport Stream
11. Click the Browse button to open the Audio Stream Selection dialog box
shown in Figure 2–76.
Figure 2–76: The Audio Stream Selection dialog box
12. Select c:\mts100\audio\10KHZ.MP2.
13. Choose OK. This returns you to the Audio Stream dialog box with all the
information about the 10KHZ.MP2 file entered, as shown in Figure 2–77.
Figure 2–77: Details of the selected audio elementary stream
MTS 100 MPEG Test System User Manual
2–55
Page 96

Tutorial: Creating an MPEG-2 Transport Stream
Just like the Video Stream dialog box, the Audio Stream dialog box allows you
to edit only the parameters near the bottom of the dialog box. (Learn more about
these parameters under Selecting an Audio Stream, on page 3–93 of this manual.)
The default parameters are acceptable for the current application.
14. Click OK to select the settings and close the dialog box. This returns you to
the hierarchic display of the configuration file as shown in Figure 2–78.
Figure 2–78: The display after an audio file is associated
Notice that 10KHZ.MP2 is now associated with the Audio Icon and the
Multiplexer Rate gauge is now a little closer to full with the addition of the audio
stream.
You would follow a similar procedure to associate a file with the Data icon.
15. Double-click on the Data icon to open the Data Stream dialog box as shown
in Figure 2–79.
2–56
MTS 100 MPEG Test System User Manual
Page 97

Tutorial: Creating an MPEG-2 Transport Stream
Figure 2–79: The Data Stream dialog box
Notice that this dialog box does not have as much information in it as the Video
Stream and Audio Stream dialog boxes. This is because it does not require
elementary streams — a file of any type is acceptable.
16. Click Cancel to close this dialog box without entering a file.
17. Select the Data icon again. This time you will delete it.
18. Choose either the Delete (–) command button from the tool bar or Delete
from the Edit menu and click Yes when the dialog box shown in Figure 2–80
appears. The hierarchy now resembles Figure 2–81.
Figure 2–80: Click Yes to delete the data stream icon
MTS 100 MPEG Test System User Manual
2–57
Page 98

Tutorial: Creating an MPEG-2 Transport Stream
Figure 2–81: The hierarchy with the Data icon deleted
19. Choose Save from the File menu to save the configuration file.
2–58
MTS 100 MPEG Test System User Manual
Page 99

Tutorial: Creating an MPEG-2 Transport Stream
Create the Transport
Stream File
You are ready to create a transport stream file.
1. Choose Go from the Multiplex menu, or Go from the tool bar. The Multiplex
Output File dialog box appears as shown in Figure 2–82.
Figure 2–82: The Multiplex Output File dialog box
NOTE. The transport stream files can be large. Make sure you have adequate
space on the selected drive before beginning.
You can create the transport stream file directly on the Data Store Board hard
drives by placing the Multiplex Output file in either c:\carb0\mono or
c:\carb0\loop.
Notice that the current configuration file name becomes the default transport
stream file name (with the file name extension changed to .trp).
2. Choose OK to begin creating the simple.trp transport stream file in the
default directory (c:\mts100\cfg-trp). As the MTS 100 generates the transport
stream file, the Duration gauge fills, showing the status of the operation.
When generation is complete, the gauge reads 100% and the Information
message box appears to indicate that the Transport Stream has been
multiplexed.
3. Click OK to continue. The multiplex display resembles Figure 2–83.
MTS 100 MPEG Test System User Manual
2–59
Page 100

Tutorial: Creating an MPEG-2 Transport Stream
Figure 2–83: Transport stream creation is complete
You have now successfully created an simple transport stream file. Next you will
make a more complex transport stream file.
Making a Complex Transport Stream File
Now you are going to add to simple.cfg file to create complex.cfg, a more
complicated configuration file. Start at the point where you left off (as shown in
Figure 2–83) from the previous steps.
1. Choose Save As from the File menu. The standard Windows Save As dialog
box appears.
2. Enter “complex” in the File Name text box.
3. Choose OK. This saves the information in simple.cfg to a new configuration
file called complex.cfg, creates a new .pmt file (called complex.pmt), and
places the name “complex” in the window title. (Notice that the Duration
gauge has also reset itself to 0%.)
2–60
MTS 100 MPEG Test System User Manual
 Loading...