

Tektronix MTM400, MTM400A User manual

Technical Reference
MTM400 and MTM400A
MPEG Transport Stream Monitors
RUI v3.x Upgrade
077-0174-00
www.tektronix.com
*P077017400*
077017400

Copyright © Tektronix. All rights reserved. Licensed software products are owned by Tektronix or its subsidiaries or
suppliers, and are protected by national copyright laws and international treaty provisions.
Tektronix products are covered by U.S. and foreign patents, issued and pending. Information in this publication supercedes
that in all previously published material. Specifications and price change privileges reserved.
TEKTRONIX, TEK, and FlexVuPlus are registered trademarks of Tektronix, Inc.
Contacting Tektronix
Tektronix, Inc.
14200 SW Karl Braun Drive
P.O. Box 500
Beaverton, OR 97077
USA
For product information, sales, service, and technical support:
H In North America, call 1-800-833-9200.
H Worldwide, visit www.tektronix.com to find contacts in your area.

Table of Contents
User Interface Overview 1. . . . . . . . . . . . . . . . . . . . . . . . . . . . . . . . . . . .
User Interface Components 2. . . . . . . . . . . . . . . . . . . . . . . . . . . . . . . . . . . . . . . .
FlexVuPlus Display 4. . . . . . . . . . . . . . . . . . . . . . . . . . . . . . . . . . . . . . . . . . . . . . .
Analysis Views 5. . . . . . . . . . . . . . . . . . . . . . . . . . . . . . . . . . . . . . . . . . . . . . . . . .
Tear-off Views 7. . . . . . . . . . . . . . . . . . . . . . . . . . . . . . . . . . . . . . . . . . . . . . . . . .
Configuration 8. . . . . . . . . . . . . . . . . . . . . . . . . . . . . . . . . . . . . . . . . . . . . . . . . . .
User Documentation 8. . . . . . . . . . . . . . . . . . . . . . . . . . . . . . . . . . . . . . . . . . . . . .
Upgrades 9. . . . . . . . . . . . . . . . . . . . . . . . . . . . . . . . . . . . . . . . . . . . . . . . . . . . . . .
RUI Control Equivalents 11. . . . . . . . . . . . . . . . . . . . . . . . . . . . . . . . . . .
Reverting the RUI 17. . . . . . . . . . . . . . . . . . . . . . . . . . . . . . . . . . . . . . . . .
Requirements 17. . . . . . . . . . . . . . . . . . . . . . . . . . . . . . . . . . . . . . . . . . . . . . . . . . .
RUI Version 3.x to Version 3.0 Procedure 18. . . . . . . . . . . . . . . . . . . . . . . . . . . . .
RUI Version 3.0 to Version 2.6.1 Procedure 21. . . . . . . . . . . . . . . . . . . . . . . . . . .
Command Line Firmware Downgrade 24. . . . . . . . . . . . . . . . . . . . . . . . . . . . . . . .
RUI v2.6.1 Product Documentation 26. . . . . . . . . . . . . . . . . . . . . . . . . . . . . . . . . .
RUI v3.0 Product Documentation 26. . . . . . . . . . . . . . . . . . . . . . . . . . . . . . . . . . .
Version 00e
MTM400 and MTM400A RUI v3.x Upgrade Technical Reference
i

Table of Contents
Version 00e
ii
MTM400 and MTM400A RUI v3.x Upgrade Technical Reference

User Interface Overview
This document introduces you to the MTM400A user interface and explains the
differences between the MTM400 RUI and the MTM400A RUI.
The MTM400A MPEG Transport Stream Monitor is functionally similar to the
MTM400 MPEG Transport Stream Monitor. However, the MTM400 was based
on Microsoft Java technology, for which Microsoft is withdrawing support. The
MTM400A is based on Sun Java, and is more closely aligned with the MTS400
MPEG Test System.
The MTM400A remote user interface (RUI) looks similar to the MTM400 RUI,
but the MTM400A RUI provides a rich, multi-layered user interface that allows
structured access to all information.
Differences between the two RUIs include:
H The MTM400 hot spot view, featuring device and stream buttons is no
longer displayed. The device and stream features have been integrated into
the single MTM400A display.
H In the MTM400, the button bar was the primary means of moving between
information screens. In the MTM400A, although the button bar is still
present, screens are also directly accessible using tabbed pages.
H The button bar can be displayed on its own to provide a high-level view of
the error state of the monitored stream. The bar can also be customized by
hiding and revealing buttons.
H For detailed analysis and specific monitoring situations, the button bar can
be hidden, leaving only the main application view visible.
H Detail views in the main application can be displayed as separate windows
using the tear-off function.
Version 00e
MTM400 and MTM400A RUI v3.x Upgrade Technical Reference
1

User Interface Overview
User Interface Components
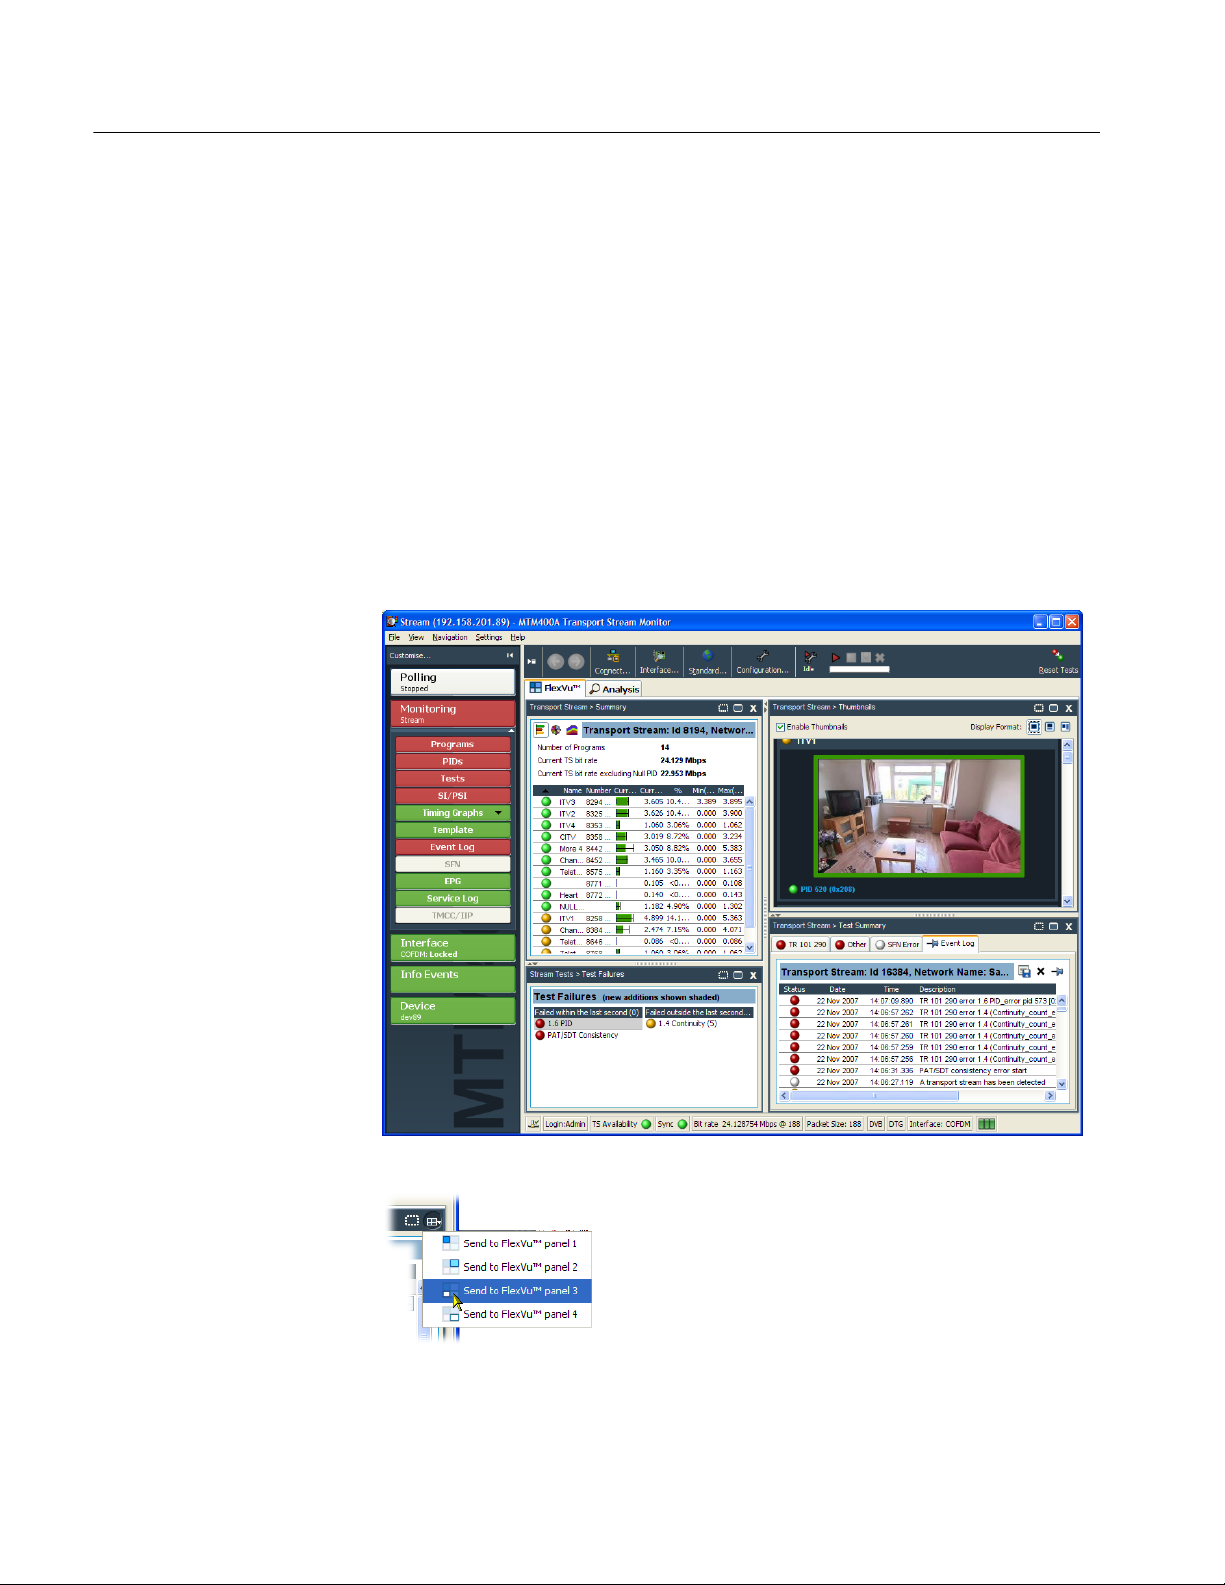
Figure 1 shows the major components of the user interface implemented in the
MTM400A and version 3.x of the RUI.
The menu bar, toolbar, and status bar, while visually different, contain options
and buttons similar in function to those in the MTM400.
The main viewing areas of the window is divided into two areas: the Button Bar
and the Main Application View.
Figure 1: MTM400A user interface components
2
Version 00e
MTM400 and MTM400A RUI v3.x Upgrade Technical Reference

User Interface Overview
Button Bar
Main Application View
RUI Navigation
The MTM400 button bar showed monitoring status and displayed a corresponding view when clicked. The MTM400A RUI copies this idea, but rearranges the
buttons into a more intuitive order. The MTM400 Stream and Device hot spot
buttons become Monitoring and Device buttons in the MTM400A RUI.
The buttons from the MTM400 Stream window have been streamlined and
grouped under the MTM400A Monitoring button. The buttons from the
MTM400 Device window have been removed and replaced by a node in the
Analysis Tests view.
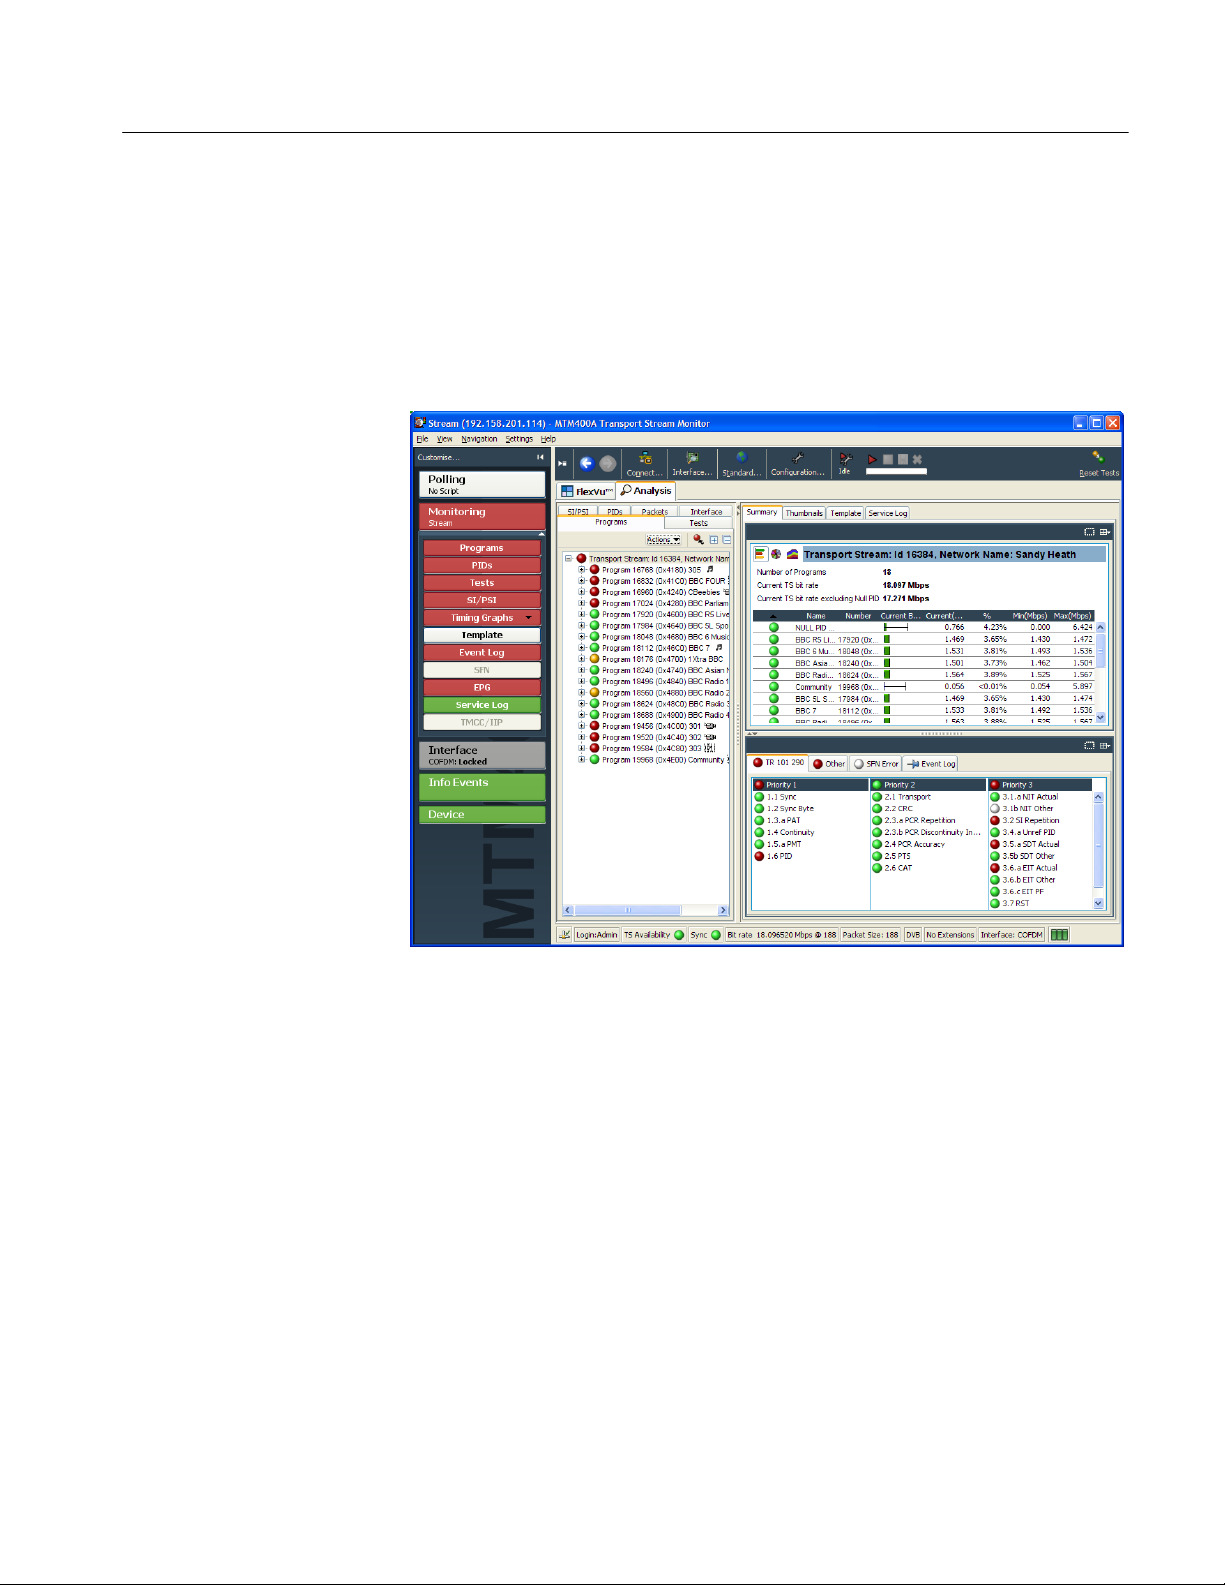
In the main application view, two top-level views are selected using tabs:
FlexVuPlus and Analysis. You can customize the FlexVuPlus display to contain
the analysis views of your choice.
The main analysis views are Programs, Tests, SI/PSI (tables), PIDs, Packets, and
Interface (when an optional interface card is installed). The analysis views are
selected using the summary tabs.
Each analysis view contains a tree view and a detail view. The content of the
detail view is dependent on which node is selected in the tree view.
The MTM400 RUI navigation was simple, allowing the right view to change in
accord with the button being clicked.
The MTM400A RUI has comprehensive navigation possibilities that use the
button bar, context menus, hyperlinks, and double-clicks.
Version 00e
MTM400 and MTM400A RUI v3.x Upgrade Technical Reference
3
User Interface Overview
FlexVuPlus Display
The FlexVuPlus display philosophy (first introduced in the Tektronix WVR600
Waveform Rasterizer), is now adapted for the MTM400A. This gives users up to
four concurrent views of a monitored signal and the flexibility to configure each
of the windows independently. Each of the FlexVuPlus views is derived from
views available under the Analysis tab. FlexVuPlus setups will be remembered
between MTM400A sessions.
With a virtually unlimited variety of stream monitoring displays from which
users can choose, this exceptional flexibility enables the MTM400A to perform
like a “4-in-1 monitor” on a single incoming stream. The FlexVuPlus display
enables users to easily configure their MTM400A to provide a monitoring
solution that is optimized for their specific requirement.
Present on all Analysis detail views, the FlexVuPlus
selection icon is used to extract views to the
FlexVuPlus panels.
Version 00e
4
MTM400 and MTM400A RUI v3.x Upgrade Technical Reference
Analysis Views
User Interface Overview
The MTM400A Analysis views each use a single tree view with different
context-sensitive detail views contained within tabbed frames. From the main
window, you can access the following views: Program, Tests, Tables, PID,
Packets, and Interface.
Programs View
The Program view provides a fast overview of the transport stream contents in
terms of program content, bit rated use by each program, and TR 101 290 test
results. Red, amber and green LEDs highlight errors associated with each
program, or element of a program, within the transport stream. Red LEDs
indicate that there are current errors in the stream, amber LEDs indicate that
errors have occurred but are now clear, and green LEDs indicate that no errors
have been detected.
Errors that are detected at lower levels in the program stream hierarchy propagate
up to the highest level. This allows you to monitor all of the programs in the
stream at a high level and then quickly go to lower levels as necessary to locate a
problem.
The contents of the MTM400A Programs view are broadly equivalent to the
following MTM400 screens: Stream view: Summary, Detail (All Programs),
Service and Event Logs, SFN, TMCC/IIP, Templates.
Version 00e
MTM400 and MTM400A RUI v3.x Upgrade Technical Reference
5
 Loading...