

Page 1

User Manual
MTM400
MPEG Transport Stream Monitor
071-1224-04
Test Equipment Depot - 800.517.8431 - 99 Washington Street Melrose, MA 02176 - FAX 781.665.0780 - TestEquipmentDepot.com
Page 2

Table of Contents
General Safety Summary...................................................................................... vii
Service Safety Summary.........................................................................................ix
Preface.....................................................................................................................xi
Related Material.................................................................................................... xii
Manual Conventions............................................................................................xiii
Getting Started
Overview...............................................................................................................1-1
Accessories ...........................................................................................................1-2
Installing the MTM400.........................................................................................1-8
Powering Up the MTM400................................................................................. 1-13
The Remote User Interface.................................................................................1-14
Operating Basics
Local Indicators ....................................................................................................2-2
Remote User Interface .......................................................................................... 2-3
Using WebMSM.................................................................................................2-12
Using MLM1000 ................................................................................................2-12
User Interface Version........................................................................................2-12
Time Zones .........................................................................................................2-13
Reference
Device View..........................................................................................................3-1
Device Status ........................................................................................................3-2
View Device Log..................................................................................................3-4
Device Configuration............................................................................................3-6
Device Information.............................................................................................3-15
SNMP..................................................................................................................3-16
Stream View ......................................................................................................3-17
Monitoring Overview Screen (Summary Screen)...............................................3-20
Detail Screen....................................................................................................... 3-22
Tests Screen........................................................................................................3-23
Custom Screen....................................................................................................3-26
Information Screen..............................................................................................3-28
Programs Screen ................................................................................................. 3-30
MTM400 MPEG Transport Stream Monitor User Manual i
Page 3

Table of Contents
PIDs Screen.........................................................................................................3-34
PID Groups Screen..............................................................................................3-41
PCR Jitter Screen ................................................................................................3-48
SFN Screen..........................................................................................................3-56
TMCC Screen......................................................................................................3-57
SI Graphs Screen.................................................................................................3-58
SI Tables Screen..................................................................................................3-62
Template..............................................................................................................3-68
Recording............................................................................................................3-71
Log Screen ..........................................................................................................3-72
Configuration Screen ..........................................................................................3-76
Service Log .........................................................................................................3-80
MTM400 Configuration Files ..........................................................................3-85
Scheduling..........................................................................................................3-91
Scheduling Activities..........................................................................................3-93
Triggered Recording.........................................................................................3-99
Triggered Recording Settings............................................................................3-100
Pre-Trigger Recordings.....................................................................................3-102
Triggered Recording Operation ........................................................................3-103
Interface Configuration and Interpretation.................................................3-107
QPSK (L-Band).................................................................................................3-109
QAM (Annex A and Annex C).........................................................................3-114
QAM (Annex B II)............................................................................................3-118
COFDM.............................................................................................................3-122
8VSB.................................................................................................................3-126
8PSK (Phase Shift Keying)...............................................................................3-129
SMPTE310 Settings..........................................................................................3-132
ASI Settings ......................................................................................................3-132
ii MTM400 MPEG Transport Stream Monitor User Manual
Page 4

Table of Contents
Appendices
Appendix A: Network Installation ................................................................... A-1
MAC Address ...................................................................................................... A-2
IP Address............................................................................................................ A-3
Resetting the IP Address...................................................................................... A-3
Network Set-Up................................................................................................... A-7
Network Naming.................................................................................................. A-8
Network Latency.................................................................................................. A-8
Glossary
Index
Appendix B: Maintenance................................................................................. B-1
Preventative Maintenance.................................................................................... B-1
Rack Mounting..................................................................................................... B-2
MTM400 MPEG Transport Stream Monitor User Manual iii
Page 5

Table of Contents
List of Figures
Figure 1-1: MTM400 connectors (shown with QPSK interface).......................................1-9
Figure 1-2: Logging on....................................................................................................1-15
Figure 1-3: Hotspot view.................................................................................................1-16
Figure 1-4: Summary view ..............................................................................................1-16
Figure 2-1: Front panel......................................................................................................2-2
Figure 2-2: RUI overview..................................................................................................2-3
Figure 2-3: Hotspot view...................................................................................................2-4
Figure 2-4: Device view.....................................................................................................2-5
Figure 2-5: Stream view.....................................................................................................2-6
Figure 2-6: Combined view...............................................................................................2-9
Figure 2-7: Multiple view................................................................................................2-10
Figure 2-8: Time zones - illustration................................................................................2-13
Figure 3-1: Device view.....................................................................................................3-1
Figure 3-2: Device view - Status........................................................................................3-2
Figure 3-3: Device view - Log........................................................................................... 3-4
Figure 3-4: Device view - Configuration...........................................................................3-6
Figure 3-5: Device view - Information............................................................................3-15
Figure 3-6: Stream view...................................................................................................3-17
Figure 3-7: Stream view - Overview................................................................................3-20
Figure 3-8: Stream view – Detail.....................................................................................3-22
Figure 3-9: Stream view - Tests.......................................................................................3-23
Figure 3-10: Stream view - Custom ................................................................................. 3-26
Figure 3-11: Stream view - Information.......................................................................... 3-28
Figure 3-12: Stream View - Programs............................................................................. 3-30
Figure 3-13: Stream view - PIDs.....................................................................................3-34
Figure 3-14: Stream view - PID groups...........................................................................3-41
Figure 3-15: Stream view - PCR graph - PCR inaccuracy...............................................3-50
Figure 3-16: Stream view - PCR graph - PCR arrival......................................................3-51
Figure 3-17: Stream view - PCR graph - PCR overall jitter ............................................3-52
Figure 3-18: Stream view - PCR graph - PCR frequency offset......................................3-53
Figure 3-19: Stream view - PCR graph - PCR drift rate..................................................3-54
Figure 3-20: Stream view - PCR graph - PTS arrival......................................................3-55
Figure 3-21: Stream view - SFN screen...........................................................................3-56
Figure 3-22: Stream view - TMCC screen.......................................................................3-57
Figure 3-23: Stream view - SI graphs screen - Example..................................................3-58
Figure 3-24: DVB SI Tables dialog................................................................................. 3-63
iv MTM400 MPEG Transport Stream Monitor User Manual
Page 6

Table of Contents
Figure 3-25: ATSC SI Tables dialog................................................................................3-63
Figure 3-26: ISDB-T SI Tables dialog.............................................................................3-64
Figure 3-27: SI Tables view - Tear off view....................................................................3-66
Figure 3-28: Stream view - Template...............................................................................3-69
Figure 3-29: Stream view - Log.......................................................................................3-72
Figure 3-30: Stream view - Configuration (MTM400 DVB format) ............................... 3-76
Figure 3-31: Stream view - Configuration (MTM400 ISDB format)...............................3-77
Figure 3-32: Stream view - Configuration (MTM400 ATSC format) .............................3-77
Figure 3-33: Service logging - Data storage.....................................................................3-81
Figure 3-34: Stream view - Summary..............................................................................3-82
Figure 3-35: Configuration file handling .........................................................................3-85
Figure 3-36: Scheduling and time zones..........................................................................3-97
Figure 3-37: Triggered Recording dialog box..................................................................3-99
Figure 3-38: Interface configuration - QPSK (L-Band).................................................3-109
Figure 3-39: Input card screen - QPSK (L-Band)).........................................................3-112
Figure 3-40: Interface configuration - QAM (Annex A and Annex C)..........................3-114
Figure 3-41: Input card screen - QAM (Annex A and Annex C)...................................3-116
Figure 3-42: Interface configuration – QAM Annex B II..............................................3-118
Figure 3-43: Input card screen - QAM Annex B II (example).......................................3-120
Figure 3-44: COFDM interface configuration (example)..............................................3-122
Figure 3-45: Input card screen - COFDM (Example) ....................................................3-124
Figure 3-46: 8VSB interface configuration (example)...................................................3-126
Figure 3-47: Input card screen - 8VSB (Example).........................................................3-128
Figure 3-48: 8PSK interface configuration (example)...................................................3-129
Figure 3-49: Input card screen (example - 8PSK).......................................................... 3-131
Figure A-1: Network set-up - Example.............................................................................A-1
Figure A-2: Transport stream processor reset switches.....................................................A-6
Figure B-1: Chassis section rack slides............................................................................. B-2
Figure B-2: Rack mounted sections..................................................................................B-3
Figure B-3: Installing or removing the rack slides............................................................B-4
MTM400 MPEG Transport Stream Monitor User Manual v
Page 7

Table of Contents
List of Tables
Table 1-1: Standard MTM400 deliverables.......................................................................1-2
Table 1-2: MTM400 options (continued) ..........................................................................1-2
Table 1-3: MTM400 power cord options...........................................................................1-3
Table 1-4: MTM400 field upgrade kits..............................................................................1-4
Table 1-5: MTM400 options summary (part 1 of 2).......................................................... 1-6
Table 1-6: Electrical operating requirements..................................................................... 1-9
Table 1-7: Transport stream Processor card connectors..................................................1-10
Table 2-1: Button colors - Hot Spot views.......................................................................2-11
Table 2-2: Button colors - Device and Stream views.......................................................2-11
Table 3-1: Button colors - Information view ...................................................................3-29
Table 3-2: DVB Regional Options...................................................................................3-78
Table 3-3: ISDB Regional Options.................................................................................. 3-78
Table 3-4: Chinese Regional Options.............................................................................. 3-78
vi MTM400 MPEG Transport Stream Monitor User Manual
Page 8

General Safety Summary
Review the following safety precautions to avoid injury and prevent damage to this product or any
products connected to it. To avoid potential hazards, use this product only as specified.
Only qualified personnel should perform service procedures.
To Avoid Fire or Personal Injury
Use Proper Power Cord. Use only the power cord specified for this product and certified for the
country of use.
Ground the Product. This product is grounded through the grounding conductor of the mainframe
power cord. To avoid electric shock, the grounding conductor must be connected to earth ground.
Before making connections to the input or output terminals of the product, ensure that the product
is properly grounded.
Ground Equipment Connected to the Product. Ensure that any equipment connected to this product
is grounded and at the same potential.
Observe All Terminal Ratings. To avoid fire or shock hazard, observe all ratings and markings on
the product. Consult the manual for further ratings information before making connections to the
product.
Do Not Operate Without Covers. Do not operate this product with covers or panels removed.
Use Proper Fuse. Use only the fuse type and rating specified for this product.
Avoid Exposed Circuitry. Do not touch exposed connections and components when power is
present.
Do Not Operate With Suspected Failures. If you suspect there is damage to this product, have it
inspected by qualified service personnel.
Do Not Operate in Wet/Damp Conditions.
Do Not Operate in an Explosive Atmosphere.
Keep Product Surfaces Clean and Dry.
Provide Proper Ventilation. Refer to the installation instructions for details on installing the product
so it has proper ventilation.
MTM400 MPEG Transport Stream Monitor User Manual vii
Page 9

General Safety Summary
Symbols and Terms
Terms in this Manual. These terms may appear in this manual:
WARNING. Warning statements identify conditions or practices that could result in
injury or loss of life.
CAUTION. Caution statements identify conditions or practices that could result in
damage to this product or other property.
Terms on the Product. These terms may appear on the product:
DANGER indicates an injury hazard immediately accessible as you read the
marking.
WARNING indicates an injury hazard not immediately accessible as you read the
marking.
CAUTION indicates a hazard to property including the product.
Symbols on the Product. The following symbols may appear on the product:
CAUTION
Refer to Manual
Protective Ground
(Earth) Terminal
viii MTM400 MPEG Transport Stream Monitor User Manual
Page 10

Service Safety Summary
Only qualified personnel should perform service procedures. Read this Service
Safety Summary and the General Safety Summary before performing any service
procedures.
Do Not Service Alone. Do not perform internal service or adjustments of this
product unless another person capable of rendering first aid and resuscitation is
present.
Disconnect Power. To avoid electric shock, switch off the instrument power, then
disconnect the power cord from the mains power.
Use Care When Servicing With Power On. Dangerous voltages or currents may
exist in this product. Disconnect power, remove battery (if applicable), and
disconnect test leads before removing protective panels, soldering, or replacing
components.
To avoid electric shock, do not touch exposed connections.
MTM400 MPEG Transport Stream Monitor User Manual ix
Page 11

Preface
This manual describes the functions and use of the Tektronix MTM400 MPEG
Transport Stream Monitor. The manual is organized into the following sections:
Getting Started
An overview of the MTM400, installation instructions, starting the unit, and
the remote user interface.
Operating Basics
A basic guide to the MTM400 user interface(s).
Reference
A complete reference to all of the MTM400 features as accessed through the
user interface.
Appendix A: Networking
Details on configuring the instrument for network operation.
Appendix B: Maintenance
General care and service procedures.
Glossary
Index
MTM400 MPEG Transport Stream Monitor Technical Reference
(071-1560-xx)
This manual provides product specifications, test parameters, configuration
file syntax, and hardware maintenance procedures.
MTM400 MPEG Transport Stream Monitor Programmer Manual
(071-1375-xx)
This manual specifies the remote control and status monitoring interfaces
available to a management application.
MTM400 MPEG Transport Stream Monitor User Manual xi
Page 12

Preface
Related Material
Additional documentation, such as Read Me files, may be included on the
installation disks.
The following URLs access the Web sites for the standards organizations listed
(the URLs listed were valid at the time of writing):
MPEG-2 standards (International Organization for Standards)
http://www.iso.ch/
DVB standards (European Technical Standards Institute)
http://www.etsi.org/
ATSC standards (Advanced Television Systems Committee)
http://www.atsc.org/
ISDB/ARIB standards (Association of Radio Industries and Businesses)
http://www.arib.or.jp/english/
SCTE Society of Cable Television Engineers
http://www.scte.org/
xii MTM400 MPEG Transport Stream Monitor User Manual
Page 13

Preface
Manual Conventions
Naming conventions for the interface elements are based on standard Windows
naming conventions. Naming conventions for MPEG-2, ATSC, and DVB
structures follow the conventions derived from the standards organizations listed
on the previous page. In addition, the following formatting conventions apply to
this manual:
Mono-spaced text can indicate the following:
Text you enter from a keyboard
Example: Enter the network identity (http://TSMonitor01)
Characters you press on your keyboard
Example: Press
Paths to components on your hard drive
Example: The program files are installed at the following location:
C:\Program Files\Tektronix\
CTRL+C to copy the selected text.
MTM400 MPEG Transport Stream Monitor User Manual xiii
Page 14

Getting Started
Page 15

Getting Started
Overview
This section provides details of installing and powering up the Tektronix MTM400
MPEG Transport Stream Monitor.
The MTM400 is a single-stream, extended-confidence, MPEG-2 protocol,
monitoring device. It is used to monitor a single transport stream in MPEG-2,
DVB, ISDB and ATSC environments. The MTM400 is a rack-mounted device.
The basic MTM400 provides confidence monitoring by making key measurements
and comparing them with preset parameters; inconsistencies can be reported as
varying levels of error. Integrated flexibility allows the software to be upgraded
with diagnostic capabilities and to supply detailed information to enable fault
identification and analysis.
The user interface is accessed through a Remote User Interface (RUI). The RUI
allows the status of the MTM400 to be determined from anywhere in the world and
provides remote control of the measurements and configuration to the
administrator. The RUI is accessed through Microsoft Internet Explorer (Version 6
SP 1); the Microsoft Java Virtual Machine (Version 5.00.3809) must also be
installed.
The user interface can also be accessed by the Multi-Layer Monitor (MLM1000)
and the Web Monitoring Systems Manager (WebMSM),
The WebMSM is a Java application that is installed on any personal
computer; as for the RUI, Microsoft Java Virtual Machine (Version 5.00.3809)
must be available. The installation, configuration, and operation of the WebMSM
is described in the WebMSM User Manual (071-1239-xx).
The RUI and the WebMSM communicate with the MTM400 through the open
standard Simple Network Management Protocol (SNMP) and Hypertext Transfer
Protocol (HTTP).
ASI (Asynchronous Serial Interface) and SMPTE 310M (Society of Motion
Picture and Television Engineers, 19.392 Mbps only) interfaces are provided as
standard; optional QAM (Quadrature Amplitude Modulation), COFDM (Coded
Orthoganal Frequency Division Modulation), QPSK (Quadrature Phase Shift
Keying) (L-Band), and 8VSB (Vestigial Sideband) interfaces are available as
options.
MTM400 MPEG Transport Stream Monitor User Manual
1-1
Page 16

Getting Started
Accessories
The tables in this section list the standard and optional accessories available for the
MTM400 MPEG Transport Stream Monitor.
Standard
Table 1-1 lists the standard accessories that are shipped with the MTM400.
Table 1-1: Standard MTM400 deliverables
Nomenclature Description Deliverables
MTM400 Single stream MPEG
Transport Stream Monitor;
packaged in one rack unit
(1RU) chassis
1RU Chassis fitted with Transport Stream
Processor Card
User Manual (English, L0 / Japanese, L5)
Slides
License Key Certificate
Options
Tables 1-2 and 1-3 list the options that are available for the MTM400.
Table 1-2: MTM400 options (continued)
Nomenclature Description Deliverables
Opt. 01 Recording Capability Enabled using license key
Opt. 02 Transport Stream Service Information
Analysis (PSI/SI/PSIP/ISDB structure
view and repetition graphs)
Opt. 03 Template Testing with Template
Scheduling (for user-defined service
plan testing)
Opt. 04 PCR Analysis with Graphical Results
views
Opt. 05 Bit rate testing including PID groups
and PID variability
Opt. 06 Service logging Enabled using license key
Opt. QA QAM Annex A Interface QAM (Annex A) Interface
Opt. QB2 QAM Annex B Interface
(Level 1 and Level 2 Interleave)
Opt. QC QAM Annex C Interface QAM (Annex C) Interface
Enabled using license key
Enabled using license key
Enabled using license key
Enabled using license key
Card with associated cabling
QAM (Annex B II) Interface
Card with associated cabling
Card with associated cabling
1-2 MTM400 MPEG Transport Stream Monitor User Manual
Page 17

Getting Started
Table 1-2: MTM400 options (continued)
Nomenclature Description Deliverables
Opt. QP QPSK (L-Band) Interface QPSK Interface Card with
associated cabling
Opt. CF COFDM Interface COFDM Interface Card with
associated cabling
Opt. VS 8VSB Interface 8VSB Interface Card with
associated cabling
Opt. EP 8PSK Interface 8PSK Interface Card with
associated cabling
Table 1-3: MTM400 power cord options
Nomenclature Description
A0 North America Power
A1 Universal Euro Power
A2 United Kingdom Power
A3 Australia Power
A4 240 V North America Power
A5 Switzerland Power
A6 Japan Power
A10 China Power
A99 No Power Cord
MTM400 MPEG Transport Stream Monitor User Manual 1-3
Page 18

Getting Started
Field Upgrade Kits
Field upgrade kits contain hardware and software that can be installed by a user.
Table 1-4 lists the Field Upgrade kits that are available for the MTM400.
Table 1-4: MTM400 field upgrade kits
Product Option Description
MTM4UP
01 Field upgrade kit to add Recording Capability
02 Field upgrade kit to add Transport Stream Service Information
Analysis (PSI/SI/PSIP/ISDB structure view and repetition
graphs)
03 Field upgrade kit to add Template Testing With Template
Scheduling (for user-defined service plan testing)
04 Field upgrade kit to add PCR Analysis with Graphical Results
views
05 Field upgrade kit to add Bit rate testing including PID groups
and PID variability
06 Field upgrade kit to add Service Logging
MTM4FQA - Field upgrade kit to add QAM Annex A Interface
MTM4FQB2 Field upgrade kit to add QAM Annex B
(Level 1 and Level 2 interleave) Interface
MTM4FQC - Field upgrade kit to add QAM Annex C Interface
MTM4FQP - Field upgrade kit to add QPSK (L-Band) Interface
MTM4FVS Field Upgrade Kit To Add 8-VSB Interface
MTM4FCF Field Upgrade Kit To Add COFDM Interface
MTM4FEP Field Upgrade Kit To Add 8PSK Interface
1-4 MTM400 MPEG Transport Stream Monitor User Manual
Page 19

Getting Started
Licensing
Options and upgrades are enabled using a License Key. A License Key is an
encrypted code that unlocks and enables functions that have been installed on the
Real-Time Monitoring (RTM) device. Using this method, upgrading an RTM
device may simply require the entry of a new License Key.
For new RTM devices, the appropriate License Key is applied during production.
However, it is also supplied as part of the product documentation.
When field upgrade options are installed, you must apply a new license key; this
will be supplied as part of the field upgrade kit documentation.
This user manual describes all available options including field upgrades. The
basic product (with no licensed options) includes the following transport stream
features:
Test monitoring (DVB, ATSC, and ISDB)
Custom classification of tests
Basic program and PID analysis and monitoring
Basic PCR analysis
SFN and TMCC monitoring (where present in the stream)
Stream Log
MTM400 MPEG Transport Stream Monitor User Manual 1-5
Page 20

Getting Started
Table 1-5 (parts 1 and 2) summarizes the available streams options:
Table 1-5: MTM400 options summary (part 1 of 2)
Feature Default * Opt. 01
Recording
Capability
SFN
TMCC
PCR OJ, DR and FO testing
SI View
SI Graphs
PID and program bit rate limit testing
PID Groups
PID variability
Templates
Template tree view
Scheduling
Recording
PCR graphs
Service log
RF Confidence Measurement
Logging DPI section arrival
Basic syntax checking of DPI sections
Alarms Events on RF metrics
DPI (SCTE35 Digital Program Insertion) Monitoring
RF Measurement Testing
Warning Events on RF metrics
9
9
9
9
9
9
9
9
Opt. 02
SI
Analysis
9
9
Opt. 03
Template
Testing
9
9
9
* Confidence or no option license key required.
1-6 MTM400 MPEG Transport Stream Monitor User Manual
Page 21

Getting Started
Table 1-5: MTM400 options summary (part 2 of 2)
Feature Opt. 04
PCR Analysis
Opt. 05
Bit rate
Testing
SFN
TMCC
PCR OJ, DR and FO testing
SI View
SI Graphs
PID and program bit rate limit testing
PID Groups
PID variability
Templates
Template tree view
Scheduling
Recording
PCR graphs
Service log
RF Confidence Measurement
Logging DPI section arrival
Basic syntax checking of DPI sections
Alarms Events on RF metrics
DPI (SCTE35 Digital Program Insertion) Monitoring
RF Measurement Testing
Warning Events on RF metrics
9
9
9
9
Opt. 06
Service
Logging
9
The Device application does not change with licensing.
An overview of the Streams and Device applications is given in the Operating
Basics section.
MTM400 MPEG Transport Stream Monitor User Manual 1-7
Page 22

Getting Started
Installing the MTM400
This section describes how to install the MTM400 unit. It includes the following
instructions:
Installing the unit in a rack
Making the electrical connections necessary to begin monitoring transport
streams
Integrating the unit into a network
Operation is described in the following sections.
Hardware Installation
The MTM400 is designed for rack-mounted operation. The rack-mounting kit is
shipped as a standard accessory with each MTM400. Installing the rack-mounting
kit is described in the MTM400 MPEG Transport Stream Monitor Technical
Reference.
WARNING. To avoid fire hazard, the MTM400 must be installed in the rack only as
specified and proper ventilation must be maintained at all times.
1-8 MTM400 MPEG Transport Stream Monitor User Manual
Page 23
Getting Started
Electrical Installation
The electrical operating requirements of the MTM400 are summarized in
Table 1-6; see the MTM400 MPEG Transport Stream Monitor Technical
Reference for more detailed electrical characteristics.
Table 1-6: Electrical operating requirements
Requirement Specification
Temperature, operating +5 ˚C to +40 ˚C
Altitude, operating 0 m to 3000 m (9800 ft)
Source Voltage 100 VAC to 240 VAC, 50 Hz/60 Hz
Power Consumption (maximum) 1 Amp
Peak Inrush Current 7.2 A peak at 240 VAC, 50 Hz
Fuse Rating Mains fuse is 3.15 A, 250 V, Fast; Not operator
replaceable. Refer servicing to qualified service
personnel.
Overvoltage Category II (as defined in IEC61010-1)
Pollution Degree 2 (as defined in IEC61010-1).
Rated for indoor use only.
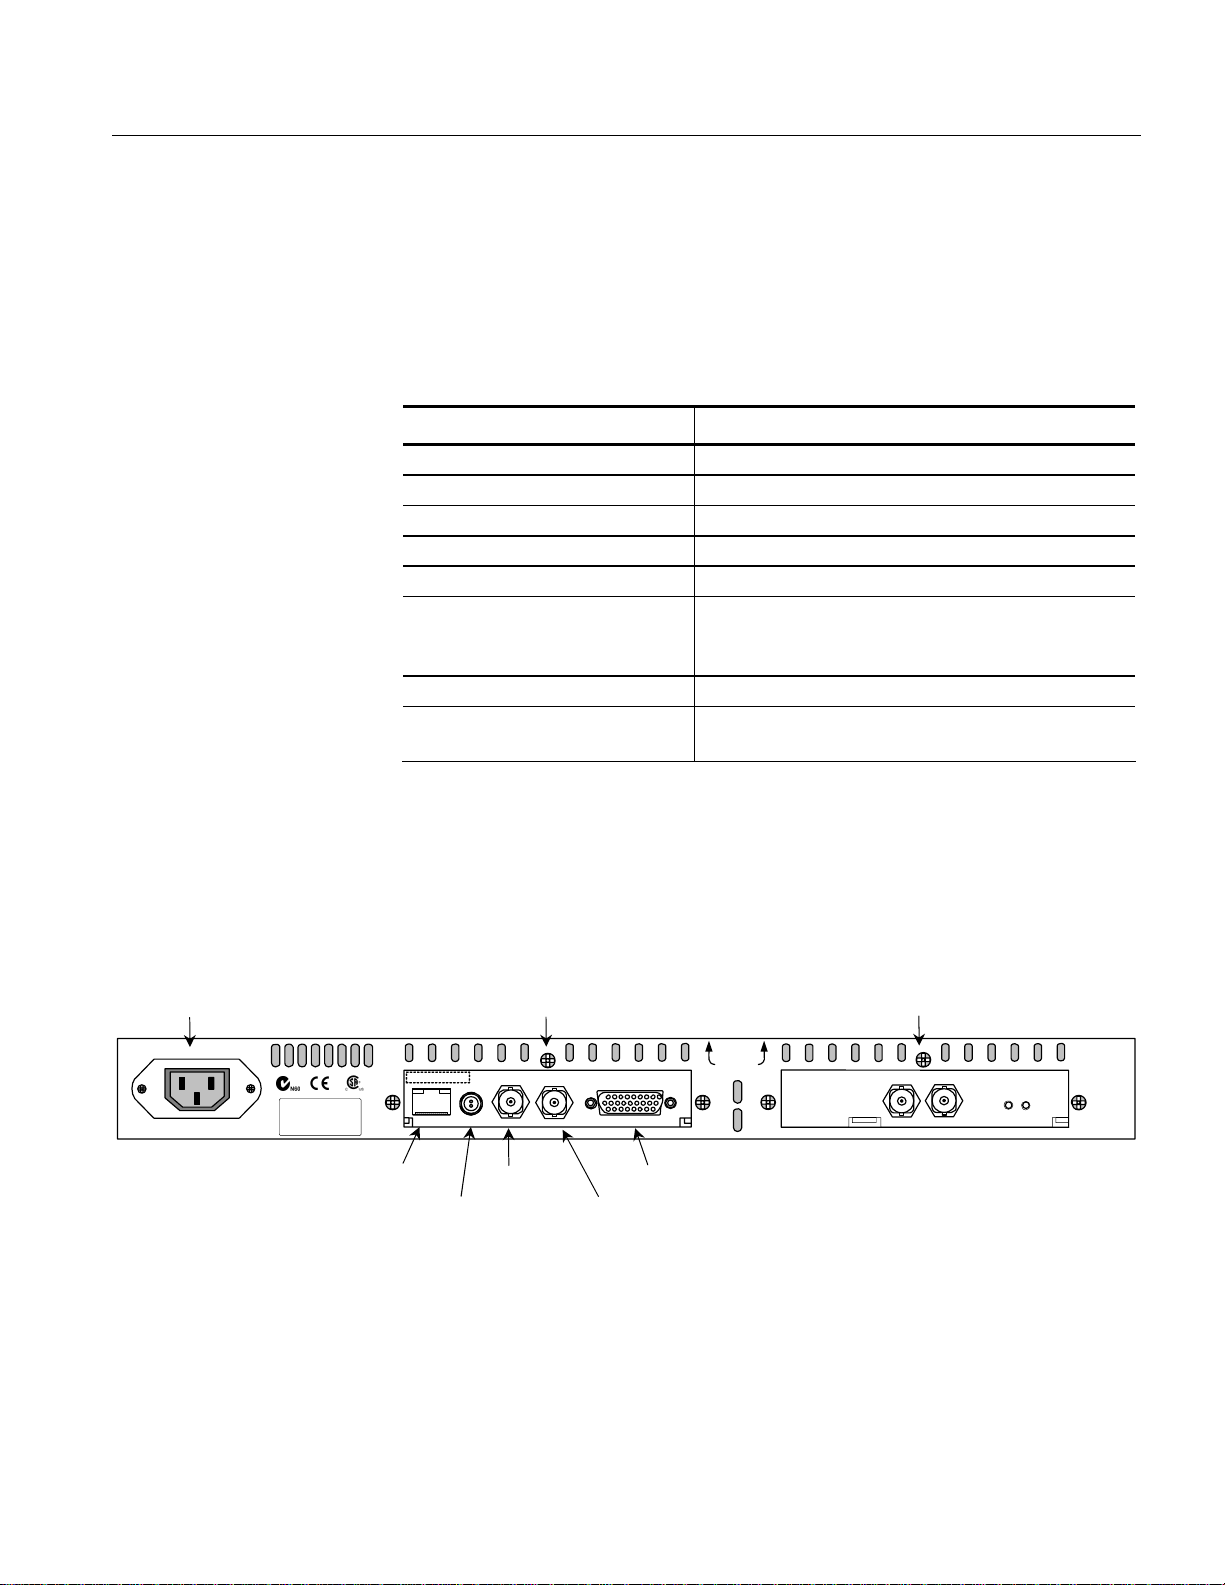
Use the following procedure to make electrical, signal, and network connections:
1. After the MTM400 has been mounted in the rack, connect the power cord
(provided with the unit) to the power connector on the rear panel. Connect the
power cord plug to a properly grounded outlet.
Power
100-240 VAC 50/60 Hz
1A MAX
Serial No.
Tektronix Inc. Beaverton OR.
U.S.A.
00-01-F8-A7-33-CC
Ethernet TS Input
Transport Stream
Processor Card
IN
LAN LTC
LTC In
ASI/
SMPTE
OUT
TS Output
1
ALARMS
Alarms
Figure 1-1: MTM400 connectors (shown with QPSK interface)
2. Make the necessary transport stream, network and peripheral device
connections using the connectors at the rear of the unit.
Interface Card
(where installed)
Additional
information
found on label
on top panel
2
6
QPSK (L-BAND)
IN OUT
LOCK
IN
LNB
POWER
MTM400 MPEG Transport Stream Monitor User Manual 1-9
Page 24

Getting Started
Table 1-7 summarizes the transport stream, network and peripheral device
connectors; (see the MTM400 MPEG Transport Stream Monitor Technical
Reference for more detailed information about each connector and the
associated signals).
Table 1-7: Transport stream Processor card connectors
Connector Description
Ethernet 10/100Base-T; RJ-45
LTC In Longitudinal time code input
Transport Stream input /
output
ASI input (BNC) • Accepts Burst and Packet mode ASI formats and M2S
ASI output (BNC) • An active loop-through of the corresponding input
SMPTE310M input • Compliant with SMPTE310M (19.392 Mbps only)
SMPTE310M output • An active loop-through of the corresponding input
Alarms (Digital input/output) 26-pin D-type connector for alarm
75 ohm, transformer coupled, BNC connectors for the
following signal formats:
relays and TTL outputs; also recording trigger input
The Alarms connector provides connections for five relays. Each relay is
configured through the user interface (see Tests Screen, page 3-23 and Custom
Screen, page 3-26); the three TTL outputs are configured in a similar manner.
ASI Loop-Through (QAM (Annex B), COFDM, 8VSB, and 8PSK only)
To monitor ASI and RF signals, (for example, both the input and output of a
modulator):
Connect the ASI signal from the modulator to the interface card ASI In.
Connect the ASI Out terminal on the interface card to the ASI In connector
on the Transport Stream Processor card.
Select the signal to be monitored from the configuration view (see page 3-76).
The ASI signal from QAM (Annex A and C) and QPSK (L-Band) interface cards
is looped to the Transport Stream Processor card internally.
1-10 MTM400 MPEG Transport Stream Monitor User Manual
Page 25

Getting Started
Network Installation
The MTM400 is designed to operate in a networked (TCP/IP) environment. The
network or system administrator may have already configured the TCP/IP
parameters (including the network identity) for the MTM400. If this is not the
case, refer to Appendix A: Network Installation for procedures to configure the
TCP/IP parameters.
Setting the Font Used By the RUI
If the RUI does not show the program names and logs in the correct character set,
first ensure that the correct standard is selected for the broadcast being monitored.
If the characters are still incorrect, you must configure the RUI to use a font that
supports the characters in use.
1. Locate the file MTM400.INI. This is typically in the Java folder inside the
Windows folder or in your home directory.
This file is formatted in Unix text. If a Unix file-format compatible text editor
(for example, PFE) is not available, edit file in Notepad. Be careful not to add
any new lines; only edit what is there.
2. Within the MTM400.INI file, change UnicodeOn=false to UnicodeOn=true,
save the file, and restart the RUI.
3. The RUI will attempt to select a suitable font installed on the system. If the
displayed characters are still incorrect, close the RUI and reopen
MTM400.INI.
4. Change the UnicodeFont=Arial Unicode MS section to the name of the
TrueType font you want to use, for example UnicodeFont=MS Gothic. Save
the file and restart the RUI.
The default Arial Unicode MS is shipped with many Microsoft products and
operating systems; it includes the whole Unicode character set. This font provides
the best compromise to display the non-English program names and the English
elements of the user interface. If this font is unavailable, similar fonts are
commercially available, for example from Bitstream Inc. (www.bitstream.com).
The preceding instructions relate to running the RUI under the Microsoft Java
Virtual Machine. Some users choose to run the WebMSM under the Sun Java
Virtual Machine, however, this is an unsupported configuration. In this case, the
user should see the Sun documentation relating to modifying ‘font properties’. The
exception is when the RUI is integrated into the MLM1000. In this case, refer to
the user manual (Tektronix part number 071-1433-xx) that accompanies the
MLM1000.
MTM400 MPEG Transport Stream Monitor User Manual 1-11
Test Equipment Depot - 800.517.8431 - 99 Washington Street Melrose, MA 02176 - FAX 781.665.0780 - TestEquipmentDepot.com
Page 26

Getting Started
Installing Font Extensions on Your PC
The ARIB specifications for ISDB make use of private extensions to the standard
Unicode character set [0xE000-0xF8FF]. These extensions provide additional
characters and non-standard proprietary characters; they are used to extend an
existing font. Check with the transport stream broadcaster for the availability of
any font extension set for their transport stream. Because these font extension files
are specific to the broadcaster, they are not supplied by Tektronix.
The extension sets are provided as TrueType Extension files (*.tte). Any extension
sets should be installed using the Private Character Editor which is supplied as part
of the standard Windows installation.
The following paragraphs describe the general procedure required to install an
extension set:
1. Select Start => Run.
2. Enter eudcedit and select OK.
3. The Private Character Editor is opened. Close the Select Code dialog box.
4. Select File => Font Links….
5. In the Font Links dialog box, select the Link with selected fonts option. (If
Link with all fonts is selected, the following actions will overwrite any
existing extension sets.)
6. In the Select Fonts box, find and highlight the font to which the extension is
to be made; this font should be the one used in the RUI.
7. Select Save As…..
8. Browse to the supplied TrueType extension file (*.tte) and select Save.
9. In the Font Links dialog box, select OK.
10. Close the Private Character Editor.
To check that the extension has been successfully installed:
1. Open the Character Map application (Select Start => Run and enter
charmap).
2. Select font name (Private Characters) and note the extended character set.
3. Close the Character Map application.
The extended character set is now available for use when the font is selected.
1-12 MTM400 MPEG Transport Stream Monitor User Manual
Page 27

Getting Started
Powering Up the MTM400
After the connections have been made to the unit, all that is required to power up
the MTM400 is to apply power. Connect the power cord to a properly grounded
outlet. Connect the other end of the cord to the product's power input
(see Figure 1-1).
There is no mains disconnect switch. Initialization will begin as soon as power is
connected to the power input. The LEDs on the front panel will indicate activity
(see Local Indicators, page 2-2). Initialization can take up to 60 seconds.
Disconnect the power cord to remove power.
MTM400 MPEG Transport Stream Monitor User Manual 1-13
Page 28

Getting Started
The Remote User Interface
The Remote User Interface (RUI) provides a means of accessing the MTM400
configuration and monitoring features. The RUI can be run on any personal
computer (client PC) that meets the minimum specification and has network access
to the MTM400 unit. The full specification is given in the MTM400 MPEG
Transport Stream Monitor Technical Reference.
Logging on
To access the configuration and monitoring features of the MTM400, use the
following procedure:
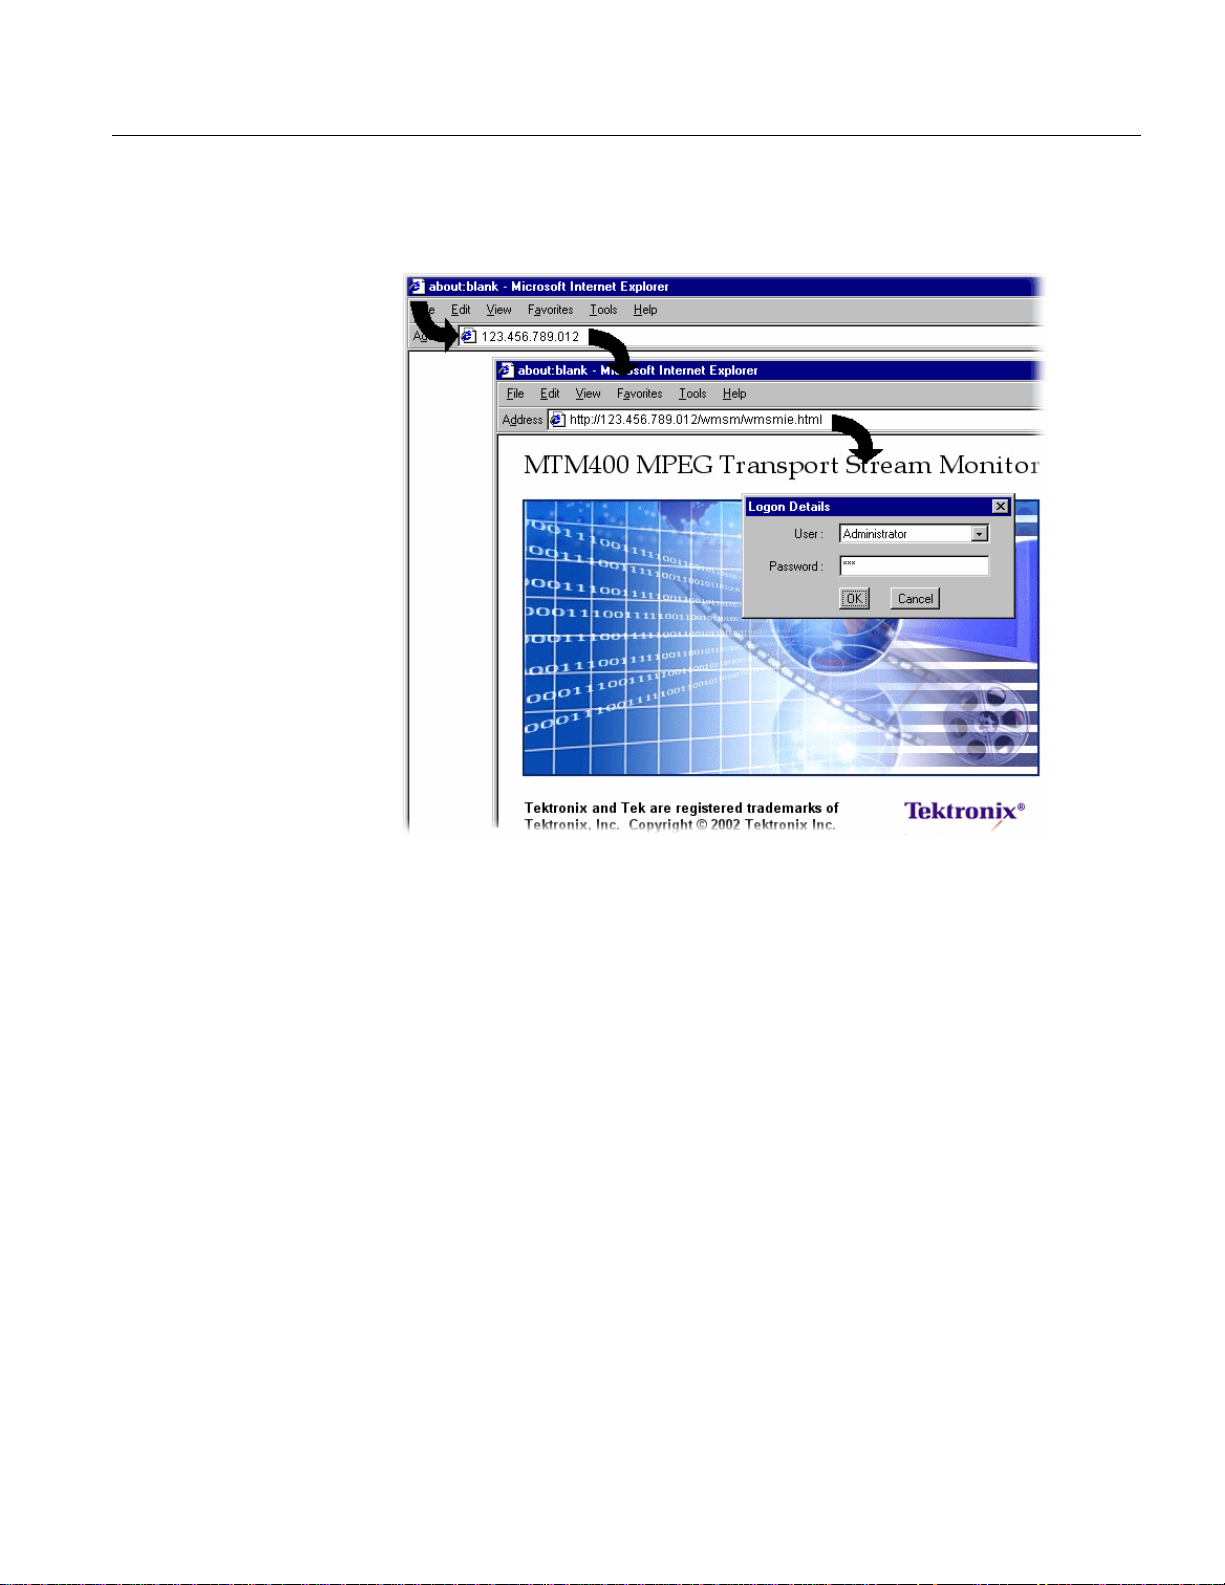
1. At a networked PC, launch Microsoft Internet Explorer.
2. In the browser address bar, enter the network identity or IP address of the
MTM400 unit, for example:
http://TSMonitor01 or http://192.201.121.231.
When the Enter key is pressed, a Java applet is downloaded from the
MTM400 unit and launched. The file size is approximately 1.5 MB; the
download time will depend on the network speed and traffic.
CAUTION. The Java applet will not run unless a 'temp' directory is properly
configured on the PC.
The Java applet will not run unless the Microsoft Java Virtual Machine is
installed. Type ‘jview’ at the command prompt to verify that it is installed and that
the version is 5.00.3809 or greater. If it is not installed, obtain the installation file
from the Tektronix Web site.
If the Sun Virtual Machine also has been installed, the Sun Virtual Machine must
not be set as the default in the Java control panel
advanced tab.
or Internet Explorer options,
1-14 MTM400 MPEG Transport Stream Monitor User Manual
Page 29
Getting Started
The MTM400 splash screen is displayed overlaid shortly thereafter by the
Details dialog:
Login
Figure 1-2: Logging on
3. Select the User name (Administrator or User from the drop-down list).
Two User Names are available at installation: Administrator and User.
Administrator: Gives full read/write access to all views and settings,
including options where installed.
User: Gives read only access to all views and settings, including options
where installed. You can also reset alarms.
4. Enter the password. The default password for the Administrator is
tek; no
password is allocated to the User. The password can be modified using the
Device Configuration screen (see page 3-13).
Select OK to accept the details. Select Cancel to close the dialog.
(To redisplay the Logon Details dialog, either reenter the network identity of
the MTM400 or select the Refresh
button in the browser.)
MTM400 MPEG Transport Stream Monitor User Manual 1-15
Page 30
Getting Started
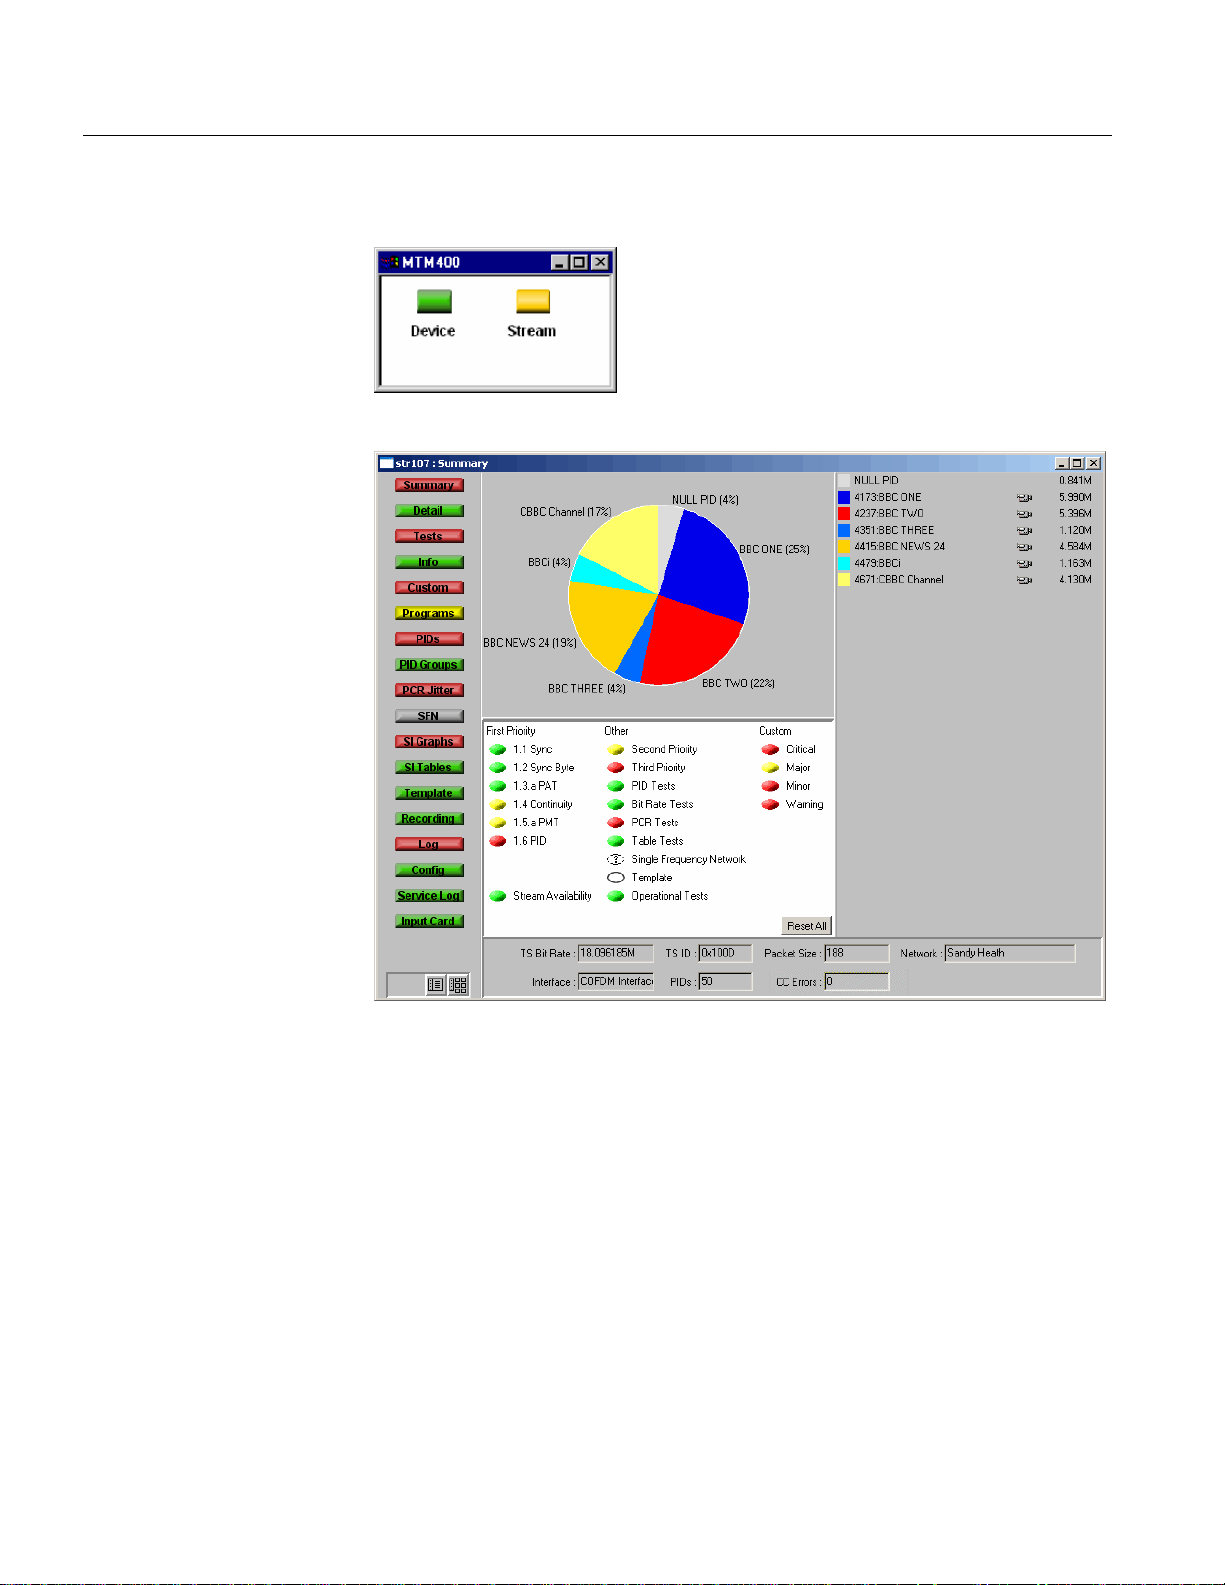
5. The Hotspot and Stream views are displayed.
Figure 1-3: Hotspot view
Figure 1-4: Summary view
The Hotspot view provides access to the device and stream monitoring views
of the MTM400 being accessed.
1-16 MTM400 MPEG Transport Stream Monitor User Manual
Page 31

Getting Started
High Level Monitoring
The Hot Spot view allows the overall state of the MTM400 device and the stream
to be viewed; each hotspot is appropriately labeled.
The color of the Hot Spot button indicates the error status of the item to which it is
linked (see Color Coding, page 2-11).
In the Hot Spot view, the error state of the linked item is as follows:
Device - the highest error state of the MTM400 device.
Stream - the highest error state of the stream.
When you left-click a hot spot, the appropriate view opens: Device or Stream.
A detailed description of the user interface is provided in the Reference section of
this manual.
Closing the Remote User Interface
Closing the original Internet Explorer window closes the RUI; the application
windows close simultaneously.
MTM400 MPEG Transport Stream Monitor User Manual 1-17
Page 32

Getting Started
1-18 MTM400 MPEG Transport Stream Monitor User Manual
Page 33

Operating Basics
Page 34

Page 35

Operating Basics
This section provides an overview of the basic operation of the system; details and
background material are found in the Reference section.
The monitoring activity of the MTM400 can be observed in three ways:
Local indicators
Remote User Interface (RUI)
WebMSM
Options are available to the RUI and the WebMSM to upgrade the monitoring
from simple conformance checking to full diagnostic capability using license keys.
The following sections describe all available options; your MTM400 may not have
all options enabled.
MTM400 MPEG Transport Stream Monitor User Manual
2-1
Page 36

Operating Basics
Local Indicators
The MTM400 is an MPEG monitor for use in remote situations and does not have
a local graphical user interface display. However, a local interface, consisting of
four front-panel LEDs, can assure you that the MTM400 unit is functioning.
ATSC
Figure 2-1: Front panel
MTM400
MPEG Transport Stream Monitor
SYNC STATUS ETHERNET SYSTEM
These LEDs indicate the following:
SYNC Indicates that a valid MPEG transport stream is connected to the
unit.
STATUS Indicates the combined state of the tests currently being performed
on the stream. The test reported by the STATUS LED corresponds
to the Any Stream Error in the RUI (see Device Status, page 3-2).
ETHERNET Indicates the state of the Ethernet physical link.
SYSTEM State of all non-stream items (hardware, time sources). The test
reported by the SYSTEM LED corresponds to the Any Box Error
in the RUI (see Device Status, page 3-2).
Each LED can show one of three colors:
Green indicates that the monitor is currently passing the test.
Red indicates that the monitor is currently failing the test.
Yellow indicates that the monitor is currently passing the test, but has failed
since the last system reset.
The Ethernet LED never shows yellow.
2-2 MTM400 MPEG Transport Stream Monitor User Manual
Page 37

Operating Basics
Remote User Interface
The Remote User Interface (RUI) allows you to configure and monitor the
MTM400. The RUI can be run on any personal computer (client PC) that meets the
minimum specifications (refer to MTM400 MPEG Transport Stream Monitor
Technical Reference) and that has access to the MTM400 unit.
You can open the RUI of more than one RTM device by opening a new browser
window each time; however, this may place an excessive processing load on your
PC.
With the RUI accessed through your PC browser, three primary screens (or views)
are provided to enable monitoring and configuration of the MTM400: Hot Spot
View, Device View, and Stream View.
Hot Spot view
Device view
Stream view
Figure 2-2: RUI overview
To close the Remote User Interface, close the original web browser window. All
associated windows will close.
MTM400 MPEG Transport Stream Monitor User Manual 2-3
Page 38

Operating Basics
Hot Spot View
The Hot Spot view lets you see the overall state of the MTM400 and the stream;
each hotspot is appropriately labeled.
Figure 2-3: Hotspot view
The color of the Hot Spot button indicates the error status of the item to which it is
linked (see Color Coding, page 2-11).
For example, in Figure 2-3, the Device button is green and the Stream button is
yellow. This indicates that no errors have occurred on the device; an error has been
noted on the stream, but it is currently OK.
The color (or state) of the Device and Stream hot spots corresponds to the Any
Box Error and Any Stream Error tests in Device and Stream views.
If you click on a hot spot, the appropriate MTM400 view will open.
2-4 MTM400 MPEG Transport Stream Monitor User Manual
Page 39

Operating Basics
Device View
The Device view allows you to monitor and set parameters specific to the
MTM400 device itself. The view contains a menu bar with various buttons, and an
information view. You can choose the information that appears in the view by
pressing the appropriate button. The button color indicates the overall state of the
information in the corresponding view (see Color Coding, page 2-11).
Figure 2-4: Device view
The title bar displays the name of the device to which you are connected (the name
you set in the Device Configuration view) and the current view type. The screens
provided are:
Status Displays the state of hardware items on the MTM400. It also
allows administrators to configure alarms and relays and
parameters associated with each item.
Log Displays the MTM400 device log, which includes non-stream
events such as 'Device Start'.
Config Displays general configuration parameters for the MTM400.
Administrators can modify certain parameters.
Info The Information view details the software and hardware build
state of the MTM400.
MTM400 MPEG Transport Stream Monitor User Manual 2-5
Page 40

Operating Basics
Stream View
The Stream view allows you to monitor and set parameters specific to the stream
being monitored.
As with the Device view, the screen consists of a menu bar with various buttons,
and an information view. You can choose the information that appears in the view
by pressing the appropriate button. The color of the button shows the overall state
of the information that will be shown in the corresponding view (see Color
Coding, page 2-11).
Figure 2-5: Stream view
The title bar displays the name of the device to which you are connected (the name
you set in the Device Configuration view) and the current view type.
2-6 MTM400 MPEG Transport Stream Monitor User Manual
Page 41

Operating Basics
The information takes the form of a series of screens; a brief summary of each
follows:
Summary A dynamic visual overview of the stream and monitoring status.
The information is updated at regular intervals.
(See page 3-20.)
Detail Displays the detailed information about the stream according to
SI tables, PIDs, or Program.
(See page 3-22.)
Tests Displays the state of the tests applied to the stream. It also
allows users with read-write permissions (Administrators) to
configure alarms and relays and parameters associated with each
test.
(See page 3-23.)
Information
Displays events not normally logged in the Stream log; for
example, PAT/PMT version changes.
(See page 3-28.)
Custom Displays the state of the tests in the same way as the Tests view,
but categorized as Critical, Major, Minor or Warning.
The allocation of tests to categories is preconfigured, but you
can override the settings at run time. However, the settings will
not be saved when the RUI is closed (using the WebMSM
allows permanent configurations to be saved).
(See page 3-26.)
Programs Displays the programs that are being transmitted on the stream
along with bit rate and the minimum and maximum bit rates that
are observed. Administrators can set bit rate limits for each
program if the bit rate limits option is licensed.
(See page 3-30.)
PIDs Displays the PIDs that are being transmitted on the stream along
with bit rate and the minimum and maximum bit rates that are
observed. Administrators can set bit rate limits for each PID if
the bit rate limits option is licensed.
(See page 3-34.)
PID Groups * Displays the PID groups that you have created. The displayed
information includes the error state and the bit rate.
(See page 3-41.)
MTM400 MPEG Transport Stream Monitor User Manual 2-7
Page 42

Operating Basics
PCR Jitter * Displays the following PCR graphs: Inaccuracy, Arrival, Overall
Jitter, Frequency Offset, and Drift Rate.
(See page 3-48.)
SFN Displays the Single Frequency Network (SFN) information
when available.
(See page 3-56.)
TMCC Displays the Transmission and Multiplexing Configuration
Control (TMCC) and IIP information when available.
(Only available for ISDB streams)
(See page 3-57.)
SI Graphs * Displays information about repetition rates of SI tables and
subtables in graphical format.
(See page 3-58.)
SI Tables * Displays the SI Information for the stream.
(See page 3-62.)
Template * Displays the structure and status of templates applied to the
stream.
(See page 3-68.)
Recording * Displays the Triggered Recording setup screen.
(See page 3-71.)
Log Displays the stream log.
(See page 3-72.)
Config Displays general configuration parameters for the stream.
Administrators can modify certain parameters. Scheduling,
triggered recording, and interface setup are configured here.
(See page 3-76.)
Service Log Displays the Service Log. Service logging allows packet counts
for specified PIDs (range: 0 to 100) to be collected at a userdefinable interval.
(See page 3-80.)
Input Card Displays the relevant graphs and setup of any installed interface
card. (Only displayed if an interface card is present.)
(See page 3-107.)
* - licensed options (see Table 1-5: MTM400 Options Summary).
2-8 MTM400 MPEG Transport Stream Monitor User Manual
Page 43

Operating Basics
Device and Stream View Manipulation
The manipulation of the Device and Streams views is similar. Each view consists
of a Button bar and an information window. The two view elements can be
displayed either combined (a single window with the Button bar on the left) or as
separate elements (the Button Bar and the information window are displayed
separately). When displayed as separate windows, multiple information windows
can be opened. The choice is made by selecting one of the two buttons at the
bottom of the Button bar.
Combined View. Figure 2-6 illustrates the combined Device view; the Streams view
is similar. Each time a button is selected, the adjoining view changes.
Figure 2-6: Combined view
MTM400 MPEG Transport Stream Monitor User Manual 2-9
Page 44

Operating Basics
Multiple View. Figure 2-7 illustrates the multiple Device view; the Streams view is
similar. Each time you select a function button, a new window opens.
Figure 2-7: Multiple view
When switching from multiple view to combined view, you will be asked to
acknowledge that all the function windows will close before the combined view
window can be displayed.
The individual Device and Streams function windows are described in the
Reference section of this manual.
2-10 MTM400 MPEG Transport Stream Monitor User Manual
Page 45

Operating Basics
Color Coding
In the RUI Hot Spot View, the Device and Stream buttons use the color scheme
shown in Table 2-1.
Table 2-1: Button colors - Hot Spot views
Icon Color Meaning
Green Operation normal — no error detected.
Red Error detected and still present.
Yellow Transient error, which has now corrected itself.
Gray The corresponding test has been disabled (or is unavailable).
All buttons gray indicates that connection to a device has
been lost.
In the Stream and Device views, the buttons and icons use the color-coded error
scheme shown in Table 2-2.
Table 2-2: Button colors - Device and Stream views
Icon Color Meaning
Green Operation normal — no error detected.
Red Error detected and still present.
Yellow Transient error, which has now corrected itself.
Gray The corresponding test has been disabled (or is unavailable).
All buttons are gray indicates that connection to a device has
been lost.
White Test not applicable.
Clear / ? Test unknown or incomplete (for example, during a
measurement settling time).
Black Maintenance mode.
Where buttons represent a collection of elements (for example, for the Status
button), the color indicates the highest error state of the elements.
MTM400 MPEG Transport Stream Monitor User Manual 2-11
Page 46

Operating Basics
Using WebMSM
Using MLM1000
If you have a system consisting of MTM400 units, you can expand your
monitoring capabilities by using the WebMSM Monitoring System Manager.
The WebMSM software is effectively an installed version of the RUI. The
WebMSM software provides additional functionality by allowing you to create
hierarchical network views of your systems using the WebMSM Configuration
Editor, and monitor and control multiple devices. The WebMSM user interface is
similar to the RUI.
For further information concerning installing and configuring the WebMSM, refer
to the WebMSM User Manual (Tektronix part number 071-1239-xx).
If you have a system with a number of Tektronix monitoring devices, which are
not limited to MTM400 units, you can enhance your monitoring capabilities by
using the MLM1000 Multi-Layer Monitoring software.
User Interface Version
The MLM1000 software manages a hierarchical network of MTM400 units,
waveform monitors, RF monitors and other instruments. Like the WebMSM
software, it is installed on the PC; the MTM400 interface is identical to the RUI.
For further information concerning installing and configuring the MLM1000
software, refer to the MLM1000 Multi-Layer Monitoring Software User Manual
(Tektronix part number 071-1433-xx).
The software version of the user interface (RUI or WebMSM) is shown on the
device information screen (page 3-1). Ensure that the RUI version is the same as
the FW version installed in connected MTM400s.
2-12 MTM400 MPEG Transport Stream Monitor User Manual
Page 47

Operating Basics
Time Zones
An inevitable consequence of allowing the RTM device user interface to be
accessed across networks is the crossing of time zones. Various features of the user
interface display timing information, including the Log files. You need to know the
time source being used to record events. Also, when scheduling the loading of
configuration files, time zones must be taken into account (see Scheduling,
page 3-91).
Figure 2-8 shows a typical setup in which an MTM400 is located in Denver and is
monitored from Portland. In local time, Portland is one hour behind Denver. In this
example Universal Coordinated Time (UTC) is 10 p.m. Therefore the local times
in Portland and Denver are 2 p.m. and 3 p.m. respectively.
Portland
Local Time = 2 p.m.
UTC = 10 p.m.
UTC/Local Offset = -480 minutes
Figure 2-8: Time zones - illustration
The MTM400 user interface allows you to coordinate times of the system elements
and to choose the local reference time zone; UTC, local time at the client PC or
local time at the RTM device. All times are calculated with respect to Universal
Coordinated Time. (See Device Configuration - Set Time, page 3-9.)
USA (part)
Denver
Local Time = 3 p.m.
UTC = 10 p.m.
UTC/Local Offset = -420 minutes
UTC = 10 p.m.
MTM400 MPEG Transport Stream Monitor User Manual 2-13
Page 48

Reference
Page 49

Device View
The Reference section provides a detailed description of each of the views
available in the RUI. The descriptions are given in the order in which they appear
in the two primary views: Device and Streams.
The Device view allows you to monitor and set parameters specific to the
MTM400 unit. The view consists of a menu bar with various buttons, and an
information view. You can choose the information that appears in the view by
pressing the appropriate button. The color coding of buttons is explained in the
previous section (see Color Coding, page 2-11.)
Figure 3-1: Device view
The title bar displays the Device Name and the current view type.
The screens provided are:
Status Displays the state of hardware items that are installed on the
MTM400. It also allows administrators to configure alarms and
relays and parameters associated with each item. (See page 3-2.)
Log Displays the MTM400 device log. (See page 3-4.)
Config Displays general configuration parameters for the MTM400.
administrators can modify certain parameters. (See page 3-6.)
Info The Information view details the software and hardware build
state of the MTM400. (See page 3-15.)
MTM400 MPEG Transport Stream Monitor User Manual
3-1
Page 50

Device View
Device Status
The Device Status option displays a screen that shows the status of MTM400
device events (as opposed to stream events).
Figure 3-2: Device view - Status
The events displayed will depend on the RTM device type; those currently shown
for the MTM400 are as follows:
Any Device Error
Temperature When active, indicates that the maximum temperature
Front Panel When active, indicates that either the temperature at the front
Battery When active, indicates that the configuration backup battery
Time Source When active, indicates that the time source selected in the Set
Provides an overview of the device error state, which includes
the events shown in this panel.
monitored at the front panel and the processor board has
exceeded the safe operating limit.
panel has exceeded the safe operating limit, one or more of the
LEDs has failed, or the audible alarm is faulty.
on the TS Processor board has failed. In this case, all
configuration settings will be lost when power is removed
from the unit.
Time… section of the Device Configuration (see page 3-9)
has failed.
3-2 MTM400 MPEG Transport Stream Monitor User Manual
Test Equipment Depot - 800.517.8431 - 99 Washington Street Melrose, MA 02176 - FAX 781.665.0780 - TestEquipmentDepot.com
Page 51

Device View
Typical display elements are described in the following paragraphs:
State A button showing the State of the event.
(See Color Coding, page 2-11.)
A right-click on the button will open a popup menu that allows
you to reset the error or enable/disable the event monitoring.
Double-clicking the button will toggle event monitoring
between enabled and disabled.
Error Name of the Error event (for example, Fan).
Alm An icon indicating whether an audible alarm (Alm) will sound
when an error of the type occurs. Double-clicking the icon will
toggle its state: enabled or disabled.
- Disabled; - Enabled
(See the MTM400 MPEG Test Technical Reference for
additional details.)
TTLn An icon indicating whether the TTL (TTLn) will activate
when an error occurs. Double-clicking the icon will toggle its
state: enabled or disabled.
- Disabled; - Enabled
(See the MTM400 MPEG Test Technical Reference for
additional details.)
SNMP (T- and T+) Indicates whether SNMP trap messages should
be sent when a specific event starts and finishes.
- Off (gray); - On (yellow)
RLYn An icon indicating whether the relay (RLYn) will activate
when an error occurs. Double-clicking the icon will toggle its
state: enabled or disabled.
- Disabled; - Enabled
(See the MTM400 MPEG Test Technical Reference for
additional details.)
MTM400 MPEG Transport Stream Monitor User Manual 3-3
Page 52

Device View
View Device Log
The Device Log records device-specific events associated with the selected
MTM400. Logged events are displayed in a scrolling list. The Date, Time, Event
ID and a description of each event is displayed.
Figure 3-3: Device view - Log
Highlighting Log Entries
To open a pop-up menu from which log entry highlight coloring can be initiated,
right-click anywhere within the listing.
3-4 MTM400 MPEG Transport Stream Monitor User Manual
Page 53

Device View
Using the Log Entry Highlights dialog allows specific types of entries to be
highlighted in a selected color. Select the Event type to be highlighted from the
drop-down list adjacent to the Color
required; hex values are shown in the event
list. Select OK to close the dialog and implement the highlighting.
Saving the Device Log
The Device Log can be saved using the Download Log… button. In the Log
Download dialog, select (or enter) a filename and path and select the Start button.
Select the Close button when the operation has finished or to terminate the process
early.
The resulting downloaded log file is saved in CSV (comma separated values)
format.
Clearing the Device Log
Select Clear Log to clear the current log entries.
MTM400 MPEG Transport Stream Monitor User Manual 3-5
Page 54

Device View
Device Configuration
Time Zone
Monitoring devices across time zones may cause some confusion with respect to
the timing of events. The displayed times at which log events occurred can be
adjusted by making a selection from the Time Zone drop-down list at the top of
the window. The following options are available:
Local The time local to the machine on which MTM400 Remote User
Interface is currently running.
UTC Universal Coordinated Time.
RTM Device The time local to the RTM device being monitored.
The Device Configuration screen allows you to configure items specific to the
MTM400 unit being monitored.
Figure 3-4: Device view - Configuration
Device Type
Device Name
Enter the required name and select Set to activate it.
Network Settings…
3-6 MTM400 MPEG Transport Stream Monitor User Manual
: Displays the monitoring device type; this information is read
from the unit being monitored.
: You can give the monitoring device a name, which is then
displayed in the title bar of all screens. You need not enter a
Device Name if the IP address of the device is displayed.
Allows the network settings of the device to be reconfigured.
(See Network Settings, page 3-7.)
Page 55

Device View
Set Time… Allows the RTM device time to be set.
(See Set Time, page 3-9.)
Upload Device Firmware…
Allows new firmware to be uploaded to overwrite the existing
device firmware.
(See Firmware Upload, page 3-11.)
Upload I/F Card Firmware…
Allows new firmware to be uploaded to overwrite the existing
interface card firmware.
(See Firmware Upload, page 3-11.)
Set Device Passwords
Allows the RUI passwords to be set.
(See Passwords, page 3-13.)
Reset Device Resets the MTM400 by rebooting. The configuration is reloaded
from non-volatile RAM; any configuration settings not saved
before the reset will be lost.
(See Device Reset, page 3-13.)
Upload License…
Allows the License Key details to be entered.
(See Upload License, page 3-14.)
Network Settings
Although the MTM400 network identity is initially set up during installation, it can
be changed subsequently through the Network Settings dialog.
SNMP community strings can also be set using the Network Settings dialog box.
In all cases, when the values have been changed as required, select the adjacent Set
button to store the new settings in the MTM400.
To open the Network Settings dialog, select Network Settings from the Device
Configuration dialog.
MTM400 MPEG Transport Stream Monitor User Manual 3-7
Page 56

Device View
When the network settings have been changed and set and Close is selected, the
following dialog is displayed:
For the network settings to take effect, select OK to restart the device. Select
Cancel if a restart is not required. The new settings will not take effect until the
unit is restarted.
If necessary, obtain the IP Address, Gateway and Subnet Mask values from the
Network Administrator.
NOTE. If the Network Settings are changed and the MTM400 is restarted, the PC
that is running the RUI will be unable to communicate with the MTM400, since the
browser is trying to communicate with the previous network identity. It will be
necessary to close the RUI by closing the Internet Explorer. Internet Explorer can
then be reopened and the MTM400 accessed using the new network identity.
This is true of any WebMSM system configuration, which must be revised using the
WebMSM Configuration Editor (refer to the WebMSM user manual).
3-8 MTM400 MPEG Transport Stream Monitor User Manual
Page 57

Device View
Set Time
You can coordinate the time used by the RTM device and/or the remote user
interface. (For a general description of the timing model, see Time Zones,
page 2-13.)
Three time sources are available to the MTM400 from the Time Source
drop-down menu.
Real Time Clock The MTM400 internal clock.
LTC (Longitudinal Time Clock) An analogue format time clock
often available from a centralized source.
SNTP (Simple Network Time Protocol) A UTC-synchronized time
clock available over the internet. Appropriate IP addresses of
time servers should be available from the System
Administrator.
Local time is the time being used by the remote user interface; it is the local
PC time. It is referenced to UTC (Coordinated Universal Time) and may be
offset to allow for local time variations, for example, British Summer Time =
+60 minutes. The adjusted time is shown. Local time corresponds with the
current Windows clock and time zone parameters.
RTM Device time is the time being used by the RTM device; this may be in a
completely different time zone. It is referenced to UTC (Coordinated
MTM400 MPEG Transport Stream Monitor User Manual 3-9
Page 58

Device View
Universal Time) and may be offset to allow for local time variations, for
example, British Summer Time = +60 minutes. The adjusted time is shown.
With Real Time Clock selected from the Time Source drop-down list, the RTM
device can be synchronized to local PC time using Sync with Local. Any offset
required (for a different time zone) is entered in the UTC to Time Zone
Offset field in minutes (range: ±12 hours) and activated using Set.
NOTE. There may be a slight delay between the RTM device time displayed and the
actual time on the device due to network delays incurred in retrieving the time.
This is most likely to be seen if you apply Sync with Local and observe that the
Local and RTM Device times are slightly out of step.
With either Longitudinal Time Code or Simple Network Time Protocol selected
from the Time Source drop-down list, the RTM device takes its time from the
respective input. Any offset required (for a different time zone) is entered in the
UTC to Time Zone Offset field (in minutes) and activated using Set.
To use a remote time server, Simple Network Time Protocol should be selected
from the Time Source drop-down list, and the IP address of a suitable SNTP
server entered in the SNTP field.
The network Gateway and Subnet Mask must be set up for the remote server to be
able to communicate (see Network Settings, page 3-7).
3-10 MTM400 MPEG Transport Stream Monitor User Manual
Page 59

Device View
Firmware Upload
If new device or interface card firmware is available, this function allows you to
upload it to the respective device. The firmware filename format is *.hex.
Device Firmware Upload.
CAUTION. The Device Log must be cleared immediately before uploading the
firmware.
1. Clear the Device Log.
2. Select Upload Device Firmware.
3. Identify the firmware file either by entering the path and filename or by using
Browse.
4. Select Start to upload the firmware.
CAUTION. If the instrument contains a CIP interface card (COFDM, QAMB2,
8PSK,8VSB), the upload process can take up to 15 minutes to complete. The
operation will fail if power is removed during this process.
MTM400 MPEG Transport Stream Monitor User Manual 3-11
Page 60

Device View
5. Select Close when the process has completed or to terminate the process.
Interface Card Firmware Upload.
NOTE. This feature will only be used for interim updates of the Interface Card
Firmware. The update will comprise up to three files. Documentation specifying
Card Type and ROM number to be used will be supplied with the firmware files.
The firmware is uploaded to non-volatile RAM on the card. If this firmware
becomes corrupted and the device needs to be reprogrammed, the original
firmware from the MTM400 will be used; the updated firmware would have to be
reapplied.
1. To upload interface card firmware, select Upload I/F Card Firmware.
2. Select the Card Type to which the firmware is to be uploaded from the drop-
down list.
3. Enter the ROM number (0, 1 or 2).
3-12 MTM400 MPEG Transport Stream Monitor User Manual
Page 61

Device View
4. Identify the firmware Filename
: (either by entering the path and filename or
using Browse.
5. Select Start to upload the firmware.
Select Close when the process has completed or to terminate the process.
Passwords
Use the Password feature in the device configuration to change the current
password. This is the password that will be required when you access the device
through the RUI. The password file created is stored on the RTM device.
Note that only users with administrator access can change the RUI passwords.
1. For the administrator, enter a password in the Password field. Verify it by
entering it again in the Verify Password field.
2. Repeat for the user.
3. Select OK to confirm the passwords.
Device Reset
Selecting Reset Device resets the RTM device; it is equivalent to removing and
reinstating power. The configuration is reloaded from non-volatile RAM; any
configuration settings applied in the preceding few seconds may not be saved so if
you have changed settings wait a few seconds before resetting the box. The device
configuration is reloaded from non-volatile RAM upon restart.
MTM400 MPEG Transport Stream Monitor User Manual 3-13
Page 62

Device View
Upload License
A license key is applied to each RTM device to enable functionality. When new or
upgraded functions are added, for example as part of a field upgrade, you will
receive a new license key with the upgrade kit. Use the License Upload dialog to
apply the new license key.
Enter the new License Key; this will accompany the upgrade documentation.
Select Upload. The result will be displayed.
The license key will be stored on the RTM device. Note that licensing is specific to
a single RTM device.
3-14 MTM400 MPEG Transport Stream Monitor User Manual
Page 63

Device View
Device Information
The Info view details the software and hardware build state of the MTM400. (The
values shown in this example will differ from the values shown on your display.)
Figure 3-5: Device view - Information
MTM400 MPEG Transport Stream Monitor User Manual 3-15
Page 64

Device View
SNMP
The MTM400 Simple Network Management Protocol (SNMP) agent is a software
process that responds to queries using the SNMP to provide status and statistics
about the MTM400. This enables management applications to be developed that
can access MTM400 units remotely across a network using SNMP.
Each of the events available from the MTM400 is kept in a database described by a
Management Information Base (MIB). The various values that can be retrieved
from the MIB are called MIB variables. These variables are defined in the MIB for
the MTM400. Each MIB variable is named by an Object Identifier (OID).
The MTM400 MIB is documented in the MTM400 MPEG Transport Stream
Monitor Programmer Manual, Tektronix part number 071-1375-xx.
The MTM400 MIB definition files can be downloaded from the MTM400 using
http://address/mib/adsys.mib and http://address/mib/admpeg.mib.
Communities
An SNMP Community String is like a password. It is sent along with each SNMP
request and allows (or denies) access to the MTM400. Most agents accept a default
password of “public”. Alternative community strings can also be used to enhance
security. The MTM400 uses the standard community string “public”. However, it
allows a secondary community string to accommodate older systems that use
different values and cannot be changed. Even if these values are changed, the
“public” community string can still be used. Read and Write community strings
can be set in the Network Settings dialog (see page 3-7).
SNMP Traps
An SNMP Trap is an unsolicited message from an MTM400 to an SNMP agent
that an event has occurred. Traps provide an immediate notification for an event
that might only be discovered during occasional polling using normal SNMP
techniques.
SNMP traps have a default community string of “public”. An alternative
community string can be assigned in the Network Settings dialog (see page 3-7).
3-16 MTM400 MPEG Transport Stream Monitor User Manual
Page 65

Stream View
The Stream view provides information about the monitored stream.
Figure 3-6: Stream view
The title bar displays the Stream Name (configured by the user), and the current
view type.
The information takes the form of a series of screens; a brief summary of each
follows:
Summary A dynamic visual overview of the stream and monitoring status.
The information is updated at regular intervals.
(See page 3-20.)
Detail Displays the detailed information about the stream according to
SI tables, PIDs, or Program.
(See page 3-22.)
MTM400 MPEG Transport Stream Monitor User Manual
3-17
Page 66

Stream View
Tests Displays the state of the tests applied to the stream. It also
allows users with read-write permissions (Administrators) to
configure alarms and relays and parameters associated with each
test.
(See page 3-23.)
Information
Displays events not normally logged in the Stream log; for
example, PAT/PMT version changes.
(See page 3-28.)
Custom Displays the state of the tests in the same way as the Tests view,
but categorized as Critical, Major, Minor or Warning.
The allocation of tests to categories is preconfigured, but you
can override the settings at run time. However, the settings will
not be saved when the RUI is closed (using the WebMSM
allows permanent configurations to be saved).
(See page 3-26.)
Programs Displays the programs that are being transmitted on the stream
along with bit rate and the minimum and maximum bit rates that
are observed. Administrators can set bit rate limits for each
program if the bit rate limits option is licensed.
(See page 3-30.)
PIDs Displays the PIDs that are being transmitted on the stream along
with bit rate and the minimum and maximum bit rates that are
observed. Administrators can set bit rate limits for each PID if
the bit rate limits option is licensed.
(See page 3-34.)
PID Groups * Displays the PID groups that you have created. The displayed
information includes the error state and the bit rate.
(See page 3-41.)
PCR Jitter * Displays the following PCR graphs: Inaccuracy, Arrival, Overall
Jitter, Frequency Offset, and Drift Rate.
(See page 3-48.)
SFN Displays the Single Frequency Network (SFN) information
when available.
(See page 3-56.)
TMCC Displays the Transmission and Multiplexing Configuration
Control (TMCC) and IIP information when available.
(Only available for ISDB streams)
(See page 3-57.)
3-18 MTM400 MPEG Transport Stream Monitor User Manual
Page 67

Stream View
SI Graphs * Displays information about repetition rates of SI tables and
subtables in graphical format.
(See page 3-58.)
SI Tables * Displays the SI Information for the stream.
(See page 3-62.)
Template * Displays the structure and status of templates applied to the
stream.
(See page 3-68.)
Recording * Displays the Triggered Recording setup screen.
(See page 3-71.)
Log Displays the stream log.
(See page 3-72.)
Config Displays general configuration parameters for the stream.
Administrators can modify certain parameters. Scheduling,
triggered recording, and interface setup are configured here.
(See page 3-76.)
Service Log Displays the Service Log. Service logging allows packet counts
for specified PIDs (range: 0 to 100) to be collected at a userdefinable interval.
(See page 3-80.)
Input Card Displays the relevant graphs and setup of any installed interface
card. (Only displayed if an interface card is present.)
(See page 3-107.)
* - licensed options (see Table 1-5: MTM400 Options Summary).
MTM400 MPEG Transport Stream Monitor User Manual 3-19
Page 68

Stream View
Monitoring Overview Screen (Summary Screen)
This screen provides a dynamic visual overview of the stream and monitoring
status. The information is updated at regular intervals.
Figure 3-7: Stream view - Overview
The upper half of the Overview screen displays service information in the form of
a pie chart and a list. Services are named and color coded to allow correlation
between the pie chart and the list. The pie percentage value of the NULL PID
relates to the stream bitrate. The services are divided pro-rata over the total
effective bitrate of all the active services in the stream (due to PID reuse the total
effective bitrate may be greater than the transmitted stream bitrate), this ensures
that the NULL PID bitrate shows the true available bandwidth. Bit rates of
individual services are given in the service list. The icons in the service list give an
indication of the program content: video, audio or data.
3-20 MTM400 MPEG Transport Stream Monitor User Manual
Page 69

Stream View
The lower half of the screen displays an overview of the tests applied to the stream.
The tests are grouped as follows:
First Priority: Lists the first priority tests in DVB, ISDB or ATSC order.
Other: Summarizes all test groups except First Priority. The groups are derived
from the Tests screen (see page 3-23).
Custom: Represents the highest error state present in the events associated with
the category. (These can be edited on the Custom screen, see page 3-26.)
The button to the left of the test name shows the current error status of the
individual test or, in the case of test groups, the highest error state reported by any
test within that group (see also Color Coding, page 2-11).
All tests can be reset using Reset All.
The Stream State summary table shows the overall status of the stream in terms of
error severity and event classification.
A summary of stream statistics is provided at the bottom of the screen. The fields
are as follows:
TS Bit Rate
TS ID
: Overall bit rate of stream.
: Transport stream identity; derived from the Program
Association Table (PAT).
Packet Size
Network
: Transport stream packet size (188/204).
: Network name; derived from the Network Information Table
(NIT) in the stream.
Interface
: Indicates the interface selected.
(see Configuration Screen, page 3-76.)
PIDs
: Number of Packet Identifiers (PIDs) in the transport stream.
BER: Bit Error Rate (Only displayed with L-Band (QPSK) or QAM
interfaces).
MTM400 MPEG Transport Stream Monitor User Manual 3-21
Page 70

Stream View
Detail Screen
This screen provides a dynamic, detail view of the stream PIDs. The information is
updated at regular intervals.
Figure 3-8: Stream view – Detail
The Detail screen button offers three options. All PIDs displays details of all the
PIDs in the stream. SI Tables displays details of only those PIDs that are carrying
service information table information. Programs… allows you to select a single
program and display details of the associated PIDs.
3-22 MTM400 MPEG Transport Stream Monitor User Manual
Page 71

Stream View
Tests Screen
The Tests screen displays the results of tests on the current stream grouped in
DVB, ISDB or ATSC priority order. Additional proprietary tests are grouped by
function; for example, Bit Rate tests and PID Tests.
Figure 3-9: Stream view - Tests
A full list of tests and their associated parameters is given in the MTM400 MPEG
Transport Stream Monitor Programmer Manual.
The Tests and Custom screens provide the same information prioritized in different
ways.
In addition to providing an overview of the stream status, up to four types of alarm
can be activated when an error on a test occurs. The alarms may be:
An internal audible alarm.
A TTL output on the rear of the unit, allocated to the stream.
An SNMP (Simple Network management Protocol) trap event.
One or more relay outputs on the rear of the unit, allocated to the stream.
MTM400 MPEG Transport Stream Monitor User Manual 3-23
Page 72

Stream View
The alarm output specifications are given in MTM400 MPEG Transport Stream
Monitor Technical Reference Manual.
Each test can be enabled/disabled by double-clicking the appropriate icon.
Only administrators can set parameters, enable and disable tests and set alarms.
The button (State) to the left of the test name (Error) shows the current status of the
test (see Color Coding, page 2-11).
The screen contains the following information:
Title Bar The title bar of the screen displays the name of the stream under
test. (Assigned on the Stream Configuration screen, page 3-74).
State Icon showing the state of the event:
When you right-click on this icon, it will open a popup menu
that will allow you to Reset the error, Disable/Enable monitoring
of this event, or adjust the parameters of the test.
Double-clicking the icon will disable/enable the event
monitoring.
Error Name of the event (for example, 1.1 Sync). The names are those
allocated by the standards (DVB, ASTC, ISDB or proprietary).
Alarm (Alm) Off -
; On - ;
Indicates whether an audible alarm will sound when an error
occurs. Double-click this icon to toggle its state: enabled or
disabled.
TTL (TTL1, TTL2 and TTL3) Off -
; On - ;
Indicates whether a TTL output will activate when an error
occurs. Double-click this icon to toggle its state: enabled or
disabled.
SNMP (T- and T+) Off -
(gray); On - (yellow);
Indicates whether SNMP trap messages should be sent when a
specific event starts and finishes.
3-24 MTM400 MPEG Transport Stream Monitor User Manual
Page 73

Stream View
Relay (RLY1 to RLY5) Off -
Indicates whether a relay will activate when an error occurs.
Double-click the icon to toggle its state: enabled or disabled.
Five relays are available (Rly1, Rly2, Rly3, Rly4 and Rly5).
The relay connections are given in the relevant RTM device user
guide.
Rec Off -
This icon is only displayed if Triggered Recording (Option 01)
The Triggered Recording parameters are set up from the
Test Parameters
Many tests are associated with parameters recommended by the standard (DVB,
ATSC, ISDB) being applied to the stream. The parameters can be adjusted to suit
local conditions (although the test result may then not conform to the standard).
○, Set - ●;
This icon, when active, indicates that the test has been selected
as a trigger for recording a stream. To select a test, double-click
the icon in the Rec column; an activated icon is red; an inactive
icon is a clear circle.
is licensed for use.
Configuration Screen (see page 3-76).
; On - ;
The parameters dialogs are accessed by right-clicking on the error State icon of the
required test and selecting Parameters…. An example dialog is shown below:
Tests and Parameters are fully described elsewhere (see the MTM400 MPEG
Transport Stream Monitor Programmer Manual).
MTM400 MPEG Transport Stream Monitor User Manual 3-25
Page 74

Stream View
Custom Screen
Figure 3-10: Stream view - Custom
The Tests and Custom screens provide the same information prioritized in different
ways. In the Custom screen, test results for the current stream are grouped in Event
Classification order. Setting up the Event Classification is described below.
All fields in the view are as described in the Test screen section (page 3-23).
Only users logged on as Administrators can set parameters, enable and disable
tests and set alarms.
3-26 MTM400 MPEG Transport Stream Monitor User Manual
Page 75

Stream View
Stream Event Classification
The Stream Event Classification dialog is opened by selecting the
Custom Classifications… button in the Custom view.
The dialog box allows the associated Event Classification file to be temporarily
modified. All changes made will be lost when the current session is ended by
closing the MTM400. (When accessed via the WebMSM, these changes are
saved.)
The dialog box allows each error event to be designated in one of four categories:
Critical, Major, Minimal or Warning. The list of events presented in the dialog will
reflect the stream standard (DVB, ISDB and ATSC) notified by the RTM device.
Some proprietary tests may also be listed. The classifications set are used in the
stream summary screen to show the overall status of the stream.
MTM400 MPEG Transport Stream Monitor User Manual 3-27
Test Equipment Depot - 800.517.8431 - 99 Washington Street Melrose, MA 02176 - FAX 781.665.0780 - TestEquipmentDepot.com
Page 76

Stream View
Information Screen
Select the Close button to retain the temporary settings and close the dialog.
The Information screen displays stream events and messages.
Stream events and messages may be logged but do not constitute a test failure; for
example, a version change of a table carried in the SI/PSI is reported in the stream
log but is not subject to a standard test. The only place that these stream events are
recorded is in the stream logs. This screen collects these all in one place and allows
their recording in the stream log to be enabled or disabled. Alarms can be raised
when a message occurs.
The messages to be displayed are set at the factory; interface cards can also
generate messages.
Figure 3-11: Stream view - Information
The layout and functionality is similar to the Tests screen; a single column of icons
is added, that is Log.
Log
Off - ; On - ;
Enables/disables message recording in the stream log.
Double-click this icon to toggle its state: enabled or disabled.
3-28 MTM400 MPEG Transport Stream Monitor User Manual
Page 77

Stream View
Right-click the error LED to set parameters, enable and disable tests and set
alarms.
State Icons
The State icons used in the Information screen are as shown in Table 3-1:
Table 3-1: Button colors - Information view
Icon Color Meaning
Green Idle - the event is not happening at this time.
Blue Event detected and still present.
Yellow Transient message, which has now corrected itself.
Gray The event has been disabled (or is unavailable).
All buttons gray indicates that connection to a device has been lost.
White Test not applicable. For example, PCR tests when the program
clock reference is not carried by any PIDs in the stream.
Clear / ? Test state unknown or incomplete. For example, during an RF
measurement settling period.
Black Maintenance mode.
MTM400 MPEG Transport Stream Monitor User Manual 3-29
Page 78

Stream View
Programs Screen
The Programs screen provides a quick overview of the program contents of a
transport stream.
Figure 3-12: Stream View - Programs
In this view, all the programs detected in the incoming transport stream are
displayed. Each displayed program is accompanied by:
Program name (Divider bar)
Program ID
Error state (only displayed if Bit Rate Testing - Option 05 - is licensed for
use)
Program bit rate (graphically and numerically)
PMT Test
Also displayed, at the top of the view, are the transport stream ID, the packet size,
and the total stream bit rate.
3-30 MTM400 MPEG Transport Stream Monitor User Manual
Page 79

Stream View
The view contains the following elements (more detailed descriptions follow):
Title Bar The title bar of the screen displays the name of the stream
under test (assigned on the Configuration Screen
(see page 3-76).
Transport Stream: The transport stream identity.
Packet Size: The transport stream packet size.
Stream Bit Rate: The total bit rate of the stream.
Hex Display If enabled, the Transport Stream ID and the program ID are
displayed in hex format. If disabled, they are displayed in
decimal format.
Table:
Program ID (ID)
: The program number.
Program Occupancy Status (State):*
Indicates the Program Occupancy test error state for the
program.
Program Bit Rate (Multiplex Occupancy):*
A graphical representation of the program bit rate. The bar
color indicates the error status of the program bit rate.
Superimposed on the bar are the Change Bar and (where set)
the limits (see Clear Limits below).
Program Bit Rate (Bit Rate)
:
The program bit rate in bits per second.
PMT Test: Shows the PMT Test result (see page 3-33).
Buttons:
Reset Change Bars *
Resets the Change Bars of all programs.
Reset Prog Occ Event *
Resets the proprietary Program Occupancy test normal state
(no error).
Clear Limits * Resets and disables the Bit Rate Limits of all programs.
* - only displayed if Bit Rate Testing (Option 05) is licensed for use.
MTM400 MPEG Transport Stream Monitor User Manual 3-31
Page 80

Stream View
Only administrators can adjust bit rate limits.
Bit Rates
The program bit rate (Bit Rate) shows the sum of the individual bit rates for all the
PIDs that make up the program.
NOTE. It is possible that in certain transport streams, different programs may
reference a single PID; for example, programs may reference one PCR PID. In
these cases, the PID bit-rate will be included in all the programs from which the
PID is referenced. Therefore the total bit-rate of all the programs may add up to
more than the total stream bit rate displayed at the top of the window.
Change Bar
The Change Bar indicates the variation of bit rates in each program. The ends of
the Change Bar show the maximum and minimum values of the bit rate since
monitoring started or since the change bars were last reset.
Change Bar
The Change Bar on all programs can be reset by selecting the
Reset Change Bars button at the top of the Programs screen.
Bit Rate Limits
For each program it is possible to set a minimum (
) and maximum ( ) bit rate
limit. If the incoming bit rate falls outside the values that have been set, an alarm is
indicated on the screen by a color change in the graphical bit rate bar; the Program
Occupancy test and state icon on the Tests view are also set. This test can also
activate the external alarm outputs. When enabled, the limits appear as in the
preceding diagram shown above.
Minimum Limit
Maximum Limit
3-32 MTM400 MPEG Transport Stream Monitor User Manual
Page 81

Stream View
The maximum and minimum bit rate limits are set in the Limits dialog. Click on
the program bar to open the dialog box:
Only users logged on as Administrator can adjust bit rate limits. Users logged on
as User can only view the limits.
The maximum and minimum values can be set either by using the appropriate
slider bar or by entering a value in the numeric field. Values are expressed in
kilobytes per second. The Enabled checkbox must be selected before the limit will
be implemented. To confirm the settings select the OK button; to discard any
changes, select the Cancel button.
The Bit Rate Limits of all programs in a stream can be disabled and reset by
selecting the Clear Limits button at the top of the Programs screen.
PMT Test
The PMT column shows the results of the PMT test (MPEG Test 1.5) for specific
programs; green indicates a pass, red indicates a fail, and yellow indicates a
previous fail. Normally the test is enabled for all of the programs in a stream, but
programs with known problems can be excluded by right-clicking the test button
and selecting Disable; the button is colored gray.
MTM400 MPEG Transport Stream Monitor User Manual 3-33
Page 82

Stream View
PIDs Screen
The PIDs screen provides an overview of the PIDs contained in a transport stream
sorted by program.
Figure 3-13: Stream view - PIDs
In this view, all the PIDs detected in the incoming transport stream are displayed.
The PIDs are grouped by program; PIDs not associated with specific programs are
displayed in numerical order below the program listings under the section title
Other PIDs in the Multiplex.
The view contains the following elements (a more detailed description follows
where necessary):
Title Bar The title bar of the screen displays the name of the stream
under test (assigned on the Configuration screen,
page 3-74).
Transport Stream: The transport stream identity.
Packet Size: The transport stream packet size.
3-34 MTM400 MPEG Transport Stream Monitor User Manual
Page 83

Stream View
Stream Bit Rate: The total bit rate of the stream.
Hex Display If enabled, the Transport Stream ID and the PID identities
are displayed in hex format. If disabled, they are displayed
in decimal format.
Test: Allows specific tests, selected from the drop-down list, to be
applied to all of the PIDs in the stream. The state of the test
is indicated for each PID by the Test icon. If a test is not
relevant to a PID, the test is disabled for that PID; the Test
icon indicates this.
The tests shown below are those that can be applied to each
PID where appropriate:
(See Test Selection, page 3-40)
Table
PID The PID number carrying the data.
Test Icon showing the state of the currently selected PID test:
Right-click this icon to open a popup menu that allows you
to reset the error, disable or enable monitoring of this event,
or adjust the parameters of the test.
MTM400 MPEG Transport Stream Monitor User Manual 3-35
Page 84

Stream View
Double-clicking the icon will disable/enable the event
monitoring.
Scrambled A key icon is shown adjacent to conditional access
tables, for example, EMM/ECM.
A padlock icon
is shown if the PID is scrambled.
Type The data type carried by the PID, for example, Video+PCR,
MPEG Audio.
Multiplex Occupancy
A graphical representation of the PID bit rate. The bar color
indicates the error status of the PID. Superimposed on the
bar are the Change Bar and (where set) the limits (see Clear
Limits below). The graphic is displayed in the color
according to whether there are any PID errors (if a set limit
has been exceeded).
Note that the graphical representation and section Title bar
is changed when PID Variability is selected (see Test
Selection, see page 3-40).
Bit Rate The PID bit rate in bits per second.
Buttons
Reset Change Bars Reset s the Change Bars of all programs.
Clear Limits * Resets and disables the Bit Rate Limits of all programs.
User PIDs Allows you to add PIDs to the displayed list.
Reset All Resets the selected test for all PIDs.
* - only displayed if Bit Rate Testing (Option 05) is licensed for use.
The Stream Bit Rate shows the sum of the individual PID bit rates that make up
the stream. The PID bit rate (Bit Rate) shown for each PID is that for the
individual PID.
Only users logged on as Administrators can adjust bit rate limits.
3-36 MTM400 MPEG Transport Stream Monitor User Manual
Page 85

Stream View
Change Bar
The variation of bit rate in each PID is indicated by a Change Bar (except when
PID Variability is selected). The ends of the Change Bar show the maximum and
minimum values of the bit rate since monitoring started or since the change bars
were last reset.
Change Bar
The Change Bar on all PIDs can be reset by selecting the Reset Change Bars
button at the top of the PIDs screen.
Bit Rate Limits
For each PID you can set a minimum (
) and maximum ( ) bit rate limit. If the
incoming bit rate falls outside the values that have been set, an alarm is indicated
on the screen by the graphical bit rate bar changing from green to red or yellow;
the PID Occupancy test on the Tests view is also set. This test can also activate the
external alarm outputs. When enabled, the limits appear as in the following
diagram:
Minimum Limit
Maximum Limit
MTM400 MPEG Transport Stream Monitor User Manual 3-37
Page 86

Stream View
The maximum and minimum bit rate limits are set in the Limits dialog. Click on
the program bar to open the dialog box:
The maximum and minimum values can be set either using the appropriate slider
bar or by entering a value in the numeric field. Values are expressed in kilobytes
per second. The Enabled checkbox must be selected before the limit will be tested.
The Bit Rate Limits of all PIDs in a stream can be disabled and reset by selecting
the Clear Limits button at the top of the PIDs screen.
User PIDs
You can add PIDs that are not automatically recognized in the stream to the
display. The additional PIDs will appear in the Other PIDs in the Multiplex
section of the display.
3-38 MTM400 MPEG Transport Stream Monitor User Manual
Page 87

Stream View
Adding a User PID.
1. From the PIDs screen, select User PIDs….
The User PIDs dialog box is displayed.
2. Enter the PID ID in the New PID: field.
The PID ID can be entered in either Hex (0xnnnn) or decimal (nnnn) format.
3. Select Add.
The PID ID will be displayed in the PIDs: list and subsequently in the PIDs
view. It will be displayed in decimal format.
Deleting a User PID.
1. From the PIDs screen, select User PIDs….
The User PIDs dialog box is displayed.
2. In the PIDs: list, highlight the PID to be deleted.
3. Select Delete.
The selected PID will be removed from the list and subsequently from the
main PIDs view.
MTM400 MPEG Transport Stream Monitor User Manual 3-39
Page 88

Stream View
Test Selection
The Test: drop-down list allows the user to select and apply specific tests to the
PIDs in the stream. Tests on those PIDs to which the selected test is not applicable
are disabled.
The following PID tests can be selected from the Test: drop-down list:
Any PID Error
PID Bit Rate *
PCR Repetition
PCR Discontinuity
PCR Accuracy
PCR Overall Jitter **
PCR Frequency Offset**
* Require Bit Rate Testing to be licensed (License Option 05, Table 1-2:
MTM400 options).
** Require PCR Testing to be licensed (see Table 1-2: MTM400 options).
The results of the tests are indicated by the Test icons. Where the test is
inapplicable, the icon will be white.
For most of the tests, the parameters applied to each PID can be varied by rightclicking on the Test state button and selecting the Parameters… option.
PCR Drift Rate **
PTS Repetition
PID Variability *
Missing PID
Unreferenced PID
Continuity
Discontinuity
Each of these tests and the associated parameters are described in the MTM400
MPEG Transport Stream Monitor Programmer Manual.
The results of tests applied here are not reflected in the PID Groups.
3-40 MTM400 MPEG Transport Stream Monitor User Manual
Page 89

Stream View
PID Groups Screen
PIDs can be grouped together to enable composite bit rate and test reporting of
user-selected PIDs, perhaps carrying similar information. Up to 32 PID Groups can
be formed. A maximum of 128 PIDs can be included in each of these 32 groups.
Figure 3-14: Stream view - PID groups
In this view, the PID Groups set up for the incoming transport stream are
displayed. PID Group editing is performed using this screen.
Only users logged on as Administrator can adjust bit rate limits and modify the
PID Groups.
The view consists of the following elements (a more detailed description follows
where necessary):
Title Bar The title bar of the screen displays the name of the stream
under test (assigned on the Configuration Screen, page 3-76).
Transport Stream: The transport stream identity.
Packet Size: The transport stream packet size.
MTM400 MPEG Transport Stream Monitor User Manual 3-41
Page 90

Stream View
Stream Bit Rate: The total bit rate of the stream.
Table
Each PID Group formed displays a title bar carrying the allocated name of the
group. Each PID Group displays the following information:
State Icon showing the state of the PID Group (whether the bit rate
limits are exceeded).
Multiplex Occupancy:
A graphical representation of the total bit rate of the PID Group.
The bar color indicates the error status of the PID Group.
Superimposed on the bar are the Change Bar and (where set) the
limits (see below). The graphic is displayed in the color
according to whether there are any PID Group errors (that a set
limit has been exceeded).
Bit Rate: The PID bit rate in bits per second.
Buttons
New PID Group…
Opens a new (empty) PID Group, after a name has been
allocated.
Delete PID Group…
Displays a list of all PID Groups and allows one or more to be
deleted.
Reset Change Bars
Resets the Change Bars of all programs.
Reset PID Group Occ Event
Resets all PID Group errors. Note that this also resets the
individual PID errors.
Clear Limits Resets and disables the Bit Rate Limits of all programs.
PIDs… (See PID Group Management, page 3-43.)
The Stream Bit Rate shows the sum of the individual PID bit rates that make up
the stream. The bit rate (Bit Rate) shown for each PID group, is the sum of the
grouped PID bit rates.
3-42 MTM400 MPEG Transport Stream Monitor User Manual
Page 91

Stream View
PID Group Management
This section describes how to add, edit, and remove PID Groups. Only an
Administrator can add and delete PID Groups.
Adding a New PID Group. PID Groups are created in three stages:
Identify the PIDs to be grouped.
Create a new, named PID Group.
Populate the new PID Group.
The procedure is as follows:
1. Use the PID screen to identify the PIDs to be grouped. The hex or the decimal
PID can be used.
2. In the PID Group screen, select New PID Group….
3. Enter the PID Group name.
Select OK. Selecting Cancel will end the PID Group creation.
MTM400 MPEG Transport Stream Monitor User Manual 3-43
Page 92

Stream View
4. The new PID Group is displayed in the PID Group screen:
The new PID Group is empty and must be populated with PIDs.
5. Select PIDs… from the new group title bar.
6. In the PIDs dialog box and in the New PID: field, enter the identity of one
PID in either hex (0xnnnn) or decimal (nnn) format.
7. Select Add.
The PID is added to the PIDs: field.
3-44 MTM400 MPEG Transport Stream Monitor User Manual
Page 93

Stream View
8. Repeat the previous steps until all the PIDs to be included in the group have
been added and are listed.
9. Select Close to close the dialog box. Display will begin immediately,
confirming that the PID Group is operational.
MTM400 MPEG Transport Stream Monitor User Manual 3-45
Page 94

Stream View
Editing a PID Group. To add or remove a PID from a PID Group, select PIDs… from
the PID Group title bar.
Delete removes the PID highlighted in the PIDs: field.
The PID is removed from the PIDs: field.
Add adds the PID identified in the New PID: field to the PID Group.
The PID is added to the PIDs: field.
Change Bar
The variation of bit rate in each PID is indicated by a Change Bar. The ends of the
Change Bar show the maximum and minimum values of the bit rate since
monitoring started or since the change bars were last reset.
Change Bar
The Change Bar on all PID Groups can be reset by selecting the
Reset Change Bars button at the top of the PID Groups screen.
3-46 MTM400 MPEG Transport Stream Monitor User Manual
Page 95

Stream View
Bit Rate Limits
For each PID Group, you can set a minimum (
) and maximum ( ) bit rate limit.
If the incoming bit rate falls outside the values that have been set, an alarm is
indicated on the screen by the graphical bit rate bar changing from green to red or
yellow; the corresponding State icon is also set to the correct color. This test can
also activate the external alarm outputs. When enabled, the limits appear as in the
following diagram:
Minimum Limit
Maximum Limit
The maximum and minimum bit rate limits are set in the Limits dialog box; click
on the program bar to open the dialog box:
The maximum and minimum values can be set either by using the appropriate
slider bar or by entering a value in the numeric field. Values are expressed in
kilobytes per second. The Enabled checkbox must be selected before the limit will
be implemented.
The Bit Rate Limits of all PID Groups can be disabled and reset by selecting the
Clear Limits button at the top of the PID groups screen.
MTM400 MPEG Transport Stream Monitor User Manual 3-47
Page 96

Stream View
PCR Jitter Screen
Real time analysis is performed on PCRs and displayed in graphical format. The
following options are available:
PCR Arrival
PCR Inaccuracy (PCR_AC)
PCR Overall Jitter (PCR_OJ)
PCR Drift Rate (PCR_DR)
PCR Frequency Offset (PCR_FO)
PTS Arrival
Selecting the PCR Jitter button displays a pop-up menu from which the graph
type can be selected.
3-48 MTM400 MPEG Transport Stream Monitor User Manual
Page 97

Stream View
The PCR to be displayed can then be selected in the Select PCR PID dialog box.
PID numbers are displayed in decimal and hex form.
Common Elements
Statistical information for each graph is shown at the bottom of each graph. When
enabled, the View Limits checkbox ensures that the parameter limits are shown on
the Y-axis. When disabled, the data is allowed to expand to fill the available
screen. Limits are set using the parameter function on the Test and PID screens.
PCR Inaccuracy (PCR_AC)
The PCR Inaccuracy graph shows the difference between the actual and expected
values for each PCR on the y-axis. Expected PCR values are calculated from the
byte index of the PCR and the overall bitrate derived from the PCR.
MTM400 MPEG Transport Stream Monitor User Manual 3-49
Page 98

Stream View
Figure 3-15: Stream view - PCR graph - PCR inaccuracy
The MPEG-2, DVB and ATSC standards specify that PCRs must be within
±500 ns of the actual transport rate. By default, the scale is set to ±500 ns. If the
Inaccuracy in any of the displayed PIDs is greater than ±500 ns, the y-axis is
drawn to show the complete range of values as full scale.
The Maximum PCR Accuracy Error can be adjusted for all PIDs as follows:
Tests screen Î 2.4 PCR Accuracy parameter (right-click) Î Max PCR
accuracy error.
For individual PIDs:
PIDs screen Î Test: select PCR Accuracy Î individual PID parameter
(right-click) Î Max PCR accuracy error.
Right-click on the graph and set the limit for each PID.
PCR Arrival
The PCR Arrival graph provides a display of the time interval between successive
PCRs. The interval is displayed on the y-axis. By default (with the View Limits
checkbox enabled) the y-axis scale shows the conformance thresholds for the
DVB, ATSC or MPEG-2 standards.
3-50 MTM400 MPEG Transport Stream Monitor User Manual
Page 99

Stream View
Figure 3-16: Stream view - PCR graph - PCR arrival
The PCR Arrival graph provides a display of the time interval between successive
PCRs, during the last 256 PCRs. The interval is displayed on the y-axis. Points are
color-coded with respect to the Maximum Repetition Period set in DVB test 2.3
(The DVB default value is 40 ms). Points are plotted in blue when they fall within
the specified period. Any points that exceed the interval are plotted in red. If the
interval exceeds the limits displayed on the screen, the scale is adjusted
automatically as necessary to include the maximum displayed values.
The PCR Maximum Repetition Interval can be adjusted for individual PIDs as
follows:
PIDs screen Î Test: select PCR Repetition Î individual PID parameter
(right-click) Î PCR max repetition interval.
Right-click on the graph and set the limit for each PID.
PCR Overall Jitter (PCR_OJ)
The PCR Overall Jitter graph shows the difference between the actual value of the
PCR (expressed as a time) and its expected value based on its measured arrival
time.
MTM400 MPEG Transport Stream Monitor User Manual 3-51
Page 100

Stream View
Figure 3-17: Stream view - PCR graph - PCR overall jitter
The Maximum PCR Accuracy Error can be adjusted for all PIDs as follows:
Tests screen Î PCR Tests section Î PCR Overall Jitter (PCR_OJ)
parameter (right-click) Î Max PCR overall jitter.
For individual PIDs:
PIDs screen Î Test: select PCR Jitter Î individual PID parameter (right-
click) Î Max PCR overall jitter.
Right-click on the graph and set the limit for each PID.
3-52 MTM400 MPEG Transport Stream Monitor User Manual
Test Equipment Depot - 800.517.8431 - 99 Washington Street Melrose, MA 02176 - FAX 781.665.0780 - TestEquipmentDepot.com
 Loading...