

Page 1

Technical Reference
MTM400 and MTM400A
MPEG Transport Stream Monitors
RUI v3.x Upgrade
077-0174-00
www.tektronix.com
*P077017400*
077017400
Page 2

Copyright © Tektronix. All rights reserved. Licensed software products are owned by Tektronix or its subsidiaries or
suppliers, and are protected by national copyright laws and international treaty provisions.
Tektronix products are covered by U.S. and foreign patents, issued and pending. Information in this publication supercedes
that in all previously published material. Specifications and price change privileges reserved.
TEKTRONIX, TEK, and FlexVuPlus are registered trademarks of Tektronix, Inc.
Contacting Tektronix
Tektronix, Inc.
14200 SW Karl Braun Drive
P.O. Box 500
Beaverton, OR 97077
USA
For product information, sales, service, and technical support:
H In North America, call 1-800-833-9200.
H Worldwide, visit www.tektronix.com to find contacts in your area.
Page 3

Table of Contents
User Interface Overview 1. . . . . . . . . . . . . . . . . . . . . . . . . . . . . . . . . . . .
User Interface Components 2. . . . . . . . . . . . . . . . . . . . . . . . . . . . . . . . . . . . . . . .
FlexVuPlus Display 4. . . . . . . . . . . . . . . . . . . . . . . . . . . . . . . . . . . . . . . . . . . . . . .
Analysis Views 5. . . . . . . . . . . . . . . . . . . . . . . . . . . . . . . . . . . . . . . . . . . . . . . . . .
Tear-off Views 7. . . . . . . . . . . . . . . . . . . . . . . . . . . . . . . . . . . . . . . . . . . . . . . . . .
Configuration 8. . . . . . . . . . . . . . . . . . . . . . . . . . . . . . . . . . . . . . . . . . . . . . . . . . .
User Documentation 8. . . . . . . . . . . . . . . . . . . . . . . . . . . . . . . . . . . . . . . . . . . . . .
Upgrades 9. . . . . . . . . . . . . . . . . . . . . . . . . . . . . . . . . . . . . . . . . . . . . . . . . . . . . . .
RUI Control Equivalents 11. . . . . . . . . . . . . . . . . . . . . . . . . . . . . . . . . . .
Reverting the RUI 17. . . . . . . . . . . . . . . . . . . . . . . . . . . . . . . . . . . . . . . . .
Requirements 17. . . . . . . . . . . . . . . . . . . . . . . . . . . . . . . . . . . . . . . . . . . . . . . . . . .
RUI Version 3.x to Version 3.0 Procedure 18. . . . . . . . . . . . . . . . . . . . . . . . . . . . .
RUI Version 3.0 to Version 2.6.1 Procedure 21. . . . . . . . . . . . . . . . . . . . . . . . . . .
Command Line Firmware Downgrade 24. . . . . . . . . . . . . . . . . . . . . . . . . . . . . . . .
RUI v2.6.1 Product Documentation 26. . . . . . . . . . . . . . . . . . . . . . . . . . . . . . . . . .
RUI v3.0 Product Documentation 26. . . . . . . . . . . . . . . . . . . . . . . . . . . . . . . . . . .
Version 00e
MTM400 and MTM400A RUI v3.x Upgrade Technical Reference
i
Page 4

Table of Contents
Version 00e
ii
MTM400 and MTM400A RUI v3.x Upgrade Technical Reference
Page 5

User Interface Overview
This document introduces you to the MTM400A user interface and explains the
differences between the MTM400 RUI and the MTM400A RUI.
The MTM400A MPEG Transport Stream Monitor is functionally similar to the
MTM400 MPEG Transport Stream Monitor. However, the MTM400 was based
on Microsoft Java technology, for which Microsoft is withdrawing support. The
MTM400A is based on Sun Java, and is more closely aligned with the MTS400
MPEG Test System.
The MTM400A remote user interface (RUI) looks similar to the MTM400 RUI,
but the MTM400A RUI provides a rich, multi-layered user interface that allows
structured access to all information.
Differences between the two RUIs include:
H The MTM400 hot spot view, featuring device and stream buttons is no
longer displayed. The device and stream features have been integrated into
the single MTM400A display.
H In the MTM400, the button bar was the primary means of moving between
information screens. In the MTM400A, although the button bar is still
present, screens are also directly accessible using tabbed pages.
H The button bar can be displayed on its own to provide a high-level view of
the error state of the monitored stream. The bar can also be customized by
hiding and revealing buttons.
H For detailed analysis and specific monitoring situations, the button bar can
be hidden, leaving only the main application view visible.
H Detail views in the main application can be displayed as separate windows
using the tear-off function.
Version 00e
MTM400 and MTM400A RUI v3.x Upgrade Technical Reference
1
Page 6

User Interface Overview
User Interface Components
Figure 1 shows the major components of the user interface implemented in the
MTM400A and version 3.x of the RUI.
The menu bar, toolbar, and status bar, while visually different, contain options
and buttons similar in function to those in the MTM400.
The main viewing areas of the window is divided into two areas: the Button Bar
and the Main Application View.
Figure 1: MTM400A user interface components
2
Version 00e
MTM400 and MTM400A RUI v3.x Upgrade Technical Reference
Page 7

User Interface Overview
Button Bar
Main Application View
RUI Navigation
The MTM400 button bar showed monitoring status and displayed a corresponding view when clicked. The MTM400A RUI copies this idea, but rearranges the
buttons into a more intuitive order. The MTM400 Stream and Device hot spot
buttons become Monitoring and Device buttons in the MTM400A RUI.
The buttons from the MTM400 Stream window have been streamlined and
grouped under the MTM400A Monitoring button. The buttons from the
MTM400 Device window have been removed and replaced by a node in the
Analysis Tests view.
In the main application view, two top-level views are selected using tabs:
FlexVuPlus and Analysis. You can customize the FlexVuPlus display to contain
the analysis views of your choice.
The main analysis views are Programs, Tests, SI/PSI (tables), PIDs, Packets, and
Interface (when an optional interface card is installed). The analysis views are
selected using the summary tabs.
Each analysis view contains a tree view and a detail view. The content of the
detail view is dependent on which node is selected in the tree view.
The MTM400 RUI navigation was simple, allowing the right view to change in
accord with the button being clicked.
The MTM400A RUI has comprehensive navigation possibilities that use the
button bar, context menus, hyperlinks, and double-clicks.
Version 00e
MTM400 and MTM400A RUI v3.x Upgrade Technical Reference
3
Page 8
User Interface Overview
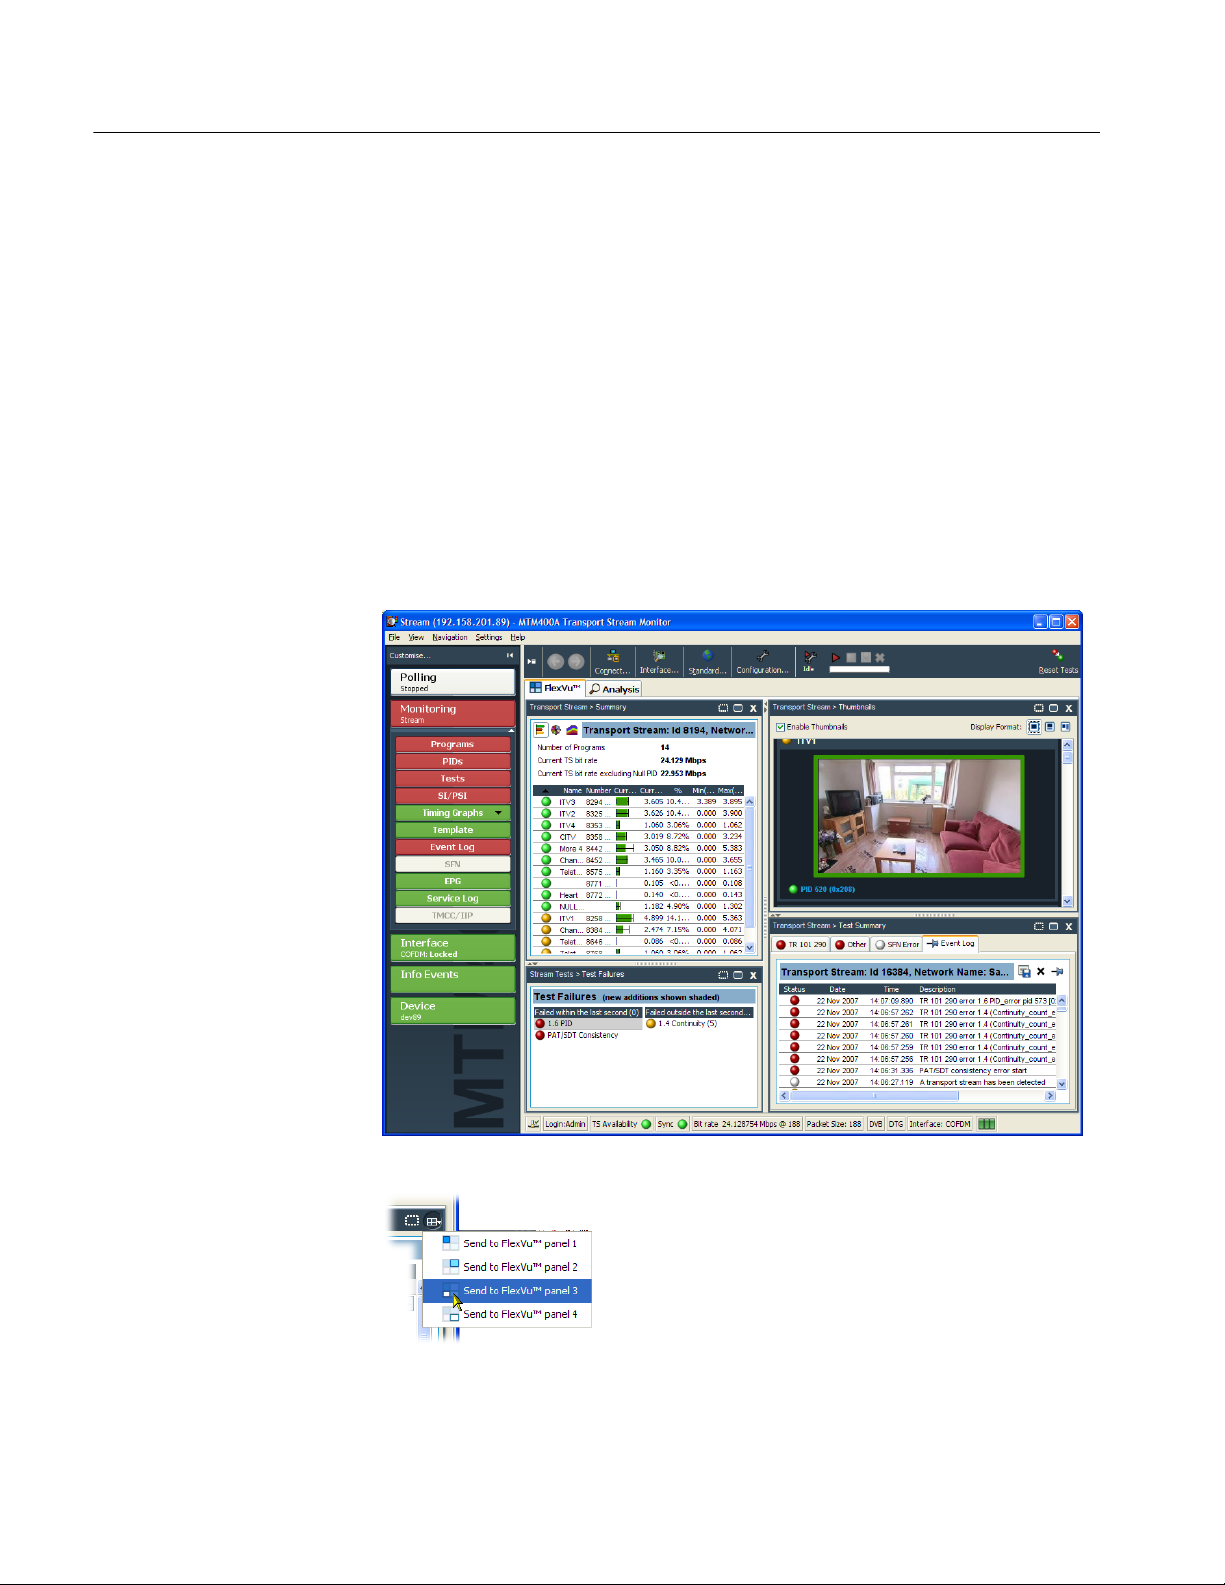
FlexVuPlus Display
The FlexVuPlus display philosophy (first introduced in the Tektronix WVR600
Waveform Rasterizer), is now adapted for the MTM400A. This gives users up to
four concurrent views of a monitored signal and the flexibility to configure each
of the windows independently. Each of the FlexVuPlus views is derived from
views available under the Analysis tab. FlexVuPlus setups will be remembered
between MTM400A sessions.
With a virtually unlimited variety of stream monitoring displays from which
users can choose, this exceptional flexibility enables the MTM400A to perform
like a “4-in-1 monitor” on a single incoming stream. The FlexVuPlus display
enables users to easily configure their MTM400A to provide a monitoring
solution that is optimized for their specific requirement.
Present on all Analysis detail views, the FlexVuPlus
selection icon is used to extract views to the
FlexVuPlus panels.
Version 00e
4
MTM400 and MTM400A RUI v3.x Upgrade Technical Reference
Page 9
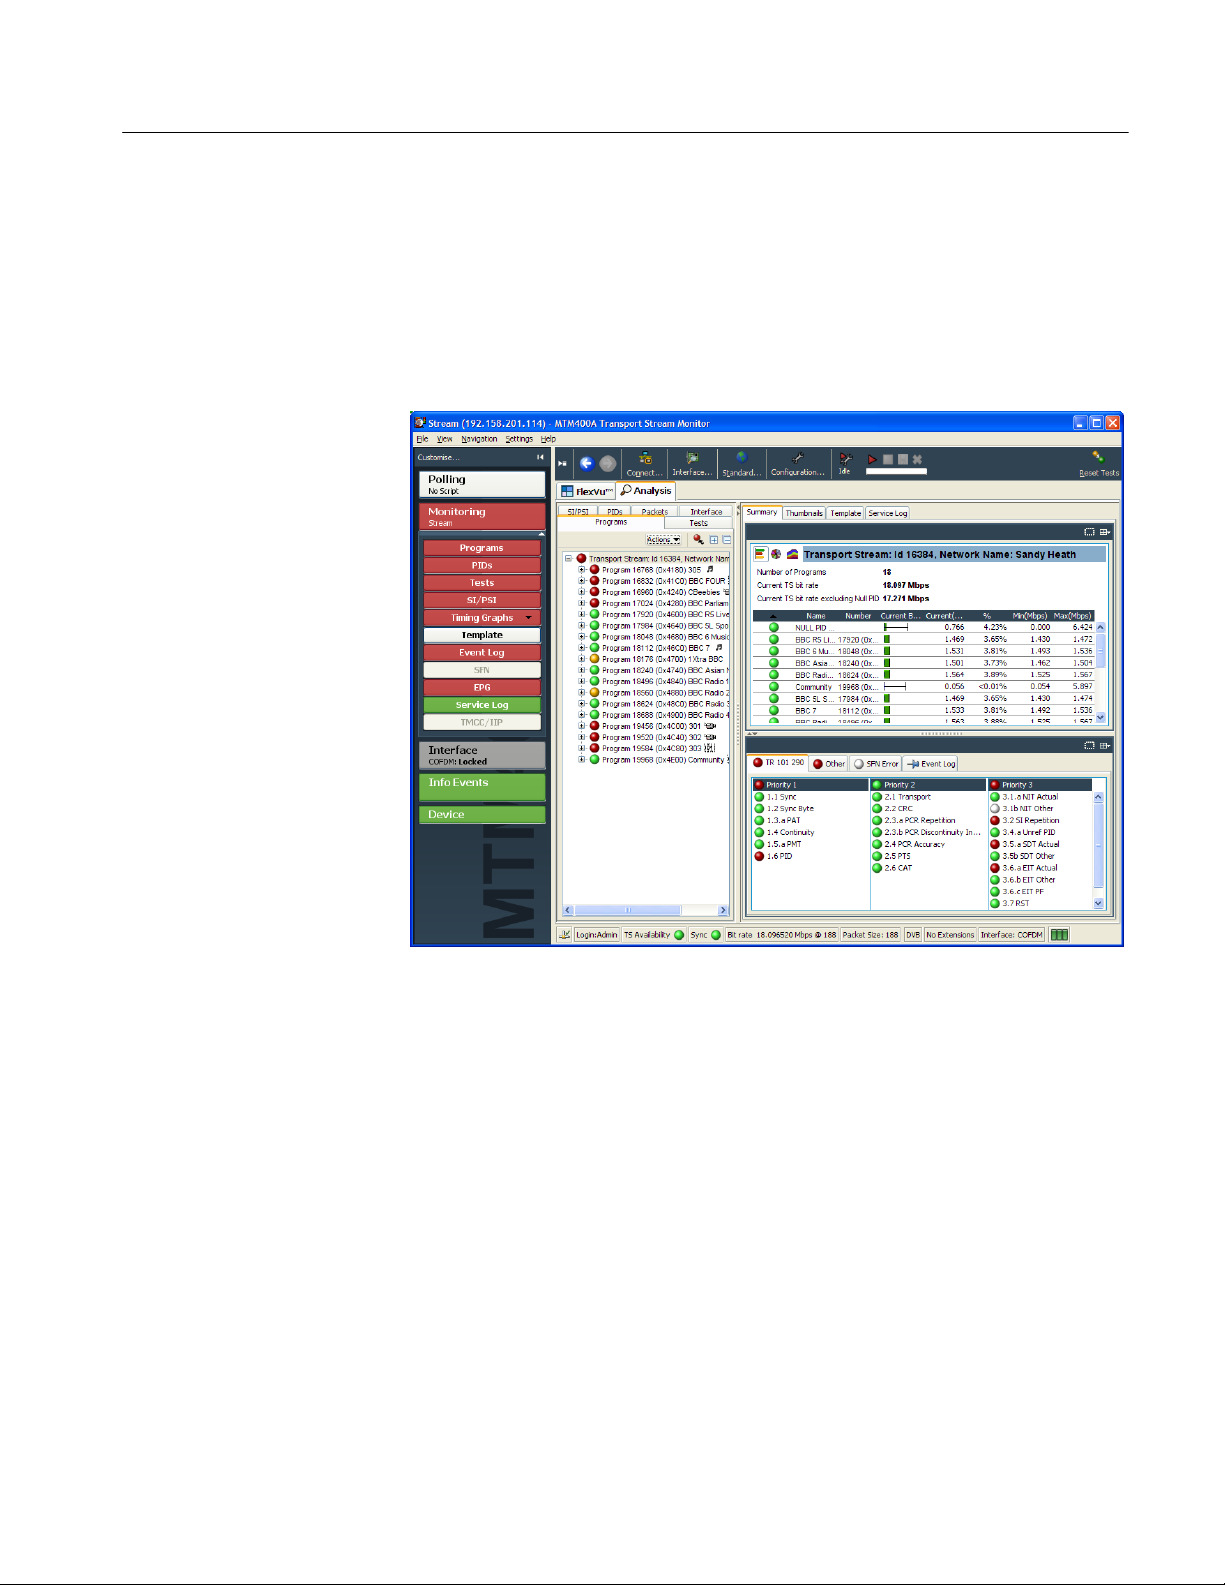
Analysis Views
User Interface Overview
The MTM400A Analysis views each use a single tree view with different
context-sensitive detail views contained within tabbed frames. From the main
window, you can access the following views: Program, Tests, Tables, PID,
Packets, and Interface.
Programs View
The Program view provides a fast overview of the transport stream contents in
terms of program content, bit rated use by each program, and TR 101 290 test
results. Red, amber and green LEDs highlight errors associated with each
program, or element of a program, within the transport stream. Red LEDs
indicate that there are current errors in the stream, amber LEDs indicate that
errors have occurred but are now clear, and green LEDs indicate that no errors
have been detected.
Errors that are detected at lower levels in the program stream hierarchy propagate
up to the highest level. This allows you to monitor all of the programs in the
stream at a high level and then quickly go to lower levels as necessary to locate a
problem.
The contents of the MTM400A Programs view are broadly equivalent to the
following MTM400 screens: Stream view: Summary, Detail (All Programs),
Service and Event Logs, SFN, TMCC/IIP, Templates.
Version 00e
MTM400 and MTM400A RUI v3.x Upgrade Technical Reference
5
Page 10

User Interface Overview
Tests View
SI/PSI (Tables) View
With the Tests view you can identify the tests that are signaling errors in a
monitored stream. The error log is automatically filtered by the selected test, and
can also be filtered by Packet Identifier (PID). In addition to the standard first,
second, and third priority tests included in TR 101 290 standard, tests are
available for Program Clock Reference (PCR) jitter and program/PID bit rate. A
variability test enables you to test the changes in the bit rate of a specific PID,
and there are many tests that are specific to ISDB-T and ISDB-S streams.
Informational events are also reported, including interface card warnings and
polling events.
Also displayed in the Tests view are tests related to the MTM400A monitor, for
example, the system card temperature.
The contents of the MTM400A Tests view are broadly equivalent to the
following MTM400 screens: Device View: Status, Device Log; Stream view:
Tests, Event Log.
The SI/PSI (Tables) view displays the service information tables that have
occurred in the analyzed stream that comply with the selected digital video
standard. This includes MPEG-specific program information, DVB service
information (SI), and ATSC (PSIP), ISDB program, and system protocol
information. The tables are grouped together by function and hyperlinks enable
you to quickly access related information within other tables. The SI/PSI tables
repetition rate graphs and section data are available on additional tabs.
PIDs View
The contents of the MTM400A SI/PSI view are broadly equivalent to the
following MTM400 screens: Stream view: SI graphs and tables.
The PID view displays information about all of the PIDs found in the transport
stream. When you select the transport stream, the associated summary view
provides a PID-oriented overview of the transport stream, displaying the relative
data rates of all of the PIDs contained within the stream. The information can be
displayed as either a bar chart or as a pie chart. Pop up menus enable fast limit
selection and links.
Each PID is associated with a number of tests. When one or more tests fail, each
failed test will be listed under the relevant PID. Select a specific PID to display a
summary of all the associated tests. Select a specific test to display the Event
Log and Parameters for only that test.
The contents of the MTM400A PIDs view are broadly equivalent to the
following MTM400 screens:
Stream view: PIDs, PID groups, PCR timing graphs.
Version 00e
6
MTM400 and MTM400A RUI v3.x Upgrade Technical Reference
Page 11

User Interface Overview
Packets View
Interface View
In DVB mode, the Packets view displays SFN (single frequency network) data if
detected in the stream. In ISDB-T mode, this view displays ISDB-T information
packets (IIPs) and TMCC information, if detected in the stream.
The contents of the MTM400A packets view are broadly equivalent to the
following MTM400 screens: Stream view: SFN and TMCC.
The Interface view provides a central location for information related to the IP
and RF interface cards (where installed).
H Test results
H Graphical representation of specific IP and RF card measurements
H IP and RF card readings and control settings
The graphical views display a selection of graphs of instantaneous measurements
and measurement trends. Trend graphs use accumulated readings to represent
trends in selected readings for up to a week. Also available are an Event Log and
a Parameter view.
The Interface tab is displayed only when an interface card is installed; only one
interface card at a time can be installed.
Tear-off Views
The contents of the MTM400A interface view are broadly equivalent to the
following MTM400 screens: Stream view: Configuration (interface) and Input
Card.
The ability of the MTM400 to display multiple detail views at the same time is
replicated in the MTM400A using the tear-off function. Any detail view
displaying the tear-off icon shown below can be displayed as a separate window.
The tear-off window will continue to be updated independently of the main
application. The displayed content can also be modified independently of the
main display.
Tear-off icon
Version 00e
MTM400 and MTM400A RUI v3.x Upgrade Technical Reference
7
Page 12

User Interface Overview
Configuration
All configuration elements, including stream, parameters, device, interface, and
display, previously distributed throughout the MTM400 user interface, are now
combined in a single dialog box that can be accessed from the menu bar or the
toolbar.
User Documentation
Table 1 lists the user documentation available for the MTM400A monitor.
Table 1: MTM400A product documentation
Document title Tektronix part number Description
Quick Start User Manual 071-2492-xx (English)
071-2493-xx (Japanese)
071-2632-xx (German)
Contains installation information and high-level operational
overviews
Release Notes 077-0181-xx Contains information about known operational issues
Technical Reference 077-0175-xx Contains in-depth operational information
Specifications and Performance
Verification Technical Reference
Test Parameter and Configuration File
Technical Reference
Programmer Manual 077-0178-xx Contains syntax information about remote control
Declassification and Security
Instructions
077-0176-xx Contains the product specifications and a performance
verification procedure
077-0177-xx Contains information about test parameters and configura-
tion files
commands
077-0179-xx Contains information about how to remove user proprietary
information from the instrument
Version 00e
8
MTM400 and MTM400A RUI v3.x Upgrade Technical Reference
Page 13

User Interface Overview
Upgrades
Table 2 lists the ordering information that has changed for product upgrades.
Table 2: Upgrade ordering information
MTM400 upgrades (old) MTM400A upgrades (new) Description
MTM4UP Opt. 01 MTM4UP 01 Triggered recording capability up to 160 MB
MTM4UP Opt. 02 MTM4UP 02 Transport stream service information analysis (PSI/SI/PSIP/ARIB view)
MTM4UP Opt. 03 MTM4UP 03 Template testing (for user-defined service plan testing)
MTM4UP Opt. 04 MTM4UP 04 In-depth PCR analysis with graphical result views
MTM4UP Opt. 05 MTM4UP 05 Bit rate testing functionality
MTM4UP Opt. 06 MTM4UP 06 Service logging
MTM4UP Opt. 07 MTM4UP 07 Polling
MTM4FCF MTM4UP CF COFDM interface
MTM4FGE MTM4UP GE Ethernet Interface With 10/100/1000Base-T; RJ-45 Electrical Port
MTM4FGE Opt. SX MTM4UP SX 1000Base-SX Short Wavelength Optical port with LC connector
(Multi-Mode 850 nm)
MTM4FGE Opt. LX MTM4UP LX 1000Base-LX Long Wavelength Optical port with LC connector
(Single Mode 1310 nm)
MTM4FGE Opt. ZX MTM4UP ZX 1000Base-ZX Optical port with LC connector
(Single Mode 1550 nm)
MTM4FQA MTM4UP QA QAM Annex A interface
MTM4FQB2 MTM4UP QB2 QAM Annex B Level 1 and Level 2 interface
MTM4FEP MTM4UP EP 8PSK/QPSK interface
MTM4FQC MTM4UP QC QAM Annex C interface
MTM4FVS MTM4UP VS 8VSB Interface
MTM4FEPIFC MTM4UP IFC One-time install of all selected options and calibration for one product
MTM4FGEIFC
MTM4FQB2IFC
MTM4FQCIFC
MTM4FVSIFC
MTM4FCFIFC
MTM4FQPIFC
MTM4FQAIFC
Version 00e
MTM400 and MTM400A RUI v3.x Upgrade Technical Reference
9
Page 14

User Interface Overview
10
Version 00e
MTM400 and MTM400A RUI v3.x Upgrade Technical Reference
Page 15

RUI Control Equivalents
Table 3 describes the control equivalents between the MTM400A RUI and the
MTM400 RUI.
Table 3: RUI control equivalents
MTM400 RUI controls
Button bar Button / Field
Summary Pie Chart and Test Summary Click the Programs button in the button bar
Detail All PIDs Click the PIDs button in the button bar
SI Tables Click the PIDs button in the button bar
Program… Click the Programs button in the button bar
MTM400A RUI equivalent controls
Select the Pie Chart button on the right hand Summary tab
Select the Pie Chart button on the right hand Summary tab
Select the SI/PSI PIDs node in the PIDs tree
Select the Pie Chart button on the right hand Summary tab
Select the desired Program
Select the Pie Chart button on the right hand Summary tab
Tests Status Click the Tests button in the button bar
Status is shown in the Tests tree and right hand panes
Set Alarms Click the Tests button in the button bar
Right click desired test to show menu
Select required Trigger Action from menu
Parameters… Click the Tests button in the button bar
Right click desired test to show menu
Select Edit Parameters… from menu
Note that not all tests have editable parameters
Custom Tests List This feature is not implemented in the MTM400A RUI
Info Status Click the Info Events button in the button bar
Status is shown in the tree and right hand panes
Set Alarms Click the Tests button in the button bar
Right click desired event to show menu
Select required Trigger Action from menu
Version 00e
MTM400 and MTM400A RUI v3.x Upgrade Technical Reference
11
Page 16

RUI Control Equivalents
Table 3: RUI control equivalents (Cont.)
MTM400 RUI controls
Button bar Button / Field
Programs Histogram view Click the Programs button in the button bar
Set Program Bit rate limits Click the Programs button in the button bar
Clear Limits Click the Programs button in the button bar
Reset Change Bars Click the Programs button in the button bar
MTM400A RUI equivalent controls
Select the Histogram Chart button on the right hand Summary tab
Right click the required program to show menu
Select Set Bit Rates Limits… from menu
Right click the required program to show menu
Select Clear Bit Rates Limits from menu
Right click the required program to show menu
Select Reset Range Bars from menu
PIDs Histogram View Click the PIDs button in the button bar
Select the Histogram button on the right hand Summary tab
Filter on test Click the Tests button in the button bar
Select the desired test in the tree
Associated PIDs view on the right shows PIDs for the test
Set PID bit rate limits Click the PIDs button in the button bar
Right click the required PID to show menu
Select Set Bit Rates Limits… from menu
Clear PID bit rate limits Click the PIDs button in the button bar
Right click the required PID to show menu
Select Clear Bit Rates Limits from menu
Set per PID Parameters Click the PIDs button in the button bar
Select the required PID
In right hand Associated Tests view, right click test and select Edit
Parameters… from menu
Reset Change Bars Click the PIDs button in the button bar
Right click the required PID to show menu
12
Select Reset Range Bars (all PIDs) from menu
Version 00e
MTM400 and MTM400A RUI v3.x Upgrade Technical Reference
Page 17

Table 3: RUI control equivalents (Cont.)
MTM400 RUI controls
Button bar Button / Field
PIDs (continued) Manage User PIDs… Click the PIDs button in the button bar
Program PID grouping Click the Programs button in the button bar
PID Groups PID Group Management Click the PIDs button in the button bar
PCR Jitter PID x Timing graphs Click the Timing Graphs button in the button bar
MTM400A RUI equivalent controls
Right click the User PIDs node in the PIDs tree to show menu
Select Add User PID
Select the Program node
PIDs are grouped in tree and in Histogram view
Select the PID Groups node
Group Management is via the right hand view and the context menus for the
PID Group nodes in the tree
RUI Control Equivalents
Select the required PID from the menu
Timing Graphs tab shown on the right hand side
SFN SFN View Click the SFN button in the button bar
Right hand side shows SFN data
Note: This is only available when there is SFN data in the stream
TMCC TMCC Summary View Click the TMCC/IIP button in the button bar
Select the Transport Stream node in the tree
Select the TMCC/IIP tab on right hand side
Note: This is only available when there is TMCC data in the stream
SI Graphs SI Graphs for Table x Click the SI/PSI button in the button bar
Select the desired table in the tree
Select the SI Repetition Graphs tab on the right hand side
SI Tables SI Tree view Click the SI/PSI button in the button bar
The SI/PSI tree structure is shown in the tree
Template Click the Template button in the button bar
Right hand side shows Template data
Note: This is only available when Template Checking is enabled
Recording Click the Recording Settings button on the toolbar (to the right of the
Configuration… button)
The configuration dialog is opened at the recording page
Recording Status Status is shown on the toolbar and on the Recording page
Version 00e
MTM400 and MTM400A RUI v3.x Upgrade Technical Reference
13
Page 18

RUI Control Equivalents
Table 3: RUI control equivalents (Cont.)
MTM400 RUI controls
Button bar Button / Field
Log Event Log Click the Event Log button in the button bar
MTM400A RUI equivalent controls
Right hand side shows Event Log at bottom
Note: Filtered event logs are present when clicking on each test in the Tests
tree
Change displayed timezone of log
entries
Download and Clear Log Click the Event Log button in the button bar
Config Standard and Region Click the Standard… button on the toolbar
Interface (select/configure) Click the Interface… button on the toolbar
Interface (lock) Displayed as text on Interface button
Stream Name Click the Configuration... button on the toolbar
Template Checking Click the Configuration... button on the toolbar
Maintenance Mode Click the Configuration... button on the toolbar
Click the Configuration... button on the toolbar
Select the Preferences page
Edit the Timezone for timestamp display field
Right hand side shows Event Log at bottom
Download and Clear buttons are above log entries
Select the standard and/or region
Use the dialog to select channels and edit parameters
Select the Stream page
Select the Stream page
Select the Stream page
Configuration Slot management Click the Configuration... button on the toolbar
Select the Slot Management page
Scheduling management Click the Configuration... button on the toolbar
Select the Schedule Management page
Enable Thumbnails Click the Configuration... button on the toolbar
Select the Stream page
SI Parameter Processing (ISDB only) Click the Configuration... button on the toolbar
Select the Stream page
Service Log Status and Management Click the Service Log button in the button bar
The service log view is shown on the right hand side
14
MTM400 and MTM400A RUI v3.x Upgrade Technical Reference
Version 00e
Page 19

Table 3: RUI control equivalents (Cont.)
MTM400 RUI controls
Button bar Button / Field
Polling Polling Channel List Click the Polling button in the button bar
Channel configuration Click the Polling button in the button bar
Thumbnails Click the Programs button in the button bar
MTM400A RUI equivalent controls
The Polling window is displayed containing the selected channels
The Polling window is displayed containing the selected channels
Select the Configure button
Press OK to use the currently defined presets in the interface dialog as the
polling channels
Select the Thumbnails tab on the right hand side
Note: Thumbnails can also be viewed for individual programs and for all
PIDs
RUI Control Equivalents
Input Card Graphs Click the Interface button in the button bar
Select the Graphs tab
Select the Add Graph button and select desired graph
Controls Click the Interface… button on the toolbar
In the dialog, edit the parameters for the desired preset, press Apply to see
the effects without closing the dialog.
Readings Click the Interface button in the button bar
Select the Graphs tab
Readings is displayed on the right hand side of the tab
Note: This readings table can be shown in a floating or torn−off window
Version 00e
MTM400 and MTM400A RUI v3.x Upgrade Technical Reference
15
Page 20

RUI Control Equivalents
16
Version 00e
MTM400 and MTM400A RUI v3.x Upgrade Technical Reference
Page 21

Reverting the RUI
You can use the following procedure to replace the RUI on your instrument with
RUI version 2.6.1. You would do this if you have an MTM400A monitor, or an
MTM400 monitor that has been upgraded to RUI version 3.x, and you want to
use the previous version of the RUI.
CAUTION. You must revert the RUI to version 3.0 before reverting to version
2.6.1. If you attempt to revert the RUI version directly from version 3.1 or above
to version 2.6.1, the process may fail.
As an alternative to using the RUI, you can use the command line firmware
upgrade program supplied on the MTM400A Application Firmware CD-ROM,
see page 24.
CAUTION. If you have the GE option (GbE interface) installed, you must use the
Command Line Firmware Upgrade process, page 24. For other interface
options, you can use either upgrade process.
Requirements
To perform this procedure, you need the the following files:
RUI version 2.6.1 firmware file - MTM400 v2.6.1 build 03.hex
RUI version 3.0.060 firmware file - MTM400 v3.0.060 build 702.hex
These files are available on the Tektronix Web site (www.tektronix.com/software). They are also provided on the application firmware CD that was shipped
with your monitor:
H MTM400 (Tektronix part number 063-3719-07)
H MTM400A (Tektronix part number 063-4136-xx)
NOTE. In this section the content of dialog boxes may change depending on the
RUI version. However, the dialog box titles and the procedures described are
accurate.
Version 00e
MTM400 and MTM400A RUI v3.x Upgrade Technical Reference
17
Page 22

Reverting the RUI
RUI Version 3.x to Version 3.0 Procedure
The process for reverting the firmware version of the instrument is initiated from
the initial Connect to MTM Device dialog box.
CAUTION. To prevent software problems, do not open the Connect to MTM
Device dialog box from the Connect button in the MTM400A RUI toolbar.
1. On a networked PC, launch Microsoft Internet Explorer.
2. In the Web browser address bar, enter the IP address or network name of the
MTM400 or MTM400A monitor (see Figure 2), for example:
http://TSMonitor01 or http://192.158.201.105.
After you press the Enter key, a Java applet is downloaded from the the
MTM400A monitor and launched.
3. In the Connect to MTM Device dialog box, select the Administrator Login
Type from the drop-down list, and then enter the password.
4. Click Upload Firmware to open the Upload Device Firmware dialog box.
18
Figure 2: Connecting to the instrument
Version 00e
MTM400 and MTM400A RUI v3.x Upgrade Technical Reference
Page 23

Reverting the RUI
5. In the Upload Device Firmware dialog box (see Figure 3), enter the path and
name of the firmware file or use the Browse button to locate and select the
firmware file - MTM400 v3.0.060 build 702.hex.
C:\MTM400 v2.6.1 build 03.hex
Figure 3: Upload Device Firmware dialog box − typical
6. In the Upload Device Firmware dialog box, click Start to initiate the
firmware installation.
7. When the firmware upload is complete, a Firmware upload complete
message is displayed (see Figure 4).
As stated in the message, the uploaded firmware will be checked, and if
valid, reprogramming of the instrument will start. The reprogramming
process can take up to fifteen minutes.
CAUTION. To prevent software problems, do not remove power from the
instrument during reprogramming.
Version 00e
MTM400 and MTM400A RUI v3.x Upgrade Technical Reference
19
Page 24

Reverting the RUI
GbE Interface
Confirmation
Figure 4: Firmware upload complete message - typical
8. When reprogramming is complete, close the RUI, and if necessary, close the
associated Web browser window.
If you are reverting the firmware to version 3.0 and you have a GbE card
installed (Option GE), it will not be listed in the Configure Interface dialog box
until the device (MTM400A) has been reset.
1. Allow sufficient time for the reprogramming to complete; this can be up to
30 minutes.
2. Open the RUI as described previously.
3. Select Configuration from the toolbar.
4. Select Device > Reset Device in the Configuration dialog box.
When complete, the GbE interface card option will be listed in the Configure
Interface dialog box drop-down menu.
20
Version 00e
MTM400 and MTM400A RUI v3.x Upgrade Technical Reference
Page 25

RUI Version 3.0 to Version 2.6.1 Procedure
5. Repeat steps 1 to 8 using the RUI version 2.6.1 firmware file, MTM400
v2.6.1 build 03.hex.
6. Launch Microsoft Internet Explorer.
NOTE. Before the MTM400 RUI can be opened, you must disable the Java
Runtime Environment in the Internet Explorer. If you attempt to open the
MTM400 RUI before disabling the Java Runtime Environment, the following
message will be displayed.
Reverting the RUI
7. From the Internet Explorer menu bar, select Tools > Internet Options..., and
then select the Advanced tab.
8. Locate the Java (Sun) node, and then clear the Use JRE check box (see
Figure 5).
Version 00e
MTM400 and MTM400A RUI v3.x Upgrade Technical Reference
21
Page 26

Reverting the RUI
Figure 5: Internet Options dialog box
9. Close the Internet Options dialog box.
10. Close and restart Internet Explorer.
11. In the Web browser address bar, enter the IP address or network name of the
MTM400 or MTM400A monitor.
NOTE. After you have disabled the Java Runtime Environment, if you still receive
the message (Microsoft Java Virtual Machine required to run application), you
may need to reinstall the Microsoft Virtual Machine. This is available on the
Internet or from the support folder on the MTM400A monitor application
firmware CD, Tektronix part number 063-4136-00.
12. In the Logon Details dialog box (see Figure 6), select the user type from the
drop-down list, and enter the password.
22
Version 00e
MTM400 and MTM400A RUI v3.x Upgrade Technical Reference
Page 27

Reverting the RUI
Figure 6: Login Details dialog box
13. The MTM400 RUI hot spot and Stream Summary windows should now be
displayed (see Figure 7).
NOTE. If the instrument on which you reverted the firmware version was an
MTM400A monitor, and especially if the login password was changed from the
factory default value, the RUI v2.6.1 may be inaccessible. In this situation, you
must clear the NVRAM and reassign the IP address of the instrument. The
procedure to perform that task is located in the Installation section of the
MTM400A Quick Start User Manual, Tektronix part number 071-2492-xx.
Figure 7: RUI version 2.6.1 display
Version 00e
MTM400 and MTM400A RUI v3.x Upgrade Technical Reference
23
Page 28

Reverting the RUI
Command Line Firmware Downgrade
An alternative to downgrading the firmware using the MTM400A RUI is by
using the command line firmware upgrade program supplied on the MTM400A
Application Firmware CD-ROM.
Use the following steps to downgrade the firmware from the command line:
1. Ensure that the MTM400A instrument is powered on.
2. Ensure that the PC is connected to the same network as the MTM400A
instrument.
3. Ensure that the firmware upgrade file(s) is available; refer to Requirements,
page 17. You are advised to copy these files to a temporary directory on the
PC’s hard drive.
4. At the PC, insert the MTM400A Application Firmware CD-ROM into the
CD-ROM drive. You are advised to locate the upgrade program, mtmfwuploader.exe, and copy it to the temporary directory containing the firmware
upgrade file(s).
5. From the Windows desktop, open the Command window, Start > Run >
cmd.
6. In the command window, change to the temporary directory containing the
upgrade program and the upgrade files.
7. Enter the program command in the following format:
mtmfwuploader <mtm address> <firmware file>
for example,
mtmfwuploader 123.345.567.789 “mtm400 v3.0.060 build 702.hex”
NOTE. When the firmware upload file name has spaces in it, enclose the name in
quotation marks, as shown in this example.
24
Version 00e
MTM400 and MTM400A RUI v3.x Upgrade Technical Reference
Page 29

Reverting the RUI
8. Execute the command by pressing the Enter key on your keyboard.
The firmware upload program will run. When complete, the following
message will be displayed:
MTM400 and interface card is programmed now.
Troubleshooting
The firmware upload is complete.
NOTE. When downgrading from RUI Version 3.x to Version 3.0, you must refer to
GbE Interface Confirmation, page 20, before attempting to select the GbE
interface card (Option GE).
NOTE. When downgrading from RUI Version 3.0 to Version 2.6.1, you must
disable the Java Runtime Environment in the Internet Explorer, see step 6, page
21, to step 10, page 22.
The progress indicator following the “Waiting for interface programming to
complete” message, may go beyond 100%. If this happens, note the following
steps:
1. Ensure that the signal input is disconnected and retry the process.
2. Observe the SFP LINK LED on the GbE interface card rear panel.
Version 00e
MTM400 and MTM400A RUI v3.x Upgrade Technical Reference
25
Page 30

Reverting the RUI
CAUTION. If, with no input, the SFP LINK LED stays lit, rebooting the
instrument could result in firmware corruption.
3. If the LED is still lit after 15 minutes, then a reboot, by removing and
reinstating power, can be tried.
4. If the upgrade is still unsuccessful, contact Tektronix support
(www.tek.com).
RUI v2.6.1 Product Documentation
You can download the latest versions of the user documentation for the RUI
v2.6.1 listed in Table 4 from the Tektronix Web site (www.tektronix.com).
Table 4: RUI v2.6.1 product documentation
Document Tektronix part number
User manual 071-1224-xx (English)
Technical reference 071-1560-xx
Release notes 071-1564-xx
RUI v3.0 Product Documentation
You can download the latest versions of the user documentation for the RUI v3.0
listed in Table 5 from the Tektronix Web site (www.tektronix.com).
Table 5: RUI v2.6.1 product documentation
Document Tektronix part number
Quick Start User manual 071-2492-xx (English)
Technical reference 071-2495-xx
Release notes 071-2494-xx
071-1538-xx (Japanese)
071-2493-xx (Japanese)
26
Version 00e
MTM400 and MTM400A RUI v3.x Upgrade Technical Reference
 Loading...