

Page 1

User Manual
MTM300 Series
MPEG Transport Monitor
071-0597-04
This document supports
firmware version 2.1.
www.tektronix.com
Page 2

Copyright © Tektronix, Inc. All rights re served. Licensed software products are owned by Tektronix or its suppliers and
are protected by United States copyright laws and international treaty provisions.
Use, duplication, or disclosure by the Government is subject to restrictions as set forth in subparagraph (c)(1)(ii) of the
Rights in Technical Data and Computer Software clause at DFARS 252.227-7013, or subparagraphs (c)(1) and (2) of the
Commercial Computer Software -- Restricted Rights clause at FAR 52.227-19, as applicable.
Tektronix products are covered by U.S. and foreign patents, issued and pending. Information in this publication supercedes
that in all previously published material. Specifications and price change privileges reserved.
Tektronix, Inc., P.O. Box 500, Beaverton, OR 97077
TEKTRONIX and TEK are registered trademarks of Tektronix, Inc.
Page 3

HARDWARE WARRANTY
Tektronix warrants that the products that it manufactures and sells will be free from defects in materials and workmanship
for a period of one (1) year from the date of shipment. If a product proves defect ive during this warranty period, Tektronix,
at its option, either will repair the defective product without charge for parts and labor, or will provide a replacement in
exchange for the defective product.
In order to obtain service under this warranty, Custome r must not ify Tektronix of the defect before the expiration of the
warranty period and make suitable arrangements for the performance of service. Customer shall be responsible for
packaging and shipping the defective product to the service center designated by Tektronix, with shipping charges prepaid.
Tektronix shall pay for the return of the product to Customer if the shipment is to a location within the country in which the
Tektronix service center is located. Customer shall be responsible for paying all shipping charges, duties, taxes, and any
other charges for products returned to any other locations.
This warranty shall not apply to any defect, failure or damage caused by improper use or improper or inadequate
maintenance and care. Tektronix shall not be obligated to furnish service under this warranty a) to repair damage resulting
from attempts by personnel other than Tektronix representatives to install, repair or service the product; b) to repair
damage resulting from improper use or connection to incompatible equipment; c) to repair any damage or malfunction
caused by the use of non-Tektronix supplies; or d) to service a product that has been modified or integrated with other
products when the effect of such modification or integration increases the time or difficulty of servicing the product.
THIS WARRANTY IS GIVEN BY TEKTRONIX IN LIEU OF ANY OTHER WARRANTIES, EXPRESS OR
IMPLIED. TEKTRONIX AND ITS VENDORS DISCLAIM ANY IMPLIED WARRANTIES OF
MERCHANTABILITY OR FITNESS FOR A PARTICULAR PURPOSE. TEKTRONIX’ RESPONSIBILITY TO
REPAIR OR REPLACE DEFECTIVE PRODUCTS IS THE SOLE AND EXCLUSIVE REMEDY PROVIDED TO
THE CUSTOMER FOR BREACH OF THIS WARRANTY. TEKTRONIX AND ITS VENDORS WILL NOT BE
LIABLE FOR ANY INDIRECT, SPECIAL, INCIDENTAL, OR CONSEQUENTIAL DAMAGES IRRESPECTIVE
OF WHETHER TEKTRONIX OR THE VENDOR HAS ADVANCE NOTICE OF THE POSSIBILITY OF SUCH
DAMAGES.
Page 4

SOFTWARE WARRANTY
Tektronix warrants that the media on which this software product is furnished and the encoding of the programs on the
media will be free from defects in materials and workmanship for a period of three (3) months from the date of shipment.
If a medium or encoding proves defective during the warranty period, Tektronix will provide a replacement in exchange
for the defective medium. Except as to the media on which this software product is furnished, this software product is
provided “as is” without warranty of any kind, either express or implied. Tektronix does not warrant that the functions
contained in this software product will meet Customer’s requirements or that the operation of the programs will be
uninterrupted or error-free.
In order to obtain service under this warranty, Custome r must not ify Tektronix of the defect before the expiration of the
warranty period. If Tektronix is unable to provide a replacement that is free from defects in materials and workmanship
within a reasonable time thereafter, Customer may terminate the license for this software product and return this software
product and any associated materials for credit or refund.
THIS WARRANTY IS GIVEN BY TEKTRONIX IN LIEU OF ANY OTHER WARRANTIES, EXPRESS OR
IMPLIED. TEKTRONIX AND ITS VENDORS DISCLAIM ANY IMPLIED WARRANTIES OF
MERCHANTABILITY OR FITNESS FOR A PARTICULAR PURPOSE. TEKTRONIX’ RESPONSIBILITY TO
REPLACE DEFECTIVE MEDIA OR REFUND CUSTOMER’S PAYMENT IS THE SOLE AND EXCLUSIVE
REMEDY PROVIDED TO THE CUSTOMER FOR BREACH OF THIS WARRANTY. TEKTRONIX AND ITS
VENDORS WILL NOT BE LIABLE FOR ANY INDIRECT, SPECIAL, INCIDENTAL, OR CONSEQUENTIAL
DAMAGES IRRESPECTIVE OF WHETHER TEKTRONIX OR THE VENDOR HAS ADVANCE NOTICE OF
THE POSSIBILITY OF SUCH DAMAGES.
Page 5

Table of Contents
Getting Started
General Safety Summary xiii..........................................
Service Safety Summary xv..........................................
Preface xvii...................................................
Contacting Tektronix xx.............................................
Getting Started 1--1............................................
MTM300 Series MPEG Transport Monitor 1--1............................
Options and Accessories 1--8...........................................
Installation 1--11...............................................
Hardware Installation 1--11.............................................
Electrical Installation 1--17.............................................
Network Installation 1--22..............................................
Configuration 1-- 23.............................................
Logging On to the MTM300 Series MPEG Transport Monitor 1--23............
Starting and Exiting the Master Client Application 1--25......................
Shutting Down the MTM300 Series MPEG Transport Monitor 1--26............
Configuring the MTM300 Series MPEG Transport Monitor 1--28..............
Functional Check 1--35..........................................
Verifying the Performance of the MPEG-2 Components 1--35.................
Verifying the Performance of the TMCC Components 1--42...................
Verifying the Hardware Components 1--45.................................
Operating Basics
Operating Basics 2--1..........................................
Functional Overview 2--1.............................................
Tutorial 2--15..................................................
Preliminary Setup 2--15................................................
Starting the Master Client 2--16.........................................
Connecting to the Local Server Manager 2--17.............................
Configuring the Master Client Workspace 2--17.............................
Monitoring Transport Stream Inputs 2--19.................................
Configuring the Analysis Servers 2--25....................................
Configuring the Data Logging Function 2--28..............................
Analyzing a Stream Using the Expert Client 2--29...........................
MTM300 Series MPEG Transport Monitor User Manual
i
Page 6

Table of Contents
Reference
Reference 3--1.................................................
MPEG Overviews 3--2................................................
Client-Server Overview 3--6...........................................
Master Client Refer ence 3--9....................................
Master Client Application Window 3--10..................................
Master Client Toolbars and Icons 3-- 17....................................
Master Client Menus 3--23.............................................
Workspace Dialog Box 3--26............................................
Workspace Tasks 3--30................................................
Error Reporting Tasks 3--38.............................................
Using the Master Client to Monitor PQM300 Program QoS Monitor Results 3--40.
Analyses Reference 3--43........................................
Analysis Servers 3--43.................................................
Default Analyses 3--44.................................................
User Controlled Analyses (Probes) 3--45..................................
ETR 290 Probe Descriptions 3--49.......................................
Multiplex Probe Descriptions 3--65.......................................
Syntax Probe Descriptions 3--71.........................................
Private Syntax Probe Descriptions 3--72...................................
Transport Syntax Probe Descriptions 3--73.................................
Section Syntax Probe Descriptions 3--77..................................
Mega Frame Syntax Probe Descriptions 3--79..............................
Timing Probe Descriptions 3--81.........................................
Transport Rate Probe Descriptions 3--84...................................
Section Rate Probe Descriptions 3--85....................................
Mega Frame Rate Probe Descriptions (DVB-T only) 3--87....................
TMCC Probe Descriptions 3--88.........................................
Expert Client Reference 3--93....................................
Expert Client Display Elements 3--94.....................................
Expert Client Menus 3--100..............................................
Manually Capturing a Transport Stream 3--103..............................
Configuring the Expert Client Views 3--105.................................
Using the Hierarchic View 3--110.........................................
Using the Report View 3--116............................................
Using the Client Area 3--132.............................................
Configuration Client Reference 3--159..............................
Changing Configurations 3--160..........................................
Saving and Restoring Configurations 3--161.................................
Managing Remote Transport Monitors 3--164...............................
Data Logging 3--166...................................................
Configuration Client Display Elements 3--168...............................
Configuration Settings 3--172............................................
ii
MTM300 Series MPEG Transport Monitor User Manual
Page 7

Appendices
Table of Contents
TMCC Expert Client Reference 3--209..............................
Using the TMCC Expert Client Display Elements 3--210......................
Manually Capturing a TMCC Transport Stre am 3--216........................
TMCC Configuration Client Reference 3--219........................
Changing Configurations 3--220..........................................
Saving and Restoring Configurations 3--221.................................
TMCC Configuration Client Display Elements 3--222.........................
TMCC Configuration Settings 3--225......................................
Appendix A: Specifications A --1..................................
Performance Conditions A--1...........................................
Electrical, Hardware, and Signal Specifications A--1........................
System Components A--7..............................................
Power Characteristics A--8.............................................
Mechanical (Physical) Characteristics A--8................................
Environmental Characteristics A--9......................................
Certification and Compliances A--10......................................
Appendix B: Cleaning and Maintenance B--1......................
General Care B--1....................................................
Preventive Maintenance B--1...........................................
In Case of Problems B--3..............................................
Repackaging for Shipment B--10.........................................
Appendix C: Networking C--1...................................
Network Requirements C--1............................................
Network Installation C--2..............................................
Network Troubleshooting C--10..........................................
Appendix D: Software Repair and Installation D--1.................
Software Repair Strategy D--1..........................................
Restoring System Settings D--4.........................................
Restoring Device Drivers D--17..........................................
Restoring the MTM300 Series MPEG Transport Monitor Operating System D--24.
Installing the MTM300 Series Application Software D--26....................
Appendix E: Using the Private Syntax Interpreter E--1..............
Private Syntax Interpreter Interface E--2..................................
Editing Private Syntax Definitions E--12...................................
Compiling Private Syntax Definitions E--21................................
Analyzing Private Syntax with the Expert Client E--21.......................
Private Data Reference E--23............................................
Appendix F: ATSC Program Paradigm F--1.......................
Glossary
Index
MTM300 Series MPEG Transport Monitor User Manual
iii
Page 8

Table of Contents
List of Figures
Figure 1--1: The MTM300 Series MPEG Transport Monitor 1--1......
Figure 1--2: Attaching the extension brackets to the
stationary tracks 1--13.......................................
Figure 1--3: Mounting hole selection on the front rails of the
equipment rack 1--13........................................
Figure 1--4: Attaching the extension bracket to the rear rail of the
equipment rack 1--14........................................
Figure 1--5: Mounting the stationary section to the front rail of the
equipment rack 1--15........................................
Figure 1--6: Stationary bracket, extension bracket, and attaching
screws 1--15................................................
Figure 1--7: Installing the instrument into the equipment rack 1--16....
Figure 1--8: MTM300 Series transport monitor rear p anel
connectors 1--18............................................
Figure 1--9: Keyboard and monitor connections 1--21................
Figure 1--10: On/Stby switch 1--23................................
Figure 1--11: Server Manager and Analysis Server icons in
system tray 1--24............................................
Figure 1--12: The Tektronix MPEG Transport Monitor
program group 1--25.........................................
Figure 1--13: Shutting down the transport monitor 1--26..............
Figure 1--14: Windows NT Shut Down Windows dialog box 1--27......
Figure 1--15: Router application showing two host machines 1--28......
Figure 1--16: SNMP Traps to Target dialog box 1--29.................
Figure 1--17: SNMP Traps to Target dialog box showing localhost
IP parameters 1--29.........................................
Figure 1--18: Router application 1--30..............................
Figure 1--19: IP parameters for network management station 1--31.....
Figure 1--20: Network management station added 1--32...............
Figure 1--21: Modified Hosts file 1--33.............................
Figure 1--22: Master client initial toolbar and Home button 1--36......
Figure 1--23: Workspace dialog box with one input selected 1--36.......
Figure 1--24: Monitoring a transport stream 1--37...................
Figure 1--25: Starting the Configuration client 1--38..................
Figure 1--26: Choosing the analysis type 1--38.......................
Figure 1--27: Adding all ETR290 probes 1--39.......................
Figure 1--28: Master client showing errors on Cinestar 1--40...........
iv
MTM300 Series MPEG Transport Monitor User Manual
Page 9

Table of Contents
Figure 1--29: Expert client showing errors on Cinestar 1--41...........
Figure 1--30: Probes added in the TMCC Configuration Client 1--42....
Figure 1--31: TMCC Expert Client 1--43...........................
Figure 1--32: Hardware diagnostic tool 1--46........................
Figure 1--33: Default self test selections 1--46........................
Figure 1--34: Self test in progress 1--47.............................
Figure 1--35: Saving test results 1-- 48..............................
Figure 2--1: The Master client application window 2--2..............
Figure 2--2: The Expert client application window 2--4..............
Figure 2--3: The Configuration client application window 2--6........
Figure 2--4: The TMCC Expert client application window 2--7........
Figure 2--5: The TMCC Configuration client application window 2--10..
Figure 2--6: Front-panel elements 2--12.............................
Figure 2--7: Empty Master client application window 2--16............
Figure 2--8: Creating workspace bouquets 2--17.....................
Figure 2--9: Changing the analysis display options 2--18..............
Figure 2--10: Master client monitoring inputs 2--19..................
Figure 2--11: Master client showing errors on a service 2--22...........
Figure 2--12: Services panel details view 2--23.......................
Figure 2--13: Connected to the Configuration client 2--25.............
Figure 2--14: Setting ETR290 probes 2--26..........................
Figure 2--15: Changing the message level 2--27......................
Figure 2--16: Data Logging configuration panel 2--28.................
Figure 2--17: Selecting the Expert client 2--29.......................
Figure 2--18: Expert client showing errors 2--30.....................
Figure 2--19: ETR290 panel (for an MPEG-2 stream) 2--31............
Figure 3--1: Master client application window 3--10..................
Figure 3--2: Details view of the Services panel 3--14..................
Figure 3--3: Bouquet Selection panel 3--27..........................
Figure 3--4: Graphics panel 3--28.................................
Figure 3--5: Sound panel 3--29....................................
Figure 3--6: Selecting inputs in the Bouquet Selection panel 3--30......
Figure 3--7: Report Message Level panel in the
Configuration client 3--38....................................
Figure 3--8: Multiplex Analysis panel, Probe Type list box 3--46........
Figure 3--9: Expert client display elements 3--94.....................
Figure 3--10: View panel in the Settings window 3--105................
MTM300 Series MPEG Transport Monitor User Manual
v
Page 10

Table of Contents
Figure 3--11: Report View configuration window 3-- 106................
Figure 3--12: Graphics View configuration window 3--108..............
Figure 3--13: PID Allocation View configuration window 3--109.........
Figure 3--14: Expert client hierarchic display 3--110...................
Figure 3--15: Specific information displayed for transport
strea m items 3--111...........................................
Figure 3--16: Report view display 3--116.............................
Figure 3--17: Report view display modes 3--120.......................
Figure 3--18: Analysis Results area of the Report view 3--121...........
Figure 3--19: Hierarchy levels in the Analysis Results area 3--123........
Figure 3--20: Error Graph panel for the Program report mode 3--124....
Figure 3--21: Message panel for the Program report mode 3--124........
Figure 3--22: Error Graph panel for the ETR 290 report mode 3--125....
Figure 3--23: Error Graph panel for the Advanced report mode 3--127...
Figure 3--24: Error Graph panel for the Error report mode 3--128.......
Figure 3--25: Program Allocation panel (Current Rate mode) 3--135.....
Figure 3--26: Reading the Program Allocation panel bar graphs 3--137...
Figure 3--27: PID Allocation panel (current rate mode) 3--138..........
Figure 3--28: Continuity Counter panel 3--141........................
Figure 3--29: Type Allocation panel 3--142...........................
Figure 3--30: TP (Transport Packet) Error Indicator panel 3--143.......
Figure 3--31: Unsynchronized Packets panel 3--144...................
Figure 3--32: ASI/M2S Distribution panel 3--145......................
Figure 3--33: ETR 290 view (DVB mode) 3--146......................
Figure 3--34: Section Analysis view 3--148...........................
Figure 3--35: Section Rate view 3--150...............................
Figure 3--36: PCR Analysis view 3--151.............................
Figure 3--37: PTS/DTS Analysis view 3--154.........................
Figure 3--38: MIP Packet Analysis view 3--155.......................
Figure 3--39: IP Monitoring view 3--158.............................
Figure 3--40: Data logging directory hierarchy 3--166..................
Figure 3--41: Data logging file structure 3--167.......................
Figure 3--42: Configuration client display elements 3--168..............
Figure 3--43: Hardware configuration panel 3--173....................
Figure 3--44: Analysis configuration panel 3--174.....................
Figure 3--45: ETR 290 configuration panel 3--176.....................
Figure 3--46: Multiplex Analysis configuration panel 3--177............
Figure 3--47: Syntactic Analysis configuration panel 3--179.............
Figure 3--48: Transport Syntactic Analysis configuration panel 3--181....
vi
MTM300 Series MPEG Transport Monitor User Manual
Page 11

Table of Contents
Figure 3--49: Section Syntactic Analysis configuration panel 3--183......
Figure 3--50: Mega Frame Syntactic Analysis configuration panel 3--185.
Figure 3--51: PCR Timing Analysis configuration panel 3--187..........
Figure 3--52: PTS/DTS Timing Analysis configuration panel 3--189......
Figure 3--53: Mega Frame Timing Analysis configuration panel 3--191...
Figure 3--54: Transport Rate Analysis configuration panel 3--192.......
Figure 3--55: Section Rate Analysis configuration panel 3--193..........
Figure 3--56: Mega Frame Rate Analysis configuration panel 3--195.....
Figure 3--57: Report configuration panel 3--196......................
Figure 3--58: Report Message Level configuration panel 3--198.........
Figure 3--59: Event Configuration configuration panel 3--200...........
Figure 3--60: Event Settings dialog box 3--203........................
Figure 3--61: Filtering configuration panel 3--205.....................
Figure 3--62: Data Logging configuration panel 3--206.................
Figure 3--63: Security configuration panel 3--207.....................
Figure 3--64: TMCC Expert Client display elements 3--210.............
Figure 3--65: TMCC Configuration Client display elements 3--222.......
Figure 3--66: TMCC Input configuration panel 3--226.................
Figure 3--67: TMCC Analysis configuration panel 3--227..............
Figure 3--68: TMCC Data Storage configuration panel 3--229...........
Figure 3--69: Data Storage Event Configuration dialog box 3--232.......
Figure B--1: Connecting the loop throughs on the back of the
transport monitor B--5......................................
Figure B--2: Hardware diagnostic tool B--6.........................
Figure B--3: Default self test selections B--6........................
Figure B--4: Changing self test parameters B--7.....................
FigureB--5:Selftestinprogress B--8..............................
Figure B--6: Saving test results B--9...............................
Figure B--7: Repackaging the instrument (new packaging) B--11.......
Figure B--8: Repackaging the instrument (old packaging) B--13........
Figure B--9: Placement of bottom spacer pad in inner shipping box B--14
Figure C--1: Network dialog box showing TCP/IP Protocol item C--3...
Figure C--2: IP tab parameters C--4...............................
Figure C--3: DNS tab parameters C--5.............................
Figure C--4: Router application window C--8.......................
Figure C--5: IP parameters for network management station C--8......
Figure C--6: Management station added C--9.......................
MTM300 Series MPEG Transport Monitor User Manual
vii
Page 12

Table of Contents
Figure C--7: Incorrect IP address C--11.............................
Figure C--8: Incorrect subnet mask C--12...........................
Figure C--9: Incorrect default gateway IP address C--13...............
Figure C--10: Ping.exe command window C--15......................
Figure C--11: Tracert.exe command window C--16....................
Figure C--12: Command prompt with nslookup results C--17..........
Figure C--13: Network name C--18.................................
Figure C--14: Network dialog box, Adapters tab C--21................
Figure C--15: Adapter card dialog box C--22........................
Figure C--16: Adapter card test complete C--22......................
Figure C--17: Connecting to a remote Server Manager with
the Router C--25.............................................
Figure C--18: List of machines receiving traps C--25..................
Figure D--1: Software Protection key D--26..........................
Figure D--2: Software protection key D--28..........................
Figure D--3: Check free disk space D--29............................
Figure D--4: Setup type dialog box D--30............................
Figure D--5: Interim reboot message D--31..........................
viii
MTM300 Series MPEG Transport Monitor User Manual
Page 13

List of Tables
Table of Contents
Table 1--1: MTM300 Series transport monitor options 1--8..........
Table 1--2: Standard accessories for the transport mon itor 1--8.......
Table 1-- 3: Standard accessories for the network management
software 1--9..............................................
Table 1--4: Optional accessories 1--9..............................
T able 1--5: Electrical operating r equirements 1--17..................
Table 1--6: Rear-panel connectors 1--19............................
Table 1-- 7: Relay closure pin assignment for the relay board
in slot 8 1--20..............................................
Table 1-- 8: Relay closure pin assignment for the relay board
in slot 9 1--20..............................................
Table 2--1: Modulation mode color scheme 2--8....................
Table 2--2: Front panel-key controls 2--13..........................
Table 2-- 3: Touch screen techniques 2--14..........................
Table2--4:Erroriconstates 2--20.................................
Table 2--5: Error gauge icon states 2--20...........................
Table 2--6: Multiplex level Details panel icons 2--23..................
Table 2--7: Service (or Program) level Details panel icons 2--24........
Table 3-- 1: Master client toolbar buttons 3--17......................
Table 3--2: Master client multiplex and service icons 3--18............
Table 3--3: Multiplex icon variations 3--19.........................
Table3--4:Erroricons 3--19.....................................
Table 3--5: Error severity gauge icons 3--20.........................
Table 3-- 6: Detail panel error icons with an input selected 3--20........
T able 3--7: Detail panel err or icons with a service selected 3--21........
Table 3--8: Transport monitor server icons 3--22....................
T able 3--9: Master client Master menu 3--23........................
T able 3--10: Master client Workspace menu 3--23...................
Table 3-- 11: Master client View menu 3 -- 24.........................
Table 3--12: Master client Help menu 3 --24.........................
Table 3--13: Multiplex panel shortcut menu 3--24...................
T able 3--14: Services panel shortcut menu 3--25.....................
Table 3--15: ETR 290 tests 3--49..................................
MTM300 Series MPEG Transport Monitor User Manual
ix
Page 14

Table of Contents
Table 3-- 16: Overview of service information defined in
ETS 300 468 3--61..........................................
T able 3--17: SI repetition rates according to DVB 3--62...............
Table 3--18: Multiplex analyses 3--65..............................
Table 3-- 19: Table ID analyses 3--67...............................
Table 3--20: Transport syntax analyses 3--73........................
Table 3--21: Section syntax analyses 3--77..........................
Table 3--22: Section syntax analyses 3--79..........................
Table 3--23: Section rate analyses 3--86............................
Table 3-- 24: Functions of the View Toolbar buttons 3--96.............
Table 3-- 25: Functions of the Report View Toolbar buttons 3--98.......
Table 3-- 26: Expert client Active View menu commands 3--100.........
Table 3-- 27: Expert client Session menu commands 3--101.............
Table 3-- 28: Expert client View menu commands 3--101...............
Table 3-- 29: Expert client Window menu commands 3--102............
Table 3-- 30: Expert client Help menu commands 3--102...............
Table 3-- 31: Mouse and keyboard actions in the Hierarchic view 3--112..
Table 3--32: Hierarchic view icon identification 3--113................
Table 3-- 33: Hierarchic view menu commands 3--115.................
Table 3-- 34: Functions of the Report View Toolbar buttons 3--117.......
Table 3--35: Report view shortcut menu 3--120.......................
Table 3--36: Error graph symbols 3--122............................
Table 3--37: Icons used in the Report view Analysis Results area 3--123..
T able 3--38: Message view column descriptions
(Program mode) 3--125.......................................
T able 3--39: Message view column descriptions
(ETR 290 mode) 3--126.......................................
T able 3--40: Message view column descriptions
(Advanced mode) 3--128......................................
T able 3--41: Message view column descriptions
(Error mode) 3--129..........................................
Table 3-- 42: Configuration client Session menu commands 3--169.......
Table 3-- 43: Configuration client Help menu commands 3--170.........
Table 3-- 44: Functions of the Configuration client
Toolbar buttons 3--170.......................................
Table 3--45: Multiplex analysis probes 3--178........................
Table 3--46: Transport syntax probes 3--182.........................
Table 3--47: Section syntax probes 3--184...........................
Table 3--48: Mega Frame syntax probes 3--186.......................
x
MTM300 Series MPEG Transport Monitor User Manual
Page 15

Table of Contents
Table 3-- 49: Functions of the TMCC Expert Client
toolbar buttons 3--211........................................
T able 3--50: Color for each TMCC Expert Client
modulation mode 3--212......................................
Table 3--51: TMCC data syntax 3--213..............................
Table 3--52: Syntax view LED icons an d error conditions 3--214........
Table 3-- 53: Functions of the TMCC Configuration Client
Toolbar buttons 3--223.......................................
Table A--1: Processing Interface Adapter (PIA) board A--1...........
T able A--2: ASI mezzanine A--1..................................
T able A--3: SSI mezzanine A--2..................................
Table A--4: Alarm relay board A--3...............................
Table A-- 5: Rear panel interface characteristics A--4................
Table A--6: Relay closure for alarm relay boards A--5...............
Table A-- 7: Side and front panel interface characteristics A --6........
T able A--8: System components A--7..............................
T able A--9: AC power source characteristics A--8...................
T able A--10: Mechanical characteristics A--8.......................
Table A--11: Environmental characteristics A--9....................
Table A--12: Electromagnetic Compatibility A--10...................
T able A--13: Environmental Limits and Use Classification for
Safety Certification Compliance A--11..........................
Table B--1: Troubleshooting power-on failures B--3.................
T able D--1: MTM300 Series COM port settings D--8................
Table D-- 2: Touchscreen driver hardware settings D--22..............
Table E--1: Menu bar File menu E--4.............................
Table E--2: Menu bar Edit menu E--4.............................
T able E--3: Menu bar View menu E--5............................
Table E--4: Menu bar Window menu E--5.........................
Table E--5: Menu bar Help menu E--5............................
Table E--6: Private Syntax Interpreter toolbar buttons E--6..........
Table E--7: Hierarchic view icons and label descriptions E --7.........
Table E--8: Hierarchy position of added items E-- 14..................
Table E--9: Default parameters for added private syn tax fields E--15...
Table E--10: Private syntax data type definitions E--16...............
Table E--11: Private syntax expression operators and terminals E--16...
MTM300 Series MPEG Transport Monitor User Manual
xi
Page 16

Table of Contents
Table E--12: Private syntax example interpretation expressions E--17...
Table E--13: Private section E--24.................................
Table E--14: Private descriptor E--26..............................
T able F--1: PID assignment for the elementary streams of a
program F--1..............................................
Table F--2: Program paradigm errors F--2.........................
xii
MTM300 Series MPEG Transport Monitor User Manual
Page 17

General Safety Summary
Review the following safety precautions to avoid injury and prevent damage to
this product or any products connected to it. To avoid potential hazards, use this
product only as specified.
Only qualified personnel should perform service procedures.
ToAvoidFireor
Personal Injury
Use Proper Power Cord. Use only the power cord specified for this product and
certified for the country of use.
Ground the Product. This product is indirectly grounded through the grounding
conductor of the mainframe power cord. To avoid electric shock, the grounding
conductor must be connected to earth ground. Before making connections to the
input or output terminals of the product, ensure that the product is properly
grounded.
Observe All Terminal Ratings. To avoid fire or shock hazard, observe all ratings
and markings on the product. Consult the product manual for further ratings
information before making connections to the product.
Do Not Operate Without Covers. Do not operate this product with covers or panels
removed.
Use Proper Fuse. Use only the fuse type and rating specified for this product.
Avoid Exposed Circuitry. Do not touch exposed connections and components
when power is present.
Do Not Operate With Suspected Failures. If you suspect there is damage to this
product, have it inspected by qualified service personnel.
Do Not Operate in Wet/Damp Conditions.
Do Not Operate in an Explosive Atmosphere.
Keep Product Surfaces Clean and Dry.
Provide Proper Ventilation. Refer to the manual’s installation instructions for
details on installing the product so it has proper ventilation.
MTM300 Series MPEG Transport Monitor User Manual
xiii
Page 18

General Safety Summary
Symbols and Terms
Terms in this Manual. These terms may appear in this manual:
WARNING. Warning statements identify conditions or practices that could result
in injury or loss of life.
CAUTION. Caution statements identify conditions or practices that could result in
damage to this product or other property.
Terms on the Product. These terms may appear on the product:
DANGER indicates an injury hazard immediately accessible as you read the
marking.
WARNING indicates an injury hazard not immediately accessible as you read the
marking.
CAUTION indicates a hazard to property including the product.
Symbols on the Product. The following symbols may appear on the product:
CAUTION
Refer to Manual
Protective Ground
(Earth) Terminal
xiv
MTM300 Series MPEG Transport Monitor User Manual
Page 19

Service Safety Summary
Only qualified personnel should perform service procedures. Read this Service
Safety Summary and the General Safety Summary before performing any service
procedures.
Do Not Service Alone. Do not perform internal service or adjustments of this
product unless another person capable of rendering first aid and resuscitation is
present.
Disconnect Power. To avoid electric shock, switch off the instrument power, then
disconnect the power cord from the mains power.
Use Care When Servicing With Power On. Dangerous voltages or currents may
exist in this product. Disconnect power, remove battery (if applicable), and
disconnect test leads before removing protective panels, soldering, or replacing
components.
To avoid electric shock, do not touch exposed connections.
MTM300 Series MPEG Transport Monitor User Manual
xv
Page 20

Service Safety Summary
xvi
MTM300 Series MPEG Transport Monitor User Manual
Page 21

Preface
This manual describes the functions and use of the Tektronix MTM300 Series
MPEG Transport Monitor. The manual is organized into the following sections:
H Getting Started.
This section provides a functional description of the transport monitor
platform and the software modules that make up the MTM300 Series MPEG
Transport Monitor. It also provides a list of items shipped with the transport
monitor as well as optional accessories. Finally, Getting Started describes
how to install the transport monitor in your monitoring environment.
H Operating Basics.
This section provides a detailed description of the MTM300 Series MPEG
Transport Monitor and a brief tutorial that shows how the client modules are
used to monitor transport streams. Operating Basics also provides a
comprehensive list of the buttons, icons, and menu selections for each client
module.
H Reference.
This section provides detailed descriptions and procedures for using each of
the MTM300 Series client modules, including the TMCC real-time analysis
modules. It also provides a reference for all user-controlled analyses (called
probes) enabled by the MTM300 Series MPEG Transport Monitor.
H Appendices.
This section is comprised of the following appendices:
H Appendix A: Specifications. This appendix lists the electrical, physical,
and environmental specifications for your instrument.
H Appendix B: Cleaning and Maintenance. This appendix describes how to
perform periodic user maintenance. This section does not include repair
or replacement procedures.
H Appendix C: Networking. This appendix provides networking require-
ments and procedures for installing the MTM300 Series MPEG
Transport Monitor in a TCP/IP networking environment. Networking
also provides basic network troubleshooting procedures.
MTM300 Series MPEG Transport Monitor User Manual
xvii
Page 22

Preface
Related Material
H Appendix D: Software Repair and Installation. This appendix provides
the procedure for replacing device drivers, restoring the transport
monitor operating system, and installing MTM300 Series applications
onto a network management station, a remote monitoring station, or the
transport monitor itself.
H Appendix E: Private Syntax Interpreter. This appendix describes how to
use the Private Syntax Interpreter. This application is a standard
accessory with each MTM300 Series MPEG Transport Monitor.
H Appendix F: ATSC Program Paradigm. This appendix describes the PID
value restrictions for program elements in ATSC transport streams.
H Glossary.
H Index.
In addition to the material in this manual, each MTM300 Series client module
has an online help system accessed through the Help menu. The Expert client
and Configuration client Help menus also provide access to an Analysis Server
online help, describing the analyses performed by Analysis Servers.
Included on the software application CD-ROM is the Read Me file for the
MTM300 Series software. This file lists the application files included with the
software installation types and other important information.
The Read This First document that ships with each MTM300 Series product lists
known problems with the software at the time the software was released and
workarounds for those issues.
The following URLs access the websites for the standards organizations listed
(the URLs listed were valid as of January, 2001):
H MPEG-2 standards (International Organization for Standards)
http://www.iso.ch/
H DVB standards (European Technical Standards Institute)
http://www.etsi.org/
H ATSC standards (Advanced Television Systems Committee)
xviii
http://www.atsc.org/
MTM300 Series MPEG Transport Monitor User Manual
Page 23

Preface
The following ARIB (Association of Radio Industries and Business) and ITU-R
(International Telecommunications Union) standards were used to develop the
added ARIB and TMCC enhancements to the transport monitor:
H ARIB STD-B10 (1.2), 1999, Service Information for Digital Broadcasting
System
H ARIB STD-B16 (1.1), 1999, Digital Receiver Commonly Used for Digital
Satellite Broadcasting Services Using Communication Satellite
H ARIB STD--B20 (1.1), Digital Broadcasting System and Related Operation-
al Guidelines for Broadcasting Satellites
H ITU-R BO. 1408, Transmission System for Advanced Multimedia Services
Provided by Integrated Services Digital Broadcasting in A Broadcasting
Satellite Channel
Finally, a PDF file of the PQM300 Program QoS Monitor User Manual
(Tektronix part number, 071-0576-XX) is included on the software application
CD-ROM. Refer to this manual for operating instructions if you have installed
the PQM300 client module on your network management station and do not
have access to the printed version of the manual.
Manual Conventions
Naming conventions for the interface elements and Windows elements in this
manual follow the Microsoft Manual of Style, Third Edition. Naming conventions for MPEG-2, ATSC, and DVB structures follow the conventions derived
from the standards documents listed above. In addition, the following formatting
conventions apply to this manual:
H Bold text refers to specific interface elements that you are instructed to
select, click, or clear.
Example: Select Settings from the Configuration menu.
H Italic text refers to document names or sections. Italics are also used to refer
to a named item when it is first described.
Example: See Details Panel for more information.
Example: A transport stream (also called a multiplex) is an ordered series of
bytes representing valid MPEG-2, DVB, or ATSC elements.
MTM300 Series MPEG Transport Monitor User Manual
xix
Page 24

Preface
Contacting Tektronix
Phone 1-800-833-9200*
Address Te ktronix, Inc.
Department or name (if known)
14200 SW Karl Braun Drive
P.O. Box 500
Beaverton, OR 97077
USA
Web site www.tektronix.com
Sales support 1-800-833-9200, select option 1*
Service support 1-800-833-9200, select option 2*
Technical support Email: techsupport@tektronix.com
1-800-833-9200, select option 3*
6:00 a.m. -- 5:00 p.m. Pacific time
* This phone number is toll free in North America. After office hours, please leave a
voice mail message.
Outside North America, contact a Tektronix sales office or distributor; see the
Tektronix web site for a list of offices.
xx
MTM300 Series MPEG Transport Monitor User Manual
Page 25
Getting Started
This section will help you install your MTM300 Series MPEG Transport
Monitor in your broadcast environment and configure it for monitoring transport
stream inputs. Getting Started includes the following information:
H MTM300 Series MPEG Transport Monitor and client applications overviews
H Transport monitor options and standard and optional accessories
H Hardware, electrical, and network installation procedures
H Procedures for configuring the MTM300 Series host machines
H Procedures for logging onto and turning off the transport monitor, as well as
procedures for starting and exiting the Master client
H Procedure for verifying that the MTM300 Series transport monitor is
working
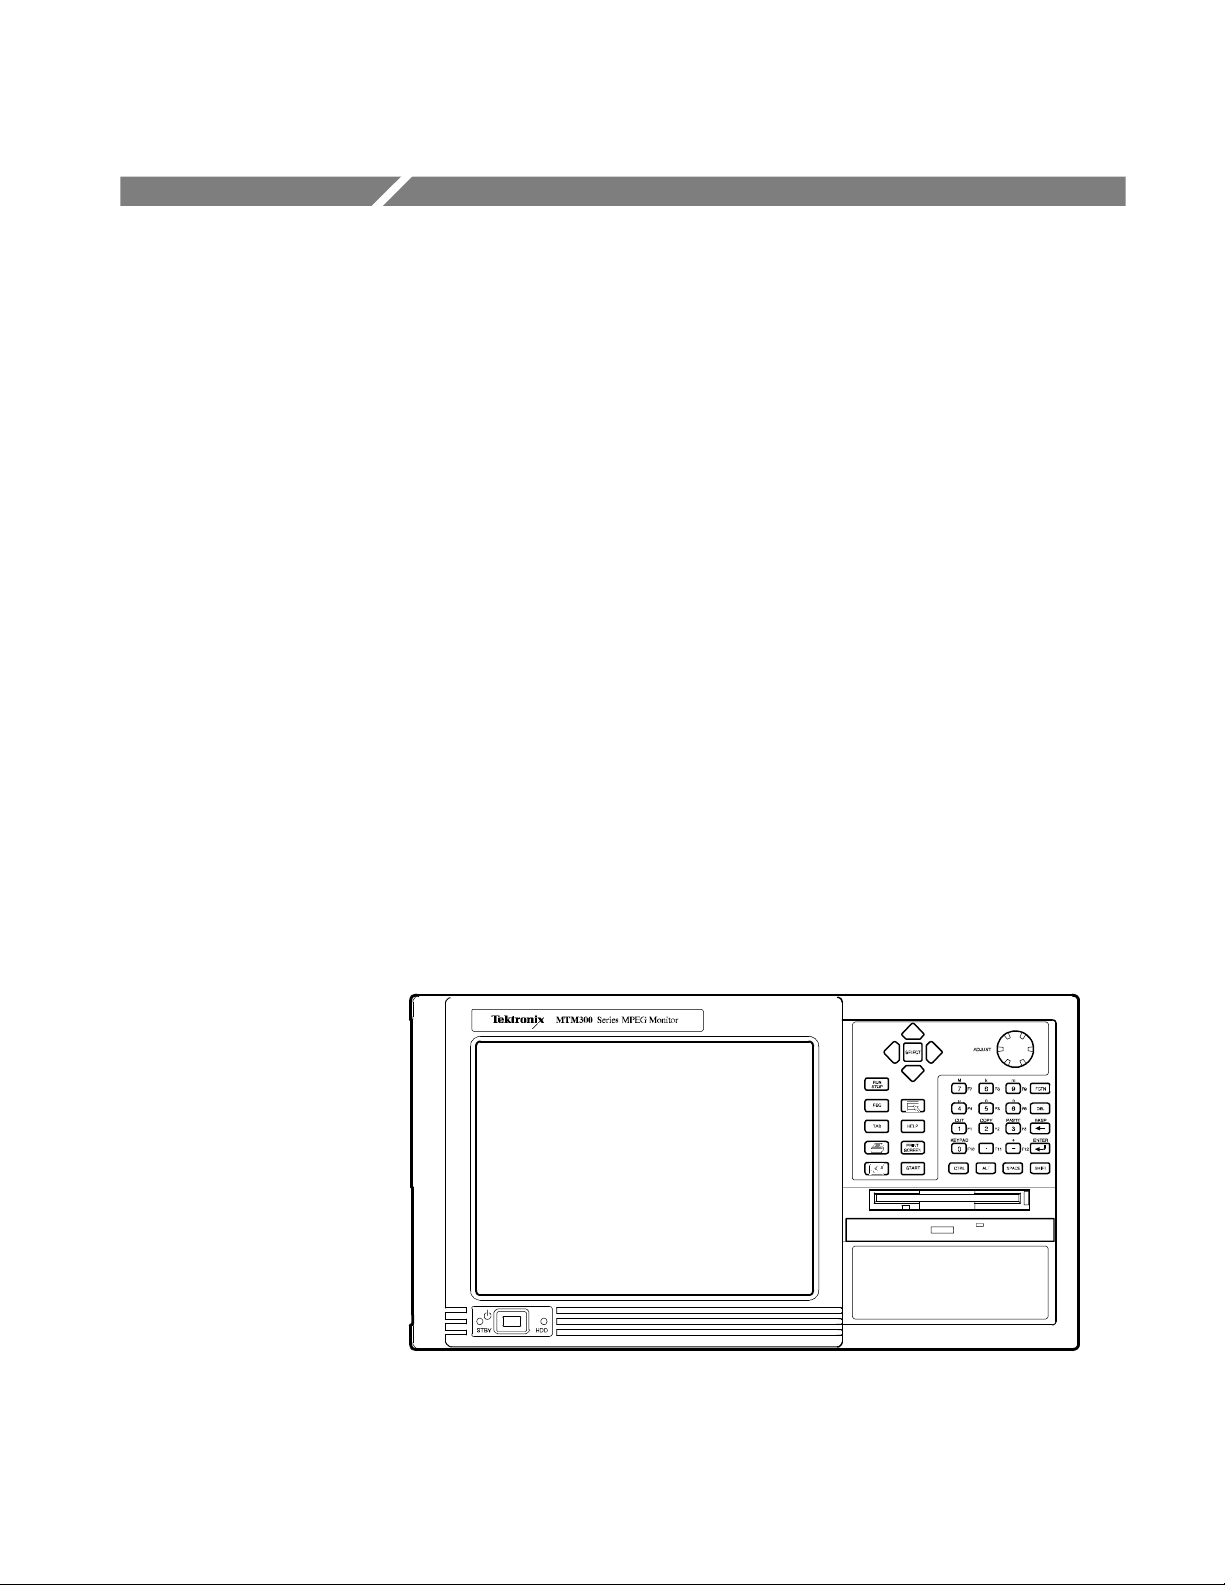
MTM300 Series MPEG Transport Monitor
The Tektronix MTM300 Series MPEG Transport Monitor is a rack-mounted,
MPEG-2 protocol monitor used to monitor single and multiple program transport
streams in MPEG-2, DVB, ATSC, and ISDB-S/ARIB environments. The
transport monitor depicted in Figure 1--1 includes the optional user interface
(keypad and touchscreen).
Figure 1- 1: The MTM300 Series MPEG Transport Monitor
MTM300 Series MPEG Transport Monitor User Manual
1- 1
Page 26

Getting Started
NOTE. Refer to the MPEG-2, DVB, ATSC, and ISDB-S/ARIB standards for
detailed information about the syntax and semantics of each system.
Each monitor can analyze up to eight transport stream inputs simultaneously and
accepts inputs in the following electrical formats:
H ASI/M2S (the monitor automatically detects the format)
H SMPTE 310M
The transport monitor allows you to output alarm signals using a 25-pin serial
interface. Each critical or major error recorded by an Analysis Server closes a
contact tied to the specific input. The pin-out for the alarm relay is provided in
Appendix A: Specifications.
The transport monitor uses a client/server architecture consisting of of a Server
Manager, multiple Analysis Servers, and the following client applications:
H Master client, which you use to monitor up to eight transport stream inputs
in real time
Server Manager
H Expert client, which you use to analyze specific transport streams in real
time
H Configuration client, which you use to configure the types of analyses
performed on transport stream inputs
H TMCC Expert client, which you use to monitor a TMCC transport stream
input in real time
H TMCC Configuration client, which you use to configure the types of TMCC
analyses performed on TMCC basic and data streams
The Master client is tightly integrated with the other analysis and configuration
clients making the transport monitor easy to use for experts and non-experts.
The Server Manager is the process that makes the results of the Analysis Servers
available to Master clients and starts automatically when you start the transport
monitor. Only one Server Manager can run on a transport monitor or network
management station.
The Server Manager process interacts with the following entities:
H The Analysis Server sends analysis results (called traps)totheServer
Manager.
1- 2
H The Master client displays the data collected by the Server Manager.
H The PQM300 Program QoS Monitor client sends traps to the Server
Manager.
MTM300 Series MPEG Transport Monitor User Manual
Page 27

Getting Started
Analysis Servers
Master Client
With this release of the software, there are two types of Analysis Server: one is
used to analyze any valid MPEG-2, DVB, or ATSC transport stream, and one is
used to analyze only TMCC transport streams. Analysis Servers are the
processes that actually analyze transport stream inputs. One Analysis Server for
each I/O port starts automatically when you start the transport monitor. Each
transport monitor can support up to eight Analysis Server processes
simultaneously.
The Analysis Server processes interact with the following entities:
H The Server Manager collects the Analysis Server results (called traps).
H The Expert client displays the results of the Analysis Server directly;
similarly, the TMCC Expert client displays the results of the TMCC
Analysis Server directly .
H The Configuration client sets the monitoring and analysis parameters for
each Analysis Server process operating on the inputs to the transport
monitor; similarly, the TMCC Configuration client sets the monitoring and
analysis parameters for each TMCC Analysis Server process.
The Master client provides an intuitive interface for monitoring the status of
transport stream inputs. You can also monitor a remote Tektronix PQM300
Program QoS Monitor from the Master client. Of the three MTM300 Series
applications, the Master client is the one you will use most often.
The Master client characteristics are shown in the following list:
H The Bouquet panel displays icons for the bouquets (groups of inputs) that
you have defined for the workspace.
H The Multiplex panel displays icons for the inputs that you have defined for a
bouquet (if enabled).
H The Services panel displays icons for the services (also called programs)
encoded in the transport stream.
H The Details panel displays icons indicating the type, status, and severity of
errors on a transport stream or service.
H The Expert and Configuration clients (MPEG-2 and TMCC), and PQM300
client can be started from the Master client. (See the PQM300 Program QoS
Monitor User Manual for operating information about this client.)
MTM300 Series MPEG Transport Monitor User Manual
1- 3
Page 28

Getting Started
Expert Client
Configuration Client
The Expert client analyzes a single stream in greater detail. You will use the
Expert client to help troubleshoot errors in your digital transmission system.
The Expert client has the following characteristics:
H Graphical displays that show the structure (hierarchy) of the input transport
stream and display characteristics of each component of the input stream
(for example: PID and type allocation, section rate analyses, and timing
analyses).
H Report views that indicate the types of errors recorded by the Analysis
Server and the characteristics of the input stream.
H Error views that show specific errors recorded for the various components
of the transport stream; for instance, PMT section rate errors and ETR290
errors.
The Expert client displays the results of only one Analysis Server (input) at a
time.
The Configuration client allows you to specify which transport stream parameters you want monitored, and how you want errors in your system to be reported.
The Configuration client allows you to perform the following tasks:
H Specify the standard to which you are testing an input: MPEG-2, DVB, or
ATS C.
H Set, remove, or modify the probes that test transport streams for valid syntax
and semantics and rates.
H Specify the way in which errors are reported in both the Expert and Master
clients. You can configure each probe to report an error as Critical, Major,
Minor, Warning, or as information only.
H Specify the types of transport stream events that are recorded using the Data
Logging function. You can also set the maximum file size and time period of
each log file.
H Stop and restart an Analysis Servers running on a transport monitor.
H Set passwords on specific inputs that prevent others from changing the
Analysis Server configuration for that input.
H Set parameters for capturing part of an input transport stream.
1- 4
MTM300 Series MPEG Transport Monitor User Manual
Page 29

Getting Started
TMCC Expert Client
TMCC Configuration
Client
The TMCC (Transmission Multiplexing Configuration Control) Expert Client is
a new application included with version 2.0 of the MTM300 Series MPEG
Transport Monitor. This client allows you to analyze the TMCC data of an
ARIB-compliant transport stream input in real time. You can also analyze an
ARIB-compliant transport stream file stored on your local disk.
The TMCC Expert client has the following characteristics:
H Indicates the presence of sync bytes (0x47 for TMCC basic streams and W1,
W2, or W3 sync bytes for TMCC data streams)
H Displays the syntax of TMCC data
H Displays Slot, TSID, TS Name, and Modulation mode information
H Displays information, warning, and error information
H Indicates the presence of TMCC alarm and update flags in the transport
stream
H Displays the overall stream rate
The TMCC (Transmission Multiplexing Configuration Control) Configuration
client is a new application included with version 2.0 of the MTM300 Series
MPEG Transport Monitor. This client allows you to set the monitoring, analysis,
and reporting parameters of the TMCC Analysis Servers.
The TMCC Configuration client has the following characteristics:
H Configures the TMCC Analysis Servers to operate in either TMCC basic or
TMCC data stream modes
H Enables you to specify a transport stream ID to analyze using the MPEG-2
Analysis Server (only in the TMCC data stream mode)
H Sets parameters for the following TMCC probes:
H Frame size
H Super frame size
H Modulation mode and slot consistency
H TMCC syntax
H TMCC update counter (only in TMCC data stream mode)
MTM300 Series MPEG Transport Monitor User Manual
1- 5
Page 30

Getting Started
SNMP Capabilities
MTM300 Series MPEG
Transport Monitor
Installation Options
The MTM300 Series MPEG Transport Monitor includes two SNMP management information bases (MIB). The Tektronix RTA MIBs are textual descriptions
of the Analysis Server objects (functions and parameters) that can be monitored
and controlled by the network management station using SNMP controls. The
MIB text files are installed with each MTM300 Series MPEG Transport Monitor
installation (on both the transport monitor and a computer with the network
management software installed) at the following location:
C:\Mib\, where C is the letter designator of the local hard drive.
The two MIBs located in this directory, RTAv1.mib and RTAv2.mib, are used for
SNMP version 1 and SNMP version 2 systems respectively.
An HP OpenView plug-in is provided that allows you to integrate the transport
monitor into HP OpenView Network Node Manager network monitoring
systems.
The MTM300 Series MPEG Transport Monitor client and server modules
described in this manual can be installed as described in the following list. The
items in the list correspond to the options you select from when installing or
reinstalling the MTM300 Series software. See Appendix E: Software Installation
and Repair for installation procedures, minimum system requirements, and the
list of files and file locations for each installation option.
H MPEG Transport Monitor
All of the client and server modules (and required program files) are installed
on the transport monitors. Each transport monitor can monitor up to eight
transport streams simultaneously, with a combined maximum bit rate of
180 Mbps.
CAUTION. You must ensure that transport monitors sending traps, and the
network management stations receiving them, are using the same version of
MTM300 series software. The network management station software does not
work in mixed MTM300 series software version envirionments.
H Network Management Software (MTM3FMS)
NOTE. You must have the software key in place to install the MTM300 Series
Network Management Software. See Installing the MTM 300 Series Software on
page D--28 for more information.
1- 6
MTM300 Series MPEG Transport Monitor User Manual
Page 31

Getting Started
All of the client modules and the Server Manager (and required program
files) are installed on the network management stations. In addition, you can
install the PQM300 Program QoS Monitor client and operate the PQM300
from the network management station. See the PQM300 Program QoS
Monitor User Manual for PQM300 operating information. See Appendix D:
Software Installation and Repair for information about installing the
PQM300 client.
The client applications installed on network management stations are
identical to the transport monitor and program monitor client applications
with one important exception: the Server Manager installed on a network
management station can monitor up to 40 transport streams with acceptable
performance (up to 250 inputs theoretical maximum)
The Analysis Server module is not installed on the network management
stations.
H Remote Monitoring Desktop
Only the Master, Expert, and Configuration client modules (and required
program files) are installed on remote monitoring stations. Each remote
monitoring station can connect to an arbitrary number of Server Managers
running on remote transport monitors.
H HP Openview Network Node Manager plug-in
A Master client plug-in (and required program files) for HP Openview
Network Node Manager environment is installed.
MTM300 Series MPEG Transport Monitor User Manual
1- 7
Page 32

Getting Started
Options and Accessories
The tables in this section list the options and the standard and optional accessories available for the MTM300 Series transport monitor and software.
Options
Standard Accessories
Table 1--1 lists the options available when you purchase the MTM300 Series
MPEG Transport Monitor.
Table 1- 1: MTM300 Series transport monitor options
Option Description
MTM300
MTM301
Option AS A two-input ASI/M2S I/O daughter board
Option SS A two-input SSI (SMPTE310M) I/O daughter board
Option LC LCD display, touchscreen, keypad, keyboard, and mouse
Option VK External keyboard, monitor, and mouse
1
2
1
2
You must order one of the following: Option AS or Option SS
You must order two of the following (any combination): Option AS or Option SS
Transport monitor with one analysis board
Transport monitor with two analysis boards
Table 1--2 lists the standard accessories that are shipped with your transport
monitor. Use this list to ensure that your order is complete.
1- 8
Table 1- 2: Standard accessories for the transport monitor
Quantity Description Part number
1 MTM 300 Series MPEG Transport Monitor User Manual 071-0597-XX
1 CD-ROM disc, jewel case, and liner; contains
application software
1 CD--ROM disc, jewel case, and liner; contains transport
monitor operating system software
1 Read This First 071-0598-XX
1 Statement of ISO Compliance (in envelope) N/A
1 Emergency backup disk (3–1/4 inch floppy disk) N/A
1 Rackmount slides hardware kit N/A
1 Power cord (North American) 161-0066-00
2 Stylus (for use with the touchscreen, if ordered) 119-6107-00
063-3442-XX
063-3443-XX
MTM300 Series MPEG Transport Monitor User Manual
Page 33

Getting Started
Table 1- 2: Standard accessories for the transport monitor (cont.)
Quantity Part numberDescription
1 SCSI terminator (installed on the transport monitor) 650-4062-00
1 Front panel cover 200-4408-00
Table 1--3 lists the standard accessories for the MTM300 Series Network
Management Software (MTM3FMS).
Table 1- 3: Standard accessories for the network management software
Quantity Description Part number
1 MTM 300 Series MPEG Transport Monitor User Manual 071-0597-XX
Optional Accessories
1 CD-ROM disc, jewel case, and liner; contains
application software
1 Read This First 071-0598-XX
1 Software key 119-5927-00
1 License document 063-3158-00
063-3442-XX
Table 1--4 lists the optional accessories you can order for your transport monitor.
See your Tektronix representative for help ordering these optional accessories.
Table 1- 4: Optional accessories
Description Part number
MTM 300 Series MPEG Transport Monitor Service Manual 071-0601-XX
Two-input SMPTE310M I/O daughter board MTM3FSS
Two-input ASI I/O daughter board MTM3FAS
Analysis board MTM3FPIA
Portable cabinet kit with instructions 016-1929-XX
Power cord options:
Option A1 Universal Euro 230 V 161-0066-09
Option A2 United Kingdom, 230 V 161-0066-10
Option A3 Australian 240 V 161-0066-11
Option A5 Swiss 230 V 161-0154-00
MTM300 Series MPEG Transport Monitor User Manual
1- 9
Page 34

Getting Started
1- 10
MTM300 Series MPEG Transport Monitor User Manual
Page 35

Installation
Hardware Installation
This section describes how to install the MTM300 Series MPEG Transport
Monitor. It includes instructions for installing the transport monitor in a rack,
making the electrical connections necessary to begin monitoring transport stream
inputs, and provides brief requirements for using the transport monitor in a
TCP/IP network.
The factory installed cabinet is designed to operate in an equipment rack (see
Rackmount Installation on page 1--12). The optional portable cabinet allows you
to operate the instrument on a bench or cart (see Portable Installation on
page 1--17).
CAUTION. The transport monitor must be installed in the rackmount cabinet (not
the portable cabinet) when you install the instrument in a rack.
For proper cooling, provide at least two inches (5.1 cm) of clearance at the rear
and to the sides of the transport monitor, and ensure that the air temperature at
all air intake vents (inside of the rack) does not exceed 40
°C.
MTM300 Series MPEG Transport Monitor User Manual
1- 11
Page 36

Installation
Rackmount Installation
If your instrument has the rackmount cabinet, there is rackmounting hardware on
each side of the cabinet.
CAUTION. For proper cooling in an equipment rack installation, the air
temperature at all air intake vents (inside of the rack) must not exceed 40
Mounting the Stationary Tracks in the Equipment Rack. The s lider kit consists of
left and right stationary tracks that must be installed in the equipment rack. Extra
hardware is provided with the slider assemblies. Since the hardware is intended
to make the sliders compatible with a variety of racks and installation methods,
not all of the hardware will be used for any installation procedure.
1. Attach the extension bracket to the rear of the stationary track.
a. Measure the distance between the front and rear rails of the equipment
rack using method A or method B. Refer to Figure 1--2.
H Method A. If the extension bracket is to be mounted against the front
edge of the rear rail in the equipment rack, measure from the front
edge of the rear rail to the front edge of the front rail.
H Method B. If the extension bracket is to be mounted against the
inside surface of the rear rail in the equipment rack, measure from
the front corner of the rear rail to the front edge of the front rail.
°C.
b. Attach the extension bracket to the rear of the stationary track so that the
length of the combined assembly is approximately that of the measurement taken in step a. above. Use the screws and bar nuts provided with
the chassis tracks. Leave the screws loose.
2. Select the appropriate mounting holes in the front rails of the equipment
rack, observing the clearance measurements shown in Figure 1--3. The front
panel of the rack adapter is designed to fit in an 11-inch high opening.
1- 12
MTM300 Series MPEG Transport Monitor User Manual
Page 37

Method A Method B
Installation
Rear rail
10-32 PNH screw
Extension bracket
Stationary track
Bar
Nut
Use this measurement
Stop latch
hole
Automatic latchAutomatic latch
NOTE: Right-hand and left-hand stationary sections are designated by the
RH and the LH marked on the rails. Stop latch holes should be towards
the bottom when slides are in place. (The right hand rail is shown above.)
Figure 1- 2: Attaching the extension brackets to the stationary tracks
Rear rail
Extension bracket
Stationary track
Use this measurement
Adjacent equipment
Figure 1- 3: Mounting hole selection on the front rails of the equipment rack
MTM300 Series MPEG Transport Monitor User Manual
0.500 in.
1.75 in.
1- 13
Page 38

Installation
3. Mount the stationary sections (with extension brackets attached) to the front
and rear rails of the equipment rack.
a. Install the rear of the stationary section in front of, behind, or beside the
rear rail of the equipment rack. Use the mounting holes in the rear rails
that correspond to the same level as the front rail holes selected.
If the rear-rail mounting holes are tapped, the bar nut is not used to
attach the extensions. If the rear-rail mounting holes are not tapped, use
the bar nut on the inside of the rail, as shown in Figure 1--4A or use
suitable captive nut clips (not supplied). Figure 1--4B shows the
extension bracket mounted to the inside surface of the rear rail.
Method A Method B
Rear rail
10-32 PNH
screws
Bar nut (use
if rear rail is
not tapped)
Figure 1- 4: Attaching the extension bracket to the rear rail of the equipment rack
Rear rail
1- 14
MTM300 Series MPEG Transport Monitor User Manual
Page 39

Installation
b. Mount the stationary sections (with the bracket extensions) to the front
rails. If the front rails are not tapped, use the bar nuts. Refer to
Figure 1--5.
Front rail
Bar nut
(use if front rail
is not tapped)
10-32 PNH
screws
Figure 1- 5: Mounting the stationary section to the front rail of the equipment rack
4. Tighten the screws attaching the extension bracket to the stationary section.
Refer to Figure 1--6.
Tighten these screws
Figure 1- 6: Stationary bracket, extension bracket, and attaching screws
MTM300 Series MPEG Transport Monitor User Manual
1- 15
Page 40

Installation
Installing the Instrument in the Equipment Rack. Perform the following steps to
install the instrument in the equipment rack:
1. Pull out the intermediate sections of each slide-out track to the fully
extended position. Refer to Figure 1--7.
2. Insert the tracks of the rack adapter into the slide-out intermediate sections.
3. Press both stop latch releases and push the rack adapter toward the rack until
the latches snap into their holes.
4. Again press the stop latches and push the rack adapter fully into the
equipment rack.
1- 16
Figure 1- 7: Installing the instrument into the equipment rack
MTM300 Series MPEG Transport Monitor User Manual
Page 41

Installation
5. If necessary, adjust the alignment of the stationary sections according to the
following procedure:
a. Loosen the mounting screws at the front of both stationary sections.
b. Allow the tracks to seek their normal positions with the adapter centered
in the rack.
c. Tighten the mounting screws.
Portable Installation
Electrical Installation
The optional portable cabinet allows you to operate the instrument on a bench or
cart. If you operate the instrument while it rests on the rear feet, make sure that
you properly route any cables coming out of the rear of the instrument to avoid
damaging them. Table 1--4 on page 1--9 lists the part number of the portable
cabinet.
CAUTION. Keep the bottom of the instrument clear of obstructions to ensure
proper cooling.
The electrical operating requirements for the MTM300 Series transport monitor
are listed in Table 1--5. See Appendix A: Specifications for more detailed
electrical characteristics.
Table 1- 5: Electrical operating requirements
Requirement Specification
Source Voltage 100 VAC to 240 VAC
Fuse Rating 10 A Fast / 250 V
Maximum Power Consumption 185 Watts typical
Inrush Surge Current 36 Amps maximum
Power Factor Correction Yes
MTM300 Series MPEG Transport Monitor User Manual
1- 17
Page 42

Installation
Use the following procedure to make electrical, signal, and network connections:
CAUTION. Do not supply power to the instrument until after all connections have
been made.
1. After you have installed the transport monitor in a rack or mounted it on
your bench, connect the power cord (provided with the instrument) to the
power connector on the rear panel. See Figure 1--8.
2. Make the transport stream, network, and peripheral device connections
necessary for your environment using the connectors at the rear of the
instrument. See Figure 1--8 for the locations of these connectors.
Transport stream
inputs/outputs
Alarm relay
outputs
SVGA
monitor
LANPower
12 54
Input A
Output A
Input B
Output B
Figure 1- 8: MTM300 Series transport monitor rear panel connectors
89367101112
Printer
Keyboard
Mouse
SCSI terminator9-pin RS-232
1- 18
MTM300 Series MPEG Transport Monitor User Manual
Page 43

Table 1--6 describes the transport stream, network, and peripheral device
connectors. See Appendix A: Specifications for more detailed information
about each connector and the signal formats you can use for inputs to the
transport monitor.
Table 1- 6: Rear-panel connectors
Connector Description
Transport stream input / output
75 Ω BNC connectors for the following signal formats:
Installation
ASI Input
ASI Output
SMPTE310M Input
SMPTE310M Output
Alarm relay output 25-pin sub-D connectors for relaying alarms
Monitor 15-pin female high density-D-sub connector for SVGA monitor
Keyboard 2, Mini-DIN connectors for PS2 compatible keyboard (on rear
Mouse 2, Mini-DIN connectors for PS2 compatible mouse (on rear
Printer 25-pin sub-D connector for parallel communication
LAN (Ethernet) 10 Base-T/100 Base-T, RJ45 connector for Ethernet
RS-232/438 9-pin D-sub type connector for serial communication
SCSI Standard, PC compatible SCSI port
Accepts both Burst and Packet mode ASI formats and M2S
An active loop-through of the corresponding input
Compliant with SMPTE310M
An active loop-through of the corresponding input
and side panels)
and side panels)
communications
Each transport stream input has a corresponding output. The output BNC
connector is located immediately below the input BNC connector for each
pair of inputs and outputs. Each transport monitor supports up to eight inputs
as shown in Figure 1--8 on page 1--18.
The alarm relay connector pins described in Tables 1--7 and 1--8 are two
contacts of each relay . The relay closes during each ETR 290 priority 1 and
priority 2 error recorded by the transport monitor. The alarm relay board in
slot 8 relays errors detected on the inputs installed in slots 1 and 2 (inputs
1A, 1B, 2A, and 2B). The alarm relay board in slot 9 relays errors detected
on inputs installed in slots 4 and 5 (inputs 4A, 4B, 5A, and 5B). See Table
1--7 and Table 1--8 for the pin assignments for each relay board.
MTM300 Series MPEG Transport Monitor User Manual
1- 19
Page 44

Installation
Table 1- 7: Relay closure pin assignment for the relay
board in slot 8
Input Error Priority Pins
1A 1 4 and 17
2 3 and 15
1B 1 7 and 20
2 6 and 18
2A 1 10 and 23
2 9 and 21
2B 1 12 and 25
2 11 and 24
Table 1- 8: Relay closure pin assignment for the relay
board in slot 9
Input Error Priority Pins
4A 1 4 and 17
2 3 and 15
4B 1 7 and 20
2 6 and 18
5A 1 10 and 23
2 9 and 21
5B 1 12 and 25
2 11 and 24
1- 20
MTM300 Series MPEG Transport Monitor User Manual
Page 45

Installation
Alternative connectors for a mouse and keyboard are provided at the side
panel of the transport monitor. See Figure 1--9.
Earphones
USB
Keyboard
Mouse
Figure 1- 9: Keyboard and monitor connections
3. After you have installed the transport monitor and completed making the
signal, network and peripheral connections, plug the power cord into the
mains.
MTM300 Series MPEG Transport Monitor User Manual
1- 21
Page 46

Installation
Network Installation
The MTM300 Series MPEG Transport Monitor comes with the Microsoft
TCP/IP software pre-installed and is designed to operate in TCP/IP networks.
Your network or systems administrator may have already configured the TCP/IP
parameters for your transport monitor. If not, see Appendix C: Networking for
procedures to configure TCP/IP parameters.
To use the transport monitor, you need to specify the Server Managers to which
you will send error messages. Error messages, called traps, are generated by the
Analysis Servers and sent to one or more Server Managers running on the local
or remote host machines. (A host machine can be either a transport monitor, or a
personal computer with the remote desktop or network management software
installed.)
By default, the transport monitor is configured to send traps to the local Server
Manager (using the localhost loopback address as the trap target). If you are
installing the transport monitor into a networked system, you can also send traps
to one or more network management stations. See the procedures described in
Configuring the MTM300 Series MPEG Transport Monitor beginning on
page 1--28 for complete procedures on configuring host machines that have
MTM300 Series modules installed on them.
1- 22
MTM300 Series MPEG Transport Monitor User Manual
Page 47

Configuration
This section describes how to logon and power down the MTM300 Series
MPEG Transport Monitor, how to start and exit applications, and how to
configure the instrument.
Logging On to the MTM300 Series MPEG Transport Monitor
The default login configuration for the MTM300 Series transport monitor is to
automatically log onto Windows NT (using Administrator for the user name and
MPEG2 for the password). If the default configuration has not been changed,
you should perform step 1 from the following procedure, and you should not
have to enter a password or user name to log onto the transport monitor.
However, if you have changed the default configuration, use the following
procedure to log on to the transport monitor:
1. Switch the transport monitor power on to begin the Windows NT initialization process. See Figure 1--10. Initialization can take up to two minutes.
2. When the Begin Logon window appears, press CTRL + ALT + Delete (all
three keys simultaneously) to open the Logon Information window.
On/Stby switch
Figure 1- 10: On/Stby switch
MTM300 Series MPEG Transport Monitor User Manual
1- 23
Page 48

Configuration
3. Enter Administrator in the User name box.
4. Enter MPEG2 for the password, and then press Enter.
This is the login account you should use for most of your work. See Login
Passwords on page 1--24 for more information.
NOTE. You must use the “administrator” login when you perform any software
upgrades.
CAUTION. The “administrator” user has all the privileges of an administrator. If
you are connected to a network, you may have more privileges than you realize
within the network. Exercise caution when you use the administrator login.
Both the Server Manager and Analysis Servers are configured to start when you
start the transport monitor. You can check to see that the Server Manager and
Analysis Servers are running by looking for the icons in the system tray as
shown in Figure 1--11.
Login Passwords
Figure 1- 11: Server Manager and Analysis Server icons in system tray
Two Analysis Server icons per input capacity are displayed: one for MPEG-2,
DVB, and ATSC streams, and one for ISDB-S/ARIB streams. Usually, all of the
Analysis Server icons will be green, indicating that the Analysis Servers are
running. If the icons are not displayed, restart the Server Manager and Analysis
Servers. The easiest way to restart these services is to restart the transport
monitor. See Stopping and Restarting Analysis Servers and the Server Manager
on page 3--37 for an alternative procedure.
You can change the login passwords if necessary; refer to the Windows NT
documentation for instructions.
1- 24
MTM300 Series MPEG Transport Monitor User Manual
Page 49

Starting and Exiting the Master Client Application
Configuration
Starting the Master Client
To start the Master client, use one of the following techniques:
H Double-click the Master client icon in the Tektronix MPEG Transport
Monitor program group window.
H Select Master Client from the Tektronix MPEG Transport Monitoring
System program group as shown in Figure 1--12.
Figure 1- 12: The Tektronix MPEG Transport Monitor program group
Initially, the Master Client window is blank. To start monitoring an input,
connect to a Server Manager and configure your workspace.
H See the procedures in C onfiguring the MTM300 Series MPEG Transport
Monitor beginning on page 1--28 for information about configuring the
transport monitor to send traps to a Server Manager.
H See the Tutorial beginning on page 2--15 for procedures on connecting to a
Server Manager and configuring a workspace, or see related procedures in
Master Client Reference beginning on page 3--9.
Exiting the Master Client
MTM300 Series MPEG Transport Monitor User Manual
To exit the Master client, use one of the following techniques:
H Select Exit from the Master menu.
H Click the Close control button in the Master client title bar.
1- 25
Page 50

Configuration
Shutting Down the MTM300 Series MPEG Transport Monitor
There are three ways to shut down the transport monitor: two standard
approaches (depending on whether the transport monitor has a local user
interface), and one hard power down procedure.
Soft Power Down
Standard Power Down
The transport monitor has a soft power down capability that allows you to exit
Windows NT and put the transport monitor in standby. To use this capability,
first exit all open applications running on the transport monitor.
CAUTION. Exit all open applications running on the transport monitor before
using the soft power down capability. Some applications will prompt you to save
unsaved data before exiting. If you do not have a local user interface, you will
not see the prompt, and may lose data if you remove power to the transport
monitor before Windows NT exits.
To start the soft power down, press and release the On/Stby switch. After the
transport monitor goes into standby, you can restart it pressing the On/Stby
switch again.
To completely remove power to the instrument, disconnect the power cord at the
rear panel.
If your transport monitor has a local user interface, use the normal Windows NT
shutdown procedure to turn off the operating system as described below:
1. To avoid loss of data and possible problems during subsequent Windows NT
initialization, always shut down Windows NT before switching computer
power off. To shut down Windows NT, select Shut Down from the Start
menu as shown in Figure 1--13.
1- 26
Figure 1- 13: Shutting down the transport monitor
MTM300 Series MPEG Transport Monitor User Manual
Page 51

Configuration
2. Select Shut down the computer? in the resulting Shut Down Windows
dialog box shown in Figure 1--14, and then click Yes .
Figure 1- 14: Windows NT Shut Down Windows dialog box
3. After a few seconds, the Shutdown Computer window appears with the
message indicating that “It is now safe to turn off your computer.” You can
now put the MTM300 Series transport monitor into standby by pressing the
On/Stby switch. After the transport monitor goes into standby, pressing the
On/Stby switch will restart it.
Hard Power Down
CAUTION. Use the following procedure only if all other attempts to shut down the
transport monitor fail. The hard power down procedure can cause you to lose
data.
You can turn off the transport monitor in a emergency or other priority situation
by holding the On/Stby button in for about 3 or 4 seconds. This method is a hard
shutdown that can cause missing or corrupted files. The next time the transport
monitor is powered on, the operating system performs a check for missing or
corrupt files (SCAN DISK).
MTM300 Series MPEG Transport Monitor User Manual
1- 27
Page 52

Configuration
Configuring the MTM300 Series MPEG Transport Monitor
To monitor inputs, your transport monitor must be configured to send traps. By
default, the transport monitor is configured to send traps to the local Server
Manager. If your configuration has been changed (and you want to restore it to
the default configuration), or if you need to send traps to a network management
station, use the procedures described in this section.
Sending Traps to the
Local Server Manager
Use the following procedure to restore the default configuration of the transport
monitor to send traps to the local Server Manager:
1. Start the transport monitor.
2. Select Router from the Tektronix program group. The Router application is
displayed.
3. Click Home (shown at left) to display the list of host machines receiving
traps generated by the local Analysis Servers. The display may look similar
to Figure 1--15.
1- 28
Figure 1- 15: Router application showing two host machines
MTM300 Series MPEG Transport Monitor User Manual
Page 53

Configuration
4. To remove host machines from the list, select the host machine name and
click Remove.
5. If localhost is not displayed in the Router application, click Add.TheSNMP
Traps to Target dialog box is displayed as shown in Figure 1--16.
Figure 1- 16: SNMP Traps to Target dialog box
6. Enter localhost in the Computer Name text box.
7. After you have entered localhost, click in the IP Address text box. The IP
address and subnet mask are automatically completed for you as shown in
Figure 1--17.
Figure 1- 17: SNMP Traps to Target dialog box showing localhost IP parameters
8. Click Add when you are finished.
MTM300 Series MPEG Transport Monitor User Manual
1- 29
Page 54

Configuration
Now, when you return to the Router application, the localhost IP parameters
are displayed in the List of machines receiving traps selection box.
Figure 1--18 shows the default configuration for the transport monitor: only
the localhost is receiving traps.
Sending Traps to a
Network Management
Station
Figure 1- 18: Router application
9. Click OK. The Server Manager and the Analysis Servers are automatically
stopped and restarted, and then the Router application is dismissed. These
settings will remain in effect until you change them.
When you are finished performing this procedure, your transport monitor will
send traps to the network management station you specify. If you are installing
your transport monitor into a network managed by a different vendor’s software,
use the procedures described in the documentation from that vendor. If you are
installing your transport monitor into a network using the MTM300 Series
Network Management Software (MTM3FMS), use the following procedure:
NOTE. The Server Manager running on the network management station must be
running before a Server Manager on a transport monitor begins sending traps to
the network management station.
1. Start the transport monitor. (If necessary, log on to Windows NT as
Administrator.)
2. Select Router from the Tektronix program group. The Router application is
displayed.
1- 30
MTM300 Series MPEG Transport Monitor User Manual
Page 55

Configuration
3. Click Home. The Router application displays the list of host machines
receiving traps generated by the local Analysis Servers. See Figure 1--18 on
page 1--30. A host machine can be a transport monitor or network management station with a Server Manager.
4. Click Add. The SNMP Traps to Target dialog box is displayed.
5. Enter the computer name of the network management station in the
Computer Name text box.
You can get this name from your network administrator, or you can get it
from the Network dialog box on the network management station.
Right-click the Network Neighborhood icon on the Windows NT desktop
and select Properties from the shortcut menu to display the Network dialog
box.
6. After you have entered the name of the network management station to
which you will send traps, click in the IP Address text box. If the computer
name is recognized, the IP address and subnet mask are automatically
completed for you as shown in Figure 1--19.
Figure 1- 19: IP parameters for network management station
If the name is not recognized, enter the IP address by hand.
7. Click Add when you are finished.
MTM300 Series MPEG Transport Monitor User Manual
1- 31
Page 56

Configuration
When you return to the Router application, the IP parameters for the network
management station are displayed in the List of machines receiving traps
selection box as shown in Figure 1--20.
Configuring a Transport
Monitor for use in a Small
Network
Figure 1- 20: Network management stat ion added
8. Click OK to accept your changes and close the Router application window.
The Server Manager and the Analysis Servers are automatically stopped and
restarted, and then the Router application is dismissed. These settings will
remain in effect until you change them.
Some TCP/IP networks are quite small and do not require many of the features
available in larger TCP/IP networks such as DNS servers. The following
procedure allows you to set up a transport monitor for use in a small TCP/IP
network. In this procedure, you will modify the Hosts file to identify all of the
computers you will send traps to, and then use the Router application to specify
those host machines.
1. Start the transport monitor. (If necessary, log on to Windows NT as
Administrator.)
2. Open the Hosts file using Notepad. The Hosts file is used to map IP
addresses to host machine names and is located at the following location in
the Windows NT directory:
C:\winnt\system32\drivers\etc\Hosts
1- 32
MTM300 Series MPEG Transport Monitor User Manual
Page 57

Configuration
3. Use the following syntax to add the dotted decimal IP addresses of the
machine(s) to which you will be sending traps. Figure 1--21 shows an
example of the Host file after it has been edited.
IP Address HostMachineName
Figure 1- 21: Modified Hosts file
You can obtain the IP addresses and host machine names directly from the
Network and TCP/IP properties dialog boxes on the host machines, or you
can obtain them from your network administrator. Include at least one space
between the IP address and the host name.
4. Save the Hosts file and exit Notepad.
5. Use the Router application and the procedure described in Sending Traps to
the Local Server Manager beginning on page 1--28 to add the host machine
names of the computers receiving the traps (error messages) generated by the
Analysis Servers on the local machine.
MTM300 Series MPEG Transport Monitor User Manual
1- 33
Page 58

Configuration
1- 34
MTM300 Series MPEG Transport Monitor User Manual
Page 59

Functional Check
This section provides procedures for checking the performance of the MTM300
Series MPEG Transport Monitor. The following procedures are provided:
H Verifying the Performance of the MPEG-2 Components
H Verifying the Performance of the TMCC Components
H Verifying the Hardware Components
Verifying the Performance of the MPEG -2 Components
Use this procedure to verify the operation of the MPEG-2 components of the
MTM300 Series MPEG Transport Monitor.
NOTE. If you are using the transport monitor in a TMCC environment, perform
steps 1 through 7, cabling a TMCC stream input at step 1 and selecting the
TMCC input in step 7. After performing these modified steps, perform the
procedure described in Verifying the Performance of TMCC Components,
beginning on page 1--43.
If you have not already done so, perform the following procedures to prepare for
the functional check:
1. Cable a Transport Stream Input. Use the information provided in Electrical
Installation beginning on page 1--17 to provide a transport stream input to
one of the rear -panel connectors.
2. Start the Transport Monitor. Use the procedure described in Logging on to
the MTM300 Series MPEG Transport Monitor beginning on page 1--23.
3. Start the Master Client. Use the procedure described in Starting and Exiting
the Master Client Application beginning on page 1--25.
MTM300 Series MPEG Transport Monitor User Manual
1- 35
Page 60

Functional Check
Connect to the Local
4. Click the Home button in the Master client toolbar as shown in Figure 1--22.
Server Manager
Toolbar
Figure 1- 22: Master client initial toolbar and Home button
Edit a Workspace and
Select an Input
5. Select Edit from the Workspace menu. The Workspace dialog box is
displayed as shown in Figure 1--23. Your dialog box will show a different
mix of inputs.
Home
button
Navigation
frame
Figure 1- 23: Workspace dialog box with one input selected
6. Click in the left-hand column of the Selected multiplexes list box next to the
name of the input you will monitor. See Figure 1--23. (You can click Select
All to select all of the listed transport stream inputs.)
Selected
multiplexes
list box
1- 36
MTM300 Series MPEG Transport Monitor User Manual
Page 61

Functional Check
7. Click OK to accept your changes and close the dialog box. The Master client
should now look similar to Figure 1--24. The icons displayed are the default
icons for the multiplex (or transport stream) and services (or programs).
Multiplex
icon
Figure 1- 24: Monitoring a transport stream
Service
icons
MTM300 Series MPEG Transport Monitor User Manual
1- 37
Page 62

Functional Check
Start the Configuration
Client and Set ETR 290
Error Probes
8. Right-click the multiplex icon and select Configuration Client from the
shortcut menu as shown in Figure 1--25. The Configuration client is
displayed (see Figure 1--26).
Multiplex
icon
Figure 1- 25: Starting the Configuration client
Navigation panel Analysis Type group
Figure 1- 26: Choosing the analysis type
1- 38
MTM300 Series MPEG Transport Monitor User Manual
Page 63

Apply
button
Functional Check
9. Click Analysis in the Navigation panel and choose the appropriate analysis
type from the Analysis Type group as shown in Figure 1--26, where the
analysis type chosen is DVB.
10. Click ETR290 in the Navigation panel, and then click Add All as shown in
Figure 1--27.
Figure 1- 27: Adding all ETR290 probes
11. Click the Apply button. If you see a message asking whether you want to
restart the analysis, click Restart now, and then close the Configuration
client.
MTM300 Series MPEG Transport Monitor User Manual
1- 39
Page 64

Functional Check
If there are errors on the input, the Master client should now look similar to
Figure 1--28.
Figure 1- 28: Master client showing err ors on Cinestar
1- 40
MTM300 Series MPEG Transport Monitor User Manual
Page 65

Functional Check
Start the Expert Client
12. Click an input icon and then right-click a service icon (or double-click a
service icon), choosing a service icon that is displaying errors.
13. Select Expert Client from the shortcut menu. The Expert client is displayed
showing the errors occurring on the selected service (if any). See
Figure 1--29.
Figure 1- 29: Expert client showing er rors on Cinestar
MTM300 Series MPEG Transport Monitor User Manual
1- 41
Page 66

Functional Check
Verifying the Performance of the TMCC Components
Before performing the functional check, make sure that you have performed
steps 1 through 7 of Verifying the Performance of the MPEG-2 Software
Components beginning on page 1--35 (these procedures instruct you to cable an
input, in this case a TMCC input; start the transport monitor; and start and
configure the Master client).
Set TMCC Probes
1. Right-click the multiplex icon representing the TMCC transport stream
input, and then select TMCC Configuration Client from the submenu.
2. After the TMCC Configuration Client is displayed, click Analysis in the
Navigation panel and ensure that the Stream type selected is appropriate for
your input. S_TMCC streams (TMCC basic streams) are TMCC multiplexes
with a single transport stream. M_TMCC streams (TMCC data streams) are
TMCC multiplexes with multiple transport streams. You need to select the
correct stream type for the TMCC Expert Client to synchronize to the input.
3. Click Add All and notice that a number of probes are added to the List of
Probes selection box. See Figure 1--30.
Figure 1- 30: Probes added in the TMCC Configuration Client
1- 42
MTM300 Series MPEG Transport Monitor User Manual
Page 67

Functional Check
The exact number of probes added will vary, depending on whether you are
analyzing a TMCC basic or TMCC data stream. Data streams are analyzed
for the TMCC Update counter, whereas basic streams are not.
4. Click Apply to save your changes.
5. Exit the TMCC Configuration Client and return to the Master Client. If the
transport stream you are analyzing has TMC C errors, you should see an error
icon in the details panel.
Display the TMCC Expert
Client
6. Right--click the Multiplex icon for the input you just configured, and then
select TMCC Expert Client from the submenu.
7. Confirm that the TMCC Expert Client displays with data in the Slots,
Syntax, Dump, and Report view frames. See Figure 1--31.
Figure 1- 31: TMCC Expert Client
8. Exit the TMCC Expert Client and return to the Master Client.
MTM300 Series MPEG Transport Monitor User Manual
1- 43
Page 68

Functional Check
Set ARIB Table Probes
Display the Section Rate
using the MPEG-2 Expert
Client
9. Right--click a Multiplex icon representing a TMCC stream and select
Configuration Client from the submenu.
10. In the Analysis Panel of the Configuration Client, select ISDB (this panel is
the default panel displayed when first starting the Configuration Client).
11. Select Rate | Section in the Navigation panel, and configure the Analysis
Server to check that the DCT is updated at least every .0001 seconds (the
rate, 0.1 Mbps, is a much higher rate than standard and will generate errors
from the Analysis Server).
12. Apply your changes, restarting the Analysis Server when prompted, and then
exit the Configuration Client.
13. Confirm that errors are being reported for the input you just modified.
14. In the Master Client, click the Multiplex icon for the input you just
configured, and then right-click the TMCC Service icon displaying an error
and select Expert Client from the submenu.
15. When the Expert Client is displayed, locate a DCT icon in the Hierarchic
view.
16. Right-click the DCT icon select Section Rate from the submenu.
17. In the dialog box that is displayed, select one of the section numbers and
click OK.
18. Confirm that the client area of the Expert Client changes to show the section
rate analysis of the selected element.
19. Quit the Expert Client.
1- 44
MTM300 Series MPEG Transport Monitor User Manual
Page 69

Verifying the Hardware Components
Each transport monitor is shipped with a Hardware Diagnostic application that
verifies the performance of the hardware components of the MTM300 Series
MPEG Transport Monitor. Using this tool, you check the following parameters:
H Board access
H Process paths
H Stream paths
H I/O parameters
H External connections
You will not check the external connections during this functional check. For
more detailed information about the Hardware Diagnostic tool, see Appendix B:
Cleaning and Maintenance.
1. Select Hardware Diagnostic from the Tektronix MPEG Transport Monitor
program group. The Pia+ Diagnostic Self Test application is displayed as
shown in Figure 1--32 on page 1--46.
Functional Check
2. Click the Home button as shown in Figure 1--32.
MTM300 Series MPEG Transport Monitor User Manual
1- 45
Page 70

Functional Check
Figure 1- 32: Hardware diagnostic tool
3. Use the default selections as shown in Figure 1--33 and click Start. You will
be prompted to stop the Analysis Servers and Server Manager. Click OK
Figure 1- 33: Default self test selections
4. If you see a message indicating that the Analysis Servers will be stopped,
click OK.
1- 46
MTM300 Series MPEG Transport Monitor User Manual
Page 71

Functional Check
5. During the course of the self test, the Pia+ Diagnostic Self Test application
window updates showing the progress of the tests. See Figure 1--34 on
page 1--47.
Test control area
Test summary area
Test details area
Figure 1- 34: Self test in progress
H The test control area indicates which tests are being performed and the
progress of each test:
H A yellow LED icon indicates the test is in process.
H A green LED icon indicates that the test is completed and passed.
H A red LED icon indicates that the test failed, and the self test stops.
H The test summary area displays a summary of each test checked in the test
control area. This section updates with a summary of the test results when all
tests for that set of diagnostics has been performed.
H The test details area records details about each test as it is being performed.
MTM300 Series MPEG Transport Monitor User Manual
1- 47
Page 72

Functional Check
When the self test is complete, you can save the details of the self test by
right-clicking in the test details area, and then selecting Save Report from the
shortcut menu as shown in Figure 1--35. You will be prompted for a file
name using a standard Save As dialog box.
Figure 1- 35: Saving test results
6. When the test is completed, the Analysis Servers will restart.
This completes the Functional Check.
If you encountered any errors while performing these procedures, refer to other
sections of this manual or in the optional MTM300 Series MPEG Transport
Monitor Service Manual for additional information about the transport monitor.
If you cannot resolve your problems using these resources, call your Tektronix
representative.
1- 48
MTM300 Series MPEG Transport Monitor User Manual
Page 73

Operating Basics
Functional Overview
NOTE. If you are not familiar with the Windows 95 or Windows NT 4.0 operating
systems, review the Windows NT documentation that accompanied your test
system.
This section provides a functional overview of the MTM300 Series MPEG
Transport Monitor client modules and a tutorial that will show you how the
modules work together. The rear-panel description is provided in Getting Started
beginning on page 1--17.
Functional Overview describes the following MTM300 Series elements:
H Master Client page 2--2
Describes the parts of the Master client application window that allow you to
monitor transport stream inputs at various levels of detail.
H Configuration Client page 2--6
Describes the parts of the Configuration client application window that allow
you to quickly and easily set probes on transport stream inputs.
H Expert Client page 2--4
Describes the parts of the Expert client application window that allow you to
analyze in detail the characteristics of a transport stream input and the errors
occurring on that input.
H TMCC Expert Client page 2--7
Describes the parts of the TMCC Expert client application window that
allow you to analyze the characteristics of a transport stream input and the
errors occurring on that input.
H TMCC Configuration Client page 2--10
Describes the parts of the TMCC Configuration client application window
that allow you to set probes on TMCC transport stream inputs.
H Front Panel page 2--12
Describes the front-panel controls. The front panel user interface is an option
and this section may not pertain to your configuration.
MTM300 Series MPEG Transport Monitor User Manual
2- 1
Page 74

Operating Basics
Bouquet
panel
Master Client
The Master client views and elements enable you to monitor the results of the
analyses being performed by Analysis Servers on up to eight transport stream
inputs. See Figure 2--1. The Master client also allows you to monitor Video QoS
measurements performed by a remote PQM300 Program QoS Monitor.
Address bar
Selection Indicator barMultiplex panel
Services
panel
Figure 2- 1: The Master client application window
Note the following characteristics of the Master client window in Figure 2--1
(following the named items starting at the Bouquet panel and working clockwise):
H The Bouquet panel shows that three bouquets are being monitored, one
(Bouquet 1) has no errors, and Bouquet 3 is selected.
H The Multiplex panel shows the inputs configured for the bouquet selected in
the Bouquet panel. Bouquet 3 includes three transport stream inputs
(multiplexes) on inputs 1A, 1B, and 2A. No errors are being detected on
input 1A, errors are detected on input 1B, and input 2A has lost synchronization.
2- 2
Details panelError gauge
MTM300 Series MPEG Transport Monitor User Manual
Page 75

Operating Basics
H The Address bar shows that the Master client is connected to the Server
Manager running on jam20.
H The Selection Indicator bar shows the currently selected items in the
Bouquet, Multiplex, and Services panels, respectively.
H The Services panel shows the services encoded on the input selected in the
Multiplex panel. Input 1B is the currently selected input, and errors have
been detected on all inputs. FUN TV is the currently selected service.
H The Details panel shows the status, types, and severity of errors occurring on
the currently selected service (or multiplex). FUN TV is experiencing an
array of errors. The most serious error is a major error.
H The Error gauge displays the severity of the most recent error for the service
(or multiplex) displayed in the Details panel. It shows that a current major
error exists on FUN TV.
See Master Client Reference for more detailed instruction on using the Master
client. See the tutorial later in this section for an introduction to using the Master
client. See the PQM300 Program QoS Monitor User Manual for operating
information about the PQM300.
MTM300 Series MPEG Transport Monitor User Manual
2- 3
Page 76

Operating Basics
Hierarchic
view
Expert Client
The Expert client views and elements show the detailed results of analyses being
performed on one transport stream input. See Figure 2--2.
Machine name
Input number
Client
area
Report view
toolbar
Hierarchic panel of
the Report view
Figure 2- 2: The Expert client application window
Note the following characteristics of the Expert client window in Figure 2--2
(following the named items starting at the Hierarchic view and working
clockwise):
H The Hierarchic view shows the structure of the transport stream you are
monitoring. The hierarchy shown is based on the transport stream elements.
For instance, since the Program Map Table (PMT), and the program
elements the PMT references, are referenced by the Program Allocation
Table (PAT), the PMT icons are shown subordinate to the PAT icon.
H The Address bar shows that the Expert client is connected to the Analysis
Server analyzing input 1A on the machine named oxford6.
Messages panel of
the Report view
2- 4
MTM300 Series MPEG Transport Monitor User Manual
Page 77

Operating Basics
H The Client area is displaying the Program Allocation panel, which is one of
the panel in the Statistics view. The Statistics view panels display statistical
information about the input stream to which the Expert client is connected.
Other views can also be displayed in the Client area. These views are
accessed using shortcut menus displayed when you right-click an icon in the
Hierarchic view.
H The Messages panel of the Report view shows the errors occurring on the
input selected in the Hierarchic panel of the Report view. You can display
more detail about a specific error by double-clicking the line on which the
error is reported.
H The Hierarchic panel of the Report view allows you to select different ways,
or modes, of displaying errors or statistics about the transport stream being
analyzed. The mode of the Report view is determined using the toolbar to
the left. The current mode is Program and FUN TV is selected.
NOTE. This is the way the Expert client would be displayed if you double-clicked
FUN TV in the Services panel of the Master client.
H The Report view toolbar allows you to change the mode of the Report view.
Using this toolbar you can display errors grouped in one of four logical
modes: by program, ETR290 priority, error type, or error severity.
MTM300 Series MPEG Transport Monitor User Manual
2- 5
Page 78

Operating Basics
Navigation
panel
Configuration Client
The Configuration client views and elements allow you to quickly and easily set,
modify, and remove probes for analyzing and monitoring transport stream inputs.
See Figure 2--3.
Address bar
Selection
indicator bar
Configuration
panel
Probe type area
Figure 2- 3: The Configuration client application window
Note the following characteristics of the Configuration client window in
Figure 2--3 (following the named items starting at the Navigation panel and
working clockwise):
H The Navigation panel allows you to quickly choose the category of error for
which you want the Analysis Server to probe. The currently selected error
category is ETR290.
H The Address bar shows that the Configuration client is connected to the
Analysis Server that is analyzing input 1A on oxford6.
Probe list
2- 6
MTM300 Series MPEG Transport Monitor User Manual
Page 79

Operating Basics
H The Selection Indicator bar shows the item currently selected in the
Navigation panel.
H The Configuration panel allows you to specify probes for the connected
Analysis Server and changes depending on the item selected in the Navigation panel.
H The Probes list shows the specific probes set for the connected Analysis
Server. It also displays the probe limits, PID numbers, and other variables for
each probe.
H The Probe type area allows you to add, modify, and remove specific probes.
In most cases, you can also define various probe parameters used by the
Analysis Server when analyzing the input shown in the Address bar.
Toolbar
Slots
panel
TMCC Expert Client
The Expert client views and elements show the detailed results of analyses being
performed on one transport stream input. See Figure 2--4.
Address bar
Selection
indicator bar
Dump panel
Status
bar
Figure 2- 4: The TMCC Expert client application window
MTM300 Series MPEG Transport Monitor User Manual
Message
panel
2- 7
Page 80

Operating Basics
Note the following characteristics of the TMCC Expert client window in
Figure 2--4:
H The Slots panel uses three columns to show the following information:
H The slot number (1 through 48)
Note the following relationships between packets, slots, frames, and
super frames:
H A slot corresponds to one MPEG-2 TS packet with error coding (a
204-byte packet)
H A frame is made up of 48 slots (48, TMCC TS packets)
H A super frame is eight frames
H The transport stream ID associated with each slot (if no TSID is
associated with a slot, Unassigned is indicated)
H The modulation mode, and the total and effective number of slots for
each mode
Modulation modes (BSPK, QPSK, and TC8PSK) for each slot are indicated
in text and are color coded, as shown in Table 2--1.
NOTE. When the modulation mode and the number of slots are not consistent, the
color for the modulation mode is red.
Table 2- 1: Modulation mode color scheme
Modulation mode Color code
BSPK (1/2) Dark green
QPSK (1/2) Purple
QPSK (2/3) Light green
QPSK (13)4 Yellow
QPSK (5/6) Brown
QPSK (7/8) Dark blue
TC8PSK (2/3) Light blue
H The following toolbar buttons allow you to control the TMCC Expert Client:
2- 8
H Freeze. Pauses the analysis of the input, causing the current display to
become static.
MTM300 Series MPEG Transport Monitor User Manual
Page 81

Operating Basics
H Start. Starts moving transport stream data through the capture memory
buffer. This button is disabled until you enable a manual capture of a
transport stream.
H Record. Starts the manual capture of the transport stream input. This
button is disabled until you enable a manual capture of a transport
stream.
H Stop. Stops the movement of transport stream data through the capture
memory buffer. This button is disabled until you enable a manual capture
of a transport stream and click the Record button.
H The Address bar shows the machine (IP address or machine name) and
TMCC Analysis Server (input) to which the TMCC Expert client is
connected.
H The Syntax panel shows the TMCC data in the transport stream. Parameter
names and values are shown for ID and Transmission mode and slot
information for single TMCC data streams. This panel is interactive;
selecting icons in the hierarchic view of the Syntax panel changes the display
in the right part of the Syntax panel.
H The Dump panel displays the hexadecimal values of the TMCC data.
H The Messages panel displays error, warning, and information messages
generated by the TMCC Analysis Servers.
H The status bar indicates the status of the TMCC Expert Client connection to
the Analysis Server, the instantaneous rate of the transport stream, and
whether the Analysis Server is synchronized to the input.
MTM300 Series MPEG Transport Monitor User Manual
2- 9
Page 82

Operating Basics
TMCC Configuration
Toolbar
Navigation
panel
Client
The TMCC Configuration client views and elements allow you to quickly and
easily set, modify, and remove probes for analyzing and monitoring TMCC
transport stream inputs. See Figure 2--5.
Address bar
Configuration
panel
Status bar
Probe list
Figure 2- 5: The TMCC Configuration client application window
Note the following characteristics of the Configuration client window in
Figure 2--5:
H The Navigation panel allows you to navigate to one of the three Configura-
tion panels used to configure the TMCC Analysis Server:
H The toolbar displays allows you to perform the following actions:
H The New button allows you to create a new configuration for the
Analysis Server to which you are connected. The new configuration of
probes, inputs and outputs, trigger, and sync bytes will be applied to the
new configuration file (a *.cnf file).
H The Load button displays the Open dialog box, allowing you to open a
saved configuration file (a *.cnf file). The default location for saved
configuration files is the C:\MTM300\bin directory.
2- 10
MTM300 Series MPEG Transport Monitor User Manual
Page 83

Operating Basics
H The Save button opens the Save dialog box, allowing you to name the
current configuration. The .cnf file name suffix is appended automatically.
H The Apply button applies the current configuration of the TMCC
Configuration Client to the Analysis Server shown in the Address bar.
H The Address bar shows the machine (IP address or machine name) and
TMCC Analysis Server (input) to which the TMCC Configuration client is
connected.
H The Configuration panel displays the configuration options. Each panel
allows you configure different aspects of the TMCC analysis.
H Input panel. This panel allows you to configure the input and output
format, the triggering mechanism, and the number of sync bytes to test
before reporting a synchronization error.
H Analysis panel. This panel allows you to set the multiplex type (single or
multiple transport stream multiplexes), the transport stream ID for
MPEG analysis, and the TMCC probes you will use to analyze the input.
H Data Storage panel. This panel allows you to configure the errors upon
which the TMCC Expert Client will automatically trigger a data capture.
H The Probe list shows the probes that are set on the input shown in the
Address bar.
H The Status bar displays the status of the connection between the TMCC
Configuration Client and the Analysis Server.
MTM300 Series MPEG Transport Monitor User Manual
2- 11
Page 84

Operating Basics
Front Panel
The default front panel configuration is blank with the exception of the On/Stby
button and the 3–1/4 inch floppy disk and CD-ROM drives. If you ordered the
front panel option with your monitor, your instrument will look similar to
Figure 2--6.
Keypad
Floppy disk drive
(standard)
CD-ROM drive
(standard)
Touch screen
Figure 2- 6: Front-panel elements
This section shows how to use the touch screen features. Table 2--2 describes the
keypad controls, Table 2--3 lists touch screen techniques for working with the
Master client. Use similar techniques for the Expert and Configuration clients.
CAUTION. Do not use sharp or abrasive objects to perform operations using the
touch screen. Using sharp or abrasive objects can damage the LCD display.
Included as a standard accessory with all transport monitors is a stylus that gives
you more precise control over the items you touch on the touch screen.
2- 12
MTM300 Series MPEG Transport Monitor User Manual
Page 85

Operating Basics
Table 2- 2: Front panel-key controls
Control name M echanism Description
Up Arrow Button Use to navigate and change focus from
Left Arrow Button
Right Arrow Button
Down Arrow Button
Select Button Same as the space key.
Adjust Knob Knob (Rotary encoder) Not enabled.
Run/Stop Button Not enabled.
Esc Button Standard Escape key.
Tab Button Standard Tab key.
Print Button Prints the current display.
Touch Button (w/hand icon) Toggle function not enabled. The touch
onewindow function toanother.
screen is always on.
Menu (Application key) Button (w/pointer icon) Displays shortcut menus for selected
items.
Help Button Opens the Help contents. Standard F1 key
Print Screen Button (w/printer icon) Copies the screen to the clipboard. Alt plus
Print Screen copies the active window.
START Key Button (w/Windows logo) Opens the Windows Start menu.
Numbers 0 to 9, . (period), and -- (minus
Fctn ButtonwithLED Modifier for numeral keys to create keys
Del Button Deletes selected text or object.
Ctrl ButtonwithLED Control key. LED indicates when keypad is
Alt ButtonwithLED Alternate key. LED indicates when keypad
Space Button Use it like a keyboard space bar or use it
Buttons Standard number keys, most have second
(Shift) and third (Function) functions.
F1 through F12. LED indicates when
active.
Button Backspace key.
Button Enter key.
in control mode.
is in alternate mode.
as mouse button 1
Shift ButtonwithLED Shift key. LED indicates when keypad is in
MTM300 Series MPEG Transport Monitor User Manual
shift mode. Locked mode key feature.
2- 13
Page 86

Operating Basics
NOTE. Some of the functions of the Expert and Configuration clients require the
use of an external keyboard and mouse.
Table 2- 3: Touch screen techniques
Task Action
Highlighting an item Touch the item.
Selecting an item
Making a menu selection Touch the menu name, and then touch the menu item.
Moving a window Touch and drag the title bar of the window without lifting the
stylus from the touch screen.
Displaying shortcut menus Touch an icon that has a shortcut menu associated with it (for
instance, a multiplex or service icon) and press the Menu
button from the keypad.
Checking or clearing option
boxes
Entering values in text boxes Touch the text box until a cursor appears in the text box, and
Scrolling through a list Touch the scrolling list until a cursor appears in the list, and
Scrolling a window Touch and drag a scroll bar without lifting the stylus from the
Resizing windows Touch and drag the lower right corner of the window to the
Following links in the online
help
Expanding or collapsing a
hierarchy
Copying text or other values Touch and drag over the area you want to copy, and then press
Pasting text or other values Touch the area into which you want to paste the contents of the
Touch the option name or check box.
then enter values using the keypad. (Only numeric values and
the letters M, k, m, u, n, and p can be entered from the
keypad.)
then press the Down Arrow button from the keypad.
touch screen.
desired size without lifting the stylus from the touch screen.
Touch the link text.
Double-tap the touch screen item at the point you want to
expand or collapse a hierarchical display, or touch the
Expand/Collapse control next to the item name.
the Shift button followed by the Copy button on the keypad.
clipboard, and then press the Shift button followed by the
Paste button on the keypad.
2- 14
MTM300 Series MPEG Transport Monitor User Manual
Page 87

Tutorial
This section contains a step-by-step tutorial that will introduce you to the
capabilities and features of the three MTM300 Series MPEG Transport Monitor
Master, Expert, and Configuration client modules. Refer to the Reference section
for detailed operating information for each client module.
Perform this tutorial with your own input stream, and then spend some time
experimenting with the various monitoring, configuration, and analysis options.
The sections of the tutorial begin on the following pages:
H Starting the Master Client page 2--16
H Connecting to the Local Server Manager page 2--17
H Configuring the Master Client Workspace page 2--17
H Monitoring Transport Stream Inputs page 2--19
H Configuring the Analysis Servers page 2--25
H Configuring the Data Logging Function page 2--28
H Analyzing a Stream Using the Expert Client page 2--29
Preliminary Setup
For information about using the client modules not described in this tutorial, see
the relevant sections of the Reference section:
H TMCC Expert Client page 3--209
H TMCC Configuration Client page 3--219
Connect an input to the rear panel of the instrument, start the transport monitor,
and configure the Server Manager on the local transport monitor to send traps to
itself. Refer to the relevant sections of Getting Started if you have not yet
performed these tasks.
NOTE. If you are not familiar with the Windows 95 or Windows NT 4.0 operating
systems, review the Windows NT documentation that accompanied your test
system.
MTM300 Series MPEG Transport Monitor User Manual
2- 15
Page 88

Tutorial
Starting the Master Client
Use the following procedure to start the Master client:
1. Click Start, point to Programs and Tektronix MPEG Transport Monitor.
2. Click Master Client. An empty Master client window is displayed as shown
in Figure 2--7.
You can also double-click the Master client icon in the Program Group
window on your desktop.
2- 16
Figure 2- 7: Empty Master client application window
MTM300 Series MPEG Transport Monitor User Manual
Page 89

Connecting to the Local Server Manager
Before you can start monitoring inputs, you must connect the Master client to a
Server Manager. The Server Manager (represented by the life preserver icon in
the system tray) collects the information generated by the Analysis Servers about
the transport stream errors and statistics. There are several ways to connect to a
local Server Manager, but for this tutorial, use the simplest technique:
3. Click the Home button on the Master client toolbar as shown in Figure 2--7.
The toolbar changes and the Server Manager to which you are connected is
displayed in the Address bar.
Configuring the Master Client Workspace
Using the Workspace dialog box you can create one or more bouquets (collections of inputs), and specify the types of errors you want to monitor in the
Master client.
Tutorial
Navigation
panel
Create a Bouquet
4. Click the Edit button on the toolbar. The Workspace dialog box is displayed.
5. Highlight the Bouquet Selection item in the Navigation panel as shown in
Figure 2--8. The Bouquet Selection panel is displayed.
Selected
inputs
Bouquet names
Figure 2- 8: Creating workspace bouquets
MTM300 Series MPEG Transport Monitor User Manual
Bouquet selection panel
2- 17
Page 90

Tutorial
6. Change the Bouquet Selection panel so that it looks similar to Figure 2--8.
Specify Errors to Monitor
Analysis display options
7. Highlight Graphics in the Navigation panel and the Graphics panel is
displayed. Using this panel you can change the way your Master client
reports errors and displays icons.
8. Change the Analysis display options to show only Critical and Major errors
as shown in Figure 2--9.
Figure 2- 9: Changing the analysis display options
9. Click OK to apply your changes and return to the Master Client.
Experiment with the other options available in this dialog box. Return to the
Master client when you are ready to continue with the tutorial.
2- 18
MTM300 Series MPEG Transport Monitor User Manual
Page 91

Monitoring Transport Stream Inputs
After creating a workspace, your Master client window should look similar to
Figure 2--10; except that you have not yet associated any logos with services.
(You will do this later in the tutorial.)
Multiplex panel
Tutorial
Selection
indicator bar
Bouquet panel
Error gauge
Figure 2- 10: Master client monitoring inputs
In this part of the tutorial you will learn how to interpret the icons used by the
Master client to indicate errors, and you will learn how the different Master
client panels allow you to see different levels of detail regarding the errors
occurring on the input.
Services
panel
Details panel
MTM300 Series MPEG Transport Monitor User Manual
2- 19
Page 92

Tutorial
Use the Bouquet Panel
10. Select one of the bouquet icons in the Bouquet panel. In Figure 2--10
Bouquet 2 is selected.
If your input is displaying any critical or major errors, you will see error
icons overlaying the icons in the bouquet panel (as well as the icons in the
Multiplex and Services panels). Table 2--4 describes the different icon states.
Table 2- 4: Error icon states
Icon state Description
Red. This icon indicates that a critical, major, or minor error is currently
being experienced on the indicated bouquet, multiplex, or service.
Orange. This icon indicates that a critical, major, or minor error was
recorded on the indicated bouquet, multiplex, or service, but that no error
condition currently exists.
Yellow. This icon indicates that a warning is currently being experienced on
the indicated bouquet, multiplex, or service.
Notice that the Details panel is blank, and that Bouquet 2 (or the similar text
for your bouquet name) appears in the Selection Indicator bar. The Details
panel is blank because you have not clicked an input icon in the Multiplex
panel.
Use the Multiplex Panel
11. Select one of the icons in the Multiplex panel.
Notice the changes to the Details panel and the Selection Indicator bar.
Notice also that when you select an icon in the Multiplex panel that the Error
gauge changes. The Error gauge shows you the severity of errors being
recorded on the selected item. Table 2--5 describes the Error gauge states.
Table 2- 5: Error gauge icon states
Icon state Description
Red. This icon indicates at least one critical error is detected for the
selected multiplex or service.
Red. This icon indicates at least one major error is detected for the sel ected
multiplex or service. No critical errors are detected.
Red. This icon indicates at least one minor error is detected for the multiplex
or service. No critical or major errors are detected.
2- 20
MTM300 Series MPEG Transport Monitor User Manual
Page 93

Tutorial
Table 2- 5: Error gauge icon states (cont.)
Icon state Description
Yellow. This icon indicates at least one warning condition is detected for the
selected multiplex or service. No critical, major, or minor errors are detected.
Green. This icon indicates that no current errors or warning conditions are
being recorded for the selected service or input.
In an earlier step, you set the workspace to show only critical or major
errors. So, your error gauge should like the first, second, or last icons in
Table 2--5.
The icons that are displayed in the Details panel when you click a Multiplex
icon are described in Table 2--6 on page 2--23.
12. Right-click in the Multiplex panel and experiment with the shortcut menu
items.
Use the Services Panel
13. Click one of the icons in the Services panel experiencing errors. As you roll
your cursor over an icon in the Services panel, a tool tip is displayed
showing you the transport stream ID and service ID pair for the service.
Notice the changes to the Details panel and the Selection Indicator bar. The
Details panel shows a different set of icons than those that were displayed
when an Multiplex icon was selected (descriptions for the icons are shown in
Table 2--7 on page 2--24).
14. Right-click an icon in the service panel, and then select Associate Logo from
the shortcut menu.
15. Navigate to the Logos folder and choose a *.jpg or *.bmp file that you want
to associate with the selected service.
16. Click OK. You are returned to the Master client, and the logo is displayed in
place of the default service icon.
A folder with JPEG files suitable for your use is included with each
MTM300 Series system installation. The location of the folder is
C:\MTM300\Bin\Logos\.
NOTE. Some service providers do not allow their logos to be used without
permission. Check with the service provider before you use their logo.
MTM300 Series MPEG Transport Monitor User Manual
2- 21
Page 94

Tutorial
You can also go to the following URL to download logos for satellite
services: http://www.satlogo.com/ (this link was valid as of January, 2001.)
After you have associated all of your service icons with a logo, the Master
client should look similar to Figure 2--11.
2- 22
Figure 2- 11: Master client showing errors on a service
17. Right-click again in the service panel and choose Details from the shortcut
menu.
The Services panel changes to show a tabular display that lists the more
information about each service.
18. Click and drag the left border of the Services panel to display all of the
columns in the Details view as shown in Figure 2--12 (you can do the same
thing with all of the internal panel borders).
MTM300 Series MPEG Transport Monitor User Manual
Page 95

Tutorial
Figure 2- 12: Services panel details view
You can sort the inputs shown in this view by clicking on the column
headers.
19. Experiment with some of the other Services panel shortcut menu items, and
then return the Services panel to display Large Icons when you are finished
and ready to proceed with the tutorial.
Use the Details Panel
20. Select a Multiplex icon and notice again the change to the Details panel. The
icons in this panel indicate the types, severity, and status of errors occurring
on the multiplex at the transport stream level. Table 2--6 describes the icons
displayed in the Details panel when a Multiplex icon is selected.
Table 2- 6: Multiplex level Details panel icons
Icon Description
Indicates that a current error for a PAT, CAT, or EMM is detected for the
selected multiplex. This icon can also indicate general errors, such as sync
loss.
Indicates a current error in one or more SI, PSIP, or ARIB parameters for the
selected multiplex.
The colors used for these icons follow the same paradigm as do the rest of
the error icons for the Master client:
H Red indicates that a critical, major, or minor error is currently being
experienced on the item.
H Orange indicates that a critical, major, or minor has occurred on the item,
but that an error does not currently exist.
H Yellow indicates that a warning condition is currently being experienced
on the item.
MTM300 Series MPEG Transport Monitor User Manual
2- 23
Page 96

Tutorial
21. Now, select a Services panel icon and note again the changes to the Details
panel.
When a Services icon is selected the Details panel icons show the type,
severity, and status of the errors occurring on the multiplex at the service, or
program level. Table 2--7 describes the icons displayed in the Details panel
when a Services panel icon is selected.
Table 2- 7: Service (or Program) level Details panel icons
Icon Description
Indicates a PCR error is detected for the selected service.
Indicates that a rate or syntax error in the PMT, SDT, or EIT for the service is
detected.
Indicates that an error concerning a video component of the service is
detected.
Indicates that an error concerning an audio component of the service is
detected.
Indicates that a current error concerning the data components for the
selected service is detected.
Indicates that an error concerning the ECM components of the service is
detected.
Indicates that a PQM300 Program QoS error is detected (only displayed
when a PQM300 probe is set on the video component of a monitored
program).
2- 24
MTM300 Series MPEG Transport Monitor User Manual
Page 97

Configuring the Analysis Servers
In this part of the tutorial, you will learn how to start the Configuration client
from the Master client and how to change the configuration of the Analysis
Server on the input selected in the Master client.
22. Right-click an icon in the Multiplex panel and select Configuration client
from the shortcut menu. The Configuration client is displayed and is
connected to the input you selected in the Master client (notice the
machineName and inputNumber in the Address bar). See Figure 2--13.
Tutorial
Expand/
Collapse boxes
Navigation
panel
Machine name
Input number
Analysis
panel
Configuration panel
names
Figure 2- 13: Connected to the Configuration client
See Configuration Client on page 2--6 for an overview of the Configuration
client display elements. See Configuration Client Reference beginning on
page 3--159 for detailed information about the Configuration client and setting
probes.
MTM300 Series MPEG Transport Monitor User Manual
2- 25
Page 98

Tutorial
Select the Analysis Type
Set ETR290 Probes
Apply button
23. Expand the hierarchy in the Navigation panel so that it looks similar to
Figure 2--13 by clicking on the expand/collapse boxes next to the Configuration panel names.
24. Highlight Analysis, and then select MPEG-2 in the Analysis panel.
25. Highlight ETR 290 in the Navigation panel to display the ETR 290 panel.
This panel includes probes for the ETR 290 recommendations.
26. Click Add All and notice the change to the Probe List selection box.
27. In the Probe List selection box, remove all ETR290 priority 3 probes by
double-clicking the probe name.
28. Click Apply as shown in Figure 2--14 to apply the changes you have made to
the Analysis Server analyzing the input on jam20.1B.
ETR290 probes list
selection box
Figure 2- 14: Setting ETR290 probes
Change an Error Level
29. Expand the View hierarchy in the Navigation panel, and then select Message
30. Scroll down the list of probes in the Report Message Level panel and
31. Right-click in the Message level column on the highlighted row as shown in
2- 26
level.
highlight Continuity counter.
The default for this display is to show the probes in alphabetical order by
probe name. You can change this sort order by clicking one of the column
headers.
Figure 2--15 on page 2--27, and then select Major from the shortcut menu.
This changes the level at which a continuity counter error is displayed in the
Master client and in the Report view of the Expert client.
MTM300 Series MPEG Transport Monitor User Manual
Page 99

Tutorial
Figure 2- 15: Changing the message level
32. Change all Critical errors to Major errors using the following procedure:
a. Click the Report Level column header. This will sort all of the probes by
b. Left-click on all of the Critical error icons in the Report Level column.
33. Apply your changes to the Configuration client and switch to the Master
client.
34. Select Edit from the Workspace menu, and then highlight Graphics in the
Workspace Navigation panel.
35. Deselect Major in the Analysis Display group, and then click OK.
36. Click the Acknowledge Errors button on the Master client toolbar. The error
indicators in the Master client should go away.
37. Restore the settings in the Configuration client by clicking Restore Default at
the bottom of the Report Message Level panel. Do not forget to apply your
changes before minimizing the Configuration client (do not close it yet).
error severity (the level the errors are reported by the Analysis Servers).
Each click steps through the list of error levels. Since you are clicking
the Critical errors, the report level changes to Major errors.
MTM300 Series MPEG Transport Monitor User Manual
2- 27
Page 100

Tutorial
Configuring the Data Logging Function
The Data Logging function allows you to write a record of selected real-time
analysis events to tab-delimited text files on the instrument hard drive. The
Configuration Client enables and sets the parameters of the events that are
recorded. Refer to Data Logging on page 3--166 for more information.
1. Open the Configuration Client from the Master C lient window.
2. Select Data Logging in the Navigation Panel of the Configuration Client to
open the Data Logging panel shown in Figure 2--16.
3. Click on Enable Data logging to enable the Data Logging function.
4. Click on the various Report Selection and Field Selection boxes to select
which type of analysis events will trigger a log entry.
5. Use the Logging Management boxes to set the maximum size of each log
file and to set the time span for each log file.
6. Click the Apply button to apply your changes. Your specified transport
stream events will now be written to a text file in the following directory:
C:\MTM300\DataLogging.
Figure 2- 16: Data Logging configuration panel
2- 28
MTM300 Series MPEG Transport Monitor User Manual
 Loading...