

Page 1
Introduction to Oscilloscopes
Lab Experiment
A collection of lab exercises to introduce you to the basic
controls of a digital oscilloscope in order to make common
electronic measurements.
Revision 1.0 Page 1 of 18
Page 2

Introduction to Oscilloscopes Lab Experiment
Table of Contents
LABORATORY EXPERIMENT INTRODUCTION........................................................................................ 3
OBJECTIVES ...............................................................................................................................................3
EQUIPMENT LIST.........................................................................................................................................3
OVERVIEW OF AN OSCILLOSCOPE.........................................................................................................4
INTRODUCTION............................................................................................................................................ 4
PERFORMANCE TERMS AND CONSIDERATIONS .............................................................................................5
INITIAL SETUP AND SCREEN EXPLANATION......................................................................................... 6
CREATING A STABLE DISPLAY.....................................................................................................................6
SCREEN EXPLANATION ............................................................................................................................... 7
INSTRUMENT CONTROLS .........................................................................................................................8
VERTICAL CONTROLS...............................................................................................................................9
INTRODUCTION............................................................................................................................................ 9
VERTICAL POSITION/SCALE CONTROLS ....................................................................................................... 9
HORIZONTAL CONTROLS ....................................................................................................................... 10
INTRODUCTION.......................................................................................................................................... 10
HORIZONTAL POSITION/SCALE CONTROLS................................................................................................. 10
SETTING THE RECORD LENGTH ................................................................................................................. 10
TRIGGER CONTROLS...............................................................................................................................11
INTRODUCTION.......................................................................................................................................... 11
TRIGGER LEVEL CONTROL ........................................................................................................................11
TRIGGER MENU ........................................................................................................................................ 12
OSCILLOSCOPE MEASUREMENTS........................................................................................................13
INTRODUCTION.......................................................................................................................................... 13
MANUAL MEASUREMENTS .........................................................................................................................14
CURSOR MEASUREMENTS ......................................................................................................................... 14
AUTOMATED MEASUREMENTS...................................................................................................................15
FINAL EXERCISE ......................................................................................................................................16
Revision 1.0 Page 2 of 18
Page 3
Introduction to Oscilloscopes Lab Experiment
Laboratory Experiment Introduction
Objectives
1. Understand the block diagram and basic controls of a digital oscilloscope.
2. Setup an oscilloscope for a stable display of the applied signal.
3. Make common electronic measurements with a digital oscilloscope.
Equipment List
1. One Tektronix MSO2000 or DPO2000 Series digital oscilloscope.
2. One Tektronix P2221 1X/10X passive probe.
3. One Host/Device USB cable.
4. One Tektronix 878-0456-xx demonstration board.
Revision 1.0 Page 3 of 18
Page 4
Introduction to Oscilloscopes Lab Experiment
Overview of an Oscilloscope
Introduction
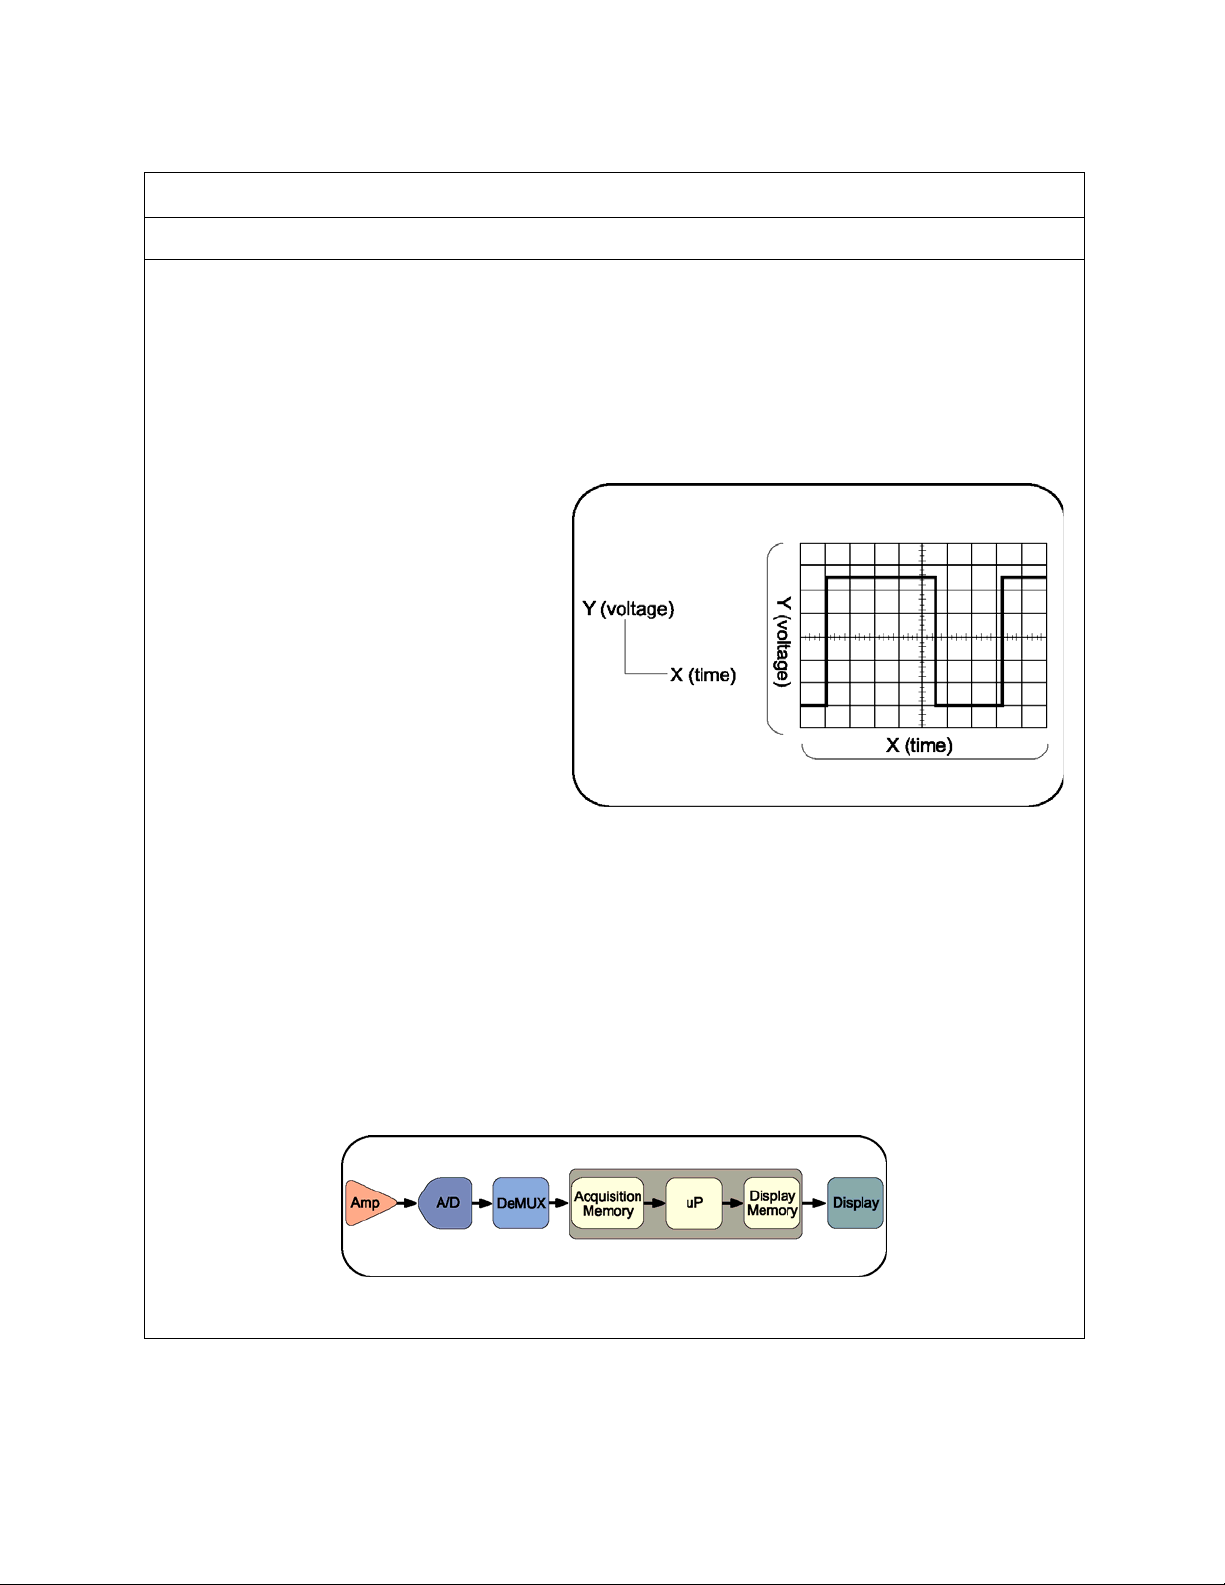
An oscilloscope is an electronic test instrument that displays electrical signals graphically, usually as a
voltage (vertical or Y axis) versus time (horizontal or X axis) as shown in figure 1. The intensity or
brightness of a waveform is sometimes considered the Z axis. There are some applications where other
vertical axes such as current may be used, and other horizontal axes such as frequency or another
voltage may be used.
Oscilloscopes are also used to measure electrical signals in response to physical stimuli, such as
sound, mechanical stress, pressure, light, or heat. For example, a television technician can use an
oscilloscope to measure signals from a television circuit board while a medical researcher can use an
oscilloscope to measure brain waves.
Oscilloscopes are commonly used for
measurement applications such as:
• observing the wave shape of a signal
• measuring the amplitude of a signal
• measuring the frequency of a signal
• measuring the time between two events
• observing whether the signal is direct
current (DC) or alternating current (AC)
• observing noise on a signal
An oscilloscope contains various controls that assist in the analysis of waveforms displayed on a
graphical grid called a graticule. The graticule, as shown in figure 1, is divided into divisions along both
the horizontal and vertical axes. These divisions make it easier to determine key parameters about the
waveform. In the case of the MSO/DPO2000 Series oscilloscope, there are 10 divisions horizontally
and 8 divisions vertically.
A digital oscilloscope acquires a waveform by conditioning the input signal in the analog vertical
amplifier, sampling the analog input signal, converting the samples to a digital representation with an
analog-to-digital converter (ADC or A/D), storing the sampled digital data in its memory, and then
reconstructing the waveform for viewing on the display.
Figure 1: Typical Oscilloscope Display
Figure 2: Typical Digital Oscilloscope Block Diagram
Revision 1.0 Page 4 of 18
Page 5

Introduction to Oscilloscopes Lab Experiment
Performance Terms and Considerations
There are many ways to specify digital oscilloscope performance, but the most important are bandwidth,
rise time, sample rate, and record length.
Bandwidth
Bandwidth is the first specification to consider. Bandwidth is the frequency range of the oscilloscope,
usually measured in Megahertz (MHz). It is the frequency at which the amplitude of the displayed sine
wave is attenuated to 70.7% of the original signal amplitude.
When measuring high-frequency or fast rise-time signals, oscilloscope bandwidth is especially critical.
Without adequate bandwidth, an oscilloscope will not be able to display and measure high-frequency
changes. It is generally recommended that the oscilloscope’s bandwidth be at least 5 times the highest
frequency that needs to be measured. This “5-times rule” allows for the display of the 5
signal and assures that measurement errors due to bandwidth are minimized.
th
5≥
Example: If the signal of interest is 100 MHz, the oscilloscope would need a bandwidth of 500 MHz.
signalofharmonicbandwidthpeoscillosco
Rise Time
The edge speed (rise time) of a digital signal can carry more high-frequency content than its repetition
rate might imply. An oscilloscope and probe must have a sufficiently fast rise time to capture the higher
frequency components, and therefore show signal transitions accurately. Rise time is the time taken by
a step or a pulse to rise from 10% to 90% of its amplitude level. There is another “5-times rule” that
recommends that the oscilloscope’s rise time be at least 5 times faster than the rise time of the signal
that needs to be measured.
timerisesignal
timerisepeoscillosco ≤
5
Example: If the signal of interest has a rise time of 5
μ
faster than 1
sec.
μ
sec, then the oscilloscope rise time should be
th
harmonic of the
Sample Rate
Digital oscilloscopes sample the input signals at a frequency called the sample rate, measured in
samples / second (S/sec). To properly reconstruct the signals, Nyquist sampling requires that the
sample rate be at least twice the highest frequency being measured. That’s the theoretical minimum. In
practice, sampling at least 5 times as fast is generally desirable.
fratesample ∗≥ 5
Highest
Example: The correct sample rate for a 450 MHz signal would be ≥ 2.25 GS/sec.
Record Length
Digital oscilloscopes capture a specific number of samples or data points, known as the record length,
for each acquired waveform. The record length, measured in points or samples, divided by the sample
rate (in Samples/second) specifies the total time (in seconds) that is acquired.
timeacquired =
lengthrecord
ratesample
Example: With a record length of 1 Mpoints and a sample rate of 250 MS/sec, the oscilloscope will
capture a signal 4 msec in length.
Revision 1.0 Page 5 of 18
Page 6
Introduction to Oscilloscopes Lab Experiment
Exercise
What minimum oscilloscope performance is required to properly capture 2 msec of a 1 V
sine wave?
• Bandwidth:
• Sample Rate:
• Record Length:
, 250 MHz
pk-pk
Initial Setup and Screen Explanation
Creating a Stable Display
1. The following steps will describe how to automatically create a stable oscilloscope display using a
1 kHz, 5 V
a. Power up the MSO/DPO2000 Series oscilloscope by pressing the power button on the lower
left corner of the instrument.
b. Press the front panel Default Setup button to set the oscilloscope to a known starting point.
c. Connect a P2221 1X/10X passive probe to the channel 1 input. To connect a BNC connector,
push and turn the probe connector until it slides on the connector. Then, turn the locking ring
clockwise to lock the connector in place.
d. Use the probe slide switch to set the probe attenuation to 10X.
e. Attach the probe’s alligator style ground lead to the ground connector on the lower right
corner of the oscilloscope.
f. Attach the probe tip to the PROBE COMP connector just below the ground lead connector. The
PROBE COMP connector provides a 1 kHz square wave that this lab will use to demonstrate
the operation of an oscilloscope.
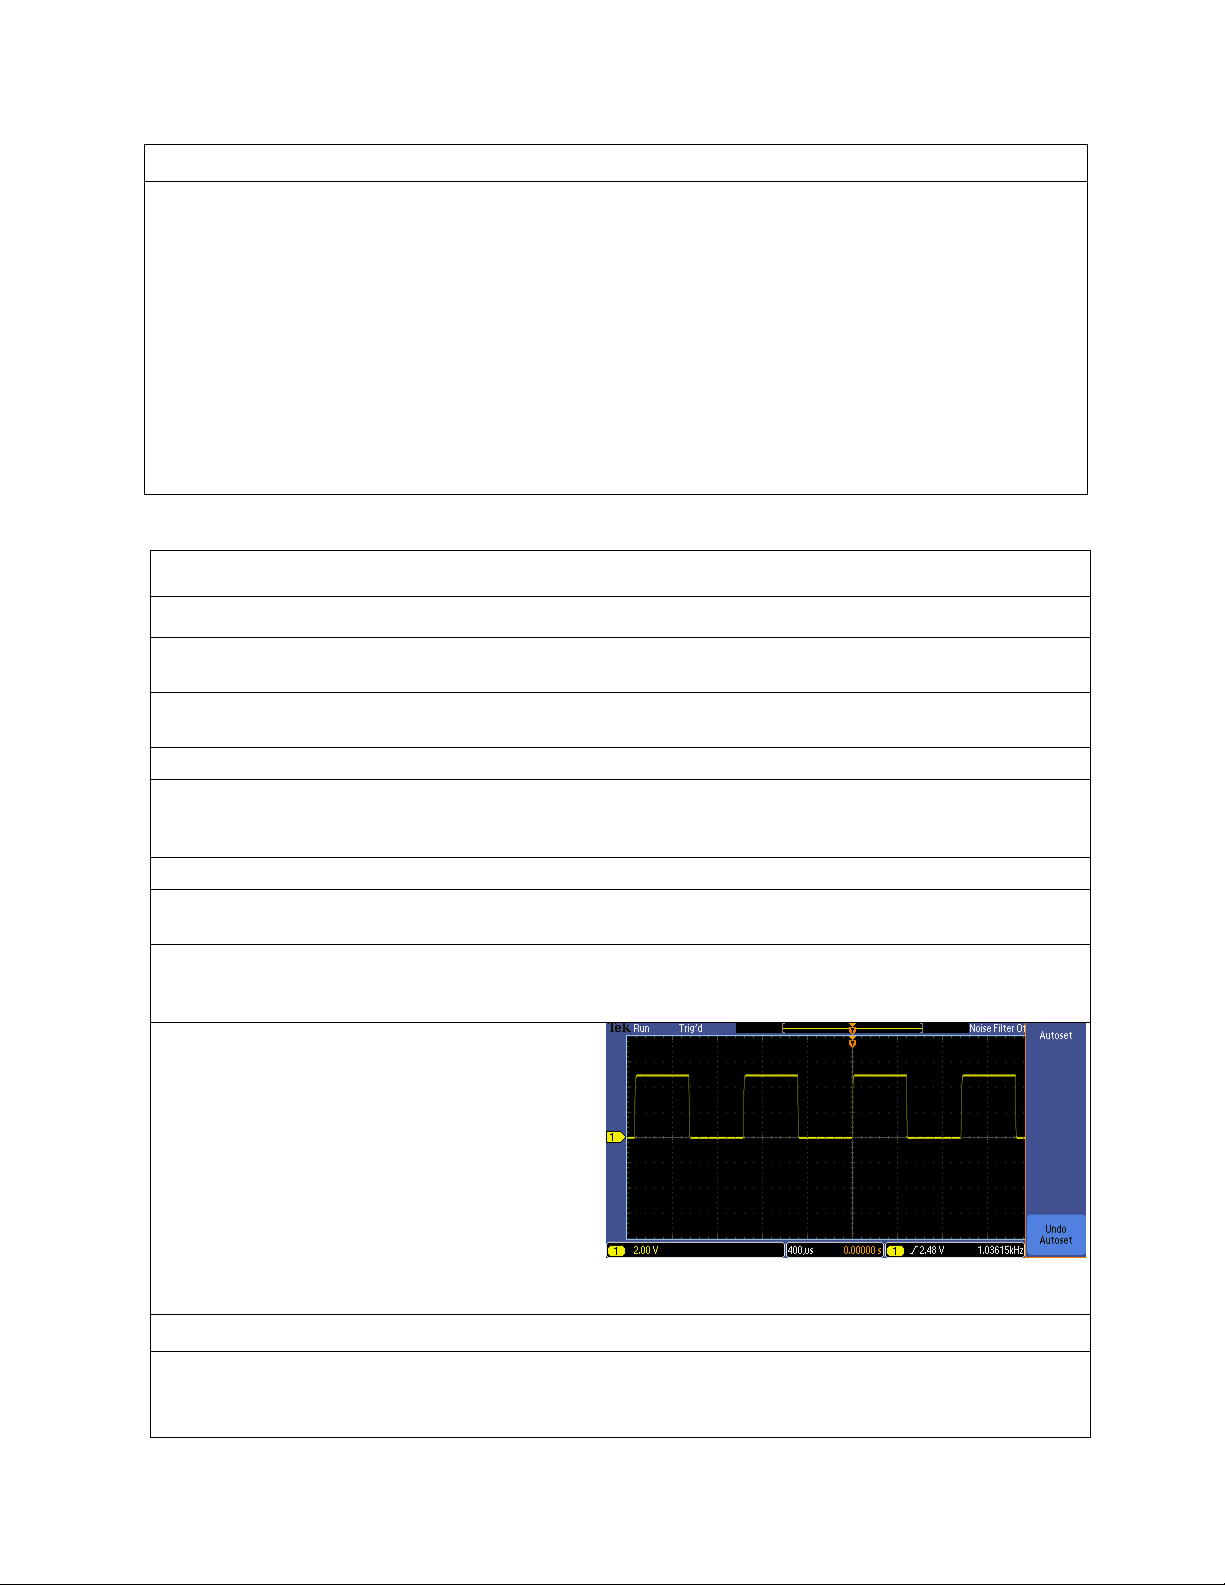
g. Press the front panel Autoset button to
cause the oscilloscope to automatically
set the vertical, horizontal and trigger
settings for a stable display of the
PROBE COMP 1 kHz square wave.
square wave.
pk-pk
Key Points to Remember
1. To return the oscilloscope to a known state, press the Default Setup button.
2. The Autoset button adjusts the vertical, horizontal and trigger settings such that four or five cycles
of the waveform are displayed with the trigger near the middle of the screen
Revision 1.0 Page 6 of 18
.
Page 7

Introduction to Oscilloscopes Lab Experiment
Screen Explanation
1. Following is a review of the oscilloscope’s display.
a. The channel 1 vertical axis button is yellow and most of the elements on the screen that relate
to the channel 1 signal are yellow in color.
b. On the display, the following items are yellow to indicate they are associated with channel 1:
• waveform
• waveform ground level indicator (center left of screen)
• vertical scale readout (bottom left of screen 2.00 V)
c. The channel 2, 3, and 4 vertical axis buttons are blue, magenta and green respectively. The
display uses the color coding of these channels just as it does for the yellow of channel 1.
d. As can be seen on the oscilloscope screen, the square wave extends up about 2 ½ divisions on
the display graticule from the ground level indicator. Since the vertical scale factor is 2
Volts/div, this indicates the signal’s positive peak is at about +5 V.
e. One cycle of the waveform is about 2 ½ divisions wide. The time per horizontal division is
indicated by the horizontal scale readout which in this case is 400 µsec/div (bottom center of
the display). At 400 µsec/div, the period of the signal is about 1 msec and the frequency is
about 1 kHz.
f. Finally, the trigger frequency readout indicates the channel 1 signal has a frequency of about
1 kHz as shown in the bottom right corner of the display.
Key Points to Remember
1. The input channels are color coded. Onscreen channel information is in that channel’s color,
including the waveform, ground indicator, and vertical scale factor (Volts/div).
2. The amplitude of the signal can be determined by multiplying the number of vertical divisions the
waveform spans times the vertical scale factor.
3. The signal period can be determined by multiplying the number of horizontal divisions times the
horizontal scale factor.
4. Signal frequency is calculated by dividing 1 by the signal period.
Exercise
Based on the display shown here, answer the
following questions:
What is the peak-to-peak voltage of the signal?
What is the voltage of the signal’s positive
peak? Negative peak?
What is the period and frequency of the signal?
Revision 1.0 Page 7 of 18
Page 8
Introduction to Oscilloscopes Lab Experiment
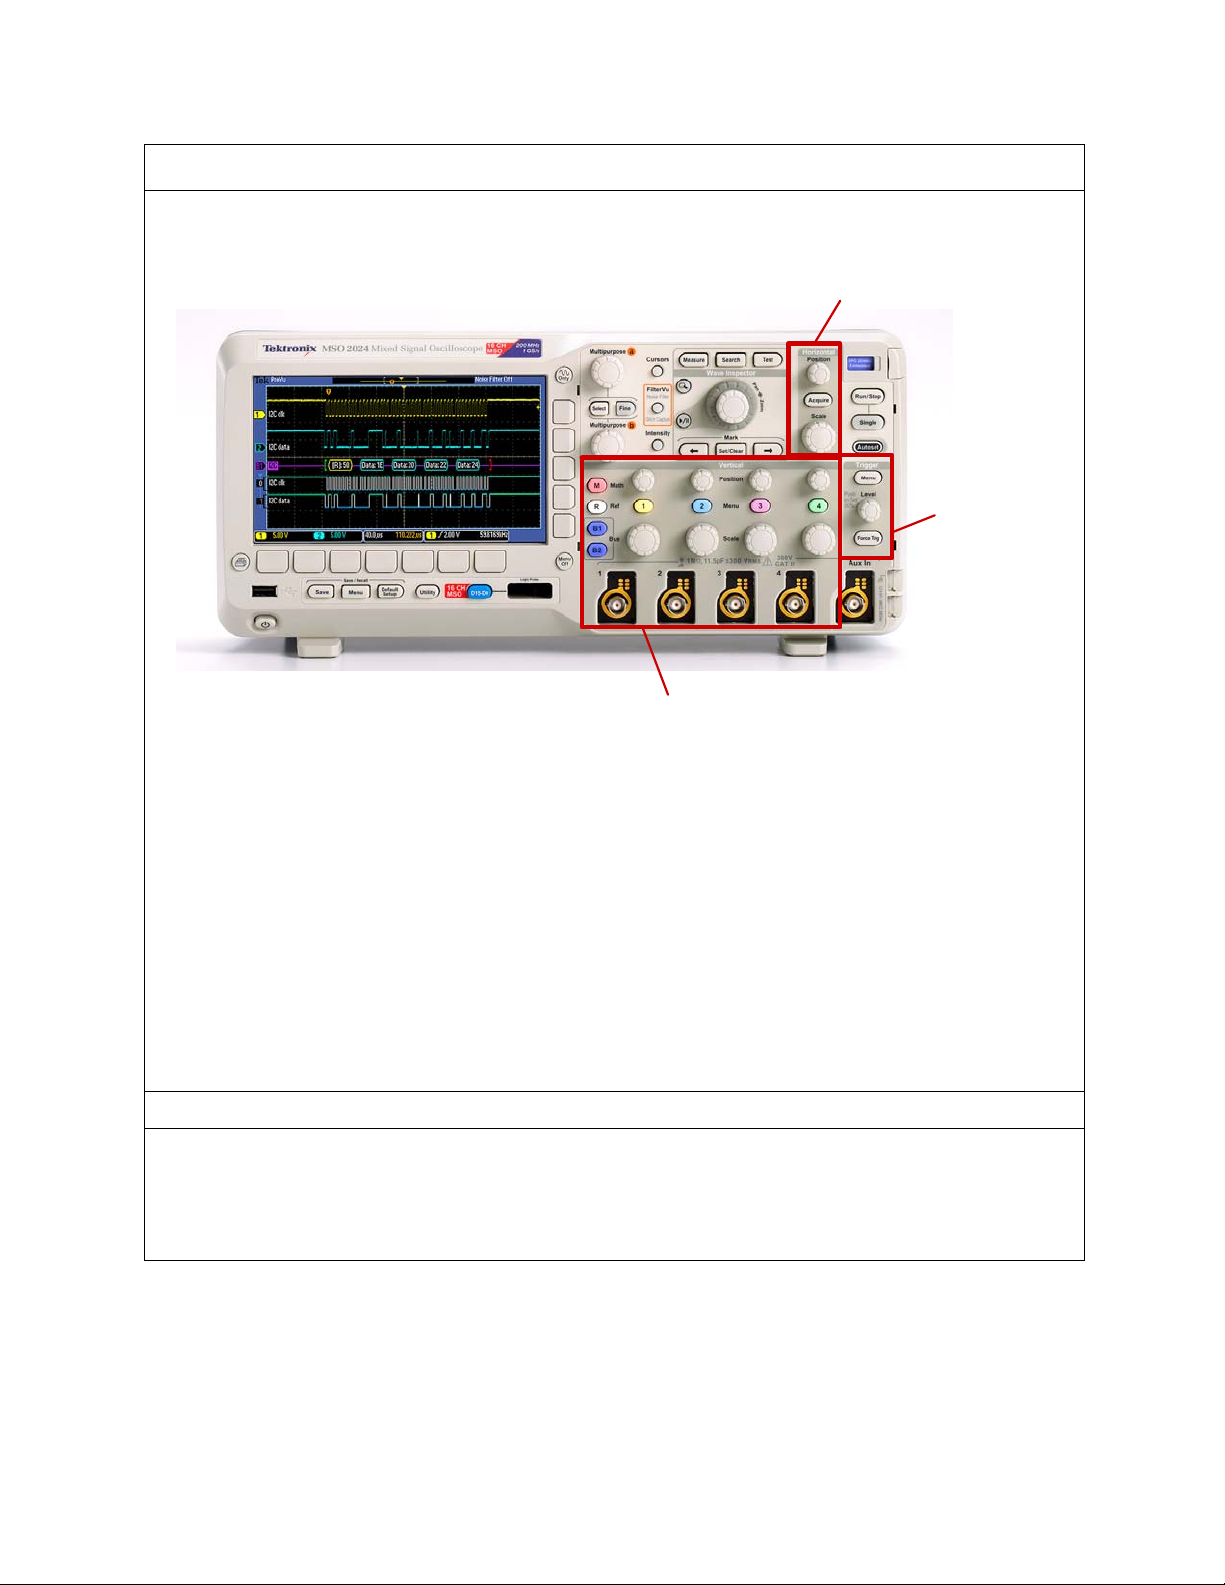
Instrument Controls
The controls of a typical oscilloscope can be grouped into three major categories: vertical, horizontal,
and trigger. These are the three main functions that are used to set up an oscilloscope. The use of
these controls is described in the following sections of this lab.
Horizontal Controls
Trigger
Controls
Vertical Controls
Here are a few hints that will make using the oscilloscope controls easier:
• Decide if the task is related to oscilloscope’s vertical axis (typically voltage), horizontal axis
(typically time), trigger, or some other function. This will make it easier find the correct control or
menu.
• Pressing a front panel button will usually display a first-level menu at the bottom of the display.
The menu items are logically prioritized from left-to-right. If they are selected in that order, the
setup should be straightforward.
• In most cases, pressing the button underneath a menu item at the bottom of the display results
in a second-level menu at the side of the display. These menu items are logically prioritized topto-bottom.
• If a small orange a or b is displayed on the screen, it indicates the front panel Multipurpose a
or b controls may be used to change that menu selection.
• Pressing the Menu Off button turns off one menu level at a time until all menus and readouts
are removed.
Exercise
The oscilloscope’s vertical axis controls are typically used to control which parameter?
Revision 1.0 Page 8 of 18
Page 9

Introduction to Oscilloscopes Lab Experiment
Vertical Controls
Introduction
The vertical controls set or modify the vertical scale, position, and other signal conditioning for each of
the analog input channels.
There is a set of vertical controls for each input channel. These controls are used to scale, position, and
modify that channel’s input signal so it can be viewed appropriately on the oscilloscope display. In
addition to the dedicated vertical controls for each channel, there are also buttons to access the math
menu, reference menu and bus menus.
Vertical Position/Scale Controls
1. The following steps will explore the use of the vertical axis position and scale front panel controls.
a. Use the channel 1 vertical Position knob to position the waveform near the bottom of the
display and notice the ground level indicator also moves.
The vertical position control moves the waveform up and down. It is generally used to align the
waveform with the vertical divisions on the graticule. Position is generally a graphical display
function only and does not affect the acquired waveform data.
b. Use the channel 1 vertical Scale knob to change the vertical scale from 2 V/div to 1 V/div.
The vertical scale (Volts/division) control adjusts the height of the waveform on the display.
Generally, the vertical scale control changes the settings of the input amplifier and/or attenuator
and does affect the acquired waveform data. Because the vertical scale controls the amplitude
of the signal going into the ADC, the highest-resolution measurements are achieved when the
signal almost fills the screen vertically without going off screen.
Key Points to Remember
1. The vertical position knob controls the position of the waveform on the vertical axis.
2. The vertical scale knob controls the amount of voltage represented by a vertical division on the
graticule.
Exercise
To make the highest-resolution measurement, what vertical scale should be used to measure the
PROBE COMP square wave? Why?
Revision 1.0 Page 9 of 18
Page 10

Introduction to Oscilloscopes Lab Experiment
Horizontal Controls
Introduction
The horizontal controls are used to scale and position the time axis of the oscilloscope display. There is
a dedicated front panel control for setting the horizontal scale (time/division) of the display and another
for setting the horizontal position of the displayed signals. The Acquire menu offers additional options
for modifying the waveform display, as well as setting the record length.
Horizontal Position/Scale Controls
1. The following steps will explore the use of the horizontal axis scale front panel control. The
horizontal scale control (also known as time/division or seconds/division) adjusts the amount of time
displayed on the screen.
a. Press the front panel Autoset button to restore the oscilloscope to a known starting point and
then set the vertical scale to 1 V/div.
b. Use the vertical Position knob to center the waveform on the screen.
c. Turn the horizontal Scale knob until the horizontal readout indicates 10μs/div (readout is shown
in the bottom center of the display.)
Since there are 10 divisions horizontally, a scale factor of 10 µsec/div yields a 100 µsec time
window. This setting shows the actual shape of the rising edge of the square wave.
2. The horizontal Position control moves the waveform and its horizontal reference or trigger point
(indicated by the orange icon at the top of the display) back and forth on the display. This is used to
align the displayed waveform with the horizontal divisions on the display graticule.
a. Turn the horizontal Position knob counter-clockwise to position the waveform’s falling edge at
the center of the display.
Key Points to Remember
1. The horizontal scale control sets the time window displayed on the oscilloscope screen. Since there
are 10 divisions horizontally, the time window is equal to:
divisionsfactorscalehorizontalwindowtime 10∗=
2. The horizontal position knob allows you to align the displayed waveform with the horizontal divisions
of the display graticule or to view a different section of the displayed waveform.
Exercise
If the horizontal scale factor were set to 1 μsec/div, the displayed time window would be:
Setting the Record Length
1. The following steps will investigate the relationship between the oscilloscope’s horizontal scale
factor, record length and sample rate.
a. Set the horizontal scale to 100 μs/div.
b. Press the Acquire front panel button. Press the Acquisition Details bottom bezel button.
Notice that the sample rate is currently 125 MS/s for a record length of 125 kpoints.
c. Press the Record Length bottom bezel button and press the 1.00M points side bezel button.
This sets the record length to 1 Mpoints.
d. Press the Acquisition Details bottom bezel button again. Notice that the sample rate is now 1
GS/s. The 1 msec time window has not changed, meaning the sample rate was increased by
the same ratio as the record length.
Revision 1.0 Page 10 of 18
Page 11

Introduction to Oscilloscopes Lab Experiment
Key Points to Remember
1. The sample rate of the oscilloscope is determined by the displayed time window (and therefore, the
horizontal scale factor) and the selected record length.
ratesample =
lengthrecord
windowtime
Exercise
With the horizontal scale factor set to 200 μsec/div and the record length set to 1 Mpoints, what is the
oscilloscope’s sample rate? Verify your answer by looking at the acquisition details on the oscilloscope.
Trigger Controls
Introduction
The trigger defines when a signal is acquired and stored in memory. For a repetitive signal, a trigger is
required to stabilize the display.
There is a front panel control to set the trigger level and a button to force the oscilloscope to trigger. The
Trigger menu offers different trigger types and allows you to set the conditions of the trigger.
Trigger Level Control
1. The following steps will explore the use of the front panel trigger level control.
a. Use the Default Setup and Autoset buttons to set the oscilloscope to a known starting point.
b. Press the Menu Off button to turn off the
menus. Set up the oscilloscope to match the
display shown here.
2. In the default trigger setting, the oscilloscope looks for a rising edge on the channel 1 input signal.
The trigger level control is used to set the voltage at which the oscilloscope triggers. The waveform
is displayed with the rising edge aligned with the trigger point (indicated by the orange T icon at the
top of the display). The trigger voltage level is shown by a yellow arrow on the right side of the
display. In this case, the arrow is slightly above the vertical axis midpoint.
a. Turn the Trigger Level knob until the trigger level, as indicated by the yellow arrow on the right
side of the screen, is above the top of the waveform (about 5.5 V) resulting in an
un-triggered display.
Key Points to Remember
1. A trigger defines when a signal is acquired and stored in memory.
2. The trigger level has to be within the signal range to properly trigger the oscilloscope.
3. For a repetitive signal, a trigger is necessary to obtain a stable display.
Revision 1.0 Page 11 of 18
Page 12

Introduction to Oscilloscopes Lab Experiment
Exercise
Using the Trigger level control, move the trigger level in and out of the signal’s voltage range and note
the effect this has on the displayed signal. Note how the text in the top left portion of the display (known
as the trigger indicator) changes from Auto, to Trig?, to Trig’d depending on the position of the trigger
voltage level. What do you think Trig?, and Trig’d mean?
(The Auto trigger indicator means the oscilloscope is in Auto trigger mode. This causes an acquisition
to be made about once a second if no trigger event is found. This provides a display, but not a stable
one, as illustrated here.)
Trigger Menu
1. During the following steps, a trigger will be set up to create a stable display.
a. Press the Trigger Level knob (it doubles as a button) to force the trigger voltage setting to the
50% point of the signal. The oscilloscope display should now match the figure in the previous
section.
b. Change the horizontal scale factor to 100μsec to display one full cycle of the signal.
c. Press the front panel Trigger Menu button.
The Trigger Menu allows you to specify the trigger event used to capture a waveform. Available
trigger types include specific pulse widths and glitches, short digital “runt” pulses, rise time, fall
time and several others.
d. Press the Source bottom bezel button. The source menu allows you to select which signal to
monitor for the trigger event.
e. Use the Multipurpose a control to select the channel that will be the source of the trigger.
Select channels 2, 3 and 4 in sequence and note the effect this has on the triggered state of the
display. When channel 1 is not selected, the display is not triggered because channels 2, 3 and
4 do not have an applied signal.
f. Use the Multipurpose a control to select channel 1 and ensure the display is triggered. Press
the Menu Off front panel button.
g. Press the Slope bottom bezel button to select the falling edge of the signal as the trigger point.
The slope menu controls whether the trigger looks for a positive or negative edge on the trigger
signal.
2. The edge trigger is used by default. However, because the trigger is a critical element in making a
measurement, there are several trigger options to pick from based on your measurement needs.
Perform the following steps to see how a few of the other trigger types are used.
a. Press the Type bottom bezel button for a selection of trigger types.
b. Use the Multipurpose a knob to select Pulse Width.
c. Press the Trigger When bottom bezel button.
d. Use the Multipurpose a control to select Pulse Width =.
The Pulse Width = setting causes the oscilloscope to trigger when the pulse width is within +/5% of the specified values.
e. Use the Multipurpose b control to select 500μs and note the oscilloscope triggers on the 500
μsec pulse. Remember this signal has a period of 1 msec with a 50% duty cycle. Thus the pulse
width is 500μsec.
Revision 1.0 Page 12 of 18
Page 13
Introduction to Oscilloscopes Lab Experiment
f. To return to the default Edge trigger mode, press the Type bottom bezel button and use the
Multipurpose a knob to select Edge trigger. Then press the front panel Menu Off button twice
to remove the menus.
Key Points to Remember
1. Pressing the trigger level knob forces the trigger level to the 50% point of the applied signal.
2. The trigger menu allows you to specify the trigger event used to capture a waveform.
3. Use the trigger source menu to select which input channel to monitor for the trigger event.
4. Use the trigger slope control to specify which edge (rising or falling) to trigger on.
5. The pulse width trigger can isolate pulses within a signal.
Exercise
In this last exercise, a pulse width trigger was used to capture a 1 kHz square wave. To trigger on all
square waves that are faster than 500 Hz, how would you set up the oscilloscope’s trigger? Assume the
square wave has a 50% duty cycle.
Oscilloscope Measurements
Introduction
A digital oscilloscope can make a variety of measurements on electrical signals, such as peak-to-peak
and RMS amplitude measurements and frequency, period, and pulse width timing measurements. The
oscilloscope provides several ways to make these measurements. This section will review the three
most common measurement methods:
• Manual measurements
• Cursor measurements
• Automatic measurements
Manual Measurements. Manual measurements rely upon the graticule on the display and the vertical
and horizontal scale settings to make measurements. A typical graticule has 8 divisions vertically and 10
divisions horizontally. For the highest accuracy, scale and position the waveform to fill the display
vertically and horizontally and then visually measure the parameter in units of graticule divisions. Then
multiply the number of divisions by the scale factor to get the final measurement value.
Cursor Measurements. Cursor measurements are made by manually aligning a pair of cursors to
points on the waveform and then reading the measurement values from the display cursor readouts.
Automatic Measurements. Automatic measurements use algorithms stored in the oscilloscope’s
firmware. These algorithms identify the appropriate waveform characteristics, make the measurements,
scale the measurements, apply the appropriate units and display them on the oscilloscope.
Revision 1.0 Page 13 of 18
Page 14

Introduction to Oscilloscopes Lab Experiment
Manual Measurements
1. The following exercise will explore making manual waveform measurements.
a. Reset the oscilloscope back to a known
staring point and use the front- panel
controls to create this display.
Normally, for greatest accuracy, the
waveform is adjusted vertically to fill as
much of the display as possible. For this
exercise, leave the waveform as shown
to the right.
Exercise
1. Determine the amplitude of the signal by counting the number of vertical divisions on the graticule
and multiplying that by the vertical scale factor. Write the amplitude here:
2. Calculate the period of the signal by counting the number of horizontal divisions on the graticule and
multiplying that by the horizontal scale factor. Write signal period here:
3. Calculate the frequency of the signal by performing the following calculation:
Frequency = 1/(signal period). Write the frequency here:
Cursor Measurements
1. For greater measurement accuracy, the oscilloscope provides cursors that will be used in the next
series of steps.
a. Press the front panel Cursors button twice to turn on all the cursors.
• The vertical cursors measure time along the horizontal axis.
• The horizontal cursors measure voltage along the vertical axis.
• When the cursors are inactive, they are dotted. Solid lines indicate the cursors are active.
b. Press the Select button to cause the horizontal cursors to turn solid if they are not already. Use
the Multipurpose a and b knobs to position the horizontal cursors to the top and bottom of the
waveform. Write the signal amplitude from the upper right corner of the display in the Exercise
section below.
c. Press the Select button to select the vertical cursors. Notice the a and b indicators move to the
timing readout and the vertical cursors go from dotted to solid.
d. Use the Multipurpose a and b button to position the cursors at the start and end of one cycle of
the signal (falling edge to falling edge) and then read out the time on the display.
Exercise
1. Write the signal amplitude here:
2. Write the period of the signal here:
Revision 1.0 Page 14 of 18
Page 15

Introduction to Oscilloscopes Lab Experiment
Automated Measurements
1. The MSO/DPO2000 Series oscilloscopes offer 29 automated measurements. To make automated
peak-to-peak amplitude, period and frequency measurements, the oscilloscope needs to display at
least one full cycle of the waveform and have the waveform fill as much of the vertical axis as
possible without the signal going off the top or the bottom of the screen. This ensures the
measurement algorithms have a complete description of the waveform in memory upon which to
make calculations.
The next steps will use the oscilloscope’s automated measurements to analyze the signal.
a. Press the Cursor button once to turn off the cursors.
b. Press the front panel Measure button.
c. Press the Add Measurement bottom bezel button.
d. Use the Multipurpose a knob to select Peak-to-peak and press the OK Add Measurement
side bezel button.
e. Use the Multipurpose a knob to select Period and press the OK Add Measurement side bezel
button.
f. Use the Multipurpose a knob to select Frequency and press the OK Add Measurement side
bezel button.
g. Press the Menu Off button twice. The Pk-Pk, Period and Freq automated measurements
should now be displayed at the bottom of the screen.
Exercise
1. Write the results from the peak-to-peak and period automated measurements here.
2. 2. What is the % difference between your automated measurements and manual measurements?
Between your automated measurements and cursor measurements?
Key Points to Remember
1. Measurements can be made manually, with cursors or automatically using firmware-based
algorithms that process waveform data stored in the oscilloscope’s memory.
2. Manual measurements have the lowest accuracy, cursors are typically more accurate than manual
measurements and automated measurements are the most accurate of all the techniques.
3. All signal elements pertaining to an automated measurement must be displayed on the
oscilloscope’s screen.
Revision 1.0 Page 15 of 18
Page 16

Introduction to Oscilloscopes Lab Experiment
Final Exercise
1. The first parameter to consider when choosing an oscilloscope is:
a. Size
b. Record Length
c. Bandwidth
d. Number of Measurements
2. Oscilloscopes usually:
a. Display amplitudes such as voltages on the vertical axis of the display.
b. Provide the most-commonly used controls on the front panel.
c. Provide multiple ways to make waveform parameter measurements.
d. All the above.
3. A typical digital oscilloscope:
a. Conditions analog input signals with amplification.
b. Samples the input signals at a high sample rate and converts them to digital format.
c. Stores the digitized waveform data in memory and displays the waveform on the display.
d. All the above.
4. The three primary sets of oscilloscope controls are:
a. Vertical, Measurements and Display
b. Horizontal, Autoset and Measurements
c. Vertical, Horizontal and Trigger
d. Trigger, Measurements and Cursors
5. Oscilloscopes can make measurements with:
a. Automated measurements using firmware-based algorithms to process stored waveform data.
b. Cursor measurements.
c. Manual measurements based on the graticule of the display.
d. All the above.
Revision 1.0 Page 16 of 18
Page 17

Introduction to Oscilloscopes Lab Experiment
6. This final exercise will require the use of the skills and knowledge gained to this point.
a. Begin by using the USB cable to
connect the demonstration
board to the oscilloscope’s USB
port as shown in the figure to
the right.
b. Connect the oscilloscope probe’s alligator ground tip to the
GND connector and the probe tip to the pin labeled
CNT_CLK as shown in the figure to the right. Press the
Default Setup button.
c. Set up the oscilloscope to obtain a stable display consisting of 2-4 cycles and to fill as much of
the screen vertically as possible without clipping the waveform. Do Not Use Autoset!
Write your steps down here:
Revision 1.0 Page 17 of 18
Page 18

Introduction to Oscilloscopes Lab Experiment
d. Using the display’s graticule, measure the following:
1. peak-to-peak voltage
2. period of the signal
e. Using the oscilloscope’s cursors, measure the following:
1. peak-to-peak voltage
2. period of the signal
f. Using the oscilloscope’s automated measurements, measure the following:
1. peak-to-peak voltage
2. period of the signal
3. frequency of the signal
Tektronix products are covered by U.S. and foreign patents, issued and pending. Information in this publication supersedes that in all previously published material.
Specification and price change privileges reserved. TEKTRONIX and TEK are registered trademarks of Tektronix, Inc. All other trade names referenced are the service marks,
trademarks or registered trademarks of their respective companies.
07/09 JS/WWW 3GW-24274-0 EM Lab
Revision 1.0 Page 18 of 18
 Loading...