

Page 1

DTx-EZ
Getting Started Manual
DTXEZ-903-01 Rev. A / January 2005
www.keithley.com
A GR
EATER MEASURE OF CONFIDENCE
Page 2

WARRANTY
Keithley Instruments, Inc. warrants this product to be free from defects in material and workmanship for a period of 3 years from
date of shipment.
Keithley Instruments, Inc. warrants the following items for 90 days from the date of shipment: probes, cables, rechargeable batteries,
diskettes, and documentation.
During the warranty period, we will, at our option, either repair or replace any product that proves to be defective.
To exercise this warranty, write or call your local Keithley representative, or contact Keithley headquarters in Cleveland, Ohio.
You will be given prompt assistance and return instructions. Send the product, transportation prepaid, to the indicated service facility. Repairs will be made and the product returned, transportation prepaid. Repaired or replaced products are warranted for the balance of the original warranty period, or at least 90 days.
LIMITATION OF WARRANTY
This warranty does not apply to defects resulting from product modification without Keithley’s express written consent, or misuse
of any product or part. This warranty also does not apply to fuses, software, non-rechargeable batteries, damage from battery leakage, or problems arising from normal wear or failure to follow instructions.
THIS WARRANTY IS IN LIEU OF ALL OTHER WARRANTIES, EXPRESSED OR IMPLIED, INCLUDING ANY IMPLIED
WARRANTY OF MERCHANTABILITY OR FITNESS FOR A PARTICULAR USE. THE REMEDIES PROVIDED HEREIN
ARE BUYER’S SOLE AND EXCLUSIVE REMEDIES.
NEITHER KEITHLEY INSTRUMENTS, INC. NOR ANY OF ITS EMPLOYEES SHALL BE LIABLE FOR ANY DIRECT,
INDIRECT, SPECIAL, INCIDENTAL OR CONSEQUENTIAL DAMAGES ARISING OUT OF THE USE OF ITS INSTRUMENTS AND SOFTWARE EVEN IF KEITHLEY INSTRUMENTS, INC., HAS BEEN ADVISED IN ADVANCE OF THE
POSSIBILITY OF SUCH DAMAGES. SUCH EXCLUDED DAMAGES SHALL INCLUDE, BUT ARE NOT LIMITED TO:
COSTS OF REMOVAL AND INSTALLATION, LOSSES SUSTAINED AS THE RESULT OF INJURY TO ANY PERSON,
OR DAMAGE TO PROPERTY.
A G R E A T E R M E A S U R E O F C O N F I D E N C E
Keithley Instruments, Inc.
Corporate Headquarters • 28775 Aurora Road • Cleveland, Ohio 44139
440-248-0400 • Fax: 440-248-6168 • 1-888-KEITHLEY (534-8453) • www.keithley.com
12/04
Page 3

DTx-EZ
Getting Started Manual
©2005, Keithley Instruments, Inc.
All rights reserved.
First Printing, January 2005
Cleveland, Ohio, U.S.A.
Document Number: DTXEZ-903-01
Rev. A
Page 4

Manual Print History
The print history shown below lists the printing dates of all Revisions and Addenda created for this manual. The Revision Level letter increases alphabetically as the manual undergoes subsequent updates. Addenda, which are released
between Revisions, contain important change information that the user should incorporate immediately into the manual.
Addenda are numbered sequentially. When a new Revision is created, all Addenda associated with the previous Revision
of the manual are incorporated into the new Revision of the manual. Each new Revision includes a revised copy of this
print history page.
Revision A (Document Number DTXEZ-903-01A) ........................................................................... January 2005
All Keithley product names are trademarks or registered trademarks of Keithley Instruments, Inc.
Other brand and product names are trademarks or registered trademarks of their respective holders.
Page 5

Safety Precautions
The following safety precautions should be observed before using
this product and any associated instrumentation. Although some instruments and accessories would normally be used with non-hazardous voltages, there are situations where hazardous conditions
may be present.
This product is intended for use by qualified personnel who recognize shock hazards and are familiar with the safety precautions required to avoid possible injury. Read and follow all installation,
operation, and maintenance information carefully before using the
product. Refer to the manual for complete product specifications.
If the product is used in a manner not specified, the protection provided by the product may be impaired.
The types of product users are:
Responsible body is the individual or group responsible for the use
and maintenance of equipment, for ensuring that the equipment is
operated within its specifications and operating limits, and for ensuring that operators are adequately trained.
Operators use the product for its intended function. They must be
trained in electrical safety procedures and proper use of the instrument. They must be protected from electric shock and contact with
hazardous live circuits.
Maintenance personnel perform routine procedures on the product to keep it operating properly, for example, setting the line voltage or replacing consumable materials. Maintenance procedures
are described in the manual. The procedures explicitly state if the
operator may perform them. Otherwise, they should be performed
only by service personnel.
Service personnel are trained to work on live circuits, and perform
safe installations and repairs of products. Only properly trained service personnel may perform installation and service procedures.
Keithley products are designed for use with electrical signals that
are rated Measurement Category I and Measurement Category II, as
described in the International Electrotechnical Commission (IEC)
Standard IEC 60664. Most measurement, control, and data I/O signals are Measurement Category I and must not be directly connected to mains voltage or to voltage sources with high transient overvoltages. Measurement Category II connections require protection
for high transient over-voltages often associated with local AC
mains connections. Assume all measurement, control, and data I/O
connections are for connection to Category I sources unless otherwise marked or described in the Manual.
Exercise extreme caution when a shock hazard is present. Lethal
voltage may be present on cable connector jacks or test fixtures.
The American National Standards Institute (ANSI) states that a
shock hazard exists when voltage levels greater than 30V RMS,
42.4V peak, or 60VDC are present. A good safety practice is to ex-
pect that hazardous voltage is present in any unknown circuit
before measuring.
Operators of this product must be protected from electric shock at
all times. The responsible body must ensure that operators are prevented access and/or insulated from every connection point. In
some cases, connections must be exposed to potential human contact. Product operators in these circumstances must be trained to
protect themselves from the risk of electric shock. If the circuit is
capable of operating at or above 1000 volts, no conductive part of
the circuit may be exposed.
Do not connect switching cards directly to unlimited power circuits.
They are intended to be used with impedance limited sources.
NEVER connect switching cards directly to AC mains. When connecting sources to switching cards, install protective devices to limit
fault current and voltage to the card.
Before operating an instrument, make sure the line cord is connected to a properly grounded power receptacle. Inspect the connecting
cables, test leads, and jumpers for possible wear, cracks, or breaks
before each use.
When installing equipment where access to the main power cord is
restricted, such as rack mounting, a separate main input power disconnect device must be provided, in close proximity to the equipment and within easy reach of the operator.
For maximum safety, do not touch the product, test cables, or any
other instruments while power is applied to the circuit under test.
ALWAYS remove power from the entire test system and discharge
any capacitors before: connecting or disconnecting cables or jumpers, installing or removing switching cards, or making internal
changes, such as installing or removing jumpers.
Do not touch any object that could provide a current path to the common side of the circuit under test or power line (earth) ground. Always
make measurements with dry hands while standing on a dry, insulated
surface capable of withstanding the voltage being measured.
The instrument and accessories must be used in accordance with its
specifications and operating instructions or the safety of the equipment may be impaired.
Do not exceed the maximum signal levels of the instruments and accessories, as defined in the specifications and operating information, and as shown on the instrument or test fixture panels, or
switching card.
When fuses are used in a product, replace with same type and rating
for continued protection against fire hazard.
Chassis connections must only be used as shield connections for
measuring circuits, NOT as safety earth ground connections.
If you are using a test fixture, keep the lid closed while power is applied to the device under test. Safe operation requires the use of a
lid interlock.
5/03
Page 6

If a screw is present, connect it to safety earth ground using the
wire recommended in the user documentation.
!
The symbol on an instrument indicates that the user should refer to the operating instructions located in the manual.
The symbol on an instrument shows that it can source or measure 1000 volts or more, including the combined effect of normal
and common mode voltages. Use standard safety precautions to
avoid personal contact with these voltages.
The symbol indicates a connection terminal to the equipment
frame.
The WARNING heading in a manual explains dangers that might
result in personal injury or death. Always read the associated information very carefully before performing the indicated procedure.
The CAUTION heading in a manual explains hazards that could
damage the instrument. Such damage may invalidate the warranty.
Instrumentation and accessories shall not be connected to humans.
Before performing any maintenance, disconnect the line cord and
all test cables.
To maintain protection from electric shock and fire, replacement
components in mains circuits, including the power transformer, test
leads, and input jacks, must be purchased from Keithley Instruments. Standard fuses, with applicable national safety approvals,
may be used if the rating and type are the same. Other components
that are not safety related may be purchased from other suppliers as
long as they are equivalent to the original component. (Note that selected parts should be purchased only through Keithley Instruments
to maintain accuracy and functionality of the product.) If you are
unsure about the applicability of a replacement component, call a
Keithley Instruments office for information.
To clean an instrument, use a damp cloth or mild, water based
cleaner. Clean the exterior of the instrument only. Do not apply
cleaner directly to the instrument or allow liquids to enter or spill on
the instrument. Products that consist of a circuit board with no case
or chassis (e.g., data acquisition board for installation into a computer) should never require cleaning if handled according to instructions. If the board becomes contaminated and operation is affected,
the board should be returned to the factory for proper cleaning/servicing.
Page 7

Table of Contents
About this Manual . . . . . . . . . . . . . . . . . . . . . . . . . . . . . . . . . xiii
Intended Audience. . . . . . . . . . . . . . . . . . . . . . . . . . . . . . . . . . . . . xiii
What You Should Learn from this Manual. . . . . . . . . . . . . . . . . xiii
Organization of this Manual. . . . . . . . . . . . . . . . . . . . . . . . . . . . . xiv
Conventions Used in this Manual . . . . . . . . . . . . . . . . . . . . . . . . xiv
Related Information . . . . . . . . . . . . . . . . . . . . . . . . . . . . . . . . . . . . . xv
Where to Get Help . . . . . . . . . . . . . . . . . . . . . . . . . . . . . . . . . . . . . xvi
Chapter 1: Overview . . . . . . . . . . . . . . . . . . . . . . . . . . . . . . . . 1
What is DTx-EZ?. . . . . . . . . . . . . . . . . . . . . . . . . . . . . . . . . . . . . . . . . 2
Conforms to the DT-Open Layers Standard . . . . . . . . . . . . . . 2
Provides Custom Controls. . . . . . . . . . . . . . . . . . . . . . . . . . . . . 2
The Data Acquisition Custom Control . . . . . . . . . . . . . . 3
The DT Plot Custom Control . . . . . . . . . . . . . . . . . . . . . . . 3
Provides Properties, Methods, and Events . . . . . . . . . . . . . . . 4
Provides Function and Subroutine Libraries . . . . . . . . . . . . . 5
Follows Object-Oriented Design. . . . . . . . . . . . . . . . . . . . . . . . 6
Provides Extensive Example Programs . . . . . . . . . . . . . . . . . . 6
Provides Multiple Board Support. . . . . . . . . . . . . . . . . . . . . . . 6
Provides High Performance . . . . . . . . . . . . . . . . . . . . . . . . . . . 7
What You Need. . . . . . . . . . . . . . . . . . . . . . . . . . . . . . . . . . . . . . . . . . 8
Installation. . . . . . . . . . . . . . . . . . . . . . . . . . . . . . . . . . . . . . . . . . . . . . 9
Adding DTx-EZ Custom Controls to Your Project . . . . . . . . . . . 10
Adding to a Visual Basic 6.0 Project . . . . . . . . . . . . . . . . . . . . 10
Adding to a Visual C++ 6.0 Project. . . . . . . . . . . . . . . . . . . . . 11
Creating an Application . . . . . . . . . . . . . . . . . . . . . . . . . . . . . . . . . 12
Using the DTx-EZ Online Help . . . . . . . . . . . . . . . . . . . . . . . . . . . 13
vii
Page 8

Contents
Chapter 2: Using the DTx-EZ Examples . . . . . . . . . . . . . . . 15
About the Examples. . . . . . . . . . . . . . . . . . . . . . . . . . . . . . . . . . . . . 16
Running the Examples as Applications. . . . . . . . . . . . . . . . . 17
Opening the Examples from within Visual Basic. . . . . . . . . 18
Opening the Examples from within Visual C++ . . . . . . . . . 19
A/D Burst Example . . . . . . . . . . . . . . . . . . . . . . . . . . . . . . . . . . . . . 20
DAC Waveform Generator Example. . . . . . . . . . . . . . . . . . . . . . . 25
Continuous A/D Example . . . . . . . . . . . . . . . . . . . . . . . . . . . . . . . 29
Single-Value Example . . . . . . . . . . . . . . . . . . . . . . . . . . . . . . . . . . . 31
About-Trigger Example. . . . . . . . . . . . . . . . . . . . . . . . . . . . . . . . . . 33
Digital I/O Example . . . . . . . . . . . . . . . . . . . . . . . . . . . . . . . . . . . . 35
DDE Server and Client Examples . . . . . . . . . . . . . . . . . . . . . . . . . 37
Waveform Generator Example. . . . . . . . . . . . . . . . . . . . . . . . . . . . 39
Continuous FFT Example . . . . . . . . . . . . . . . . . . . . . . . . . . . . . . . . 40
ChartIt Example . . . . . . . . . . . . . . . . . . . . . . . . . . . . . . . . . . . . . . . . 41
Scope Example . . . . . . . . . . . . . . . . . . . . . . . . . . . . . . . . . . . . . . . . . 42
viii
Chapter 3: Property, Method, Function, and Subroutine
Summary . . . . . . . . . . . . . . . . . . . . . . . . . . . . . . . . . . . . . . . . 45
Introduction. . . . . . . . . . . . . . . . . . . . . . . . . . . . . . . . . . . . . . . . . . . . 46
Data Acquisition Custom Control . . . . . . . . . . . . . . . . . . . . . . . . . 47
Information Properties and Methods. . . . . . . . . . . . . . . . . . . 47
Initialization Properties . . . . . . . . . . . . . . . . . . . . . . . . . . . . . . 57
Configuration Properties and Functions . . . . . . . . . . . . . . . . 58
Operation Properties, Methods, Functions, and
Subroutines . . . . . . . . . . . . . . . . . . . . . . . . . . . . . . . . . . . . . . . 61
Data Management DLLs . . . . . . . . . . . . . . . . . . . . . . . . . . . . . . . . . 64
Buffer Management Functions and Subroutines . . . . . . . . . 64
Conversion Functions and Subroutines. . . . . . . . . . . . . . . . . 67
DT Plot Custom Control . . . . . . . . . . . . . . . . . . . . . . . . . . . . . . . . . 69
Plot Appearance . . . . . . . . . . . . . . . . . . . . . . . . . . . . . . . . . . . . 69
Page 9

Plot Pre-Display Operational Parameters . . . . . . . . . . . . . . . 70
Grids . . . . . . . . . . . . . . . . . . . . . . . . . . . . . . . . . . . . . . . . . . . . . . 71
Markers. . . . . . . . . . . . . . . . . . . . . . . . . . . . . . . . . . . . . . . . . . . . 71
x-Axis Parameters . . . . . . . . . . . . . . . . . . . . . . . . . . . . . . . . . . . 72
y-Axis Parameters . . . . . . . . . . . . . . . . . . . . . . . . . . . . . . . . . . . 73
Plotting Operation Control Parameters. . . . . . . . . . . . . . . . . 73
Chapter 4: Programming Flowcharts. . . . . . . . . . . . . . . . . . 75
Introduction. . . . . . . . . . . . . . . . . . . . . . . . . . . . . . . . . . . . . . . . . . . . 76
Single-Value Operations . . . . . . . . . . . . . . . . . . . . . . . . . . . . . . . . . 77
Continuous Buffered Input Operations . . . . . . . . . . . . . . . . . . . . 79
Continuous Buffered Output Operations. . . . . . . . . . . . . . . . . . . 81
Event Counting Operations . . . . . . . . . . . . . . . . . . . . . . . . . . . . . . 83
Frequency Measurement Operations . . . . . . . . . . . . . . . . . . . . . . 85
Pulse Output Operations. . . . . . . . . . . . . . . . . . . . . . . . . . . . . . . . . 87
Plotting Control Operations . . . . . . . . . . . . . . . . . . . . . . . . . . . . . . 89
Chapter 5: Software Architecture. . . . . . . . . . . . . . . . . . . . . 91
Introduction. . . . . . . . . . . . . . . . . . . . . . . . . . . . . . . . . . . . . . . . . . . . 92
System Operations . . . . . . . . . . . . . . . . . . . . . . . . . . . . . . . . . . . . . . 93
Initializing and Specifying a Board . . . . . . . . . . . . . . . . . . . . 93
Specifying a Subsystem . . . . . . . . . . . . . . . . . . . . . . . . . . . . . . 94
Configuring a Subsystem. . . . . . . . . . . . . . . . . . . . . . . . . . . . . 95
Handling Events . . . . . . . . . . . . . . . . . . . . . . . . . . . . . . . . . . . . 96
Handling Errors. . . . . . . . . . . . . . . . . . . . . . . . . . . . . . . . . . . . . 96
Halting the Operation. . . . . . . . . . . . . . . . . . . . . . . . . . . . . . . . 98
Analog and Digital I/O Operations . . . . . . . . . . . . . . . . . . . . . . . 99
Data Encoding . . . . . . . . . . . . . . . . . . . . . . . . . . . . . . . . . . . . . . 99
Resolution. . . . . . . . . . . . . . . . . . . . . . . . . . . . . . . . . . . . . . . . . 100
Channels . . . . . . . . . . . . . . . . . . . . . . . . . . . . . . . . . . . . . . . . . . 100
Specifying the Channel Type . . . . . . . . . . . . . . . . . . . . . 101
Contents
ix
Page 10

Contents
Specifying a Single Channel . . . . . . . . . . . . . . . . . . . . . 102
Specifying One or More Channels . . . . . . . . . . . . . . . . 102
Specifying the Channel List Size . . . . . . . . . . . . . . 103
Specifying the Channels in the Channel List . . . . 104
Inhibiting Channels in the Channel List . . . . . . . . 105
Specifying Synchronous Digital I/O Values
in the Channel List . . . . . . . . . . . . . . . . . . . . . . . . . 106
Ranges. . . . . . . . . . . . . . . . . . . . . . . . . . . . . . . . . . . . . . . . . . . . 108
Gains . . . . . . . . . . . . . . . . . . . . . . . . . . . . . . . . . . . . . . . . . . . . . 109
Specifying the Gain for a Single Channel . . . . . . . . . . 109
Specifying the Gain for One or More Channels . . . . . 109
Filters. . . . . . . . . . . . . . . . . . . . . . . . . . . . . . . . . . . . . . . . . . . . . 111
Data Flow Modes . . . . . . . . . . . . . . . . . . . . . . . . . . . . . . . . . . 112
Single-Value Operations . . . . . . . . . . . . . . . . . . . . . . . . . 112
Continuous Operations . . . . . . . . . . . . . . . . . . . . . . . . . 113
Continuous (Post-Trigger) Mode . . . . . . . . . . . . . . 114
Continuous Pre-Trigger Mode . . . . . . . . . . . . . . . . 115
Continuous About-Trigger Mode. . . . . . . . . . . . . . 116
Triggered Scan Mode . . . . . . . . . . . . . . . . . . . . . . . . . . . . . . . 118
Scan-Per-Trigger Mode . . . . . . . . . . . . . . . . . . . . . . . . . . 119
Internal Retrigger Mode . . . . . . . . . . . . . . . . . . . . . . . . . 120
Retrigger Extra Mode . . . . . . . . . . . . . . . . . . . . . . . . . . . 121
Clock Sources. . . . . . . . . . . . . . . . . . . . . . . . . . . . . . . . . . . . . . 122
Internal Clock Source . . . . . . . . . . . . . . . . . . . . . . . . . . . 122
External Clock Source . . . . . . . . . . . . . . . . . . . . . . . . . . . 123
Extra Clock Source . . . . . . . . . . . . . . . . . . . . . . . . . . . . . 124
Trigger Sources . . . . . . . . . . . . . . . . . . . . . . . . . . . . . . . . . . . . 124
Software (Internal) Trigger Source . . . . . . . . . . . . . . . . 125
External Digital (TTL) Trigger Source . . . . . . . . . . . . . 125
External Analog Threshold (Positive) Trigger Source 126
x
Page 11

External Analog Threshold (Negative) Trigger
Source . . . . . . . . . . . . . . . . . . . . . . . . . . . . . . . . . . . . . . . 126
Analog Event Trigger Source . . . . . . . . . . . . . . . . . . . . . 127
Digital Event Trigger Source . . . . . . . . . . . . . . . . . . . . . 127
Timer Event Trigger Source . . . . . . . . . . . . . . . . . . . . . . 127
Extra Trigger Source . . . . . . . . . . . . . . . . . . . . . . . . . . . . 127
Buffers. . . . . . . . . . . . . . . . . . . . . . . . . . . . . . . . . . . . . . . . . . . . 128
Ready Queue . . . . . . . . . . . . . . . . . . . . . . . . . . . . . . . . . . 128
Done Queue . . . . . . . . . . . . . . . . . . . . . . . . . . . . . . . . . . . 131
Buffer and Queue Management . . . . . . . . . . . . . . . . . . 133
Buffer Wrap Modes . . . . . . . . . . . . . . . . . . . . . . . . . . . . . 134
DMA Resources. . . . . . . . . . . . . . . . . . . . . . . . . . . . . . . . . . . . 135
Counter/Timer Operations. . . . . . . . . . . . . . . . . . . . . . . . . . . . . . 137
Counter/Timer Operation Mode . . . . . . . . . . . . . . . . . . . . . 138
Event Counting . . . . . . . . . . . . . . . . . . . . . . . . . . . . . . . . 138
Frequency Measurement . . . . . . . . . . . . . . . . . . . . . . . . 140
Using the Windows Timer. . . . . . . . . . . . . . . . . . . . 140
Using a Pulse of a Known Duration . . . . . . . . . . . 142
Rate Generation . . . . . . . . . . . . . . . . . . . . . . . . . . . . . . . . 144
One-Shot . . . . . . . . . . . . . . . . . . . . . . . . . . . . . . . . . . . . . . 148
Repetitive One-Shot . . . . . . . . . . . . . . . . . . . . . . . . . . . . 151
C/T Clock Sources . . . . . . . . . . . . . . . . . . . . . . . . . . . . . . . . . 154
Internal C/T Clock . . . . . . . . . . . . . . . . . . . . . . . . . . . . . 155
External C/T Clock . . . . . . . . . . . . . . . . . . . . . . . . . . . . . 155
Internally Cascaded Clock . . . . . . . . . . . . . . . . . . . . . . . 156
Extra C/T Clock Source . . . . . . . . . . . . . . . . . . . . . . . . . 157
Gate Types . . . . . . . . . . . . . . . . . . . . . . . . . . . . . . . . . . . . . . . . 157
Software Gate Type . . . . . . . . . . . . . . . . . . . . . . . . . . . . . 158
High-Level Gate Type . . . . . . . . . . . . . . . . . . . . . . . . . . 158
Low-Level Gate Type . . . . . . . . . . . . . . . . . . . . . . . . . . . 158
Contents
xi
Page 12

Contents
Low-Edge Gate Type . . . . . . . . . . . . . . . . . . . . . . . . . . . 159
High-Edge Gate Type . . . . . . . . . . . . . . . . . . . . . . . . . . . 159
Any Level Gate Type . . . . . . . . . . . . . . . . . . . . . . . . . . . 159
High-Level, Debounced Gate Type . . . . . . . . . . . . . . . 160
Low-Level, Debounced Gate Type . . . . . . . . . . . . . . . . 160
High-Edge, Debounced Gate Type . . . . . . . . . . . . . . . . 160
Low-Edge, Debounced Gate Type . . . . . . . . . . . . . . . . 161
Level, Debounced Gate Type . . . . . . . . . . . . . . . . . . . . . 161
Pulse Output Types and Duty Cycles . . . . . . . . . . . . . . . . . 162
Simultaneous Operations . . . . . . . . . . . . . . . . . . . . . . . . . . . . . . . 164
Plot Control Operations. . . . . . . . . . . . . . . . . . . . . . . . . . . . . . . . . 166
Plotting Data . . . . . . . . . . . . . . . . . . . . . . . . . . . . . . . . . . . . . . 166
Data Identification Properties . . . . . . . . . . . . . . . . . . . . 166
Plotting Mechanics Properties . . . . . . . . . . . . . . . . . . . . 167
Appearance . . . . . . . . . . . . . . . . . . . . . . . . . . . . . . . . . . . 167
Stripchart Mode . . . . . . . . . . . . . . . . . . . . . . . . . . . . . . . . 168
Specifying a Grid. . . . . . . . . . . . . . . . . . . . . . . . . . . . . . . . . . . 168
Specifying Markers . . . . . . . . . . . . . . . . . . . . . . . . . . . . . . . . . 169
xii
Appendix A: Flowcharts for Substeps . . . . . . . . . . . . . . . 171
Chapter 6: Product Support . . . . . . . . . . . . . . . . . . . . . . . . 191
General Checklist . . . . . . . . . . . . . . . . . . . . . . . . . . . . . . . . . . . . . . 192
Service and Support. . . . . . . . . . . . . . . . . . . . . . . . . . . . . . . . . . . . 193
Index . . . . . . . . . . . . . . . . . . . . . . . . . . . . . . . . . . . . . . . . . . . . 195
Page 13

This manual describes how to get started using DTx-EZ™ to develop
application programs for data acquisition boards that conform to the
DT-Open Layers
TM
Intended Audience
This document is intended for engineers, scientists, technicians, or
others responsible for developing application programs using the
Microsoft Visual Basic™ or Visual C++™ compiler to perform data
acquisition operations.
It is assumed that you are a proficient programmer, that you are
experienced programming in the Windows® 98, Windows NT,
Windows Me (Millennium Edition), or Windows 2000 operating
environment on the IBM PC or compatible computer platform, that
you have familiarity with data acquisition principles, and that you
have clearly defined your requirements.
About this Manual
standard.
What You Should Learn from this Manual
This manual provides installation instructions, summarizes the
functions provided by the DTx-EZ, and describes how to use the
properties, methods, functions, and subroutines to develop a data
acquisition program. Using this manual, you should be able to
successfully install the DTx-EZ software and get started writing an
application program for data acquisition.
This manual is intended to be used with the online help for the
DTx-EZ, which you can find in the same program group as the
DTx-EZ software. The online help for the DTx-EZ contains all of the
specific reference information for each of the properties, methods,
functions, subroutines, error codes, and Windows messages (events).
xiii
Page 14

About this Manual
Organization of this Manual
This manual is organized as follows:
• Chapter 1, “Overview,” provides an overview of DTx-EZ.
• Chapter 2, “Using the DTx-EZ Examples,” describes how to use
the example programs provided with DTx-EZ.
• Chapter 3, “Property, Method, Function, and Subroutine
Summary,” summarizes the properties, methods, functions, and
subroutines provided with DTx-EZ.
• Chapter 4, “Programming Flowcharts,” provides programming
flowcharts for using the properties, methods, functions, and
subroutines provided with DTx-EZ.
• Chapter 5, “Software Architecture,” describes the architecture
and concepts of DTx-EZ software.
• Chapter 6, “Product Support,” describes how to get help if you
have trouble using DTx-EZ.
• Appendix A, “Flowcharts for Substeps,” provides additional
flowcharts for performing substeps required for an operation.
xiv
• An index completes this document.
Conventions Used in this Manual
The following conventions are used in this manual:
• Notes provide useful information that requires special emphasis,
cautions provide information to help you avoid losing data or
damaging your equipment, and warnings provide information to
help you avoid catastrophic damage to yourself or your
equipment.
• Items that you select or type are shown in bold. Property,
method, function, and subroutine names also appear in bold.
• Code fragments appear in courier font.
Page 15

• In syntax, items inside square brackets are optional.
• In syntax, a vertical bar between braces indicates that you must
choose between two or more items. You must choose an item
unless all of the items are also enclosed in curly brackets. For
example, { True | False } indicates that you must select one of
these choices.
• When navigating the screens, an instruction such as Configure >
Board means to select “Board” from the drop-down menu under
“Configure.”
Related Information
Refer to the following documentation for more information on using
DTx-EZ:
• DTx-EZ Online Help. This Windows help file is located in the
same program group as the DTx-EZ software and contains all of
the specific reference information for each of the properties,
methods, subroutines, functions, error codes, and Windows
messages (events) provided by DTx-EZ. Refer to page 13 for
information on how to launch this help file.
About this Manual
• Device Driver documentation for your board. This
documentation describes the capabilities supported by the device
driver for your board. Refer to this documentation as you
develop application programs using DTx-EZ.
• User manual for your data acquisition board. This manual
describes the capabilities of the hardware as well as how to set up
and install your board.
• For Visual Basic and Visual C++ programmers, see the online
help in your programming environment.
• Windows programming documentation.
xv
Page 16

About this Manual
Where to Get Help
Should you run into problems installing or using DTx-EZ, the
Keithley Technical Support Department is available to provide
technical assistance.
xvi
Page 17

1
Overview
What is DTx-EZ?. . . . . . . . . . . . . . . . . . . . . . . . . . . . . . . . . . . . . . . . . 2
What You Need. . . . . . . . . . . . . . . . . . . . . . . . . . . . . . . . . . . . . . . . . . 8
Installation. . . . . . . . . . . . . . . . . . . . . . . . . . . . . . . . . . . . . . . . . . . . . . 9
Adding DTx-EZ Custom Controls to Your Project . . . . . . . . . . . 10
Creating an Application . . . . . . . . . . . . . . . . . . . . . . . . . . . . . . . . . 12
Using the DTx-EZ Online Help . . . . . . . . . . . . . . . . . . . . . . . . . . . 13
1
Page 18

Chapter 1
What is DTx-EZ?
DTx-EZ is a set of Object-Linking and Embedding (OLE) controls that
facilitate rapid data acquisition application development in Visual
Basic and Visual C++ environments.
DTx-EZ supplies the programming tools to transform Visual Basic
and Visual C++ into a powerful data acquisition application
development environment. With DTx-EZ, you can quickly develop
applications with analog and digital I/O, real-time data display, and
a graphical user interface (GUI), while operating in a true Windows
environment.
Conforms to the DT-Open Layers Standard
DTx-EZ is fully compatible with DT-Open Layers.
DT-Open Layers is a set of open standards for developing integrated,
modular software under Microsoft Windows. Because it is modular
and uses Windows DLLs, DT-Open Layers is easily expanded to
support new, more powerful hardware devices without re-linking or
rebuilding applications. Therefore, you do not need to rewrite your
code when adding new data acquisition boards that have DT-Open
Layers-compliant device drivers. DT-Open Layers protects your
software investment now and in the future.
Provides Custom Controls
The DTx-EZ provides two custom controls:
• Data Acquisition Custom Control, and
• Plotting Custom Control.
The following subsections describe these controls.
2
Page 19

The Data Acquisition Custom Control
Overview
The Data Acquisition Custom Control facilitates performing data
acquisition functions. Each copy of the Data Acquisition Custom
Control operates on a single subsystem of the supported board at a
time. However, Visual Basic and Visual C++ lets you use multiple
copies of this control operating simultaneously, controlling different
subsystems on the same board or even on different boards.
DTx-EZ determines the capabilities of each subsystem for your data
acquisition board. The board’s supported capabilities are listed in the
custom control’s Properties window. You can control the subsystem's
operation by manipulating the subsystem's properties. You can
change the properties at design time in the Properties window or at
run time using simple Visual Basic or Visual C++ code.
Each subsystem may have multiple channels. For example, the A/D
subsystem on the DataAcq-EZ boards has 16 available channels. To
access multiple channels, you must set up a list of channels you want
to sample. The DataAcq-EZ boards also provide programmable
gains. To program the gains on the channels, you need to set up a
gain list to accompany the channel list.
The DT Plot Custom Control
1
1
1
1
1
1
The DT Plot Custom Control is a high-speed plotting control, useful
for plotting fixed- or floating-point data in your Visual Basic or Visual
C++ application. Since the DT Plot Custom Control works directly
with DT-Open Layers hBuf data, the need to copy the buffer to an
array is eliminated.
1
1
1
3
Page 20

Chapter 1
You fill a buffer with data you want to plot and assign it to the plot’s
Buffer property. You can plot from 1 to 16 channels of data at a time,
all with different colors. You may also choose from a variety of line
styles and the following features:
• x and y grid lines that you can set to automatically scale to your
data or to remain at fixed spacing intervals.
• x and y markers that can be used to indicate a zoom-in section of
the data or to determine the data value at that position.
• A stripchart mode so you can plot many buffers of
rapidly-changing, continuous data and see all of them on the
plot’s display.
• A single-point feature when in strip charting mode that allows
you to add one point of data at a time to the display.
At design time, the DT Plot Custom Control displays a
randomly-generated data plot that shows you what your plots will
look like. Whenever you change a property, the plot immediately
displays the effects of your changes. For some properties, you can
enter new data for the plot at either design time or run time.
Provides Properties, Methods, and Events
The Data Acquisition and DT Plot Custom Controls have unique
properties, methods, and events, described as follows:
• Properties represent the variables that allow you to configure the
data acquisition or plotting operation. Many read/write
properties are accessible in the Properties window at design time
or at runtime. Some read/write properties are lists that may be
accessed through the control’s custom property pages. Other
properties are read-only; you can access them only at runtime.
These read-only properties represent variables that you can use
to determine data acquisition or plotting capabilities.
4
Page 21

Overview
Note: Each Data Acquisition Custom Control can be associated
with a single subsystem at a time. This means that you must first
select the board and subsystem you want to use before you can configure
the subsystem's properties. When a custom control is created, its
properties are set to the default settings. You must modify the
properties if you want to change their values from the default
settings.
• Methods are tools that are used in the Visual Basic or Visual C++
code to provide runtime control of data acquisition operations;
no methods are associated with the DT Plot Custom Control.
• Events have procedures that execute code when the specified
data acquisition event occurs during runtime in the case of the
Data Acquisition Custom Control or when the specified mouse or
keyboard event occurs during runtime in the case of the DT Plot
Custom Control. Most OLE custom control events are based on
user interactions.
Note, however, that the Data Acquisition Custom Control events
are based on specific data acquisition events that could occur
within your application. Most of the Data Acquisition Custom
Control events are used for either continuous acquisition
operation or for error tracking.
1
1
1
1
1
1
All of the DT Plot Custom Control events are standard Microsoft
events. Refer to your Visual Basic or Visual C++ online help for
more information about them.
Provides Function and Subroutine Libraries
In addition to custom controls, DTx-EZ provides a library of
DT-Open Layers functions and subroutines for Visual Basic and for
Visual C++. These libraries add facilities for managing buffers,
simultaneously starting multiple subsystems, and performing FFT
analysis.
1
1
1
5
Page 22

Chapter 1
Follows Object-Oriented Design
For easy programming, DTx-EZ’s Application Programming
Interface (API) emphasizes polymorphism — it uses nearly identical
interface functions to communicate with each type of data acquisition
subsystem: analog input (A/D), analog output (D/A), digital input
(DIN), digital output (DOUT), and counter/timer (C/T).
The features provided by each supported data acquisition board
vary; for a complete list of capabilities supported by your board, refer
to board's driver documentation.
The API provides a full set of functions to query and set all possible
device capabilities. The library hides device details and presents a
consistent interface to each subsystem.
Provides Extensive Example Programs
To get your application up and running quickly, a comprehensive set
of Visual Basic and Visual C++ example programs is provided. You
can use these examples as tutorials to learn how DTx-EZ operates, or
you can modify one or more examples to form the basis of your own
custom data acquisition application. Source code is included, so you
can customize the examples to complete your Visual Basic or Visual
C++ application.
Provides Multiple Board Support
The DTx-EZ is hardware-independent. You can add support for new
boards without altering or recompiling code at the application level
simply by adding a new DT-Open Layers device driver. You install
the device driver separately (in the Windows environment); refer to
your board and/or device driver documentation for more
information on installing device drivers.
The library functions are designed to fully support all board features.
6
Page 23

Provides High Performance
Overview
DTx-EZ was designed with an intimate knowledge of the Windows
operating environment and the IBM PC computer system. As a result,
it takes unique advantage of the Windows architecture to achieve
maximum performance. By using sophisticated software buffering
(part of the DT-Open Layers standard), and the PCI bus, USB bus, or
DMA capabilities of the hardware, the software can achieve
continuous throughput to or from memory at greater than 1 MHz.
1
1
1
1
1
1
1
1
1
7
Page 24

Chapter 1
What You Need
To use DTx-EZ, you need the following:
• Pentium or higher-based PC with a CD-ROM drive and a
minimum of 32 Mbytes of RAM;
• One or more supported data acquisition boards;
• Microsoft Windows 2000 or XP.
• Microsoft Visual C++ 6.0 or Microsoft Visual Basic 6.0.
8
Page 25

Installation
DTx-EZ is installed automatically when you install the device driver
for the module. Refer to the getting started manual for your module
for more information.
Overview
1
1
1
1
1
1
1
1
1
9
Page 26

Chapter 1
Adding DTx-EZ Custom Controls to Your Project
The following subsections describe how to add DTx-EZ Custom
Controls to:
• A Visual Basic 6.0 project (this page),
• A Visual C++ 6.0 project (page 11).
Adding to a Visual Basic 6.0 Project
Before you begin using the DT-EZ, add the DTx-EZ Data Acquisition
and DT Plotting Custom Controls and definition files. Add the files
DTACQ32.OCX, DTPLOT32.OCX, OLMEMDEFS.BAS,
OLDADEFS.BAS and OLDSPDEFS.BAS to your project file as follows
from Visual Basic 6.0:
1. Select Project > Components.
The Components dialog box appears.
2. Click the Controls tab.
10
3. Click DTAcq32 OLE Custom Control module and/or DTPlot32
OLE Custom Control module, then click OK.
4. Choose Project > Add Module.
The Add Module dialog box appears.
5. Select the Existing tab.
6. Select OLMEMDEFS.BAS, OLDEFS.BAS, and/or
OLDSPDEFS.BAS from the \DTx-EZ\INCLUDE directory, and
click Open.
Page 27

When the DTx-EZ custom controls are loaded, the DTACQ32 and
DTPLOT32 icons appear in the Toolbox as follows:
Adding to a Visual C++ 6.0 Project
Overview
1
1
Before you begin using the DT-EZ, add the DTx-EZ Data Acquisition
and DT Plotting Custom Controls.
1. Start Windows 95 and launch Microsoft Visual C++ 6.0.
2. Create a new MFC project using the application wizard.
Ensure you add support for ActiveX controls in Step 2.
3. Select Project > Add to Project > Components and Controls.
The “Component and Controls Gallery” appears.
4. Double-click the Registered ActiveX Controls folder.
5. Select the DTPlot32 Control and click Insert.
The program prompts you to insert the component and to confirm the
creation of a wrapper class for accessing the control through Visual
C++.
6. Repeat step 5 for the DTAcq32 Control.
1
1
1
1
1
1
1
11
Page 28

Chapter 1
Creating an Application
You can use the Data Acquisition Custom Control and DT Plot
Custom Control just like other ActiveX or OLE custom controls to
integrate data acquisition into your Windows application. Create
your application as follows:
1. Add the Data Acquisition or DT Plot Custom Control to your
form by selecting it from the toolbox and placing it on your form.
For information on adding a DTx-EZ Custom Control to a project, see
page 10. Once added to your project, you can select the DTx-EZ
Custom Control from the toolbox.
2. Configure your control object for the desired function by setting
values in the Properties window.
Refer to Chapter 5, “Software Architecture,” for more information.
Context-sensitive online help is available for the DTx-EZ Custom
Controls as well. To access online help, simply press F1, and
information related to the current operation appears on the screen.
3. Add code, as needed, using the Code window to
− Respond to user actions,
12
− Change the properties at run time, or
− Control data acquisition operations.
Refer to Chapter 2, “Using the DTx-EZ Examples,” for more
information.
4. When you are ready to run your application outside your
development environment, create an executable file (.EXE) by
choosing Make EXE file from the File menu.
Note: When you create and distribute applications that use the
Data Acquisition Custom Control and DT Plot Custom Control,
review the licensing material included in the DTx-EZ online help.
Page 29

Using the DTx-EZ Online Help
This manual is intended to be used with the online help for DTx-EZ.
The online help contains all of the specific reference information for
each of the functions, error codes, and Windows messages not
included in this manual.
To launch this online help, double-click the DTx-EZ help icon in the
KUSB Series program group or folder.
Overview
1
1
1
1
1
1
1
1
1
13
Page 30

Chapter 1
14
Page 31

2
Using the DTx-EZ Examples
About the Examples. . . . . . . . . . . . . . . . . . . . . . . . . . . . . . . . . . . . . 16
A/D Burst Example . . . . . . . . . . . . . . . . . . . . . . . . . . . . . . . . . . . . . 20
DAC Waveform Generator Example. . . . . . . . . . . . . . . . . . . . . . . 25
Continuous A/D Example . . . . . . . . . . . . . . . . . . . . . . . . . . . . . . . 29
Single-Value Example . . . . . . . . . . . . . . . . . . . . . . . . . . . . . . . . . . . 31
About-Trigger Example. . . . . . . . . . . . . . . . . . . . . . . . . . . . . . . . . . 33
Digital I/O Example . . . . . . . . . . . . . . . . . . . . . . . . . . . . . . . . . . . . 35
DDE Server and Client Examples . . . . . . . . . . . . . . . . . . . . . . . . . 37
Waveform Generator Example. . . . . . . . . . . . . . . . . . . . . . . . . . . . 39
Continuous FFT Example . . . . . . . . . . . . . . . . . . . . . . . . . . . . . . . . 40
ChartIt Example . . . . . . . . . . . . . . . . . . . . . . . . . . . . . . . . . . . . . . . . 41
Scope Example . . . . . . . . . . . . . . . . . . . . . . . . . . . . . . . . . . . . . . . . . 42
15
Page 32

Chapter 2
About the Examples
DTx-EZ provides the software tools to create Visual Basic and
Visual C++ data acquisition applications quickly and easily. A
comprehensive set of examples shows you how to use DTx-EZ's Data
Acquisition and DT Plotting Custom Controls in the Visual Basic or
Visual C++ environment. If your needs are simple, choose one of the
example programs; DTx-EZ will perform data acquisition right out of
the box. Since all example source code is included, you can easily
modify the examples to suit your needs, combine two or more
examples, or extend the examples with your own code.
The following examples are provided:
• A/D Burst Example − Acquires data to disk; demonstrates
channel-gain list setup (page 20).
• DAC Waveform Generator Example − Generates sine, square, or
triangle output waveforms. It also demonstrates “zooming in”
using the plot control (page 25).
• Continuous A/D Example − Continuously samples and displays
multiple data points (page 29).
16
• Single Value Example − Acquires a single value from an A/D
subsystem; outputs a single value to a D/A subsystem (page 31).
• About-Trigger Example − Acquires data to disk from
initialization until the trigger event occurs and then for one
second after (page 33).
• Digital I/O Example − Controls digital I/O lines (page 35).
• DDE Server and Client Example − Moves data to or from other
applications using Window's Dynamic Data Exchange (page 37).
• Waveform Generator Example − Demonstrates the use of
counter/timers to generate square waves (page 39).
• Continuous FFT Example − Computes and displays FFTs of the
input data (page 40).
Page 33

Using the DTx-EZ Examples
• ChartIt Example − Demonstrates how to use the stripchart mode
to display single points of data (page 41).
• Scope Example − Generates and displays analog input channels
including typical oscilloscope functions (page 42).
2
This chapter explains how to use each example. To see actual signals
being acquired, connect a signal source to the analog inputs of your
data acquisition board. (You can choose to run the examples without
connecting a signal source to the board.)
You can run the examples as applications. However, if you wish to
view or modify the source code for the examples, open the associated
.VBP files from within Visual Basic (see page 18), or open the
associated .MDP files from within Visual C++ (see page 19).
Note: Before running the examples, make sure the device driver for
your data acquisition board has been installed.
Running the Examples as Applications
If you wish to use them as tutorials to learn how DTx-EZ operates,
you can run the examples as applications as follows:
1. Start your operating system.
2. In the start menu, select the icon for the desired example from the
DTx-EZ program group.
2
2
2
2
2
2
2
2
17
Page 34

Chapter 2
Opening the Examples from within Visual Basic
To customize the DTx-EZ example code for your own application,
you must open the example’s build file, .VBP, from within Visual
Basic as follows:
1. Start your operating system, and start Visual Basic.
2. Choose File > Open Project.
3. Select the examples from the directory DTx-EZ\examples\vb.
(The examples have a .VBP extension.)
Table 1: Visual Basic Example Programs and Their .VBP Files
Example Directory
A/D Burst \adburst\adburst.vbp
DAC Waveform \dacwave\dacwave.vbp
Continuous A/D \contdisp\contdisp.vbp
Single value \sv\sv.vbp
18
Digital I/O \dio\dio.vbp
DDE Server \dde\server.vbp
DDE Client \dde\client.vbp
Wave Generator \wavegen\wavegen.vbp
About-Trigger \abouttrigger\abouttrigger.vbp
Continuous FFT \contfft\contfft.vbp
ChartIt \chartit\chartit.vbp
Scope \scope\scope.vbp
4. Select Run > Start to run each example.
Page 35

Using the DTx-EZ Examples
Opening the Examples from within Visual C++
To customize the DTx-EZ example code for your own application,
you must open the example’s build file, .MDP, from within
Visual C++ as follows:
1. Start your operating system, and start Visual C++.
2. Choose File > Open Workspace.
3. Select the examples from the directory DTx-EZ\examples\cpp.
(The examples have a .MDP extension.)
Table 2: Visual C++ Example Programs and Their .MDP Files
Example Directory
A/D Burst \adburst\adburst.mdp
DAC Waveform \dacwave\dacwave.mdp
Continuous A/D \contdisp\contdisp.mdp
Single value \sv\sv.mdp
Digital I/O \dio\dio.mdp
DDE Server \dde\server\server.mdp
2
2
2
2
2
2
DDE Client \dde\client\client.mdp
Wave Generator \wavegen\wavegen.mdp
About-Trigger \abouttrigger\abouttrigger.mdp
Continuous FFT \contfft\contfft.mdp
ChartIt \chartit\chartit.mdp
Scope \scope\scope.mdp
4. Select Run > Start to run each example.
2
2
2
19
Page 36

Chapter 2
A/D Burst Example
This example (adburst.vbp or adburst.mdp) samples multiple analog
input channels and places the resulting data in a disk file for
archiving and post-acquisition analysis. This example also
demonstrates how to configure a channel-gain list and the A/D
subsystem for a data acquisition board. You could use this example
once your application is debugged to store actual data values.
When you run the example, the “Select Board” dialog box appears.
The A/D Buffer To File screen is shown in Figure 1.
20
Figure 1: A/D Buffer To File Screen
Follow these steps:
1. Select Configure > Board to select a board from the list.
2. Select Configure > CGL to set up your board's channel-gain list.
The Channel/Gain List Setup dialog box, shown in Figure 2, appears.
Page 37
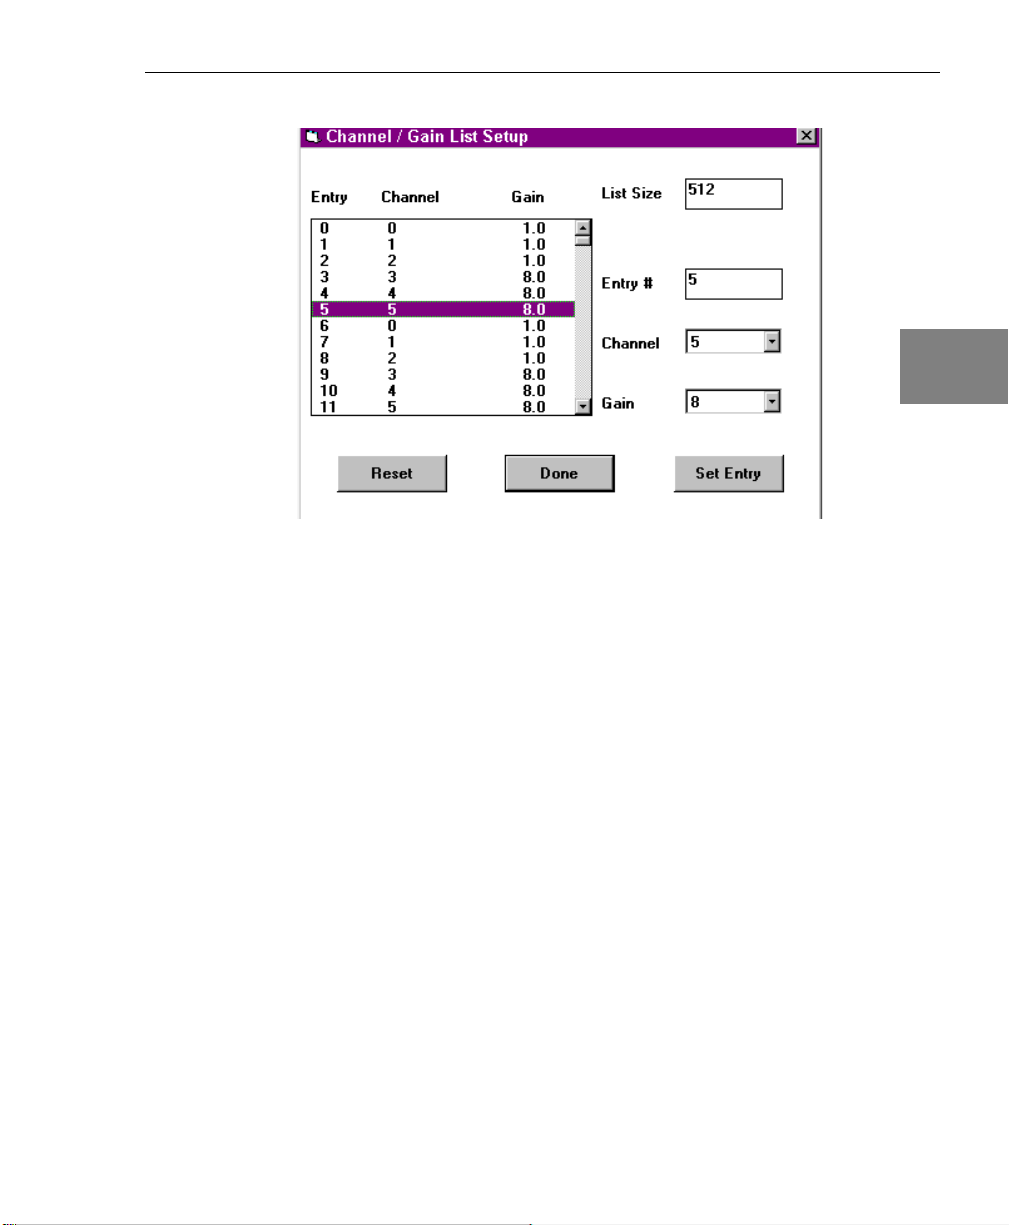
Figure 2: Setting Up a Channel-Gain List
Using the DTx-EZ Examples
2
2
2
2
2
During data acquisition, the channel-gain list automatically
selects channel and gain values without compromising
throughput. You can configure the list with channel numbers and
associated gains.
To set up the channel-gain list, perform the following steps:
a. Select the list size, and then choose channel and gain values
for each entry in the list.
b. After changing each item, click Set Entry to confirm the
setting.
c. When you have completed the setup, click Done to return to
the main menu.
2
2
2
2
21
Page 38

Chapter 2
The screen shown in Figure 2 illustrates a 512-entry channel-gain
list that repeatedly scans channels 0 through 5 using a gain of 1
for channels 0-2 and a gain of 8 for channels 3-5.
3. Select Configure > Input to configure the analog input settings
for your data acquisition board.
The Input Options dialog box, shown in Figure 3, appears.
22
Figure 3: Configure the Analog Input Settings
Page 39

Using the DTx-EZ Examples
Any settings that are not software-configurable for your board
are inactive. The available settings are as follows:
− Interface Mode — allows you to select either single-ended or
differential inputs. Most data acquisition boards can be
configured for either 16 single-ended or 8 differential input
channels. Single-ended inputs share a common ground.
Differential inputs use a separate ground for each channel
(which halves the channel capacity). Differential inputs can
improve accuracy where long cables, low-level input ranges
(< 1 V full-scale), or high resolution converters (> 12 bits) are
used.
2
2
2
Note: If your board uses an onboard jumper to set the input
mode, do not change this setting until you remove the board and
change the jumper configuration to correspond with the new
selection. If your board provides software-configurable input
mode selection, you do not need to change any jumper settings.
− Clock Source and Trigger Source — You can select either an
internal or an external clock source and trigger source. Clock
frequency sources and triggers help you synchronize data
conversions with off-board events. External frequency sources
can also be used to produce clock frequencies that cannot be
achieved with the board’s onboard oscillator.
− Range — allows you to select the input voltage range. Ranges
can be unipolar or bipolar.
− Encoding — lets you choose the input data encoding format.
2
2
2
2
2
2
23
Page 40

Chapter 2
Note: Because older boards use an onboard jumper to set the
input voltage range and data encoding format, these settings
cannot be changed until you remove the board and change the
jumper configuration to correspond with the new selections. (If
your board provides software-configurable settings, you do not
need to change any jumper settings.)
− Triggered Scan — You can enable this mode on boards that
support this feature. (Refer to your board’s driver
documentation to determine if it is supported on your board.)
Triggered scan mode performs scans through the
channel-gain list, where each scan is initiated by the onboard
trigger. On some boards, the interval between the scans is
programmable.
4. Select the desired options and click OK.
5. When you have completed the configuration, select Start! to
begin acquiring data.
Note that the menu name changes to Stop! until the operation is done.
You can choose Stop! to halt the operation at any time.
24
When the acquisition is complete, a message indicates that a
buffer of data was collected and where the file was created.
Page 41

Using the DTx-EZ Examples
DAC Waveform Generator Example
The DAC (digital-to-analog converter) waveform generator example
(dacwave.vbp or dacwave.mdp) uses the D/A subsystem to
continuously output a sine wave, square wave, or triangle wave. You
can specify waveform frequency and the board on which to output
the signal. You could use this example to supply a test signal for
circuit evaluation or a stimulus to your experiment.
2
2
When you run the example, the Select Board dialog box appears.
Choose the desired board from the list and click OK. The DAC
Waveform Generator screen, shown in Figure 4, appears.
Figure 4: DAC Waveform Generator Screen
2
2
2
2
2
2
2
25
Page 42
Chapter 2
Follow these steps:
1. Select Configure > Board to choose a data acquisition board from
the list.
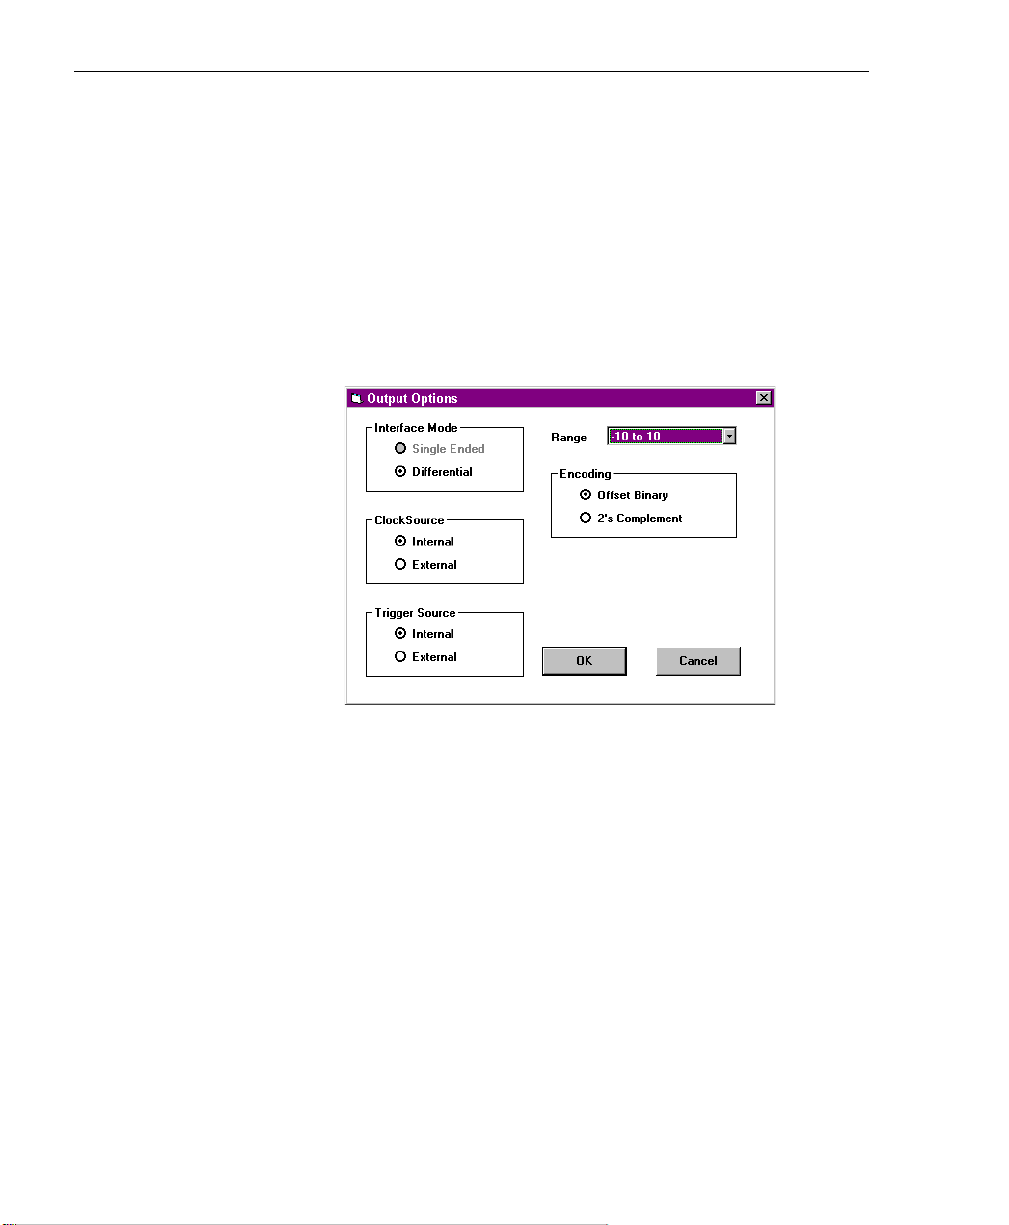
2. Select Configure > Output to configure the analog output
settings for your board.
The Output Options dialog box, shown in Figure 5, appears. Refer to
the A/D Burst example in the previous section for information on these
settings.
26
Figure 5: Configure the Analog Output Settings
3. Select Configure > Acquisition to configure your output
waveform.
The Acquisition Options dialog box, shown in Figure 6, appears.
Page 43

Using the DTx-EZ Examples
Figure 6: Configure Output Waveform
− Click Use DMA to enable direct memory access (DMA) for
data transfer operations. (For optimum speed, DMA should
be enabled on boards that support it.)
− Select the type of waveform you wish to produce, and then
select the waveform’s peak voltage, the wave frequency, and
the board’s sample frequency.
2
2
2
2
2
2
4. When you've completed the setup, click OK.
5. Select Start! to begin outputting a continuous waveform.
Note that the name changes to Stop! until the operation completes. You
can choose Stop! to halt the operation at any time.
6. Select ViewOutput! to display the waveform on your screen.
Figure 7 shows a typical sine wave.
2
2
2
27
Page 44

Chapter 2
Figure 7: Displaying a Waveform
You can zoom in on a portion of the data by right-clicking on the
plot and then dragging the red dotted selection bars.
Double-click the left mouse button to zoom out again.
28
Page 45

Continuous A/D Example
This example (contdisp.vbp or contdisp.mdp) continuously samples
a single analog input channel to memory and plots the data on screen
using pre-defined buffer and frequency settings. You could use this
example to detect data trends by immediately viewing the effect of
changing stimulus.
Click Start to begin the acquisition; click Stop to end it. Figure 8
shows a typical acquisition.
Using the DTx-EZ Examples
2
2
2
2
2
Figure 8: Continuous A/D Display
2
2
2
2
29
Page 46

Chapter 2
The Y-axis setting (volts) corresponds to the minimum and maximum
voltage settings for the selected board. The X-axis setting (seconds) is
determined by the data buffer size and selected sampling frequency.
(You can modify these properties within the example’s form_load()
event subroutine.)
30
Page 47

Single-Value Example
This example (sv.vbp or sv.mdp) acquires a single sample from a
single analog input channel and outputs a single value on the DAC
you specify. You can use this example to check for correct
configuration, to monitor slowly-changing inputs, or to provide a
constant or slowly-varying voltage output.
When you run it, the example prompts you for the board’s name.
After the board is located, a display allows you to monitor inputs and
generate outputs. A single value is continuously input and displayed
in a text box and on the scroll bar, as shown in Figure 9.
Using the DTx-EZ Examples
2
2
2
2
2
Figure 9: Monitoring Inputs and Outputs for a Single-Value Operation
2
2
2
2
31
Page 48

Chapter 2
A single value can also be output continuously. You can change the
output voltage setting by entering a new value in the text box or by
adjusting the scroll bar.
Note: The actual read and write rate is set (to 100 ms) by the timer
control. The clock timer control runs from the system clock.
32
Page 49

About-Trigger Example
This example (abouttrig.vbp or abouttrig.mdp) samples a single
analog input channel to memory and plots the data on screen using
pre-defined buffer and frequency settings until the main trigger
event. After the trigger, the example samples the channel for one
second and then stops. You could use this example to collect data
before and after a specific event (trigger) occurs. In this example, the
marker is used to show the first point collected after the trigger event,
so you can see the triggering point.
This example also demonstrates using the stripchart mode to plot
entire buffers of data rather than single points, one at a time.
Using the DTx-EZ Examples
2
2
2
Click Start to begin the acquisition; click Stop to end it. Figure 10
shows a typical acquisition.
Figure 10: About-Trigger A/D Display
2
2
2
2
2
2
33
Page 50

Chapter 2
The y-axis setting (volts) corresponds to the minimum and maximum
voltage settings for the selected board. The x-axis setting (number of
samples) is determined by the data buffer size and selected sampling
frequency. (You can modify these properties within the example’s
form_load() event subroutine.)
34
Page 51

Digital I/O Example
This example (dio.vbp or dio.mdp) demonstrates the use of a single
value operation with DIN and DOUT subsystems. You could use this
example to interface with sensors and control devices that use digital
signals.
After selecting the board, the screen shown in Figure 11 appears.
Using the DTx-EZ Examples
2
2
2
2
2
Figure 11: Monitoring Digital I/O Operations
The “light bulbs” represent the digital input and output data. A timer
control reads the digital input data at regular intervals. The light
bulbs turn “on” and “off” to indicate the value read from the DIN
subsystem.
You can change the digital output value by clicking the light bulbs in
the bottom half of the display. As you turn them on and off, the new
values are written to the DOUT subsystem.
2
2
2
2
35
Page 52

Chapter 2
Note: The actual read and write rate is set (to 100 ms) by the timer
control. The timer control runs from the system clock.
36
Page 53

DDE Server and Client Examples
The DDE server and client examples demonstrate the use of
Windows Dynamic Data Exchange (DDE) between applications. In
Visual Basic, these examples (server.vbp and client.vbp) reside in the
same directory; in Visual C++, these examples (server.mdp and
client.mdp) reside in their own directories. In either platform, the two
examples are designed to be used together. These examples allow you
to send acquired voltage values to other applications for analysis and
display and to move voltage values calculated in another application
to DTx-EZ for conversion and output. You could use this example for
report generation and data analysis or data generation using any
Windows spreadsheet, word processing, or analysis package.
Using the DTx-EZ Examples
2
2
2
For more information on DDE operation, refer to your development
environment’s programming guide.
Open the Server and Client examples to display the forms shown in
Figure 12.
Figure 12: DDE Forms
2
2
2
2
2
2
37
Page 54

Chapter 2
These forms allow you to share data between the two examples. The
Server represents the A/D subsystem and the Client represents the
D/A subsystem. The Server continuously updates the input data
values in the scroll bar and text box.
Follow these steps:
1. Click Copy Link on the Server form to copy the data link to the
clipboard.
2. Click Paste Link on the Client form to continuously output data
from the clipboard and to display it in the Client form’s scroll bar
and text box.
Note that the Paste Link command has toggled to Close DDE Link.
3. Click Close DDE Link to stop the data exchange into the D/A
subsystem.
38
Page 55

Waveform Generator Example
This example (wavegen.vbp or wavegen.mdp) generates a square
wave from counter/timer 0. Set the frequency by entering the value
(in hertz) in the text box at runtime, as shown in Figure 13.
Using the DTx-EZ Examples
2
2
2
2
Figure 13: Setting the Waveform Frequency
2
2
2
2
2
39
Page 56

Chapter 2
Continuous FFT Example
This example (contfft.vbp or contfft.mdp) acquires data from a single
analog input channel, performs frequency analysis on the data using
an FFT (Fast Fourier Transform), and plots the result of the analysis.
You could use this example for vibration analysis, to calculate
transfer functions, or to monitor the frequency content of an audio
signal.
Click Start to begin the FFT; click Stop to end it. A typical FFT display
is shown in Figure 14.
40
Figure 14: FFT Display
Page 57

ChartIt Example
This example (chartit.vbp or chartit.mdp) acquires data using the
GetSingleValue method and plots the data using the plotting
control’s SinglePoint property in stripchart mode.
Using the DTx-EZ Examples
2
Click Start to begin sampling. A timer control samples and plots each
data point every 500 ms. Click Stop to halt sampling. A typical
stripchart display is shown in Figure 15.
Figure 15: Stripchart Display
2
2
2
2
2
2
2
2
41
Page 58

Chapter 2
Scope Example
This example generates and displays data from one to four analog
input channels. It includes typical oscilloscope functions such as
single sweep or continuous scan, horizontal and vertical offsets, and
adjustable time and amplitude settings. The example also operates as
a single-channel spectrum analyzer with a number of popular
windowing selections.
You may apply gains and filters (if available) and even invert
Channel 2 data and add it to Channel 1 data. Both manual and auto
triggering as well as external triggering are possible. By clicking the
mouse on the plot display, an exact voltage reading for each channel
and the time of acquisition is displayed.
For further analysis, you can apply various windowing formulas as
well as FFTs to a single channel of data. Both of these are performed at
a user-selected acquisition rate.
Starting the example produces a screen similar to that shown in
Figure 16.
42
Page 59

Figure 16: Sample Scope Screen
Using the DTx-EZ Examples
2
2
2
2
2
2
2
2
2
43
Page 60

Chapter 2
44
Page 61

3
Property, Method, Function,
and Subroutine Summary
Introduction. . . . . . . . . . . . . . . . . . . . . . . . . . . . . . . . . . . . . . . . . . . . 46
Data Acquisition Custom Control . . . . . . . . . . . . . . . . . . . . . . . . . 47
Data Management DLLs . . . . . . . . . . . . . . . . . . . . . . . . . . . . . . . . . 64
DT Plot Custom Control . . . . . . . . . . . . . . . . . . . . . . . . . . . . . . . . . 69
45
Page 62

Chapter 3
Introduction
This chapter summarizes the properties, methods, functions, and
subroutines provided by the Data Acquisition and the DT Plot
Custom Controls in DTx-EZ.
46
Page 63

Property, Method, Function, and Subroutine Summary
Data Acquisition Custom Control
The Data Acquisition Custom Control provides the following
categories of data acquisition tools:
• Information properties and methods (page 47);
• Initialization properties (page 57);
• Configuration properties and functions (page 58); and
3
3
• Operation properties, methods, functions, and subroutines (page
61).
The following subsections briefly describe these tools.
Note: For specific information about each of these tools, refer to the
DTx-EZ online help. See page 13 for information on launching the
online help file.
Information Properties and Methods
To determine the capabilities of your installed boards, subsystems on
each board, and software, use the information properties and
methods listed in Table 4.
3
3
3
3
3
3
3
47
Page 64

Chapter 3
Table 4: Information Properties and Methods
Query About Properties and Methods Description
Boards and
Devices
Subsystems numSubSystems Property Returns the number of available
BoardList Property Lists all currently-installed DT-Open
Layers data acquisition boards
(devices).
numBoards Property Returns the number of DT-Open
Layers boards currently installed in
the system.
EnumBoards Method Invokes the board enumeration
sequence.
DeviceName Property Gets the full name of the specified
device (this name is set by the driver
as part of the installation procedure).
hDev Property Returns the handle of the current
subsystem’s device.
subsystems for the selected
DT-Open Layers board.
SubSystemList Property Lists the subsystems available for
the selected DT-Open Layers board.
EnumSS Method Lists the names, types, and element
number for each subsystem
supported by the specified device.
48
GetDevCaps Method Returns the number of elements for
a specified subsystem type on a
specified device.
Page 65

Property, Method, Function, and Subroutine Summary
Table 4: Information Properties and Methods (cont.)
Query About Properties and Methods Description
Subsystems
(cont.)
GetSSCaps Method Returns whether a specified
subsystem capability is supported
and/or the number of capabilities
supported. Refer to Ta bl e 5 for a list
of possible capabilities and return
values.
GetSSCapsEx Method Gets information about extended
subsystem capabilities including the
minimum and maximum throughput,
retrigger frequency, clock divider
value, and base clock frequency.
EnumSSCaps Method Lists the possible settings for
specified subsystem capabilities
including filters, ranges, gains, and
resolution.
numFilters Property Returns the number of available filter
settings for a subsystem.
FilterValues Property Lists filters available to the selected
subsystem.
numGains Property Returns the number of available gain
settings for a subsystem.
3
3
3
3
3
3
GainValues Property Lists the subsystem’s available gain
values.
numResolutions Property Returns the number of available
resolution settings for a subsystem.
ResolutionValues Property Lists a subsystem’s available
resolution values.
numRanges Property Returns the number of available
range settings for a subsystem.
MaxRangeValues Property Lists a subsystem’s maximum
voltage range values.
3
3
3
49
Page 66

Chapter 3
Table 4: Information Properties and Methods (cont.)
Query About Properties and Methods Description
Subsystems
(cont.)
Software LastError Property Retrieves the last known DT-Open
MinRangeValues Property Lists a subsystem’s minimum voltage
range values.
hDass Property Returns the handle of the current
subsystem.
Layers error generated by the
DTAcq32 Control.
LastErrorDescription
Property
Retrieves a string representation of
the last known DT-Open Layers error
generated by the DTAcq32 Control.
Tabl e 5 lists the subsystem capabilities that you can query using the
GetSSCaps method. Note that capabilities may be added as new
boards are developed; for the most recent set of capabilities, refer to
the DTx-EZ online help.
Table 5: Capabilities to Query with the GetSSCaps Method
Query About Capability Method Returns
Data Flow
Mode
OLSSC_SUP_SINGLEVALUE Non-zero if subsystem supports
single value operations.
50
OLSSC_SUP_CONTINUOUS Non-zero if subsystem supports
continuous (post-trigger)
operations.
OLSSC_SUP_CONTINUOUS_
PRETRIG
OLSSC_SUP_CONTINUOUS_
ABOUTTRIG
Non-zero if subsystem supports
continuous pre-trigger operations.
Non-zero if subsystem supports
continuous about-trigger (both
pre- and post-trigger) operations.
Page 67

Property, Method, Function, and Subroutine Summary
Table 5: Capabilities to Query with the GetSSCaps Method (cont.)
Query About Capability Method Returns
Simultaneous
Operations
Pausing
Operations
Windows
Messaging
Buffering OLSSC_SUP_BUFFERING Non-zero if subsystem supports
DMA OLSSC_NUMDMACHANS Number of DMA channels
OLSSC_SUP_
SIMULTANEOUS_START
OLSSC_SUP_PAUSE Non-zero if subsystem supports
OLSSC_SUP_POSTMESSAGE Non-zero if subsystem supports
OLSSC_SUP_WRPSINGLE Non-zero if subsystem supports
OLSSC_SUP_WRPMULTIPLE Non-zero if subsystem supports
OLSSC_SUP_INPROCESS_
FLUSH
Non-zero if subsystem can be
started simultaneously with
another subsystem on the device.
pausing during continuous
operation.
asynchronous operations.
buffering.
single buffer wrap mode.
multiple buffer wrap mode.
Non-zero if subsystem supports
copying a buffer on subsystem’s
inprocess queue.
supported.
3
3
3
3
3
3
OLSSC_SUP_GAPFREE_
NODMA
DMA (cont.) OLSSC_SUP_GAPFREE_
SINGLEDMA
OLSSC_SUP_GAPFREE_
DUALDMA
Non-zero if subsystem supports
gap-free continuous operation
with no DMA.
Non-zero if subsystem supports
gap-free continuous operation
with a single DMA channel.
Non-zero if subsystem supports
gap-free continuous operation
with two DMA channels.
3
3
3
51
Page 68

Chapter 3
Table 5: Capabilities to Query with the GetSSCaps Method (cont.)
Query About Capability Method Returns
Triggered
Scan Mode
Channel-Gain
List
OLSSC_SUP_TRIGSCAN Non-zero if subsystem supports
triggered scans.
OLSSC_MAXMULTISCAN Maximum number of scans per
trigger or retrigger supported by
the subsystem.
OLSSC_SUP_RETRIGGER_
SCAN_PER_TRIGGER
OLSSC_SUP_RETRIGGER_
INTERNAL
OLSSC_SUP_RETRIGGER_
EXTRA
OLSSC_CGLDEPTH Number of entries in channel-gain
OLSSC_SUP_RANDOM_CGL Non-zero if subsystem supports
Non-zero if subsystem supports
scan-per-trigger triggered scan
mode (retrigger is the same as
the initial trigger source).
Non-zero if subsystem supports
internal retriggered scan mode.
(retrigger source is on the board;
initial trigger is any available
trigger source).
Non-zero if subsystem supports
retrigger-extra triggered scan
mode (retrigger can be any
supported trigger source; initial
trigger combinations may be
limited by the driver).
list.
random channel-gain list setup.
52
OLSSC_SUP_SEQUENTIAL_
CGL
Non-zero if subsystem supports
sequential channel-gain list setup.
Page 69

Property, Method, Function, and Subroutine Summary
Table 5: Capabilities to Query with the GetSSCaps Method (cont.)
Query About Capability Method Returns
Channel-Gain
List (cont.)
Gain OLSSC_SUP_PROGRAMGAIN Non-zero if subsystem supports
Synchronous
Digital I/O
I/O Channels OLSSC_NUMCHANNELS Number of I/O channels.
OLSSC_SUP_
ZEROSEQUENTIAL_CGL
OLSSC_SUP_
SIMULTANEOUS_SH
OLSSC_SUP_CHANNELLIST_
INHIBIT
OLSSC_NUMGAINS Number of gain selections.
OLSSC_SUP_
SYNCHRONOUS_DIGITALIO
OLSSC_MAXDIGITALIOLIST_
VALUE
Non-zero if subsystem supports
sequential channel-gain list setup
starting with channel zero.
Non-zero if subsystem supports
simultaneous sample-and-hold
operations.The channel-gain list
must be set up with both a
sample channel and a hold
channel.
Non-zero if subsystem supports
channel-gain list entry inhibition.
programmable gain.
Non-zero if subsystem supports
synchronous digital output
operations.
Maximum value for synchronous
digital output channel list entry.
3
3
3
3
3
3
Channel Type OLSSC_SUP_SINGLEENDED Non-zero if subsystem supports
single-ended inputs.
OLSSC_MAXSECHANS Number of single-ended
channels.
OLSSC_SUP_DIFFERENTIAL Non-zero if subsystem supports
differential inputs.
OLSSC_MAXDICHANS Number of differential channels.
Filters OLSSC_SUP_
FILTERPERCHAN
OLSSC_NUMFILTERS Number of filter selections.
Non-zero if subsystem supports
filtering per channel.
3
3
3
53
Page 70

Chapter 3
Table 5: Capabilities to Query with the GetSSCaps Method (cont.)
Query About Capability Method Returns
Ranges OLSSC_NUMRANGES Number of range selections.
OLSSC_SUP_
RANGEPERCHANNEL
Resolution OLSSC_SUP_
SWRESOLUTION
OLSSC_NUMRESOLUTIONS Number of different resolutions
Data
Encoding
Triggers OLSSC_SUP_SOFTTRIG Non-zero if subsystem supports
OLSSC_SUP_BINARY Non-zero if subsystem supports
OLSSC_SUP_2SCOMP Non-zero if subsystem supports
OLSSC_SUP_EXTERNTRIG Non-zero if subsystem supports
OLSSC_SUP_
THRESHTRIGPOS
OLSSC_SUP_
THRESHTRIGNEG
Non-zero if subsystem supports
different range settings for each
channel.
Non-zero if subsystem supports
software-programmable
resolution.
that you can program for the
subsystem.
binary encoding.
twos complement encoding.
internal software trigger.
external digital (TTL) trigger.
Non-zero if subsystem supports
positive analog threshold trigger.
Non-zero if subsystem supports
negative analog threshold trigger.
54
OLSSC_SUP_
ANALOGEVENTTRIG
OLSSC_SUP_
DIGITALEVENTTRIG
OLSSC_SUP_
TIMEREVENTTRIG
OLSSC_
NUMEXTRATRIGGERS
Non-zero if subsystem supports
analog event trigger.
Non-zero if subsystem supports
digital event trigger.
Non-zero if subsystem supports
timer event trigger.
Number of extra trigger sources
supported.
Page 71
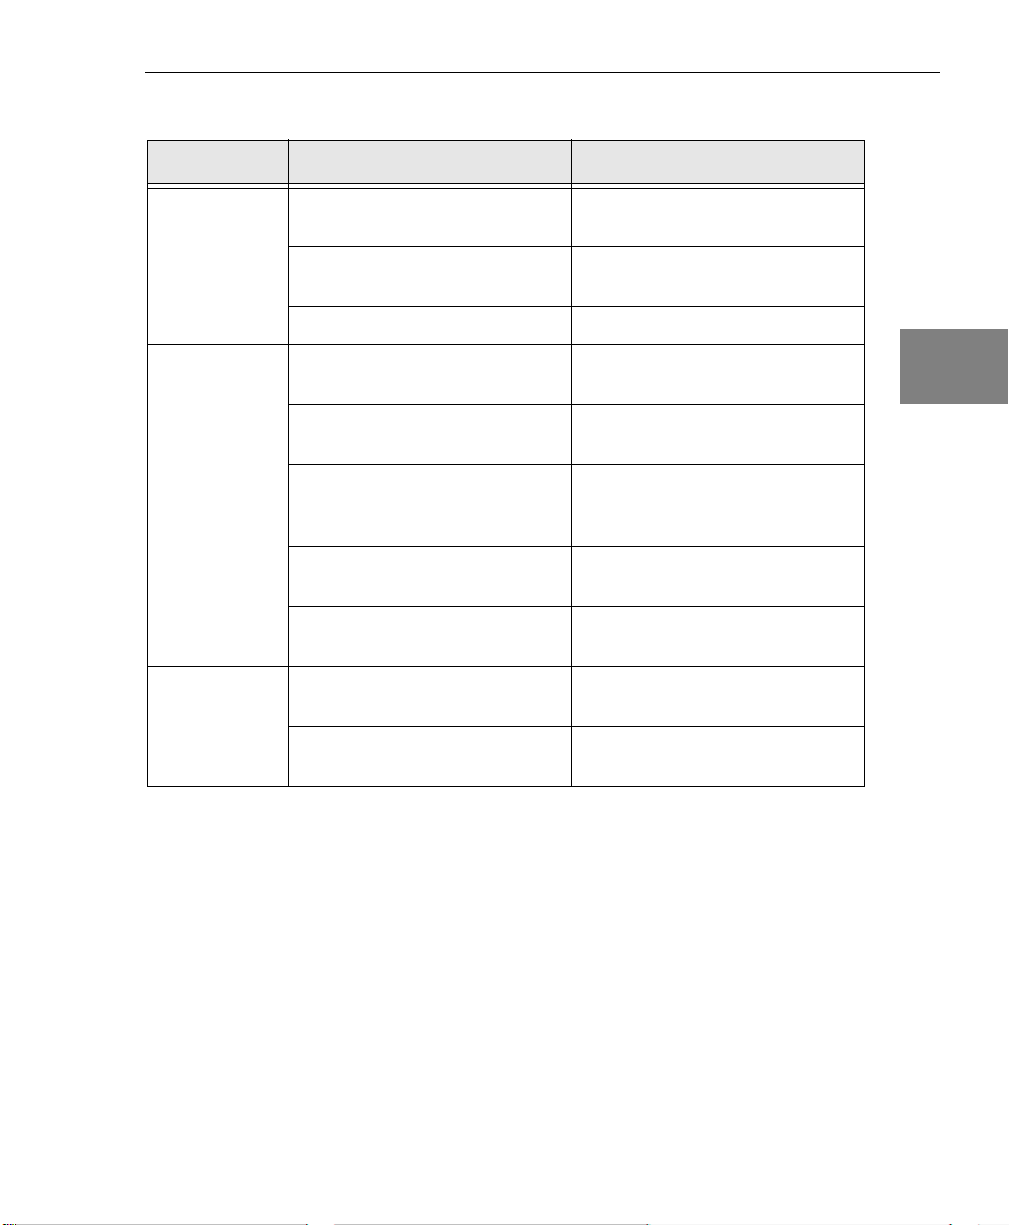
Property, Method, Function, and Subroutine Summary
Table 5: Capabilities to Query with the GetSSCaps Method (cont.)
Query About Capability Method Returns
Clocks OLSSC_SUP_INTCLOCK Non-zero if subsystem supports
internal clock.
OLSSC_SUP_EXTCLOCK Non-zero if subsystem supports
external clock.
OLSSC_NUMEXTRACLOCKS Number of extra clock sources.
Counter/Timer
Modes
Counter/Timer
Pulse Output
Ty p es
OLSSC_SUP_CASCADING Non-zero if subsystem supports
cascading.
OLSSC_SUP_CTMODE_
COUNT
OLSSC_SUP_CTMODE_RATE Non-zero if subsystem supports
OLSSC_SUP_CTMODE_
ONESHOT
OLSSC_SUP_CTMODE_
ONESHOT_RPT
OLSSC_SUP_PLS_HIGH2LOW Non-zero if subsystem supports
OLSSC_SUP_PLS_LOW2HIGH Non-zero if subsystem supports
Non-zero if subsystem supports
event counting mode.
rate generation (continuous pulse
output) mode.
Non-zero if subsystem supports
(single) one-shot mode.
Non-zero if subsystem supports
repetitive one-shot mode.
high-to-low output pulses.
low-to-high output pulses
3
3
3
3
3
3
3
3
3
55
Page 72

Chapter 3
Table 5: Capabilities to Query with the GetSSCaps Method (cont.)
Query About Capability Method Returns
Counter/Timer
Gates
OLSSC_SUP_GATE_NONE Non-zero if subsystem supports
an internal (software) gate type.
OLSSC_SUP_GATE_HIGH_
LEVEL
OLSSC_SUP_GATE_LOW_
LEVEL
OLSSC_SUP_GATE_HIGH_
EDGE
OLSSC_SUP_GATE_LOW_
EDGE
OLSSC_SUP_GATE_LEVEL Non-zero if subsystem supports
OLSSC_SUP_GATE_HIGH_
LEVEL_DEBOUNCE
OLSSC_SUP_GATE_LOW_
LEVEL_DEBOUNCE
OLSSC_SUP_GATE_HIGH_
EDGE_DEBOUNCE
Non-zero if subsystem supports
high-level gate type.
Non-zero if subsystem supports
low-level gate type.
Non-zero if subsystem supports
high-edge gate type.
Non-zero if subsystem supports
low-edge gate type.
level change gate type.
Non-zero if subsystem supports
high-level gate type with input
debounce.
Non-zero if subsystem supports
low-level gate type with input
debounce.
Non-zero if subsystem supports
high-edge gate type with input
debounce.
56
OLSSC_SUP_GATE_LOW_
EDGE_DEBOUNCE
OLSSC_SUP_GATE_LEVEL_
DEBOUNCE
Interrupt OLSSC_SUP_INTERRUPT Non-zero if subsystem supports
Non-zero if subsystem supports
low-edge gate type with input
debounce.
Non-zero if subsystem supports
level change gate type with input
debounce.
interrupt-driven I/O.
Page 73

Property, Method, Function, and Subroutine Summary
Table 5: Capabilities to Query with the GetSSCaps Method (cont.)
Query About Capability Method Returns
FIFOs OLSSC_SUP_FIFO Non-zero if subsystem has a
FIFO in the data path.
Processors OLSSC_SUP_PROCESSOR Non-zero if subsystem has a
processor on board.
Software
Calibration
OLSSC_SUP_SWCAL Non-zero if subsystem supports
software calibration.
Initialization Properties
Once you have identified the available devices, use the initialization
properties described in Tab le 6 .
Table 6: Initialization Properties
Property Description
Board Property Provides the means for the software to associate specific
requests with a particular board; it must be called before any
other property. This property loads a specified board’s
software support. Specify the alias name assigned to the
board upon its installation.
3
3
3
3
3
3
SubSystem Property Provides the means for the software to associate specific
requests with a particular subsystem on a board; it must be
called after the Board property and before any other tool.
SubSysElement
Property
SubSysType Property Sets and returns the subsystem’s type. May be used in
Sets and returns the subsystem’s element number. May be
used in conjunction with the SubSysType property as a
replacement for the SubSystem property.
conjunction with the SubSysElement property as a
replacement for the SubSystem property.
3
3
3
57
Page 74
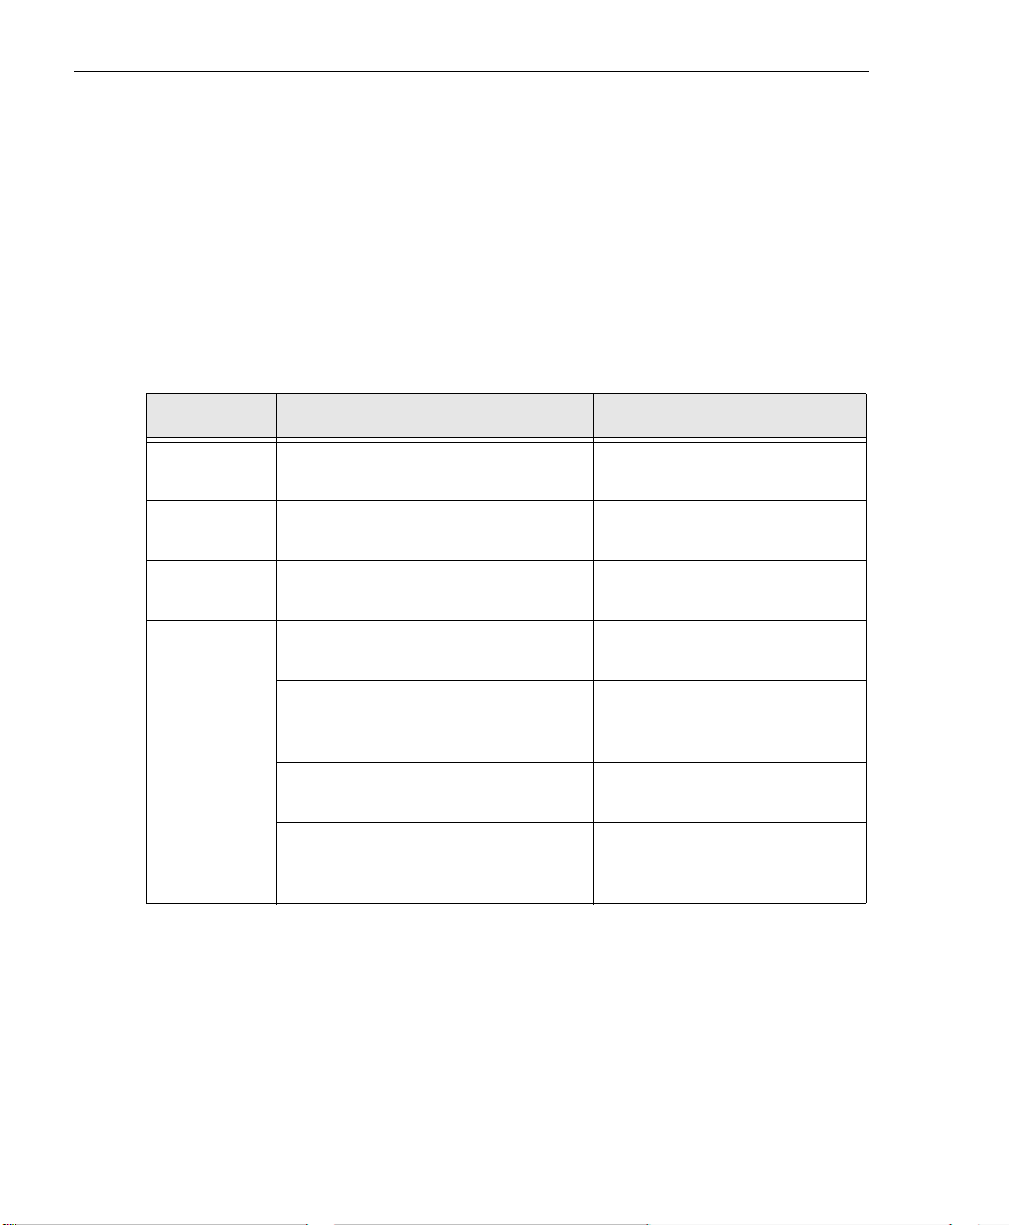
Chapter 3
Configuration Properties and Functions
Once you have initialized a board and subsystem and determined
what its capabilities are, set or return the value of the subsystem’s
parameters using the configuration properties and functions listed in
Tabl e 7.
Note that italic text indicates a the name of an alternate function call.
Table 7: Configuration Properties and Functions
Feature Properties and Functions Description
Data Flow
Mode
Buffer Wrap
Mode
DMA DmaUsage Property Sets and returns the number of
Triggered
Scans
DataFlow Property Sets and returns the data flow
mode.
WrapMode Property Sets and returns the buffer
processing wrap mode.
DMA channels to be used.
TriggeredScan Property Enables or disables triggered
scan mode.
MultiscanCount Property Sets and returns the number of
times to scan per
trigger/retrigger.
RetriggerMode Property Sets and returns the retrigger
mode.
RetriggerFreq Property Sets and returns the frequency
of the internal retrigger when
using internal retrigger mode.
58
Page 75

Property, Method, Function, and Subroutine Summary
Table 7: Configuration Properties and Functions (cont.)
Feature Properties and Functions Description
ChannelGain List
Synchronous
Digital I/O
Channel
Ty p e
Filters FilterList Property Sets and returns the analog
ListSize Property Sets and returns the size of the
channel-gain list.
ChannelList Property Sets and returns the channel
number of a channel-gain list
entry.
GainList Property Sets a gain value for a
channel-gain list entry.
InhibitList Property Enables/disables channel entry
inhibition for a channel-gain list
entry.
DIOList Property Sets and returns the digital
value to output for the
channel-gain list entry.
SyncDIOUsage Property Enables/disables synchronous
digital I/O operations.
ChannelType Property Sets and returns the channel
configuration type of a channel.
filter that may be applied to
each input or output channel.
3
3
3
3
3
3
Ranges Range Property Sets and returns the voltage
range for a subsystem.
Get Channel Range Function
olDaGetChannelRange
MaxRange Property Returns the maximum voltage
MinRange Property Returns the minimum voltage
Gets the voltage range for a
channel.
value of the current range
setting.
value of the current range
setting.
3
3
3
59
Page 76

Chapter 3
Table 7: Configuration Properties and Functions (cont.)
Feature Properties and Functions Description
Resolution Resolution Property Sets and returns the number of
bits of resolution.
Data
Encoding
Triggers Trigger Property Sets and returns the
Clocks ClockSource Property Sets and returns the clock
Counter/Tim
ers
Encoding Property Sets and returns the data
encoding type.
post-trigger source.
PreTrigger Property Sets and returns the
pre-trigger source.
ReTrigger Property Sets and returns the retrigger
source for retrigger-extra
retrigger mode.
source.
Frequency Property Sets and returns the frequency
of the internal clock or a
counter/timer’s output
frequency.
ClockDivider Property Sets and returns the divider
value applied to the external
clock.
CTMode Property Sets and returns the
counter/timer mode.
CascadeMode Property Sets and returns the
counter/timer cascade mode.
60
GateType Property Sets and returns the gate type
for the counter/timer mode.
PulseType Property Sets and returns the pulse type
for the counter/timer mode.
PulseWidth Property Sets and returns the pulse
output width for the
counter/timer mode.
Page 77
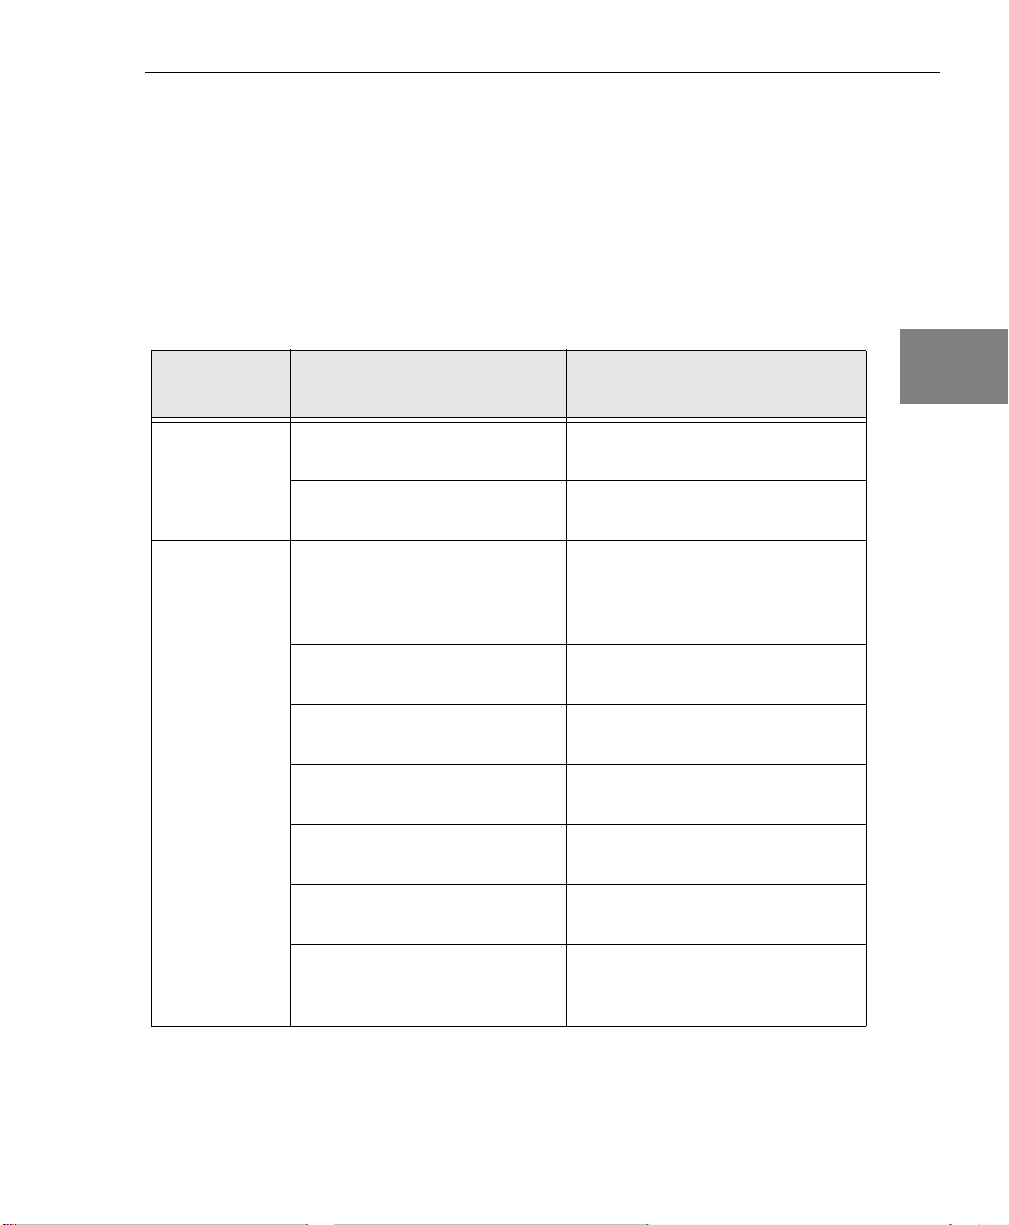
Property, Method, Function, and Subroutine Summary
Operation Properties, Methods, Functions, and Subroutines
Once you have set the parameters of a subsystem, use the operation
properties, methods, functions, and subroutines listed in Table 8 .
Note that italic text indicates a the name of an alternate function call.
Table 8: Operation Properties, Methods, Functions, and Subroutines
3
3
Operation
Single-Value
Operations
All Other
Operations
Properties, Methods,
Functions, and Subroutines
GetSingleValue Method Reads a single input value from
the specified subsystem channel.
PutSingleValue Method Writes a single output value to the
specified subsystem channel.
Config Method After setting up a specified
subsystem using the configuration
tools, configures the subsystem
with new parameter values.
Start Method Starts the operation for which the
subsystem has been configured.
Pause Method Pauses a continuous operation on
the subsystem.
Continue Method Continues the previously paused
operation on the subsystem.
Stop Method Stops the operation and returns
the subsystem to the ready state.
Abort Method Stops the subsystem’s operation
immediately.
Description
3
3
3
3
3
3
Reset Method Causes the operation to terminate
immediately, and reinitializes the
subsystem.
3
61
Page 78

Chapter 3
Table 8: Operation Properties, Methods, Functions, and Subroutines (cont.)
Properties, Methods,
Operation
Functions, and Subroutines
Description
Buffer
Operations
Counter/Timer
Operations
Power
Operations
Flush Method Transfers all data buffers held by
the subsystem to the done queue.
Queue Property Adds buffers to the ready queue
and retrieves buffers from the
done queue.
QueueSize Property Gets the size of the specified
queue (ready, done or inprocess)
for a specified subsystem. The
size indicates the number of
buffers on the specified queue.
CTReadEvents Method Gets the number of events that
have been counted since the
subsystem was started with the
Start method.
MeasureFrequency Method Measures the frequency of the
input clock source for the selected
counter/timer.
PowerOn Method Powers on a USB module and
restores the configuration of the
module at the time that it was last
powered down.
PowerOff Method Stores the configuration of the
USB module and powers down the
module.
62
Errors ClearError Method Clears the LastErrNum property.
LastErrNum Property Retrieves the last known DT-Open
Layers error generated by the
DTAcq32 Control.
LastErrDescription Property Retrieves a string representation
of the last known DT-Open Layers
error generated by the DTAcq32
Control.
Page 79
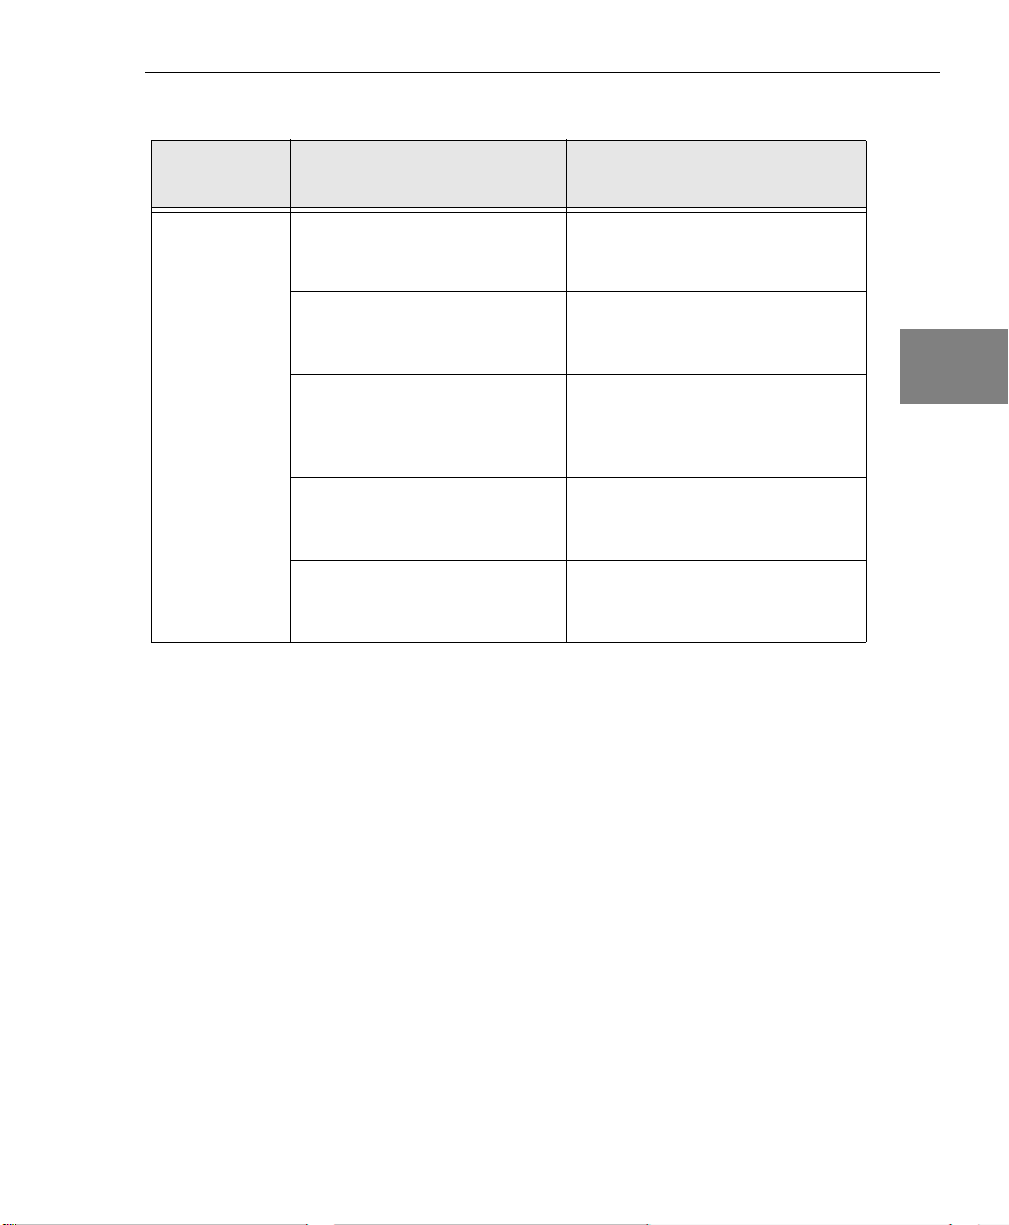
Property, Method, Function, and Subroutine Summary
Table 8: Operation Properties, Methods, Functions, and Subroutines (cont.)
Operation
Simultaneous
Operations
Properties, Methods,
Functions, and Subroutines
GetSimultaneousStartList
Function
olDaGetSSList
PutSubSysOnSSList
Subroutine
olDaPutDassToSSList
SimultaneousPreStart
Subroutine
olDaSimultaneousPreStart
SimultaneousStart Subroutine
olDaSimultaneousStart
ReleaseSimultaneousStartList
olDaReleaseSSList
Description
Creates a simultaneous start list
and returns a handle to it.
Puts the specified subsystem on
the simultaneous start list.
Simultaneously prestarts
(performs setup operations on) all
subsystems on the specified
simultaneous start list.
Simultaneously starts all
subsystems on the specified
simultaneous start list.
Releases all subsystems from the
simultaneous start list and
removes the list itself.
3
3
3
3
3
3
3
3
3
63
Page 80

Chapter 3
Data Management DLLs
In addition to the Data Acquisition Custom Control, DTx-EZ offers
the following data management tools:
• Buffer management functions and subroutines (page 64) and
• Conversion functions and subroutines (page 67).
Buffer Management Functions and Subroutines
The buffer management functions and subroutines form one of the
basic elements of the DT-Open Layers architecture. They “glue” the
various layers together. The fundamental data object in DTx-EZ is a
buffer. All functions that create, manipulate, and delete buffers are
encapsulated in the data management portion of DTx-EZ.
The buffer management functions and subroutines, listed in Table 9,
are intended for use by both application and system programmers.
They provide a set of object-oriented buffer management facilities.
When a buffer object is created, a buffer handle (hbuf) is returned.
This handle is used in all subsequent buffer manipulation.
64
Note: The buffer management functions and subroutines, listed in
Tabl e 9, are intended for use by both application and system
programmers. They provide a set of object-oriented buffer
management facilities. When a buffer object is created, a buffer
handle (hbuf) is returned. This handle is used in all subsequent
buffer manipulation.
Page 81

Property, Method, Function, and Subroutine Summary
Note: Because of the differences in the two compliers, the Visual
Basic and Visual C++ libraries exist as separate entities; however,
they are nearly identical in functionality. In Ta ble 9, a function or
subroutine name followed by a parenthetical, italicized name
indicates that Visual Basic and Visual C++ each have their own tools.
In such cases, the Visual C++ name appears in italics following the
Visual Basic name.
For specific information about each of these functions and
subroutines, refer to the DTx-EZ online help. See page 13 for
information on launching the online help file.
Table 9: Buffer Management Functions and Subroutines
Functions and Subroutines Description
AllocBuffer Function
olDmAllocBuffer
CallocBuffer Function
olDmCallocBuffer
CopyChannelFromBuffer
Subroutine*
Creates a buffer object of a specified number of
samples, where each sample is 2 bytes.
Creates a buffer object of a specified number of
samples of a specified size.
Copies one selected channel’s data from a buffer to
the specified array.
3
3
3
3
3
3
CopyLongChannelFromBuffer
Subroutine*
CopySingleChannelFromBuffer
Subroutine*
CopyChannelToBuffer
Subroutine*
CopyLongChannelToBuffer
Subroutine*
* These functions were instituted for Visual Basic users since direct buffer access cannot be
achieved; Visual C++ users can access the buffer directly with olDmGetBufferPtr.
Copies one selected channel’s data from a buffer to
the specified array.
Copies one selected channel’s data from a buffer to
the specified array.
Copies one selected channel’s data from a buffer to
the specified array.
Copies one selected channel’s data from a buffer to
the specified array.
3
3
3
65
Page 82

Chapter 3
Table 9: Buffer Management Functions and Subroutines (cont.)
Functions and Subroutines Description
CopySingleChannelToBuffer
Subroutine*
CopyFromBuffer Subroutine* Copies data from a buffer to the specified array.
CopyToBuffer Subroutine* Copies data from an array to the specified buffer.
FreeBuffer Subroutine
olDmFreeBuffer
olDmGetBufferPtr Gets a pointer to the buffer data.
GetBufferSize Function
olDmGetBufferSize
GetDataBits Function
olDmGetDataBits
GetDataWidth Function
olDmGetDataWidth
GetErrorString Function
olDaGetErrorString
olDmGetErrorString
olDspGetErrorString
GetMaxSamples Function
olDmGetMaxSamples
GetTimeDateStamp Function
olDmGetTimeDateStamp
Copies one selected channel’s data from a buffer to
the specified array.
Deletes a buffer object.
Gets the physical buffer size (in bytes).
Gets the number of valid data bits.
Gets the width of each data sample.
Gets the string corresponding to a data
management error code value.
Gets the physical size of the buffer (in samples).
Gets the time and date of the buffer's data.
66
SetValidSamples Function
olDmSetValidSamples
Sets the number of valid samples in the buffer.
Page 83
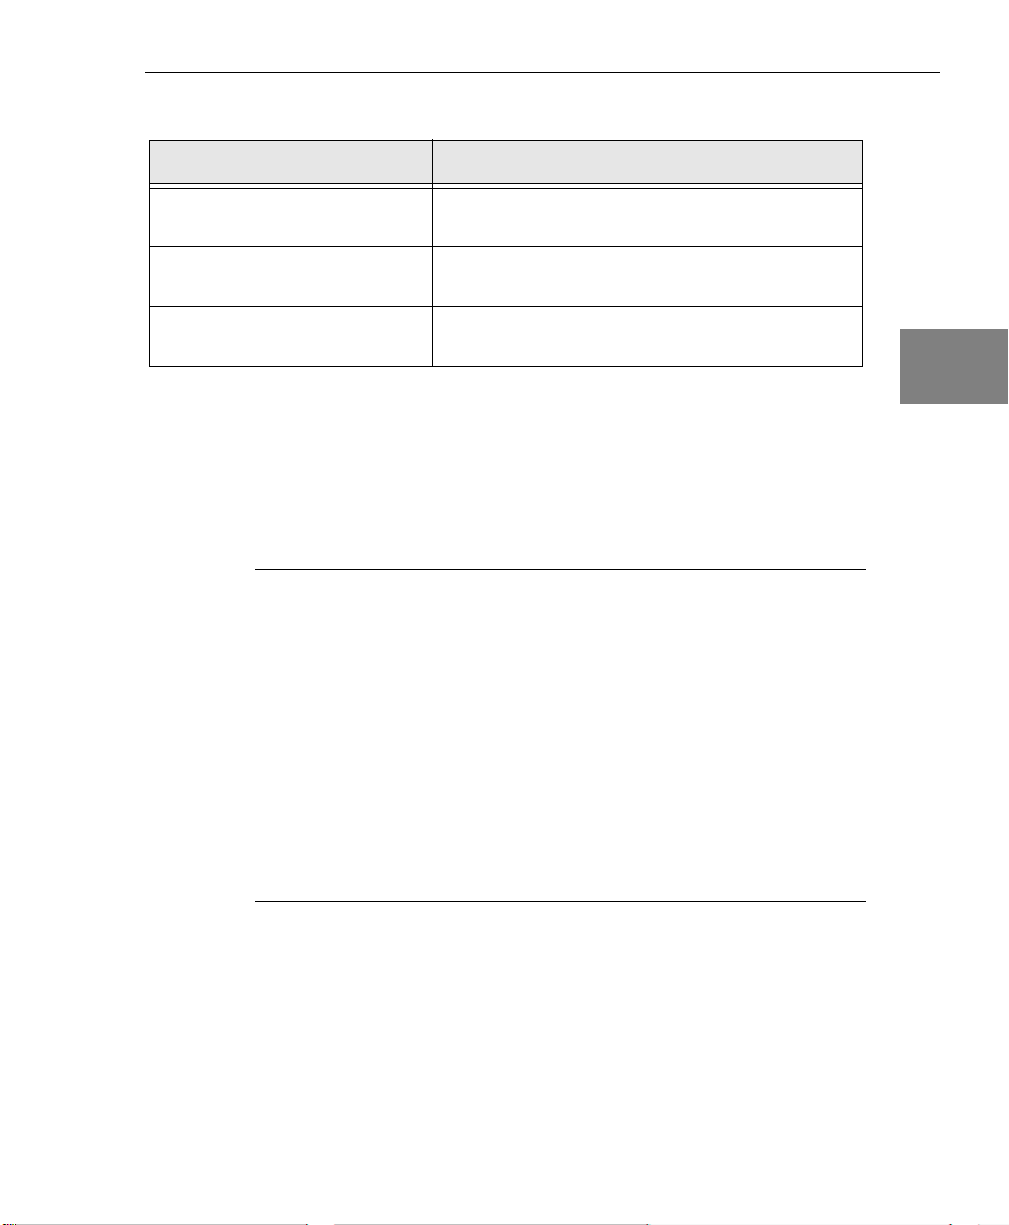
Property, Method, Function, and Subroutine Summary
Table 9: Buffer Management Functions and Subroutines (cont.)
Functions and Subroutines Description
GetValidSamples Function
olDmGetValidSamples
ReallocBuffer Subroutine
olDmReAllocBuffer
ReCallocBuffer Subroutine
olDmReCallocBuffer
Gets the number of valid samples.
Reallocates a buffer object (alloc() interface).
Reallocates a buffer object (calloc() interface).
Conversion Functions and Subroutines
The data conversion utilities that are available in DTx-EZ are listed in
Tabl e 10.
Note: The conversion utilities, listed in Table 10, are intended for
use by both application and system programmers. Because of the
differences in the two compliers, the Visual Basic and Visual C++
libraries exist as separate entities; however, they are nearly identical
in functionality. In Table 10, a function or subroutine name followed
by a parenthetical, italicized name indicates that Visual Basic and
Visual C++ each have their own tools. In such cases, the Visual C++
name appears in italics following the Visual Basic name.
For specific information about each of these functions and
subroutines, refer to the DTx-EZ online help. See page 13 for
information on launching the online help file.
3
3
3
3
3
3
3
3
3
67
Page 84

Chapter 3
Table 10: Conversion Utilities
Functions and Subroutines Description
ValueToVolts Function Converts a value into a voltage value as a
single-precision value.
VoltsToOutput Subroutine
olDspVoltsToOutput
VoltsToValue Function Converts the specified voltage into units that are
InputToVolts Subroutine
olDspInputToVolts
MagToDB Subroutine
olDspMagToDB
RealFFT Subroutine
olDspRealFFT
Window Subroutine
olDspWindow
Converts input voltage values to an output buffer
that is compatible with the current setting of the
specified subsystem.
appropriate for the specified subsystem.
Converts a subsystem input buffer into the
corresponding voltage values.
Converts the input buffer data into decibels (dB).
Performs a Fast Fourier Transform (FFT) on the
specified data buffer.
Converts the input data buffer into floating-point
and applies the specified window.
68
Page 85

Property, Method, Function, and Subroutine Summary
DT Plot Custom Control
The DT Plot Custom Control provides the following categories of
plotting control properties:
• Plot appearance (this page),
• Plot pre-display operational parameters (page 70),
•Grids (page 71),
3
3
•Markers (page 71),
• x-Axis parameters (page 72),
•y-Axis parameters (page 73), and
• Plotting operation control parameters (page 73).
The following subsections briefly describe these properties.
Note: For specific information about each of these properties, refer
to the DTx-EZ online help. See page 13 for information on launching
the online help file.
Plot Appearance
The properties outlined in Table 11 allow you to affect the display’s
basic appearance.
3
3
3
3
3
3
3
69
Page 86
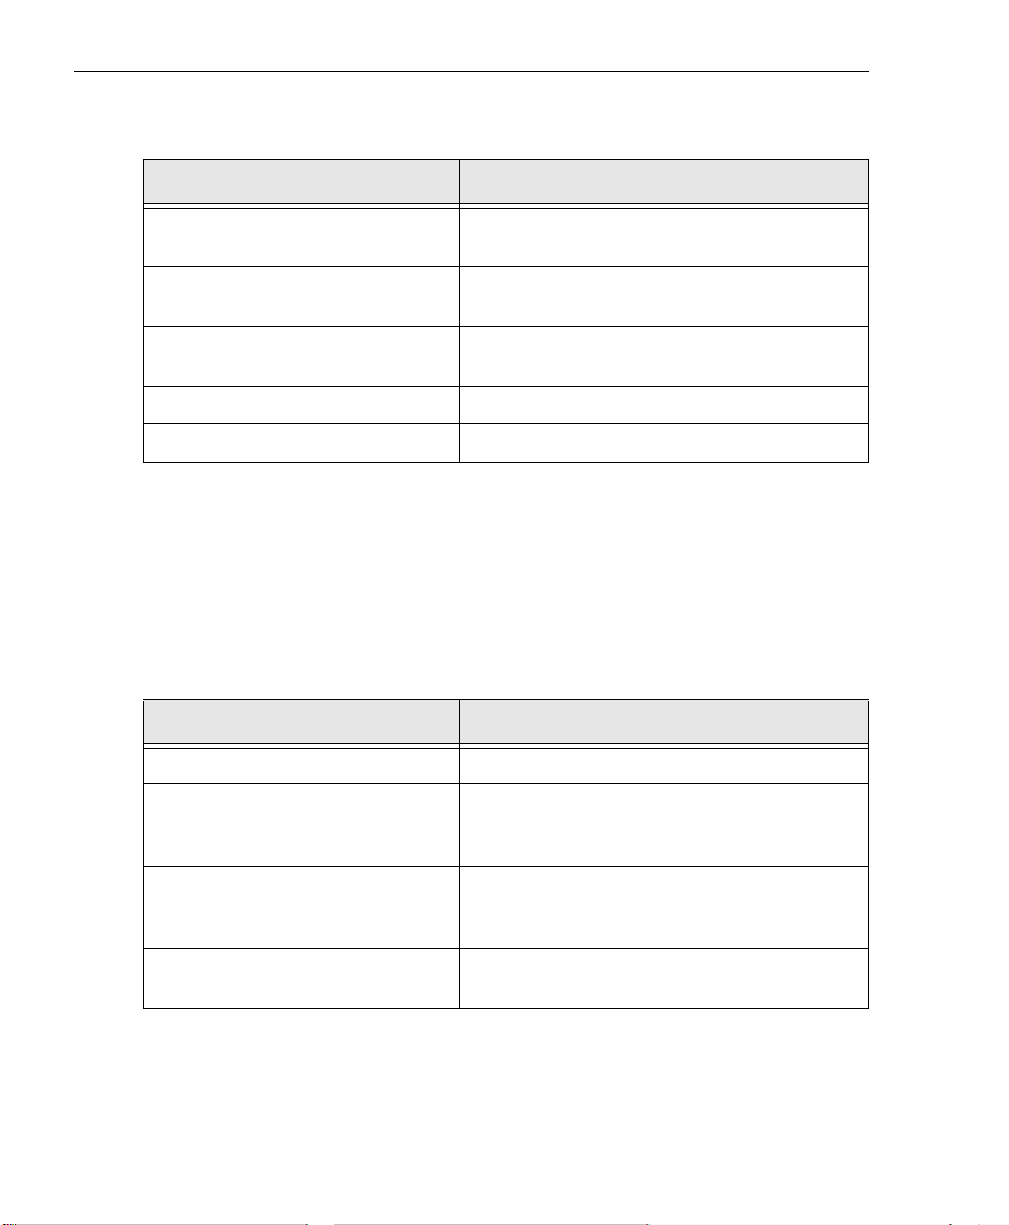
Chapter 3
Table 11: Plot Appearance
Property Description
BackColor Sets the display’s background color (Microsoft
standard property)
ForeColor Sets the plot lines’ colors (Microsoft standard
property)
Palette Property Sets the color of each channel’s plot line
individually.
LineStyle Property Sets the style of the data plotting lines.
LineWidth Property Sets the width of the data plotting lines.
Plot Pre-Display Operational Parameters
The properties outlined in Table 12 allow you to define how the plot
functions and outputs data.
70
Table 12: Plot Pre-Display Operational Parameter Properties
Property Description
StripChartMode Property Enables/Disables the stripchart mode.
StripChartSize Property Sets and returns the maximum number of data
points to store and that can be displayed per
channel when in stripchart mode.
DataType Property Sets the type of data in the buffer object
(unsigned fixed point, singed fixed point, or
floating-point).
numChannels Property Specifies the number of data channels in the
buffer object.
Page 87

Grids
Property, Method, Function, and Subroutine Summary
The properties in Table 13 allow you to affect the display’s grid
appearance.
Table 13: Grid Properties
Property Description
GridAutoScale Property Enables/Disables grid autoscale mode.
GridColor Property Sets and returns the grid color.
GridStyle Property Sets and returns the grid’s line style.
GridXOn Property Displays/Hides vertical grid lines.
GridXSpacing Property Sets vertical grid line spacing.
GridXStart Property Sets the position of the first vertical grid line.
GridYOn Property Displays/Hides horizontal grid lines.
GridYSpacing Property Sets horizontal grid line spacing.
GridYStart Property Sets the position of the first horizontal grid line.
3
3
3
3
3
3
Markers
The properties outlined in Table 14 allow you to affect the display’s
marker appearance.
Table 14: Marker Properties
Property Description
MarkerColor Property Sets the color for the horizontal and vertical
markers.
MarkerH1On Property Displays/Hides the first horizontal marker.
3
3
3
71
Page 88

Chapter 3
Table 14: Marker Properties (cont.)
Property Description
MarkerH1Pos Property Sets the position of the first horizontal marker.
MarkerH2On Property Displays/Hides the second horizontal marker.
MarkerH2Pos Property Sets the position of the second horizontal
marker.
MarkerV1Data Property Sets and returns the value of the data point at
the location of the first marker.
MarkerV1On Property Displays/Hides the first vertical marker.
MarkerV1Pos Property Sets the position of the first vertical marker.
MarkerV2Data Property Sets and returns the value of the data point at
the location of the second marker.
MarkerV2On Property Displays/Hides the second vertical marker.
MarkerV2Pos Property Sets the position of the second vertical marker.
72
x-Axis Parameters
The properties outlined in Table 15 allow you to affect a plot’s x-axis.
Table 15: x-Axis Parameter Properties
Property Description
xAutoScale Property Enables/Disables setting the xStart and
xLength properties automatically for each new
data buffer.
xLength Property Specifies the amount of data per channel to
display.
xScale Property Sets the x-axis scaling of the input data buffer.
xStart Property Sets the first data point to be displayed.
Page 89

y-Axis Parameters
Property, Method, Function, and Subroutine Summary
The properties outlined in Table 16 allow you to affect a plot’s y-axis.
Table 16: x-Axis Parameter Properties
Property Description
yAutoScale Property Enables/Disables setting the yMin and yMax
properties automatically for each new data
buffer.
yMax Property Specifies the upper limit of the plot’s y-axis.
yMin Property Specifies the lower limit of the plot’s y-axis.
Plotting Operation Control Parameters
The properties outlined in Table 17 allow you to affect how the
DT Plot Custom Control handles and plots data.
Table 17: Plotting Operation Control Parameter Properties
Property Description
3
3
3
3
3
3
Buffer Property Plots a buffer of data.
ForceRepaint Property Enables/Disables the repainting mode.
MouseXPos Property Returns the x coordinate of the current mouse
position.
MouseYPos Property Returns the y coordinate of the current mouse
position.
SinglePoint Property Plots a single point in stripchart mode.
UpdateMode Property Enables/Disables the plot update mode.
3
3
3
73
Page 90

Chapter 3
74
Page 91

4
Programming Flowcharts
Introduction. . . . . . . . . . . . . . . . . . . . . . . . . . . . . . . . . . . . . . . . . . . . 76
Single-Value Operations . . . . . . . . . . . . . . . . . . . . . . . . . . . . . . . . . 77
Continuous Buffered Input Operations . . . . . . . . . . . . . . . . . . . . 79
Continuous Buffered Output Operations. . . . . . . . . . . . . . . . . . . 81
Event Counting Operations . . . . . . . . . . . . . . . . . . . . . . . . . . . . . . 83
Frequency Measurement Operations . . . . . . . . . . . . . . . . . . . . . . 85
Pulse Output Operations. . . . . . . . . . . . . . . . . . . . . . . . . . . . . . . . . 87
Plotting Control Operations . . . . . . . . . . . . . . . . . . . . . . . . . . . . . . 89
75
Page 92

Chapter 4
Introduction
If you are unfamiliar with the capabilities of your board and/or
subsystem, query the device as follows:
• To determine the number and types of DT-Open Layers boards
and drivers installed, use the
properties.
• To determine the subsystems supported by the board, use the
EnumSS or GetDevCaps
• To determine the capabilities of a subsystem, use the GetSSCaps
or GetSSCapsEx
in Table 5 on page 50.
• To determine the gains, filters, resolutions, and ranges if more
than one is available, use the EnumSSCaps method, or these sets
of properties:
− Gains numGains and GainValues
− Filters numFilters and FilterValues
numBoards and the BoardList
method.
method, specifying one of the capabilities listed
76
− Resolutions numResolutions and
ResolutionsValues
− Ranges numRanges, MinRangeValues, and
MaxRangeValues
Then, follow the flowcharts presented in the remainder of this
chapter to perform the desired operation.
Note: Although the flowcharts do not show error checking, it is
recommended that you check for errors after using each property,
method, function, and subroutine.
Page 93
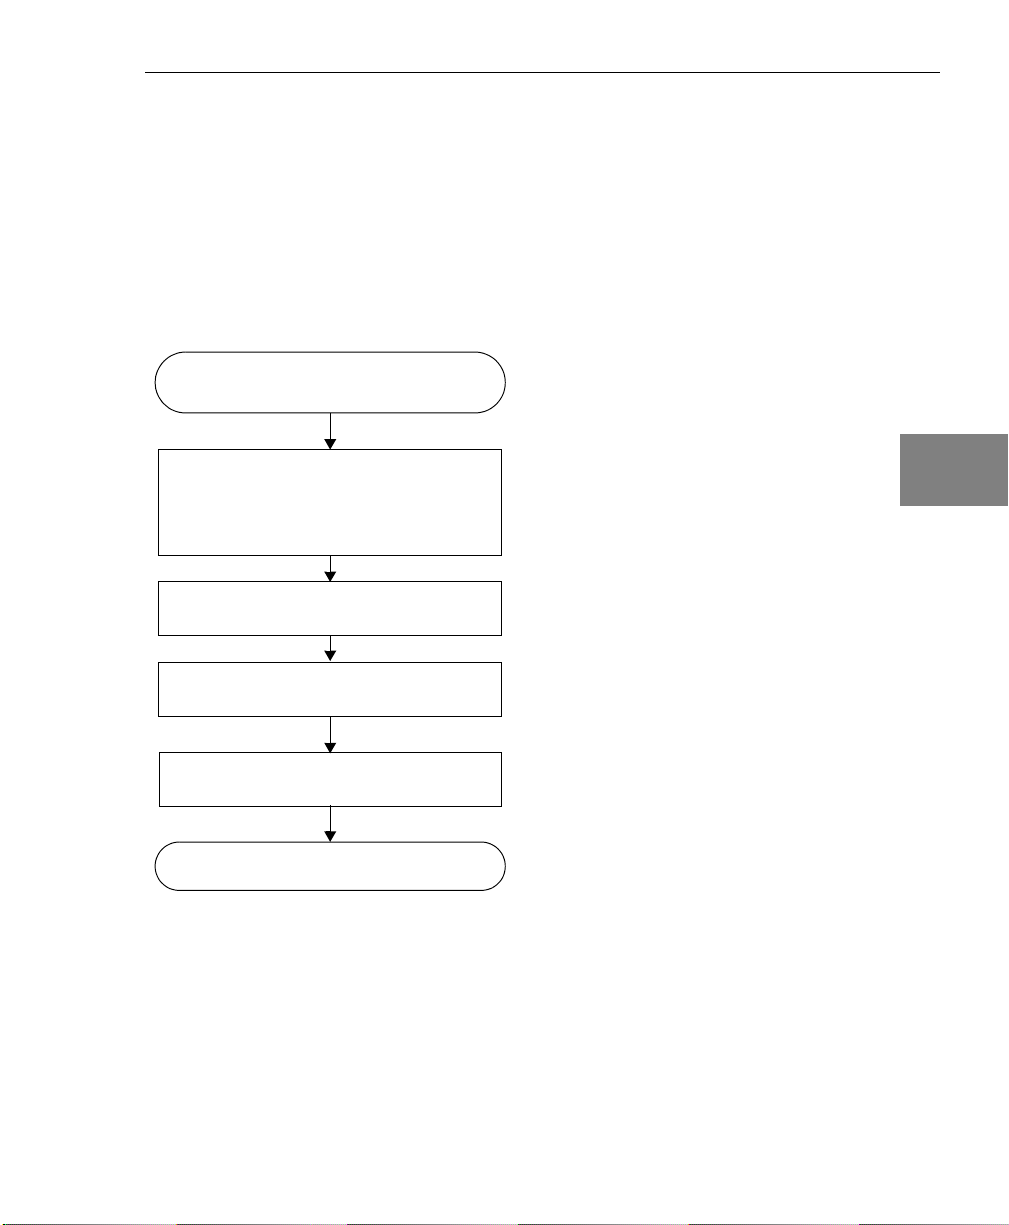
Single-Value Operations
The flowchart in Figure 17 provides an overview of the steps required
to perform a single-value operation. Some steps represent several
substeps; if you are unfamiliar with the functions required to perform
a step, refer to the indicated page in Appendix A for more
information.
Programming Flowcharts
4
4
Select the board with the Board
property.
Specify the subsystem to perform the
operation with the SubSystem property
(or use the SubSysType and
SubSysElement properties).
Specify a single value operation by setting
the DataFlow property to 1.
Set the subsystem parameters
(see page 172).
Configure the subsystem using the
Config method.
Go to the next page.
Figure 17: Performing Single-Value Operations
Specify A/D for an analog input subsystem, D/A
for an analog output subsystem, DIN for a digital
input subsystem, or DOUT for a digital output
subsystem.
4
4
4
4
4
4
4
77
Page 94

Chapter 4
Continued from previous page.
Acquiring
Ye s
data?
No
Output a single value using the
PutSingleValue method.
Acquire a single value using the
GetSingleValue method.
Acquire/output
another
value?
Figure 17: Performing Single-Value Operations (cont.)
Ye s
78
Page 95
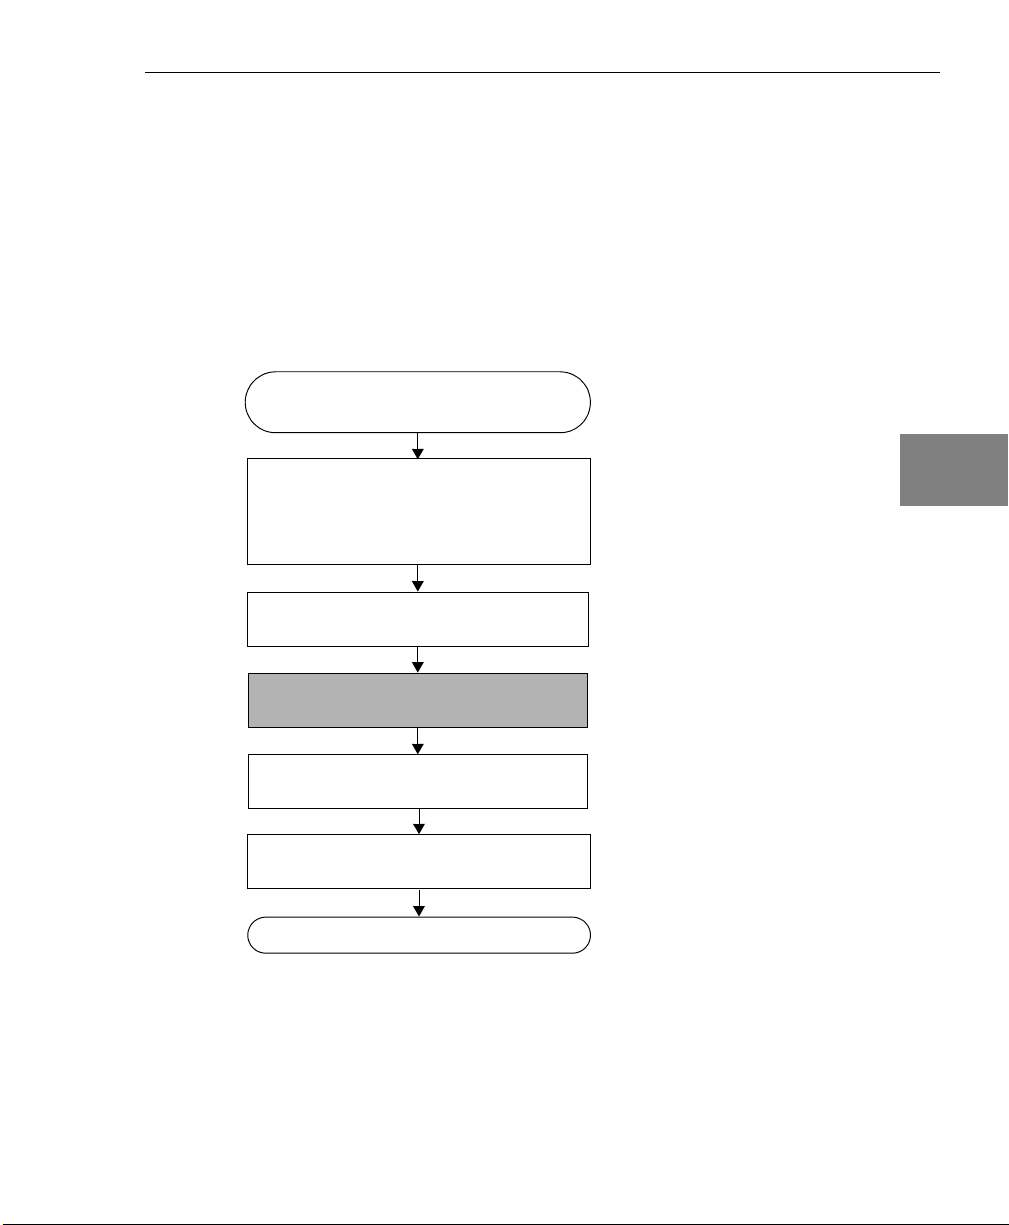
Programming Flowcharts
Continuous Buffered Input Operations
The flowchart in Figure 18 provides an overview of the steps required
to perform a continuous buffered analog input or digital input
operation. Many steps represent several substeps; if you are
unfamiliar with the functions required to perform a step, refer to the
indicated page in Appendix A for more information. Optional steps
appear in shaded boxes.
4
4
Select the board with the Board
property.
Specify the subsystem to perform the
operation with the SubSystem property
(or use the SubSysType and
SubSysElement properties).
Set the data flow with the DataFlow
property.
Set the DMA channel usage using the
DmaUsage property.
Set the subsystem parameters
(see page 172).
Set up the channel list and channel
parameters (see page 173).
Go to the next page.
1
Specify continuous (0) for post-trigger operations, continuous pre-trigger (4)
for continuous pre-trigger operations, or continuous about-trigger (5) for
continuous about-trigger operations).
1
4
4
4
4
4
4
4
Figure 18: Performing a Continuous Buffered Input Operation
79
Page 96

Chapter 4
Continued from previous page.
Set up the clocks, triggers, and
pre-triggers (see page 174).
If you want to use triggered scan mode,
set up the scan (see page 175.)
Set up buffering (see page 176).
Configure the subsystem using the
Config method.
Start the operation with the Start
method.
Deal with events and buffers
(see page 178).
80
Stop the operation
(see page 184).
Figure 18: Performing a Continuous Buffered Input Operation (cont.)
Page 97

Programming Flowcharts
Continuous Buffered Output Operations
The flowchart in Figure 19 provides an overview of the steps required
to perform a continuous buffered analog output or digital output
operation. Many steps represent several substeps; if you are
unfamiliar with the functions required to perform a step, refer to the
indicated page in Appendix A for more information. Optional steps
appear in shaded boxes.
4
4
Select the board with the Board
property.
Specify the subsystem to perform the
operation with the SubSystem property
(or use the SubSysType and
SubSysElement properties).
Select continuous data flow by setting
the DataFlow property to
continuous (0).
Set the DMA channel usage using the
DmaUsage property.
Set the subsystem parameters
(see page 172).
Set up the channel list and channel
parameters (see page 173).
4
4
4
4
4
4
Go to the next page.
Figure 19: Performing a Continuous Buffered Output Operation
4
81
Page 98

Chapter 4
Continued from previous page.
Set up the clocks and triggers
(see page 181).
Set up buffering (see page 177).
Configure the D/A or DOUT subsystem
using the Config method.
Start the operation with the Start
method.
Deal with events and buffers
(see page 181).
82
Stop the operation
(see page 184).
Figure 19: Performing a Continuous Buffered Output Operation (cont.)
Page 99

Event Counting Operations
The flowchart in Figure 20 provides an overview of the steps required
to perform an event counting operation. Many steps represent several
substeps; if you are unfamiliar with the functions required to perform
a step, refer to the indicated page in Appendix A for more
information. Optional steps appear in shaded boxes.
Programming Flowcharts
4
4
Select the board with the Board property.
Select a C/T subsystem with the
SubSystem property (or use the
SubSysType and SubSysElement
properties).
Set the cascade mode using the
CascadeMode property.
Set up the clocks and gates
(see page 183).
Specify the count events counter/timer mode
by setting the CTMode property to event
counting (0).
Configure the subsystem using the Config
method.
4
4
4
4
4
4
Go to the next page.
Figure 20: Performing an Event Counting Operation
4
83
Page 100

Chapter 4
Continued from previous page.
Start the operation using the Start method.
Read the events counted using the
CTReadEvents method.
Get update
of events
total?
No
Stop the operation
(see page 184).
Ye s
Figure 20: Performing an Event Counting Operation (cont.)
84
 Loading...