

Page 1

Short Introduction
K15 Protocol Tester
C73000-B6076-C103-1
This document supports software version 1.00
Revised: September 03
Page 2

Copyright © Tektronix, Inc. 2003. All rights reserved.
Tektronix products are covered by U.S. and foreign patents, issued and pending.
Information in this publication supercedes that in all previously published material.
Specifications and price change privileges reserved.
Valid controlled documentation is only distributed electronically by Tektronix.
Printed copies are considered for reference only.
Tektronix Berlin
Wernerwerkdamm 5
13629 Berlin
GERMANY
TEKTRONIX and TEK are registered trademarks of Tektronix, Inc.
Microsoftr Windows XP Embeddedr: Copyright © Microsoft Corporation
1985 - 2002
Adober Acrobatr Reader Version 5.0: Copyright © Adobe Systems Incorporated
and its licensors 1987 - 2001
Routines to compress and uncompress tcp packets (for transmission over low speed
serial lines): Copyright © Regents of the University of California 1989
VxWorksr Version 5.1: Copyright © Wind River Systems, Inc. 1984 - 1993
Network Time Protocol Software: Copyright © David L. Mills 1982 - 2003
PowerQuest Software: Copyright © PowerQuest Corporation 1994 - 2001
Page 3

WARRANTY
Tektronix warrants that this product will be free from defects in materials and workmanship for a
period of one (1) year from the date of shipment. If any such product proves defective during this
warranty period, Tektronix, at its option, either will repair the defective product without charge
for parts and labor, or will provide a replacement in exchange for the defective product.
In order to obtain service under this warranty, Customer must notify Tektronix of the defect
before the expiration of the warranty period and make suitable arrangements for the performance
of service. Customer shall be responsible for packaging and shipping the defective product to the
service center designated by Tektronix, with shipping charges prepaid. Tektronix shall pay for the
return of the product to Customer if the shipment is to a location within the country in which the
Tektronix service center is located. Customer shall be responsible for paying all shipping charges,
duties, taxes, and any other charges for products returned to any other locations.
This warranty shall not apply to any defect, failure or damage caused by improper use or
improper or inadequate maintenance and care. Tektronix shall not be obligated to furnish service
under this warranty a) to repair damage resulting from attempts by personnel other than Tektronix
representatives to install, repair or service the product; b) to repair damage resulting from
improper use or connection to incompatible equipment; c) to repair any damage or malfunction
caused by the use of non–Tektronix supplies; or d) to service a product that has been modified or
integrated with other products when the effect of such modification or integration increases the
time or difficulty of servicing the product.
THIS WARRANTY IS GIVEN BY TEKTRONIX WITH RESPECT TO THE LISTED
PRODUCTS IN LIEU OF ANY OTHER WARRANTIES, EXPRESS OR IMPLIED.
TEKTRONIX AND ITS VENDORS DISCLAIM ANY IMPLIED WARRANTIES OF
MERCHANTABILITY OR FITNESS FOR A PARTICULAR PURPOSE. TEKTRONIX’
RESPONSIBILITY TO REPAIR OR REPLACE DEFECTIVE PRODUCTS IS THE
SOLE AND EXCLUSIVE REMEDY PROVIDED TO THE CUSTOMER FOR BREACH
OF THIS WARRANTY. TEKTRONIX AND ITS VENDORS WILL NOT BE LIABLE
FOR ANY INDIRECT, SPECIAL, INCIDENTAL, OR CONSEQUENTIAL DAMAGES
IRRESPECTIVE OF WHETHER TEKTRONIX OR THE VENDOR HAS ADVANCE
NOTICE OF THE POSSIBILITY OF SUCH DAMAGES.
Page 4

Page 5

Table of Contents
General Safety Summary xiii. . . . . . . . . . . . . . . . . . . . . . . . . . . .
Service Safety Summary xix. . . . . . . . . . . . . . . . . . . . . . . . . . . . .
Precautions xxi. . . . . . . . . . . . . . . . . . . . . . . . . . . . . . . . . . . . . . . .
Preface xxiii. . . . . . . . . . . . . . . . . . . . . . . . . . . . . . . . . . . . . . . . . . . .
About This Manual xxiv. . . . . . . . . . . . . . . . . . . . . . . . . . . . . . . . . .
Conventions xxv. . . . . . . . . . . . . . . . . . . . . . . . . . . . . . . . . . . . . . . .
Related Manuals and Online Documentation xxvi. . . . . . . . . . . . . .
Service and Support xxvii. . . . . . . . . . . . . . . . . . . . . . . . . . . . . . . . . .
Contacting Tektronix xxviii. . . . . . . . . . . . . . . . . . . . . . . . . . . . . . . . .
Configuration 1. . . . . . . . . . . . . . . . . . . . . . . . . . . . . . . . . . . . . .
Switching on the K15 Protocol Tester 5. . . . . . . . . . . . . . . . . . . .
Autoconfiguration 7. . . . . . . . . . . . . . . . . . . . . . . . . . . . . . . . . . .
Manual Configuration 8. . . . . . . . . . . . . . . . . . . . . . . . . . . . . . . .
Configuring Hardware 9. . . . . . . . . . . . . . . . . . . . . . . . . . . . . . . .
Creating Measurement Scenarios 12. . . . . . . . . . . . . . . . . . . . . . .
Configuring Sources 16. . . . . . . . . . . . . . . . . . . . . . . . . . . . . . . . .
Configuring Processing Elements 23. . . . . . . . . . . . . . . . . . . . . . .
Saving Configurations 33. . . . . . . . . . . . . . . . . . . . . . . . . . . . . . . .
Printing Configurations 35. . . . . . . . . . . . . . . . . . . . . . . . . . . . . . .
Copying Configurations (Pack&Go) 35. . . . . . . . . . . . . . . . . . . . .
Loading Saved Configurations 36. . . . . . . . . . . . . . . . . . . . . . . . .
K15 Measurements 37. . . . . . . . . . . . . . . . . . . . . . . . . . . . . . . . .
Selecting a Type of Measurement 38. . . . . . . . . . . . . . . . . . . . . . .
Starting Measurements 46. . . . . . . . . . . . . . . . . . . . . . . . . . . . . . .
Stopping Measurements 47. . . . . . . . . . . . . . . . . . . . . . . . . . . . . . .
Viewing Measurement Results 48. . . . . . . . . . . . . . . . . . . . . . . . .
Working with Frames 75. . . . . . . . . . . . . . . . . . . . . . . . . . . . . . . .
Configuring Filters 83. . . . . . . . . . . . . . . . . . . . . . . . . . . . . . . . . . .
Configuring Triggers 95. . . . . . . . . . . . . . . . . . . . . . . . . . . . . . . . .
Assigning Protocol Stacks 109. . . . . . . . . . . . . . . . . . . . . . . . . . . . .
Delayed Evaluation of Data by Recording 117. . . . . . . . . . . . . . . .
K15 Short Introduction
i
Page 6

Table of Contents
Applications 123. . . . . . . . . . . . . . . . . . . . . . . . . . . . . . . . . . . . . . .
Abis Mon 128. . . . . . . . . . . . . . . . . . . . . . . . . . . . . . . . . . . . . . . . . .
BHCA (Busy Hour Call Attempts) 131. . . . . . . . . . . . . . . . . . . . . .
CallMon 134. . . . . . . . . . . . . . . . . . . . . . . . . . . . . . . . . . . . . . . . . . .
CallTrace (Single and Multi-Interface) – MICT 138. . . . . . . . . . . .
CallTrace / Sequencer 144. . . . . . . . . . . . . . . . . . . . . . . . . . . . . . . .
Count All 150. . . . . . . . . . . . . . . . . . . . . . . . . . . . . . . . . . . . . . . . . .
Decipher 153. . . . . . . . . . . . . . . . . . . . . . . . . . . . . . . . . . . . . . . . . . .
Erlang 159. . . . . . . . . . . . . . . . . . . . . . . . . . . . . . . . . . . . . . . . . . . . .
GPRS MM/SM Statistics 163. . . . . . . . . . . . . . . . . . . . . . . . . . . . . .
GPRS-Gb Analyzer 166. . . . . . . . . . . . . . . . . . . . . . . . . . . . . . . . . .
IP Traffic Analyzer 173. . . . . . . . . . . . . . . . . . . . . . . . . . . . . . . . . .
Iub Monitor 178. . . . . . . . . . . . . . . . . . . . . . . . . . . . . . . . . . . . . . . .
NFN (Nortel Frame Number) 186. . . . . . . . . . . . . . . . . . . . . . . . . .
PCR (Preventive Cyclic Retransmission) 188. . . . . . . . . . . . . . . . .
Service Profile Statistics 189. . . . . . . . . . . . . . . . . . . . . . . . . . . . . .
Statistics 194. . . . . . . . . . . . . . . . . . . . . . . . . . . . . . . . . . . . . . . . . . .
TCA (Traffic Channel Analysis) 201. . . . . . . . . . . . . . . . . . . . . . . .
UMTS IuX Statistics 204. . . . . . . . . . . . . . . . . . . . . . . . . . . . . . . . .
IMA Monitoring 208. . . . . . . . . . . . . . . . . . . . . . . . . . . . . . . . . . . .
Tools 217. . . . . . . . . . . . . . . . . . . . . . . . . . . . . . . . . . . . . . . . . . . . . .
PCM Autoconfiguration 219. . . . . . . . . . . . . . . . . . . . . . . . . . . . . .
Iub Autoconfiguration 222. . . . . . . . . . . . . . . . . . . . . . . . . . . . . . .
Traffic Analyzer 226. . . . . . . . . . . . . . . . . . . . . . . . . . . . . . . . . . . . .
Load Meter 231. . . . . . . . . . . . . . . . . . . . . . . . . . . . . . . . . . . . . . . . .
RealChart 233. . . . . . . . . . . . . . . . . . . . . . . . . . . . . . . . . . . . . . . . . .
Key Manager 236. . . . . . . . . . . . . . . . . . . . . . . . . . . . . . . . . . . . . . .
NTP Configuration Tool 242. . . . . . . . . . . . . . . . . . . . . . . . . . . . . .
Record File Merger 248. . . . . . . . . . . . . . . . . . . . . . . . . . . . . . . . . .
Record File Converter 250. . . . . . . . . . . . . . . . . . . . . . . . . . . . . . . .
FSN Test 252. . . . . . . . . . . . . . . . . . . . . . . . . . . . . . . . . . . . . . . . . . .
CDR Viewer 254. . . . . . . . . . . . . . . . . . . . . . . . . . . . . . . . . . . . . . . .
Rf5 File Mutator 257. . . . . . . . . . . . . . . . . . . . . . . . . . . . . . . . . . . .
IP2Hex2IP 260. . . . . . . . . . . . . . . . . . . . . . . . . . . . . . . . . . . . . . . . .
Rec2Ascii 262. . . . . . . . . . . . . . . . . . . . . . . . . . . . . . . . . . . . . . . . . .
Configuration Files Packer 264. . . . . . . . . . . . . . . . . . . . . . . . . . . .
ii
K15 Short Introduction
Page 7

Table of Contents
Reference 267. . . . . . . . . . . . . . . . . . . . . . . . . . . . . . . . . . . . . . . . .
System Information Files (keyfile.txt, .ini, . cfg, .cnf) 267. . . . . . .
Configuration Files 269. . . . . . . . . . . . . . . . . . . . . . . . . . . . . . . . . .
File Structure, File Types, Directories 271. . . . . . . . . . . . . . . . . . .
Toolbars 273. . . . . . . . . . . . . . . . . . . . . . . . . . . . . . . . . . . . . . . . . . .
Menu Bar 275. . . . . . . . . . . . . . . . . . . . . . . . . . . . . . . . . . . . . . . . . .
Shortcut Keys and Buttons 277. . . . . . . . . . . . . . . . . . . . . . . . . . . .
Abbreviations G-1. . . . . . . . . . . . . . . . . . . . . . . . . . . . . . . . . . . . . .
Index Index-1. . . . . . . . . . . . . . . . . . . . . . . . . . . . . . . . . . . . . . . . . . . . .
K15 Short Introduction
iii
Page 8

Table of Contents
iv
K15 Short Introduction
Page 9

List of Figures
Figure 1: Configuration flow chart 4. . . . . . . . . . . . . . . . . . . .
Figure 2: Status Window 5. . . . . . . . . . . . . . . . . . . . . . . . . . . . .
Figure 3: Select Startup Option dialog box 6. . . . . . . . . . . . . .
Figure 4: Data Flow Window with K15 default
configuration 8. . . . . . . . . . . . . . . . . . . . . . . . . . . . . . . . . . . .
Figure 5: Cards Overview window 9. . . . . . . . . . . . . . . . . . . .
Figure 6: Port Setup dialog box 10. . . . . . . . . . . . . . . . . . . . . . .
Figure 7: Measurement Scenarios window 13. . . . . . . . . . . . . .
Figure 8: Pipeline buttons 14. . . . . . . . . . . . . . . . . . . . . . . . . . . .
Figure 9: Logical Link Setup dialog box 17. . . . . . . . . . . . . . . .
Figure 10: Dialog box to open Playback Recording Files 19. .
Figure 11: Recording Playback Configuration dialog box 20.
Figure 12: Dialog box to open View Recording Files 21. . . . . .
Figure 13: Recording Viewer Configuration dialog box 22. . .
Figure 14: Capture RAM Configuration dialog box 26. . . . . .
Figure 15: Dialog box to open Write Recording Files 30. . . . .
Figure 16: Recording Write Configuration dialog box 31. . . .
Figure 17: Online Recording measurement scenario 39. . . . . .
Figure 18: Online Monitoring measurement scenario 40. . . . .
Figure 19: Recording Viewer measurement scenario 41. . . . .
Figure 20: Online Statistics measurement scenario 42. . . . . . .
Figure 21: Offline Recording measurement scenario 43. . . . .
Figure 22: Offline Monitoring measurement scenario 44. . . . .
Figure 23: Offline Statistics measurement scenario 45. . . . . . .
Figure 24: Monitor window 48. . . . . . . . . . . . . . . . . . . . . . . . . .
Figure 25: Column configuration for short view 51. . . . . . . . .
K15 Short Introduction
v
Page 10

List of Figures
Figure 26: Display Level window 52. . . . . . . . . . . . . . . . . . . . . .
Figure 27: Monitor Setup dialog box, Color tab 53. . . . . . . . .
Figure 28: Search Text Setup dialog box 60. . . . . . . . . . . . . . . .
Figure 29: Zoom dialog box 63. . . . . . . . . . . . . . . . . . . . . . . . . .
Figure 30: Monitor status bar 65. . . . . . . . . . . . . . . . . . . . . . . .
Figure 31: Save As dialog box 67. . . . . . . . . . . . . . . . . . . . . . . . .
Figure 32: Print dialog box 69. . . . . . . . . . . . . . . . . . . . . . . . . . .
Figure 33: Filter Setup dialog box for Filters 84. . . . . . . . . . . .
Figure 34: Trigger Configuration dialog box 96. . . . . . . . . . . .
Figure 35: Filter Setup dialog box for Triggers 97. . . . . . . . . .
Figure 36: Select Capture RAM for trigger 99. . . . . . . . . . . . .
Figure 37: Prolog Epilog trigger 102. . . . . . . . . . . . . . . . . . . . . .
Figure 38: Protocol Stack Editor 110. . . . . . . . . . . . . . . . . . . . . .
Figure 39: Online Recording measurement scenario 117. . . . . .
Figure 40: Recording Write Configuration dialog box 118. . . .
Figure 41: Recording Viewer measurement scenario 120. . . . .
Figure 42: Recording Viewer Configuration dialog box 121. . .
Figure 43: Load / Unload Application Programs dialog box 125
Figure 44: AbisMon dialog box 129. . . . . . . . . . . . . . . . . . . . . . .
Figure 45: AbisMon results 130. . . . . . . . . . . . . . . . . . . . . . . . . . .
Figure 46: BHCA dialog box 132. . . . . . . . . . . . . . . . . . . . . . . . .
Figure 47: CallMon dialog box 135. . . . . . . . . . . . . . . . . . . . . . . .
Figure 48: CallMon release causes 136. . . . . . . . . . . . . . . . . . . . .
Figure 49: Scenario Configuration dialog box 139. . . . . . . . . . .
Figure 50: Link Assignment dialog box 140. . . . . . . . . . . . . . . . .
Figure 51: Configuration dialog box 141. . . . . . . . . . . . . . . . . . .
Figure 52: Status dialog box 142. . . . . . . . . . . . . . . . . . . . . . . . . .
Figure 53: MSC Diagram dialog box 143. . . . . . . . . . . . . . . . . . .
Figure 54: CallTr/Seq dialog box 145. . . . . . . . . . . . . . . . . . . . . .
vi
K15 Short Introduction
Page 11

List of Figures
Figure 55: CallTr/Seq Iu Interface - Parameters Tab 146. . . . .
Figure 56: CallTr/Seq Iu Interface - Cause Value Tab 147. . . . .
Figure 57: CallTr/Seq Iu Interface - Message Options tab 148.
Figure 58: Count All dialog box 151. . . . . . . . . . . . . . . . . . . . . . .
Figure 59: Deciphering on the Gb interface 153. . . . . . . . . . . . .
Figure 60: Decipher configuration with two pipelines 154. . . . .
Figure 61: Decipher dialog box 155. . . . . . . . . . . . . . . . . . . . . . .
Figure 62: Timer Conditions tab 157. . . . . . . . . . . . . . . . . . . . . .
Figure 63: Status pane of the Decipher dialog box 158. . . . . . . .
Figure 64: Erlang dialog box 160. . . . . . . . . . . . . . . . . . . . . . . . .
Figure 65: GPRS MM/SM Statistics dialog box 163. . . . . . . . . .
Figure 66: Evaluating a GPRS MM/SM application 165. . . . . .
Figure 67: GPRS-Gb Analyzer main window 167. . . . . . . . . . . .
Figure 68: Start dialog box 168. . . . . . . . . . . . . . . . . . . . . . . . . . .
Figure 69: Loaded GPRS Gb Analyzer 168. . . . . . . . . . . . . . . . .
Figure 70: GPRS-Gb Analyzer, Filter settings dialog box 169. .
Figure 71: GPRS-Gb Analyzer, Detail view 170. . . . . . . . . . . . .
Figure 72: GPRS-Gb Analyzer, Analysis window 171. . . . . . . .
Figure 73: GPRS-Gb Analyzer, Statistics File Option
dialog box 172. . . . . . . . . . . . . . . . . . . . . . . . . . . . . . . . . . . . . .
Figure 74: IP Traffic Analyzer dialog box 174. . . . . . . . . . . . . .
Figure 75: Configure dialog box 176. . . . . . . . . . . . . . . . . . . . . . .
Figure 76: Logical link setup for Iub Monitor 179. . . . . . . . . . .
Figure 77: Logical Link Setup dialog box 180. . . . . . . . . . . . . . .
Figure 78: Advanced LL Settings dialog box 181. . . . . . . . . . . .
Figure 79: Edit Frame Processing Parameters for
IUB Interface dialog box 182. . . . . . . . . . . . . . . . . . . . . . . . . .
Figure 80: Iub Monitor dialog box, Common Config tab 183. .
Figure 81: Iub Monitor dialog box, Link Assignment tab 184. .
K15 Short Introduction
vii
Page 12

List of Figures
Figure 82: NFN dialog box 187. . . . . . . . . . . . . . . . . . . . . . . . . . .
Figure 83: PCR dialog box 188. . . . . . . . . . . . . . . . . . . . . . . . . . .
Figure 84: Service Profile Statistics dialog box 190. . . . . . . . . .
Figure 85: Service Profile Output Configuration dialog box 191
Figure 86: Statistics window with Default Configuration
Figure 87: Edit a new counter dialog box 196. . . . . . . . . . . . . . .
Figure 88: Statistics window with Groups 197. . . . . . . . . . . . . . .
Figure 89: Possible output format of the Statistics
Figure 90: TCA dialog box 201. . . . . . . . . . . . . . . . . . . . . . . . . . .
Figure 91: UMTS IuX Statistics dialog box 205. . . . . . . . . . . . .
Figure 92: Possible output format of the UMTS IuX Statistics
Figure 93: IMA Monitoring structure with protocol layers 208
Figure 94: Ports setup for IMA Monitoring 211. . . . . . . . . . . . .
Figure 95: IMA Port parameter settings 212. . . . . . . . . . . . . . . .
Figure 96: IMA Pool member settings 213. . . . . . . . . . . . . . . . . .
Figure 97: Logical link setup for IMA Monitoring 214. . . . . . .
Figure 98: IMA Monitoring Pool part of the Ports Setup
Figure 99: PCM Autoconfiguration Wizard, page 1 220. . . . . .
Figure 100: Iub Autoconfiguration Wizard 223. . . . . . . . . . . . .
Figure 101: Autoconfiguration Process Results dialog box 224.
Figure 102: Traffic Analyzer window for ATM traffic 226. . . .
Figure 103: Traffic Analyzer window for PCM traffic 228. . . .
Figure 104: ATM and PCM Scanner Settings dialog box 230. .
Figure 105: Load Meter window 231. . . . . . . . . . . . . . . . . . . . . .
Figure 106: Real Chart diagram types 233. . . . . . . . . . . . . . . . .
Figure 107: RealChart window 234. . . . . . . . . . . . . . . . . . . . . . .
dialog box 195. . . . . . . . . . . . . . . . . . . . . . . . . . . . . . . . . . . . . .
application 199. . . . . . . . . . . . . . . . . . . . . . . . . . . . . . . . . . . . . .
application 207. . . . . . . . . . . . . . . . . . . . . . . . . . . . . . . . . . . . . .
dialog box 215. . . . . . . . . . . . . . . . . . . . . . . . . . . . . . . . . . . . . .
viii
K15 Short Introduction
Page 13

List of Figures
Figure 108: Key Manager dialog box 236. . . . . . . . . . . . . . . . . .
Figure 109: Date and Time Properties dialog box 242. . . . . . . .
Figure 110: Network Time Protocol - Service Configuration
dialog box 244. . . . . . . . . . . . . . . . . . . . . . . . . . . . . . . . . . . . . .
Figure 111: User defined Time Servers dialog box 245. . . . . . . .
Figure 112: New Server dialog box 245. . . . . . . . . . . . . . . . . . . .
Figure 113: Recordfile Merger dialog box 248. . . . . . . . . . . . . .
Figure 114: RecFileConverter dialog box 250. . . . . . . . . . . . . . .
Figure 115: FSN dialog box 252. . . . . . . . . . . . . . . . . . . . . . . . . . .
Figure 116: FSN test results 253. . . . . . . . . . . . . . . . . . . . . . . . . .
Figure 117: CDR Viewer dialog box 255. . . . . . . . . . . . . . . . . . .
Figure 118: File Mutator dialog box 257. . . . . . . . . . . . . . . . . . .
Figure 119: Configure dialog box 258. . . . . . . . . . . . . . . . . . . . . .
Figure 120: Mask Configuration dialog box 259. . . . . . . . . . . . .
Figure 121: IP2Hex2IP dialog box 260. . . . . . . . . . . . . . . . . . . . .
Figure 122: IP2Hex2IP results 260. . . . . . . . . . . . . . . . . . . . . . . .
Figure 123: Recording File Export wizard 262. . . . . . . . . . . . . .
Figure 124: Configuration Files Packer dialog box 264. . . . . . .
K15 Short Introduction
ix
Page 14

List of Figures
x
K15 Short Introduction
Page 15

List of Tables
Table 1: Saved Settings in Setup Files 33. . . . . . . . . . . . . . . . . .
Table 2: K15 Applications 123. . . . . . . . . . . . . . . . . . . . . . . . . . .
Table 3: K15 Tools 217. . . . . . . . . . . . . . . . . . . . . . . . . . . . . . . . .
Table 4: File Extensions 271. . . . . . . . . . . . . . . . . . . . . . . . . . . . .
Table 5: Command Buttons 273. . . . . . . . . . . . . . . . . . . . . . . . . .
Table 6: Protocol Stack Editor 274. . . . . . . . . . . . . . . . . . . . . . .
Table 7: Standard Main Menu 275. . . . . . . . . . . . . . . . . . . . . . .
Table 8: Additional Menus of the Program Modules 275. . . . .
Table 9: Programs and Windows 277. . . . . . . . . . . . . . . . . . . . .
Table 10: Menus 277. . . . . . . . . . . . . . . . . . . . . . . . . . . . . . . . . . .
Table 11: Processing Elements 278. . . . . . . . . . . . . . . . . . . . . . . .
Table 12: Directory Trees 278. . . . . . . . . . . . . . . . . . . . . . . . . . . .
Table 13: Dialogs 278. . . . . . . . . . . . . . . . . . . . . . . . . . . . . . . . . . .
Table 14: Lists 279. . . . . . . . . . . . . . . . . . . . . . . . . . . . . . . . . . . . .
Table 15: List Boxes 279. . . . . . . . . . . . . . . . . . . . . . . . . . . . . . . .
K15 Short Introduction
xi
Page 16

List of Tables
xii
K15 Short Introduction
Page 17

General Safety Summary
Review the following safety precautions to avoid injury and prevent
damage to this product or any products connected to it. To avoid potential
hazards, use this product only as specified.
Only qualified service personnel should perform service procedures.
While using this product, you may need to access other parts of the
system. Read the General Safety Summary in other system manuals for
warnings and cautions related to operating the system.
To Avoid Fire or Personal Injury
Use Proper Power Cord. Use only the power cord specified for this product
and certified for the country of use.
Use Proper Line Cords. Use only the telecommunication line cords designed
and specified for the K15.
Use No. 26 AWG or larger cords as TNV-1 Connections. The telephone line cord
is to be disconnected before accessing inside the equipment. Caution: To
reduce the risk of fire, use only No. 26 AWG or larger telecommunications
line cords.
Connect and Disconnect Properly. Do not connect or disconnect probes or test
leads while they are connected to a voltage source.
Ground the Product. This product is grounded through the grounding
conductor of the power cord. To avoid electric shock, the grounding
conductor must be connected to earth ground. Before making connections
to the input or output terminals of the product, ensure that the product is
properly grounded.
Use Proper AC Adapter. To use the GPS option, use only the AC adapter
specified for this product.
Do Not Operate Without Covers. Do not operate this product with covers or
panels removed.
Do Not Operate With Open Slots. To avoid contamination and damage, always
protect free slots with the blue plastic air baffles inside the unit and with
blank panels on top of the unused slots.
K15 Short Introduction
xiii
Page 18

General Safety Summary
Use Proper Fuse. Use only the fuse type and rating specified for this
product.
Observe All Terminal Ratings. To avoid fire or shock hazard, observe all
ratings and markings on the product. Consult the product manual for
further ratings information before making connections to the product.
The common terminal is at ground potential. Do not connect the common
terminal to elevated voltages.
With some interfaces only voltages corresponding to the default of the
relevant connector are applied at the measuring sockets. However, high
voltages from the line may occur at some of the measuring sockets. These
measuring sockets are protected against accidental contact and are
specially labeled.
Do Not Look into the End of a Fiberglass Cable. Never look into the end of a
fiberglass cable or a single fiber which could be connected to a laser
source. Laser radiation can damage your eyes because it is invisible and
your pupils do not contract instinctively as with normal bright light. If you
think your eyes have been exposed to laser radiation, you should have your
eyes checked immediately by an eye doctor. The optical output’s radiation
power in our system corresponds to the laser class 1 in accordance with
IEC 60825-1:1993/A2:2001.
xiv
Avoid Exposed Circuitry. Do not touch exposed connections and components
when power is present.
Do Not Operate With Suspected Failures. If you suspect there is damage to this
product, have it inspected by qualified service personnel.
Do Not Operate in Wet/Damp Conditions.
Do Not Operate in an Explosive Atmosphere.
Keep Product Surfaces Clean and Dry.
Provide Proper Ventilation.
Refer to the manual’s installation instructions for
details on installing the product so it has proper ventilation.
Use Proper Batteries. To avoid the risk of explosion, replace battery only
with the same type and rating.
Dispose Used Batteries Properly. Used batteries must be recycled according
to local regulations.
K15 Short Introduction
Page 19

General Safety Summary
Certifications and Compliances
Consult the product specifications in the Appendix LEERER MERKER for
certifications and compliances.
K15 Short Introduction
xv
Page 20

General Safety Summary
Safety Terms and Symbols
Terms in This Manual. These terms may appear in this manual:
WARNING. Warning statements identify conditions or practices that could
result in injury or loss of life.
CAUTION. Caution statements identify conditions or practices that could
result in damage to this product or other property.
xvi
K15 Short Introduction
Page 21

General Safety Summary
Terms on the Product. These terms may appear on the product:
DANGER indicates an injury hazard immediately accessible as you read
the marking.
WARNING indicates an injury hazard not immediately accessible as you
read the marking.
CAUTION indicates a hazard to property including the product.
Symbols on the Product. These symbols may appear on the product:
Laser Klasse 1
WARNING
High Voltage
Protective Ground
(Earth) Terminal
Double
Insulated
WARNING
Laser Output
Laser Class 1
Electrostatically
Hazardous
WARNING
Laser Output
End of a Fiber-
glass Cable
CAUTION
Refer to Manual
K15 Short Introduction
xvii
Page 22

General Safety Summary
xviii
K15 Short Introduction
Page 23

Service Safety Summary
Only qualified service personnel should perform service procedures. Read
this Service Safety Summary and the General Safety Summary before
performing any service procedures.
Do Not Service Alone. Do not perform internal service or adjustments of this
product unless another person capable of rendering first aid and resuscitation is present.
Disconnect Power. To avoid electric shock, switch off the instrument power,
then disconnect the power cord from the mains power.
Use Care When Servicing with Power On. Dangerous voltages or currents may
exist in this product. Disconnect power, remove battery (if applicable), and
disconnect test leads before removing protective panels, soldering, or
replacing components.
To avoid electric shock, do not touch exposed connections.
K15 Short Introduction
xix
Page 24

Service Safety Summary
xx
K15 Short Introduction
Page 25

Precautions
In order to guarantee correct functionality and to protect the K15 from
damage, the following precautions should be taken.
Do Not Change the Pre-Configuration of the Device. The risk of changes
(software developments or expansions) which the customer undertakes
is carried by the customer. Regarding this Tektronix assumes no
responsibility.
NOTE. The K15 Protocol Tester is supported by Tektronix only. Microsoft
Support Services do not support this device.
Implement Enhanced Security Measures for Network Operation. If you apply the
protocol tester within a network or by way of a modem, then implement
further and enhanced security measures.
H Access via an individual LAN
If you operate your Protocol Testers within an individual LAN network,
then protect this network against access from other PCs.
H Access via a company-wide Intranet
If you operate your Protocol Testers within an Intranet, then implement
an extended user administration and employ up-to-date virus scanners
and firewalls.
H Access via Internet or modem
If you want to access your Protocol Tester via the Internet, implement
the same security measures as in Intranets (see above). You can also
implement additional security measures with the help of virtual private
networks (VPNs).
K15 Short Introduction
xxi
Page 26

Precautions
To implement additional security measures, contact your local system
administrator or the Tektronix service center.
CAUTION. The implementation of extended security measures is your sole
responsibility. It is realized at customer’s own risk and without liability to
Tektronix.
You should implement these measures especially while applying the
Remote Desktop software or when transferring files via a network.
xxii
K15 Short Introduction
Page 27

Preface
This manual contains operating information for the K15 Protocol Tester. It
provides a functional overview for those of you who are new to using the
K15.
To work with the K15, you should have the following qualifications:
H Knowledge of the measurement application field as well as experience
H Familiarity with signaling protocols
H Knowledge of PC and Windows XP Embedded (XPe)
H Familiarity with the safety requirements for electrical equipment for
H Completion of a K15 training course
NOTE. The participation in a K15 training course is recommended.
Information on training courses is available from your local sales partner
or via the support unit.
with communications test applications
measurement, control and laboratory use
K15 Short Introduction
xxiii
Page 28

Preface
About This Manual
This manual is divided into the following sections:
H The Safety Summaries and Precaution are the most important parts of
the manual. You should read them before you start working with the
equipment and you should always follow these instructions.
H Preface provides an overview of this manual.
H Configuration describes which settings you must configure in order to
run a measurement scenario.
H K15 Measurement describes how to select a type of measurement, how
to start it, how to view, filter, and trigger data, and how to evaluate data
by recording.
H Applications describes how to run further evaluation programs to
interpret data (applications or statistics).
H Tools describes how to use other supplementary programs simulta-
neously with the main application.
H Reference comprises an encyclopedia of topics that describe the K15
software and give background and basic information on it.
xxiv
H Abbreviations provides explanations of unique or uncommon
abbreviations related to the K15 measurements.
H Index provides page number references to topics in alphabetical order.
NOTE. More detailed information about each of the sections contained in
these chapters can be found in the K15 Online Help.
K15 Short Introduction
Page 29

Conventions
The following text styles and markings have specific meaning in this
manual:
Text style Description
in italics Italics fonts indicate menus and menu functions as well
<Key>
Bold Bold fonts indicate buttons of the Graphical User
Preface
as commands, parameters and examples.
Keys or key sequences are in angle brackets.
Interface.
K15 Short Introduction
xxv
Page 30

Preface
Related Manuals and Online Documentation
This manual is part of a document set of standard-accessory manuals and
online documentation. See the following list for other documents
supporting the K15 Protocol Tester:
H The User Manual K15 Protocol Tester provides all user-relevant
product information. It assists you when setting up and starting the
protocol tester for the first time. This user manual is available in
printed version and as a PDF online manual in the \hlp directory.
H A context sensitive online help system is the K15 reference documenta-
tion for the graphical user interface. To open the Help window, press
<F1> from within a K15 application window.
H The Release Notes are delivered separately and contain the latest
information on the current software version (readme.txt).
H Microsoft Windows XPe is described in the Windows XPe online help:
Click in the taskbar on Start: Help and Support.
Help and Support is your comprehensive resource for information and
tools. Use Search, Index, or the Table of Contents to gain access to the
extensive Online Help system.
xxvi
K15 Short Introduction
Page 31

Service and Support
When you purchase a Tektronix product, Tektronix provides support to
complete your solution. Technical support experts offer application-specific solutions and worldwide flexible support services, including on-site
support, are designed to ensure that your instruments operate at peak
performance. You will receive a timely response when you need it, where
you need it.
NOTE. Microsoft Support Services cannot be used for the Windows XPe
installation. The K15 Protocol Tester is supported by Tektronix only.
Preface
K15 Short Introduction
xxvii
Page 32

Preface
Contacting Tektronix
Address
Web site
Technical
support
Tektronix Berlin
Wernerwerkdamm 5
13629 Berlin
GERMANY
www.tektronix.com
For hotline service support, call:
+4930-386-22200 (8:00 a.m. – 6:00 p.m. GMT + 01:00)
or
1-800-833-9200 (This phone number is toll free in North
America. After office hours, please leave a voice mail
message. Outside North America, contact a Tektronix
sales office or distributor; see the Tektronix web site for a
list of offices.)
Or fax:
+4930-386-22546
Or contact us by e-mail:
mpt.hotline@tek.com
xxviii
K15 Short Introduction
Page 33

Configuration
To run a measurement, you must configure hardware and software
according to your desired measurement scenario.
Before you configure a measurement scenario, set up the device, install the
measuring modules and switch on the device (see the Getting Started
chapter in the K15 User Manual).
The easiest way to configure a measurement scenario is to start the
autoconfiguration. The autoconfiguration configures measurement
scenarios for specific traffic types automatically.
To configure the K15 manually, you must load an existing or the default
configuration, which contains all available online and offline measurement
scenarios. Then you can adapt these scenarios to your specific needs.
K15 Short Introduction
1
Page 34

Configuration
The configuration settings are made in the Data Flow window in the Cards
Overview and Measurement Scenarios tabs.
The Cards Overview and Measurement Scenarios windows consist of two
panes illustrating your settings:
H The left panes, Tester Overview and List of Scenarios, provide an
H The right panes, Cards Overview and Measurement Scenarios, contain
The file name of the current configuration is always visible in the title bar
of the Data Flow window. If the configuration is not stored in a file, the
title bar displays the word <UNTITLED>.
overview and indicate the status of the configuration. The relationships
between interface modules, data sources and measurement tasks are
depicted as tree structures.
a graphical representation of the configuration (interface modules or
pipelines).
The Measurement Scenarios tab of the Data Flow window displays the
current configured measurement scenarios and sources. This tab keeps
you informed about the currently active parameter settings and system
state at all times. The grey boxes in the pipelines represent pipeline
elements. The connecting lines indicate the data flow between those
elements.
Whenever the protocol tester is running, one configuration is always
active.
2
K15 Short Introduction
Page 35

Configuration
After configuring your desired measurement scenario, you can save
configurations in setup (.s) files, which can be reloaded at any time. Thus,
you can use a given scenario repeatedly without having to specify
configuration parameters each time.
Configurations provide the following advantages:
H You can save predefined measurement configurations for use at a later
point in time.
H If a long-term measurement is interrupted due to a power failure, the
program loads the last used configuration and then continues the
interrupted measurement (Auto-Restart). If you have loaded a
configuration and changed it, it is important to save this configuration.
Otherwise the protocol tester will not apply your changes during
automatic start up.
K15 Short Introduction
3
Page 36

Configuration
The following flow chart shows the steps to be taken in preparing a
measurement:
Switching on the K15 Protocol Tester
Configuration
Autoconfiguration
Creating Measurement Scenarios
Configuring Processing Elements
Figure 1: Configuration flow chart
Manual Configuration
Configuring Hardware
Configuring Sources
Online Offline
Saving Configuration
Starting Measurement
4
K15 Short Introduction
Page 37
Switching on the K15 Protocol Tester
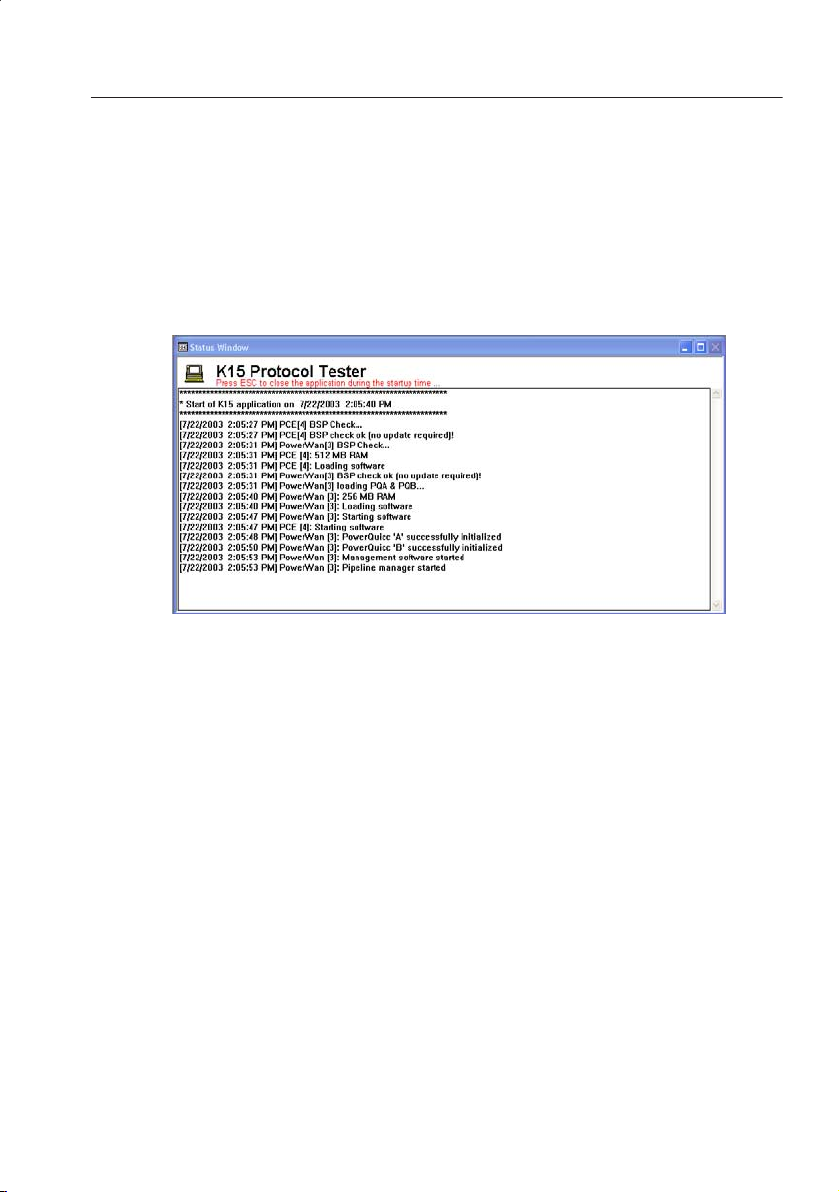
After startup, the K15 Protocol Tester runs various self-tests. The Status
Window opens, indicating the status of the connected interface modules
and the main system.
Configuration
Figure 2: Status Window
K15 Short Introduction
5
Page 38

Configuration
The main program automatically starts and opens a dialog box in which
you can select between loading a user-defined configuration, the default
configuration, the PCM autoconfiguration, or the Iub autoconfiguration.
Figure 3: Select Startup Option dialog box
6
K15 Short Introduction
Page 39

Autoconfiguration
For specific measurements, the K15 configures the measurement scenario
automatically. You only need to connect your K15 to the IUT. The protocol
tester then analyzes the received traffic and configures all parameters
needed to measure the traffic of this connection.
You can use the Autoconfiguration for the following measurements:
H Measurements with signaling in SS#7, LAPD / LAPV, TRAU, ABIS,
and HDLC (PCM Autoconfiguration) using the Power Wan or Power
Wan Light measurement board
H Measurements at the UMTS Iub interface (Iub Autoconfiguration)
using the PCE-2 measurement board
To start an Autoconfiguration, press the Autoconfiguration button in the
Select Startup Option dialog box (see figure 3). An Autoconfiguration
Wizard starts and guides you to your measurement scenario.
A detailed description of the Autoconfiguration you will find in chapter
Tools on page 222.
Configuration
K15 Short Introduction
7
Page 40

Configuration
Manual Configuration
To configure your K15 manually, load an existing system configuration in
the Select Startup Option dialog box (see figure 3) or press the Default
button.
The Data Flow window opens displaying the selected configuration. The
following pages describe how you can adapt these configurations to your
specific needs.
Measurement Scenarios tab
Figure 4: Data Flow Window with K15 default configuration
8
K15 Short Introduction
Page 41

Configuring Hardware
Hardware is configured in the Cards Overview window. Open this window
by clicking the Cards Overview tab of the Data Flow window.
The Cards Overview window provides an overview of the connected
measurement boards. Here you can define the settings for the ports of the
measurement boards or change the settings of an existing configuration.
Configuration
Cards Overview tab
Figure 5: Cards Overview window
The Tester Overview pane on the left shows a list of measuring boards
and ports.
The Cards Overview pane on the right graphically displays the individual
boards with their ports. This overview also indicates the state of statusLEDs. This enables the control of the interfaces’ states even if the protocol
tester is controlled remotely.
K15 Short Introduction
9
Page 42
Configuration
To configure the hardware settings, proceed as follows:
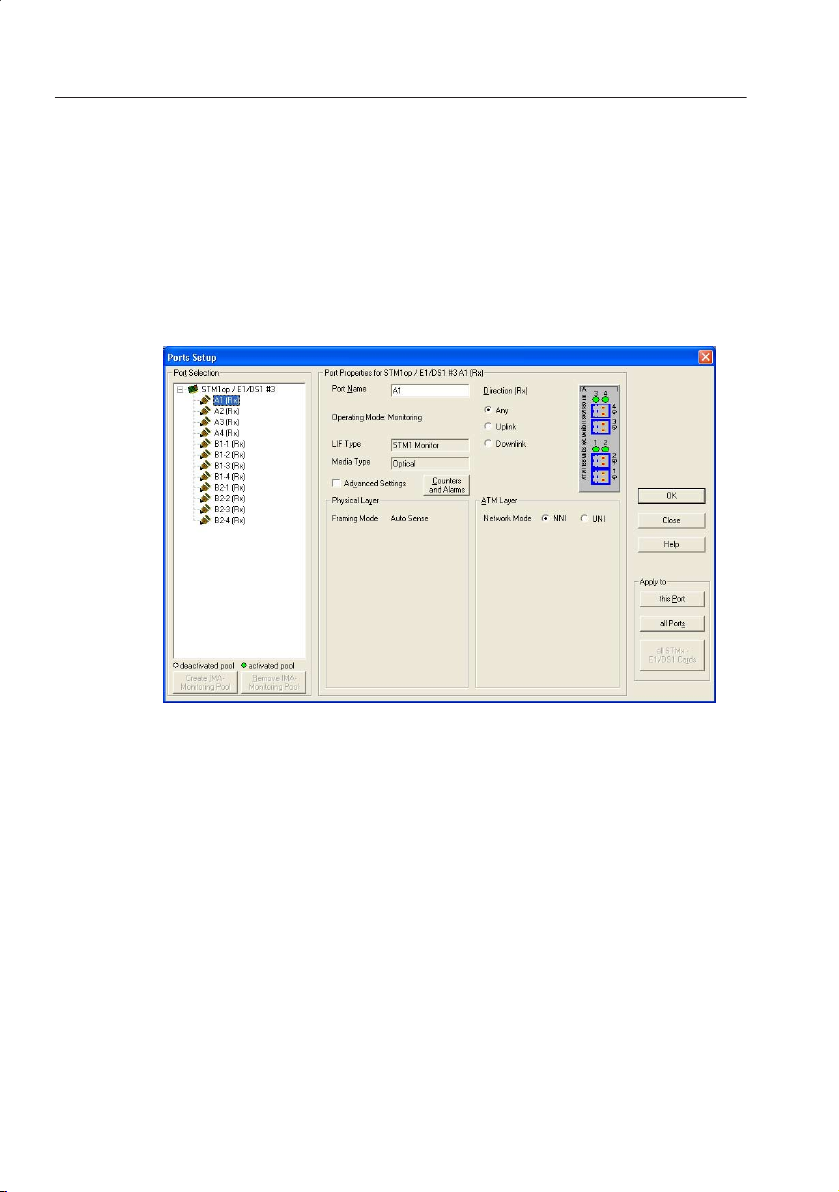
1. In the Cards Overview pane, click the Ports Setup... command or a
socket on the board to enter the Ports Setup dialog box.
The following figure shows a port configuration example for a PCE-2
board with STM-1 line interfaces:
10
Figure 6: Port Setup dialog box
2. Configure the individual ports in this dialog box or change the existing
settings.
The default values in the Ports Setup dialog box match the imprint on
the interface.
K15 Short Introduction
Page 43

Configuration
3. Confirm your settings with OK.
Now, that the ports are set up, the K15 has stored the characteristics of
the signaling traffic.
NOTE. With the Traffic Analyzer tool you can see how much traffic is on
the connected lines before starting any measurement. See Tools on
page 226.
K15 Short Introduction
11
Page 44

Configuration
Creating Measurement Scenarios
After startup and configuring the hardware, you must configure the
software. To configure the K15 measurement software you must first set
up a suitable measurement scenario.
In the K15 program, a measurement scenario is represented as a pipeline
of processing elements. Processing elements are all measurement modules
that are required for a measurement scenario.
You can adapt predefined scenarios to your individual measurement task
by configuring the processing elements in these scenarios.
12
K15 Short Introduction
Page 45
Configuration
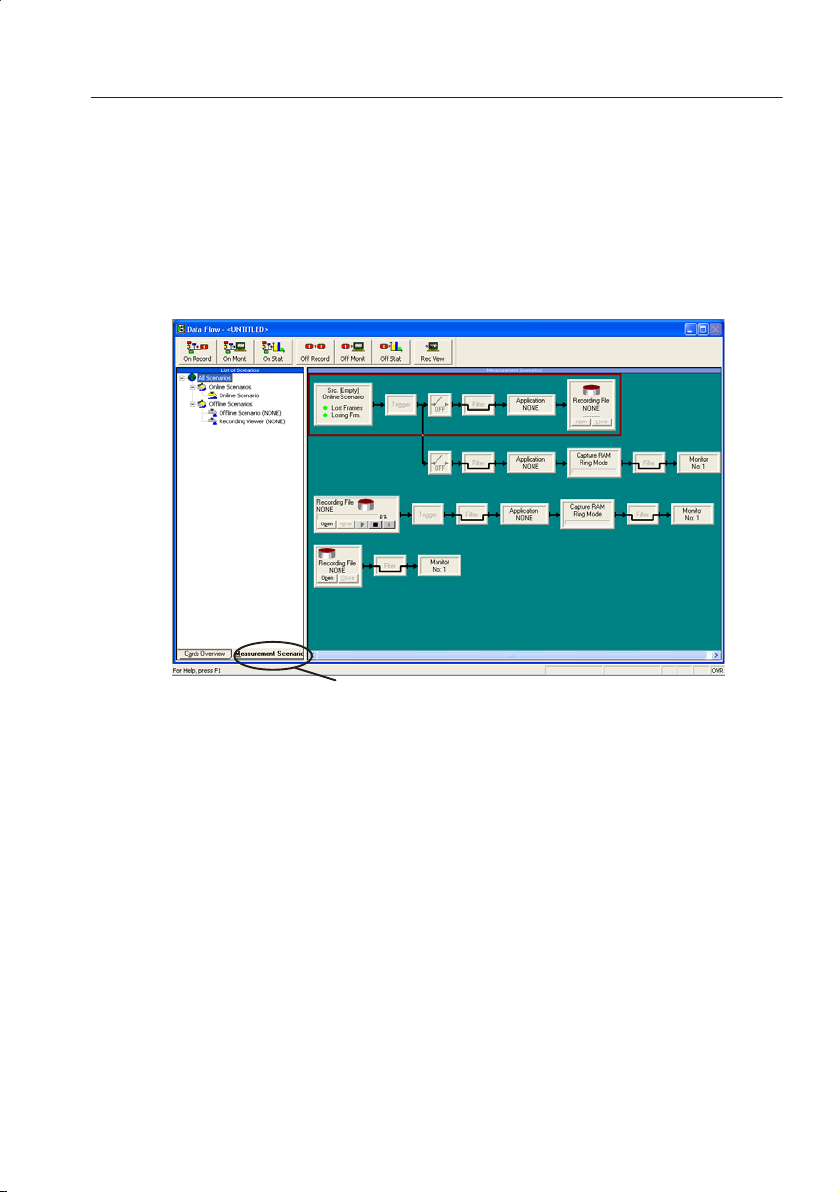
Scenarios are created in the Measurement Scenarios window. Open this
window by clicking the Measurement Scenario tab of the Data Flow
window. The Measurement Scenario window provides an overview of the
existing scenarios. In the default configuration some predefined scenarios
are shown.
Measurement Scenarios tab
Figure 7: Measurement Scenarios window
The List of Scenarios pane on the left shows the names of the existing
scenarios.
The Measurement Scenarios pane on the right graphically displays the
existing scenarios. Depending on which level of the List of Scenarios tree
you have clicked, you will see either individual or all scenarios in the
Measurement Scenarios pane.
K15 Short Introduction
13
Page 46

Configuration
In the Pipeline Selection toolbar, various predefined pipelines are available
for each scenario type (online and offline measurement).
Figure 8: Pipeline buttons
NOTE. The different types of measurement scenarios are described in
Selecting a Type of Measurement on page 38.
Drag & Drop
14
K15 Short Introduction
Page 47

Configuration
To configure a pipeline, proceed as follows:
1. Choose one of the pipeline buttons and drag it into the right window to
create a new scenario or connect it to an existing scenario.
The pipeline is inserted into the Measurement Scenario pane. The List
of Scenarios pane displays an entry for the new scenario.
2. Enter a name for the scenario in the List of Scenarios pane.
3. Configure the source. See Configuring Sources on page 16.
4. After configuring the source, you can configure the processing
elements for your measurement. See Configuring Processing Elements
on page 23.
You can configure several pipeline branches per scenario. For example you
may want to run an online measurement to analyze the received data in the
monitor window and simultaneously write it to a recording file.
The number of pipelines or pipeline branches that can be configured
depends on the available memory space on the interface modules. To avoid
unnecessary usage of the memory, create only the pipeline branches that
are actually required for the measurement. Refer also to the notes in the
Resources help topic.
NOTE. The analysis program Load Meter, which can run simultaneously
with measurements, indicates the memory capacity utilization on the
interface modules. If the Memory field of card 1 indicates that the limit has
been reached, you should remove one or more pipeline branches.
K15 Short Introduction
15
Page 48

Configuration
Configuring Sources
To carry out a measurement with the K15 Protocol Tester, you must define
logical rules for the data flow that is to be measured. Those rules are for
instance the assigned protocol stack and the specified channel decoding
method.
Online Sources. To define logical rules for online measurements, you must
configure the Source processing element, which defines logical links
between the system under test and the protocol tester. Logical links are
signaling links that represent the online data.
To configure a Source, all boards required for the measurement must have
been initialized (check in the Status Window for boot ok); a pipeline must
have been created, and the Data Flow window must be open.
You can combine several logical links in a single source and assign them
to one or more measurement scenarios.
Offline Sources. Offline Sources are based on recording files. The settings
for the logical links of an offline data source (offline scenario, data
display) are saved in the recording file and can be changed to a limited
extent (link names, link colors, protocol stacks).
16
K15 Short Introduction
Page 49

Configuration
Configuring Online Data Sources
An online source consists of a group of logical links. In the pipelines, an
online source is represented by the Source processing element.
Configure sources as follows:
1. Click on the Source (Src) processing element. The Logical Link Setup
dialog box opens. This dialog box looks different depending on the
chosen interface. The following figure shows the Logical Link Setup
dialog box for the STM-1 line interface:
Figure 9: Logical Link Setup dialog box
The selection lists on the left display the scenarios of the current
configuration and the logical links that are assigned to these scenarios.
You can add new links to the scenarios and edit as well as remove
existing links.
K15 Short Introduction
17
Page 50

Configuration
2. Configure the settings of your data source in this dialog box.
3. Confirm your settings with Apply.
After defining one link, you can create more settings until all your
connections are defined.
If you want to create a new logical link with settings identical to an
existing one, select the appropriate logical link in the Logical Links of
Scenario list. Then click New.
NOTE. Most of the settings in the Logical Link Setup dialog box can only
be made if you stop the measurement first. To do this, set the ON/OFF
switch in all pipeline branches of the online scenario to OFF.
NOTE. Detailed information on the individual settings can you find in
the appropriate Help topics.
18
K15 Short Introduction
Page 51

Configuration
Configuring Offline Data Sources
An offline source is based on a recording file. In the pipelines, an online
source is represented by the Playback Recording File or the View
Recording File processing element.
The Playback Recording File processing element (see page 29) allows you
to play back the contents of a specific recording file into the system.
Playback data can be edited and evaluated to the same degree as the data
of an online measurement.
The View Recording File processing element (see page 29) allows you to
open a recording file to view its contents in the offline monitor.
Configuring Playback Recording Files. Configure Playback Recording Files as
follows:
1. Click Open on the Playback Recording File processing element. The
Recording Playback Configuration dialog box opens and an Open
dialog box that displays the standard directory for recording files
\k15\rec or the last-used directory for recording files.
Figure 10: Dialog box to open Playback Recording Files
2. Select the desired file (file extension *.rf5). If you have saved the
recording file in question in a different directory, change directories as
required.
K15 Short Introduction
19
Page 52

Configuration
3. Confirm your selection with Open. The Recording Playback
Configuration dialog box will now list the logical links with the
configuration data (Name, Protocol Stack, Colors) that were set when
the recording file was created.
20
Figure 11: Recording Playback Configuration dialog box
4. If the open file does not contain the desired data, you can choose a
different recording file using the Browse command next to the File
Name field.
5. Select your preferred text and background colors for displaying the
logical links and your desired playback speed Realtime or Frames/min.
K15 Short Introduction
Page 53

Configuration
Configuring View Recording Files. Configure View Recording Files as
follows:
1. Click Open in the Recording File processing element. The Recording
Viewer Configuration dialog box opens and an Open dialog box that
displays the standard directory for recording files \k15\rec or the
last-used directory for recording files.
Figure 12: Dialog box to open View Recording Files
2. Select the desired file (file extension *.rf5). If you have saved the
recording file in question in a different directory, change directories as
required.
K15 Short Introduction
21
Page 54

Configuration
3. Confirm your selection with Open. The Recording Viewer Configura-
tion dialog box will now list the logical links with the configuration
data (Name, Protocol Stack, Colors) that were set when the recording
file was created.
22
Figure 13: Recording Viewer Configuration dialog box
4. If the open file does not contain the desired data, you can choose a
different recording file using the Browse command next to the File
Name field.
5. Select your preferred text and background colors for displaying the
logical links and your desired playback speed Realtime or Frames/min.
K15 Short Introduction
Page 55

Configuring Processing Elements
Each pipeline features all measurement modules required for a measurement as standard. Using these processing elements, you can configure the
parameters for your specific scenario. The following processing elements
are available:
H Source (see page 16)
H Application
H Statistics
H Capture RAM
H Monitor
H Recording File (Write / Playback / View Recording File)
H On/Off Switch
H Filter
H Trigger
Configuration
K15 Short Introduction
23
Page 56

Configuration
Application
K15 features specific applications providing problem-based analyses of
signaling data. They are supplementary applications that you can use, for
example, to start predefined statistical analyses. You can use up to two
applications per Application pipeline-element. These applications are
cascaded, therefore the measurement data is first processed by the position
1 application. These measurement results are then further processed by the
position 2 application.
You can select applications only after configuring the online source or
loading a recording file.
To configure, start, or stop a loaded application, proceed as follows:
1. Click the Application processing element. The Load/Unload Monitor-
2. Select the name of the application you want to switch to and confirm
ing Application Programs dialog box opens.
your selection with OK. The program window of the selected
application is activated.
Configure the application in this program window.
24
NOTE. For further details about the individual applications, refer to the
chapter Applications on page 123 and to the Online Help.
K15 Short Introduction
Page 57

Configuration
Statistics
The Statistics processing element classifies and counts received signaling
data based on adjustable criteria, while the data recording or data playback
functions continue to run in the background. Using additional programs,
you can display the counters managed in the Statistics processing element
in graphical or tabular form and print them, if required.
Before selecting Statistics, you must configure an online source or load a
recording file. If the pipeline contains an Offline Recording branch, you
must also configure a file as data sink.
To call up Statistics, click the Statistics processing element. The Statistics
window opens. Configure the Statistics application in this program
window.
NOTE. For further details, refer to Statistics on page 194 and the
Online Help.
K15 Short Introduction
25
Page 58
Configuration
Capture RAM
The Capture RAM processing element allows you to define the memory
area reserved for buffering signaling data on the interface modules, either
limiting the amount of data or writing received data continuously into the
capture RAM. You can specify criteria for writing data to the capture
RAM in the input filter.
The capture RAM allows you to ”uncouple” the speed of data reception
from the monitor display. You can save the data contained in the capture
RAM in a file and print them.
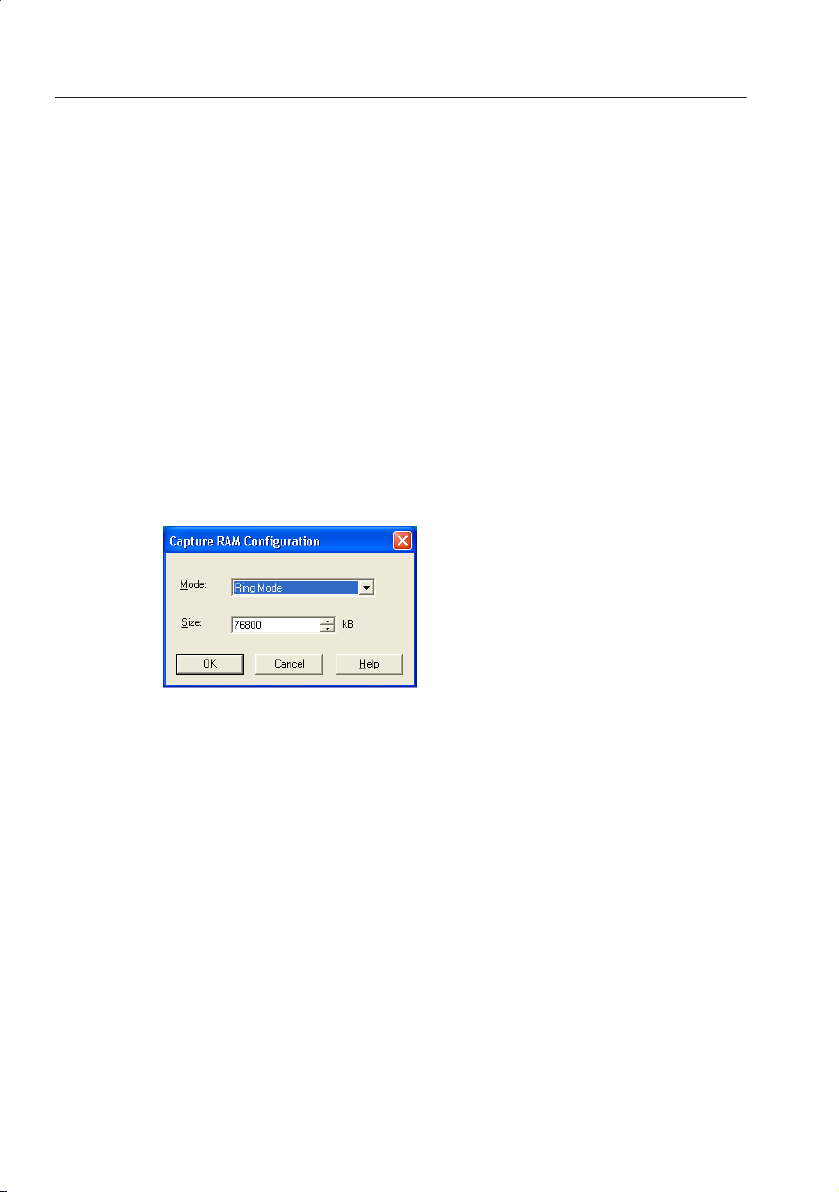
To define the Capture RAM, proceed as follows:
1. Click the processing element Capture RAM. The Capture RAM
Configuration dialog box opens.
26
Figure 14: Capture RAM Configuration dialog box
K15 Short Introduction
Page 59

Configuration
2. In the Mode list, select the mode defining how data will be entered in
the capture RAM:
H Ring Mode: When the capture RAM limit has been reached, data
continues to be added at the beginning of the memory area and
overwrites the oldest data entered. Ring Mode is particularly suited
for long-term measurements that you want to view on the monitor
without interrupting data recording.
H Linear Mode: The protocol tester writes data to capture RAM until
the memory area is full. No more data will be entered. Linear Mode
is suitable for scenarios that you have restricted in advance with
appropriate filter criteria.
3. Enter the size of the memory area in the Size text field. The size of the
capture RAM can be set anywhere between 16 kB and 256MB. It
depends on the memory available on the interface modules. The status
window indicates how much memory space there is for each module.
If you are running several measurements simultaneously and the
capture RAM exceeds a total of 256 MB, the value you entered will be
reduced automatically.
4. Confirm your entries with OK.
K15 Short Introduction
27
Page 60

Configuration
Monitor
The Monitor processing element represents the Monitor main window,
where signaling data are displayed and analyzed based on various criteria.
You can analyze data that were currently received (Online Monitoring) or
recorded data (Offline Monitoring).
To call up the Monitor window, click the Monitor processing element. The
Monitor window opens.
NOTE. For details on how to configure the Monitor window, refer to
Viewing the Measurement Results beginning on page 48 and the
Online Help.
28
K15 Short Introduction
Page 61
Configuration
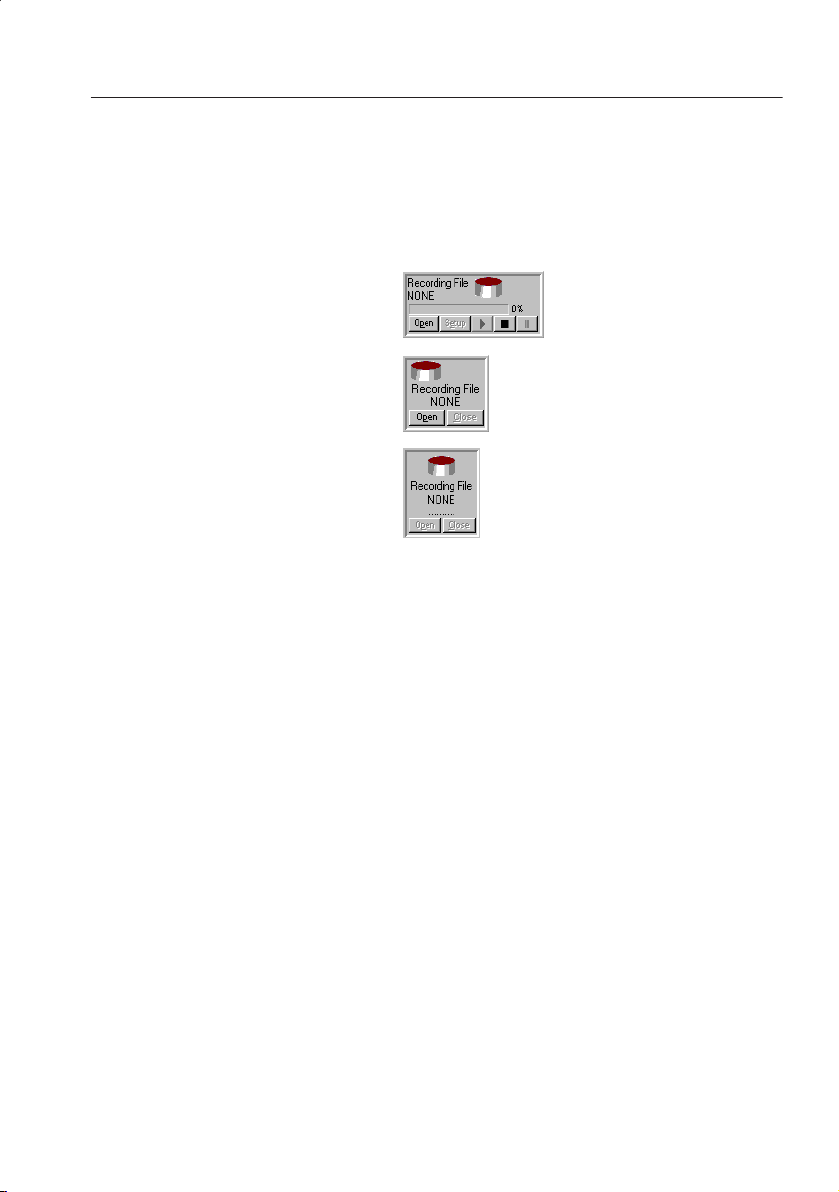
Recording File
There are three types of Recording File processing elements:
Playback Recording File
View Recording File
Write Recording File
Playback Recording File. Use the Recording File processing element to play
back the contents of a specific recording file into a system in offline
measurement tasks. Playback data can be edited and evaluated to the same
degree as the data of an online measurement. To configure the Playback
Recording File processing element, see page 19.
View Recording File. This processing element is part of the Record Viewer
scenario. It allows you to open a recording file to view its contents. To
configure the View Recording File processing element, see page 21.
K15 Short Introduction
29
Page 62
Configuration
Write Recording File. Use the Write Recording File processing element to
define the file and conditions for saving the signaling data received. To
configure the Write Recording File processing element, proceed as
follows:
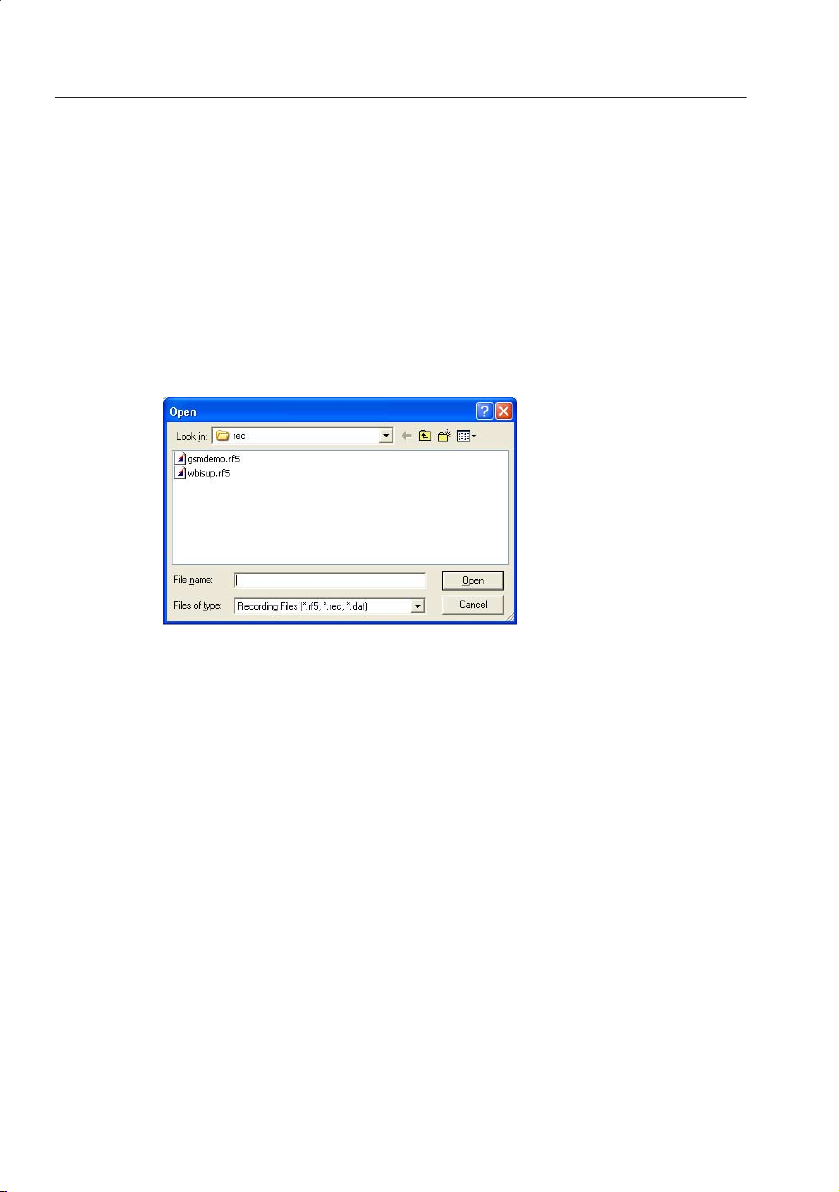
1. On the Write Recording File processing element, click Open. The
Recording Write Configuration dialog box opens and an Open dialog
box that displays the standard directory for recording files \k15\rec or
the last-used directory for recording files.
30
Figure 15: Dialog box to open Write Recording Files
H To create a new Recording File, enter the name of the new
recording file in the File Name field. The file extension *.rf5 is
added automatically. The standard directory is \k15\rec. You can
also choose a different directory.
H To use an existing Recording File, click Browse and select the
desired file in the \k15\rec list.
2. Confirm your settings with Open.
K15 Short Introduction
Page 63
Configuration
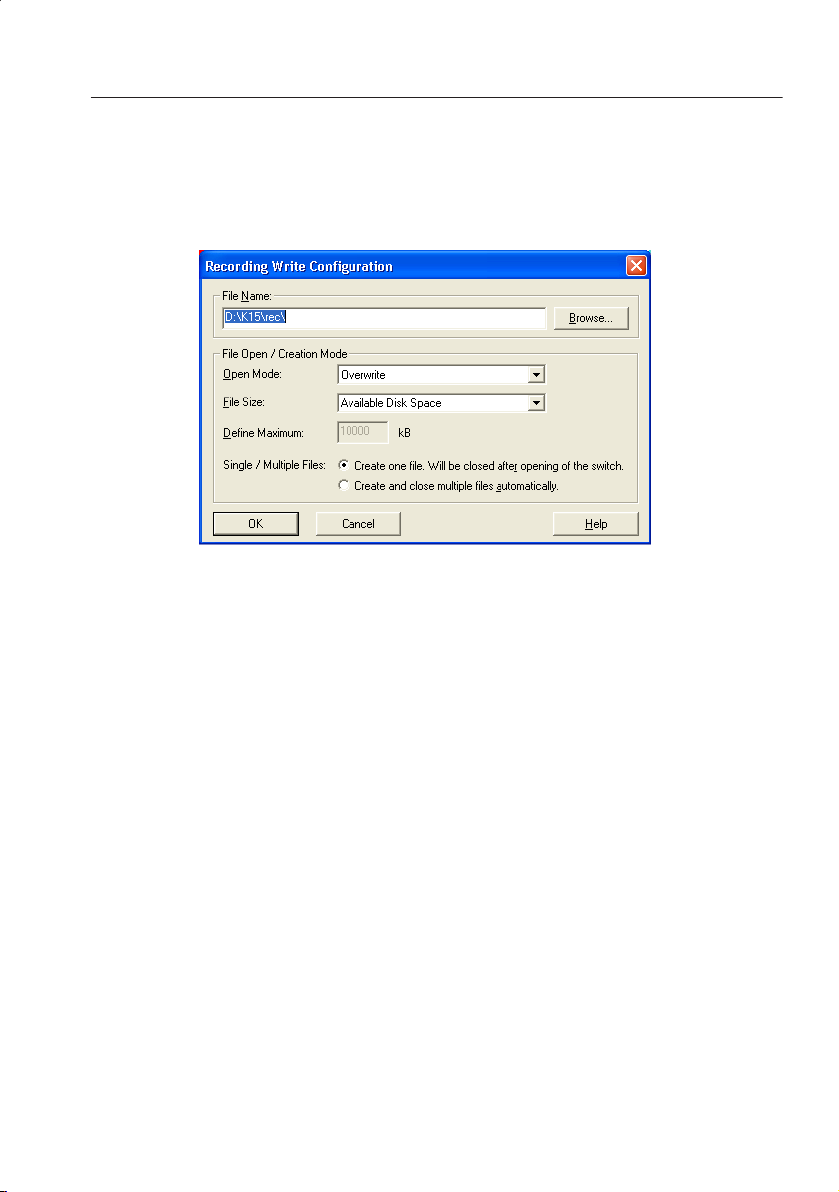
3. Now you can configure some basic settings for writing the selected
recording file in the Recording Write Configuration dialog box.
Figure 16: Recording Write Configuration dialog box
Confirm the settings in this dialog box with OK. The Write Recording
File processing element and the Measurement Scenarios pane now
display the selected file.
K15 Short Introduction
31
Page 64

Configuration
ON/OFF Switch
Use the ON/OFF switch processing element to start, interrupt and
terminate online measurements.
As long as an ON/OFF switch processing element is still activated in a
pipeline, neither a pipeline’s data source nor the configuring pipelines
settings can be changed. In this case, you will be informed by an onscreen
message.
Filter
Use filters to reduce the amount of data to be evaluated (input filters) or
displayed (display filters). The protocol tester uses filter criteria to check
which data frames are allowed to pass for further analysis. Depending on
its position in the pipeline, the Filter processing element serves as input
(just after the Source) or display filter (just before the Monitor). You can
easily apply the settings of any one filter to another.
NOTE. For information on how to configure filters, refer to Configuring
Filters on page 83 or to the appropriate topic in the Online Help.
32
Trigger
With the help of triggers you can link events with predefined actions,
called trigger actions. Events are linked with a trigger as trigger conditions. If a trigger condition is fulfilled, the defined trigger action will be
carried out. A trigger condition, for example, is the receipt of a specific
message. A trigger action, for example, is the termination of a file
recording.
NOTE. For information on how to configure triggers, refer to Configuring
Triggers on page 95 or to the appropriate topic in the Online Help.
K15 Short Introduction
Page 65

Saving Configurations
Configurations are saved in setup files. You can save any number of
configurations and load them individually as required. The standard
directory for setup files is \k15\config. Setup files have the extension *.s.
The following settings are saved in setup files:
Table 1: Saved Settings in Setup Files
Port Configuration Number and type of interface modules installed
Online Measurement
Scenarios
Offline Measurement
Scenarios
Processing Elements Capture RAM: Capture RAM size and mode
Configuration
Parameters of the configured interface modules
All configured logical links and the assigned pipelines
including their configuration and activation status
(ON, OFF)
Activation status of configured pipelines (ON, OFF)
Assignment of protocol stacks, name playback settings of
recording files
Activation status of configured pipelines (ON, OFF)
Filters: All filter settings
Triggers: All defined conditions and actions
Recording files: Name and settings for the recording or
playing back of data
Applications: Assignment of activated applications to
configured pipelines
Monitor: Screen settings (columns, panes)
NOTE. The system only saves settings for the currently installed measuring
modules. Information about previously installed measuring modules is lost
if you load a configuration with hardware settings that do not correspond
to the current installation and save this configuration again.
K15 Short Introduction
33
Page 66

Configuration
To save the current configuration, proceed as follows:
1. Choose Save System Configuration from the File menu
2. Enter the desired name for the configuration file. The file extension *.s
3. Confirm your entries with Save.
The last used configuration is loaded automatically 30 seconds after the
measurement software is started. During these 30 seconds, a dialog box is
shown with which you can start another setup file.
You can also load a saved configuration (setup file) at a later point of time,
such as after completing a measurement in order to begin a new one with
different parameters.
If you do not load or create a configuration after starting up the protocol
tester, the Data Flow window title bar displays the word <UNTITLED>.
or Save System Configuration As from the File menu
or press <CTRL + S>
The Save dialog box opens and the \k15\config directory is displayed.
is added automatically
34
NOTE. If the system cannot detect a saved configuration, the default
configuration is activated.
K15 Short Introduction
Page 67

Printing Configurations
You can print the current configuration to a system printer or to a printer
connected via the printer interface. The printout lists the following
information:
H Hardware configuration
H Source configurations
H Pipeline configurations
To print your current configuration, click Print System Configuration on
the File menu.
Copying Configurations (Pack&Go)
You can use the Pack & Go Wizard to copy configurations with all of the
linked files to another protocol tester or PC. The Pack & Go Wizard packs
and compiles the required files in an archive file. After you have copied
this configuration archive to the destination computer, you can unpack it
there with the Pack & Go Wizard.
Configuration
To pack your current configuration, click Pack&Go... on the File menu
and follow the instructions of the wizard.
K15 Short Introduction
35
Page 68

Configuration
Loading Saved Configurations
If you have changed the previously loaded configuration, the software
displays a query. Confirm with Yes if you want to save the previous
configuration.
It is also possible to load a saved configuration (setup file) at system start
or at a later time, for example when you have completed a measurement
and want to begin a new one with different parameters.
To load a saved configuration, proceed as follows:
1. Select one of the setup files from the pick list in the File menu.
An Open dialog box appears, displaying the directory \k15\config.
2. Select the desired configuration file.
3. Confirm your selection with Open.
If you have changed the currently loaded configuration, the Save dialog
box appears. You can now save the configuration before opening the new
selected configuration.
The protocol tester loads the configuration. You can either accept the
configuration as is or change the settings before starting measurement.
36
NOTE. If an error occurs while the system is loading a setup file, the most
recently loaded configuration is reactivated.
K15 Short Introduction
Page 69

K15 Measurements
With a configured K15 you can run several types of online and offline
measurements. You can edit your measurement scenarios by changing data
volumes or parameters. You can filter displayed messages and control a
measurement by configuring triggers.
The following chapter guides you through the different aspects of working
with the K15 Protocol Tester. It should help you get started by explaining
the basic principles of the protocol tester.
This chapter provides background information needed to access and use
the K15 features.
K15 Short Introduction
37
Page 70

K15 Measurements
Selecting a Type of Measurement
After configuring the K15 you must select and start the desired measurement. There are two types of measurement scenarios – online and offline
measurements. They differ in terms of the data sources they use.
Online Measurements. Online measurements monitor “live” data as it is
received. The K15 is connected to the data lines being monitored.
Three measurement scenarios are available for online measurements:
H Online Recording (to record received data)
H Online Monitoring (to analyze received data in the Monitor)
H Online Statistics (to perform statistical analyses using received data)
Before starting an online measurement, you must configure at least one
logical link in a source.
Offline Measurements. Offline measurements use data stored in recording
files. The K15 is not connected to data lines.
Recorded data can be analyzed and processed in one of two ways: it can be
viewed or played back. Playback data reproduce an online measurement.
They can be edited and evaluated like online measurement data.
Four measurement scenarios are available for offline measurements:
38
H Recording Viewer (to view recorded data)
H Offline Recording (to filter recorded data and write it to a new
recording file)
H Offline Monitoring (to edit and analyze recorded data in the Monitor)
H Offline Statistics (to perform statistical analyses of the recorded data)
Before starting an offline measurement, select a recording file for viewing
or playback.
K15 Short Introduction
Page 71

K15 Measurements
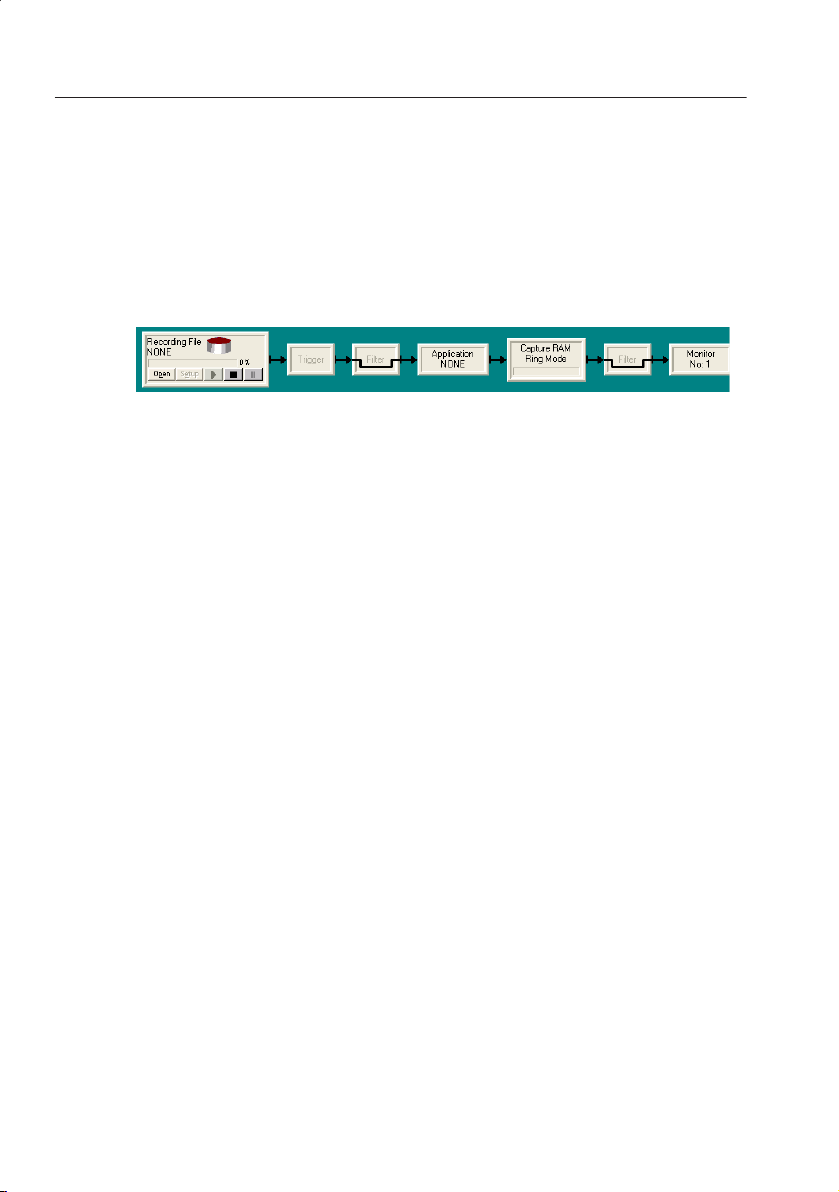
Online Recording
The Online Recording measurement scenario allows you to save received
data to recording files and evaluate them later.
You can reduce the amount of data being recorded using input filters. You
can set filter criteria for each event registered by the protocol tester,
specifying whether it should be recorded for later evaluation.
Figure 17: Online Recording measurement scenario
When using the Online Recording scenario, you can simultaneously
monitor your data using the Online Monitor and perform statistical
analyses using the Online Statistics by configuring appropriate pipeline
branches.
K15 Short Introduction
39
Page 72

K15 Measurements
Online Monitoring
The Online Monitoring measurement scenario allows you to analyze ”live”
signalling data in the Monitor window. The data are displayed as they are
received and simultaneously stored in the Capture RAM. You can
passively monitor these data in the monitor window.
You can use input filters to reduce the amount of data entered into the
Capture RAM. In addition you can specify in the display filter, which of
the messages saved in the Capture RAM will be displayed in the monitor.
Figure 18: Online Monitoring measurement scenario
When using the Online Monitoring scenario, you can simultaneously write
the data to a recording file (Online Recording) and perform statistical
analyses (Online Statistics) by configuring appropriate pipeline branches.
40
K15 Short Introduction
Page 73

K15 Measurements
Recording Viewer
The Recording Viewer measurement scenario displays recorded data in the
Offline Monitor for your inspection.
Based on this quick overview, you can decide how you want to proceed
with further data analysis or change your recording criteria.
Figure 19: Recording Viewer measurement scenario
The Record Viewer allows you to scroll through a pre-recorded and
decoded file. You can define filters for the screen output, but applications
are not available.
K15 Short Introduction
41
Page 74

K15 Measurements
Online Statistics
The Online Statistics measurement scenario helps you perform statistical
analyses using data received online. Use the input filter to reduce the
amount of data being analyzed.
Figure 20: Online Statistics measurement scenario
For more in-depth analysis, the auxiliary program RealChart (see page 233)
provides you with functions for graphically analyzing and evaluating data.
When using the Online Statistics scenario, you can simultaneously write
data to a recording file (Online Recording) and analyze it using the Online
Monitoring scenario by configuring appropriate pipeline branches.
42
K15 Short Introduction
Page 75

K15 Measurements
Offline Recording
The Offline Recording scenario allows you to edit, filter and perform
problem-specific analyses of recorded data and write the edited data to a
new recording file. In this way, you can examine and then archive data
(Recording Viewer) or analyze it in the offline monitor (Offline Monitoring).
Figure 21: Offline Recording measurement scenario
When using the Offline Recording scenario, you can simultaneously
monitor data using the Offline Monitor and perform statistical analyses
using (Offline Statistics) by configuring appropriate pipeline branches.
K15 Short Introduction
43
Page 76
K15 Measurements
Offline Monitoring
The Offline Monitoring scenario allows you to play data back into the
system as well as edit and analyze it in the monitor. Use the input filter
and problem-specific supplementary applications to restrict the data flow
to include only the area you want to analyze later in the monitor.
Figure 22: Offline Monitoring measurement scenario
When using the Offline Monitor scenario, you can simultaneously write
data to a new recording file (Offline Recording) and perform statistical
analyses (Offline Statistics) by configuring appropriate pipeline branches.
44
K15 Short Introduction
Page 77

K15 Measurements
Offline Statistics
The Offline Statistics measurement scenario allows you to evaluate
recorded data using the Statistics application.
Figure 23: Offline Statistics measurement scenario
For more in-depth analysis, the auxiliary program RealChart (see page 233)
provides you with functions for graphically analyzing and evaluating data.
When using the Offline Statistics scenario, you can simultaneously write
data to a new recording file (Offline Recording) and analyze it using the
Offline Monitoring by configuring appropriate pipeline branches.
K15 Short Introduction
45
Page 78

K15 Measurements
Starting Measurements
If you have configured your measurement scenario and selected the type of
measurement you can start the measurement.
Starting an Online Measurement. Activate the pipeline in the Measurement
Scenarios tab of the Data Flow window by clicking the ON/OFF
processing element of the pipeline branch to ON.
Starting an Offline Measurement. Select the desired file in the offline pipeline
by clicking the Open button on the Recording File processing element.
The File Open dialog box opens. The file type can be either from K15
(.rf5), K1103 (.rec) or K1297 (.dat). To start or continue the playback,
click the triangle (play) button.
During Operation...
H The corresponding pipeline branch is highlighted.
H You can set and change the settings used to record and analyze data in
the pipelines by configuring the processing elements.
H You can start several measurements simultaneously. The maximum
number is determined only by the memory space available on the
measurement boards.
46
H You should load the Load Meter program. This program provides
capacity usage information on the individual measurement boards and
the PC board (see page 231).
K15 Short Introduction
Page 79

Stopping Measurements
Stop an Online Measurement. The following actions require you to stop a
current online measurement:
H Adding new logical links to the source
H Removing existing links from the source
H Changing the assignments between logical links and protocol stacks
H Assigning a new pipeline branch
H Searching for data frames and text frames (measurement scenario
Online Monitoring)
To stop online measurements, set the ON/OFF switch to OFF (in all
pipeline branches, if you want to edit the data source).
Stop an Offline Measurement. Before performing the following actions, you
need to stop all offline measurements. The following information only
applies to data playback:
H Opening a new recording file
K15 Measurements
H Changing the assignments between logical links and protocol stacks
H Assigning a new pipeline branch
H Searching for data frames and text frames (measurement scenario
Offline Monitoring)
To stop offline measurements, click the square (stop) button in the
Recording File processing element.
K15 Short Introduction
47
Page 80

K15 Measurements
Viewing Measurement Results
To view the signaling data of the activated data flow switch to the monitor
main window by clicking the Monitor processing element at the right end
of the pipeline.
48
Figure 24: Monitor window
Monitor Pipeline Bar. The pipeline on which the current measurement is
based is located above the pane and indicates the status and progress of the
measurement, such as the Capture RAM usage or Layer 1 errors.
In the Monitor pipeline bar you can stop or interrupt the measurement,
change parameters for the individual measurement, and open a new source.
K15 Short Introduction
Page 81

K15 Measurements
Monitor Panes. The monitor features three panes that display measurement
data at three different levels of complexity.
The Short View window pane lists the data packets (frames) recorded by
the K15, displaying signaling data in single rows and short form. The
preset columns display the time stamps, logical links, protocol names, and
messages of levels 2 to 4.
The Frame View window pane shows the frame selected in the Short View.
Here, it is displayed completely decoded down to the bit level. The first
column shows the selected octet, the second column shows the name /
meaning of the octet, and the third column shows the comment or value of
the parameter. The protocol stacks loaded with the scenario determine
which protocol parameters are shown.
The Packet View window pane displays the frame selected in Short View in
HEX or ASCII, HEX plus ASCII, Binary, or EBCDIC. If you select an
individual protocol parameter in the Frame View, the corresponding values
are highlighted in the Packet View matrix (refer to the Online Help for
further details).
Monitor Status Bar. The status bar is located at the bottom edge of the
display. It contains information about the selected frame, the evaluation of
time differences, and the zoom function settings.
NOTE. Details on all menus, buttons, and functions can you find in the
appropriate help topics.
K15 Short Introduction
49
Page 82

K15 Measurements
Changing the Data Display
To view the measurement results, you can make adjustments to the data
display settings. The following sections describe, how you can change the
following display settings:
H Configuring the column settings in Short View and Frame View
H Specifying display levels for protocol parameters in Frame View
H Defining a color code for individual protocols in Frame View
H Specifying font settings for all panes
H Changing the data representation in the Packet View
The protocol tester saves all settings listed above internally when you
close the monitor. If you open the monitor again during a later session, or
if you load another configuration during the same session, the monitor will
default to the settings that were selected last. It might therefore be
necessary to change them again.
50
K15 Short Introduction
Page 83

K15 Measurements
Configuring Column Settings. To configure monitor columns, click Column
Setup Short View or Column Setup Frame View on the Monitor menu. A
Column Configuration dialog box for one of the views opens.
Figure 25: Column configuration for short view
In this dialog box you can add and remove columns. Using the Up and
Down buttons, you can change the position of selected columns. Using the
Column Width button, you can set the character width of the columns.
Column configuration files carry the extension *.mcc. They are stored in
the \k15\config directory.
K15 Short Introduction
51
Page 84

K15 Measurements
Specifying Display Levels. In Frame View, you can select one of two different
display levels for protocol parameters (complete or medium display).
To specify the display level, click Monitor Setup –> Display Level on the
Monitor menu. The Monitor Setup dialog box opens. Click the Display
Level tab in this dialog box.
52
Figure 26: Display Level window
The protocol list box shows the protocols of all protocol stacks assigned to
the source’s logical links. In the Level list box you can select your desired
setting.
NOTE. The display level setting for a specific protocol is applied to all
open Monitor windows.
K15 Short Introduction
Page 85

K15 Measurements
Defining Color-Coding Protocols. Protocols included in your measurement
can be highlighted in color for improved differentiation. The color
assignments apply to the Frame View display.
To define color-coding protocols, click Monitor Setup –> Colors of
Protocols on the Monitor menu. The Monitor Setup dialog box opens.
Click the Color tab in this dialog box.
Figure 27: Monitor Setup dialog box, Color tab
If you have already defined colors for protocols in the Protocol Stack
Editor, the Monitor will display the protocols in those colors; you can,
however, change these settings as desired.
Adjustments to color settings are system-wide changes and will be applied
to all protocol stacks containing this protocol.
K15 Short Introduction
53
Page 86

K15 Measurements
Specifying Font Settings. Font settings are valid for all three monitor panes.
Defaults are Fixedsys, Normal, 9pt. You can change the font used to
display signaling data.
Change the font settings by clicking Monitor Setup –> Font Setup on the
Monitor menu. The Monitor Setup dialog box opens. Click the Font tab in
this dialog box and specify your desired font settings.
Changing Data Representation. The Packet View decodes the protocol
parameters of the data frame selected in the Short View. If you mark an
individual protocol parameter in Frame View, the associated values in the
Packet View matrix are highlighted.
In the Packet View; data can be represented in HEX, ASCII, HEX + ASCII
EBCDIC, or BIANRY format.
To change the data representation, click Packet View Representation on the
Monitor menu and select the desired format.
54
K15 Short Introduction
Page 87

K15 Measurements
Selecting Date and Time Formats
To the Short View, you can add columns with information regarding date or
time by selecting Columns Setup –> Short View from the Monitor menu.
The corresponding system formats for date and time are used for long date,
short date, long time and short time. These formats may be adapted in the
Windows Regional and Language Options dialog box. To open this dialog
box, click Start –> Control Panel –> Regional and Language Options.
NOTE. Tektronix does not recommend using self-defined date and time
formats. Information regarding self-defined date and time formats can be
taken from your operating system’s documentation or Online Help.
Copying Monitor Configurations
If you have opened several Monitor windows, you can easily copy the
settings from one Monitor window to another. Press Ctrl + M in the
Monitor window whose settings you want to copy and Ctrl + Shift + M in
the Monitor window to which you want to apply the settings.
K15 Short Introduction
55
Page 88

K15 Measurements
Reading Data as They Are Received (Live Mode)
You can view data simultaneously as they are received (LIVE). In the Live
Mode, incoming frames are displayed immediately (live), and the screen
scrolls automatically.
Live Mode is used for “passively monitoring” measurements. In Short
View, a new line is inserted for each frame that passes the Capture RAM.
This gives you a general impression of the signaling process over time.
The system continuously updates the displays in Frame View and Packet
View based on the signaling data transmission speed. In Live Mode there
are two display modes: Ring Live and Linear Live.
You can change the way newly received data are displayed in Live Mode.
In Ring Live Mode, new data overwrite the data that have already been
displayed, and the new line scrolls across the screen from top to bottom,
whereas in Linear Live Mode, the data already displayed scroll to the top.
In Ring Live Mode, new data can be displayed very fast. This is particularly useful if the protocol tester is controlled remotely.
You can switch between modes in two ways:
H In the Short View or Frame View context menu call up the Live Mode
Presentation menu item and select the Ring Mode or Linear Mode
setting.
56
H In the Monitor toolbar click a Ring Live Mode button or a Linear Live
Mode button to change the current mode.
Ring Live Mode Button
Linear Live Mode Button
K15 Short Introduction
Page 89

K15 Measurements
Freezing the Display of Data (Freeze Mode)
You can freeze the display (FREEZE) for further data processing. In the
Freeze Mode scrolling is performed manually with the cursors. Freeze
mode suppresses the continuous display of new data allowing a more
detailed analysis of frames.
In Freeze Mode, the continuous display of new data frames is suppressed
(”frozen”), and you can select or search in the recorded data. Signaling
data received while you work in Freeze Mode continues to be recorded in
the Capture RAM.
NOTE. The Recording Viewer measurement scenario only supports
Freeze Mode.
You can switch between Live Mode and Freeze Mode in two ways:
H Select Live Mode or Freeze Mode in the Short View or Frame View
context menu.
H Click the active button in the Monitor toolbar: Live Mode or Freeze
Mode.
The new mode is displayed in the Monitor window title bar.
K15 Short Introduction
57
Page 90

K15 Measurements
The data in each view is constantly updated. In Live Mode (indicated in the
main window title bar), you can read the data as it is measured. This mode
is set by default when you switch to the Monitor main window.
If you click on a view and scroll the contents using the arrow keys (↓ and
↑), the system automatically switches into Freeze Mode (indicated in the
main window title bar). The continuous display of new data frames is then
suppressed. In the background, measurement continues until the available
storage is full. Then you receive the following error message:
Data is not available! Change to Live Mode (and back to Freeze Mode) in
order to resynchronize Monitor Window and Capture RAM content.
Then click the Live Mode button to return to live mode.
58
K15 Short Introduction
Page 91

K15 Measurements
Searching for Specific Data
You can carry out exact searches for specific messages or events in the received
data. The search for specific data “filters” the data in the Capture RAM.
NOTE. Depending on your display filter configuration, the display of the
data you search for may be suppressed even though they have been
recorded. To avoid this conflict, run the search function only if you have
not restricted the data display.
To search for specific data, proceed as follows:
1. Stop the current measurement by clicking the OFF button in online
pipelines or the Stop button in offline sources. Select a data frame.
2. To start a down search, press < CTRL > + < F3 > or select
Find –> Down from the Monitor menu.
For an up search, press < CTRL > + < SHIFT > + < F3 > or select
Find –> Up from the Monitor menu.
The Filter Setup dialog box opens. You can now specify your search
criteria. This procedure is identical to defining a filter and is described
in detail in chapter Configuring Filters on page 83. You can define
several criteria for the search, for example, error events and messages.
3. After specifying your search criteria, close the dialog box with OK.
The Monitor now displays the first data frame that matches your search
criteria. A message appears if no matching frames are found.
If you want to search for further data frames with this criterion, press the
< F3 > key for a forward search or < SHIFT > + < F3 > for a backward
search. These functions are also available via Find Again from the Monitor
menu.
If you want to cancel a long search, click Cancel in the Search Frame in
the Capture RAM Status dialog box.
NOTE. The search begins with the frame selected in Short View.
K15 Short Introduction
59
Page 92
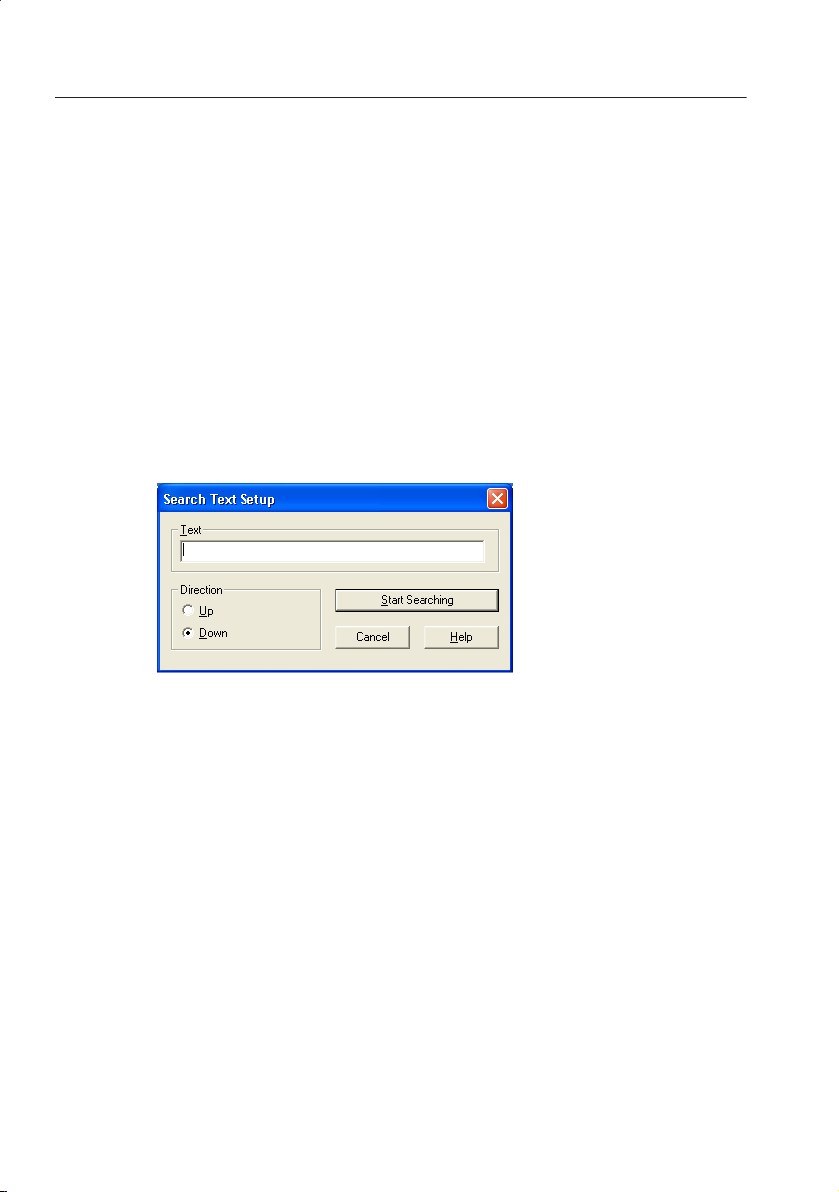
K15 Measurements
Searching for Text
You can carry out exact searches for specific text frames in the Frame
View as they are output, for example, by the applications. The search for
specific text frames “filters” the data in the Capture RAM.
To search for text, proceed as follows:
1. Stop the current measurement by clicking the OFF button in online
pipelines or the Stop button in offline sources. Select a data frame.
2. To start the search, press < CTRL > + < F7 >, or select Monitor –>
Find Text from the Monitor menu. The Search Text Setup dialog box
opens.
60
Figure 28: Search Text Setup dialog box
3. Enter the text you want to search for and change the search direction
(Up, Down) if necessary. Capitalization is ignored during search.
4. Close the dialog box with Start Searching. The Monitor now displays
the first text frame that matches your search string.
If you want to search for further text frames with this search string,
press the < F7 > key for a forward search or < SHIFT > + < F7 > for a
backward search. These functions are also available via Find Text
Again from the Monitor menu.
If you want to cancel a long search, click Cancel in the Search Frame
in Capture RAM Status dialog box.
K15 Short Introduction
Page 93

K15 Measurements
Restricting the Display of Measured Data Using a Display Filter
The display filter allows you to filter the display of the received signaling
data in the Monitor.
The display filter appears in the pipelines to the left of the Monitor
processing element. If you have deactivated the pipeline bar, reactivate it
or use the filter entry from the Pipeline Elements menu.
To configure the display filter, click on the Filter processing element. The
Filter Setup dialog box opens. You can now specify your search criteria.
This procedure is identical to defining a filter and is described in detail in
chapter Configuring Filters on page 83. You can define several criteria for
the search, for example, error events and messages.
Observe the following configuration notes:
NOTE. The filters allow you to adapt the recording and display criteria to
your specific measurement scenario. The protocol tester software does not
check your filter criteria specifications. It is therefore possible to define
mutually exclusive filter criteria.
Once you have configured the display filter, the name of the Filter
processing element is displayed in bold type.
The display configuration might impair the search function. When
searching in the recorded data, data frames that have been filtered out will
not be shown. Check the display filter settings and change them if required
before searching in the recorded data.
K15 Short Introduction
61
Page 94

K15 Measurements
Call up Protocol Information Regarding the Displayed Data
You can call up protocol information concerning the displayed data:
The Protocol Stack Editor gives you an overview of the protocols
contained in the currently loaded stack.
The Protocol Help contains detailed information on the messages and
parameters of individual protocols.
Calling up the Protocol Stack Editor. To call up the Protocol Stack Editor,
proceed as follows:
1. Switch to the Freeze Mode.
2. Position the cursor on a data frame in Short View or Frame View.
3. Press < F5 > or select Open Protocol Stack from Event from the
Monitor menu.
The Protocol Stack Editor opens and displays the allocated stack.
NOTE. If necessary, you can change the stack in the Protocol Stack Editor
(see page 112). The changes will become valid for the current measurement
when you restart the pipeline.
62
Calling up the Protocol Help. To call up the Protocol Help, proceed as
follows:
1. Switch to the Freeze Mode.
2. Place the cursor in the Short View or Frame View on the protocol or
message for which you require information.
3. Press < F2 > or select the Protocol Help menu item from the context
menu.
The Protocol Help opens and displays the information regarding the
protocol or the message.
K15 Short Introduction
Page 95
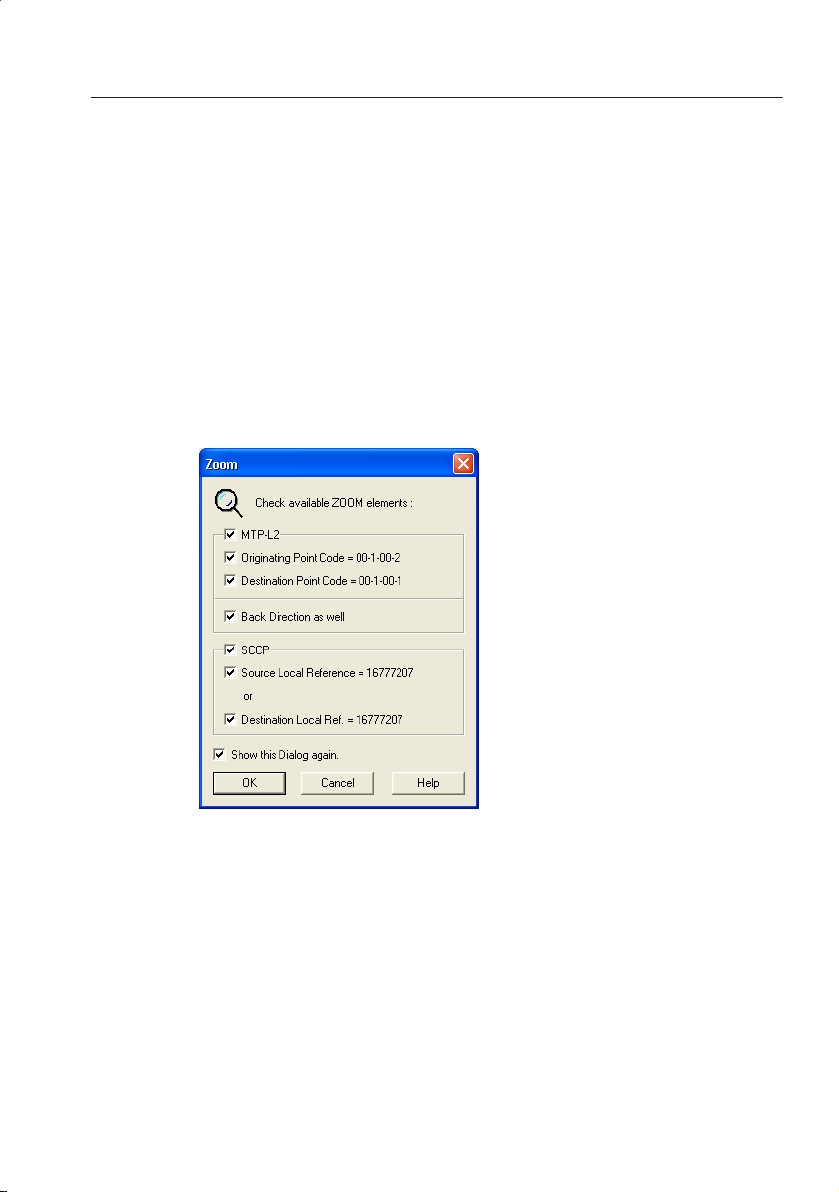
K15 Measurements
Zooming to the Data Frames of Individual Connections
Using the zoom function, you can display all messages for a single
connection.
To enable the zoom function, proceed as follows:
1. Switch to Freeze Mode.
2. In Short View, select a message that you want to investigate.
3. To enable the zoom function, click the Zoom button in the toolbar. The
Zoom dialog box opens.
Figure 29: Zoom dialog box
Use this dialog box to set zoom parameters. The available configuration
options depend on the protocol level assigned to the frame highlighted
in Short View.
K15 Short Introduction
63
Page 96

K15 Measurements
The buttons in the monitor window titlebar indicate whether the zoom
function is active. In active state, the following buttons are highlighted:
A summary of the zoom condition is displayed in the status bar.
NOTE. As long as the zoom function is active, the display filter is
automatically deactivated (bypass mode), to ensure that an unfavorably
configured display filter does not negatively affect the zooming of
messages.
When deactivating the zoom function, the display filter is reset to its
original state.
The zoom function and display filter cannot simultaneously be activated. If
you try to configure the display filter while the zoom function is activated,
a warning note will be displayed. Then, you can either deactivate the zoom
function or, alternatively, leave the display filter in the bypass mode.
64
K15 Short Introduction
Page 97

K15 Measurements
Evaluating Time Differences Between Messages
The protocol tester assigns a time stamp to each event received, indicating
the time of reception. To evaluate the difference between single events, the
following preconditions must be fulfilled:
H The Short View is shown.
H The Freeze Mode is set.
To display differences by using the keyboard, proceed as follows:
1. Press < CTRL > + < TAB > (several times if required) to switch to
Short View.
2. With the < UP ARROW > and < DOWN ARROW > keys scroll to
the event that will serve as the starting point of the difference
calculation.
3. Press < F9 > or select Reference for Timestamp –> Timestamp Format
from the Monitor menu.
The selected event is highlighted and a break icon is placed before the
line. The status bar displays the number of the reference frame.
4. Scroll up or down in the recorded data using the cursor keys until you
reach the event that will serve as the end point of the calculation.
5. Read the time difference in the status bar.
Figure 30: Monitor status bar
The clock symbol displays a negative time difference if the reference
event was received later than the last selected event. The arrow symbol
pointing to a number displays the number of the last selected frame.
NOTE. If you select a frame block, the time difference between the first and
the last frame of this block is displayed. The reference time is set
automatically.
K15 Short Introduction
65
Page 98

K15 Measurements
To display differences by using the mouse, proceed as follows:
1. Press the < ALT > key and keep it pressed.
2. In the Short View click on the event that will serve as the starting point
for the difference calculation.
The selected event is highlighted.
3. Search the recorded data for the event that will represent the ending
point of the calculation. Select this event using the left mouse button.
4. Read the time difference in the status bar (see figure 30).
To deactivate the reference selection, press < Shift > + < F9 > or select
Reference for Timestamp –> Reset from the Monitor menu.
The default format is hh : mm : ss . ms . ms. You can choose a different
time format as follows:
1. Select the menu item Reference for Timestamp –> Timestamp Format
from the Monitor menu.
66
2. Select the desired time format. The Add units description option
additionally shows the units in the status bar.
K15 Short Introduction
Page 99

K15 Measurements
Editing Capture RAM Data
During the evaluation of measurement data in the monitor, you can print or
delete the contents of the Capture RAM or save them in a file.
Saving Capture RAM Data. To save Capture RAM data, proceed as follows:
1. Select Capture RAM – Ring Mode –> Save Capture RAM As... from the
Pipeline Elements menu. Select either Recording file or Text file.
Either the standard directory for Capture RAM files \k15\rec or the
directory that was last used for Capture RAM files opens.
Figure 31: Save As dialog box
2. Enter a file name and confirm with Save.
K15 Short Introduction
67
Page 100

K15 Measurements
3. Determine whether you want to save the data in short form (Short
View) or together with all the parameters (Frame View). If required,
you can save the Packet View values with the data (Append Packet
View).
4. Confirm with OK.
68
K15 Short Introduction
 Loading...