


xx
DSA8300
ZZZ
DigitalSerialAnalyzer
Printable Online Help
*P077056900*
077-0569-00


DSA8300
Digital Serial Analyzer
ZZZ
PrintableOnlineHelp
www.tektronix.com
077-0569-00

Copyright © Tektronix. All rights reserved. Licensed software products are owned by Tektronix or its
subsidiaries or suppliers, and are protected by national copyright laws and international treaty provisions.
Tektronix products are covered by U.S. and foreign patents, issued and pending. Information in this
publication supersedes that in all previously published material. Specifications and price change privileges
reserved.
TEKTRONIX and TEK are registered trademarks o f Tektronix, Inc.
FrameScan is a re gistered trademark of Tektronix, Inc.
TekVISA and TekProbe are trademarks of Tektronix, Inc.
Online help version: 1.0
Product Software Version 1.0 and above
Contacting Tektronix
Tektronix, Inc.
14150 SW Karl Braun Drive
P. O . B o
Beaverton, OR 97077
USA
For product information, sales, service, and technical support:
x500
In North America, call 1-800-833-9200.
dwide, visit www.tektronix.com
Worl
to find contacts in your area.

Table of Contents
Welcome
DSA8300 Online Help ............................................................................................. 1
Related Documents .............................. ................................ ................................ ... 1
Analysis and Connectivity Support Overview .................................................................. 2
Get Analysis and Connectivity Software ........................................................................ 4
Accessories, Options, and Software .............................................................................. 5
Getting Started
Getting Started Overview.. .. . .. .. ... .. ... .. ... .. ... .. .. . .. .. . .. .. . .. .. . .. .. . .. .. . .. .. . .. .. . .. .. ... .. ... .. ... .. ... . 7
Instrument Operation
Theory of Operation........................................................................................... 7
Signal Acquisition Process . .. . .. .. . .. .. . .. .. ... .. ... .. .. . .. .. . .. .. . .. .. . .. .. ... .. ... .. .. . .. .. . .. .. . .. .. . .. .. . 9
User Interface Tour
User Interface Overview ..................................................................................... 11
Application Screen ........................................................................................... 12
Graticules................ ................................ .................................. .................... 13
On-Screen Operations...... ................................ ................................ .................. 14
Pop-Up Keyboard and Keypad.............................................................................. 14
Mouse and Touchscreen Operation Comparison.......................................................... 16
Front-Panel Controls
Channel Source Controls..................................................................................... 17
Channel Select Controls...................................................................................... 17
Vertical Controls ............ .................................. ................................ ................ 18
Timebase View Controls..................................................................................... 19
Acquisition Controls. ... .. .. . .. ... .. .. . .. ... .. .. . .. .. . .. .. . .. .. . .. .. . .. .. . .. .. . .. .. . .. .. . .. .. . .. .. ... .. . .. .. .. 1
Horizontal (Timebase) Controls............................................................................. 20
Trigger Controls............................................................................................... 21
Utility Controls. .. . .. .. . .. .. . .. .. ... .. ... .. .. . .. .. . .. .. . .. .. . .. .. . .. .. . .. .. ... .. ... .. .. . .. .. . .. .. . .. .. . .. .. . .. . 22
To Change Instrument Settings. ... .. .. . .. .. . .. .. ... .. ... .. .. . .. .. . .. .. ... .. ... .. .. . .. .. . .. .. ... .. ... .. .. . .. . 22
To Restore Default Instrument Setup................. ................................ ...................... 23
To Select and Display Waveforms .......................................................................... 23
Acquire and Display a Signal
Data Acquisition Introduction . .. .. ... .. ... .. .. . .. .. . .. .. . .. .. . .. .. ... .. ... .. .. . .. .. . .. .. . .. .. . .. .. ... .. ... .. 24
Acquire and Display a Signal................................................................................ 24
Signal Conditioning and Scaling Overview................................................................ 26
Math Waveforms Overview ....................... ................................ .......................... 27
Waveform Database Overview ............................ ................................ .................. 27
Waveform Measurements
Table of Contents
9
DSA8300 Printable Online Help i

Table of Contents
Waveform Measurement Introduction ...................................................................... 28
Automatic Measurements.......... ................................ ................................ .......... 28
Cursors ............... ................................ ................................ .......................... 29
Histograms..................... ................................ .................................. .............. 31
Masks .......................................................................................................... 31
Optimize Measurement Accuracy .......... ................................ ................................ 32
Controls-SpecificHelp
Acquisition Setup
Acquisition Setup Dialog Box Overview . .. .. . .. .. . .. .. . .. .. . .. .. . .. .. . .. .. . .. .. . .. .. . .. .. . .. .. . .. .. . .. .. . 33
Acquisition Mode Settings. . .. .. . .. .. . .. .. . .. .. ... .. . .. .. ... .. ... .. ... .. ... .. .. . .. ... .. .. . .. ... .. .. . .. .. . .. .. 33
Acquisition Stop A fter Settings . . .. ... .. .. . .. ... .. .. . .. .. . .. .. . .. .. . .. .. . .. .. . .. .. . .. .. . .. .. . .. .. . .. .. . .. .. . 34
Acquisition Stop Action Settings . . .. ... .. ... .. . .. .. . .. .. . .. .. . .. ... .. ... .. . .. .. . .. .. . .. .. . .. ... .. ... .. . .. .. 36
Acquisition Background
Acquisition Background .. .. ... .. ... .. ... .. ... .. .. . .. ... .. .. . .. .. . .. .. . .. .. . .. .. . .. .. . .. .. . .. .. . .. .. . .. . 36
Acquisition Key Points .. . .. .. . .. .. . .. .. . .. .. .. . .. .. . .. .. ... .. ... .. .. . .. .. . .. .. ... .. ... .. .. . .. .. . .. .. .. . . 37
Acquisition Sampling Process . .. ... .. .. . .. ... .. .. . .. .. . .. .. . .. .. . .. .. . .. .. . .. .. ... .. . .. .. ... .. ... .. .. . . 39
Cursor Setup
Cursor Setup Dialog Box Overview.............. ................................ .......................... 41
Cursor Function Settings .. . .. .. . .. ... .. .. . .. ... .. ... .. ... .. ... .. . .. .. ... .. . .. .. . .. .. . .. .. . .. .. . .. .. . .. .. . .. .. 42
Cursor 1 and 2 Settings....................................................................................... 43
Cursor Background ........................................................................................... 43
Cursor Units ................................................................................................... 46
Display Setup
Display Setup Dialog Box Overview ................................. ................................ ...... 46
Display Style Settings . . .. .. ... .. ... .. .. . .. .. . .. .. ... .. ... .. .. . .. .. . .. .. ... .. ... .. .. . .. .. . .. .. ... .. ... .. .. . .. . 47
Display Graticule Settings ................................................................................... 49
Waveform Display Background
Waveform Display Elements ............. ................................ .............................. 49
Waveform Display Key Points ......................................................................... 51
Customizing the Waveform Display............. .................................. .................... 54
Waveform Display Persistence ......................................................................... 55
Waveform Display Data Point Interpolation .......................................................... 55
Display Features ... ................................ .................................. .................... 56
Histograms Setup
Histograms Setup Dialog Box Overview .................................................................. 56
Histogram Source Settings. .. ... .. ... .. .. . .. .. . .. .. .. . .. .. . .. .. ... .. .. . .. .. . .. .. . .. .. .. . .. .. . .. .. ... .. .. . .. .. 57
Histogram Display Options.................................... ................................ .............. 59
Histogram Limit Controls.................. .................................. ................................ 60
Histogram Background....................................................................................... 60
Histogram Statistics .......................................................................................... 62
Horizontal Setup
ii DSA8300 Printable Online Help

Table of Contents
Horizontal Setup Dialog Box Overview ................................................................... 62
Timebase Controls
Horizontal Timebase Controls Overview...................... .................................. ...... 63
Horizontal Timebase Select............................................................................. 64
Horizontal Scale Setting.. .. . .. .. ... .. ... .. .. . .. .. . .. .. . .. .. . .. .. . .. .. . .. .. ... .. ... .. .. . .. .. . .. .. . .. .. . .. 65
Horizontal Position Setting . .. .. . .. .. . .. .. .. . .. .. . .. .. . .. .. . .. .. .. . .. .. . .. .. . .. .. . .. .. .. . .. .. . .. .. . .. .. . 67
Horizontal Resolution Setting .......................................................................... 69
Horizontal Record Length Setting . .. .. . .. .. . .. .. ... .. . .. .. ... .. ... .. .. . .. .. . .. .. . .. .. . .. .. . .. .. . .. .. .. 70
Horizontal Reference Setting . .. .. . .. .. . .. .. . .. .. ... .. .. . .. .. . .. .. . .. .. . .. .. .. . .. .. . .. .. . .. .. . .. .. .. . .. . 71
All Timebases Controls
All Timebases Controls Overview ..................................................................... 72
Timebase Comm Standard Setting . .. . .. .. . .. .. . .. .. . .. .. . .. .. . .. .. ... .. ... .. .. . .. .. . .. .. . .. .. . .. .. . .. . 72
Timebase Units Setting .. . .. .. . .. .. . .. .. . .. .. . .. .. . .. .. . .. .. . .. .. ... .. ... .. ... .. ... .. .. . .. .. . .. .. . .. .. . .. 73
Display Scale Settings................................................................................... 74
The Pattern Sync/FrameScan Setup Button....................... ................................ .... 74
The Horizontal Acquisition Window Overview . .. .. . .. .. . .. .. .. . .. .. . .. .. . .. .. . .. .. ... .. ... .. .. . .. .. . .. .. 75
Horizontal Scale Versus Record Length Versus Sample Interval Versus Resolution.................. 76
Independent Versus Shared Window ............. ................................ .......................... 77
FrameScan
FrameScan Overview.................................................................................... 77
FrameScan Theory of Operation ....... ................................ ................................ 79
FrameScan Enable and Scan Bits ................ ................................ ...................... 81
Mask Setup
Mask Setup Dialog Box Overview ......................................................................... 81
Mask Source Settings . .. .. . .. .. .. . .. .. . .. .. ... .. ... .. .. . .. .. . .. .. .. . .. .. . .. .. ... .. ... .. .. . .. .. . .. .. .. . .. .. . .. 83
Mask Display Settings ....................................................................................... 84
Mask Margins S ettings . .. .. .. . .. .. . .. .. .. . .. .. . .. .. .. . .. .. . .. .. .. . .. .. ... .. .. . .. .. ... .. .. . .. .. ... .. .. . .. .. .. . 85
Mask Autoset Settings ....................................................................................... 86
Mask Edit Dialog Box Overview ... .................................. ................................ ...... 87
Mask Usage Gu
Creating User Masks (Mask Editing)....................................................................... 88
Mask Hit Count Statistics.................................................................................... 90
Measure Setup
Measure Setup Dialog Box Overview ...................................................................... 91
Measurement Parameter Tabs
Measurement Parameters Tabs Overview ............................. ................................ 92
Measurement Source Tab ... .................................. ................................ .......... 93
Measurement Region Tab (Pulse Selected) ............. .................................. ............ 94
Measurement Region Tab (RZ or NRZ Selected) .................................................... 95
To Set a Measurement Region (Gates) ................ ................................ ................ 96
Measurement Hi/Low Tab .............................................................................. 97
Measurement Reference Level Tab .. ................................ ................................ .. 98
idelines.. ................................ .................................. .................. 88
DSA8300 Printable Online Help iii

Table of Contents
Automatic Measurements Overview.................... ................................ .................. 100
Automatic Measurements Caveats........................................................................ 100
Automatic Measurements Key Points .................................................................... 102
Phase Reference Setup
Phase Reference Setup Dialog Box Overview........................................................... 103
Phase Correction Settings.. .. ... .. ... .. ... .. ... .. .. . .. ... .. .. . .. ... .. .. . .. .. . .. .. . .. .. . .. .. . .. .. . .. .. . .. .. . 105
Phase Reference Clock Source Settings.......................................... ........................ 105
Phase Reference Setup Process ........................................................................... 108
Phase Reference Background. .. .. . .. .. . .. ... .. ... .. ... .. ... .. . .. .. . .. .. . .. .. . .. .. . .. .. . .. ... .. .. . .. ... .. .. 108
Phase Reference Keys Points................ .................................. ............................ 109
Phase Reference Caveats......................................... ................................ .......... 110
Phase Reference Characterization Status......... ................................ ........................ 111
TDR Setup
TDR Setup Dialog Box Overview ........................................................................ 112
TDR Preset Settings.... ................................ .................................. .................. 114
TDR Step Settings ...................... ................................ ................................ .... 116
TDR Acquisition Settings. ... .. .. . .. .. . .. .. .. . .. .. . .. .. . .. .. . .. .. .. . .. .. . .. .. ... .. ... .. .. . .. .. . .. .. ... .. .. . 117
TDR Step Deskew Settings .. .. . .. .. . .. .. . .. .. . .. .. . .. .. . .. .. . .. ... .. .. . .. ... .. ... .. ... .. ... .. . .. .. ... .. . .. 118
TDR Turn Off All Steps Settings . .. .. ... .. .. . .. .. . .. .. . .. .. .. . .. .. . .. .. . .. .. ... .. .. . .. .. . .. .. ... .. ... .. .. 119
Advanced TDR Setup .... ................................ ................................ .................. 119
Mode/Trigger Setup
Mode/Trigger Setup Dialog Box Ov
Trigger Source Settings .. ................................ .................................. ................ 123
Scope Mode (Clock Trigger Source) ............... ................................ ...................... 125
Clock Recovery Outputs ................................................................................... 125
Pattern Sync/FrameScan
Advanced Trigger Setup ................................................................................... 131
Trigger Holdoff Reference................................................................................. 132
Trigger Background ...... .................................. ................................ ................ 133
Triggering Key Points ...................................................................................... 133
Trigger Sources and Modes.................. ................................ .............................. 135
Trigger Process Overview ................................................................................. 137
Vertical Setup (Basic)
Vertical Setup (Basic) Dialog Box Overview............................................................ 139
Waveform Selector Setting .. . .. .. . .. .. ... .. . .. .. ... .. ... .. .. . .. .. . .. .. . .. .. . .. .. . .. .. . .. .. . .. .. . .. .. ... .. . 141
Vertical Scale Setting .. . .. .. . .. .. . .. .. . .. .. . .. .. . .. .. . .. .. ... .. . .. .. ... .. . .. .. ... .. ... .. .. . .. ... .. .. . .. ... .. 141
Vertical Position Setting. .. ... .. .. . .. .. . .. .. ... .. ... .. .. . .. .. . .. .. ... .. ... .. .. . .. .. . .. .. ... .. ... .. .. . .. .. . .. 143
To Set a Measurement Ref Level Method............................................................. 99
erview........................................ ...................... 121
Pattern Sync/FrameScan Setup Dialog Box......................................................... 126
Pattern Sync Controls ................................................................................. 127
AutoSync Opt
FrameScan Controls ....... ................................ .................................. .......... 130
ions ..................................................................................... 129
iv DSA8300 Printable Online Help

Table of Contents
Vertical Offset Setting .. .. . .. .. . .. .. .. . .. .. . .. .. . .. .. ... .. .. . .. .. . .. .. ... .. ... .. .. . .. .. . .. .. .. . .. .. . .. .. . .. . 143
Vertical Channel Deskew and Delay Settings .. ... .. .. . .. ... .. .. . .. ... .. .. . .. ... .. .. . .. ... .. .. . .. ... .. .. 145
Vertical Bandwidth, Units Settings .. . .. .. ... .. ... .. .. . .. .. . .. .. . .. .. . .. .. ... .. ... .. .. . .. .. . .. .. . .. .. . .. .. 146
Vertical External Attenuation Setting. .. ... .. . .. .. ... .. ... .. .. . .. .. . .. .. . .. .. . .. .. . .. .. . .. .. . .. .. . .. .. ... . 147
Vertical DC Cal Setting . .. .. . .. .. . .. .. . .. .. ... .. ... .. .. . .. .. . .. .. ... .. ... .. .. . .. .. . .. .. ... .. ... .. .. . .. .. . .. 148
Vertical Controls Background ............................................................................. 149
How Vertical Position, Scale, and Offset Affect Acquisition and Display . .. ... .. . .. .. ... .. ... .. .. . . 150
Vertical Setting Caveats . . .. .. .. . .. .. . .. .. . .. .. . .. .. .. . .. .. . .. .. ... .. ... .. .. . .. .. . .. .. ... .. .. . .. .. . .. .. . .. .. 152
Vertical Settings Key Points ... .. . .. .. ... .. .. . .. .. . .. .. ... .. ... .. .. . .. .. . .. .. .. . .. .. . .. .. . .. .. . .. .. .. . .. .. . 153
Vertical Signal Conditioning ...... ................................ .................................. ...... 155
Vertical Setup (Optical Signals)
Vertical Setup (Optical) Dialog Box Overview.................. .................................. ...... 159
Optical Waveform Selector .................... ................................ ............................ 160
Optical Wavelength Setting. .. .. . .. .. . .. .. . .. .. ... .. ... .. .. . .. .. . .. .. ... .. ... .. .. . .. .. . .. .. . .. .. . .. .. ... .. . 161
Optical Filter Setting . .. .. . .. .. . .. .. ... .. ... .. .. . .. .. . .. .. . .. .. . .. .. .. . .. ... .. .. . .. .. . .. .. ... .. ... .. .. . .. .. . 161
Optical Bandwidth.......................................................................................... 162
Optical Compensation and Calibration ............................. ................................ ...... 162
Waveform Database Setup
Waveform Database Setup Dialog Box Overview ................ .................................. .... 162
Waveform Database 1 - 4 Settings ... .. . .. .. . .. .. . .. .. .. . .. .. . .. .. . .. .. . .. .. .. . .. .. . .. .. . .. .. . .. .. .. . .. .. . 164
Waveform Database Persistence Settings . ... .. .. . .. .. . .. .. . .. .. . .. .. ... .. ... .. .. . .. .. . .. .. . .. .. . .. .. ... . 165
Waveform Database Display Options Settings . . .. .. . .. .. . .. .. . .. .. . .. .. . .. .. . .. .. ... .. ... .. ... .. ... .. .. 166
Waveform Database Background ......................................................................... 16
Waveform Database Caveats .............................................................................. 169
Waveform Database Key Points....... ................................ ................................ .... 170
File & Edit Menu Functions Overviews
Clear References Dialog Box.. ................................ .................................. .......... 170
Export Dialog Box.................. ................................ .................................. ...... 170
Saving a Waveform to a File ............ ................................ ................................ .. 172
Page Setup D i
Print Dialog Box .................... .................................. ................................ ...... 174
Save Setup Dialog Box..................................................................................... 175
Recall Setup Dialog Box................................................................................... 176
Save/Recall Setups Caveats ............................................................................... 177
Save/Recall Setups Key Points........ .................................. ................................ .. 178
Save Waveform Dialog Box......... .................................. ................................ .... 179
Recall Waveform Dialog Box ........... ................................ ................................ .. 180
Save/Recall Waveforms Background.................... ................................ ............ 180
Saving a Waveform as a Reference Waveform .......................................................... 181
Define Math Waveforms
Define Math Dialog Box Overview.................................................................. 181
Math Waveform Slot Select........................................................................... 182
alog Box................................. .................................. .................. 173
7
DSA8300 Printable Online Help v

Table of Contents
System & Utilities Overviews
About Dialog Box ...................... ................................ ................................ .... 196
Autoset
Calibration
Compensation
Diagnostics
Preferences Dialog Box
Properties
Math Expression Field............. ................................ ................................ .... 182
Math Functions......................................................................................... 184
Math Function Definitions . .. . .. .. ... .. ... .. .. . .. .. . .. .. ... .. ... .. .. . .. .. . .. .. ... .. ... .. .. . .. .. . .. .. .. 184
Math Sources... ................................ ................................ ........................ 186
Math Keypad ........................................................................................... 187
Math Syntax Controls ................................................................................. 188
Math Average, Risetime, and Mode ................................................................. 189
Math Measurement Scalars ........................................................................... 190
Math Expressions Syntax ............................................................................. 191
Math Waveforms Background........................................................................ 191
Math Waveform Caveats .............................................................................. 193
Math Waveform Key Points .......................................................................... 193
Math Waveform Operations .......................... ................................ ................ 194
Autoset Properties Dialog Box ....................................................................... 196
Autoset Mode Settings .. .. ... .. .. . .. .. . .. .. ... .. .. . .. .. . .. .. .. . .. .. . .. .. .. . .. .. . .. .. ... .. ... .. .. . .. .. . 196
Autoset Options Settings .. .. . .. .. . .. .. .. . .. .. . .. .. ... .. ... .. .. . .. .. . .. .. .. . .. .. . .. .. ... .. ... .. .. . .. .. . 198
Autoset TDR Options Settings ....................................................................... 199
Autoset Notifier Windows ...... ................................ ................................ ...... 199
Calibration Dialog Box Overview
Calibration Readout Fields.......... ................................ .................................. 201
Update Calibration Information ...................................................................... 202
Compensation Dialog Box Overview...................................... .......................... 202
Compensation Readout Fields........................................................................ 203
Compensation Select Action.......................................................................... 204
Compensatio
Compensation Results Storage ... .................................. ................................ .. 206
Execute Compensation ................................................................................ 207
Compensation Indicator Button ...................................................................... 207
Diagnostics: Subsystem Level Tab .................................................................. 208
Diagnostics: Area Level Tab ......................................................................... 210
Diagnostics: Test Level Tab .................. .................................. ...................... 211
User Preferences: General Tab ....................................................................... 212
User Preferences: Start-up Tab..................... .................................. ................ 213
User Preferences: GPIB Configuration Tab......................................................... 215
n Targets ................................................................................. 206
................................................................... 199
vi DSA8300 Printable Online Help

System Properties Dialog Box: Mainframe Tab.................................................... 216
System Properties Dialog Box: Modules Tab .................. ................................ .... 217
System Properties Dialog Box: Probes Tab......................................................... 218
System Properties Dialog Box: Options Tab ....... ................................ ................ 219
Waveform Properties Dialog Box ................................ ................................ .... 220
Automatic Measurements Reference
Automatic Measurements Reference Overview........................ ................................ ...... 221
Pulse Measurements
Pulse Amplitude Measurements........................................................................... 221
Pulse Timing Measurements......................... .................................. .................... 226
Pulse Area Measurements ........... ................................ ................................ ...... 229
Return-to-Zero (RZ) Measurements
RZ Amplitude Measurements ............................................................................. 230
RZ Timing Measurements ......... ................................ ................................ ........ 240
RZ Area Measurements .................................. ................................ .................. 244
Non-Return-to-Zero (NRZ) Measurements
NRZ Amplitude Measurements ... ... .. ... .. .. . .. .. . .. .. . .. .. . .. .. . .. .. . .. .. . .. .. . .. .. ... .. ... .. ... .. ... .. 244
NRZ Timing Measurements ............................................................................... 255
NRZ Area Measurements .................................................................................. 258
Reference Level Parameters and Calculation Methods
Reference Level Calculation Method- All Sources ..................................................... 258
Pulse Waveform Measurement Reference Levels..................... .................................. 259
RZ Waveform Measurement Reference Levels ......................................................... 262
NRZ Waveform Measurement Reference Levels ............................... ........................ 264
High/Low Level Tracking Algorithms ............ ................................ ............................ 267
Table of Contents
User Maintenance
Exterior Cleaning.............. .................................. ................................ ................ 269
Flat Panel Display Cleaning...... ................................ .................................. ............ 269
Optical Connector Cleaning.................................................................................... 270
Network Operations
Connect to a Network........................................................................................... 271
Print a Hard Copy ............................................................................................... 271
Save a Waveform to a File.................... .................................. ................................ 272
Run Other PC Applications..................................................................................... 272
Microsoft Windows Desktop Guidelines ..................................................................... 272
Index
DSA8300 Printable Online Help vii

Table of Contents
viii DSA8300 Printable Online Help

Welcom e DSA8300 Online Help
DSA8300 Online Help
Welcome to the Tektronix DSA8300 Digital Serial Analyzer Online Help.
New to the DSA
Start with the Getting Started topics for an overview of the instrument user interface, controls, and basic
signal acquisition and measurement operations.
8300?
Want to Know the Name of a User Interface Control Element?
Move your mouse pointer on most menu titles, toolbar buttons, and other control elements to show the
name of that element.
Need Context-Sensitive Help?
Click the Help button on instrument dialog boxes to open help for that dialog box. The dialog box help
may also h ave links to more in-depth information.
Looking for Something Specific?
Click the Index or Search tab and enter a keyword for which to search.
Need Some Extra Help?
If you cannot find the information that you are looking for in the online help, see if any of the Related
Documents (see page 1) have the information that you need. You can also contact Tektronix Technical
Support ) for help with operating your instrument.
Related Documents
DSA8300 Quick Start User Manual. This document includes installation, start up and other information to
get you up and running.
80E00 Electrical Module User Manual. This document describes the 80E01, 80E02, 80E03, 80E04, and
80E06 electrical sampling modules.
80E07, 80E08, 80E09, 80E10 Electrical Remote Module User Manual. This document describes the electrical
remote sampling modules.
80C00 Optical Module User Manual. This document describes the optical sampling modules.
80A02 EOS ESD Protection Module User Manual. This document describes the EOS ESD protection module.
DSA8300 Printable Online Help 1

Welcome Analysis and Connectivity Support Overview
80A03 TekConnect Probe Interface User Manual. This document describes the TekConnect probe interface
module.
80A05 Electrical Clock Recovery Module User Manual. This document describes the electrical clock
recovery module.
80N01 Module Extender User Manual. This document describes the module extender.
DSA8300 Pro
commands and other information related to controlling the instrument over the GPIB. Choose Programmer
Guide from the Help menu of the instrument application.
DSA8300 Specifications and Performance Verification Manual. This document includes the specifications
and performance verifications procedures for the DSA8300 mainframe and all modules available for
use with
Oscilloscope Analysis and Connectivity Made Easy. This document explores some options for getting data
from your instrument into any one of several available analysis tools.
grammer Manual. This online help system includes an alphabetical listing of the programming
the mainframe.
Analysis and Connectivity Support Overview
Several optional analysis and connectivity software applications are available that let you remotely control
the instrument and transfer data between the instrument and software-development and data-analysis tools.
You can use the analysis and connectivity software provided with this instrument to:
Gather instrument data (waveforms, measurements) and export it to analysis tools such as Microsoft
Excel, MathWorks' MATLAB, and MathSoft's Mathcad.
Interface with many software development environments, such as Microsoft Visual C++ and Visual
Basic, National Instruments' LabVIEW and LabWindows, and many Microsoft-Windows-compatible
development tools.
(see page 2).
Click the following software components to find out how to take advantage of the connectivity features
provided by your instrument:
The VXI Plug-and-Play Instrument Driver (see page 2)
VXI Plug-and-Play Instrument Driver
The VXI plug&play instrument driver is a collection of software components, organized according to
the standard VXI plug&play model e stablished by the VXI plug&play Systems Alliance.
TekVISA™ (see page 3)
2 DSA8300 Printable Online Help

Welcome Analysis and Connectivity Support Overview
TekVISA™
TekVISA is a library of industry-standard compliant software components, organized according to the
standard VISA model established by the VXIplug&play Systems Alliance. Use TekVISA software
to write interoperable instrument drivers to handle communicating between software applications
and your inst
TekVISA ActiveX Control (TVC) (see page 3)
rument.
TekVISA ActiveX Control (TVC)
The TekVISA Control (TVC) uses Microsoft Windows ActiveX control technology to simplify access
from Microsoft Office and Visual BASIC applications to TekVISA and the underlying instrument.
It does th
is compatible with Excel’s Visual BASIC for Applications, Visual BASIC 6.0, and other popular
programming environments for Microsoft Windows.
TekVISA Excel Toolbar (see page 3)
is by providing support f or key TekVISA features within an ActiveX control object that
TekVISA Excel Toolbar
The Te
waveforms to an Excel 2010 worksheet. Transfer is done using a toolbar that is integrated into Excel,
implemented using the TekVISA ActiveX Control (TVC) and the Visual BASIC for Applications
(VBA) macro editor built into Excel. Source code for the toolbar is accessible through Excel’s built-in
VBA editor. Access the source code to use as a tool for learning the TekVISA ActiveX Control, or
to cut-and-paste selected components to new VB applications.
VXI 11.2 LAN Server (see page 3)
kVISA Excel Toolbar allows direct, fast transfer of instrument measurements or captured
VXI 11.2 LAN Server
TheVXI11.2LANServerprovidessoftwareconnectivity between your instrument and remote
PCs over an Ethernet LAN. This tool is a client-side component built-in with TekVISA; on each
remote PC, you must install another copy of TekVISA to make use of its client-side component. The
VXI-11standard specifies a protocol for communication with devices over a network using a network
instrument server. This protocol uses the ONC/RPC (Open Network Computing/Remote Procedure
Call) standard that, in turn, is based on TCP/IP.
See Also:
Get A nalysis and Connectivity Software (see page 4)
DSA8300 Printable Online Help 3
Welcome Get Analysis and Connectivity Software
Get Analysis and Connectivity Software
The DSA8300 Product Software CD also includes the Analysis and Connectivity Software. By default, the
Analysis and Connectivity Software is installed when reinstalling the product software from the CD.
NOTE. You can
Microsoft Windows (see ReleaseNotes.pdf on the Product Software CD for installation details).
also install the Analysis and Connectivity Software on any personal computer running
For More Information
The Analysis and Connectivity Software installs a TekVISA folder to the Start > Programs menu.
This folder contains the following information:
The book Oscilloscope Analysis and Connectivity Made Easy (see page 4)
Oscilloscope Analysis and Connectivity Made Easy
This book describes how to use popular software development environments to build graphical user
interfaces to Tektronix Windows-based oscilloscopes. It includes examples of how to connect your
oscilloscope to the latest PC software tools for analyzing waveform and measurement data. The
exampl
Lab Windows, and LabVIEW.
This b
file with the software that ships with your oscilloscope.
The Release Notes
es use programming environments that include Excel VBA, Visual BASIC 6.0, MATLAB,
ook ships with appropriately equipped Tektronix oscilloscopes and may be available as a PDF
The TekVISA ActiveX Control API
The TekVISA Configuration tool
The TekVISA Programming Manual (see page 4)
TekVISA Programming Manual
This book describes the TekVISA operations, attributes, and events. It includes programming samples
using Microsoft Visual C++, and s ections that include VISA Data Type Assignments, Completion and
Error codes, and a g lossary.
This book is available from TekVISA installations and may be available as a PDF file with the
software that ships with your oscilloscope.
The TekVISA Quick Reference Card
Installing the VXI plug & play Instrument Driver
Programs menu. This folder provides the following information:
(see page 5) adds a VxiPnp folder to the Start >
4 DSA8300 Printable Online Help

Welcome Accessories, Options, and Software
Installing the VXI plu g & pla y Instrument Driver
The VXI plug&play driver is not installed by default, but the installation folder is. To install the driver:
1. Minimize the instrument application by clicking the minimize (-) button in the upper right corner
of the display.
2. Click the Window Explorer folder on the desktop.
3. From Explorer, find and open the folder C:\Program Files\Tektronix\VXIPNPInstall.
4. Double-cli
5. After installation, you will find the VXIplug&play Driver at C:\VXIpnp\WINNT\bin\tk-
tds8k_32.
6. To return the instrument application to the screen, click the DSA8300 button in the Windows
task bar a
The Tkds
The Tkdsa83 Samples
The uninstall for the Tkdsa83 Instrument Driver
ck setup.exe in this folder to install the VXI PnP driver.
dll
t the bottom of the screen.
a83 Help
Accessories, Options, and Software
Go to the Tektronix Web site (www.tek.com) for the most current DSA8300 instrument options, standard
options, optional accessories, application software, and product documentation.
DSA8300 Printable Online Help 5

Welcome Accessories, Options, and Software
6 DSA8300 Printable Online Help

Getting Started Getting Started Overview
Getting Started Overview
The following topics provide an introduction to the instrument operation, user interface, front panel
controls, and waveform operations.
Instrument Operation
Theory of Op
Signal Acquisition Process (see page 9)
eration
(see page 7)
User Interface
User Interface Overview (see page 11)
Application Screen (see page 12)
Graticules (see page 13)
Control from the Display (see page 14)
Popup Ke
yboard and Keypad
(see page 14)
Front Panel Controls
Channel Source Controls (see page 17)
Channel Select Controls (see page 17)
Vertical Controls (see page 18)
Timebase View Controls (see page 19)
Signal Acquisition Controls (see page 19)
zontal (Timebase) Controls
Hori
Trigger Controls (see page 21)
Utility Controls (see page 22)
Change Instrument Settings (see page 22)
Restore Default Instrument Setup (see page 23)
(see page 20)
aveform Operations
W
To Select and Display Waveforms (see page 23)
cquire and Display a Signal
A
Signal Conditioning and Scaling Overview (see page 26)
Math Waveforms O verview (see page 27)
Waveform Database Overview (see page 27)
Waveform Measurement Introduction (see page 28)
(see page 24)
Theory of Operation
The block diagram and text provides background information on the instrument theory of operation.
DSA8300 Printable Online Help 7

Getting Started Theory of Operation
The instrument contains five high-level subsystems or processe s, embodying a variety of hardware and
software functions:
Modular Sampling Specialization System. Allows selecting signal acquisition modules based on
the types of signals to acquire: electrical or optical; with clock recovery or without, with bandwidth
filter or not. Provides cost-effective solution for users needing very high bandwidth with superb time
resolution on repetitive waveforms. Sampling modules determine the size of the vertical acquisition
window for each channel.
Digital Signal Acquisition. Acquires a waveform record fr om each signal you apply to each channel
using the following subsystems:
Acquisition System. Sets vertical offset for the vertical acquisition window for each channel.
Performs the actual A/D (analog to digital) conversion and storing of digitized samples. Also
orms post A/D sample-based corrections to compensate for nonlinearities of various analog
perf
circuits.
ger System. Recognizes a specific event of interest on the input trigger or clock signal and
Trig
informs the Timebase that a trigger or clock event has occurred, gating the taking of a sample after
a controlled, incremental delay. The trigger event is time zero for the waveform record, which
means that all samples are displayed relative to this point.
There is no internal trigger pick off from the channels; rather, a trigger signal must be obtained
through the external trigger inputs, from the internal TDR clock, from the internal free-running
trigger, or from the clock recovery, when available from optical or accessory modules equipped
with clock recovery.
Timebase System. Tells the Acquisition system to take a sample at a specified time relative to the
trigger (or clock) event. In more general terms, synchronizes the capturing of digital samples in
the Acquisition system to the trigger (or clock) events generated from the Trigger system.
Signal Processing Transformation System. Performs a variety of transformations or operations,
such as waveform math operations, automatic measurements, and histogram gener ation, on the
channel waveforms.
8 DSA8300 Printable Online Help

Getting Started Signal Acquisition Process
Display, Input/Output, Storage Systems. Provides display control. Sets the vertical scale and
position of the display, which controls how much of the vertical acquisition window appears on screen.
Provides outp
User Interface and Waveform Display. Displays the instrument UI, waveforms, and software
controls. Al
ut (and sometimes input) of instrument-data elements in a form suitable to the user.
so provides a touch screen interface to the UI controls.
Signal Acquisition Process
The process flow diagram and text describe the signal acquisition steps.
DSA8300 Printable Online Help 9

Getting Started Signal Acquisition Process
1. The instrument starts in the idle state when powered on, after receiving most control setting changes,
or when finishing acquisition tasks.
2. When you toggle the RUN/STOP control to RUN, the instrument implements its setup based on
the current control settings (either the default settings or most recent setup, depending on user-set
preferences).
10 DSA8300 Printable Online Help

Getting Started User Interface Overview
3. The instrument then waits for a trigger. No sampling takes place until triggering criteria is met (Free
Run and TDR trigger sources generate their own internal trigger events). The instrument accepts
trigger.
4. The instrument then waits a delay time, that is, it delays taking a sample until a specified time
elapses, whe
Delay time = Horizontal Pos. + Ch. Deskew + N sample intervals
In the above calculation, N = Current sample count - 1
For example, if taking the 6th sample in the waveform record, 5 sample intervals are added.
5. The instrument takes one sample for each waveform record (c hannel) for each active (on) timebase.
This instrument samples sequentially, starting with the first waveform point and continuing to the last
waveform point. One sample is taken per trigger for each active channel in each displayed timebase.
6. If averaging or enveloping is on, each record becomes part of a multi-acquisition record that these
modes
until the number of acquisitions required for the current acquisition mode are acquired, and then
proces
7. If FrameScan mode is on, the acquisition process is modified. See FrameScan Theory of Operation
age
(see p
re:
(see page 37) produce. The process loops back to step 3 above to acquire additional records
sing continues as for step 8 below.
79) in the FrameScan Background topic for information on how FrameScan works.
8. The instrument stores the acquisition record in channel acquisition memory and makes it available for
rement of its parameters, display, output, and so on.
measu
9. The instrument then checks for user-spe cified stop condition and either returns to its idle state or
inues at step 3, according to what it finds.
cont
User Interface Overview
You have three ways of controlling the instrument:
Front Panel
The front-panel knobs and controls perform most basic vertical, horizontal, and triggering functions. See
the Front Panel Controls topics for more information on what each front-panel control does.
Mouse and Keyboard
Use the mouse and keyboard to access the complete functionality of the instrument. Your instrument
comes with a mouse and keyboard as standard accessories.
DSA8300 Printable Online Help 11

Getting Started Application Screen
Touchscreen Operation
You can control the graphical user interface using the built-in touchscreen. Push the TOUCH SCREEN
front panel button to enable and disable touchscreen operation.
Application Screen
The instrument application runs full screen, providing a variety of mouse, keyboard, or touchscreen
controls.
1. Toolbar: Access to key features, including the setup dialogs, acquisition modes, triggering modes,
and applications.
2. Menu Bar: Access to all instrument functions and configurations.
3. Status Bar: Trigger status, waveform count, and conditional acquisition status.
4. Readout Docking: Select to undock the readout area from the application to a separate window. You
can position the undocked readout window on a second monitor.
5. Readout Area: Displays waveform measurements. Use the arrow buttons at each end to scroll the
contents.
6. Readouts: Displays individual waveform measurement readouts grouped by type (measurements,
histogram, waveform, cursor, mask, and so on). Right-click on a readout to access readout display
and setup parameters.
12 DSA8300 Printable Online Help

Getting Started Graticules
7. Readout Display On/Off: Toggles on or off the display of readout groups (measurement, waveform,
and so on). This function does not turn off the measurement associated with the selected readout type,
only the displ
ay of that readout type.
8. Select Waveform and Instrument Settings: Quick access to select Channel, Math, and Reference
waveforms, a
s well as i nstrument vertical and horizontal values of the selected waveform.
9. Waveform Handles Area: Gray strip along the left edge of the graticule that displays selectors or
“handles” f
or active waveforms. Select a handle to do various operations, such as drag to adjust the
waveform vertical position.
10. Display:S
used to analyze them. Use the mouse to select waveforms, define a zoom area, and move cursors
and gates.
11. Measurements Bar : Quick access to the automated measurements by source signal-type and
measurement category. Select a signal type and category using the pulldown menus, and then click a
measurement button to add that measurement to the readouts a rea.
Graticules
Use the Display dialog box (Setup > Disp) to customize your graticule. There are four types of graticules
from which to select:
hows live, reference, and math waveforms, as well as cursors, masks, and other elements
Grid. This type of graticule display shows the outer edge of the graticule and a
dot-grid across the graticule, to help in making graticule measurements.
Crosshair. This type of graticule display shows the outer edge of the graticule and
X- and Y-axes, to help in making graticule measurements.
Full. A c ombination of Grid and Crosshair graticules.
Frame. This type of graticule display shows only a frame around the outer edges
of the graticule, so it is easy to see waveform detail.
xxx
DSA8300 Printable Online Help 13
Getting Started On-Screen Operations
On-Screen Operations
You can control much of this instrument directly from the waveform display area. Use the mouse (or your
finger or a stylus if using the touchscreen) in the waveform area to do the following operations:
Click and drag on a cursor to move it on the waveform.
Click and drag a waveform icon to change the vertical position of a waveform.
Click and drag a waveform ground reference to add offset to a channel.
Click and drag a waveform label or screen text to reposition it.
Click and drag across part of a waveform to select an area to zoom. Click the Zoom button to zoom in
on the selected area.
Click and drag an on-screen measurement gate to another horizontal position on the waveform.
Pop-Up Keyboard and Keypad
A pop-up keyboard or keypad button opens an on-screen keyboard or keypad. The pop-up keyboard
and keypad let you enter data when a keyboard is not attached to the instrument. Enter text and numbers
into the field from which you opened the keyboard or keypad.
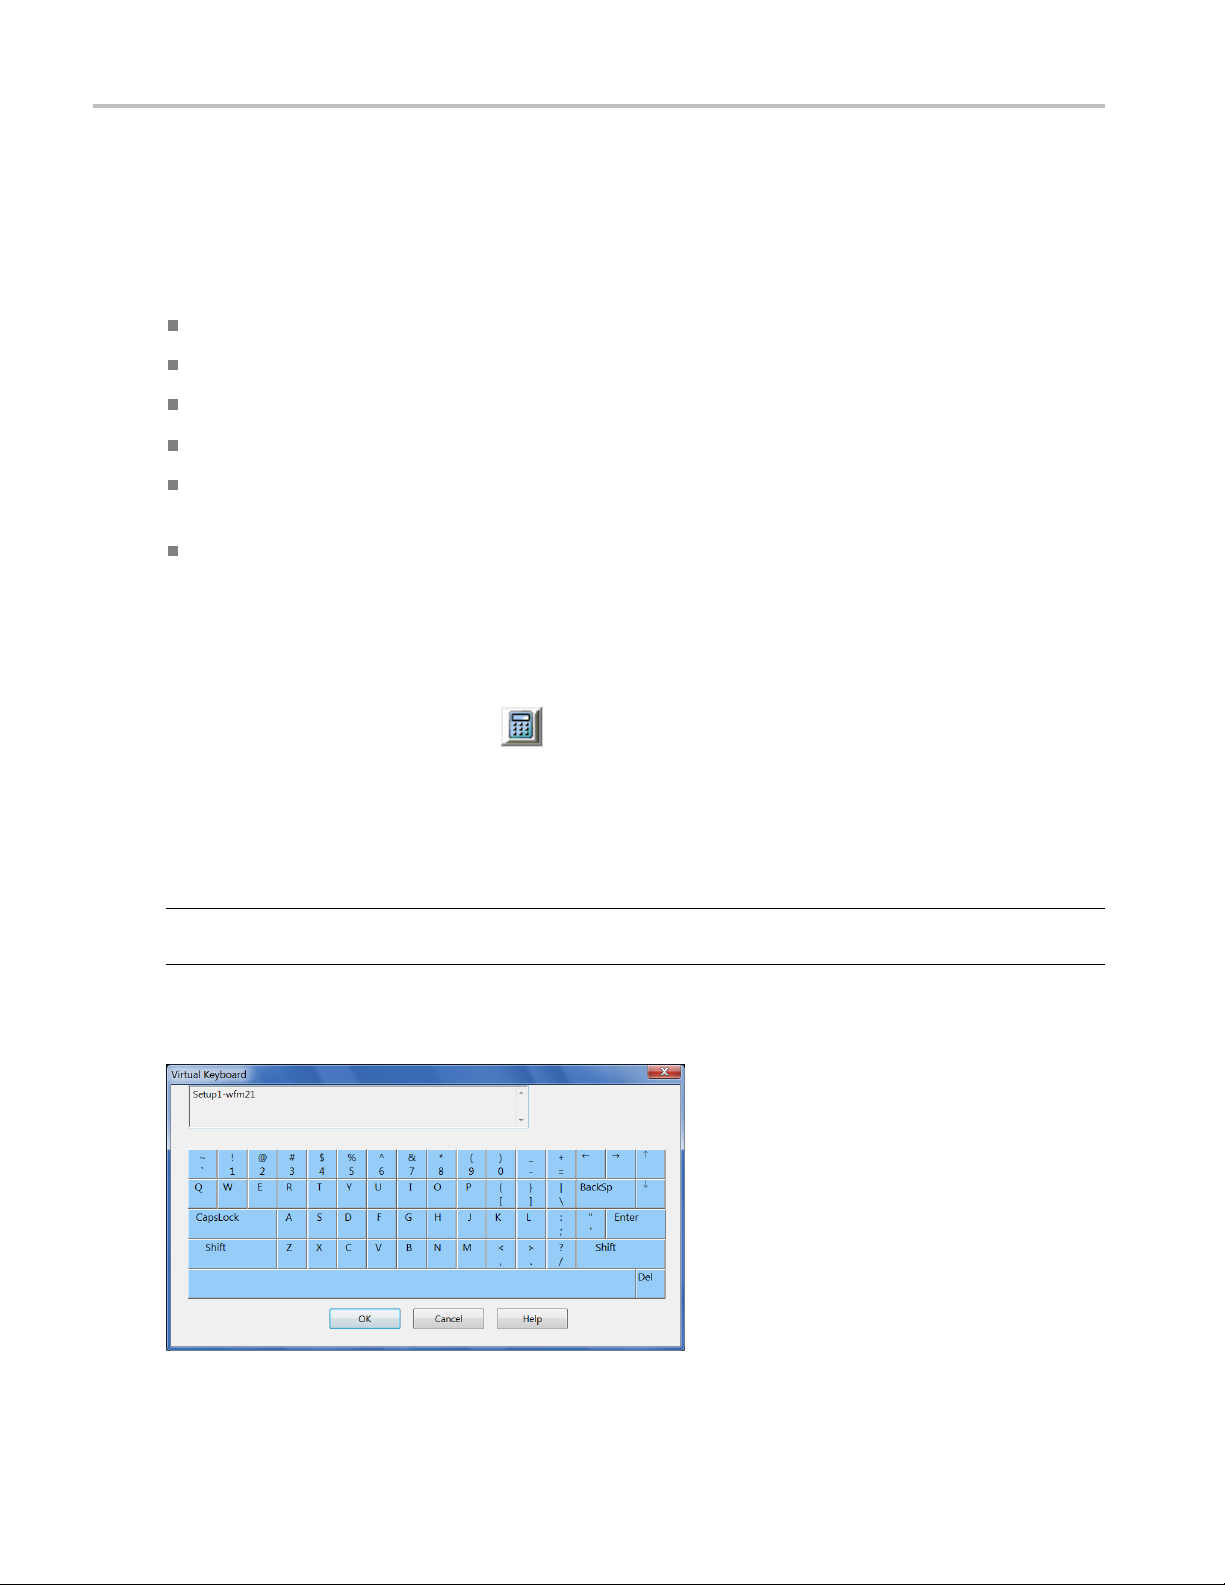
Pop-Up Keyboard
TIP. Use the Utilities > Preferences dialog box to select either a QWERTY Keyboard or Alphabetical
Keyboard keyboard display.
QWERTY Keyboard
14 DSA8300 Printable Online Help
Getting Started Pop-Up Keyboard and Keypad
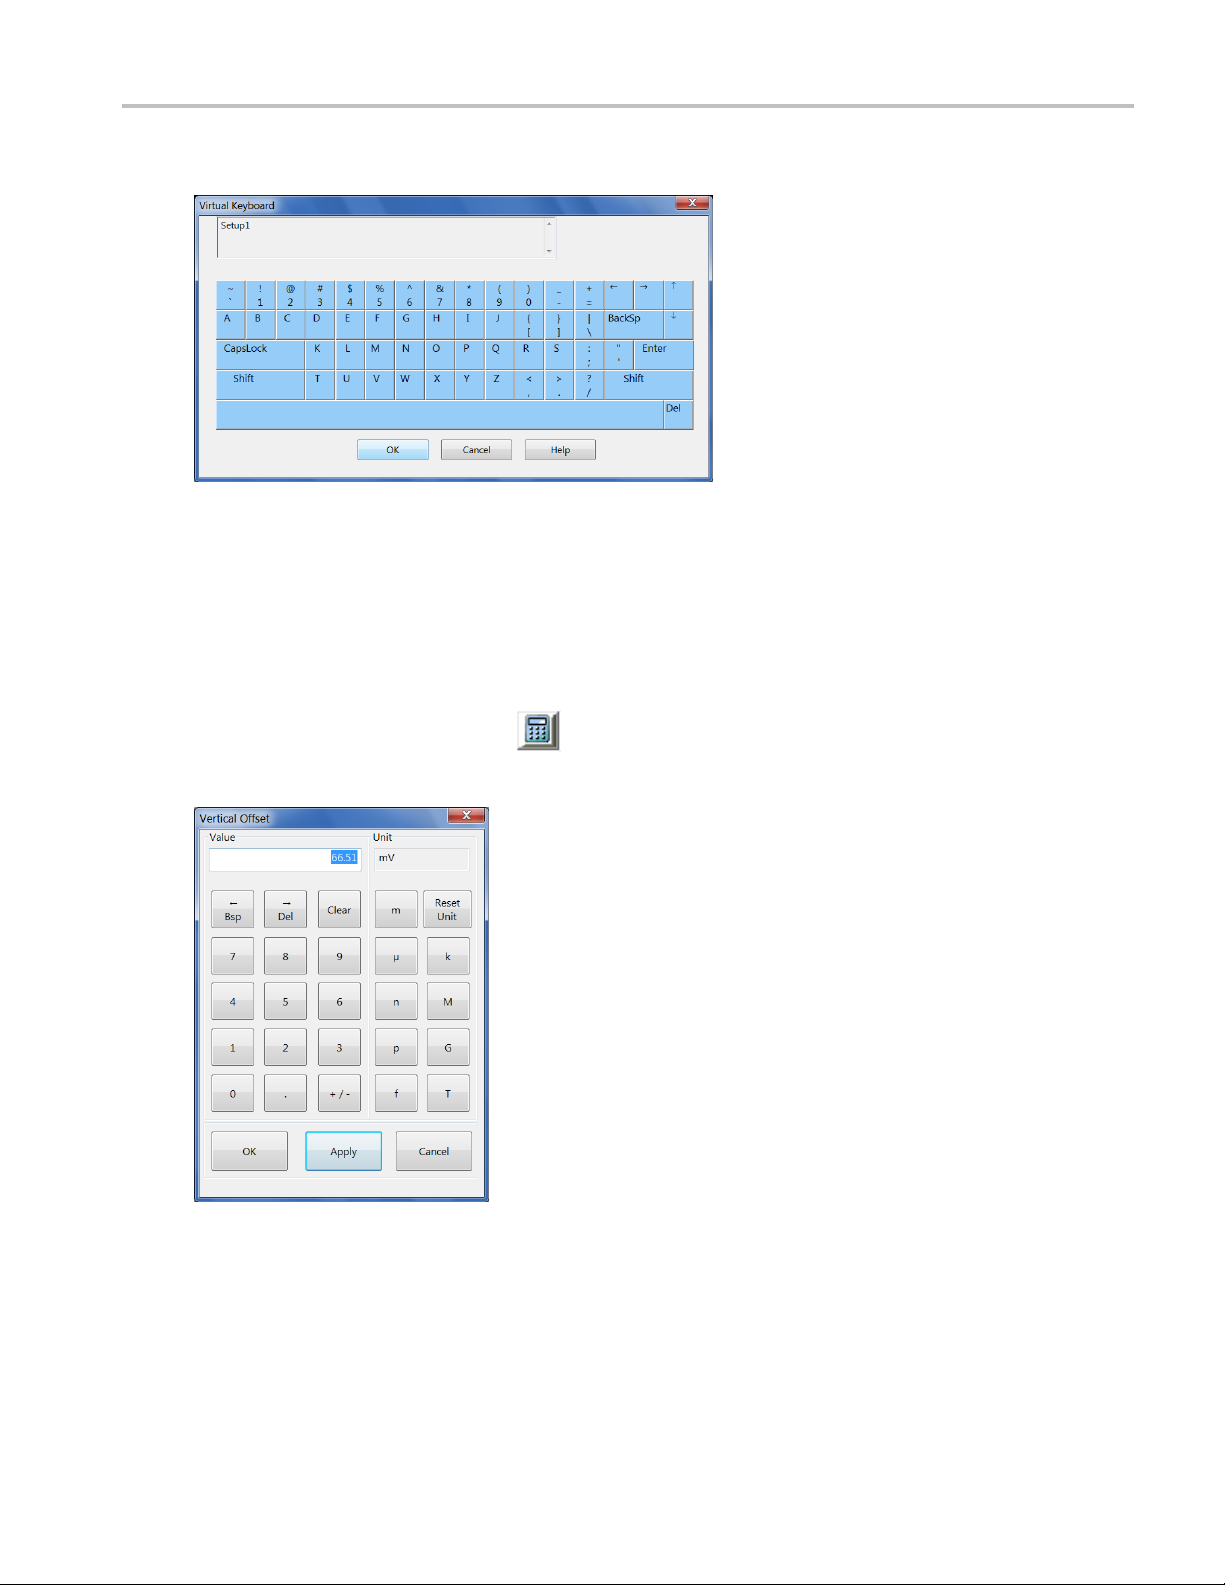
Alphabetical Keyboard
Pop-Up Keypad
Pop-up Keypad. Use the mouse or touchscreen to edit the value.
Pop-Up Keypad
Clicking the keyboard/keypad icon pops up the keypad for control fields that allow values to be
entered directly.
DSA8300 Printable Online Help 15

Getting Started Mouse and Touchscreen Operation Comparison
Mouse and Touchscreen Operation Comparison
This instrument ships with a mouse and keyboard to give you more options for instrument control.
However, for some installations, you might not have enough work space to install the mouse or keyboard.
For most oper
table lists mouse/touchscreen operation e quivalents.
Table 1: Comparison of mouse and touchscreen operations
ations, you can use the touchscreen to perform mouse-related operations. The following
Operation Using Mouse Using Touch
Select wav
Operate toolbar and dialog box
buttons
Display m
Select menu and list items
Move curs
zoom box
Open a context menu for a channel
or measurement readout
Enter a value in a field Click the keyboard icon associated with
Display a tool tip Position cursor on a main screen button
xxx
The i
eforms
enus
ors on screen, draw a
Click obje
Click and hold, move cursor
Right-c
the fiel
click the keys to enter alphanumeric
characters. Or use a keyboard if installed.
or readout
nstrument ships with two styluses. Using a stylus can make it easier to perform touchscreen
ct on screen
lick the item
d to open a virtual keyboard;
Touch (tap
Touch and
Touch and hold (do not move stylus)
Touch the keyboard icon associated
with the field to open a virtual
keyboa
alphanumeric characters.
Not available
screen
) object on screen
drag
rd; touch the keys to enter
operations.
16 DSA8300 Printable Online Help

Getting Started Channel Source Controls
Channel Source Controls
Use these buttons to select the waveform source (channel, math, or reference) before selecting a specific
waveform channel using the channel select controls
math or refer
ence waveforms are stored in memory, the instrument opens the Define Math or Recall
(see page 17). If you select MATH or REF, and no
Reference waveform dialog boxes, respectively.
CH sets the waveform source to be from an installed module.
MATH sets the waveform source to be from waveforms stored in math memory locations 1-8.
REF sets the waveform source to be from waveforms stored in reference locations 1-8.
xxx
Channel Select Controls
These b uttons enable display and selection of up to eight channels of waveforms per channel source
(CH, Ref, or Math).
1. Push a channel source button (see page 17) to select a channel source.
2. To turn on a channel, push an unlit button.
3. To select a channel, push a green lit button to turn it amber. The front-panel vertical controls
operate on selected (amber) channels.
4. To turn off a channel, push its button once if it is amber (already selected), or twice if it is green.
NOTE.
defined, the instrument opens the Define Math or Recall Reference dialog box.
xxx
If you select MATH or REF as a channel source, and no math or reference waveform is
DSA8300 Printable Online Help 17
Getting Started Vertical Controls
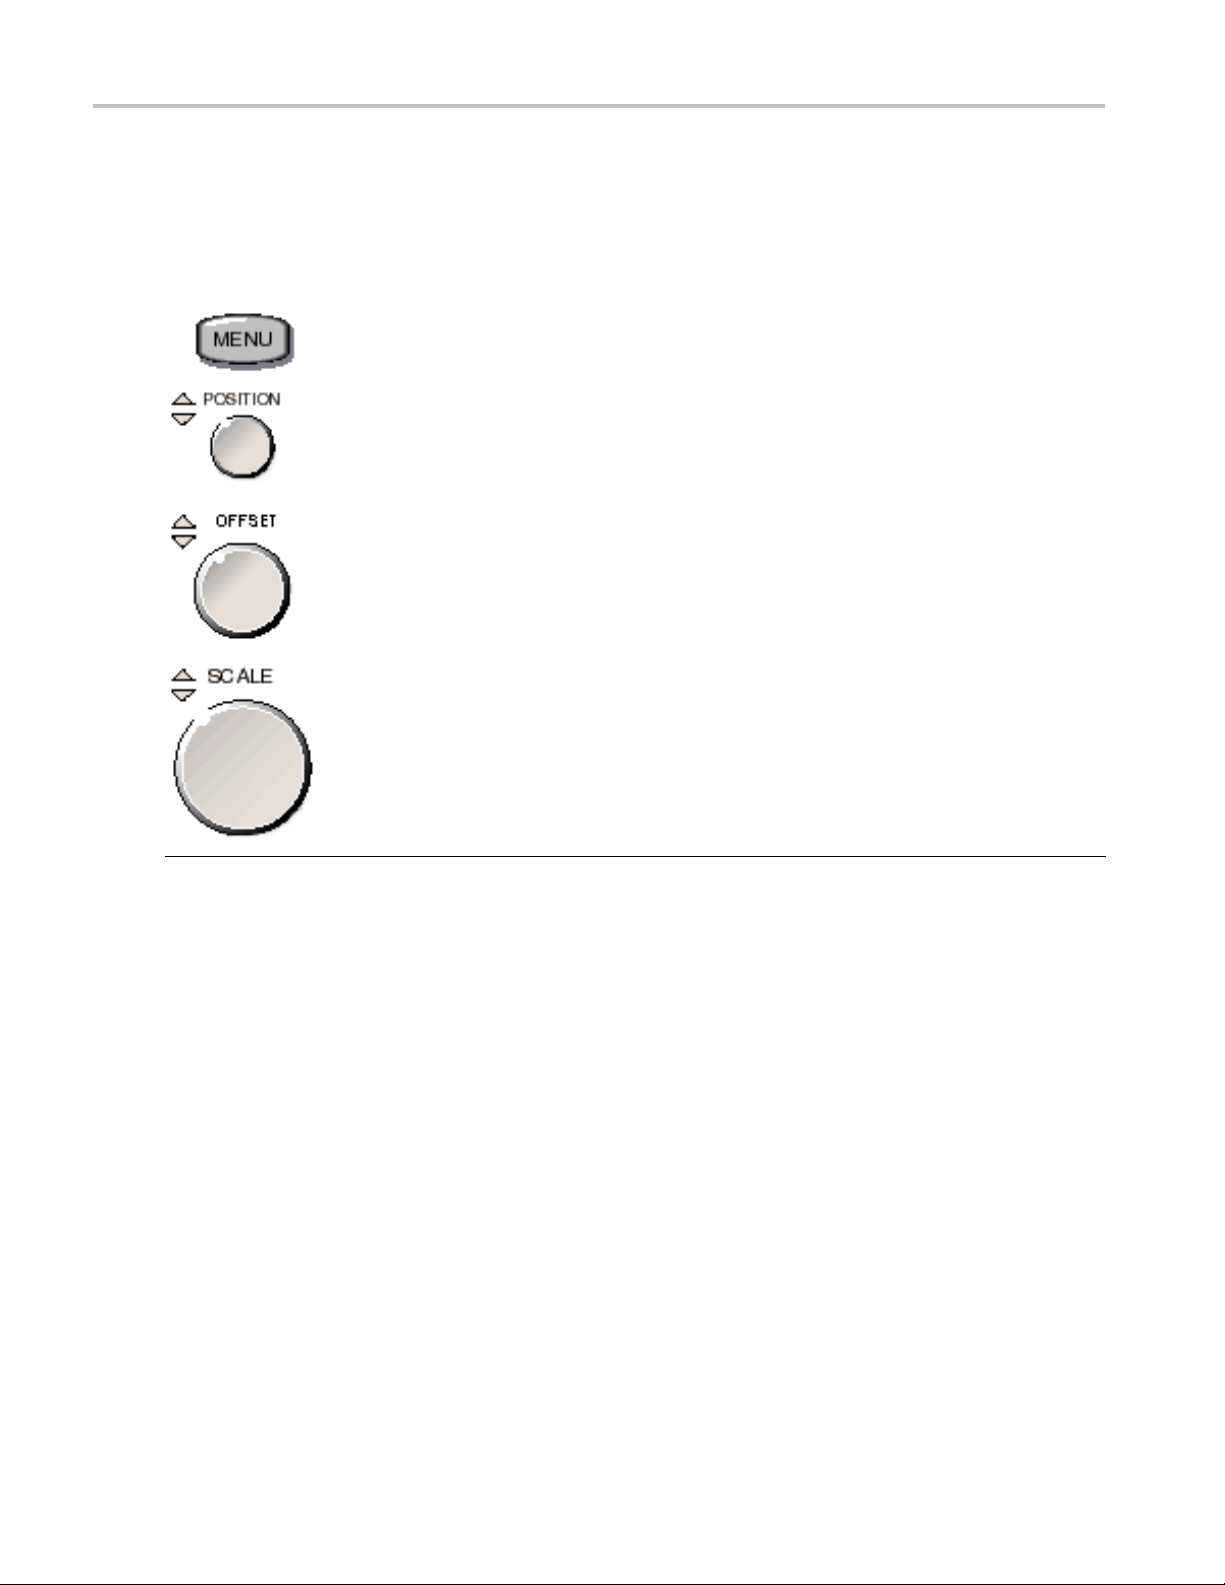
Vertical Controls
Use these controls to set the vertical attributes of a waveform.
MENU opens the Vertical Setup dialog box.
POSITION cha
OFFSET changes the vertical offset of the selected waveform.
SCALE changes the vertical scale of the selected waveform.
nges the vertical position of the selected waveform.
xxx
The Difference Between Vertical Position and Offset
Vertical position is a display function. Adjust the vertical position to place the waveforms where you want
to see them. The waveform baseline locations track adjustments made to their positions.
When you adjust vertical offset you see a similar effect, but it is actually quite different. Vertical offset
is applied at the module sampling circuit. Use vertical offset to change the effective dynamic range of
the inputs.
18 DSA8300 Printable Online Help
Getting Started Timebase View Controls
Timebase View Controls
Use these buttons to select a timebase view for acquisition and display of channel waveforms.
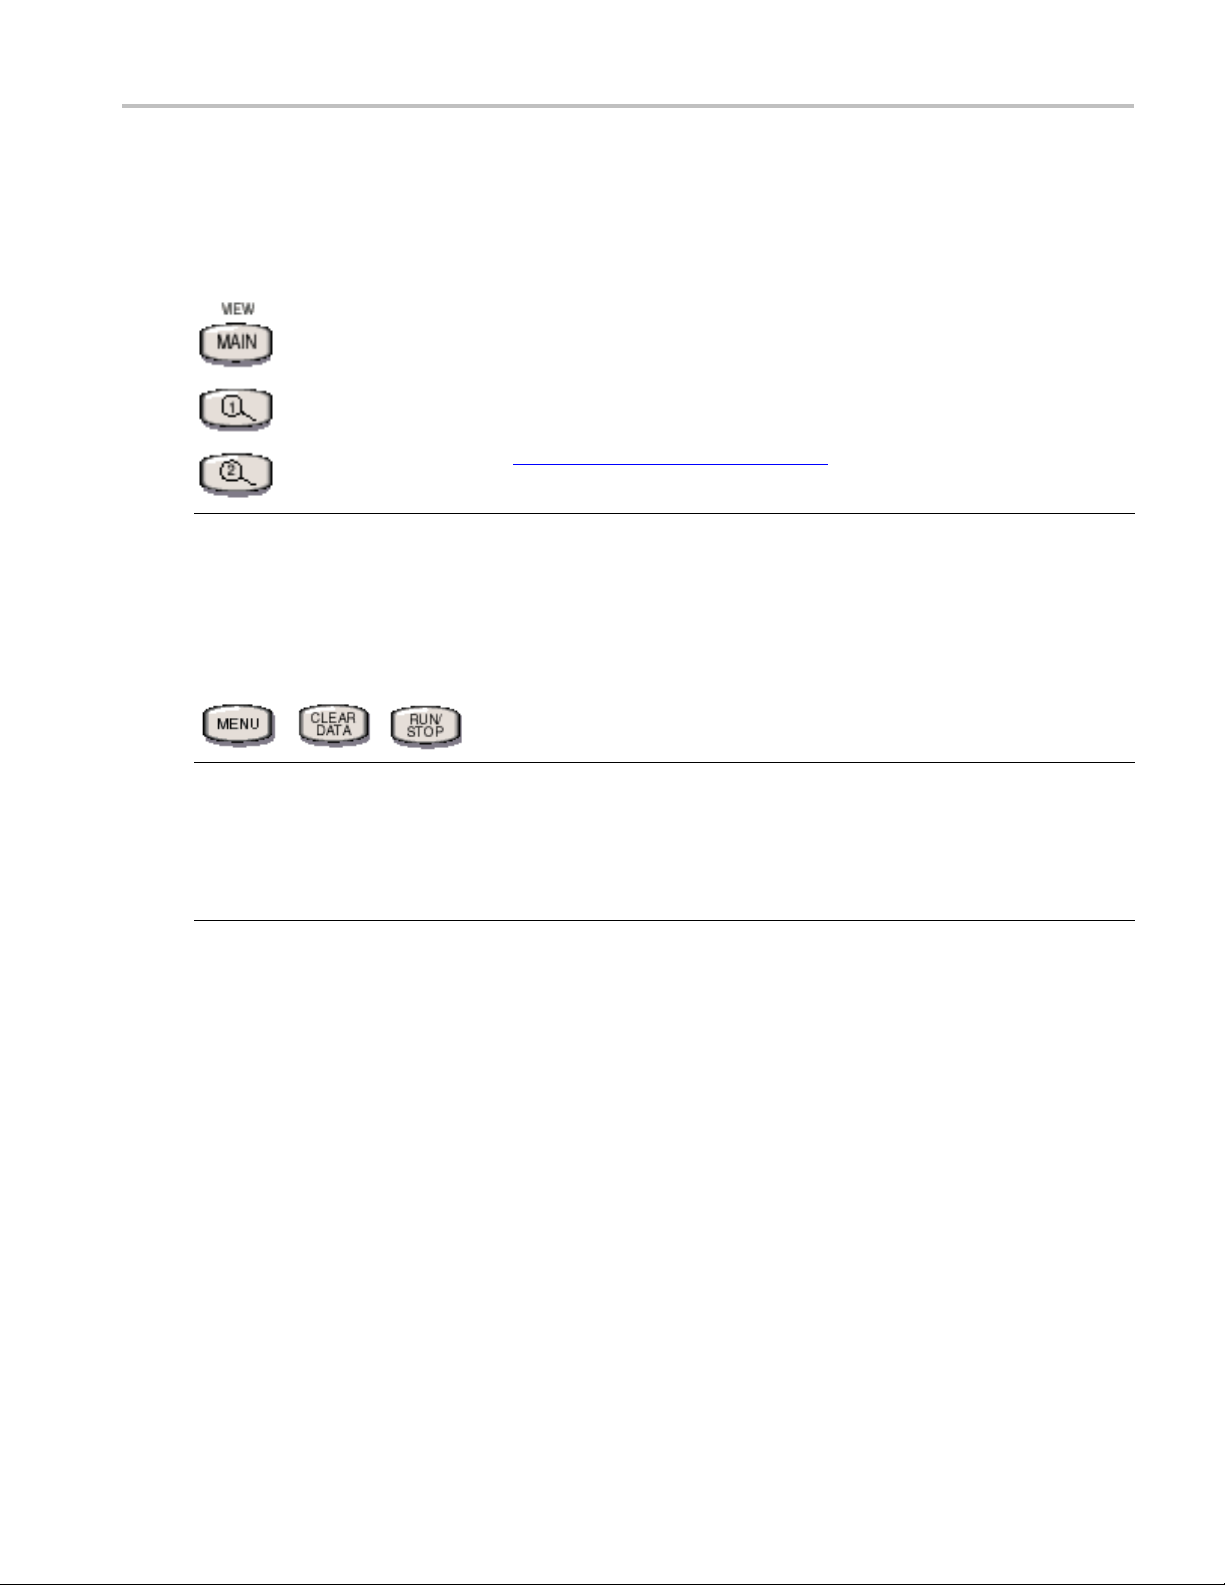
MAIN is the main instrument timebase acquisition and view mode. The instrument
always displays the Main timebase.
Mag1 and Mag2
The Mag1 and Mag2 views are not zoomed or interpolated versions of the Main
timebase: they each have an independent acquisition cycle. Waveforms defined in
themaintime
See Horizontal timebase selector
and setting multiple timebases.
xxx
are magnified views of a selected region of the main timebase view.
base are automatically defined and acquired in the magnified timebases.
(see page 64) for more information on selecting
Acquisition Controls
Use these buttons for quick access to the signal acquisition controls.
MENU displays the Acquisition Setup dialog box.
CLEAR DATA clears all previously acquired data. This includes live data, waveform databases, display persistence data,
mask cou
re-synchronization of the timebase to clock source and frequency changes.
RUN/STOP turns on and off the instrument signal acquisition. Use this button as you would the RUN/STOP button in the
toolba
xxx
nt data, histogram data, and measurement statistics. When using clock trigger sources, is also used to force
r.
DSA8300 Printable Online Help 19

Getting Started Horizontal (Timebase) Controls
Horizontal (Timebase) Controls
Use these controls to set the instrument horizontal timebase parameters.
MENU displays the Horizontal Setup dialog box.
POSITION inc
RESOLUTION increases or decreases the sample density (resolution) of all live
waveforms in the selected timebase.
SCALE incre
waveform.
reases or decreases the horizontal position of the selected waveform.
ases or decreases the horizontal timebase scale of the selected
xxx
20 DSA8300 Printable Online Help

Getting Started Trigger Controls
Trigger Controls
Use these controls to set trigger level and access other trigger controls on screen.
MENU displays the Trigger Setup dialog box.
LEVEL increa
trigger source.
READY indicates that the instrument is ready (waiting) to trigger.
TRIG'D indi
SET TO 50% sets the trigger level to 50% of the signal amplitude present on the
Trigger Direct Input connector.
xxx
ses or decreases the trigger level setting for the Trigger Direct Input
cates that the instrument has triggered on a waveform.
DSA8300 Printable Online Help 21

Getting Started Utility Controls
Utility Controls
The Utility controls give you convenient access to several features and utilities.
xxx
SETUP DIAL
PRINT sends the display image to a printer or to an image file.
DEFAULT SETUP loads the factory default instrument settings. See To Restore the Default Instrument
Setup (see page 23)
FINE toggles the General Purpose Knob between fine and coarse adjustments.
OGS displays the Setup dialog boxes.
To C
TOUCH SCREEN toggles the touchscreen on and off.
AUTOSET performs a signal autoset operation.
CURSORS cycles through and enables the following cursor types: vertical bars, horizontal bars,
waveform, and off.
SELECT toggles the selected cursor.
al Purpose Knob adjusts values or advances through selections for controls that do not have a
Gener
dedicated front-panel knob.
hange Instrument Settings
can enter or change instrument parameter values several different ways:
You
Use a keyboard or keypad (external or on-screen) to enter a specificvalueinafield.
Touch or click the increment/decrement buttons on a field to change to the next standard value.
Touch or click a control or input field and use the general-purpose k nob to scroll through available
settings or increment numeric values. See Utility Controls
(see page 22).
22 DSA8300 Printable Online Help

Getting Started To Restore Default Instrument Setup
To Restore Default Instrument Setup
To quickly restore the instrument to its default (factory) settings, push the DEFAULT SETUP front-panel
button. Click Ye s in the confirmation dialog box. Restoring the instrument to a known s tate is useful
when acquiri
instrument configuration.
ng a new signal, or multiple people use the instrument, and you do not know the current
After you co
it to your next task. This may be especially important if you share the instrument with others; previous
settings may make it difficult for you to do what you need to do.
mplete a task using your instrument, you may want to initialize the settings before you apply
To Select and Display Waveforms
From Front Panel Controls
To use the front panel to select and display available waveforms:
1. Select the signal source from the Vertical section of the front panel:
CH to di
MATH to display a math waveform
REF to display a stored reference waveform
2. Push the numbered button (1-8) corresponding to the waveform channel to display.
For example, to display channel waveform 6, push front-panel buttons CH and 6.
splay a live signal channel waveform
NOTE. If you have no math or reference waveforms defined when you push MATH or REF, the instrument
opens the Define Math dialog box or Recall Waveform dialog box.
om Setup Dialog Box Display Controls
Fr
Use the controls in the Setup > Vertical or Setup > TDR dialog boxes to display a waveform.
OTE. Selecting a channel in the TDR dialog box enables the TDR mode for that module.
N
DSA8300 Printable Online Help 23

Getting Started Data Acquisition Introduction
From the User Interface
Click the Select Waveform button ( lower
left of UI) to display a list of all available waveforms
(channel, reference, and math). Waveforms that are on,
but not selected, have a check mark next to their name
(C1 shown left). Selected waveforms have a triangle
next to their name (C5 shown).
Use the menu to select the waveform you want to make
active (selected) (example shows M1 being selected).
xxx
Data Acquisition Introduction
Before you can take signal measurements you must set the instrume nt to acquire and display a signal. The
first topic below provides an overview of how to acquire and display a live signal. The remaining topics
provide more detailed information on signal and data acquisition.
Data Acquisition Topics:
Data Acquisition Introduction (see page 24)
Acquire and Display a Signal (see page 24)
Signal Conditioning and Scaling (see page 26)
Trigger Background (see page 133)
Mode/Trigger Setup Dialog Box Overview (see page 121)
Math Waveforms Overview (see page 27)
Waveform Databases Overview (see page 27)
Waveform Measurement Introduction (see page 28)
Acquire and Display a S ignal
The following procedure describes the basic steps to acquire and display a signal. Your signal type may
require additional or different settings.
1. Connect the device under test (DUT) signals to the sampling modules. If using an external trigger
signal, connect the trigger signal to the CLOCK INPUT/PRESCALE TRIGGER or TRIGGER
DIRECT INPUT connectors on the front panel.
24 DSA8300 Printable Online Help

Getting Started Acquire and Display a Signal
CAUTION. Sampling modules are very sensitive to ESD. Follow static-safe procedures and cautions as
outlined in the sampling module user manual. Discharge electrical cable conductors before connecting
to modules or the instrument.
Sampling modules are very sensitive to overdriven signals. Do not overdrive instrument or module inputs.
2. Push the front panel CH button.
3. Push the front panel 1 through 8 button to select the module signal source. Repeated button pushing
cycles through the source settings. The button color indicates the source status:
Amber: The signal source is selected. Measurements are done on the selected source.
Green: The signal source is displayed but not selected.
No color
4. Push the front-panel Trigger MENU button to open the Mode/Trigger dialog box.
5. Select a trigger source (Clock, TDR, Direct, or Free Run). Free Run auto-triggers the instrument and
displays a non-synchronized waveform as a quick way to view signal presence.
6. From the menu bar, select Utilities > Autoset Properties and choose the Autoset Mode that matches
your intended autoset result. Close the dialog.
7. If using the Clock Input/Prescale Trigger connector as the trigger source, select one of the available
Scope Modes appropriate for your signal (Eye, Pattern, or Other). Pattern is available only if
nced Trigger (Option ADVTRIG ) has been purchased and installed.
Adva
8. Push the front-panel AUTOSET button (or click the Autoset button in the toolbar). The instrument
plays the waveform.
dis
: The signal source is off.
See Also:
Data Acquisition Introduction (see page 24)
Signal Conditioning and Scaling (see page 26)
Trigger Background (see page 133)
Mode/Trigger Setup Dialog Box Overview (see page 121)
Math Waveforms O verview (see page 27)
Waveform Databases Overview (see page 27)
Waveform Measurement Introduction (see page 28)
DSA8300 Printable Online Help 25

Getting Started Signal Conditioning and Scaling Overview
Signal Conditioning and Scaling Overview
Use signal conditioning and scaling controls to ensure that the instrument acquires the data that you
want to display, measure, or otherwise process.
To Use
Use the fron
screen position.
Use the fro
position of all waveforms.
Push the V
functions.
To ensur
e the best possible data for further processing, do the following:
Set vertical scale to adjust the waveform size on screen. You can set vertical offset to shift the
al acquisition window up or down on the signal to capture the part you want. The center of the
vertic
module's analog input dynamic range is shown by the channel's waveform handle in the waveform
handle region to the left of the graticule. For best results, u se the vertical offset control to center the
waveform around the waveform handle and then use vertical position control to graphically move the
waveformupanddowninthegraticule.
Set horizontal scale to control the time duration of the horizontal acquisition window to capture as
much as you want of the input signal(s). To control where in the input signal (data stream) that the
horizontal acquisition window acquires, you set horizontal position to delay the window relative to
igger to capture the waveform part you want. To increase or decrease the resolution between
atr
sample points, change the record length.
t-panel VERTICAL knobs to adjust the selected waveform vertical size, offset, and
nt-panel HORIZONTAL knobs to adjust the horizontal size, resolution, and screen
ertical or Horizontal front-panel MENU buttons to open the setup dialog boxes for those
See Also:
Data Acquisition Introduction (see page 24)
Acquire and Display a Signal (see page 24)
Vertical Setup Dialog Box Overview (see page 139)
Horizontal Setup Dialog Box Overview (see page 62)
The Vertical Command Group and Horizontal Command Group sections in the DSA8300 Programmers
Guide (accessed from the instrument Help menu)
26 DSA8300 Printable Online Help

Getting Started Math Waveforms Overview
Math Waveforms Overview
You can create up to eight math waveforms to support the analysis of your channel and reference
waveforms. By combining and transforming source waveforms and other data into math waveforms, you
can derive th
Mathematical operations on one or several waveforms or measurements: add, subtract, multiply,
and divide.
Function transforms of waveforms, such as integrating, differentiating, and so on.
Use the Define Math dialog box to create a math waveform expression. You can apply numerical constants,
math operators, and functions to operands (which can be channel, waveforms, reference waveforms,
measurem
much like you can the channel and reference waveforms.
See Also:
Define Math Dialog Box Overview (see page 181)
Math Waveforms Background (see page 191)
e data view that your application requires. You can create math waveforms that result from:
ent scalars, or fixed scalars). You can display and manipulate these derived math waveforms
The Math Command Group sectionintheDSA8300 Programmers Guide (accessed from the instrument
Help menu)
Data Acquisition Introduction
(see page 24)
Waveform Database Overview
Use waveform databases for measurements, histogram calculations, mask testing, and generating a
density-style, graded display. Waveform databases may be automatically allocated for measurements,
histograms, and mask testing.
In general, use the Wfm Database Setup dialog box to assign the four databases supported by the
instrument to live (channel and math) waveform sources. Also, certain measurements require the uses
f a waveform database and, when turned on, they will automatically set the measurement system to
o
use a waveform database if available.
See Also:
Waveform Database Background (see page 167)
Wfm Database Setup Dialog Box Overview (see page 162)
The Waveform Database Command Group sectionintheDSA8300 Programmers Guide (accessed from
the instrument Help menu)
Data Acquisition Introduction
(see page 24)
DSA8300 Printable Online Help 27

Getting Started Waveform Measurement Introduction
Waveform Measurement Introduction
This instrument offers several tools for measuring and characterizing waveform data. Measurement
tools include:
Automatic Measurements (see page 28)
Cursors (see page 29)
Histograms (see page 31)
Masks (see page 31)
Optimize Measurement Accuracy (see page 32)
Automatic Measurements
Auto measurements provide automatic extraction of various waveform parameters. Automated
measurements quickly give you immediate, continuously updating measurement results such as rise time
or extinction ratio. You can also display statistics on how the measurement results vary over time.
Most automatic measurements require both a source selection and a measurement selection. To quickly
select a measurement, use the measurement toolbar to first set the signal type (NRZ, RZ, or Pulse), and
then select a category (Amplitude, Timing, or Area) in the pulldown lists of the toolbar. Then click the
icon of the measurement that you want to use to measure the selected
and drop the icon on any displayed waveform, selected or not, to measure that waveform). The results
are shown in the measurements readout at the bottom of the screen.
(see page 28) waveform (or drag
Waveforms: Selecting and Selected
The selected waveform is the one that responds when you adjust vertical (rotate the vertical position
knob, for example) and other controls. You select waveforms in various ways:
Click the waveform on screen
Push the waveform selector buttons (Ch, Ref, Math, and 1-8)
Select from the waveform selection menu on the control toolbar at bottom of screen
Some features and requirements of the automatic measurement system follow:
This instrument supports up to eight simultaneously displayed m easurements.
If the waveform parameter that is to be automatically measured cannot be acquired (incorrect control
setup, out-of-range input signals), the instrument displays the indicator “???”. For example, if the
instrument acquires less than a full waveform cycle, it cannot measure frequency or period, and,
therefore, it displays “???”.
28 DSA8300 Printable Online Help

Getting Started Cursors
Except for Average Optical Power, all RZ and NRZ measurements must be performed on a waveform
database.
The Average Optical Power measurement cannot use a waveform database as its source. The Average
Optical Power measurement cannot display Annotations and cannot use gates or user-defined
High/Low met
hod.
See Also:
Automatic Measurements Overview (see page 100)
Measure Setup Dialog Box Overview (see page 91)
Automatic Measurements Reference Overview (see page 221)
The Measurement Command Group sectionintheDSA8300 Programmers Guide (accessed from the
instrument Help menu).
Cursors
Use cursors to measure amplitude and time, distance, or bits quickly and with more accuracy than when
using the graticule to take measurements. Because you position cursors wherever you want on the
orm, they are easier to localize to a waveform segment or feature than automatic measurements.
wavef
The following table summarizes each cursor type.
Cursor Type and readout
Description
Horizontal cursors measure
amplitude (volts, watts, ohms, rho).
Each cursor measures with respect
to:
v1 = Level at Cursor 1 with respect
to its source ground level
v2 = Level at Cursor 2 with respect
to its source ground level
Δv = Level at Cursor 2 - Level at
Cursor 1
Level is cursor displacement from
the source ground times the source
scale (volts/div, watts/div, ohms/div, or
rho/div). N ote that the two cursors may
have different sources and therefore
can have different volts/div settings.
Cursor readout
DSA8300 Printable Online Help 29

Getting Started Cursors
Vertical cursors measure horizontal
displacement
or distance in meters, feet, or inches).
Each cursor measures with respect to:
t1 = Time or distance at Cursor 1
with respect t
(time in seconds or bits
o the trigger point
xxx
To Enable Cursors
t2 = Time or di
with respect to the trigger point
Δt = Time or distance at Cursor 2 -
Time or distance at Cursor 1
Time is divi
the cursor from its source trigger point
times the source time/div. Note that the
two cursor
and, therefore, can have different time
base ( Main, Mag1, Mag2) settings.
Waveform cursors measure both
amplitud
effect, both a vertical and horizontal
cursor. As you set the horizontal
positio
the time with respect to the trigger
point and the vertical level of the
corresp
cannot move these cursors off the
waveform.
Note th
different source, and, therefore, can
have different vertical and horizontal
scale s
s may have different sources
e and time. Each cursor is, in
n of each cursor, it measures
onding waveform point. You
at each cursor can have a
ettings.
stance at Cursor 2
sions of displacement of
If cursors are off, first select (see page 28) the waveform on screen that you want to measure, then push the
Cursors front-panel button:
Once for vertical bar cursors
Twice for horizontal bar cursors
Three times for waveform cursors
Use the General-Purpose knob to adjust the cursors and the SELECT button to toggle control between the
cursors. (You can also use the mouse to adjust the cursors.) Examine the cursor readout for measurement
results.
See Also:
Cursor Background (see page 43)
30 DSA8300 Printable Online Help

Getting Started Histograms
Cursor Setup Dialog Box Overview (see page 41)
The Cursor Command Group sectionintheDSA8300 Programmers Guide (accessed from the instrument
Help menu).
Histograms
Use histograms to analyze a range of waveform data that you select. The instrument can display both
vertical (voltage, watts, ohms, or rho) and horizontal (time, distance, or bits) histograms, but only one at a
time.
You can use the controls in the Histogram Setup dialog box to completely specify the histogram box on
the waveform, in waveform units or as a percent of the graticule. After creating the histogram box,
you can use the same method to resize and reposition the box directly on the screen, or, for quick edits,
you can use the mouse or touchscreen to drag the histogram box boundaries on screen to surround the
data that you want to analyze.
See Also:
Histogram Background (see page 60)
Histograms Setup Dialog Box Overview (see page 56)
The Histogram Command Group section in the DSA8300 Programmers Guide (accessed from the
instrument Help menu).
Masks
Use mask testing to test your waveforms for time or amplitude violations. Mask testing detects waveform
samples that occur within a specific area o f the mask. These occurrences are called hits or violations.
Use the communications-standard masks that this instrument provides (SONET/SDH, Fibre Channel
Optical and Electrical, Ethernet, and others) to test your signals, or you can define your own masks.
Use the Mask setup dialog box to specify your mask test. In general, you will choose a live waveform
source (channel or math waveform), and then select a standard mask against which to test it. To completely
specify a mask test, read the information sources below.
See Also:
Mask Setup Dialog Box Overview (see page 81)
Mask Edit Dialog Box (see page 87)
The Masks Command Group sectionintheDSA8300 Programmers Guide (accessed from the instrument
Help menu)
DSA8300 Printable Online Help 31

Getting Started Optimize Measurement Accuracy
Optimize Measurement Accuracy
Compensation optimizes the instrument to make accurate measurements based on the ambient temperature.
Select Utilities > Compensation to open the Compensation dialog box.
Guidelines
Instrument
given that the instrument has appropriate compensation data within the current operating temperature
limits.
NOTE. A soft reboot of the instrument resets the 20-minute power-on monitoring time even though the
instrument has not been physically powered off.
Always run compensation when first installing a sampling module(s) or after moving a sampling
module from one compartment to another. You can run a compensation within the 20-minute warm-up
time. However, the compensation status (as displayed in the compensation dialog) displays a
“warmwhich the last compensation was performed is within limits of the current operating temperature, the
status displays okay (or Pass).
You must save the compensation results or they will be lost when the instrument is powered down.
You c
you when the instrument or its modules require calibration and/or compensation, or when they are
warming up.
specifications are guaranteed after the instrument has been powered-on for 20 minutes,
up” status until the 20-minute warm-up time has elapsed. At that time, if the temperature at
an set the instrument to d isplay the Compensation Indicator Button on screen, which tells
See Also:
System Compensation Dialog Box Overview (see page 202)
The Compensation Command Group section in the DSA8300 Programmers Guide (accessed from the
instrument Help menu)
32 DSA8300 Printable Online Help

Controls-Specific Help Acquisition Setup Dialog Box Overview
Acquisition Setup Dialog Box Overview
Use this dialog box to set up the acquisition modes.
Key Features:
Set acquisition mode (sample, average, or envelope)
Set stop after event condition
Set stop action the system takes upon completing acquisition
xxx
TIP. You can manually start and stop acquisition at any time by clicking the Run/Stop button in the toolbar
or by pushing the front-panel Run/Stop button.
Control Information:
Acquisition Mode Settings (see page 33)
Acquisition Stop After Settings (see page 34)
Acquisition Stop Action Settings (see page 36)
Acquisition Mode Settings
Access this set of controls from the Acquisition Setup dialog box (Setup > Acquire).
DSA8300 Printable Online Help 33

Controls-Specific Help Acquisition Stop After Settings
The acquisition mode you choose globally affects all channel acquisitions; for example, you cannot set
channel 1 to Sample mode and channel 2 to Average mode.
Sample. No post processing of acquired samples. Use Samplemodetoseethesignalinitspurestform
with no post processing.
Average. The instrument processes the number of wavefor ms you specify into the acquired waveform,
creating a running exponential average of the input signal. The instrument displays a point-wise running
average o
to reduce the uncorrelated noise and jitter in the signal to reveal fundamental waveform behavior.
f the n most recently completed waveform acquisitions, where you specify n. Use Average mode
Envelope. Continuous acquisition; the instrument retains the running minimum (Min) and maximum
(Max) values in adjacent sample intervals, creating an “envelope” of all waveforms acquired for that
channel. You ca nnot select this mode if FrameScan is enabled (Setup > Mode/Trigger > Pattern
FrameScan Setup). Use Envelope mode to show the variationofextremesovertimeinawaveform.
Sync/
To average or envelope an individual waveform, use the Average or Min and Max functions to create a
waveform specific to the waveform you want to average or envelop. Click here
math
more information on creating math waveforms.
See Also:
Acquisition Stop After Settings (see page 34)
Acquisition Stop Action Settings (see page 36)
Acquisition Stop After Settings
(see page 181) to find
Use this control to specify when you want the instrument to stop acquisition. You may set only one
active Stop After condition at a time.
34 DSA8300 Printable Online Help

Controls-Specific Help Acquisition Stop After Settings
Regardless of the Stop After condition selected, you can always stop acquisition with the RUN/STOP
button from the front panel or toolbar.
Run/Stop Button Only. Sets the instrument to stop the acquisition only when you click the Run/Stop button
in the toolbar or push the RUN/STOP button on the front panel.
Condition. Sets the instrument to automatically stop acquisition after the selected condition is achieved.
Available stop after conditions are:
Number of Acquisitions: Sets the instrument to stop acquiring after some specified number of raw
acquisition cycles. This setting tells the instrument to count the number of Main Timebase sweeps
(Mag sweep
Averag e C o mplete : Sets the instrument to stop acquisition after the specified number of waveforms
to be aver
Histogram Waveforms: Sets the instrument to stop acquisition after a specified number of Histogram
source w
Histogram Hits: Sets the instrument to stop acquisition after it acquires a specified number of valid
hits (t
s are not counted) and stop acquisition after the specified number of acquisitions.
aged is acquired.
aveforms is acquired.
hat is, nonnull samples) in the histogram region.
Mask Waveforms: Sets the instrument to stop acquisition after a specified number of waveforms is
red of the Mask source waveform.
acqui
Mask Samples: Sets the instrument to stop acquisition after a specified number of valid (that is,
ull) waveform samples are acquired of the Mask source waveform.
nonn
Mask (n) Hits: Sets the instrument to stop acquisition after a specified number of mask hits occur in
k number (n). This is a ≥ condition.
mas
Mask Total Hits: Sets the instrument to stop acquisition after a specified number of total mask hits
curs in all masks combined. This is a ≥ condition.
oc
FrameScan Cycle: Sets the instrument to stop after it h as acquired the n umber of bits specified
the Scan Bits control in the FrameScan section of the Horizontal Setup dialog box (that is, stop
in
after one FrameScan cycle).
TIP. Histogram hits, Mask (N) Hits, and Mask Total Hits are ≥ (greater than or equal to) conditions
because only complete records are processed. Therefore, the number of actual hits will not necessarily
match your requested number of hits, as the acquisition will stop when the number of hits is greater than
the number of specified hits.
See Also:
Acquisition Stop Action Settings (see page 36)
DSA8300 Printable Online Help 35

Controls-Specific Help Acquisition Stop Action Settings
Acquisition Stop Action Settings
Use these controls to direct the instrument to print the display or to save waveforms upon stopping
acquisition, and to specify directories, and files in which to save. All selections remain in effect until
you change them.
The available Stop After actions are:
None. Specifies that the instrument stops acquisition with no further action.
Print sc
the filename you want in the Filename field. Click Browse to display the Open dialog box in which
you can select a file location.
Print screen to printer. Sends the screen image to the default printer. Use the Print dialog box to set
the default printer.
Save all waveforms. Saves all waveforms to a specified file.
The i
acquisition by pressing the RUN/STOP control. It does not take action when acquisition stops due to
other factors, such as loss of a trigger.
Ring Bell. Click the Ring Bell check box to have the instrument emit a tone when the Stop After action
completes.
NO
reen to file. Prints the screen image as a bitmap (.BMP) file to a specified file location. Enter
nstrument take the selected action only when the Stop After condition is met or when you stop the
TE. You must connect a speaker to the Line Out connector on the back of the instrument to hear the tone.
Acquisition Background
Use the acquisition features to optimize and tailor the acquisition of your waveforms. The acquisition
modes described here operate on the data as the instrument acquires it-perhaps to reduce noise in the
waveform record or to capture a record of min/max values for each data point in the waveform record. The
acquisition features also let you start and stop acquisition, and take certain actions after acquisition stops,
such as to print the acquired waveform.
36 DSA8300 Printable Online Help

Controls-Specific Help Acquisition Key Points
Acquisition Guidelines
Stop after options: You can set the condition upon which acquisition stops, such as after several
acquisitions or a specified number of mask hits. You can set the Stop after Action to have the
instrument save waveforms or print the screen to a file or printer.
FrameScan acquisition: You can change the normal acquisition cycle to produce a waveform record
suitable for acquiring and analyzing repetitive patterns that are contained within a repeating data
frame. See FrameScan Overview
(see page 77)for more information on FrameScan acquisitions.
FrameScan and Envelope modes: Envelope acquisition mode cannot be used with FrameScan
acquisitions; you must use Sample or Average modes.
See Also:
sition Key Points
Acqui
Acquisition Sampling Process (see page 39)
uisition Key Points
Acq
uisition modes. Consider the mode you want to use to acquire data:
Acq
Sample- the instrument does no post-processing of acquired samples.
Average- the instrument processes the number of waveforms you specify into the acquired w aveform,
creating a running exponential average of the input signal.
Envelope- the instrument retains the running minimum (Min) and maximum (Max) values in adjacent
sample intervals continuously, as subsequent waveforms are acquired, creating an e nvelope of all
waveforms acquired for that channel.
Acquiring and displaying a noisy square wave signal shows the difference between the three modes. Note
how Average reduces the noise while Envelope captures its extremes :
(see page 37)
DSA8300 Printable Online Help 37

Controls-Specific Help Acquisition Key Points
Once the waveform record exists (regardless of mode in which acquired), you can use the post-processing
capabilities of the instrument to further process that record: perform measurements, waveform math,
mask tests, and so on.
Acquisition control. Also, consider how you want to control acquisition; you have two main options, either
settable from the Acquisition Setup dialog box (push Acquisition MENU to display):
Run/Stop Button Only: Sets the instrument to start and stop the acquisition only when you use the
Run/Stop button, which is available on the front panel or in the application toolbar. If toggled to Run,
acquisition starts when a valid trigger occurs. If toggled to Stop, acquisition stops immediately.
Condition: The stop-after control provides additional conditions you can select to stop an acquisition.
Global controls. Like the horizontal controls, the acquisition controls apply to all active channels. For
example, channel 1 cannot acquire in Sample mode while channel 2 acquires in Envelope mode; you
t stop channel 8 from acquiring (if turned on) while other channels continue to acquire. Unlike
canno
horizontal controls, acquisition settings extend across time bases: you cannot set a different sample
mode for channels acquired in the Mag1 time base; the sample mode you set extends across the Main,
Mag1 and Mag2 time bases.
Preventing aliasing. Under certain conditions, a waveform may be aliased on screen. When a waveform
ases, it appears on screen with a frequency lower than that of the input signal or it appears unstable
ali
even though the TRIGD light is lit. Aliasing occurs because the instrument sample interval is too long to
construct an accurate waveform record (see the following figure).
To quickly check for aliasing, adjust the horizontal scale to a faster time per division setting. If the shape of
the displayed waveform changes drastically or becomes stable at a faster time base setting, your waveform
was probably aliased. You can also try pressing the AUTOSET button to eliminate aliasing.
To avoid aliasing, be sure to set resolution so that the instrument samples the input signal at a rate more
than twice as fast as the highest frequency component. For example, a signal with frequency components
38 DSA8300 Printable Online Help

Controls-Specific Help Acquisition Sampling Process
of 500 MHz would need to be sampled with a sample interval less than 1 nanosecond to represent it
accurately and to avoid aliasing.
Acquisition Sampling Process
Before a signal is acquired, it must pass through the input channel where it is sampled and digitized. Each
channel has a dedicated sampler and digitizer as shown in the following figure; each channel can produce a
stream of di
page 149) for further discussion of scaling, positioning, and DC offsetting of channels.
gital data from which you can extract waveform records. See Background-Vertical
Acquisition Hardware
(see
pling
Sam
Acquisition is the process of sampling an analog input signal of an input channel, converting it into digital
ta, and assembling it into a waveform record, which is then stored in acquisition memory. Sampling,
da
then, is the process that provides one sample per trigger event and, when taken from repeated trigger
events, also provides the digitized signal data from which the instrument assembles the waveform
record (described below). The signal parts within the vertical range of the sampler are digitized. See the
following figure.
DSA8300 Printable Online Help 39

Controls-Specific Help Acquisition Sampling Process
Waveform Record
While sampling the input signal provides the data that makes up the waveform record for any given
channel, the instrument builds the waveform record through use of some common parameters (“common”
means they affect the waveforms in all channels).
The following figure shows how these common parameters define the waveform record; as shown in the
figure, they define where in the data stream data is taken and how much data is taken. Locate the following
rameters in the figure:
pa
Sample Interval. The precise time between sample points taken during acquisition.
Record Length. The number of samples required to fill a waveform record.
Trigger Point. The trigger point marks the time zero in a waveform record. All waveform samples are
located in time with respect to the trigger point.
Horizontal Delay. The time lapse from the trigger point to the first sample taken (first point in the
waveform record). It is set indirectly by setting the horizontal position (see Horizontal timebase
position (see page 67) )
As the figure shows, the instrument acquires points in order from left to right, with each point from a
separate trigger event, and delayed from that event by:
horizontal delay + (sample interval x (sample number - 1))
When all the points in the waveform record have been sampled and digitized, the waveform record is
placed in acquisition memory and becomes available for display (or for use in math waveforms, storing,
exporting, and elsewhere). See Acquisition Cycle, which follows.
40 DSA8300 Printable Online Help

Controls-Specific Help Cursor Setup Dialog Box Overview
Acquisition Cycle
The process of building a record is a subpart the acquisition cycle, which describes how the instrument
cycles through recognizing a trigger, taking a sample and processing it according to sample mode, and
adding it to a waveform record. Note the following points regarding acquisition cycles:
A waveform record exists, either on display or as an icon on the waveform bar, until it is replaced by a
more recent acquisition or until you clear the record.
FrameScan mode alters the normal acquisition cycle. Choose the FrameScan cycle when you want
to test for anomalies in repetitive data streams.
Cursor Setup Dialog Box Overview
Use this dialog box to set up the cursor 1 and cursor 2 parameters. Access this tab from Setup > Cursor.
Key Features:
Set cursor function
Set individual cursor characteristics
xxx
Control Information:
Cursor Function Settings (see page 42)
Cursor1and2Settings(see page 43)
DSA8300 Printable Online Help 41

Controls-Specific Help Cursor Function Settings
See Also:
Cursor Background (see page 43)
Cursor Function Settings
Access these controls in the Setup > Cursor dialog box.
Select the type of cursor function you want to use:
Off. Disables (turns off) the display of all cursors.
al Bars. Displays vertical bar cursors, which provide traditional horizontal unit readouts for Cursor
Vertic
1 (bar1), Cursor 2 (bar2), the delta between them, and 1/delta (results in frequency when the horizontal
unit is time).
Horizontal Bars. Displays horizontal bar cursors, which provide traditional vertical unit readouts for
Cursor 1 (bar1), Cursor 2 (bar2), and the delta between them.
Waveform. Displays vertical bar cursors with marks where they cross a waveform, which track the
waveform points, providing both vertical and horizontal coordinates for the waveform point where they
cross.
See Also:
Cursor 1 and 2 Settings (see page 43)
Cursor Background (see page 43)
42 DSA8300 Printable Online Help

Controls-Specific Help Cursor 1 and 2 Settings
Cursor 1 and 2 Settings
Access these controls in the cursor setup dialog box.
Use these controls to set the source, position, and color of Cursor 1 or 2.
Source. Selects the waveform you want associated with a cursor. All available waveforms are displayed
as selections in this control.
Position. Sets the position of the cursor. You can also use the front-panel general-purpose knob to adjust
this setting when this dialog box is the focus and no other setup dialog boxes are displayed. You can
also use the mouse to select and move the cursors.
Color. Selects a color for the cursors.
See Also:
Cursor Function Settings (see page 42)
Cursor Background (see page 43)
Cursor Units (see page 46)
Cursor Background
Use cursors to measure waveform characteristics at specific locations on a waveform. Vertical cursors
measure time, bits, or distance on screen; horizontal cursors measure amplitude: voltage, watts, rho, or
ohms; and waveform cursors measure both.
Cursor sources. Cursors can measure channel, reference, and math waveforms. You can set the source of
each cursor explicitly in the Cu
rsor Setup dialog box.
Selected cursor. The cursor selected for adjustment is the solid cursor.
Cursors are display-limited. You cannot move a cursor off screen. Also, if you resize waveforms, the
cursors do not track. That is, a cursor stays at its screen position, ignoring changes to horizontal and
DSA8300 Printable Online Help 43

Controls-Specific Help Cursor Background
vertical scale and position and to vertical offset. However, waveform cursors track the waveform point
vertically; they work differently than vertical and horizontal cursors.
Cursors default to measure the Selected Waveform. Each cursor measures its source, defined in the Cursors
Setup dialog box. Note the following behavior regarding source selection:
When cursors are first turned on, the instrument automatically assigns them to the selected w aveform.
Up to the time that you turn cursors on, you can select a w aveform on screen to use it as the source
for the curs
Once cursors are on, selecting a different waveform does not change the source the cursors measure.
To change t
Turning cursors off restores the default cursor source assignment so that assignment again tracks
the selec
Cursors can measure different sources. Each cursor can measure a different, independent source, with
each source having its own amplitude scale and time scale. Consider the following example:
Cursor1 is set to measure channel 3 (C3), which is set to 100mV/div, so the cursor readout v1 measures
C3 relative to its ground as 3 divisions x 100mV/div, or about 300 mv.
Cursor 2 is set to measure reference l (R1), which is set to 20 mV/div, so the cursor readout
v2 measures R1 relative to its ground as 3 divisions x 20mV/div, or about 60 mv.
ors.
he source while cursors are on, you must change the source in the Cursors Setup dialog box.
ted waveform.
Note that the value of each graticule division, relative to the delta readout, is not readily apparent
because the delta-amplitude readout (v) must account for the different amplitude-scale settings of
the sources. To do so, the v readout displays the results of v2 - v1 (-60 mv - 300 mv = -240 mv),
automatically accounting for the different scales of the cursor sources.
Time readouts behave similarly with regard to different sources with different time bases. Each cursor
displays its time readout, t1 or t2, with respect to the time base of its source, and Δtiscalculatedast2-t1,
tomatically accounting for any difference in the time base of each cursor source.
au
If a cursor readout does not seem c orrect, check the source of each cursor in the Cursor Setup dialog box.
ch cursor readout relates to the amplitude and time base settings of their source.
Ea
Vertical cursors measure from the trigger point (except when horizontal units are bits). Remember that each
vertical cursor measures the time from the trigger source to itself. The figure that follows shows this
relationship, indicating the components determining time cursor readout values.
44 DSA8300 Printable Online Help

Controls-Specific Help Cursor Background
Note that a vertical cursor readout (t1 or t2) includes and varies directly with the time-to-first-point
component, which varies directly with the horizontal position set for the time base used by the
cursor-source waveform. To see the amount of time to the first point, push Horizontal Menu on the front
panel and set Horizontal Ref to 0% in the dialog box that displays. Now the Horizontal position readout
shows th
on screen relative to first point. (You can find the horizontal readout both in the dialog box and in the
control bar at the bottom of the screen.) The following relationships hold:
e time to first point, and subtracting this value from the cursor readout yields the cursor position
Time to First Point = Horiz Position (when Horiz Ref Position is set to zero)
2 readouts = Time to First Point + Additional Time to Cursor
t1 or t
See Also:
Cursor Function Settings (see page 42)
Cursor Units (see page 46)
DSA8300 Printable Online Help 45

Controls-Specific Help Cursor Units
Cursor Units
Cursor units depend on the signal being measured. A cursor that measures amplitude or time will read out
in the units of its source as indicated in the Cursor Units table that follows. If the measured v1/v2 or t1/t2
units do not m
atch, the Δv/ΔtreadoutisUNDEFINED.
Cursor Standard uni
Horizontal volts, watts, ohms, rho v1, v2, Δv
Vertical
Waveform
xxx
seconds, bits, meters, feet, inches t1, t2, Δt, 1/Δt(time)
volts, wat
meters, feet, inches
ts
ts, seconds, bits, ohms, rho,
See Also:
Cursor Function Settings (see page 42)
Cursor Background (see page 43)
Display Setup Dialog Box Overview
Use the Setup > Display dialog box to set up the waveform display and graticules type.
Readouts
b1, b2, Δb, 1
d1, d2, Δd, and Δd/2 (distance)
v1, v2, Δv
t1, t2, Δt, 1/Δt(time)
b1, b2, Δb, 1/Δb(bits)
d1, d2, Δd
/Δb(bits)
, Δd/2 (distance)
46 DSA8300 Printable Online Help
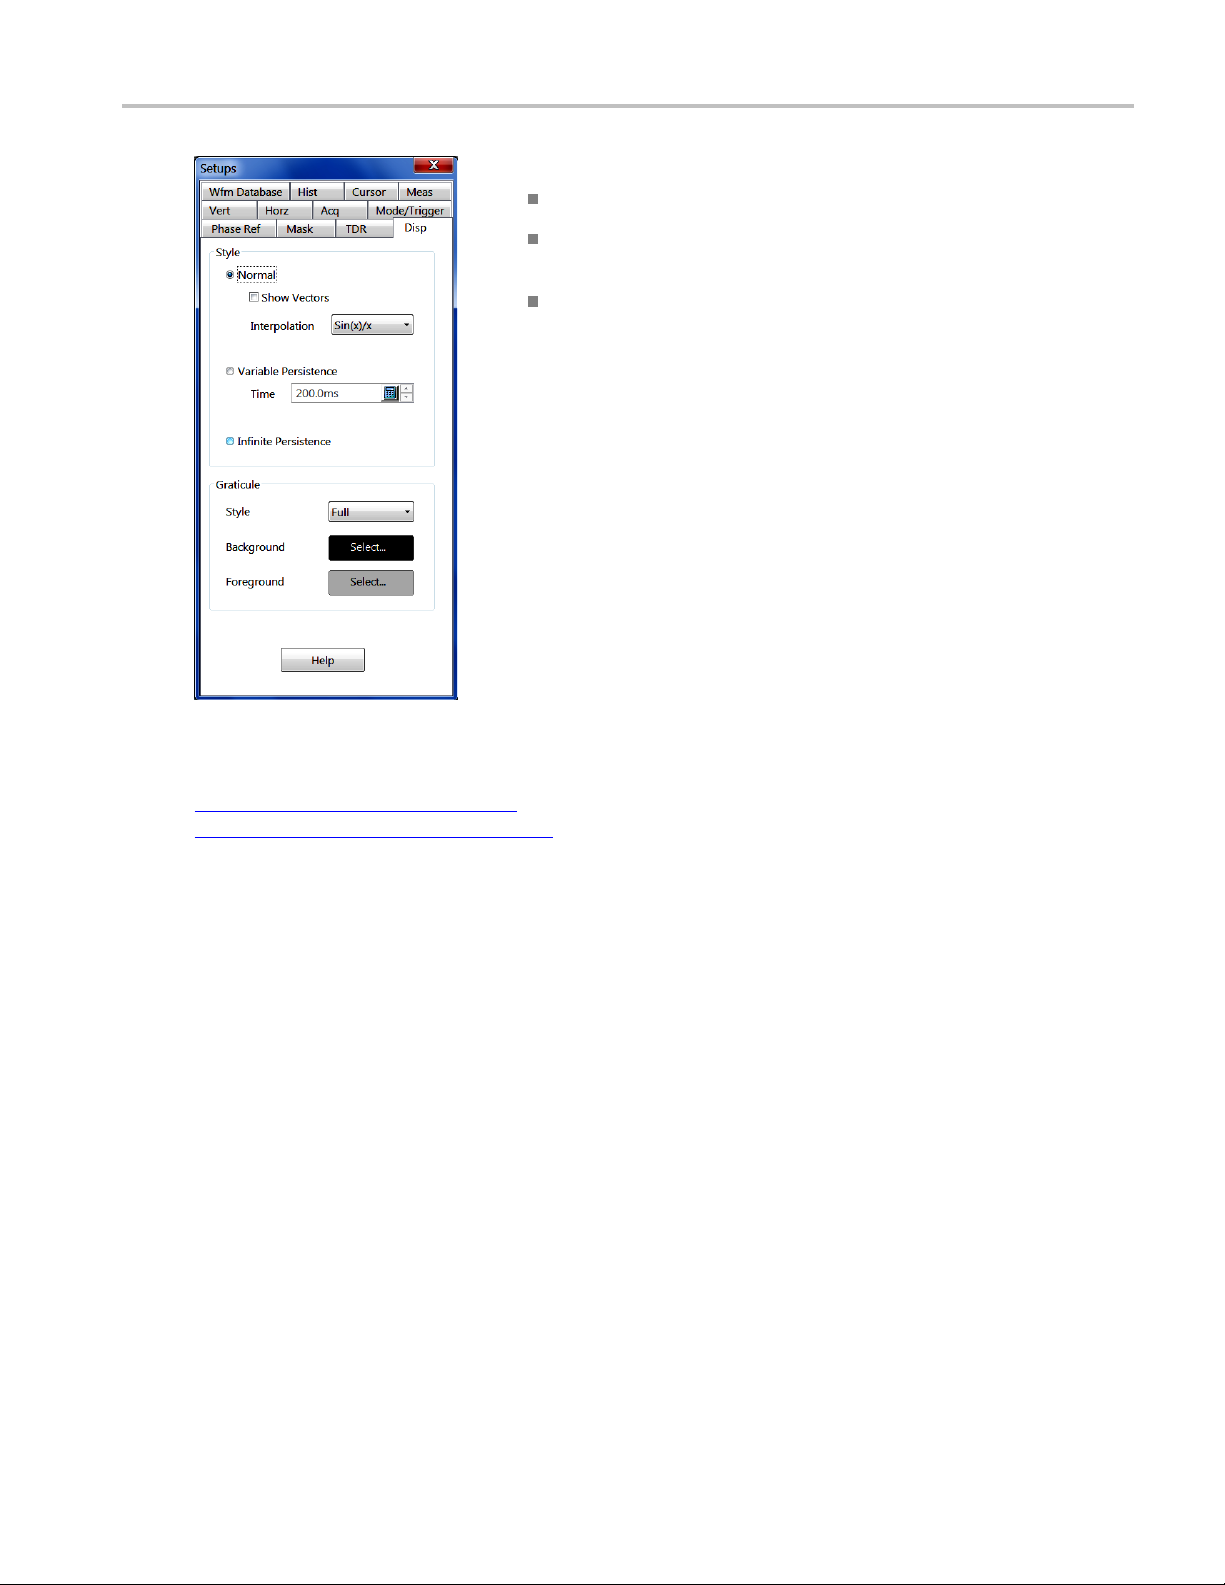
Controls-Specific Help Display Style Settings
Key Features:
Set waveform display style (normal or persistence mode)
Set normal waveforms to display as dots or vectors (lines) between data
points, and se
t the vector interpolation method
xxx
Control Information:
Display Style Settings (see page 47)
Display Graticule Settings (see page 49)
Set graticule
characteristics (style, background color, and foreground color)
Display Style Settings
Access these controls in the Setup > Display dialog box. Style controls specify displaying waveforms
as vectors or dots, interpolation between data points, and waveform persistence (variable persistence
or infinite.)
The mode you choose globally affects all displayed waveforms, except those that are displayed in
waveform database format. For example, you cannot set channel 1 to display in Normal mode and channel
2 in Variable Persistence mode.
DSA8300 Printable Online Help 47

Controls-Specific Help Display Style Settings
Normal. Sets the instrument to replace the previously acquired waveform in the display as it acquires or
processe
Variable Persistence. Sets the instrument to accumulate samples from each waveform it collects on screen
for a specific time interval (the persistence aging time). The persistence aging time (Variable Persistence
Rate) ranges from 200 ms to 10 s. The control varies this setting in increments of 100 ms from 200 ms to
1s, and in 0.5 s increments from 1 s to 10 s. You can set any value to ±0.5 ms using the keyboard.
s a new waveform.
Infinite Persistence. Sets the instrument to accumulate and keep on displaying indefinitely all samples it
collects for each waveform over time. Sample points are not removed until you perform one of the
following actions:
Reset the acquisition in any way, including using the Clear Data front-panel control. This includes
actions such as dragging a waveform to a new position or changing its vertical position.
Change the display style.
Vectors and Interpolation
For Normal display mode only, you can set the instrument to draw vectors between displayed waveform
points or display only sample points as dots.
For Normal display mode with record lengths < 1000, independent of the dots/vectors selection, you can
set the instrument to interpolate. With interpolation enabled and acquisition record lengths < 1000 points,
the instrument increases the sample density on the waveforms it displays by calculating intermediate points
etween those sampled. Choose one of the following Interpolation display algorithms:
b
None (default)
Sin (X)/X
Linear
NOTE. Interpolated points are displayed dimmer than actual acquired samples.
48 DSA8300 Printable Online Help

Controls-Specific Help Display Graticule Settings
See Also:
Display Graticule Settings (see page 49)
Display Graticule Settings
Access these controls in the Display Setup dialog box. Graticule controls specify the style, background
color, and foreground color of the graticule.
Use the c
color, and foreground color.
There ar
Style. Selects the graticule style: Frame, Grid, Cross Hair, or Full graticules. Choose Full or Crosshair for
ease in making graticule measurements; choose Frame or Grid for minimum clutter on screen.
Background. Selects the graticule background color. The default color is black.
Foreground. Selects the graticule foreground color. The default color is silver.
TIP. Choosing a Background color that matches a waveform or any onscreen readout, cursor, or other
onscreen element will mask the display of that element.
ontrols in this section of the Display Setup dialog box to set the graticule style, background
e three graticule settings:
See Also:
Display Style Settings (see page 47)
Waveform Display Elements
The following figure identifies the various elements of the waveform display.
DSA8300 Printable Online Help 49
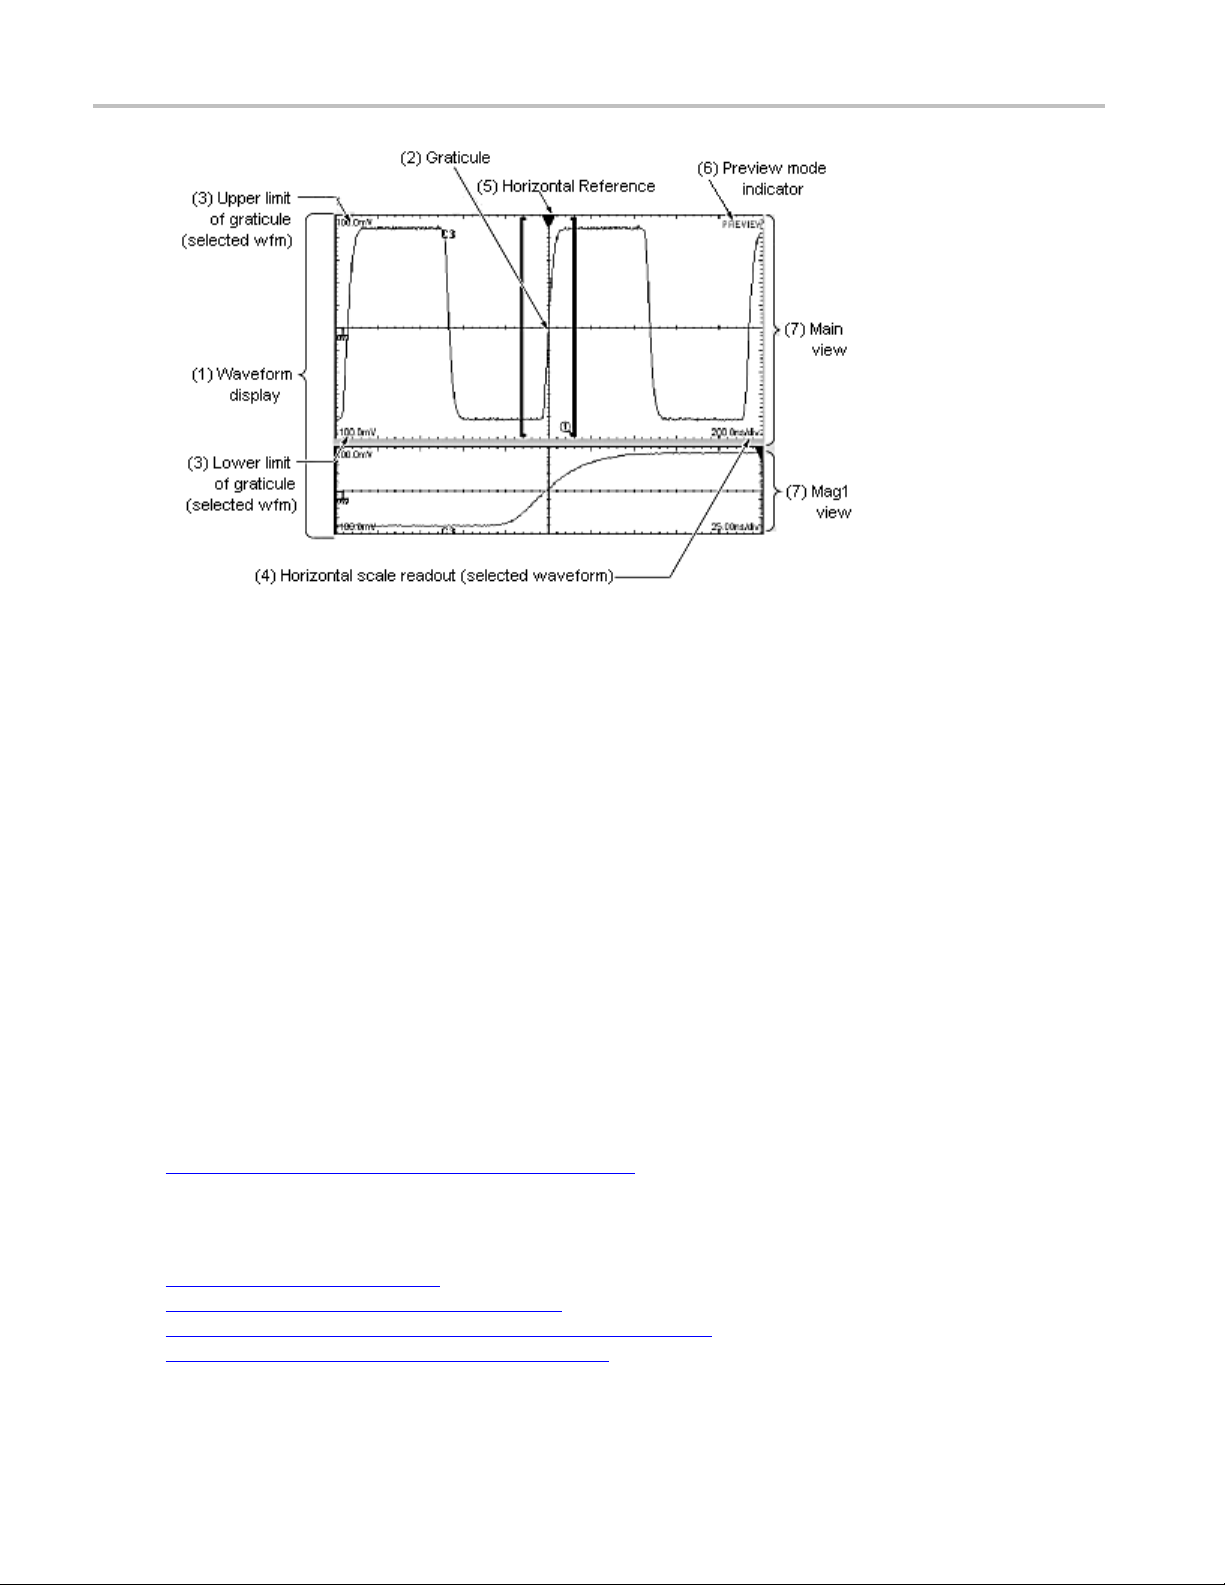
Controls-Specific Help Waveform Display Elements
(1) Waveform display: the area where the waveforms appear. The display comprises the time bases and
graticules, the waveforms, masks, histograms, and readouts.
(2) Graticule: a grid marking the display area of a view. Each graticule is associated with its time base.
(3) Upper and lower amplitude-limits readouts: the upper and lower boundary level of the graticule for
the selected waveform.
(4) Horizontal-scale readout: the horizontal scale of the selected waveform.
(5) Horizontal reference: a control that you can position to set the point around which channel waveforms
expand and contract horizontally on screen as you change the Horizontal Scale control.
(6) Preview: a status field that indicates when all waveforms are being previewed (that is, displaying an
approximation of the waveforms as they will appear when acquisition completes). This indicator may
appear when you change acquisition controls.
(7) Main, Mag1, and Mag2 views: selectable objects displaying on screen in the display, each with its
own display of any waveform that is turned on. A view is a representation of a signal on an associated time
base – the Main time base with the Main view, which is always displayed, or one of the two Mag views,
each with its own time base and graticule. You can enable or disable display of the Mag views. You can
splay up to three views on screen (Main plus Mag1 and Mag2) at the same time.
di
Touchscreen (not shown): a feature that lets you touch controls on screen to operate the instrument. See
ouse, Touchscreen, and Customizing
M
(see page 16) .
See Also:
Display Features (see page 56)
Waveform Display Key Points (see page 51)
Mouse and Touchscreen Operation Comparison (see page 16)
Customizing the Waveform Display (see page 54)
50 DSA8300 Printable Online Help

Controls-Specific Help Waveform Display Key Points
Waveform Display Persistence (see page 55)
Waveform Display Key Points
Waveform display. In general, the method of displaying a waveform is to define the waveform, and then
turn it on.
Operations
on selected waveforms. Select the waveform using the Vertical source and channel selection
buttons, and then adjust it using the Vertical Scale, Offset, and Position knobs.
The follow
ing tables summarize the control operations you can perform for the three waveform control
parameters.
Table 2: Vertical controls
Control CH MATH REF Notes
lScale
Vertica
Vertical Position Yes Yes Yes
Vertical Offset
xxx
3: Horizontal controls
Table
Control C H MATH REF Notes
Horizontal Scale
zontal Position
Hori
Horizontal Resolution Yes No No
xxx
Yes Yes Yes
Yes No No
Yes N o No
Yes N o No
The vert
Vertical offset is unavailable for channels with ohm
or rho measurement units or for math or reference
wavefo
ical controls adjust the selected waveform.
rms.
All channel waveforms are adjusted globally in the
selected time base.
waveforms are not adjusted because their
Math
horizontal parameters are derived from their
source(s).
erence waveforms are not adjusted because
Ref
they have fixed horizontal parameters determined at
the time the waveform was saved.
DSA8300 Printable Online Help 51

Controls-Specific Help Waveform Display Key Points
Table 4: Other controls
Control CH MATH REF Notes
Automatic measurement
source select
Cursor automatic target
selection
Quick horiz
adjust (Zoom)
xxx
Graticule
ion
ontal scale
s. One graticule is displayed for the Main time base, and an additional graticule is displayed
for each Mag time base that you turn on. The elements
Yes Yes Yes
Yes Yes Yes
Yes Yes No Dragging a box around a portion within the Main,
Measurements
toolbar, use the selected waveform as the source.
If cursors are off, pushing the front panel CURSOR
button sets the selected waveform as the cursor
measurement
mag1, or mag
"zoom" adjusts the horizontal scale to fill the screen
with the boxed portion of the g raticule (zoom).
, if selected from the Measurements
source.
2 timebase graticules and clicking on
(see page 49) of the time base graticules are
thesameforeachtimebasedisplayed.
Using multiple views. The methods of displaying (turning on) and selecting any time base view follow:
Turn the view on: Push the Mag1 or Mag2 front-panel button once to turn on the Mag1 or Mag2 time
base. The Main view is always (displayed); you cannot turn it off. Turning on a time base makes
it active (selects it for adjustment).
Select among displayed views: Push any time base view button to make it the active, selected time
base. The button of the selected view is always lit amber.
Turn off the selected Mag view: Once selected, Push the Mag1 or Mag2 button to turn off the time
base. The Main time base becomes the selected time base.
Operations on the selected time base view. The method of adjusting (horizontal scaling and positioning,
setting resolution/record length, and so on) is from the front panel: select the time base using the
Horizontal time base selection buttons, and then adjust it using the Horizontal Scale, Resolution, and
Position knobs. Only channel waveforms can have their horizontal parameters set directly.
The table above shows how horizontal operations relate to the waveform types; the key points to
remember are:
As the table shows, horizontal operations affect all channel waveforms, but in the selected view
only. For example, you can select each time base in turn and set one horizontal scale for all channel
waveforms in the Main view, another horizontal scale for those in the Mag1 view, and a third for
those in the Mag2 view.
The instrument displays a reference waveform using the horizontal settings in effect at the time it
was saved. You cannot change these settings.
The instrument displays a math waveform using the horizontal settings derived from its math
expression. You cannot change these settings.
All waveforms in each time b ase are displayed fit-to-screen; that is, within the full 10 horizontal
divisions that the graticule provides.
52 DSA8300 Printable Online Help

Controls-Specific Help Waveform Display Key Points
Waveform operations that cross time base views. Unlike the horizontal controls just described, some
controls apply to all time base views:
Turning a waveform on or off in any view displays or removes it from all views.
Selecting a waveform in any view makes it the selected waveform in all views; for example, select
C1 in Main, and then select Mag1. C1 is the selected waveform in Mag1. Turn on Mag2, and
Mag2 displays on screen with C1 selected
Vertical adjustments on a waveform in any time base adjust the waveform in all time bases.
Display controls versus acquisition controls. For channel waveforms, the vertical offset control and the
horizontal controls adjust the instrum
following descriptions for more information about acquisition:
Vertical Acquisition Window Considerations (see page 155)
The Horizontal Acquisition Window (see page 75)
Mag1 and Mag2 are magnifying timebases. The Mag1 and Mag2 time bases are so named because they
magnify a segment of the Main time base. Mag1 and Mag2 timebases cannot be set to a slower horizontal
scale than that of the Main timebase.
ent acquisition parameters as well as affect the display. See the
Each Mag time base scale sets the size of an aperture on the Main time base
Each Mag time base position setting locates the aperture within the Main time base.
Each Mag time base graticule displays the selected area across the full horizontal display width
(10 divisions).
Horizontal position and the horizontal reference. The horizontal position that is set and r ead from the user
interface is measured from one of two points in time:
If the horizontal units are time or distance (meters, feet, or inches), horizontal position is measured
from the trigger point to the horizontal reference point.
If the horizontal units are bits, horizontal position is measured from the Time of First Point to the
horizontal reference point (i.e. the time of first point is set to bit 0.0).
In either case, the horizontal position is not equal to the Time of First Point unless you set the horizontal
reference to 0%. See the following figure.
DSA8300 Printable Online Help 53

Controls-Specific Help Customizing the Waveform Display
Horizontal un
its. You can specify the time values in seconds, bits or distance from the Horizontal Setup
dialog box. When you s elect Bits or Distance as the timebase units, the timebase scale and position
controls and the readouts show bits or distance units. You can select from meters, feet, or inches as your
distance unit. The timing measurement results remain as seconds .
The Units Setup dialog box also provides Dielectric Const(ant) and Prop(agation) Velocity controls with
which you can select either the effective dielectric constant of the device under test or its propagation
velocity (they interact, so set one or the other). Distance units and these other two controls are useful when
doing TDR measurements and testing. You may want to turn on distance units and set the dielectric
constant o
r propagation velocity when making such measurements. The formula is:
D=VpT
where:
Vp = propagation velocity
T = Co/Square root of Dielectric Constant
Velocity of propagation (Vp) is a measure of how fast a signal travels in that transmission line. Dielectric
Constant is the relative effective dielectric constant of the propagation media.
Customizing the Waveform Display
Use the display customizing features to set display color, graticule style, waveform representation, and so
on. The table that follows lists display attributes that you can set and where they are accessed.
Display attribute Menu path Options
Graticule style Setup > Display Full, Grid, Cross-hair, Frame
Display mode
Show vectors (normal display
mode only)
Waveform labels Utilities > Waveform Properties
Waveform colors Utilities > Waveform Properties
Cursor color Setup > Cursors Select colors for cursors
Graticule color Setup > Graticule Select colors for g raticules
Histogram color
Mask color
Waveform color grading Right-click on waveform > Color Grade Display waveform with color gradation
xxx
Setup > Display Normal, Infinite, Variable
Setup > Display Enable/Disable drawing vectors (lines)
between sample points
Create a label for the selected waveform
Right-click on waveform > Properties
Select colors for waveforms
Right-click on waveform > Properties
Setup > Histogram Select colors for histograms
Setup > Mask Tests Select colors for masks
based on frequency of occurrence
54 DSA8300 Printable Online Help

Controls-Specific Help Waveform Display Persistence
Waveform Display Persistence
Use display persistence to control how the waveform data decays over time. Persistence style applies
to all waveforms except for reference waveforms and channel waveforms set to display with color or
intensity gr
Normal style displays waveforms without persistence: each new waveform record replaces the
previously
which displays lines between the record points, or dots (vectors off) which displays the record points
only. You can also choose an interpolation mode. See Interpolation below.
Variable Persistence style accumulates the waveform-record points on screen and displays them
for a specific time interval. The oldest waveform data continuously fades from the display a s new
waveform records acquire.
Infinite Persistence style accumulates the data record points until you change some control (such as
scale factor) or explicitly clear the data, causing the display to be erased. Waveform data builds up
as new data records a cquire.
ading.
acquired record for a channel. You can choose to display normal waveforms as vectors,
See Als
Waveform Display Data Point Interpolation (see page 55)
o:
Waveform Display Data Point Interpolation
For record lengths of less than 1000 points, you can choose to have the instrument interpolate between the
sampled points it acquires. Interpolation affects the display only; mask testing, histograms, and automatic
surement results are based on acquired, not interpolated, data. There are three options for interpolation:
mea
Sin(x)/x interpolation computes record points using a curve-fit between the actual values acquired. The
rve-fit assumes all the interpolated points fall along that curve. Sin(x)/x interpolation is particularly
cu
useful when acquiring more rounded waveforms, such as sine waves. Sin(x)/x interpolation may
introduce apparent overshoot or undershoot in s ignals with fast rise times.
Linear interpolation computes record points between actual acquired samples by using a
straight-line-fit. The straight-line-fit assumes all the interpolated points fall in their appropriate point
in time on that straight line. Linear interpolation is useful for many waveforms such as pulse trains.
None turns interpolation off. Only points actually sampled appear in the displays of waveform records.
See Also:
Waveform Display Persistence (see page 55)
DSA8300 Printable Online Help 55

Controls-Specific Help Display Features
Display Features
Flexible display control. Front-panel knobs and buttons support quick access to the most often used
adjustments; those that display, position, and scale waveforms. Mouse, keyboard, and touchscreen
interfaces s
Multiple timebase views. Three views, Main, plus Mag1 and Mag2, can b e displayed simultaneously, each
with its own time base. Live waveforms are acquired independently in each time base (C1 in Main is a
differentwaveformthanC1inMag1orMag2).
upport complete setup of all the display parameters.
All displa
and Mag2 if you display those views. Refere nce waveforms will appear in all views as well, but since
they have a static time base setting (the time base setting with which they were saved), they will be
identical in all views.
Fast Zoom capability. Waveform inspection has never been easier. Just click and drag a box around the
featur
Preview mode. The instrument automatically uses a preview display when control changes initiate
reacquisition of waveform data. A preview display shows how the waveforms will look when acquisition
completes. When the instrument finishes the processing of state changes, it removes the preview and
displays the actual waveforms.
Waveform color grading. You can select color grading of a waveform so that its data color or intensity
reflects the frequency of occurrence of the data.
NOTE. When the acquisition system is stopped, the data will not update on screen until acquisition
is restarted
yed waveforms shown in all views. If C1 and M1 are displayed in Main, they also appear in Mag1
e of interest and it zooms horizontally to fill the screen, reacquired at a higher resolution.
Histograms Setup Dialog Box Overview
Use this dialog box to set up and display a histogram from an acquired waveform. Access these controls
from Setup > Histogram.
56 DSA8300 Printable Online Help

Controls-Specific Help Histogram Source Settings
Key features:
xxx
Control I
nformation:
Display a histo
or reference waveform
Adjust the limits of the box that defines the area on the display to compute
the histogram
Create a linear or logarithmic plot of histogram data
Set the histogram plot size and color
The instrume
histogram is created. It then displays results as two components:
An on-screen plot of the distribution, or binning, of accumulated waveform
data
A readout of the statistical measurements for the histogram data
gram of vertical or horizontal values for any channel, math,
nt displays a box around the waveform segment from which the
Histogram Source Settings (see page 57)
Histogram Display Options (see page 59)
Histogram Limit Controls (see page 60)
See Also:
Histogram Statistics (see page 62)
Histogram Source Settings
Use these controls to select a histogram source, set the mode, and set waveform database usage settings.
Access these controls from Setup > Histogram.
You can use any waveform entity as the source of waveform data for a histogram.
DSA8300 Printable Online Help 57

Controls-Specific Help Histogram Source Settings
Source. Use the Source pulldown list to select a waveform source.
Enable Histog
Vertical/Horizontal. Display a vertical or horizontal histogram.
Use Wfm Database. Specify whether you want to take histograms on live data (check box not selected)
or on a waveform database (check box selected).
Clear Data. Resets all histogram results and restarts histogram data acquisition.
TIP. If you select a waveform source that already has a waveform database associated and displayed with it,
the instrument immediately creates the histogram data and statistics from the existing waveform database.
ram. Displays the h istogram.
See Also:
Histogram Display Options (see page 59)
Histogram Limit Controls (see page 60)
Histog
ram Statistics
(see page 62)
58 DSA8300 Printable Online Help

Controls-Specific Help Histogram Display Options
Histogram Display Options
Use the histogram display options to set histogram display options, including size, color, and whether the
histogram display is set to be linear, logarithmic, or off. Access these controls from Setup > Histogram.
Histogram. Enables or disables displaying the histogram on the graticule. Histogram measurements (in
the readouts area) will continue to update while the histogram is not displayed.
Color. Se
Linear. Specifies that bin counts smaller than the maximum be scaled linearly by dividing the bin count
by the maximum bin count.
Logarithmic. Specifies that bin counts smaller than the maximum be scaled logarithmically (log
(bin-c
bases differ only by a constant multiplier. Logarithmic scaling provides better visual detail for bins
with low counts.
Size. Scales the size of the displayed histogram data by the selected multiplier value.
See A
Histogram Source Settings (see page 57)
His
Histogram Statistics (see page 62)
lects a color for the displayed histogram data and boundary area.
ount)) with log(0) staying at 0 baseline). The base of the log does not matter since logs to different
lso:
togram Limit Controls
(see page 60)
DSA8300 Printable Online Help 59

Controls-Specific Help Histogram Limit Controls
Histogram Limit Controls
Use these controls to set the histogram boundary limits (area being measured). Access these controls
from Setup > Histogram.
The boundary region is delimited by the four boundaries: Top, Bottom, Left, and Right.
You c a n se
percent units (%). The display percent unit coordinate system is based on 0,0 as upper left, and 100,100 as
lower right.
Vertical and horizontal controls d o not change the histogram boundary area. Instead, control changes
determine the relationship between the internal coordinate system and the absolute unit values you
specified. Therefore, you see the values of the histogram boundaries change as corresponding vertical and
horizontal changes are made.
TIP. You can resize the histogram boundary area in one or both directions using standard drag-and-drop
opera
t histogram boundaries in either units based on the source waveform (Absolute)orindisplay
tions.
See Also:
togram Source Settings
His
Histogram Display Options (see page 59)
Histogram Statistics (see page 62)
Histogram Background
(see page 57)
The instrument can display histograms from waveform data. You can display both vertical (voltage,
watts, ohms or rho) and horizontal (time, bits, or distance) histograms, but only one at a time. The figure
shows a vertical histogram view with readouts.
60 DSA8300 Printable Online Help

Controls-Specific Help Histogram Background
Key Features
Flexible histogram editing. You can use the controls in Hist Setup dialog box to completely specify the
histogram box on the waveform, in waveform units or as a percent of the graticule. For quick edits, you
can use c
Any waveform as source. You can acquire Histograms from all channel, math, and reference waveforms.
If the waveform selected as the source for the histogram has a waveform database enabled, the histogram
will take measurements using the waveform database.
Conti
if you turn off the display of the histogram or of the waveform selected as its source. Histogram data is
continuously accumulated and displayed until you explicitly turn it off or clear the waveform data of
the histogram source.
One histogram at a time. One histogram can be displayed on one source at a time. The source can be any
wa
Histogram counting. Once you check Enable Histogram in the Histogram Setup dialog, histogram
counting starts and continues until you disable the histogram or clear the histogram counts. If the
histogram is not displayed on the graticule but histogram statistics still appear on the display, histogram
counting is still running. To clear histogram counts push CLEAR DATA on the front panel or click the
Clear button in the Hist Setup dialog box. Also, changing any acquisition control clears all acquired
data and the histogram count as well.
an use the mouse or touchscreen to drag to resize and reposition the box directly on the screen.
nuous operation. The h istogram that you set up can run, and its results can be displayed even
veform in any of the three Views, Main, Mag1, or Mag2.
Histogram size. The maximum vertical histogram size is 400 bins. The maximum horizontal size is
1000 bins.
Recalling setups. The histogram state i s restored to what it was when the setup was saved.
DSA8300 Printable Online Help 61

Controls-Specific Help Histogram Statistics
See Also:
Histogram Statistics (see page 62)
Histograms Setup Dialog Box Overview (see page 56)
Histogram Statistics
Histogram Statistics
Histogram statistics are displayed in the readout area. The following table describes the histogram statistics.
Item Description
Mean
Median
Std Dev Standard Deviation. The root mean square deviation of all points within or on the histogram box.
Pk-Pk
Hits
μ±1σ
μ±2σ
μ±3σ
Peak
fms
#W
xxx
See Also:
The average of all acquired points within and on the histogram box
The middle number that separates the highest half of all acquired points from the lowest half.
The peak-to-peak value of the histogram. Vertical histograms display the amplitude of the highest
nonzero bin minus the amplitude of the lowest nonzero bin. Horizontal histograms display the time
ight-most nonzero bin minus the time of the left-most nonzero bin.
of the r
mber of hits within and on the histogram box.
The nu
rcentage of points in the histogram that are within 1 standard deviation of the histogram
The pe
mean.
The percentage of points in the histogram that are within 2 standard deviations of the histogram
mean.
The percentage of points in the histogram that are within 3 standard deviations of the histogram
n.
mea
number of points in the largest bin of the histogram.
The
e number of waveforms that have contributed to the histogram
Th
Histogram Background (see page 60)
Histograms Setup Dialog Box Overview (see page 56)
Horizontal Setup Dialog Box Overview
Use this dialog box to set up horizontal timebase-related parameters. Acc ess these controls from Setup >
Horizontal.
62 DSA8300 Printable Online Help
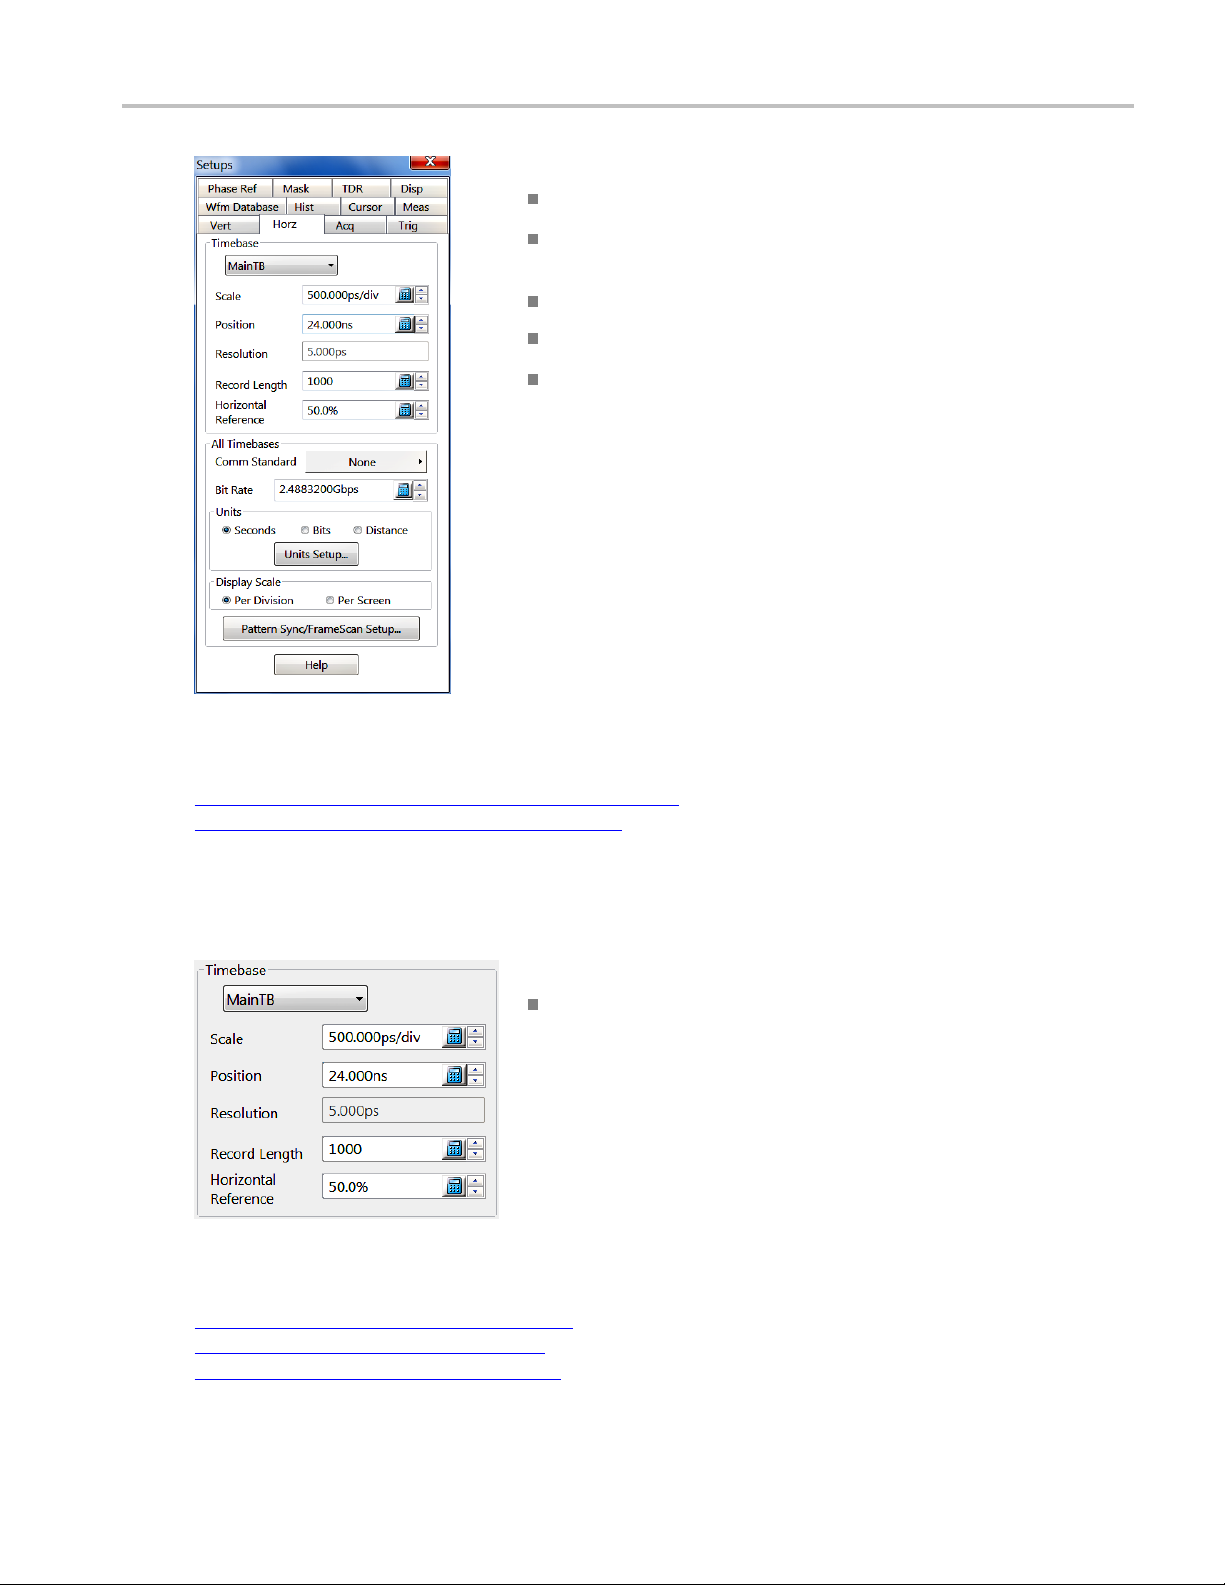
Controls-Specific Help Horizontal Timebase Controls Overview
Key Features:
Select and set up timebases to acquire and display channel waveforms
Display horizontal parameters for individual timebases associated with
stored refere
nce waveforms
ntal units to apply globally to all timebases
anually or automatically to a standard communication rate
t up Pattern Sync and FrameScan acquisition parameters
xxx
Control I
Select horizo
Set bit r ate m
Select and se
nformation:
Horizontal Timebase Controls Overview (see page 63)
All Time
basesControlsOverview
(see page 72)
Horizontal Timebase Controls Overview
Key Features:
Set the horizontal timebase, scale, position, resolution, data record length,
and horizontal reference parameters
xxx
Control Information:
Horizontal Timebase Select. (see page 64)
Horizontal Scale Setting. (see page 65)
Horizontal Position Setting (see page 67)
DSA8300 Printable Online Help 63

Controls-Specific Help Horizontal Timebase Select
Horizontal Resolution Setting (see page 69)
Horizontal Record Length Setting (see page 70)
Horizontal Re
ference Setting
(see page 71)
Horizontal Timebase Select
This c ontrol selects the measurement timeba se to set up (Main, Mag1, Mag2, Math, and Reference).
Access this
control from Setup > Horizontal.
Select from the three channel waveform timebases. Ref and Math timebases are set by their sources. They
are read-only, and you cannot edit these directly. The remaining settings change to match the timebase
you select.
When acquiring waveforms, the instrument uses the timebase settings for Main, Mag1, and Mag2, with
the trigger conditions defined in the Trigger settings, to define the horizontal acquisition windows
page 64)
.
(see
Acquisition Window
This window defines what data is included from the input signal to form a waveform record. The
vertical offset sets t he vertical center of this window independently for each channel; the horizontal
scale and position set the horizontal size and position for all channels in parallel (with some minor
delay adjustment allowed, per channel, with deskew).
Behavior
The instrument provides three timebases for acquisition and display of channel waveforms: the Main, and
two magnified timebases, Mag1 and Mag2. The instrument always displays the Main timebase; you can
toggle each Mag timebase on and off.
64 DSA8300 Printable Online Help

Controls-Specific Help Horizontal Scale Setting
All channel waveforms displayed in a given timebase share the same timebase and its settings. You
cannot display channel 1 at 100 ps and channel 2 at 200 ps in the same timebase.
The instrument acquires data for each channel independently for each timebase. The Mag1 and Mag2
views are not zoomed or interpolated versions of the Main timebase. Each one has an independent
acquisition
Waveforms defined in the main timebase are automatically defined a nd acquired in the magnified
timebases.
TIP. You can only set up the three timebases here. To turn them on and off, use the front-panel buttons,
MAIN, MAG1, and MAG 2, in the Horizontal Control block, the equivalent controls at the bottom of the
display screen, or the Mag1 and Mag2 menu commands in the View menu.
Math and Reference Timebases
Math and Reference waveforms retain their own timebase settings and display accordingly. Each Reference
waveform uses the timebase settings it was saved with; for example, a REF 1 waveform saved at 100 ps/div
always displays at 100 ps/div no matter at what horizontal scale the channel timebases display. Math
waveforms act the same, deriving their timebase s ettings from the waveform sources that define them.
cycle.
TIP. Because there are eight reference waveforms allowed, you can select the Main, Mag1 or Mag2
ase for each reference waveform. If a reference waveform is displayed, it displays the same data
timeb
for each timebase view (there is no separate magnified data for a reference waveform as there is for a
channel waveform). You can also select timebases for each of the eight math waveforms. However,
there is separate data for each Mag view of a math waveform if the expression for that math waveform
includes a channel waveform.
Also:
See
Horizontal TimeBase Controls Overview (see page 63)
rizontal Scale Setting.
Ho
Horizontal Position Setting (see page 67)
Horizontal Resolution Setting (see page 69)
Horizontal Record Length Setting (see page 70)
Horizontal Reference Setting (see page 71)
(see page 65)
Horizontal Scale Setting
Use this control to set the horizontal scale for the selected timebas e. Access this control from the
Horizontal MENU front panel button or from Setup > Horizontal.
DSA8300 Printable Online Help 65

Controls-Specific Help Horizontal Scale Setting
TIP. Yo u can
scale control at the bottom of the display.
Operatio
associated with individual Math or Ref waveforms.
Main, Ma
the timebase. Each channel timebase, Main, Mag1, and Mag2, uses its own horizontal scale. All channel
waveforms in an individual timebase share the timebase scale. The horizontal scale, together with the
record length setting, determines the sample interval or resolution (that is, the time between sample points).
TIP. Main, Mag1, and Mag2 timebase scales, positions, and record lengths (resolution) are independent of
one another; however, Mag1 and Mag2 must be totally contained within the Main timebase.
TIP. Mag v iews are useful when you want to zoom in on a particular area of interest in the signal.
Math and Ref Timebases. Timebases for Math and Ref waveforms are individually associated, derived
either from the source waveform for a Math waveform or from the source waveform for a Ref waveform.
You can display the settings for math and reference waveforms (for Main, Mag1, or Mag2 timebases),
t you cannot change them.
bu
also adjust the horizontal scale of the selected timebase using the front-panel knob or the
n differs for the timebase display of channel waveforms and the display of individual timebases
g1, and Mag2. Channel waveforms display in these timebases with the horizontal s cale set for
TIP. To see the scale on screen of a Math or Ref waveform, click the waveform to select it. The scale
readout changes to match that of the selected waveform.
66 DSA8300 Printable Online Help
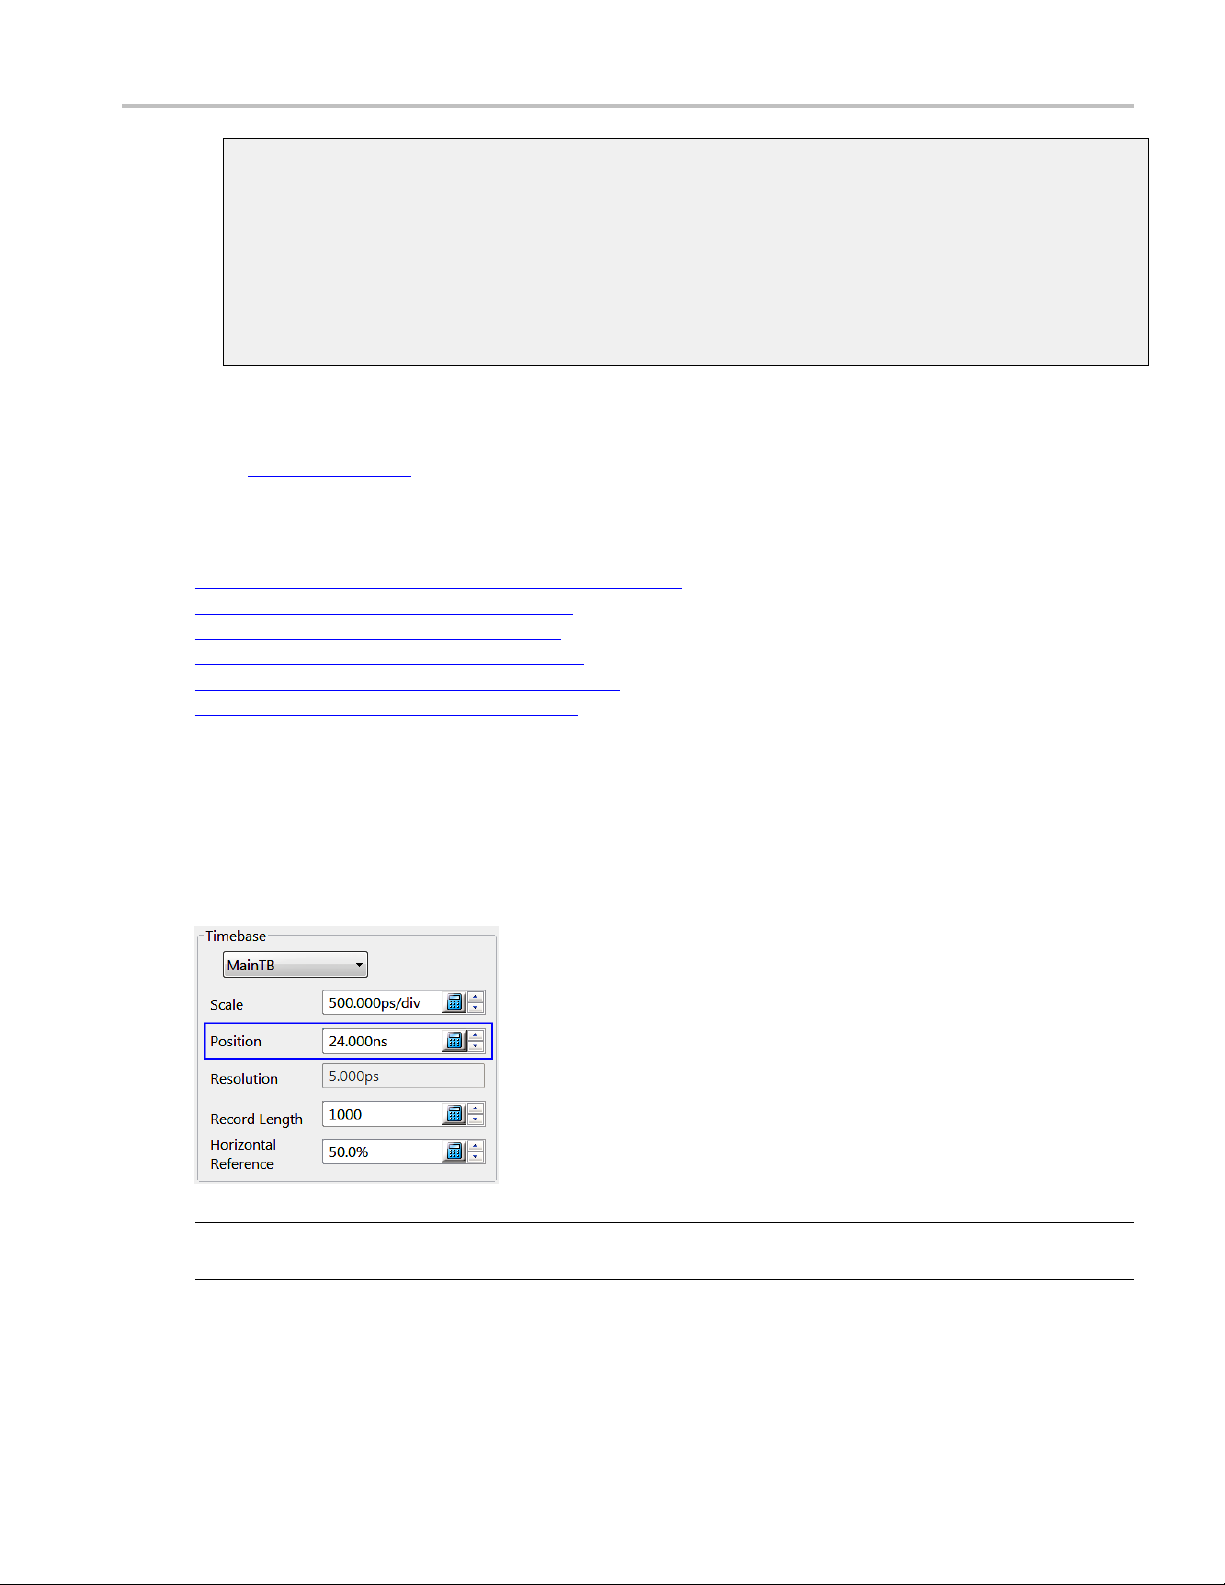
Controls-Specific Help Horizontal Position Setting
Horizontal Calculations for Bits
Horizontal scale calculation for bit units:
bits/div = scale in time/div * bit rate
Horizontal position calculation for bit units:
bits = (horizontal position in time) * bit rate (for bits units, the horizontal time reference ‘0’ is
the time of the first acquired point)
Scale Calculation
Click here (see page 67) for calculations for bit units.
See Also:
Horizontal TimeBase Controls Overview (see page 63)
age
Horizontal Timebase Select. (see p
Horizontal Position Setting (see page 67)
Horizontal Resolution Setting (see page 69)
Horizontal Record Length Setting (see page 70)
Horizontal Reference Setting (see page 71)
64)
Horizontal Position Setting
Use this control to set the horizontal position for the selected timebase. Access this control from the
Horizontal MENU front panel button or from Setup > Horizontal.
TIP. You can also adjust the horizontal position of the selected timebase using the front-panel POSITION
knob or the position control along the bottom of the graticule display.
The horizontal position value sets a global delay time, for all channel waveforms in the selected timebase,
between the trigger event and the horizontal reference for that timebase.
DSA8300 Printable Online Help 67

Controls-Specific Help Horizontal Position Setting
The minimum position you can set is limited to one of two settings, depending on the current hardware
configuration:
If there are no sampling modules on extender cables, the minimum horizontal position is set to 19ns.
This is the typical value, not the actual hardware minimum value (insertion delay, or the minimum
time from an e
If there are one or more sampling modules on extender cables, then the minimum horizontal position is
set to 19ns +
80E09, and 80E10 have the same effect as placing non-remote sampling modules on extenders. These
modules also affect the available minimum horizontal position values.
The minimum horizontal position governs the smallest horizontal position you can set. If you specify too
small of a value, the instrument will automatically set its position to the minimum position attainable.
When horizontal units = bits, the minimum horizontal position is 0 bits, which is set to equal the time of
the first acquired bit, independent of any extenders or remote samplers.
TIP. The position of each Mag timebase is constrained to be in the domain of the main timebase. Changing
the main timebase position can affect the position of each Mag timebase, but the position of a Mag
timebase cannot affect the main timebase position.
xternal trigger event to the first acquired sample).
max (Extender -Cable-Delays). Remote sampling modules such as the 80E07, 80E08,
Position Calculations
here
Click
(see page 67) for position calculations for bit units.
See Also:
Horizontal TimeBase Controls Overview (see page 63)
Horizontal Timebase Select. (see page 64)
Horizontal Scale Setting. (see page 65)
Horizontal Resolution Setting (see page 69)
Horizontal Record Length Setting (see page 70)
rizontal Reference Setting
Ho
(see page 71)
68 DSA8300 Printable Online Help
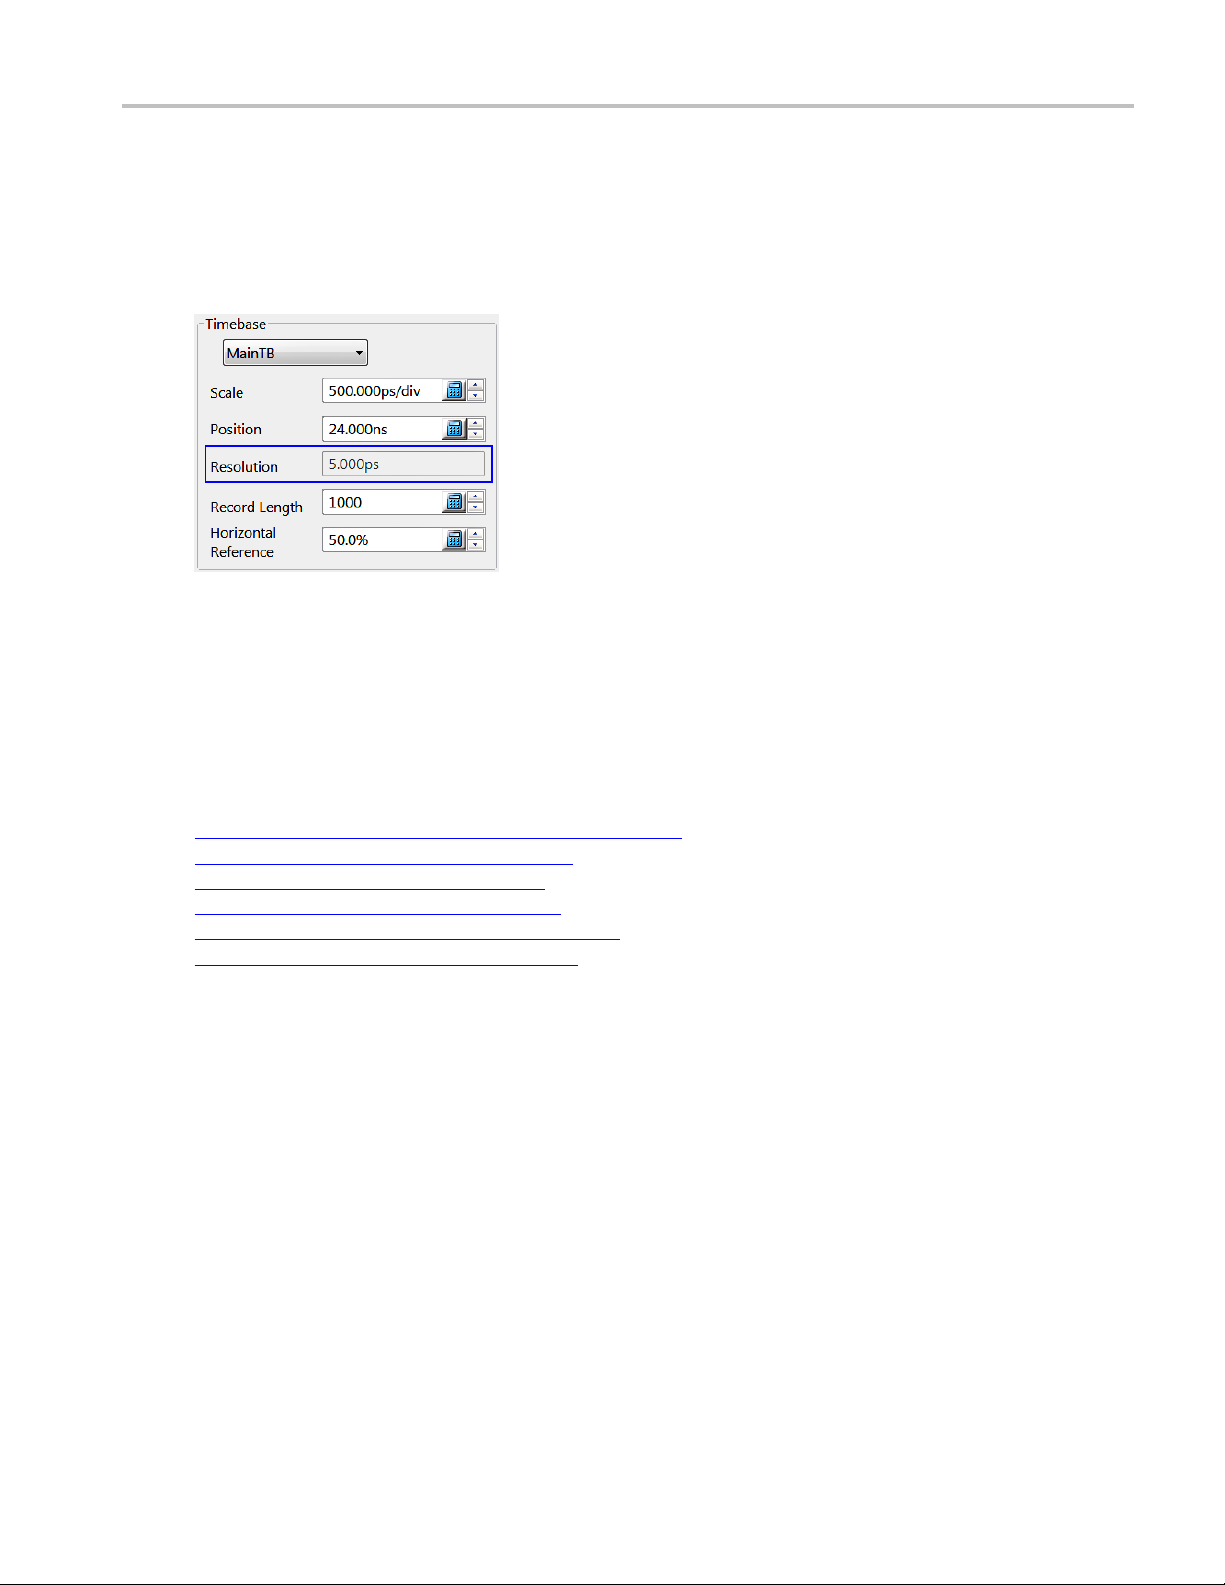
Controls-Specific Help Horizontal Resolution Setting
Horizontal Resolution Setting
Use this field to view the resolution (the sample interval between points) of the selected timebase. Access
this field from the Horizontal MENU front panel button or from Setup > Horizontal.
You cannot adjust the resolution from this field; use the Resolution knob on the front panel to change the
value. Changing the horizontal Scale or Record Length fields also changes the resolution value.
Horizontal resolution is defined as:
Resolution = (10 * horizontal scale) / record length
See Also:
Horizontal TimeBase Controls Overview (see page 63)
Horizontal Timebase Select. (see page 64)
Horizontal Scale Setting. (see page 65)
Horizontal Position Setting (see page 67)
zontal Record Length Setting
Hori
Horizontal Reference Setting (see page 71)
(see page 70)
DSA8300 Printable Online Help 69

Controls-Specific Help Horizontal Record Length Setting
Horizontal Record Length S etting
Use this control to set the record length of the selected timebase. Access this control from the Horizontal
MENU front panel button or from Setup > Horizontal.
Valid record lengths for the main timebase are 50, 100, 250, 500, 1000, 2000, 4000, 8000, and
16000 samples. Valid record lengths for the Mag1 and Mag2 timebases are 50, 100, 250, 500, 1000, 2000,
and 4000. The record lengths of MainTB, Mag1, and Mag2 timebases can be set independently.
See Also
Horizontal TimeBase Controls Overview (see page 63)
Horizo
Horizontal Scale Setting. (see page 65)
Horizontal Position Setting (see page 67)
Horizontal Resolution Setting (see page 69)
Horizontal Reference Setting (see page 71)
:
ntal Timebase Select.
(see page 64)
70 DSA8300 Printable Online Help

Controls-Specific Help Horizontal Reference Setting
Horizontal Reference Setting
This control sets the horizontal reference point for the selecte d timebase in terms of percentage of record.
Access this control from the Horizontal MENU front panel button or from Setup > Horizontal.
Horizontal reference values range from 0-100% with a default setting of 50%. When changing the
horizont
al scale for any timebase, all live waveforms are scaled about the reference point.
TIP. Percentage of record and percentage of screen coincide since the entire record is displayed in the
graticule.
See Also:
Horizontal TimeBase Controls Overview (see page 63)
Horizontal Timebase Select. (see page 64)
Horizontal Scale Setting. (see page 65)
ontal Position Setting
Horiz
Horizontal Resolution Setting (see page 69)
Horizontale R ecord Length Setting (see page 70)
(see page 67)
DSA8300 Printable Online Help 71

Controls-Specific Help All Timebases Controls Overview
All Timebases Controls Overview
Key Features:
Set comm standard, bit rate, measurement units,
and display scale parameters
Set timebase units
Set test cable properties (propagation velocity or
dielectric c
onstant)
xxx
Control Information:
Timebase Comm Standard setting. (see page 72)
Timebase Units Setting. (see page 73)
ngs
Display Scale Setti
(see page 74)
Pattern Sync/FrameScan Setup (see page 74)
Timebase Comm Standard Setting
This control sets the communication standard bit rate that you want to test. Access this control from the
Horizontal MENU front panel button or from Setup > Horizontal.
Set PattenS
ync and FrameScan parameters
Selecting a Comm Standard automatically enters the bit rate for that standard into the Bit Rate field.
Manually entering a value in the Bit Rate field changes the Comm Standard field label to User.
See Also:
All Timebases Controls Overview (see page 72)
72 DSA8300 Printable Online Help

Controls-Specific Help Timebase Units Setting
Timebase Units Setting. (see page 73)
Display Scale Settings (see page 74)
Pattern Sync/
FrameScan Setup
(see page 74)
Timebase Units Setting
This control sets the type of units to use for the horizontal axis for all timebases. Select from seconds, bits,
or distance. The timebase scale and position controls use the units you select. Access this control from the
Horizontal MENU front panel button or from Setup > Horizontal.
The timebase scale and position controls will use the units specified by this control. In addition, all
measurement results will be in the specified units.
Units Setup
Select the Units Setup button to open the Units Setup dialog box, where you set distance units, dielectric
constant, and propagation velocity parameters when operating the instrument in TDR mode.
When you select Distance as the timebase units, the timebase scale and position controls use distance
units. The Distance field shown above contains a units control for choosing meters, feet, or inches as your
distance unit. The Dielectric Const(ant) field and Prop(agation) Velocity controls interact; you can select
either the dielectric constant of the device under test or its propagation velocity (each varies with the
other). Distance units are typically used for TDR measurements and testing.
DSA8300 Printable Online Help 73

Controls-Specific Help Display Scale Settings
See Also:
All Timebases Controls Overview (see page 72)
Timebase Comm Standard Setting. (see page 72)
Display Scale Settings (see page 74)
Pattern Sync/FrameScan Setup (see page 74)
Display Scale Settings
This control sets the horizontal display scale units type to per division (with 10 divisions per screen) or per
screen (10x the per division value). For example, 200 ps/div = 2 ns/screen. Access this control from the
Horizontal MENU front panel button or from Setup > Horizontal.
A common example of using the Per Screen setting is when you are examining a serial data signal with
the horizontal units set to bits. Knowing how many bits per division is of little use, where the Per Screen
setting shows how many bit times (or unit intervals) are displayed in the entire waveform graticule.
See Also:
All Timebases Controls Overview (see page 72)
Timebase Comm Standard setting. (see page 72)
Timebase Units Setting. (see page 73)
The Pattern Sync/FrameScan Setup Button (see page 74)
The Pattern Sync/FrameScan Setup Button
This button opens the Pattern Sync/FrameScan Setup dialog box, which contains controls for setting
pattern sync and FrameScan parameters. Access this control from the Horizontal MENU front panel
button or from Setup > Horizontal > Pattern Sync/FrameScan.
See Also:
Pattern Sync/FrameScan Setup Dialog Box (see page 126)
FrameScan Overview (see page 77)
74 DSA8300 Printable Online Help

Controls-Specific Help The Horizontal Acquisition Window Overview
The Horizontal Acquisition Window Overview
You define the horizontal acquisition window, that is, you set several parameters that determine the
segment of an incoming signal that becomes the waveform record when acquired. For background, see
ord
Waveform Rec
window that is applied to all channels in parallel. (See Independent versus Shared Window
These parameters are:
The external trigger signal that you input and set the trigger system to recognize determines the point
relative to the input waveform that triggers the instrument.
The horizontal position you set determines the horizontal delay from the trigger point to the first
sample point in the acquisition window.
The horizontal scale you set, and the requirement that all waveforms fit within the 10
horizontal-division display, determines the horizontal duration of the window relative to any
waveform, allowing you to scale it to contain a waveform edge, a cycle, or several cycles.
Horizontal Acquisition Window Definition
(see page 40). These common parameters specify a common horizontal acquisition
(see page 77).)
The record length (with the horizontal scale) you set for the 10-division window determines the sample
interval (horizontal point spacing or resolution) on the waveform.
The horizontal position controls the distance to the
the first sampled point.
Horizontal Reference to indirectly set the time to
See Also:
Horizontal Scale Versus Record Length Versus Sample Interval Versus Resolution (see page 76)
Horizontal Position Setting (see page 67)
DSA8300 Printable Online Help 75

Controls-Specific Help Horizontal Scale Versus Record Length Versus Sample Interval Versus Resolution
Horizontal Reference Setting (see page 71)
Horizontal Scale Versus Record Length Versus Sample Interval Versus
Resolution
These parameters all relate to each other and specify the horizontal acquisition window. Because the
horizontal acquisition window must fit in the 10 horizontal division display, for most cases, you just set
the duration of the horizontal acquisition window (10 divs x the scale setting) as described in (1) below.
By also set
for the horizontal acquisition window (waveform record). The relationships between these horizontal
elements are:
1. Time Duration (seconds) = 10 divs (window size) x Horizontal Scale (seconds/div)
ting a record length in samples, you indirectly set the resolution/sample interval/sample rate
2. Time Dura
Time Duration is the horizontal acquisition window time duration
3. Sample I
(samples/seconds)
In (2) a
(and its scale setting) and the Record Length setting as these later two elements are user settable.
If Rec
rate/lowest sample interval/highest resolution.
You c
(see equation 3 above)); they are derived values. You can, however, check the resolution at anytime in the
resolution readout (push the Horizontal Menu button).
NOTE. The Resolution knob adjusts the record length to increase sample density (detail).
bove, note that it is Sample Interval that varies indirectly to accommodate the window time duration
ord Length or Time Duration vary, Sample Interval varies to accommodate, up to the highest sample
annot directly set resolution and the equivalent elements (sample interval and effective sample rate
tion (seconds) = Sample Interval (seconds/sample) x Record Length (samples), where:
nterval (seconds/sample) = Res olution (seconds/sample) = 1/Effective Sample Rate
76 DSA8300 Printable Online Help

Controls-Specific Help Independent Versus Shared Window
Independent Versus Shared Window
For a given time base, the instrument applies the same horizontal acquisition window to all channels from
which it acquires data. Unlike the vertical acquisition window that you set independently for each channel,
the same time
you set for a time base, apply to all channels in that time base. In other w ords, one trigger, from a single
trigger source, will locate a common horizontal acquisition window on all active channels, which you
can shift by setting t he horizontal position control.
The horizontal acquisition window determines the waveform records extracted from all signals present at
all active channels and math waveforms. You can think of the horizontal acquisition window as cutting
across any input signals present in the input channels to extract the same slice of time into waveform
records. See the figure that follows, which shows a common trigger, record length and acquisition rate
are commo
/division, resolution (record length), and horizontal delay (from the same trigger point) that
n for all channels.
FrameScan Overview
FrameScan acquisitions help you analyze pattern-dependent failures in high bit-rate communications
signals, as well as provide detailed display and analysis of individual, complete waveforms or of the bit
sequences leading up to a failure. The ability to identify the specific patterns that caused the failures makes
using FrameScan mode superior to traditional methods.
Using FrameScan along with magnification views and mask testing can help you quickly locate and debug
pattern dependent serial data compliance test failures. The following image shows how FrameScan
identified the location in a data stream where an invalid signal transition occurs. The serial data pattern
signal is in the upper Main view; the lower Mag1 view shows the magnified view of the specified Main
view area. You can also view the signal before and after the invalid signal transition.
DSA8300 Printable Online Help 77
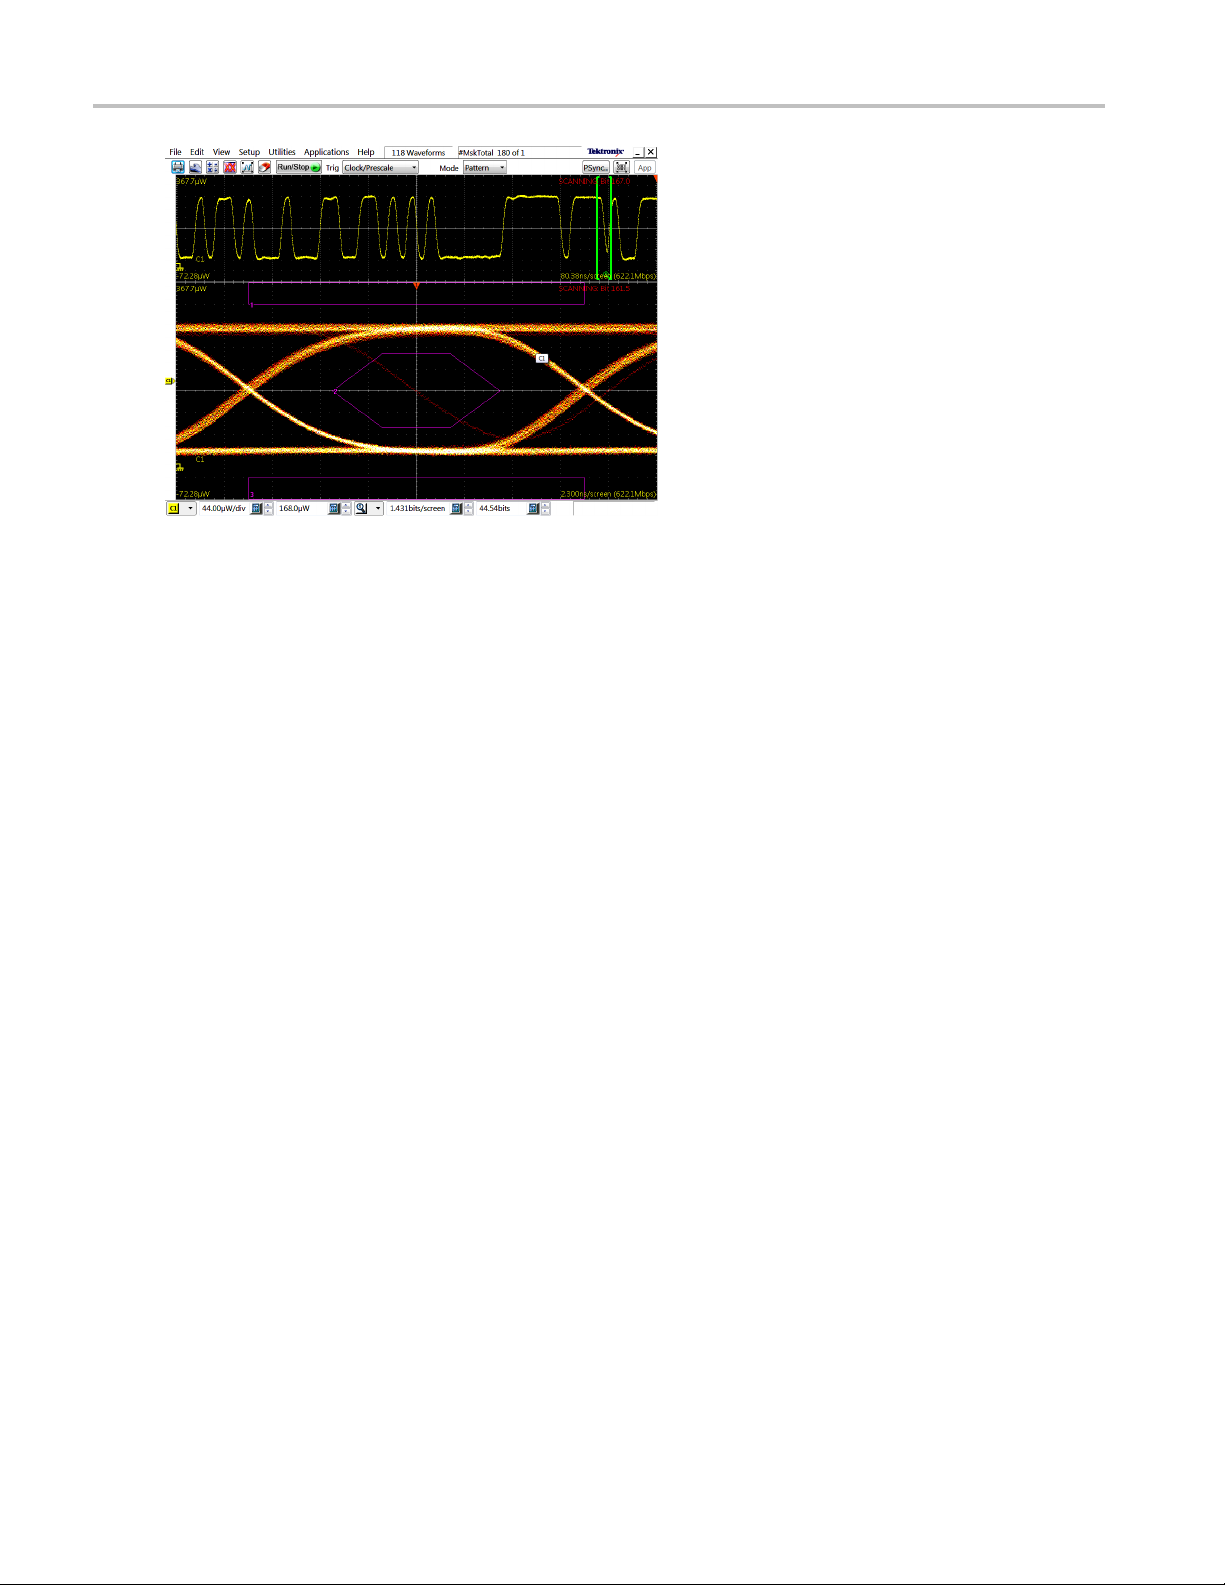
Controls-Specific Help FrameScan Overview
FrameScan acquisition mode offers the following advantages.
Breakthrough time base stability. When using the internal pattern sync capability, timing accuracy
typically varies no more than 0.1 ps, providing the stability needed to examine signals of almost any
length for pattern-dependent failures.
Flexible setup support. Set bit rates manually or set a bit rate based on a communication standard. Then
set the
independent bit rate, or Standard-Mask Autoset, if you set bit rate based on a communication standard.
Identification and analysis of pattern-dependent failures. FrameScan a cquisition, when used with
mask testing and Stop After condition acquisition, can automatically determine the bit at which a
pattern-dependent failure occurred.
Ability to acquire and display correlated eye diagrams. FrameScan mode acquires data synchronously
with respect to the pattern. This makes it possible to acquire averaged waveforms which minimizes
uncorrelated (random) noise and jitter. This capability lowers the effective instrument noise floor, enabling
the examination of very low power optical signals. Since FrameScan scans through the pattern one bit at a
time, it is possible to overlay all of the bits in the pattern to construct an averaged (correlated) eye diagram
an
The instrument must be in Average or Sample acquisition modes; FrameScan excludes Envelope
a
FrameScan is most useful when used with the Pattern scope mode (Clock trigger source), which requires
the ADVTRIG Advanced Triggers with Pattern Sync option. However,itmayalsobeusedintheother
scope modes (Eye and Other) to acquire multiple phases of a data pattern when using subdivided clocks.
Determine scan bits. You n eed to know the total number of bits for the desired FrameScan cycle, as
well as the appropriate horizontal scale.
horizontal scale manually or invoke a custom autoset: Bit/Eye-Pattern Autoset, if you have set an
dtodomasktestingonthesignal(seeabovefigure).
cquisition mode.
78 DSA8300 Printable Online Help

Controls-Specific Help FrameScan Theory of Operation
See Also
FrameScan Theory of Operation (see page 79)
FrameScan Enable and Scan Bits (see page 81)
FrameScan Theory of Operation
FrameScan mode alters the normal acquisition sequence to scan a repetitive data pattern or a sub-portion
of the bit sequence or pattern. The steps in the FrameScan acquisition are as follows:
1. The horizontal position is set to acquire the first bit, which the acquisition system acquires as a
subframe (see the figure that follows).
2. The horizontal position is incremented one-bit period (1/bit rate), and then the acquisition system
acquires the second bit as a subframe. The duration of each subframe acquisition is determined by
the horizontal scale.
3. This sequence of incrementing, and then acquiring the next bit, continues until the instrument acquires
the number of bits you specify for the frame , or until acquisition stops due to a specific test condition,
such as the failure of a mask test.
4. The resulting horizontally skewed FrameScan acquisitions display successive individual bits acquired
in increasing time order. FrameScan acquisitions can continue through an entire frame of data if
needed to help you to uncover faulty bit sequences leading up to pattern-dependent failures.
. You must supply a data or clock signal that is synchronous to the signal data pattern. Examples
NOTE
include inputting an optical serial data signal into an optical module with clock recovery, or inputting a
clock into the front panel Clock Input/Prescale Trigger input that is synchronous to a serial data signal
connected to the input of a sampling module.
DSA8300 Printable Online Help 79

Controls-Specific Help FrameScan Theory of Operation
FrameScan acquisition example
NOTE. Δh is the horizontal position change = one bit period (1/bit rate).
The acquisition d uration is determined by the horizontal scale. For example, if the scale is set to acquire 5
bits, then each subframe acquired is 5 bits in duration, shifted by one bit duration for each subframe.
80 DSA8300 Printable Online Help
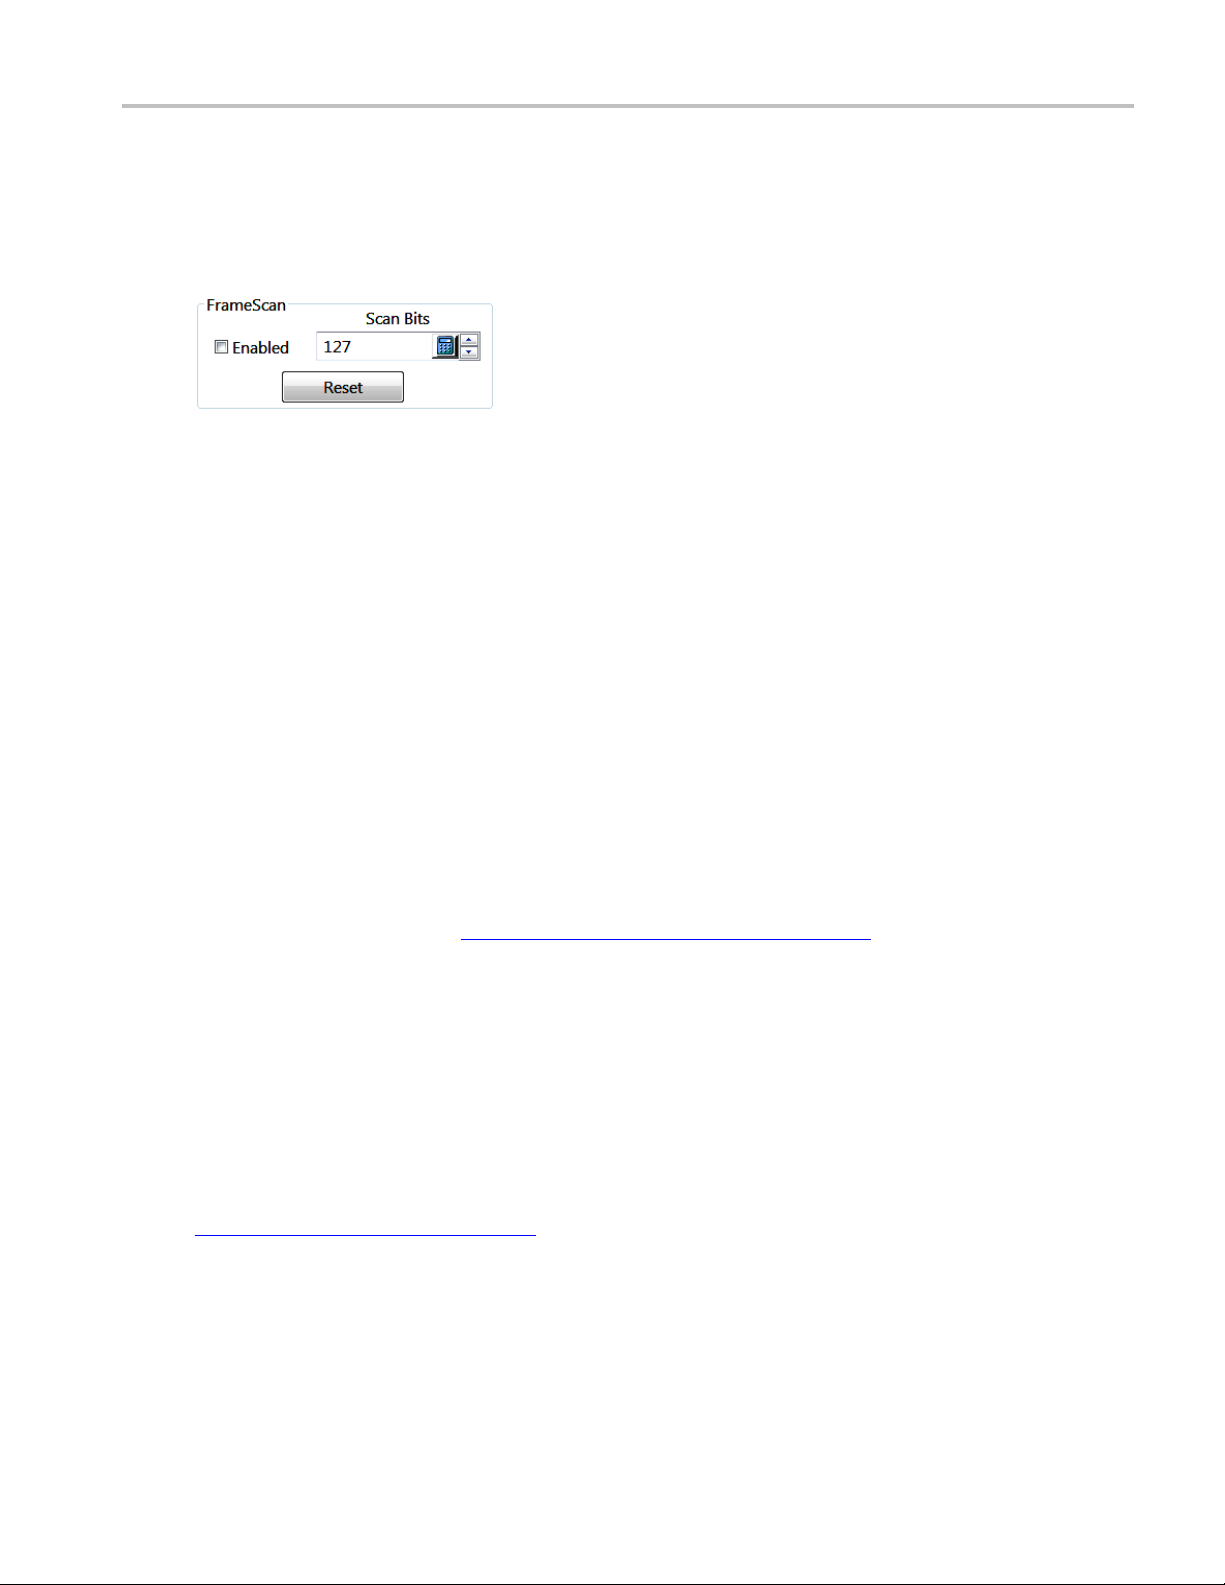
Controls-Specific Help FrameScan Enable and Scan Bits
FrameScan Enable and Scan Bits
Access this control from Setup > Horizontal > Pattern Sync/FrameScan.
Enabled. Enables or disables FrameScan. Scanning starts as soon as you enable FrameScan.
Scan Bits. Sets the number of bits or subframes to acquire. The range of Scan Bits is from 2 to 8,388,608
23
).
(2
Reset. Restart FrameSc an acquisition.
FrameScan lets you acquire and analyze repeating digital data patterns (typically Pseudo-Random Bit
Streams, or PRBSs) that are contained within a data “frame”. FrameScan is an acquisition technique that
controls how successive acquisitions occur. It can be used with any trigger source that provides a clock
signal that is synchronous to the serial data stream.
FrameScan automatically sequences or skews the timebase such that each bit, or unit interval, of the data
stream is acquired in increasing time order. The acquisition of each sample of each bit, and of each
bit of the desired bit stream, is based on the trigger events derived from an externally provided clock
signal (or internally provided when using clock recovery capable modules). Because the sequencing or
“scanning” of the timebase occurs automatically within the instrument, there is no need to interact with the
external signal source or the instrument once they are appropriately set up. For more information on how
FrameScan acquires data, see FrameScan Theory of Operation
FrameScan displays bit 0 of the data stream at the left edge of the graticule.
A primary use of FrameScan is to locate pattern-dependent anomalies. This is accomplished by using
FrameScan with the Mask Testing and Acquisition Stop After features (specifically the S top After
mask hits condition). You can also refer to a technical brief on this topic titled Finding and Examining
Pattern-Dependent Failures with the FrameScan
http://www.tektronix.com to find this brief.
See Also:
Acquisition Background (see page 36)
Mask Setup Dialog B ox Overview
(see page 79).
®
Acquisition Technology. Visit the Tektronix Website at
Use this dialog box to select (or edit) masks and run mask tests on incoming waveforms.
DSA8300 Printable Online Help 81

Controls-Specific Help Mask Setup Dialog Box Overview
Key Features:
Select signal source and communications standard (see page 82)
Enable/disable waveform database
Enable/disable mask testing (see page 82) display and color
Enable and set mask margin percent (see page 83)
Autoset (see page 83) mask to signal
Create or edit (see page 83) amask
xxx
Control Information:
Mask Source Settings (see page 83)
Mask Display Settings (see page 84)
Mask Margin Settings (see page 85)
Mask Autoset Settings (see page 86)
Mask E
dit Dialog Box
(see page 87)
Mask Testing Communication Standards
This instrument includes many industry-standard masks to support common electrical and optical
communication physical layer standards.
Mask Testing
A mask contains one or more mask polygon shapes that, when applied against the waveform type
for which it is intended, tests the waveform for violations of that mask. Waveform samples that fall
within the mask areas are c alled mask violations, failures, or hits.
The list of hits per polygon mask is called the Mask Statistics or Results. Mask testing, like
histograms, can operate on either live data or data accumulated in a waveform database.
82 DSA8300 Printable Online Help
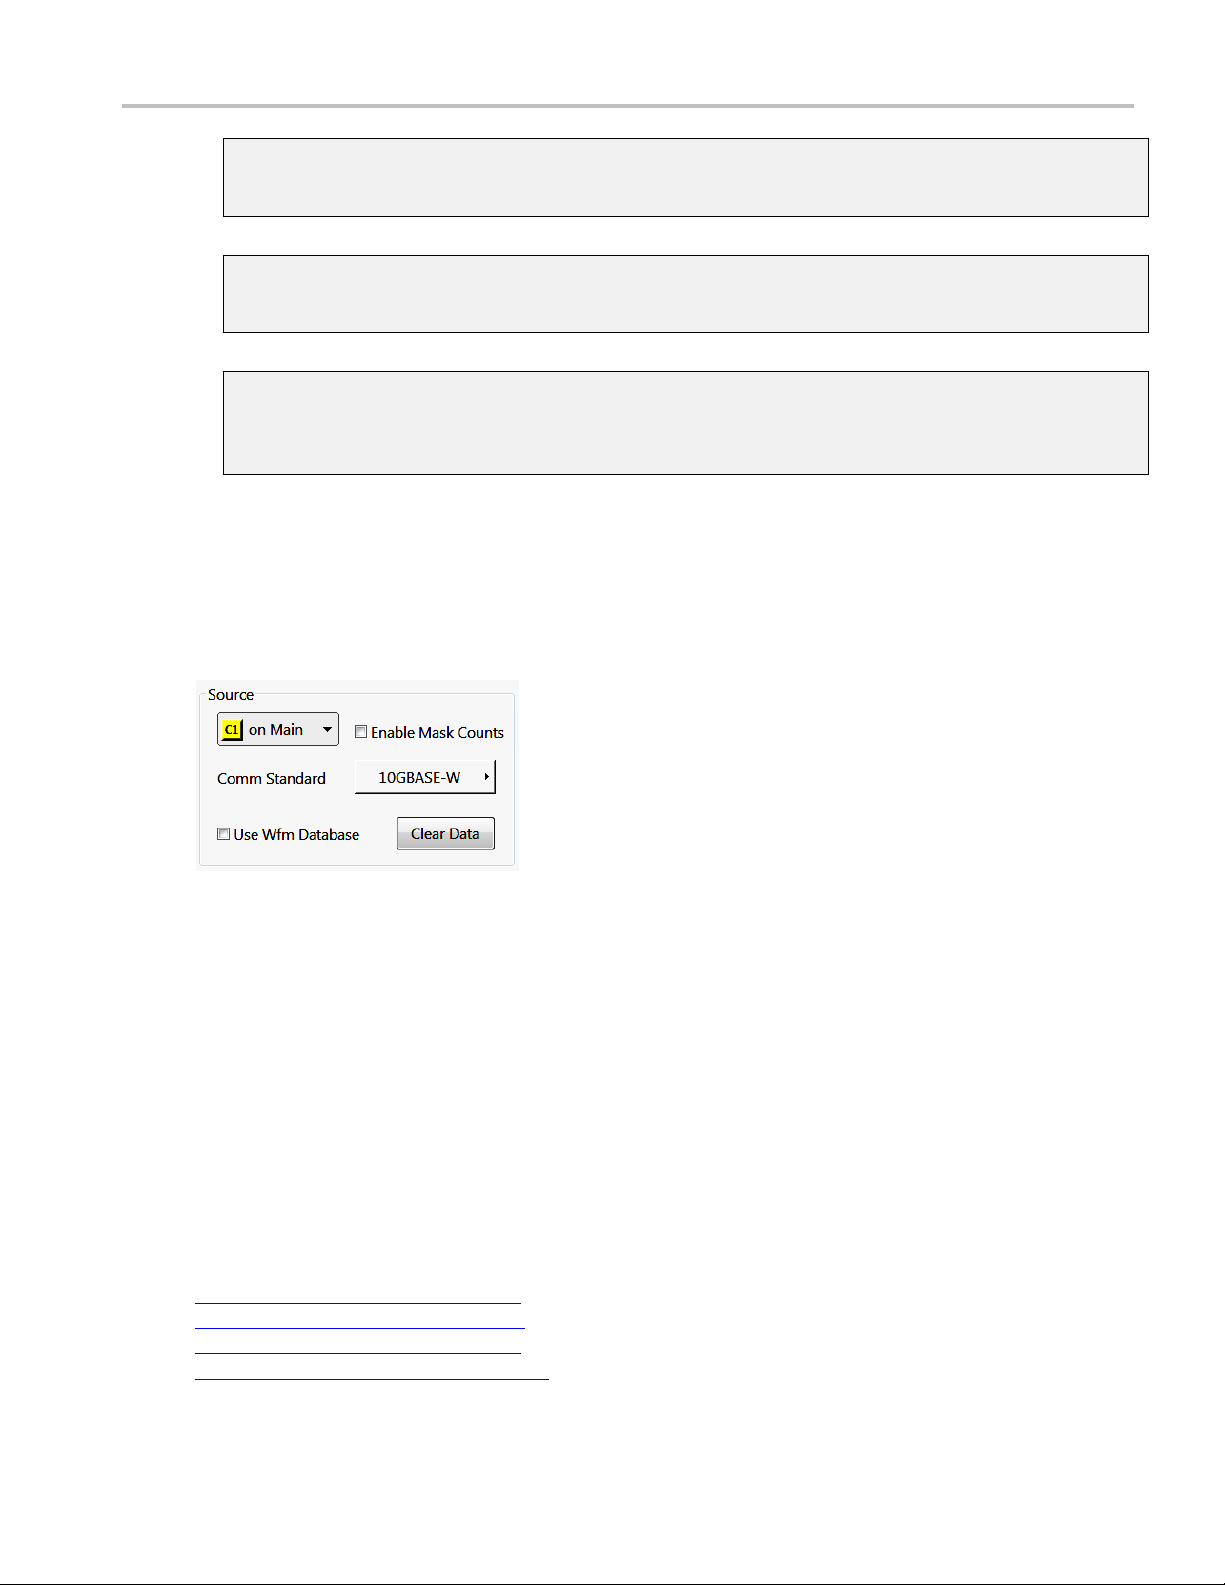
Controls-Specific Help Mask Source Settings
Mask Margin Percent
Mask margins let you shrink or expand an existing set of polygons by a specified percentage.
Autoset Mask
Autoset aligns the waveform to match the selected mask.
Mask Edit Dialog Box
Click the Mask Edit button to modify a mask or create your own custom mask, e ither from scratch or
by using a standard mask as a starting point.
Mask Source Settings
This control sets the source waveform for mask testing, enables mask
standard, and turns the use of waveform databases on and off. Access this control from Setup > Mask.
You can use any waveform entity as the source for mask testing. Select a waveform and then click Enable
Mask Counts to turn on mask counting.
Comm Standard. Use the Comm Standard button and menu to select a communication standard you want
to perform mask testing on.
Use Wfm Database. Click Use Wfm Database to turn on and off the use of waveform databases for mask
sources. When Use Wfm Database is checked, the instrument attempts to associate a waveform database
resource to the live waveform s ource. If the source for mask testing is displayed as a waveform database at
the time you enable mask testing, the Use Wfm Database control is turned on by default.
Clear Data. Click Clear Data to reset all mask counts.
counts, selects a communication
See Also:
Mask Display Settings (see page 84)
Mask Margins Settings (see page 85)
Mask Autoset Settings (see page 86)
Mask Hit Count Statistics (see page 90)
DSA8300 Printable Online Help 83

Controls-Specific Help Mask Display Settings
Mask Edit Dialog Box (see page 87)
Mask Display Settings
This control enables or disables displaying the mask, and sets the mask display color. Access this control
from Setup > Mask.
Mask. Click Mask to display the mask. Clear the check box to remove the mask from the screen.
Color. Selects the color of the displayed mask.
See Also:
Mask Source Settings (see page 83)
Mask Margins Settings (see page 85)
Mask Autoset Settings (see page 86)
Mask Hit Count Statistics (see page 90)
Mask E
dit Dialog Box
(see page 87)
84 DSA8300 Printable Online Help

Controls-Specific Help Mask Margins Settings
Mask Margins Settings
These controls enable or disable the mask margin parameter, and set the margin parameters. Access this
control from Setup > Mask.
On. Use the On check box to turn the selected mask margins on and off.
Margin. Use the Margin percent control to set the percentage by which an existing set of mask polygons
will expand or shrink when mask margins are turned on. If you select a positive mask margin percentage,
the polyg
If you select a negative mask margin percentage, the polygon shrinks, making the mask test easier to
pass due to the smaller area.
The margin limits are ±100%. If you enter a margin percentage that would cause the modified masks to
either go off screen or cross one another, the entered value is not allowed, the last valid margin is restored,
and a warning message is displayed.
on expands, making the mask test more difficult to pass due to the expanded mask violation area.
See Also:
Mask Source Settings (see page 83)
Mask Display Settings (see page 84)
Autoset Settings
Mask
Mask Hit Count Statistics (see page 90)
Mask Edit Dialog Box (see page 87)
(see page 86)
DSA8300 Printable Online Help 85

Controls-Specific Help Mask Autoset Settings
Mask Autoset Settings
These c ontrols set the mask autoset parameters. These controls are enabled only when you select a
communications sta ndard. Access these controls from Setup > Mask.
Standards masks have standard autoset algorithms. When you display a standard mask (or even a mask
derived from a standard mask), invoking Autoset performs an autoset algorithm specific to the mask
standard.
Automat
Manual. When you set it to Auto, the instrument automatically performs a standard mask-specific autoset
whenever you select a standard mask. When you set it to Manual, no autoset operation occurs unless
you click the Autoset button.
Mean/Mode. You can also select the method used for determining the High and Low values when aligning
the in
methods are:
ic/Manual. You can change autoset behavior by setting the Autoset control to either Auto or
put signal to the masks (all supported masks are based on NRZ signals). The behaviors of the
sets Mask Autoset to use the means of the histograms of the High level (topline) and Low level
Mean
(baseline) within the existing fixed eye aperture (center 20% of the eye) to align the input signal
to the NRZ mask. Mean is the default setting.
Mode sets Mask Autoset to use the modes of the histograms o f the High level (topline) and Low level
(baseline) across one unit interval of the eye diagram to align the input signal to the NRZ mask. This
selection forces the Comm. Standard setting to USER.
See Also:
Mask Source Settings (see page 83)
Mask Display Settings (see page 84)
Mask Margins Settings (see page 85)
Mask Hit Count Statistics (see page 90)
Mask Edit Dialog Box (see page 87)
86 DSA8300 Printable Online Help

Controls-Specific Help Mask Edit Dialog Box Overview
Mask Edit Dialog Box Overview
Use this dialog box to manually create and edit masks. Access these controls from Setup > Mask >
Mask Edit.
Key Features:
Create masks from scratch
Use existing masks as a starting point
Set horizontal and vertical values for selected vertices
Add or delete mask polygons and vertices to masks to create custom
masks
Use the mouse cursor and right-click context menu to edit a mask on the
display (see page 88) (select a mask, add or delete vertices, and move
vertices)
xxx
Mask. Indicates or selects the current mask polygon. A mask test can have up to 8 mask polygons. To
create a new mask, select an undefined mask and add vertices to the mask.
Vertex Number. Displays the selected vertex number of the current mask polygon. Use the field controls,
or enter a value in the field, to select a vertex. You can also use the mouse to select a mask vertex.
Horizontal. Displays the c urrent vertex horizontal position. Use the field controls, or enter a value in the
field, to define the horizontal position of the selected vertex.
Vertical. Displays the current vertex vertical position. Use the fields controls, or enter a value in the field,
to define the vertical position of the selected vertex.
Add. Adds a vertex to the selected mask. Position the cursor at the location to insert the new vertex and
click Add.
Delete. Deletes the current vertex. You cannot undo this action. To delete a polygon, delete all the
vertices in the polygon.
DSA8300 Printable Online Help 87

Controls-Specific Help Mask Usage Guidelines
NOTE. You cannot edit a mask remotely using GPIB commands.
See Also:
Mask Usage Guidelines (see page 88)
Creating Use
Mask Hit Count Statistics (see page 90)
r Masks (Mask Editing)
(see page 88)
On-Screen Mask Editing
Click on a mask polygon to select. Use the mouse to move vertices to quickly rough in the parameters.
Use the right-click context menu to add or delete vertices. Then use the Mask Edit dialog box to
refine the vertex settings to meet your signal testing requirements.
Mask Usage Guidelines
GPIB and masks. You cannot edit masks through the programmable interface (GPIB). You can create
and/or delete entire masks through the interface.
Concurrent mask tests. Only one mask standard (or user defined set) is active at any time. If you have
a ma sk selected/enabled and then select a new mask, the new mask replaces the previous mask. You
cannot test to multiple standards simultaneously.
Saving masks. Masks are saved as part of instrument setup files, so you can save sets of masks by defining
the masks and then storing the instrument setup. Displayed masks are overwritten when you recall a stored
setup, select a standard mask, or initialize the instrument.
Importing masks. Use the File > Import Custom Mask dialog box to import a custom mask. Once
imported, the custom mask can be selected from the Communication Standard list. Contact Tektronix
request a custom-designed mask for your testing needs.
Creating User Masks (Mask Editing)
Masks can be edited, in which case they become a User mask. Some tips on creating and using masks
follow:
When editing, locate one point along the left edge or right edge of the mask further left or further right
than any other point. You can still create straight lines along the edge; just place one point further left
or right than the others on the edge.
) to
The vertices numbers increase according to their order from left to right. The instrument reassigns
numbers to vertices during mask creation or editing to hold to this rule.
88 DSA8300 Printable Online Help
 Loading...