

Page 1

x
DSA8200
DigitalSerialAnalyzer
ZZZ
Quick Start User Manual
*P071204706*
071-2047-06
Page 2

Page 3

xx
DSA8200
Digital Serial Analyzer
ZZZ
Quick Start User Manual
www.tektronix.com
071-2047-06
Page 4

Copyright © Tektronix. All rights reserved. Licensed software products are owned by Tektronix or its subsidiaries or suppliers, and are
protected by na
tional copyright laws and international treaty provisions.
Tektronix pro
previously published material. Specifications and price change privileges reserved.
TEKTRONIX and TEK are registered trademarks of Tektronix, Inc.
TEKPROBE and FrameScan are registered trademarks of Tektronix, Inc.
ducts are covered by U.S. and foreign patents, issued and pending. Information in this publication supersedes that in all
Contacting Tektronix
Tektronix, Inc.
14200 SW Karl Braun Drive
P.O. Box 500
Beaverton, OR 97077
USA
For product information, sales, service, and technical support:
In North America, call 1-800-833-9200.
Worldwide, visit www.tektronix.com to find contacts in your area.
Page 5

Warranty
Tektronix warrants that this product will be free from defects in materials and workmanship for a period of one (1) year from the date of
shipment. If any such product proves defective during this warranty period, Tektronix, at its option, either will repair the defective
product without charge for parts and labor, or will provide a replacement in exchange for the defective product. Parts, modules and
replacement products used by Tektronix for warranty work may be new or reconditioned to like new performance. All replaced
parts, modules and products become the property of Tektronix.
In order to obtain service under this warranty, Customer must notify Tektronix of the defect before the expiration of the warranty period
and make suitable arrangements for the performance of service. Customer shall be responsible for packaging and shipping the
defective product to the service center designated by Tektronix, with shipping charges prepaid. Tektronix shall pay for the return of the
product to Customer if the shipment is to a location within the country in which the Tektronix service center is located. Customer shall
be responsible for paying all shipping charges, duties, taxes, and any other charges for products returned to any other locations.
This warranty shall not apply to any defect, failure or damage caused by improper use or improper or inadequate maintenance and
care. Tektronix shall not be obligated to furnish service under this warranty a) to repair damage resulting from a ttempts by personnel
other than Tektronix representatives to install, repair or service the product; b) to repair damage resulting from improper use or
connection to incompatible equipment; c) to repair any damage or malfunction caused by the use of non-Tektronix supplies; or
d) to service a product that has been modified or integrated with other products when the effect of such modification or integration
increases the time or difficulty of servicing the product.
THIS WARRANTY IS GIVEN BY TEKTRONIX WITH RESPECT TO THE PRODUCT IN LIEU OF ANY OTHER WARRANTIES,
EXPRESS OR IMPLIED. TEKTRONIX AND ITS VENDORS DISCLAIM ANY IMPLIED WARRANTIES OF MERCHANTABILITY OR
FITNESS FOR A PARTICULAR PURPOSE. TEKTRONIX’ RESPONSIBILITY TO REPAIR OR REPLACE DEFECTIVE PRODUCTS
IS THE SOLE AND E XCLU S IVE REMEDY PROVIDED TO THE CUSTOMER FOR BREACH OF THIS WARRANTY. TEKTRONIX
AND ITS VENDORS WILL NOT BE LIABLE FOR ANY INDIRECT, SPECIAL, INCIDENTAL, OR CONSEQUENTIAL DAMAGES
IRRESPECTIVE OF WHETHER TEKTRONIX OR THE VENDOR HAS ADVANCE NOTICE OF THE POSSIBILITY OF SUCH
DAMAGES.
[W2 – 15AUG04]
Page 6

Page 7

Table of Contents
General Safety Summary ...... . . . . . .... . . . . . . ... . . . . . . .... . . . . . .... . . . . . . ... . . . . . . .... . . . . . ..... . . . . . .... . . . . . . ... . . . . . . .... . . . . . .... iii
Compliance Information............................................................................................................... v
EMC Compliance................................................................................................................. v
Safety Compliance.............................................................................................................. vii
Environmental Considerations................................................................................................... ix
Preface................................................................................................................................. x
Documentation ...................................................................................................................x
Conventions Used in this Manual . . . . .... . . . . . . .... . . . . . . . ... . . . . . . .... . . . . . . ..... . . . . . . .... . . . . . . ... . . . . . . . .... . . . . . . .... . . . . . . xi
Key Features........................................................................................................................... 1
Install Your Instrument................................................................................................................. 3
Standard Accessories. . . .... . . . . . . .... . . . . . . .... . . . . . . ... . . . . . . .... . . . . . . .... . . . . . . ... . . . . . . .... . . . . . . .... . . . . . ..... . . . . . . ... . . . . 3
Operating Considerations........................................................................................................ 4
Installing Modules . .... . . . . . .... . . . . . .... . . . . . .... . . . . . .... . . . . . . .... . . . . . .... . . . . . .... . . . . . .... . . . . . .... . . . . . .... . . . . . .... . . . . . .. 6
Powering the Instrument On and Off ............................................................................................ 7
Adding a Second Monitor........................................................................................................ 8
Changing the W indows Language . . .... . . . . . . .... . . . . . . .... . . . . . . . ... . . . . . . .... . . . . . . ..... . . . . . . .... . . . . . . ... . . . . . . . .... . . . . . . 10
Getting Acquainted with Your Instrument.. . . . . . . ... . . . . . . .... . . . . . . ... . . . . . . ... . . . . . . .... . . . . . . .... . . . . . . ... . . . . . . ... . . . . . . .... . . . . . 13
Front Panel .. . . . . . . . .... . . . . . . .... . . . . . . ..... . . . . . . .... . . . . . . .... . . . . . . . ... . . . . . . . ... . . . . . . . .... . . . . . . .... . . . . . . ..... . . . . . . .... . .13
Control Panel .. . . . . . . .... . . . . . . ..... . . . . . . ... . . . . . . .... . . . . . . ..... . . . . . . ... . . . . . . .... . . . . . . ..... . . . . . . ... . . . . . . .... . . . . . . .... . . . .14
Rear Panel .... . . . . . . .... . . . . . . .... . . . . . . .... . . . . . . .... . . . . . . .... . . . . . . .... . . . . . . .... . . . . . . .... . . . . . . .... . . . . . . .... . . . . . . ... . . . . . 16
Computer I/O Panel . . . . . ..... . . . . . . ... . . . . . . .... . . . . . . ... . . . . . . ..... . . . . . .... . . . . . . .... . . . . . . ... . . . . . . .... . . . . . . .... . . . . . . ... . . . 17
Interface ......................................................................................................................... 17
Display - Single Graticule View................................................................................................. 19
Display - Multiple Views......................................................................................................... 20
Accessing Online Help.......................................................................................................... 20
Inspect Your Instrument .............................................................................................................. 23
Verify Internal Diagnostics Pass . . . . .... . . . . . .... . . . . . ... . . . . . . ... . . . . . . ... . . . . . . ... . . . . . . ... . . . . . .... . . . . . .... . . . . . ... . . . . . . ... 23
Optimizing Measurement Accuracy.................................................................................................. 25
Signal P a th Compensation . . . . . .... . . . . . .... . . . . . . ... . . . . . . .... . . . . . ..... . . . . . .... . . . . . . ... . . . . . . .... . . . . . .... . . . . . . ... . . . . . . .. 25
Perform Dark-Level and User Wavelength Ga
isition ............................................................................................................................ 30
Acqu
Setting Up Signal Input . . . . ... . . . . . . .... . . . . . . .... . . . . . . .... . . . . . . ... . . . . . . .... . . . . . . .... . . . . . . ... . . . . . . .... . . . . . . .... . . . . . . .... 30
Using Autoset ................................................................................................................... 32
Using Default Setup............................................................................................................. 32
Accessing theSetup Dialog Boxes............................................................................................. 33
Changing the Acquisition Mode . . . . ... . . . . . . .... . . . . . . .... . . . . . . ... . . . . . . .... . . . . . .... . . . . . . ... . . . . . . .... . . . . . ..... . . . . . .... . . . 34
Setting the Display Style........................................................................................................ 35
Triggers . . . ... . . . . . ... . . . . . ... . . . . . .... . . . . ... . . . . . ... . . . . . . ... . . . . ... . . . . . . ... . . . . . ... . . . . . ... . . . . . ... . . . . . ... . . . . . .... . . . . ... ........ 37
Triggering Concepts. ... . . . . . . ... . . . . . . .... . . . . . .... . . . . . .... . . . . . .... . . . . . .... . . . . . .... . . . . . .... . . . . . . ... . . . . . . ... . . . . . . ... . . . . . 37
Setting Trigger Controls...... . . . . . . ... . . . . . . .... . . . . . . ... . . . . . . .... . . . . . . .... . . . . . . .... . . . . . . ... . . . . . . .... . . . . . . .... . . . . . . ... . . . 40
Setting Pattern Sync Controls .................................................................................................. 41
Checking Trigger Status . . . ..... . . . . . . ... . . . . . . .... . . . . . . ... . . . . . . .... . . . . . . .... . . . . . . .... . . . . . .... . . . . . . .... . . . . . . .... . . . . . . ... 42
Table of Content
in Compensations. . . . .... . . . . . .... . . . . . . ... . . . . . . ... . . . . . . ... . . . . . . ... . . . . . . .. 27
s
DSA8200 Quick Start User Manual i
Page 8

Table of Content
Analyzing Waveforms . . . . . ..... . . . . . . ... . . . . . . .... . . . . . . .... . . . . . . .... . . . . . . .... . . . . . . ... . . . . . . ..... . . . . . . ... . . . . . . .... . . . . . . .... . ... 43
Using the 8
Skew and Deskewing................................................................................................................. 72
Cleani
Restoring the Operating System.....................................................................................................86
Index
s
Taking Automat
Turning Off Automatic Measurements.......................................................................................... 47
Cursor Measurements .......................................................................................................... 48
Math Waveform
Waveform Databases . . .... . . . . . . .... . . . . . . .... . . . . . . .... . . . . . . ... . . . . . . . .... . . . . . . .... . . . . . . ... . . . . . . . .... . . . . . . .... . . . . . . ... . . 52
Display a Communication Signal . . ... . . . . . . .... . . . . . . ... . . . . . . .... . . . . . . .... . . . . . . .... . . . . . . ... . . . . . . .... . . . . . . .... . . . . . . ... . . . 53
Display and A
FrameScan ...................................................................................................................... 57
To Use TDR ..................................................................................................................... 58
Phase Refer
Histograms ......................................................................................................................61
Document Your Results......................................................................................................... 63
0A05 Electrical Clock Recovery Module Examples . . . . .... . . . . . . ... . . . . . . .... . . . . . .... . . . . . . ... . . . . . . .... . . . . . ..... . . . 65
Clock Recovery / Trigger on Recovered Clock ..... . . . . . . ... . . . . . . .... . . . . . . ... . . . . . . .... . . . . . . .... . . . . . . ... . . . . . . .... . . . . . . .. 66
Clock Recovery / Trigger for Optical Signal, with the 80C12 Optical Module . .... . . . . . .... . . . . . . .... . . . . . . ... . . . . . . ... . . . . . . 67
Differen
Probing with Low-Impedance Probes . . . . . . .... . . . . . . ... . . . . . . ..... . . . . . . ... . . . . . . .... . . . . . . ... . . . . . . . .... . . . . . . ... . . . . . . .... . . 69
Probing with Differential to Single-Ended Probes. . . . .... . . . . . ..... . . . . . .... . . . . . . ... . . . . . . .... . . . . . .... . . . . . . ... . . . . . . .... . . . . 70
Vertical
Methods toAdjust Skew ........................................................................................................ 72
Setup Co
Acquisition Deskew Procedure . . . . . . . ... . . . . . . ... . . . . . . .... . . . . . . ... . . . . . . ... . . . . . . .... . . . . . . .... . . . . . . ... . . . . . . ... . . . . . . .... . . 78
TDR Step Deskew P rocedure . . .... . . . . . . ... . . . . . . . .... . . . . . . ... . . . . . . .... . . . . . . .... . . . . . . .... . . . . . . .... . . . . . . ... . . . . . . ..... . . . 81
ng the Instrument.............................................................................................................. 85
Exterior Cleaning... . . . . . . .... . . . . . .... . . . . . .... . . . . . . ... . . . . . . ... . . . . . . ... . . . . . . ... . . . . . . .... . . . . . .... . . . . . .... . . . . . . ... . . . . . . ..85
Flat Panel Display Cleaning .... . . . . . . .... . . . . . .... . . . . . . ... . . . . . . ..... . . . . . .... . . . . . . ... . . . . . . .... . . . . . . ... . . . . . . .... . . . . . . .... 85
al Connector Cleaning . . . . .... . . . . . . ... . . . . . . ..... . . . . . . .... . . . . . . ... . . . . . . ..... . . . . . . .... . . . . . . ... . . . . . . ..... . . . . . . ... . . . 85
Optic
Restoring theOperating System with Restore Discs .......................................................................... 87
ring the Operating System from the Instrument Hard Disk Drive (SN B020551 through B029999) ... . . . . . . .... . . . . . 87
Resto
Create Restore CD-ROMs (Serial Numbers B020551 to B029999) . . ... . . . . . . ..... . . . . . . ... . . . . . . .... . . . . . . ..... . . . . . . ... . . . 88
ic Measurements............................................................................................... 43
s ................................................................................................................ 50
nalyze Communication Signals Using Mask Testing........................................................... 54
ence................................................................................................................ 60
tial Clock Recovery and Acquisition ................................................................................... 68
Gain Adjustment........................................................................................................ 71
nsiderations and P rocedures . . . . .... . . . . . . ... . . . . . . .... . . . . . .... . . . . . . ... . . . . . . ..... . . . . . .... . . . . . . ... . . . . . . .... . . . . . 73
ii DSA8200 Quick Start User Manual
Page 9

General Safety S
ummary
General Safet
Review the following safety precautions to avoid injury and prevent damage to this product or any products connected to it.
To avoid potential hazards, use this product only as specified.
Only qualified personnel should perform service procedures.
While using this product, you may need to access other parts of a larger system. Read the safety sections of the other
component manuals for warnings and cautions related to operating the system.
To Avoid Fire or Personal Injury
Use Proper Power Cord. Use only the power cord specified for this product and certified for the country of use.
Connect and Disconnect Properly. Do not connect or d isconnect probes or test leads while they are c onnected
to a voltag
Ground th
shock, the grounding conductor must be connected to earth ground. Before making connections to the input or output
terminals of the product, ensure that the product is properly grounded.
Observe All Terminal Ratings. To avoid fire or shock hazard, observe all ratings and markings on the product. Consult
the prod
The inpu
e source.
e Product.
uct manual for further ratings information before making connections to the product.
ts are not rated for connection to mains or Category II, III, or IV circuits.
y Summary
This product is grounded through the grounding conductor of the power cord. To avoid electric
Do not ap
Power D
Do not block the power switch; it must remain accessible to the user at all times.
ply a potential to any terminal, including the common terminal, that exceeds the maximum rating of that terminal.
isconnect.
The power switch disconnects the product from the power source. See instructions for the location.
Do Not Operate Without Covers. Do not operate this product with covers or panels removed.
Do Not Operate With Suspected Failures. If you suspect that there is damage to this product, have it inspected by
qualified service personnel.
Avoid Exposed Circuitry. Do not touch exposed connections and components when power is present.
Use Proper Fuse. Use only the fuse type and rating specified for this product.
Wear Eye Protection. Wear eye protection if exposure to high-intensity rays or laser radiation exists.
Do Not Operate in Wet/Damp Conditions.
Do Not Operate in an Explosive Atmosphere.
Keep Product Surfaces Clean and Dry.
Provide Proper Ventilation.
oper ventilation.
pr
Refer to the manual’s installation instructions for details on installing the product so it has
DSA8200 Quick Start User Manual iii
Page 10

General Safety S
TermsinthisManual
These terms may appear in this manual:
WARNING. Warning statements identify conditions or practices that could result in injury or loss of l ife.
CAUTION. Caution statements identify c onditions or practices that could result in damage to this product or other property.
Symbols and Terms on the Product
These terms may appear on the product:
DANGER indicates an injury hazard immediately accessible as you read the marking.
WARNING indicates an injury hazard not immediately accessible as you read the m arking.
CAUTION indicates a hazard to property including the product.
The following symbol(s) may appear on the product:
ummary
iv DSA8200 Quick Start User Manual
Page 11

Compliance Info
rmation
Compliance In
This section lists the EMC (electromagnetic compliance), safety, and environmental standards with which the instrument
complies.
EMC Compliance
EC Declaration of Conformity – EMC
Meets intent of Directive 2004/108/EC for E lectromagnetic Compatibility. Compliance was demonstrated to the following
specifications as listed in the Official Journal of the European Communities:
EN 61326-1:2006, EN 61326-2-1:2006. EMC requirements for electrical equipment for measurement, control, and
laboratory use.
CISPR 11:2003. Radiated and conducted emissions, Group 1, Class A
IEC 61000-4-2:2001. Electrostatic discharge immunity
IEC 61000-4-3:2002. RF electromagnetic field immunity
IEC 61000-4-4:2004. Electrical fast transient / burst immunity
IEC 61000-4-5:2001. Power line surge immunity
IEC 61000-4-6:2003. Conducted RF immunity
IEC 61000-4-11:2004. Voltage dips and interruptions immunity
1236
formation
4
5
EN 61000-3-2:2006. AC power line harmonic emissions
EN 61000-3-3:1995. Voltage changes, fluctuations, and flicker
European Contact.
Tektronix UK, Ltd.
Western Peninsula
Western Road
Bracknell, RG12 1RF
United Kingdom
1
This product is intended f or use in nonresidential areas only. Use in residential areas may cause electromagnetic interference.
2
Emissions which exceed the levels required by this standard may occur when this equipment is connected to a test object.
3
To ensure compliance with the EMC standards listed here, high quality shielded interface cables should be used.
4
Horizontal timing susceptibility of the optical sampling modules and their internal clock recovery trigger signals usually increases
the horizontal timing jitter when external electromagnetic fi elds are applied. For fields up to 3 V/m, the increase in the horizontal
high-frequency RMS jitter is typically less than 3 ps RMS of jitter, added using the square-root-of-the-sum-of-the-squares method.
An example follows:
If an 80C01–CR operating in clock-recovery trigger mode exhibits 3.5 ps RMS of edge jitter, with no EMC field applied and for an
ideal jitterless input, then for applied fields up to 3 V/m the edge jitter, degradation would typically result in a total RMS jitter of:
5
Performance Criterion C applied at the 70%/25 cycle Voltage-Dip and the 0%/250 cycle Voltage-Interruption test levels (IEC
61000-4-11). If the instrument powers down upon a voltage dip or interruption, it will take longer than ten seconds to reboot.
DSA8200 Quick Start User Manual v
Page 12

Compliance Info
6
With an 80E01 Electrical Sampling module, up to 15 mV
signals as defined in the IEC 61000-4-3 and IEC 61000-4-6 tests.
Australia / New Zealand Declaration of Conformity – E MC
rmation
random noise is allowed when the instrument is subjected to fields and
RMS
Complies with
CISPR 11:200
EN 61326-2-1:2006.
the EMC provision of the Radiocommunications Act per the following standard, in accordance with ACMA:
3. Radiated and Conducted Emissions, Group 1, Class A, in accordance with EN 61326-1:2006 and
vi DSA8200 Q uick Start User Manual
Page 13

Safety Compliance
EC Declaration of Conformity – Low Voltage
Compliance was demonstrated to the following specification as listed in the Official Journal of the European Communities:
Low Voltage Directive 2006/95/EC.
EN 61010-1: 2001. Safety requirements for electrical equipment for m easurem ent control and laboratory use.
Compliance Info
rmation
U.S. Nation
UL 3111-1, First Edition, 2ndAmendment. Standard for electrical measuring and test equipment.
ally Recognized Testing Laboratory Listing
Canadian Certification
CAN/CSAlaboratory use. Part 1.
C22.2 No. 61010.1–97. Safety requirements for electrical equipment for measurement, control, and
Additional Compliances
IEC 61010-1: 2001. Safety requirements for electrical equipment for measurement, control, and laboratory use.
Equipment Type
Test and measuring equipment.
y Class
Safet
Class 1 – grounded product.
Pollution Degree Description
asure of the contaminants that could occur in the environ ment around and within a p roduct. Typically the internal
Ame
environment inside a product is considered to be the same as the external. Products should be used only in the environment
for which they are rated.
Pollution Degree 1. No pollution or only dry, nonconductive pollution occurs. Products in this category are generally
capsulated, hermetically sealed, or located in clean rooms.
en
llution Degree 2. Normally only dry, nonconductive pollution occurs. Occasionally a temporary conductivity that is
Po
caused by condensation must be expected. This location is a typical office/home environment. Temporary condensation
occurs only when the product is out of service.
Pollution Degree 3. Conductive pollution, or dry, nonconductive pollution that becomes conductive due to condensation.
hese are sheltered locations where neither temperature nor humidity is controlled. The area is protected from direct
T
sunshine, rain, or direct wind.
Pollution Degree 4. Pollution that generates persistent conductivity through conductive dust, rain, or snow. Typical
outdoor locations.
DSA8200 Quick Start User Manual vii
Page 14

Compliance Info
Pollution Degree
Pollution Degree 2 (as defined in IEC 61010-1). Note: Rated for indoor use only.
Installation (Overvoltage) Category Descriptions
Terminals on this product may have different installation (overvoltage) category designations. The installation categories are:
Measurement Category IV. For measurements performed at the source of low-voltage installation.
Measurement Category III. For measurements performed in the building installation.
Measurement Category II. For measurements performed on circuits directly connected to the low-voltage installation.
Measurement Category I. For measurements performed on circuits not directly connected to MAINS.
rmation
Overvolta
Overvoltage Category II (as defined in IEC 61010-1)
ge Category
viii DSA8200 Quick Start User Manual
Page 15

Environmental Considerations
This section provides information about the environmental impact of the product.
Product End-of-Life Handling
Observe the following guidelines when recycling an instrument or component:
Equipment Recycling. Production of this equipment required the extraction and use of natural resources. The
equipment may contain substances that could be harmful to the environment or human health if improperly handled at the
product’s end of life. In order to avoid release of such substances into the environment and to reduce the use of natural
resources, we encourage you to recycle this product in an appropriate system that will ensure that most of the m aterials are
reused or recycled appropriately.
This symbol indicates that this product complies with the applicable European Union requirements according
to Directives 2002/96/EC and 2006/66/EC on waste electrical and electronic equipment (WEEE) and
batteries. For information about recycling options, check the Support/Service section of the Tektronix Web
site (www.tektronix.com).
Compliance Info
rmation
Mercury N
to environmental considerations. Please contact your local authorities or, within the United States, refer to the E-cyc ling
Central Web page (www.eiae.org) for disposal or recycling information.
otification.
This product uses an LCD backlight lamp that contains mercury. Disposal may be regulated due
Perchlorate Materials. This product contains one or more type CR lithium batteries. According to the state
of California, CR lithium batteries are classified as perchlorate materials and require special handling. See
www.dtsc.ca.gov/hazardouswaste/perchlorate for additional information.
Restriction of Hazardous Substances
roduct has been classified as Monitoring and Control equipment, and is outside the scope of the 2002/95/EC RoHS
This p
Directive.
DSA8200 Quick Start User Manual ix
Page 16

Preface
Preface
Documentation
This manual describes the installation and operation of the DSA8200 Digital Serial Analyzer along with basic operation and
concepts. For more detailed information, see the online help on your instrument.
NOTE. The screen images in this manual may differ slightly from other versions of product software.
Additional information is available through a variety of sources. The following table points to the location of different types of
information available for this product.
Type of information Location
Unpacking, installation, operation and overviews
In-depth operation, UI help, programming help Instrument online help
Performance verification and specifications Product documentation CD
Product software Product software CD
Self service Service manual
PDF files of instrument and modules manuals Product software CD
Quick Start User Manual
www.tektronix.com/software
www.tektronix.com/manuals
x DSA8200 Quick Start User Manual
Page 17

Conventions Used in this Manual
The following icons are used throughout this manual.
Preface
Rear panel
power
Front panel
power
Connect
power
Network
PS2 SVGA USB
DSA8200 Quick Start User Manual xi
Page 18

Preface
xii DSA8200 Quick Start User Manual
Page 19

Key Features
The DSA8200 Digital Serial Analyzer is a high-speed, precision sampling system that finds use in validation and conformance
testing and impedance verification for:
High-performance semiconductor/computer applications, such as semiconductor testing, TDR characterization of circuit
boards, IC packages and cables, and high-speed serial digital data communications.
High-performance communications applications, s uch as design evaluation and manufacturing test of datacom and
telecom components, transceiver subassemblies, and transmission systems.
The instrument includes a user interface that runs on the Microsoft Windows XP Professional operating system as a windowed
application. You operate the instrument using front-panel controls with the mouse and keyboard or with the touch screen.
Features Include:
Industry-leading waveform acquisition and measurement rate, with Sample, Envelope, and Average acquisition modes.
Support for up to six sampling modules (two large and four small modules). Up to eight inputs can be active at a time.
Support for integrated optical and/or electrical signal pick-off and clock recovery, enabling a ccurate triggering on optical
and/or electrical c ommunication signals.
Support for optical modules with several integrated, selectable reference receivers, which eliminates the need for
a multitude of add-on reference receivers.
Key Features
Full programmability, with an extensive GPI B-command set and a message-based interface.
True differential TDR, with fast step (15 psec reflected risetime) when used with a TDR-capable 80E10 sampling module.
Industry-leading trigger bandwidth (12+ GHz) when using the built-in prescaler.
Support of both telecom (SONET and SDH) and datacom (Fibre Channel, Infiniband, and Gigabit Ethernet) optical
communication standards.
Powerful built-in measurement capability, including histograms, mask testing, and automatic measurements.
Automatic measurements operate on Pulses, RZ eye patterns, and NRZ eye pa
DC to 65 GHz optical bandwidth; DC to 70+ GHz electrical bandwidth, with up to 12.5 GHz triggering. Bandwidth is
determined by the capabilities of the installed modules.
Low jitter (200 fs typical) in phase reference modes with the 82A04 Phase Reference module.
FrameScan acquisition for isolating data-dependent failures during conformance/performance testing and for examining
very low-level repetitive signals.
Pattern (frame) triggering with the 80A06 PatternSync Trigger module.
Jitter, Noise, and BER analysis with the 80SJNB Essentials application. With the 80SJNB Advanced application, features
for de-embedding of the fixture, channel emulation, and FFE/DFE equalizer support are also added.
Improved acquisition throughput and timing accuracy using the PatternSync Trigger module in conjunction with
FrameScan.
Support for optical conformance testing of SONET/SDH signals (including the various forward error correction rates for
these telecom rates) from 155 Mbps to 43 Gb/s, Fibre Channel signals, and 1, 2, 10, and 100 Gigabit Ethernet signals
as well as 2.5 Gb/s Infiniband signals. Support for conformance testing rates is determined by the specific modules
that are installed.
tterns.
High precision time base with two modes of operation, locked and short-term jitter-optimized.
DSA8200 Quick Start User Manual 1
Page 20

Key Features
Negligible long-term jitter degradation (<0.1 ppm), which substantially improves the ability to view signals that are
delayed far fro
m the trigger point without distortion.
Improved shor
A gated trigge
connect to the instrument rear panel. This option allows you to use recirculating buffers as part of your test setup to
simulate the effects of very long optical links that are typical of undersea cables and long terrestrial links.
Analysis and connectivity tools that enable the instrument to be controlled from a variety of local and remote
environment
Predefined,
A large 10-i
An intuitiv
t-term and long-term trigger jitter.
r option (Option GT) that lets you disable or enable (gate) triggering based on a TTL signal that you
s and to share data with other commercially available analysis programs.
built-in masks in addition to the user-defined masks.
nch color display that supports color grading of waveform data to show sample density.
e user interface (UI), with built-in online help.
2 DSA8200 Quick Start User Manual
Page 21

Install Your Instrument
Unpack the instrument and check that you received all items listed as Standard Accessories. Recommended accessories
and probes, instrument options, and upgrades are listed in the online help. Check the Tektronix Web site (www.tektronix.com)
for the most current information.
Standard Accessories
Accessory Tektronix part number
DSA8200 Digital Serial Analyzer Quick Start User Manual
Certificate of Traceable Calibration for product at initial shipment
Business reply card Not orderable
Microsoft Windows compatible keyboard
Microsoft Windows compatible mouse
Instrument front cover
Accessory pouch 016-1441-00
Touch screen styluses (2)
ESD wrist strap with 6 foot coiled cord
DSA8200 Product Documentation Kit (CD)
DSA8200 Online Help (part of application software)
DSA8200 Programmer Online Guide (part of application software)
DSA8200 Product Software Kit
DSA8200 Operating System Restore Kit
Serial numbers B030000 and above
8000 Demo Applications Software CD
Power cord Type dependent on selection
Install Your Ins
071-2047-xx
Not orderable
119-B146-00
119-6936-00
200-4519-00
119-6107-00
006-3415-04
020-2543-xx
Not orderable
Not orderable
020-2734-xx
020-2980-xx
020-2480-xx
during order placement
trument
DSA8200 Quick Start User Manual 3
Page 22

Install Your Ins
trument
Operating Considerations
The following information lists the specifications related to the operation of the mainframe. Refer to the DSA8200
Specifications and Performance Verification manual for a complete list of specifications.
Mechanical
Clearance:
Top, Front, and Rear: 0 in (0 mm)
Sides: 2 in (51 mm)
Bottom: 0.75 in (19 mm)
Weight:
19.5 kg (43.0 lb.). This does not include
any accessories or modules.
Environmental
Temperature
Relative humidity
Altitude
10 °C to +40 °C
20% to 80%, with a maximum wet bulb temperature of 29 °C at or below
+40 °C
3,000 m (9,843 ft.)
Power Supply
Source voltage and Frequency 100 - 240 V
Power Consumption
600 watts
Typically, 240 watts (fully loaded); 160 watts (mainframe with no modules)
Input Connectors
Trigger Direct Input range
±1.5 V (DC + peak AC) maximum input voltage
±10%, 50 - 60 Hz or 115 V
RMS
±10%, 400 Hz
RMS
4 DSA8200 Quick Start User Manual
Page 23

Install Your Ins
trument
Trigger Presca
led Input absolute maximum
±2.5 V
input (typical)
External 10 MHz Reference Input 500 mV
Gated Trigger Input non-destruct levels
±5 V maximum
(Option GT equipped mainframes)
p-p
p-p
to5V
AC coupled into 1 kΩ , ±5 V maximum
p-p
DSA8200 Quick Start User Manual 5
Page 24

Install Your Ins
trument
Installing Modules
CAUTION. To prevent damage to modules, do not transport or ship the instrument with modules installed. Modules are
also sensitiv
removing modules and when connecting signals to the module inputs. Never install or remove modules while the instrument
is powered on.
1. Always use an ESD wrist strap (provided)
when installing and removing modules.
2. You can install up to two large sampling
modules and
total of 8 inputs.
Following are some typical module installations illustrating the interaction between large compartment channels and small
compartment channels.
e to electrostatic discharge (ESD). To avoid ESD dam age, always use an ESD wrist strap when installing or
four small modules for a
NOTE. A large compartment module that only derives power from the compartment does not use any small compartment
input channels.
Eight channels: No large and four small
modules
Six channels: Two large modules and two
small modules
Seven channels: One large module, installed
in CH3 compartment, and three small
modules
Seven channels: One large module, installed
in CH1 compartment, and three small
modules
6 DSA8200 Quick Start User Manual
Page 25

Powering the Instrument On and Off
Install Your Ins
trument
1. Insert AC powe
2. To g g l e t h e m a i
3. Use the fron
switch the instrument on and off.
r cord.
ns switch to on.
t panel power button to
Quick Tip
When turning off the instrument, Microsoft Windows and all applications automatically shut down before the instrument
powers off.
ON. To prevent damaging the modules, do not install or remove any modules while the instrument is powered on.
CAUTI
DSA8200 Quick Start User Manual 7
Page 26

Install Your Ins
trument
Adding a Second Monitor
You can operate the instrument while using Microsoft W indows and installed applications on an external monitor. Use the
Settings tab in the Windows Display Properties dialog box to set up a dual-monitor configuration. Both the oscilloscope and
the second monitor must have the color setting set to True Color.
1. Power off the instrument.
2. Connect a video cable (not supplied)
from the SVGA out dual monitor display
video port on the back of the instrument
to the external monitor.
3. Power on the instrument.
4. Power on the external monitor.
8 DSA8200 Quick Start User Manual
Page 27

5. In the Start menu, select Control Panel.
6. Select Display.
Install Your Ins
trument
DSA8200 Quick Start User Manual 9
Page 28

Install Your Ins
trument
7. In the Display P
the Settings tab.
8. Click the grayed out external monitor (2)
and drag it to the left of monitor 1.
9. Select Yes when you are prompted to
enable the ne
10. Click OK and A
prompted to restart your system so the
changes can take effect.
roperties window, select
w monitor.
pply. You will then be
Changing the Windows Language
Use the f
change the language in the TekScope application. Before you begin, minimize the TekScope application.
1. In the Start menu, select Control Panel.
2. Select Regional and Language
ollowing procedure to change the Windows language from English to one of your choice. This procedure does not
s.
Option
10 DSA8200 Quick Start User Manual
Page 29

3. Select your location.
4. Select your language preference. The
time and numbering system of your
selected loca
le will adjust automatically
to this selection.
5. Select the Languages tab to further
specify your preferences. For more
details on cu
stomizing your language
options, see your Windows XP help.
Install Your Ins
trument
DSA8200 Quick Start User Manual 11
Page 30

Install Your Ins
trument
12 DSA8200 Quick Start User Manual
Page 31

Getting Acquain
tedwithYourInstrument
Getting Acqua
Front Panel
The front panel of your instrument gives you access to the module compartments and the control panel.
inted with Your Instrument
1. Antistatic connection 1 MΩ terminal.
2. On/Off switch.
3. Trigger prescale input.
4. Trigger direct input.
5. Trigger probe power.
6. External 10 MHz reference input.
7. DC calibration output.
8. Internal clock output.
9. USB port.
10. Control panel.
11. CDRW/DVD drive.
DSA8200 Quick Start User Manual 13
Page 32

Getting Acquain
ted with Your Instrument
Control Panel
1. Access print dialog box for printing the display.
2. Optimize instrument settings for selected channels.
3. Quickly return to instrument-default control settings.
4. Display m easurement cursors and assign the knob and SELECT buttons to control them.
5. Menu buttons quickly access the setup dialog box for more detailed setup.
6. Clear all channel waveforms at once.
7. Adjust most c ontrol fields in setup dialogs. Press the SELECT button to switch among fields. Press the FINE button to
toggle between normal and fine adjustment.
8. Start and stop acquisition.
9. Display the cluster of Setup dialog boxes for comprehensive setup of the instrument.
10. Toggle the touch screen on and off. Use the touch screen to control UI when you have not installed a mouse.
11. Select a waveform type, Channel, Reference, or Math, to display or adjust on screen (selected button lights).
12. Select among displayed waveforms or display and select a waveform. Press selected w aveform to turn it off. Button
lights indicate displayed and selected waveforms.
14 DSA8200 Quick Start User Manual
Page 33

Getting Acquain
tedwithYourInstrument
13. S e lect among displayed timebase views or display and select a timebase view. Press selected view to turn it off (except
main, which is a
lways on).
14. Vertically sc
15. Horizontally
16. S et trigger le
ale, position, and offset selected waveform.
scale, position, and set record length of selected waveform.
vel and use lights to monitor trigger state.
DSA8200 Quick Start User Manual 15
Page 34

Getting Acquain
ted with Your Instrument
Rear Panel
The rear panel of your instrument allows you access to input and output connectors and the AC input.
1. Removable hard drive.
2. Scope VGA output for instrument display.
3. Computer I/O panel.
4. GPIB port. The instrument is factory set to be a GPIB device (slave), allowing you to control the instrument via the GPIB
port. You can change the instrument to be a G PIB controller (master), allowing you to control other devices via the GPIB
port. Refer to the online Programmer Guide installed on the instrument.
5. Gated trigger Option GT.
6. AC input.
7. Fuses.
8. Mains power switch.
16 DSA8200 Quick Start User Manual
Page 35
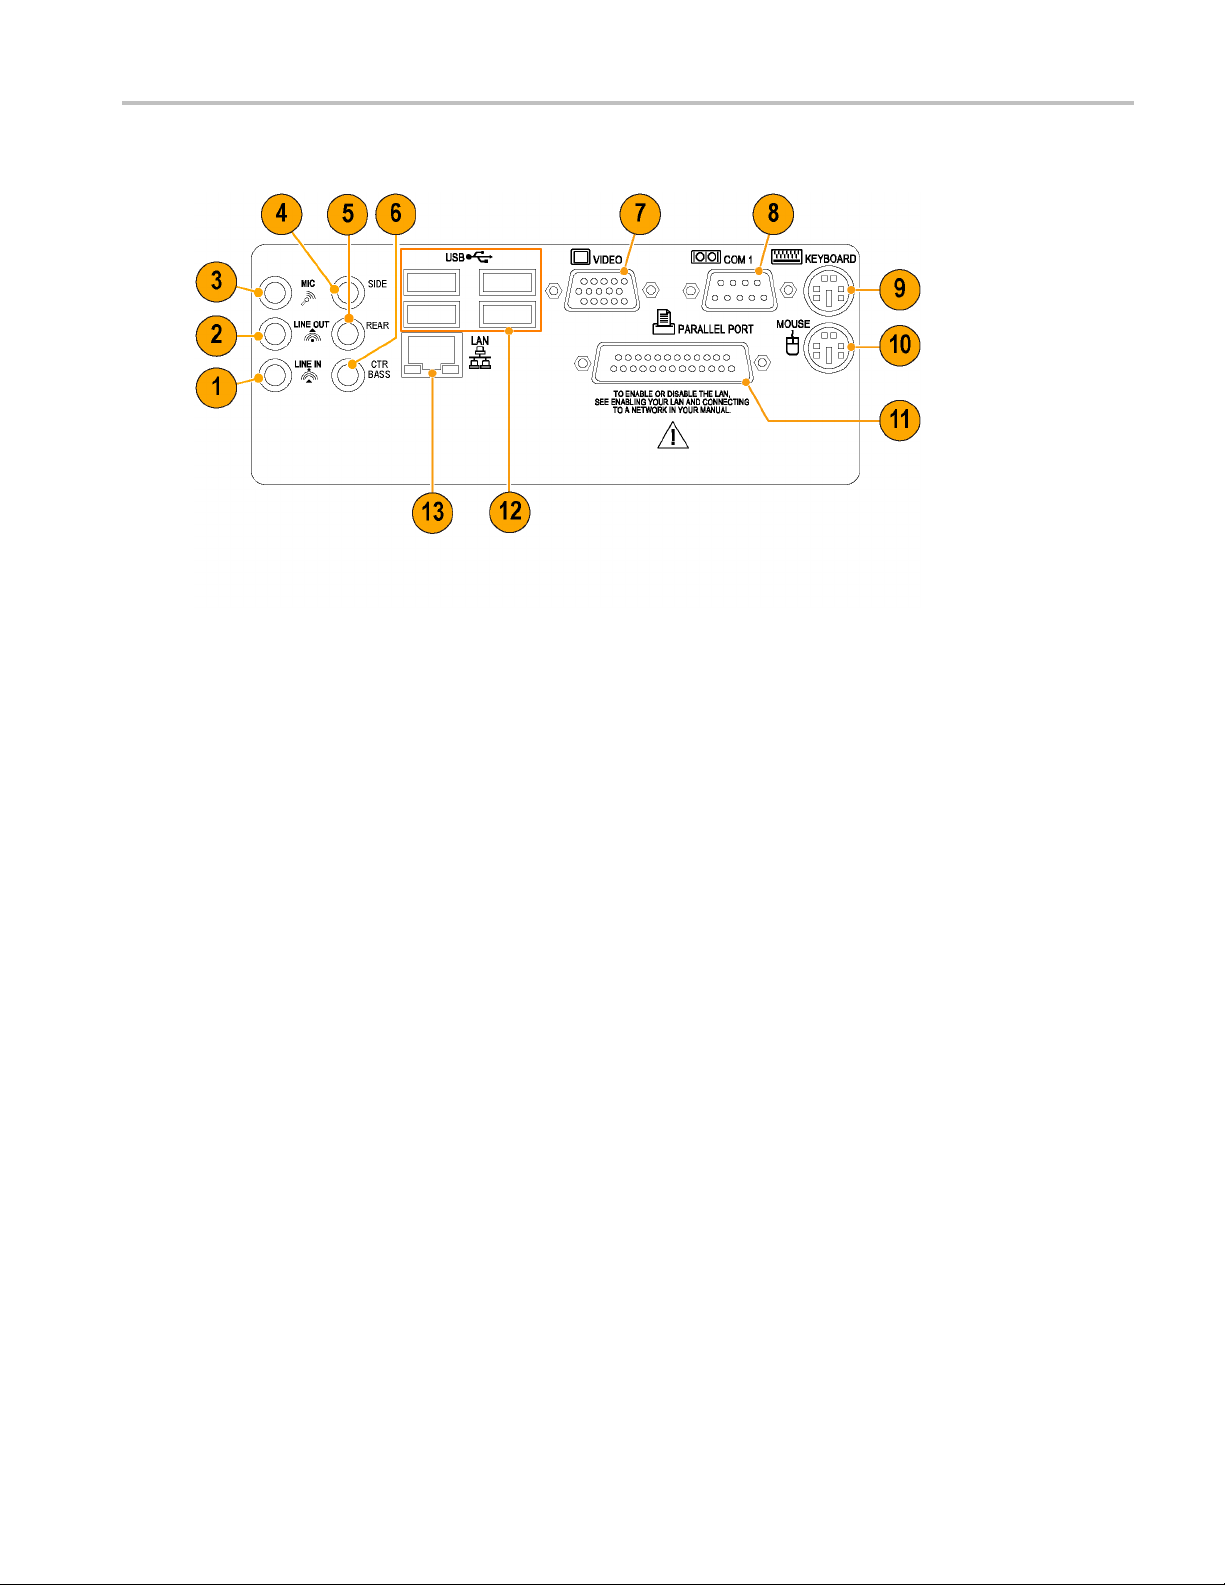
Computer I/O Panel
1. Audio line in.
Getting Acquain
tedwithYourInstrument
2. Audio line o ut.
3. Audio line in (microphone).
4. Side surround sound.
5. Rear surround sound.
6. Center Bass surround sound.
7. SVGA out for dual-monitor display.
8. COM 1.
9. PS2 (keyboard).
10. PS2 (mouse).
11. Parallel port.
12. USB ports.
13. LAN.
Interface
The menu bar provides access to commands that control all of the instrument features and functions. The toolbar provides
access to the most common features.
Hovering the cursor over a button or setting displays a brief description of its function, called a tooltip.
DSA8200 Quick Start User Manual 17
Page 36

Getting Acquain
ted with Your Instrument
1. Tool Bar. Access to key features: printing, setup dialogs, math setup, waveform database, autoset, clear data, acquisition
mode, triggering, and applications.
2. Menu Bar. Access to data I/O, printing online help system, and setup functions.
3. Status Bar. Trigger status and waveform count.
4. Readout Bar. Toggle individual readout on and off by clicking its button.
5. Phase R eference Status. Indicates the characterization status of the phase reference module.
6. A Readout. Right click any readout to display a short-cut menu providing access to often-used setup controls and
properties for the features associated with the readout.
7. Readouts. Display up to five readouts in this area; select readouts from the Readout Bar.
8. Compensation Indicator. Indicates the compensation status of modules and mainframe.
9. Controls Bar. Quick access to waveforms and timebases for display, and to their scale, offset, and position controls for
adjustment.
10. Waveform Bar. Access to waveform selection (click), waveform position (drag), and waveform properties (right-click).
11. Display. Live, reference, and math waveforms display here, along with cursors and masks to analyze them.
12. Measurements Bar. Access to automated measurements by signal type and category; click measurement buttons to
measure the selected waveform.
18 DSA8200 Quick Start User Manual
Page 37
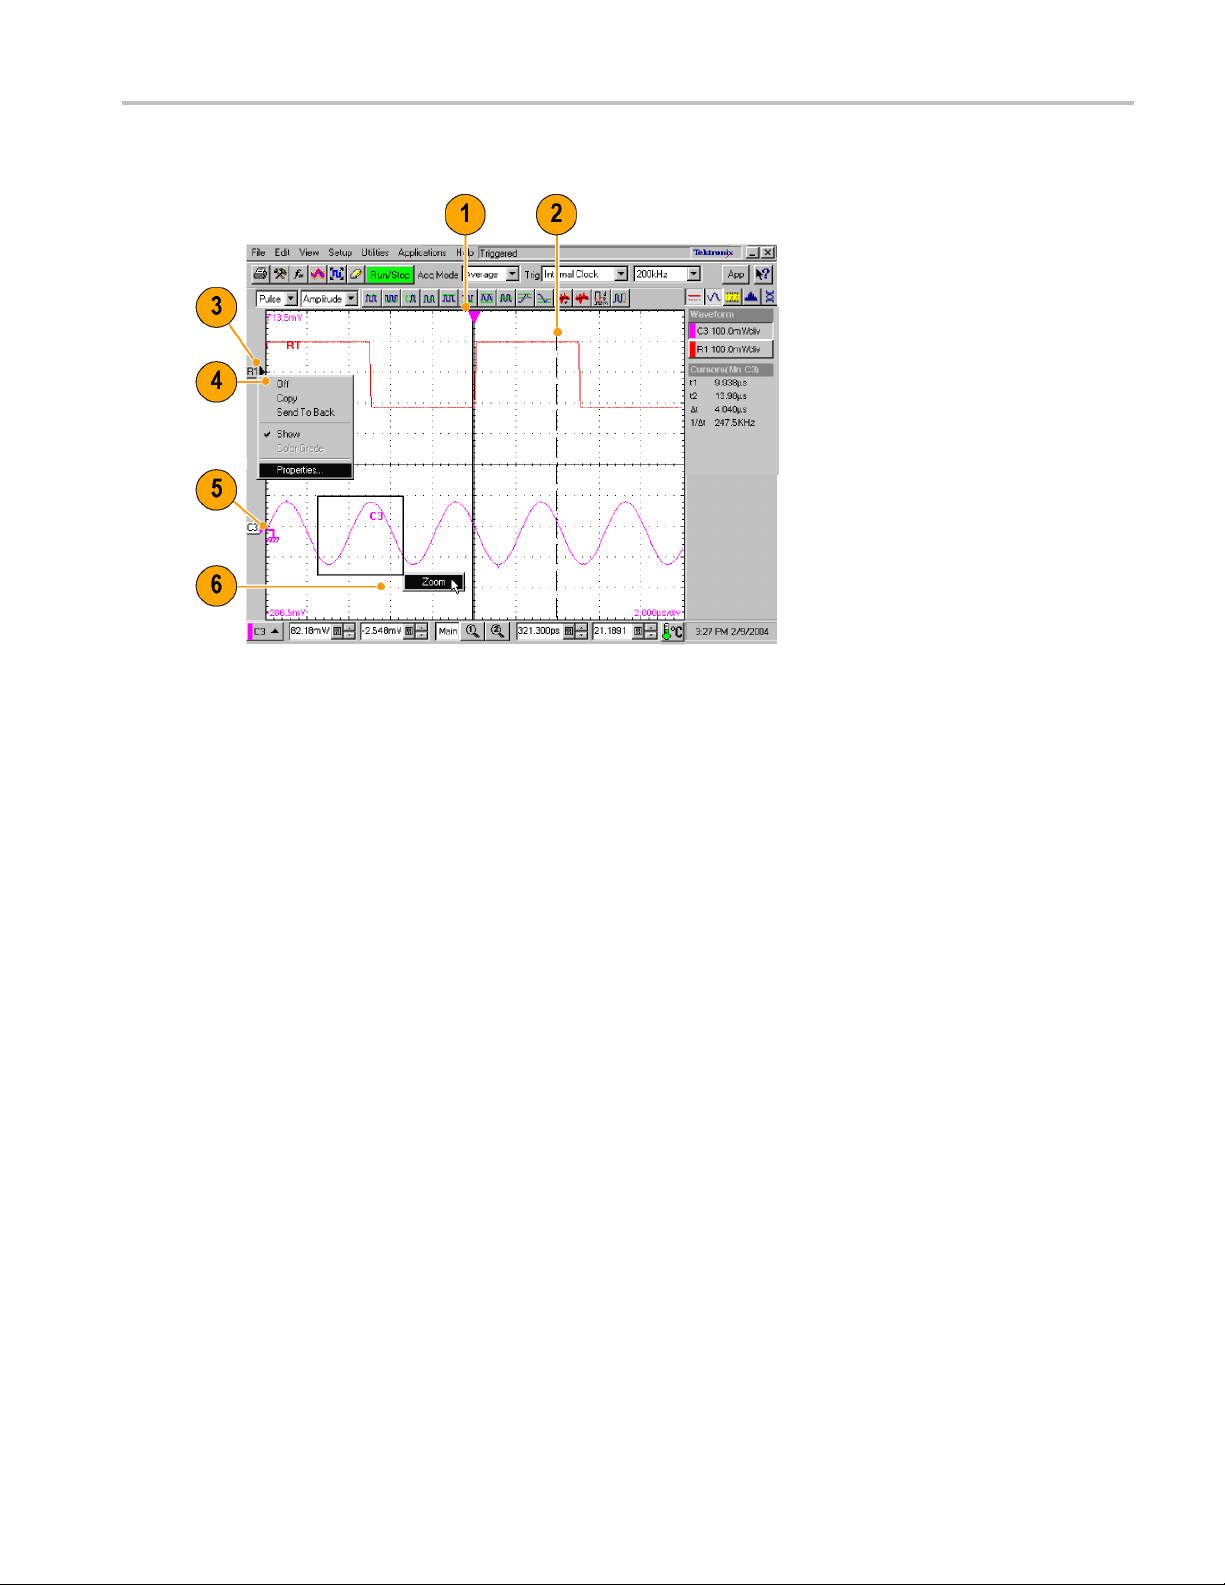
Display - Single Graticule View
Getting Acquain
tedwithYourInstrument
1. Drag the Horizontal Reference to move the point around which the horizontal scaling expands and contracts the
waveforms.
2. Drag cursors to measure waveforms on screen.
3. Drag the waveform icon vertically to position waveform.
4. Right-click on a waveform or its icon for access to often used setup controls and properties.
5. Drag ground reference icon to add offset to a waveform.
6. Drag across the waveform area to zoom the boxed waveform segment to full screen width.
DSA8200 Quick Start User Manual 19
Page 38

Getting Acquain
ted with Your Instrument
Display - Multiple Views
1. Drag the m
2. Drag the
3. Drag the
4. Mag2 Vie
5. Mag1 Vi
6. MAIN Vi
arkers to enclose the portion of waveform to appear in Mag1 View.
markers to enclose the portion of waveform to appear in Mag2 View.
border between graticules to vertically size Main, Mag1, and Mag2 Views.
w.
ew.
ew.
Accessing Online Help
In-depth information about all the features of your instrument is available in the online help.
For a brief description of controls, move your
mouse pointer and let it rest over a control,
such as a menu name, a menu item, tool-bar
button, or tool-bar readout. The help system
displays a short definition or a label (tooltips)
of the control.
20 DSA8200 Quick Start User Manual
Page 39

Getting Acquain
tedwithYourInstrument
For a more detai
led description, click the
What’s This? button in the main display or
in a dialog box.
After clicking the What’s This? button, click
the control you want described. A popup box
describes the control.
DSA8200 Quick Start User Manual 21
Page 40
Getting Acquain
ted with Your Instrument
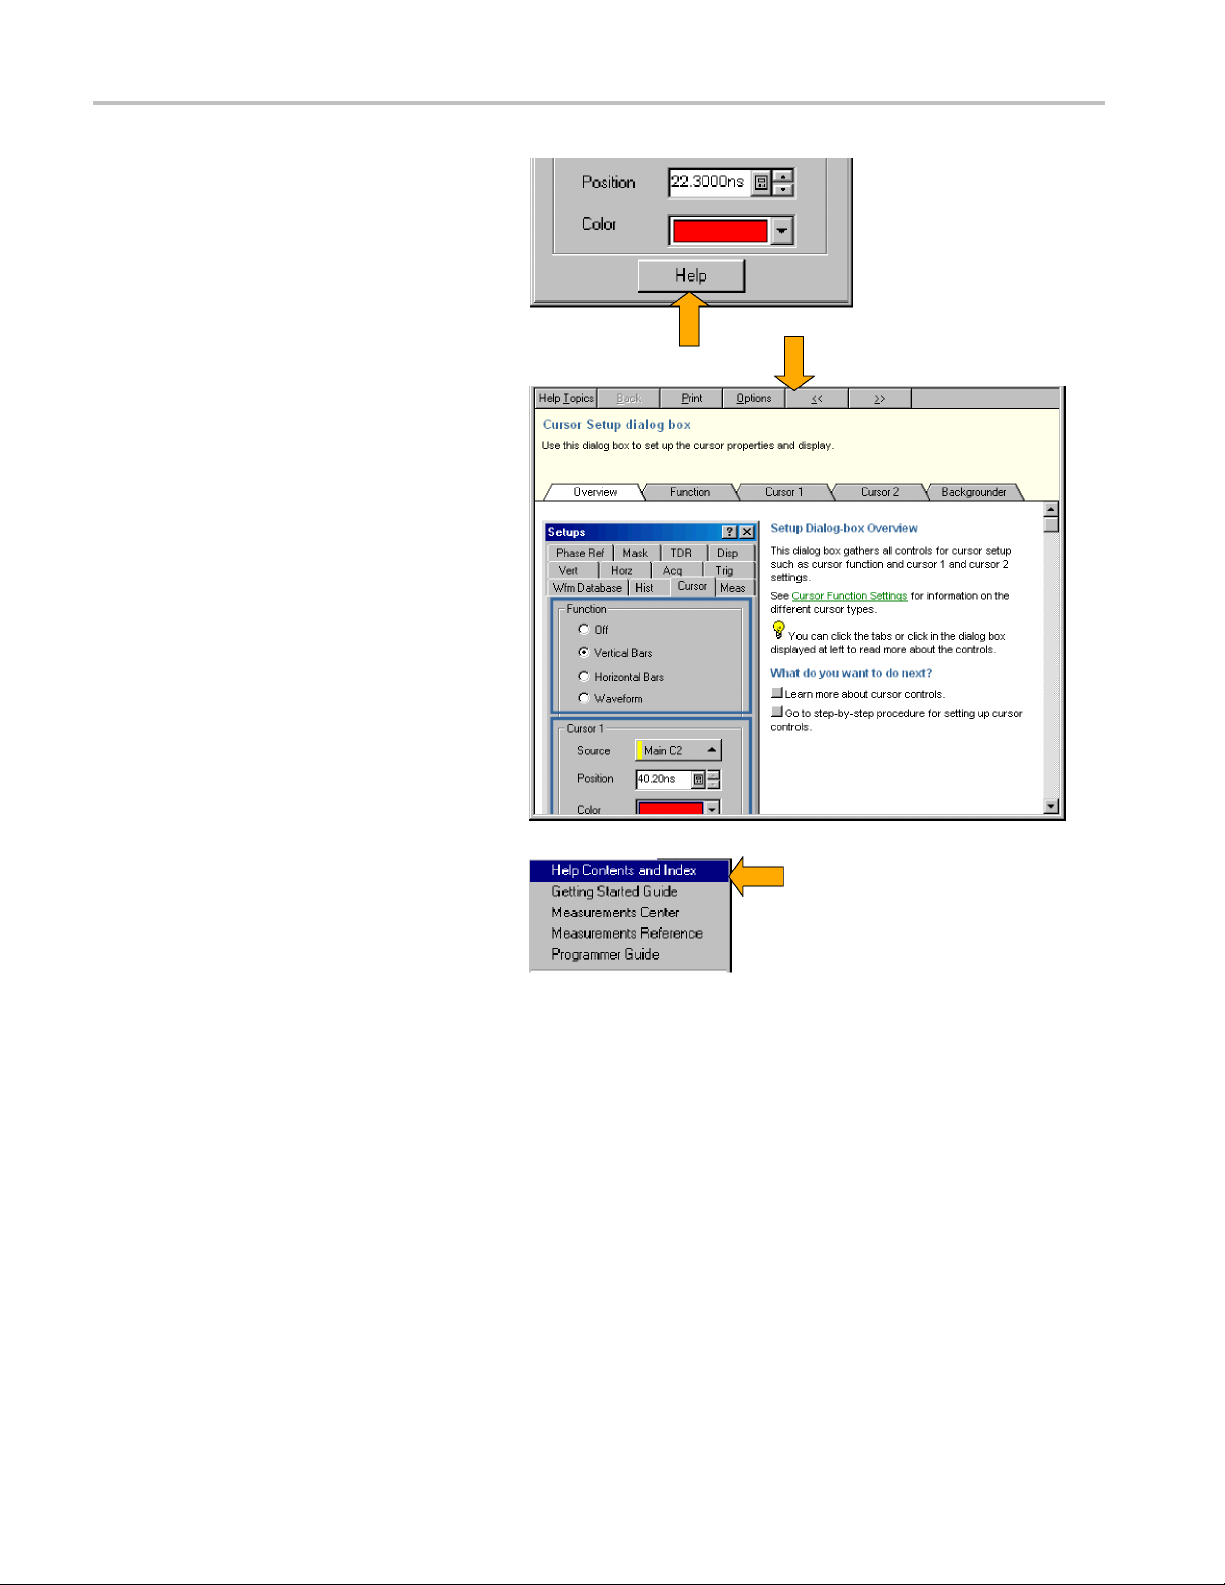
For in-depth, c
ontextual overviews, most
dialog boxes have a Help button. Click the
button to open the help system with an
overview of th
e dialog box that is currently
displayed.
You can search for in-depth help from the
application menu bar: select Help and then
HELP Contents & Index.
select
22 DSA8200 Quick Start User Manual
Page 41

Inspect Your Instrument
Use the following procedure to verify the functionality of your instrument. For a complete performance verification, see the
Performance Verification section in the optional service manual.
Verify Internal Diagnostics Pass
1. Install all modules to be diagnosed.
2. Power on the instrument and wait
20 minutes for the warm-up period.
Inspect Your Ins
trument
3. From the Utilities menu, select
Diagnostics....
DSA8200 Quick Start User Manual 23
Page 42
Inspect Your Ins
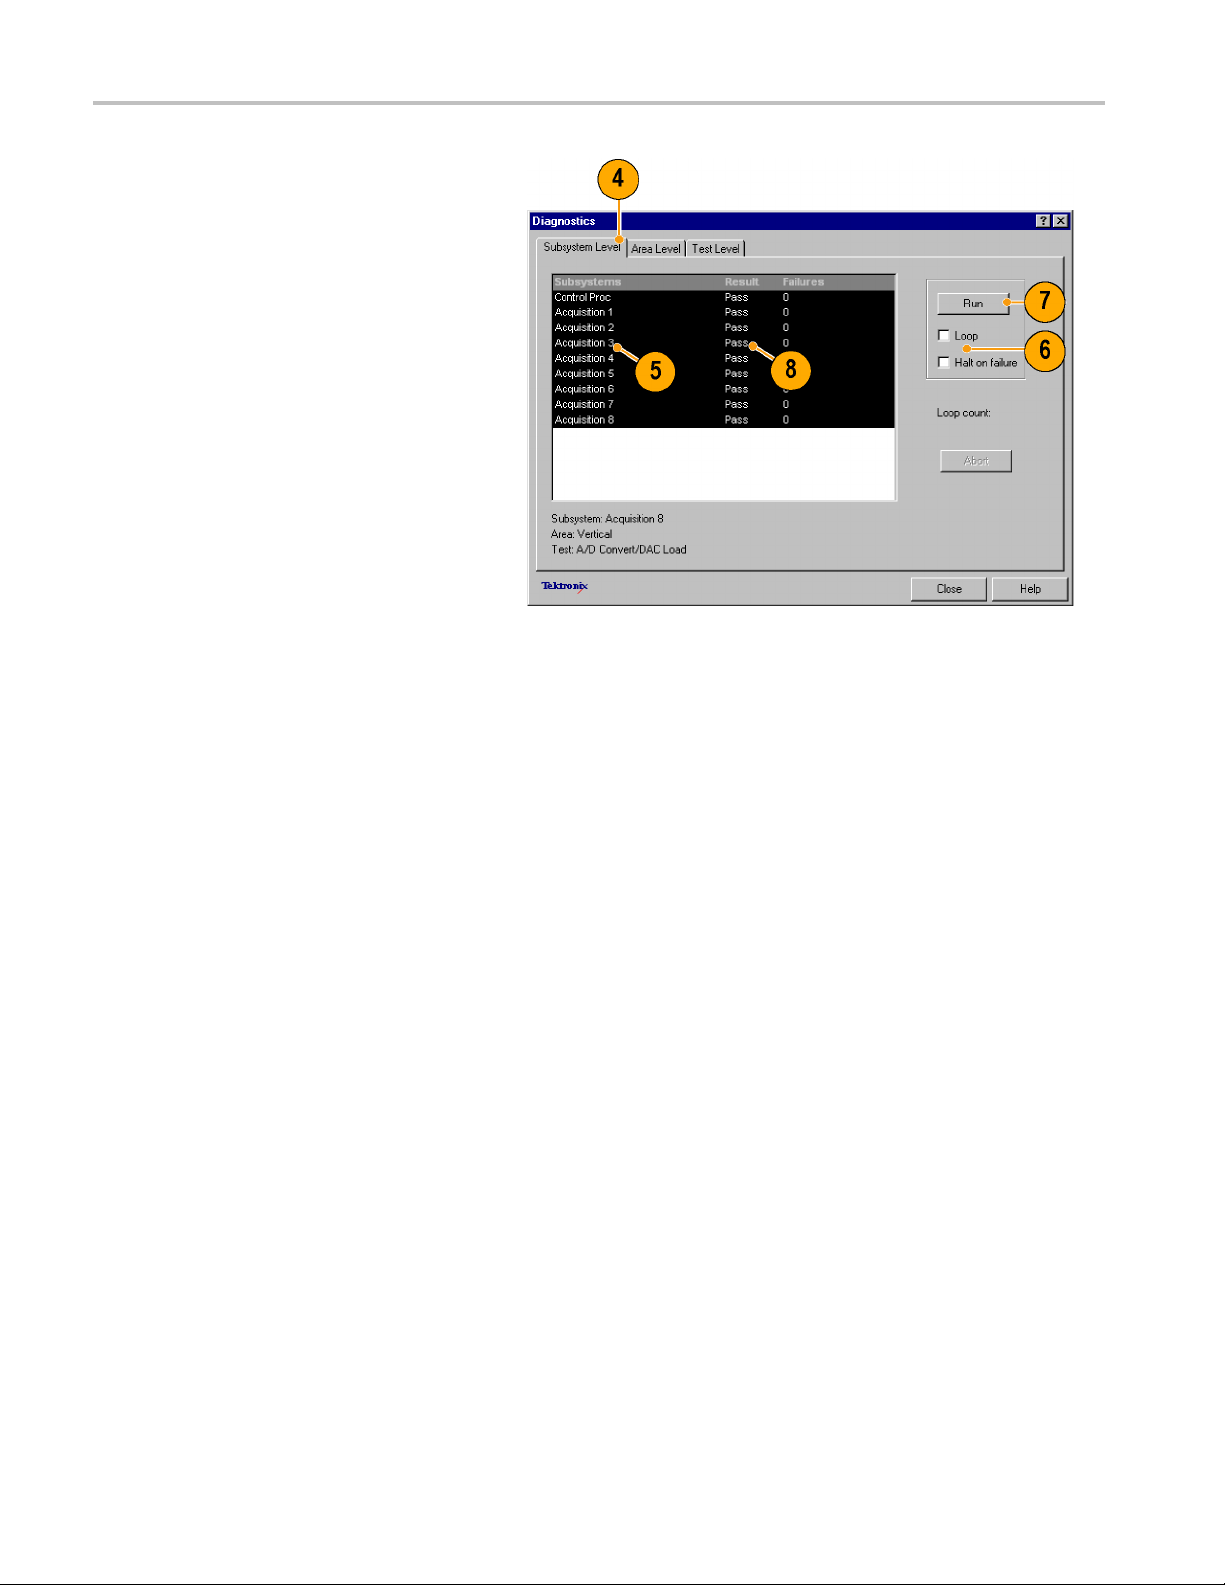
4. Select the Subsystem Level tab.
5. Select all the entries by clicking the first
entry Control Proc and dragging down
to select the r
highlighted.
6. In the Run box, leave Loop and Halt on
Failure unchecked.
7. Click Run.
8. Verify that Pass appears as Status in
the dialog b
complete. If diagnostic failures occur,
contact your local Tektronix service
personnel
trument
est. All entries should be
ox when the diagnostics
.
24 DSA8200 Quick Start User Manual
Page 43

Optimizing Meas
urement Accuracy
Optimizing Me
This instrument can compensate itself and the installed sampling m odules, optimizing the internal signal path used to acquire
the waveforms you measure. Compensation optimizes the capability of the instrument to make accurate measurements at
the ambient temperature.
NOTE. When installing a module or moving a module to another compartment, you must power on the instrument and
allow the temperature (of the instrument and module(s)) to reach a stable equilibrium (normally 20 minutes). Then, run
Compensation from the Utilities menu. This ensures the instrument meets the published specifications.
You must save the compensation results or they will be lost when the instrument is powered down.
asurement Accuracy
Signal Path Compensation
This procedure compensates the signal path of each installed module (for the current temperature) to enhance measurement
results.
Use this p
When making measurements at v ertical scale settings less than or equal to 5 mV/div, perform the signal path compensation
once a week. Failure to do so may result in the instrument not meeting warranted performance levels at those volts/div
settin
rocedure for any of the following conditions:
A module h
has been moved to another compartment.
The temperature has changed more than 5 °C since the last signal path compensation.
gs.
as been added to the instrument, an extender cable has been added or removed from a module, or a module
1. Instal
2. Instal
3. Power
l all modules to be compensated.
l all terminations and dustcovers.
Failure to ins tal l the 50 Ω terminations
on electrical inputs can yield erroneous
nsation failures or results.
compe
on the instrument and wait
20 minutes for the warm-up period.
DSA8200 Quick Start User Manual 25
Page 44
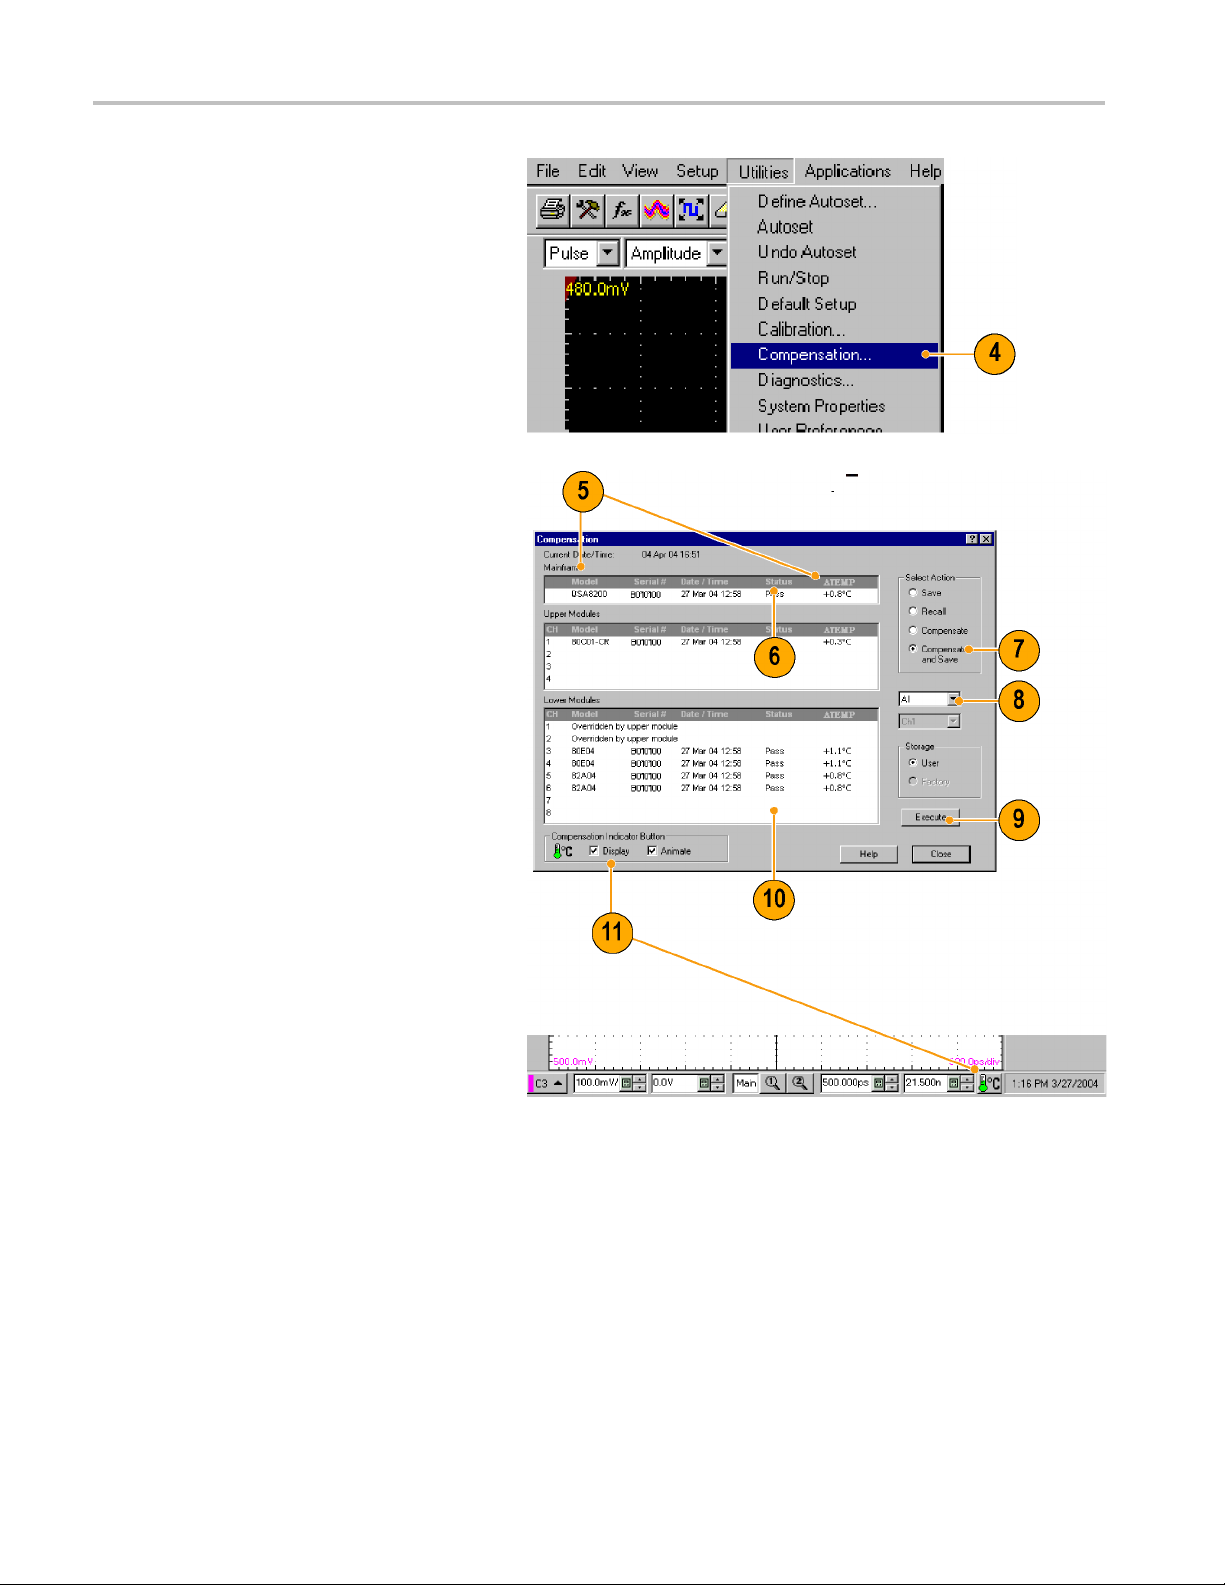
Optimizing Meas
4. Select Compensation...
5. In the Compensation dialog box, note
that the main instrument (mainframe)
and sampli
temperature change from the last
compensation is also listed.
6. Wait until the Status for all items you
want to co
Up to Pass, Fail,orComp Req’d.
urement Accuracy
ng modules are listed. The
mpensate changes from Warm
7. Under Select Action, select Compensate
and Save (default).
8. From the top dropdown list, choose All
t selection) to select the main
(defaul
instrument and all its modules as targets
to compensate.
9. Click the Execute button.
the instructions to disconnect
Follow
inputs and install terminations that
appear on screen; be sure to follow static
utions (see the user information for
preca
your sampling module) when following
these instructions.
10. Verify that the compensation routines
.
pass
If the status is Fail, rerun the
compensation. If Fail status continues
ou have allowed warmup to occur,
and y
the module or main instrument may need
service.
11. Use the Compensation Indicator Button
isplay or hide the indicator on
to d
the main display. Green indicates
all modules have been successfully
pensated. Red indicates one or
com
more modules require compensation.
26 DSA8200 Quick Start User Manual
Page 45
Optimizing Meas
Perform Dark-Level and User Wavelength Gain Compensations
Performing a dark-level compensation maximizes the accuracy of the extinction ratio and other optical automatic
measurements you take. Performing a User Wavelength Gain compensation optimizes an optical channel for your custom
input signal.
NOTE. Dark-level compensation performs a subset of the module compensation process. It is designed to be fast so it can
be performed frequently, just before measurements are taken. This compensation is not saved and is only valid for the
selected bandwidth or filter path and the internal optical power meter.
You should perform the procedure Signal Path Compensation to compensate all vertical bandwidth and filter selections.
(See page 25, Signal Path Compensation.)
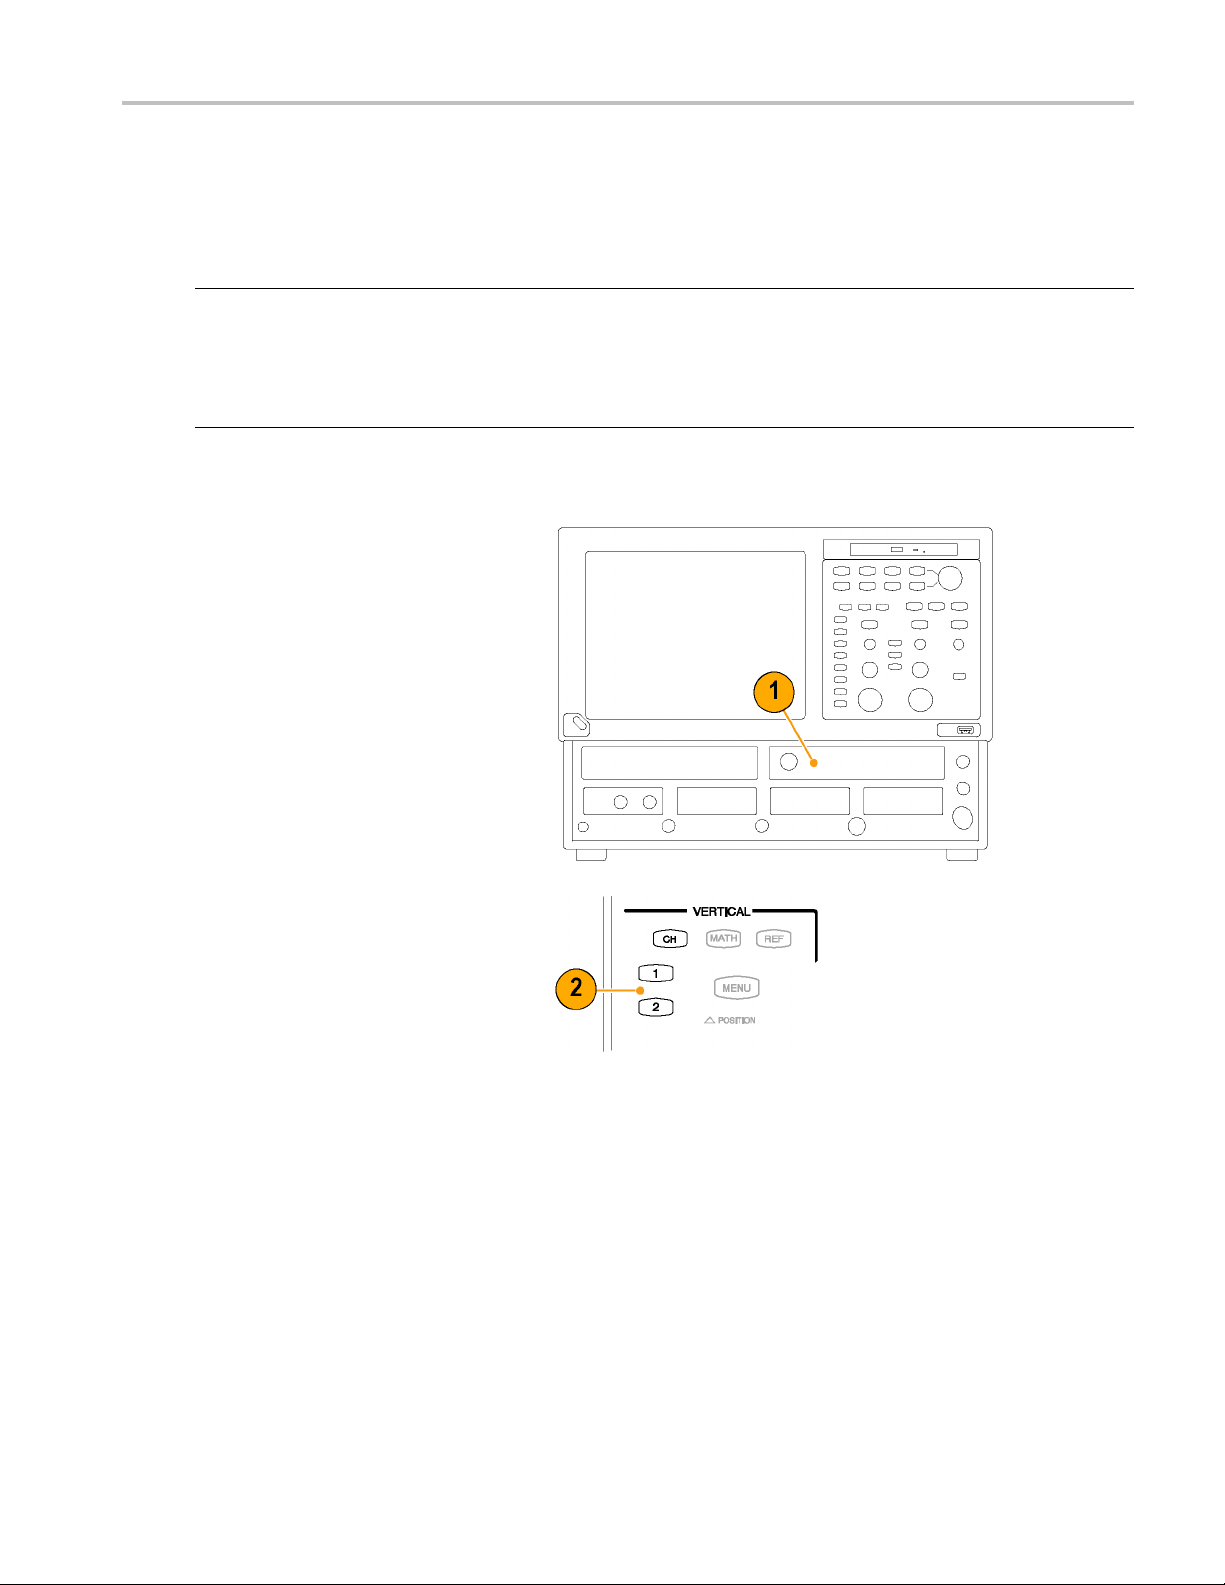
Use the following procedure to perform either compensation; this procedure applies only to optical modules.
1. Install at least one optical sampling
module in the instrument to be dark-level
calibrated. Set the acquisition system to
run continuously.
urement Accuracy
2. Use the
channel to be compensated.
Vertical buttons to select the
DSA8200 Quick Start User Manual 27
Page 46

Optimizing Meas
urement Accuracy
3. From the applic
Setup, and then click Vertical.
To run the Dark-Level compensation:
4. In Vert Setup dialog box, click the Dark
Level button under Compensation.
Follow the instructions on screen.
Repeat steps 2 and 4 for any
additional optical channels you want to
compensate.
To run the User Wavelength Gain
compensation (for custom input signals):
ation menu bar, click
5. Attach an optical signal, with a precisely
known amount of optical power, to the
optical module input.
Use an independently-calibrated average
optical power meter to measure this
power precisely. Then connect the signal
to the optical module using the same
fiber cables.
28 DSA8200 Quick Start User Manual
Page 47
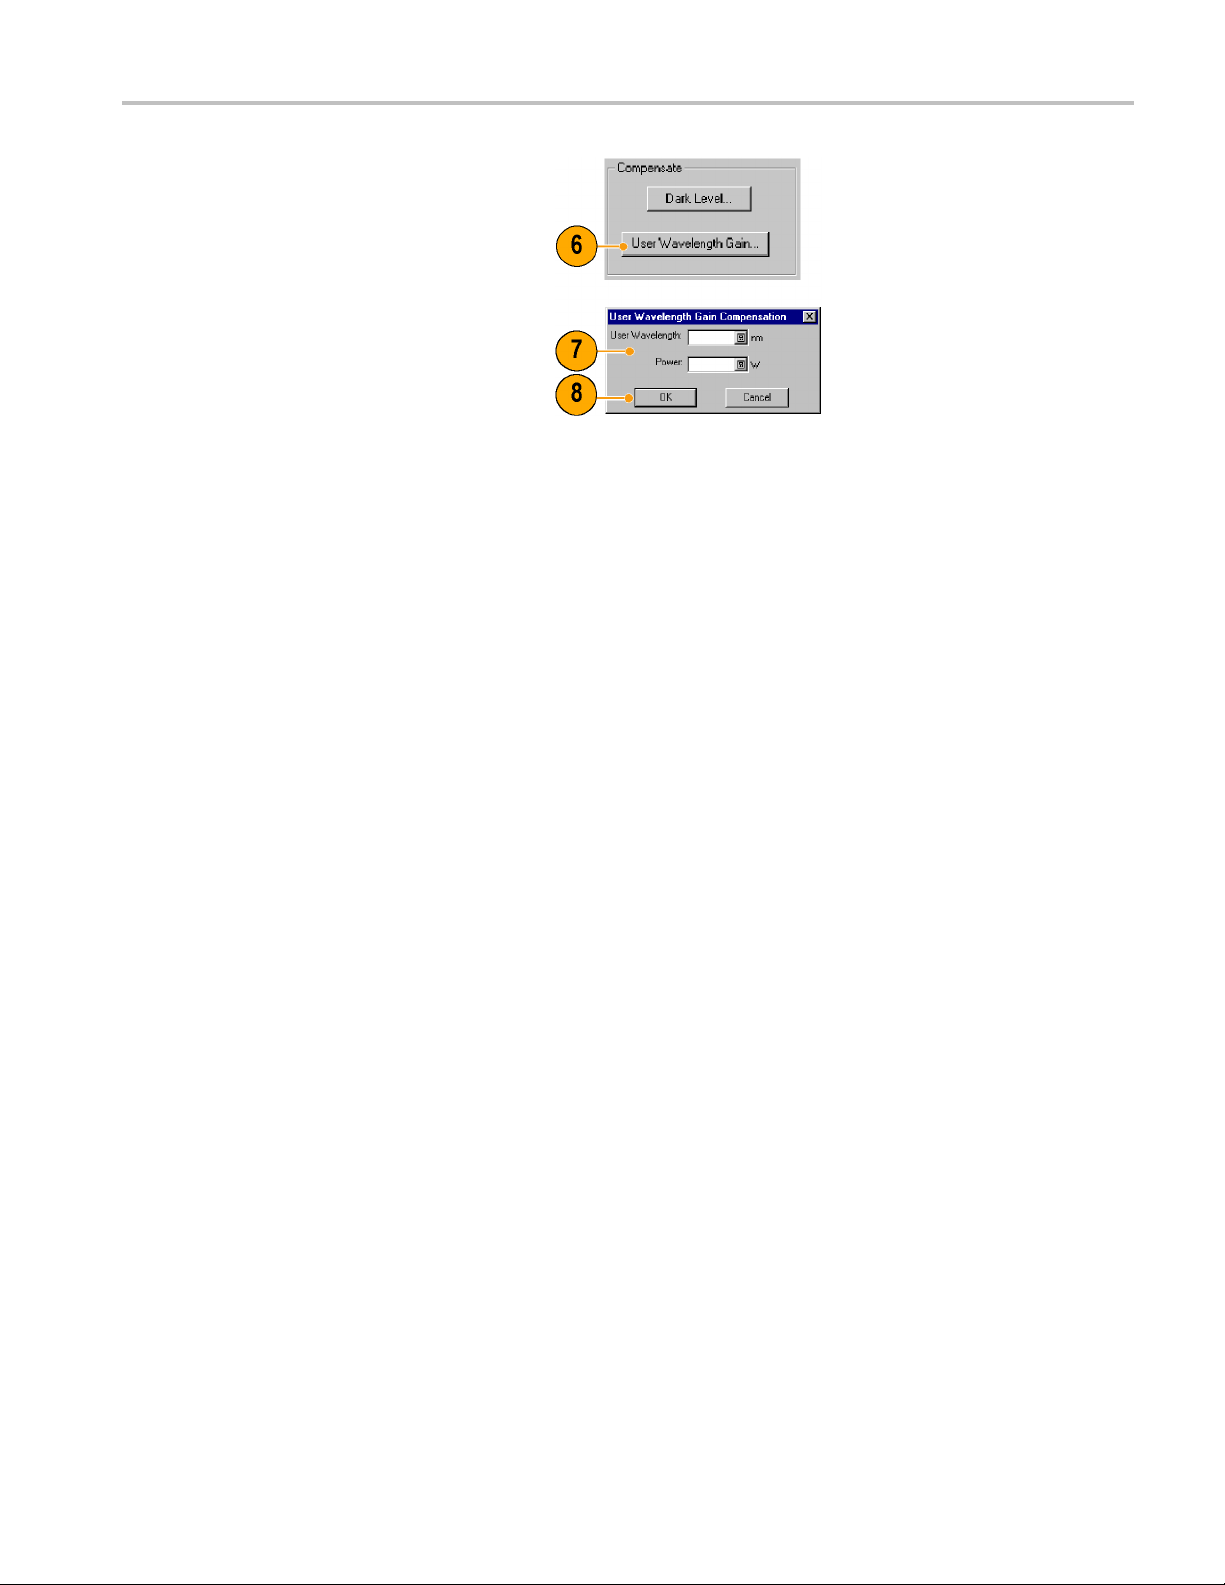
6. In Vert Setup dialog box, click the
User Wavelength Gain button under
Compensate. F
ollow the instructions on
the screen.
7. In the User Wavelength Gain
Compensation dialog box, s et the
wavelength a
nd power of the signal to be
applied to the channel.
8. Press the OK button to exec ute the
compensation.
Optimizing Meas
urement Accuracy
DSA8200 Quick Start User Manual 29
Page 48

Acquisition
Acquisition
This section contains concepts of and procedures for using the acquisition system. Detailed information is available in the
online help.
Setting Up Signal Input
Use front-pa
CAUTION. Sampling modules are inherently vulnerable to static damage. Always observe static-safe procedures and
cautions as outlined in your sampling-module user manual.
1. Connect to the signal to be acquired
using proper probi
techniques. See the user manual for the
sampling module you have chosen.
2. Connect an appropriate trigger signal to
the instrument. (
3. Push the CH button (turns amber) to
assign the waveform buttons (1–8)to
operate on channel waveforms, then
select the proper waveform button.
A waveform button lights when its
channel is on; when on but not selected,
its button is lighted green; when on and
selected, its button is lighted amber.
Pushing the MATH button assigns the
waveform buttons to math waveforms.
If no math waveforms are defined, the
Define Math dialog box appears.
Push the REF buttontoassign
the waveform buttons to reference
waveforms. If no reference waveforms
are defined, the Recall Waveform dialog
box appears.
nel buttons to set up your instrument to acquire the signal.
ng/connecting
See page 37, Triggers.)
30 DSA8200 Quick Start User Manual
Page 49
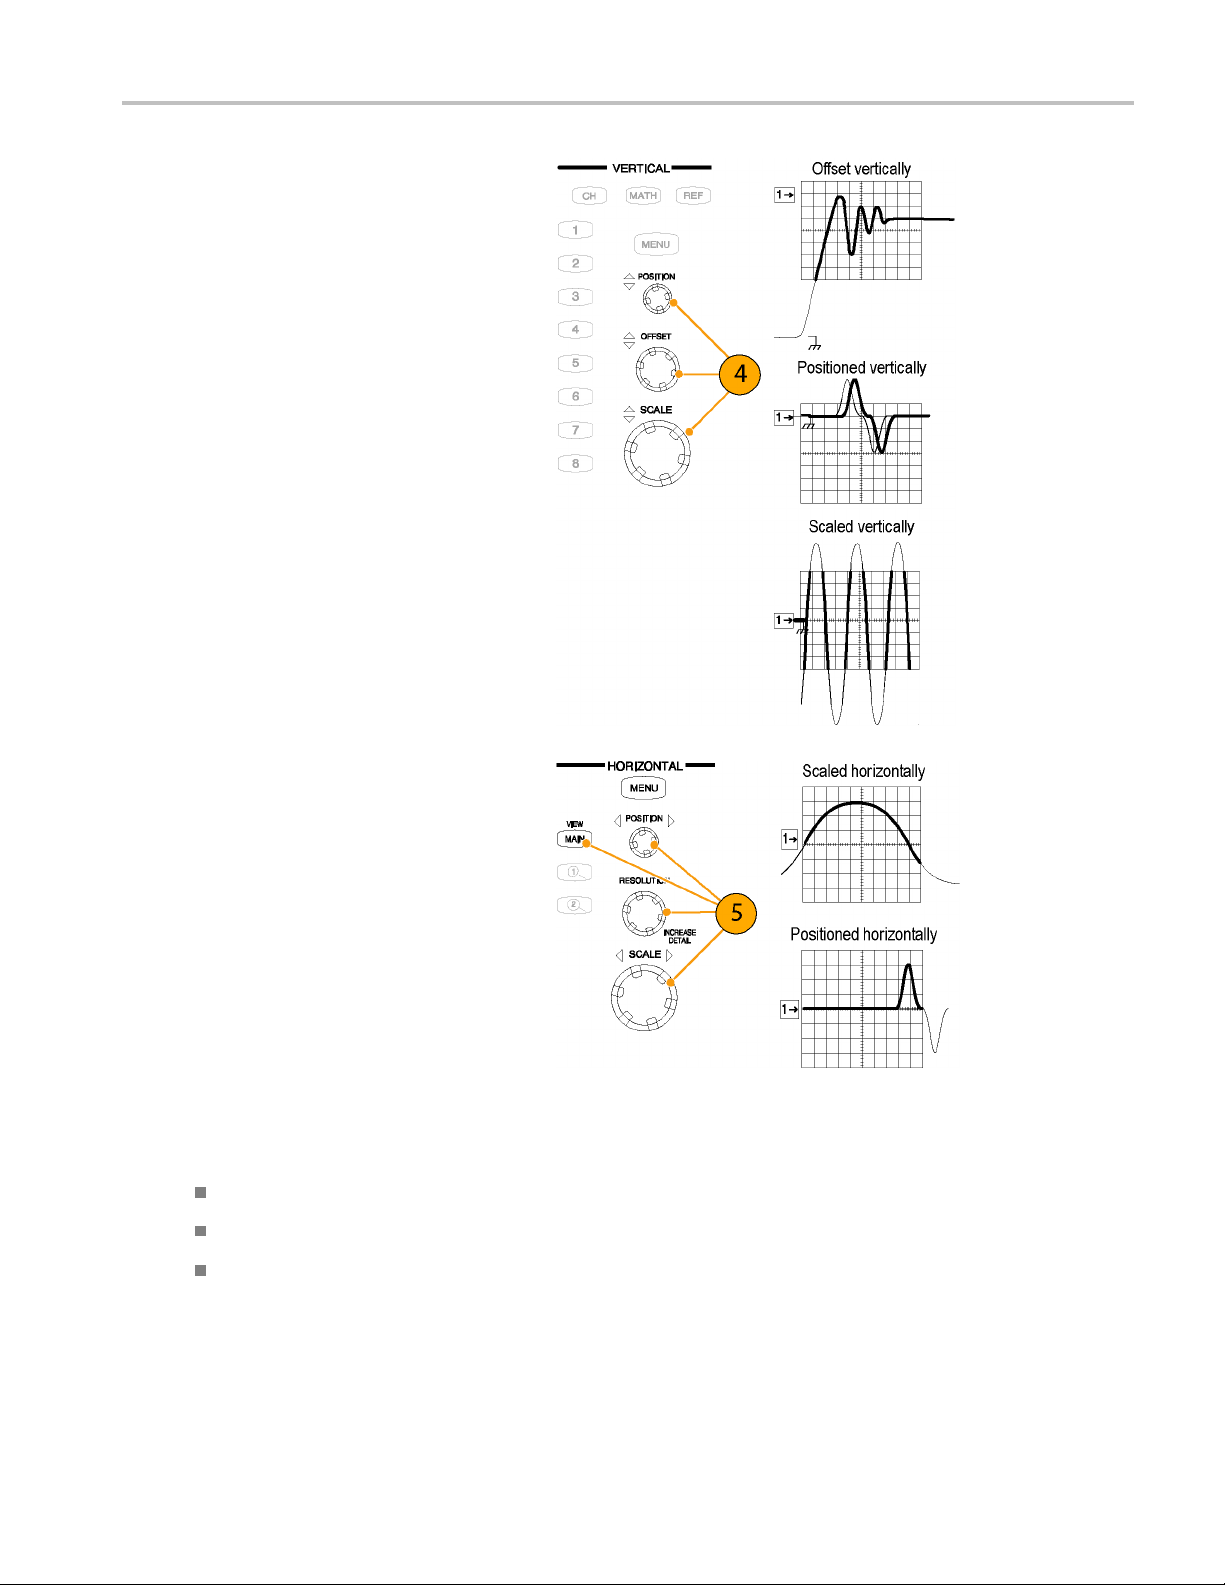
4. Use the Vertical Offset knob to adjust
the selected waveform on the screen.
Use the Vertic
knobs to adjust the display.
al Scale and Position
Acquisition
5. Push the
sure that the main time base view is
selected. Use horizontal knobs to scale
and pos
and to set sample resolution.
View Main button to make
ition the waveform on the screen
Quick Tips
You can click a waveform trace or its reference indicator with the mouse pointer (or touch screen) to select it.
Push AUTOSET to quickly set up instrument parameters based on the input signal.
Press Set to 50% in the Trigger controls, if required, to stabilize the display when using the Trigger Direct Input connector.
DSA8200 Quick Start User Manual 31
Page 50

Acquisition
Using Autoset
Use Autoset to quickly and automatically set up the instrument (vertical, horizontal, and trigger parameters) based on the
characteristics of the input signal.
1. Push the AUTOSET button to execute
an Autoset.
If you use Autoset when one or more
channels are displayed, the instrument
uses the selected channel for horizontal
scaling. Vertically, all channels in use are
individually scaled.
Quick Tip
Use the Defi
ne Autoset in the Utilities menu to display and change the Autoset properties.
Using Default Setup
1. To quickly return to the factory default
s, push DEFAULT SETUP.
setting
2. Click Y
es to restore the settings.
32 DSA8200 Quick Start User Manual
Page 51

Accessing the Setup Dialog B oxes
Acquisition
1. You c an access
by using the front panel buttons, the file
menu, or the toolbar.
the Setup dialog boxes
2. Click on the tabs to select among the
setup dialog boxes.
DSA8200 Quick Start User Manual 33
Page 52
Acquisition
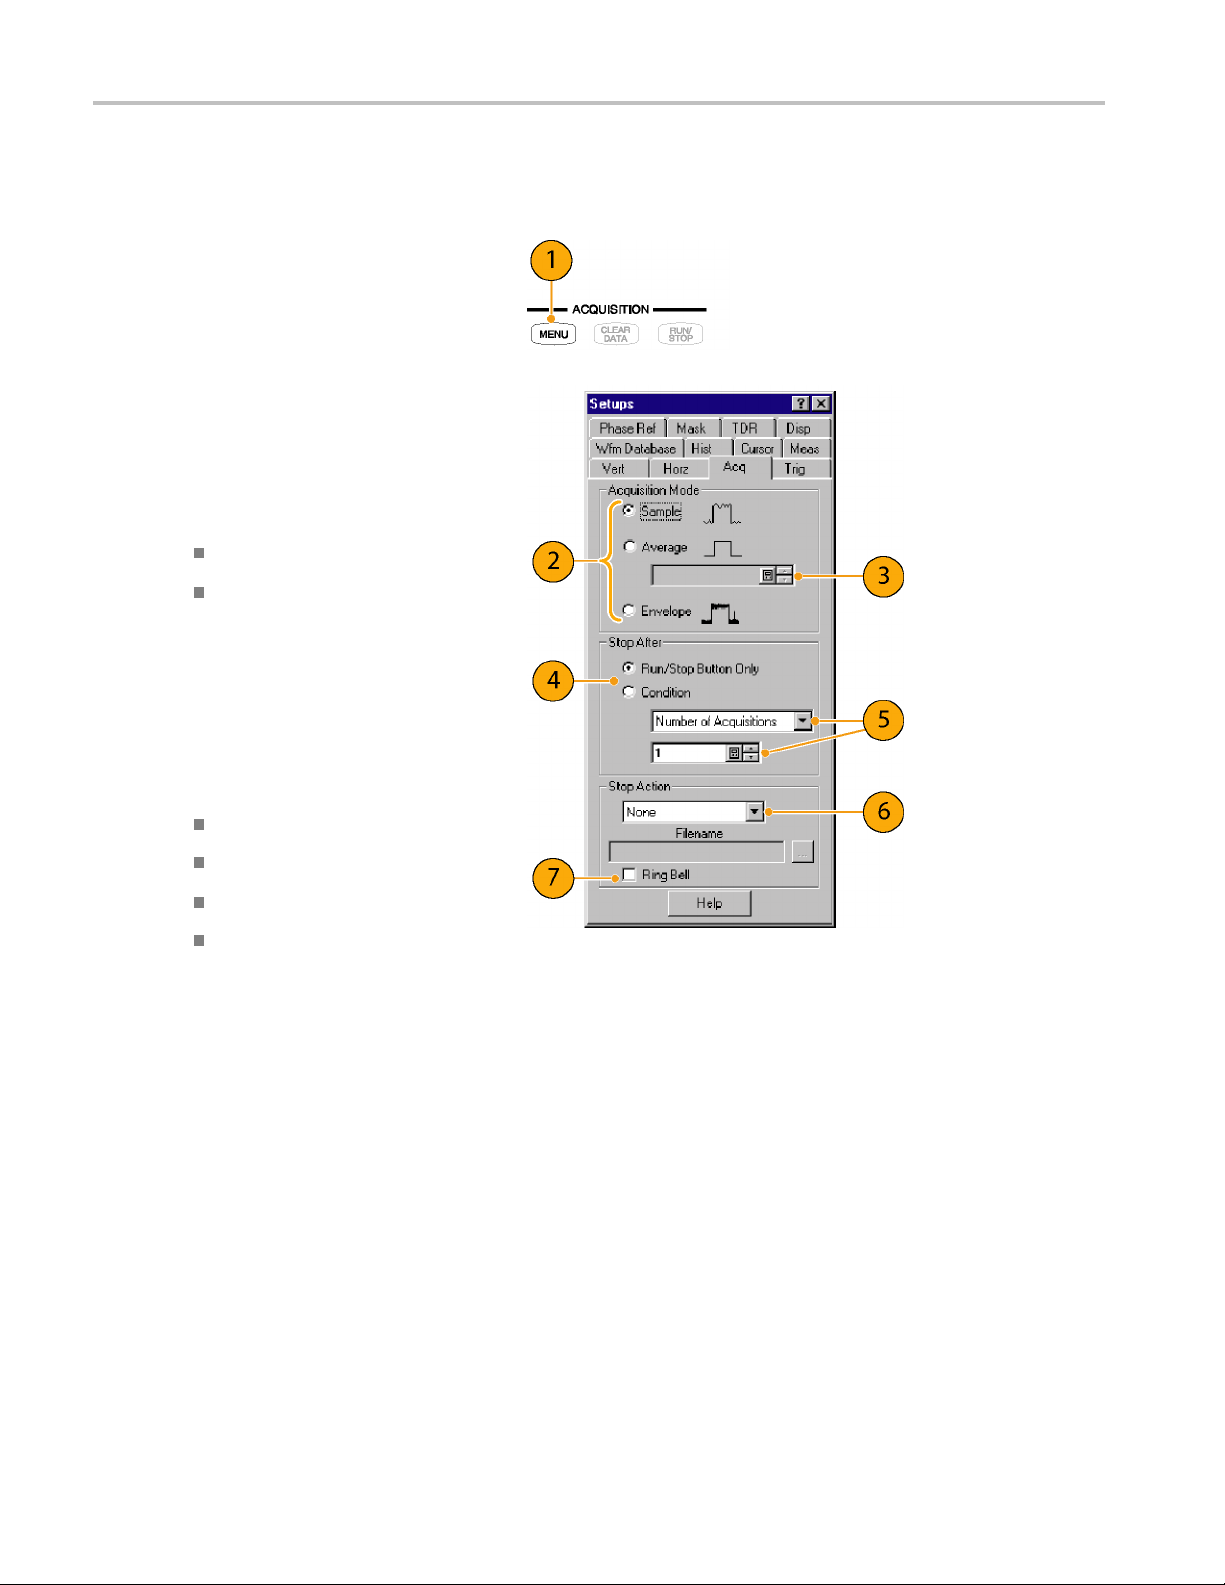
Changing the Acquisition Mode
Use the procedure that follows to set the data-acquisition mode and specify acquisition start and stop methods.
1. Press the Acquisition MENU button to
display the Acq Setup dialog box.
2. Select the a
3. For Average
samples to average.
4. Set the Stop After mode and action by
selecting one of the following options:
Run/Stop Button Only
Condition
5. If you selected Condition, choose a
conditio
list. If the condition requires a count,
enter a count.
6. Select a Stop Action action from
the drop
following actions:
None
Print Screen to File
Print Screen to Printer
Save all Waveforms
Enter a filename if you selected Print to
File o
cquisition mode.
mode, enter the number of
n to stop on from the drop-down
-down list. Choose from the
r Save all Waveforms.
7. Sele
34 DSA8200 Quick Start User Manual
ct Ring B e ll if you want an audio
notice when the acquisition stops.
Page 53
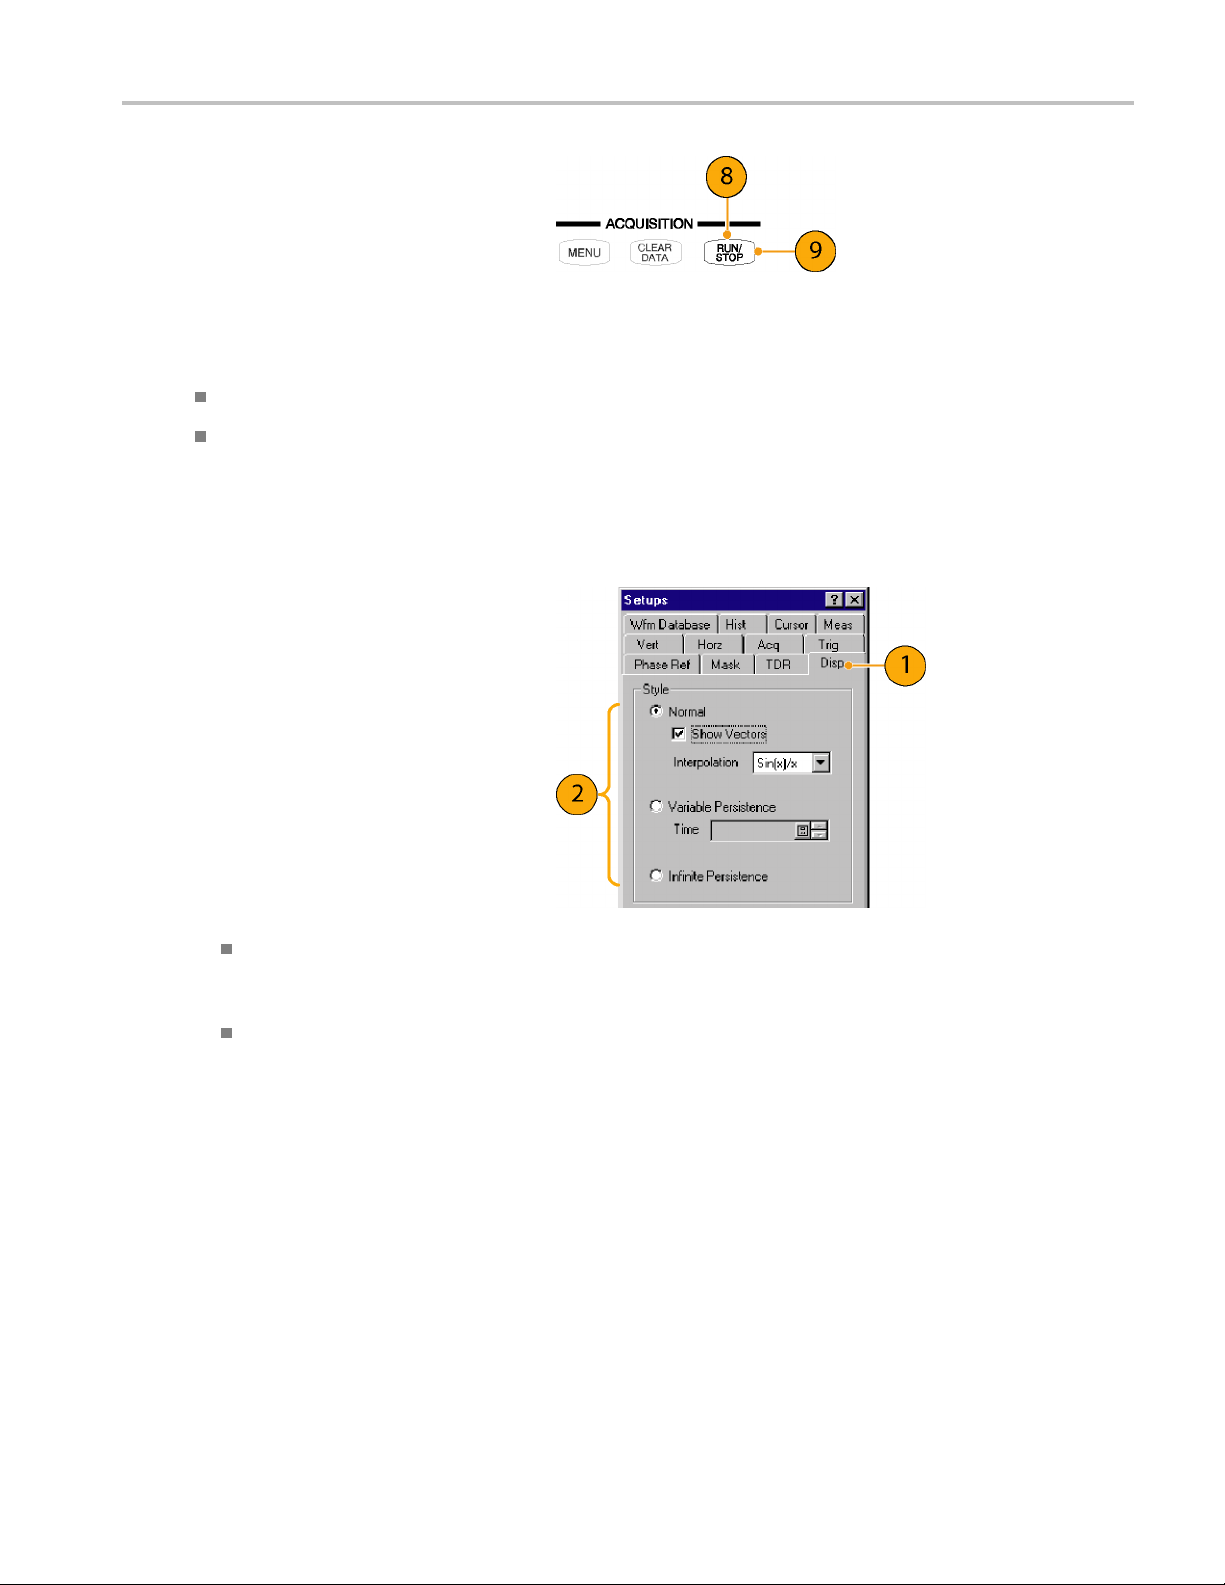
8. Press RUN/STOP to start the acquisition.
9. Press RUN/STOP again to stop the
acquisition.
Quick Tips
Run/Stop is available on both the front panel and the touch screen.
If Stop After is set to Condition, pressing RUN/STOP causes only one acquisition to run if the original condition has been
met. You need to press CLEAR DATA so that the condition must be met again.
Setting the Display Style
1. Select Disp to start setting the display
styles.
2. Choose a display style.
Normal selects a display with no
acquisition data persistence.
Waveforms are displayed with the new
data from ongoing acquisitions replacing
data acquired from previous acquisitions.
Show Vectors turns on display lines
between waveform dots; deselect to
display only dots.
Select an Interpolation mode from the
pulldown list.
Acquisition
Sin(x)/x interpolation computes
record points using a curve fit
between the acquired samples.
Linear interpolation computes
record points between actual
acquired samples by using a straight
line fit.
Variable Persistence makes data
persist for a specified time. New
waveform displays accumulate data as
new waveform records acquire, but with
continuous replacement of the oldest
data.
Set a time at which the oldest data is
removed.
DSA8200 Quick Start User Manual 35
Page 54

Acquisition
Infinite Persistence makes data
persist until you change some control
or explicitly
clear the data. Waveform
displays accumulate data as the
instrument acquires new data, resulting
in a buildup o
f data in all time slots.
3. Use the Grat
icule settings to select the
graticule style and the graticule color and
screen background.
36 DSA8200 Quick Start User Manual
Page 55

Triggers
This section contains concepts and procedures for using the trigger system. Detailed information is available in the
online help.
Triggering Concepts
Trigger Event
When a trigger event occurs, the instrument acquires a sample in the process of building a waveform record. The trigger
event establishes the time-zero point in the waveform record and all samples are measured with respect to that event. The
trigger event starts waveform acquisition. A trigger event occurs when the trigger source (the signal that the trigger circuit
monitors) passes through a specified voltage level in a specified direction (the trigger slope). When a trigger event occurs,
the instrument acquires one sample of the input signal. When the next trigger event occurs, the instrument acquires the next
sample. This process continues until the entire record is filled with acquired samples. Without a trigger, the instrument does
not acquire any samples. This behavior differs from that of real-time a cquisition systems, which can acquire a complete
waveform record from a single trigger event.
Trigger Type
Triggers
This instrument supports edge triggering only, in which edge triggers gate a series of acquisitions. The slope control
determines whether the instrument recognizes the trigger point on the rising or the falling edge of a s ignal. You can set
the trigger slope from the toolbar at the top of the display or in the Trigger Setup dialog box. The level c ontrol determines
where on that edge the trigger point occurs. You can set the trigger level from the front panel with the Trigger LEVEL knob.
The slope and level controls apply only when the trigger source is set to External Direct (using the TRIGGER DIRECT
INPUT connector).
Trigger Modes
The trigger modes control the behavior of the instrument when not triggered:
Normal mode sets the instrument to acquire a waveform only when triggered. Normal mode does not acquire data if
triggering stops; the last waveform records acquired remains "frozen" on the display (if the channels containing them are
displayed). If no last w avefo
Auto mode sets the instrument to acquire a waveform even if a trigger event does not occur. Auto m ode uses a timer tha
starts after trigger rearm. If the trigger circuit does not detect a trigger before this timeout (about 100 ms), it auto triggers,
forcing enough trigger events to acquire all active channels. In the case of repetitive acquisitions in automatic trigger mode,
waveform samples are acquired, but at different places in the data stream (synchronization is lost). If you do
signal to any displayed channel, a baseline is displayed for that channel.
rm exists, none is displayed.
t
not apply a
Trigger Sources
The trigger source provides the signal that the trigger system monitors. The source can be:
The internal clock of the instrument (TDR clock rate), with user-selectable clock frequencies. The INTERNAL CLOCK
OUTPUT connector supplies a replica of the internal clock at the instrument front panel.
An external signal coupled to one of the trigger input connectors on the front panel.
External Direct, DC coupled, and usable with signals up to at least 3.0 GHz
DSA8200 Quick Start User Manual 37
Page 56

Triggers
External Prescale, divided by 16, and usable with signals from 2.0 GHz up to at least 12.5 GHz
An internal clock-recovery trigger provided by either an optical sampling module that is equipped with a clock-recovery
option or a ded
depend on the sampling module used; for example, either 622 Mbps (OC-12/STM-4 standards) or 2.488 G bps
(OC-48/STM-16 standards) for the 80C01-CR Optical Sampling Module.
A pattern (frame) trigger provided by a PatternSync trigger module such as the 80A06 PatternSync Trigger Module. The
output of the
on the front panel.
Use a trigger source that is synchronized with the signal you are sampling and displaying. Selection of your trigger source
depends on your application, as shown in the following table.
icated electrical clock recovery module. Clock recovery is user-selectable for triggering rates that
pattern sync trigger module must be connected to the EXTERNAL DIRE CT TRIGGER INPUT connector
Table 1: Application-based triggering
Application
Communications (optical) serial
NRZ data signals
TDR measurement using an
electrical sampling module
equipped with TDR
Measurements on systems with a
synchronized pretrigger signal
Any application requiring that the
input signal provide the trigger
Any application requiring that you
probe the trigger source
Any application requiring that you
perform special measurements
using gated trigger
Source to use
Set source to Clock Recovery, set the clock-recovery type, and use an optical
sampling module equipped with a clock-recovery option supporting the specific data
rate of the serial optical signal.
The available clock recovery rates depend on which sampling module is installed.
Set source to Internal Clock to use the internal clock of the instrument (TDR clock),
and select the appropriate clock frequency. Disconnect any signal connected to the
External 10 MHz Reference Input when using the Internal clock.
Set source to External Direct or External Prescaler as appropriate and connect the
pretrigger signal.
Set source to External Direct or External Prescaler as appropriate. Use a signal
splitter or power divider to couple to both the Ext Direct or Prescaler input and the
input channel, so that the sampled signal is also the trigger signal.
Set source to External Direct and use a Tektronix probe.
Set source to External Direct, select Gated Trigger, and use a TTL connection to
trigger gate.
Trigger Source Connectors
External triggers can be connected to either the TRIGGER DIRECT INPUT or TRIGGER PRESCALE INPUT connectors
on the front panel:
Signals connected to the PRESCALE connector are divided by eight and then fed to the trigger circuits.
Signals connected to the DIRECT connector are fed directly to the trigger circuitry. The signal is DC coupled and can
be up to 3.0 GHz.
When using a given trigger source, disconnect any other trigger source from the front panel to ensure specified
performance. Specifically:
Do not connect a signal to the TRIGGER DIRECT or TRIGGER PRESCALE front-panel connector unless you have
selected that input as the trigger source in the Trigger setup dialog box.
Do not connect a signal to the External 10 MHz R eference front-panel connector unless you have selected that input as
the timebase mode in the Horizontal setup dialog box.
38 DSA8200 Quick Start User Manual
Page 57

Triggers
Gated Trigger Connector (Option GT Equipped)
You can attach a BNC cable to the External Gate input at the rear panel (TTL connection) to selectively exclude data from
acquisition by means of gating the trigger on and off. Several conditions must be met to get a stable display of waveform data:
The channel and trigger must be otherwise triggerable without the trigger gate.
The gating signal must be at a TTL high.
The triggering system must be enabled.
Enhanced Triggering
These featu
Trigger
Trigger holdoff can help stabilize triggering. When you adjust holdoff, the instrument changes the time it waits before
rearming its trigger circuit after acquiring a sample. Before rearming, trigger circuitry cannot recognize when the next
trigger conditions are satisfied and cannot generate the next trigger event. When the instrument is triggering on undesired
events, you can adjust holdoff to obtain stable triggering.
res can help stabilize triggering and perform special measurements:
High Frequ
hysteresis (a transition or noise band), which allows triggering on higher frequency signals.
Gated Triggering. Gated triggering takes the trigger and the External Gate input and applies them to the instrument
through what is in effect an AND function. Gated triggering can be used for applications such as simulations of undersea
communic
traveling longer distances. The trigger gate can be used to ignore triggers until the signal has traversed the loop
many times.
ency Triggering. High Frequency triggering increases trigger sensitivity of the trigger circuit by decreasing
ation fibers where test fixtures are used to repeat the test signal through a short loop of cable to simulate
Holdoff
DSA8200 Quick Start User Manual 39
Page 58

Triggers
Setting Trigger Controls
Nearly all trigger parameters are set in the Trigger Setup dialog window.
1. Press the trigger MENU button to display
the Trig Setup dialog box.
2. Select a trigger source.
3. Select a trigger mode: Auto or Normal.
4. Select the trigger slope.
5. Select a trigger level. Click Set to 50%
to automatically set the trigger level to
50% of the trigger signal amplitude.
6. Set the trigger holdoff value.
7. Select an Enhanced Triggering setting.
8. If the trigger source is set to Pattern
Sync, select Pattern Sync Setup....This
option is only available with a Pattern
Sync module.
Quick Tips
Selecting External Direct as the trigger source requires an appropriate trigger signal be connected to the TRIGGER
DIRECT INPUT connector.
The Slope and Level controls apply only w hen the trigger source is set to External Direct.
Selecting External Prescaler as the trigger source requires an appropriate trigger signal be connected to the TRIGGER
PRESCALE INPUT connector.
Selecting External Prescaler sets the trigger Mode to Normal.
Selecting Internal Clock uses the clock frequency setting in the pulldown list.
Selecting Clock Recovery requires that a module with clock recovery is available. Select the clock recovery standard
from the pulldown lists or user-specified range controls.
Gated Trigger is only available with Option GT.
Pattern Sync trigger is only available if a PatternSync module is installed.
The trigger output from the PatternSync module must be connected to the TRIGGER DIRECT INPUT connector.
Selecting Pattern Sync as the trigger source presets several trigger controls to predefined settings appropriate for
using the external TRIGG E R DIRECT INPUT connector.
40 DSA8200 Quick Start User Manual
Page 59

Setting Pattern Sync Controls
The Pattern Sync dialog box can be displayed when Pattern Sync is the selected triggering source.
1. Select the parameters for the pattern
sync module.
Select the channel Source where the
pattern sync module is installed.
Select the Data Rate (bit rate)
(default is 2.48832 Gbps).
Select the Pattern Length (default is
127).
Select a Data:Clock Ratio
(data-to-clock ratio) (default is
1:1).
Select a Relative Trigger Bit (in
the range of 0 to Pattern Length-1)
(default is 0).
Triggers
2. Use the AutoSync feature to
automatically detect the data rate,
pattern length and/or data-to-clock ratio
of the applied data and clock signals
(data to a sampling module channel and
the clock to the Pattern Sync module).
3. Enable FrameScan to automatically scan
through a pattern (or part o f a pattern).
The FrameScan control is tied to the
FrameScan control in the Horizontal
Setup dialog box (changing either one
affects the other).
Quick Tips
All pattern sync controls are disabled (grayed out) if there are no available pattern sync sources.
The default selected pattern sync source is the lowest-numbered pattern sync module.
The Data Rate in the Pattern Sync dialog box is tied to the Bit Rate control in the Horizontal setup dialog box (changing
either one affects the other).
If the entered Data Rate does not match the rate of the selected communication standard in the Horizontal Setup,
then the communication standard is changed to "User".
Using the PatternSync Trigger module in conjunction with FrameScan can improve both acquisition throughput and
timing accuracy.
For highest reliability and speed, it’s recommended to manually enter as many control values as possible. The control
value must be unchecked in the AutoSync Options to allow manual entry.
DSA8200 Quick Start User Manual 41
Page 60
Triggers
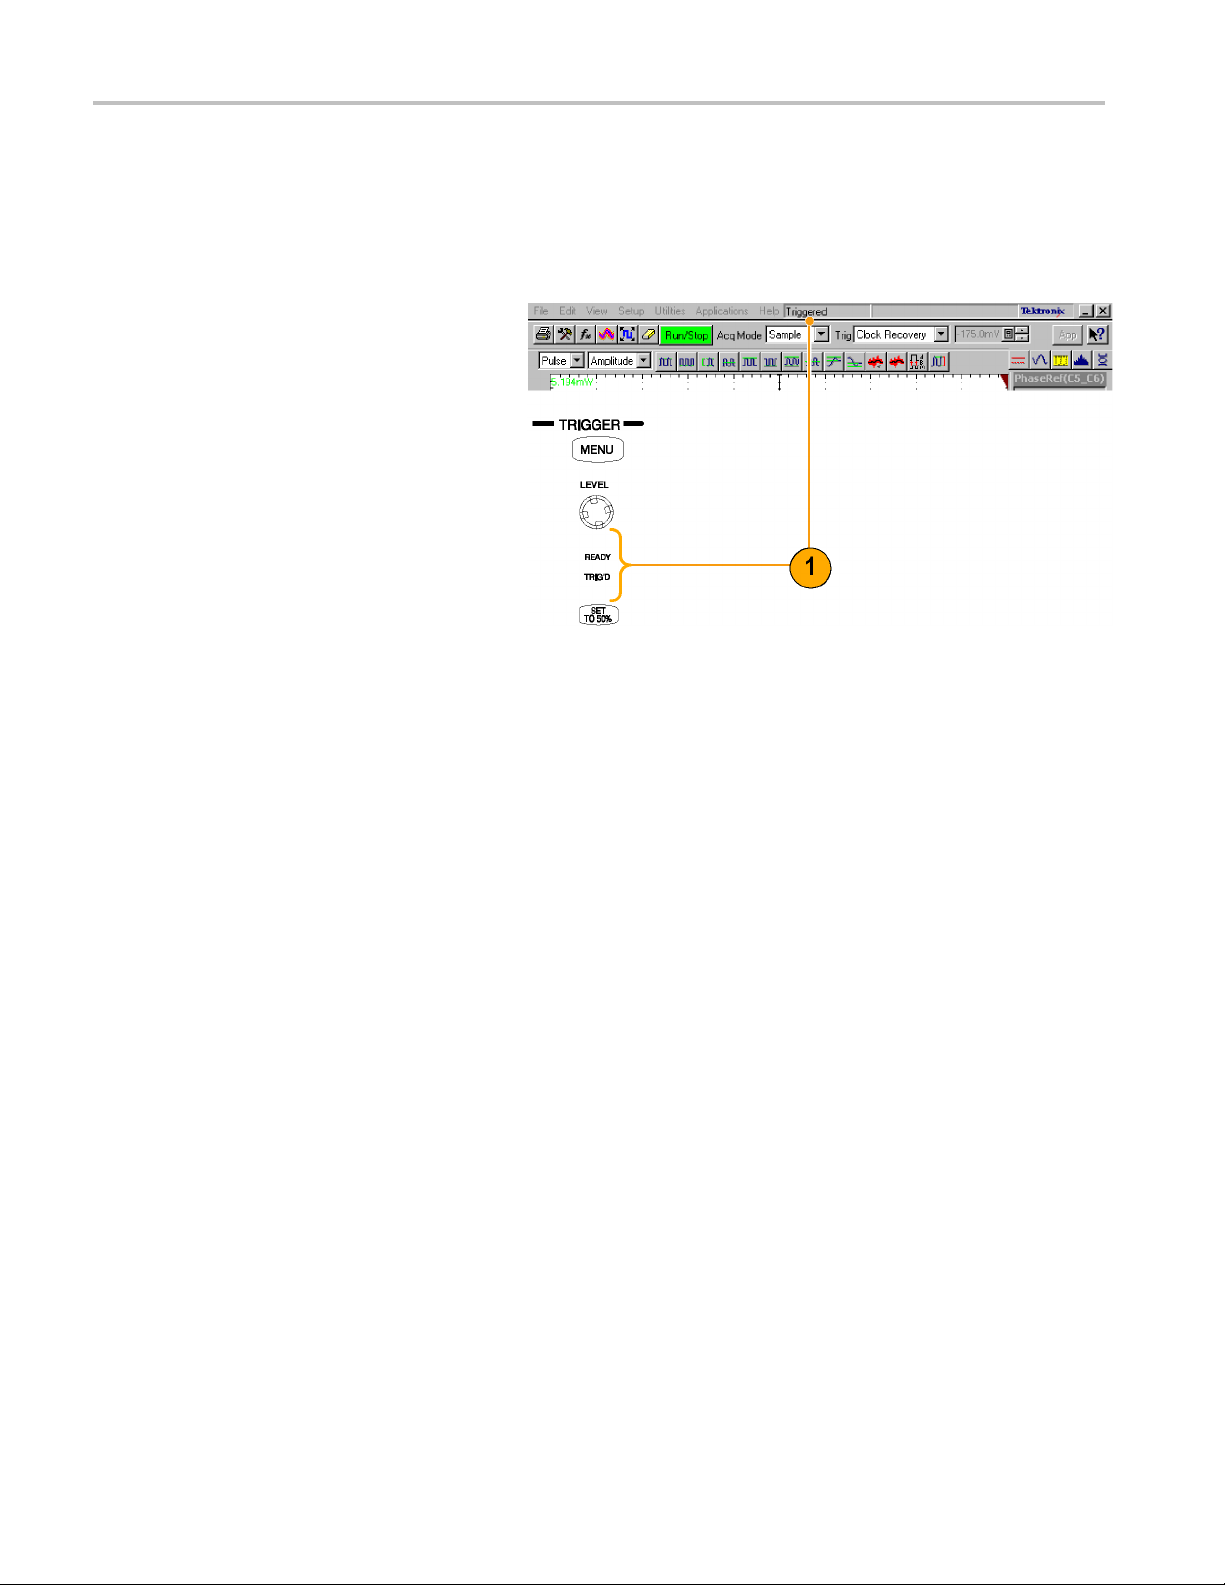
Checking Trigger Status
You can check the status of the trigger from the front panel and in the status bar. The status bar also displays the waveform
count.
You can use a phase reference module (such as the 82A04) for triggering. (See page 60, Phase Reference.)
1. Check the READY and TRIG’D
front-panel controls to determine the
trigger status.
42 DSA8200 Quick Start User Manual
Page 61
Analyzing Wavef
orms
Analyzing Wav
Your instrument features cursors, automatic measurements, statistics, histograms, and math to assist you in analyzing
waveforms. This section contains concepts and procedures for analyzing waveforms. Detailed information is available
in the online help.
eforms
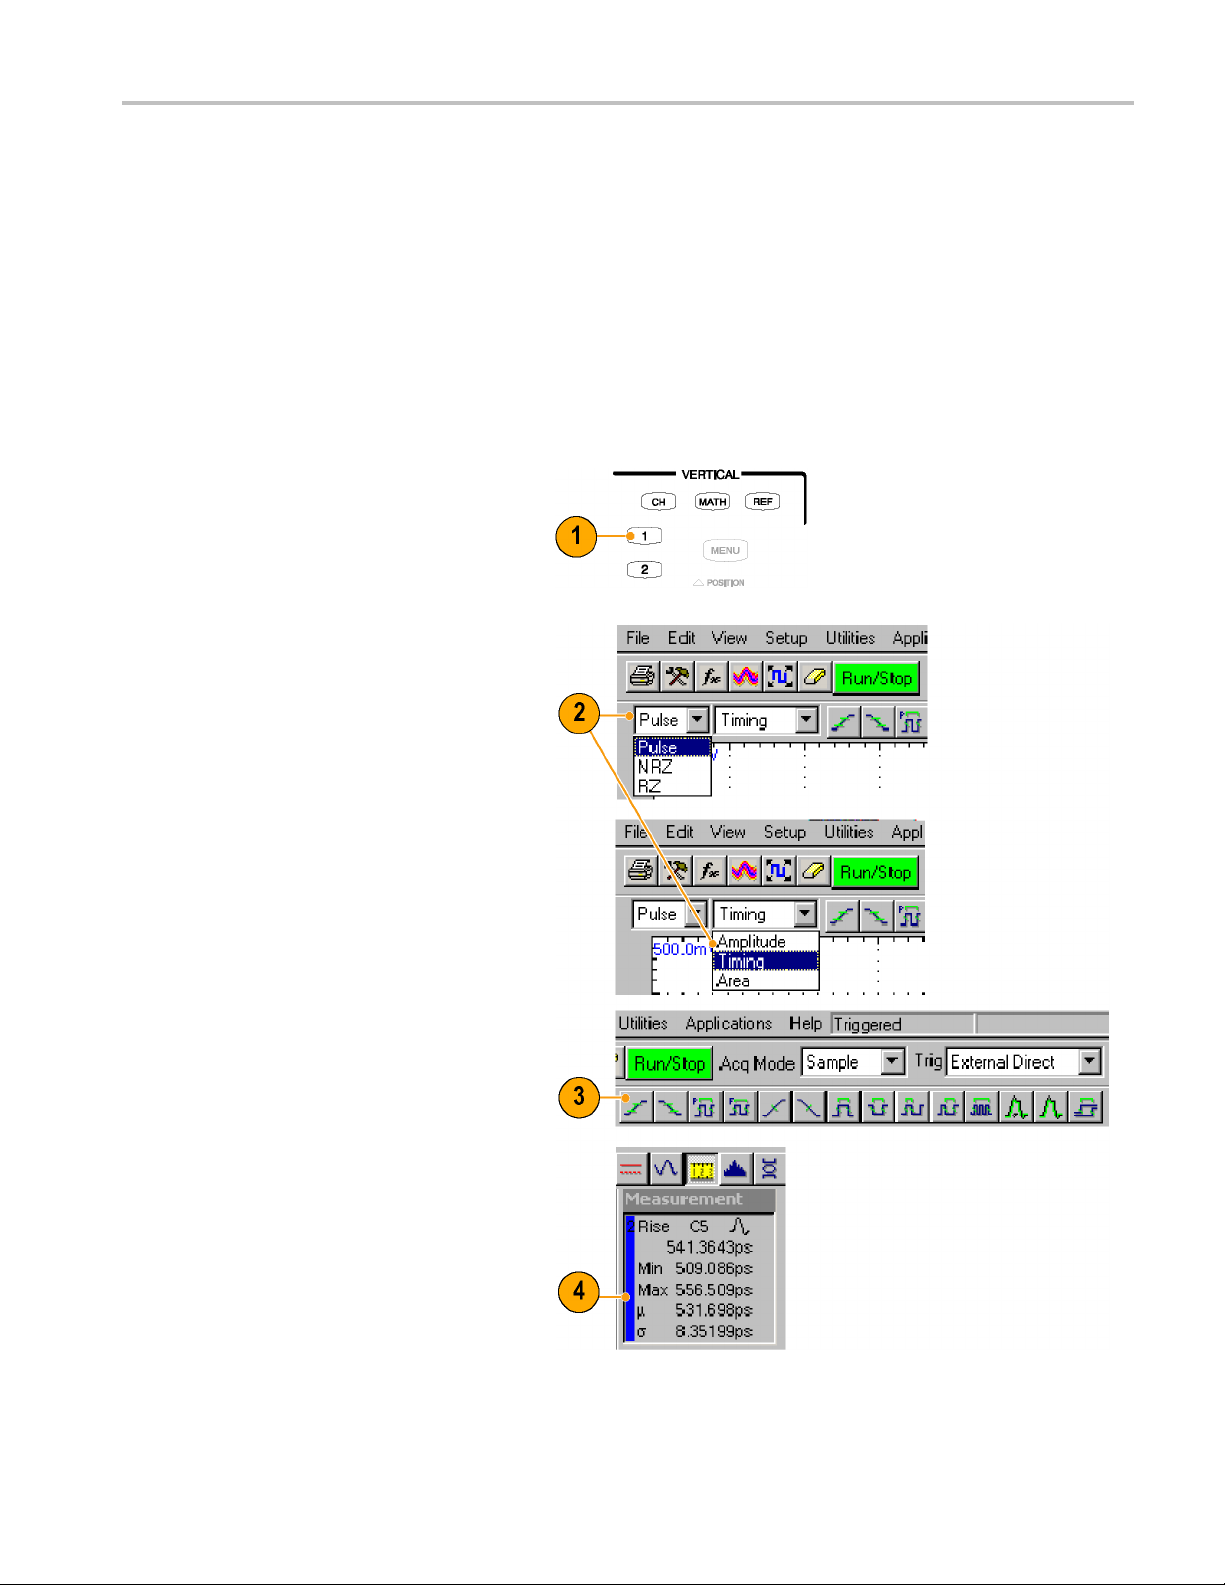
Taking Automatic Measurements
Automated m
are further divided into categories: amplitude, time, and area.
1. Use the Vertical buttons to select the
waveform to be measured.
The waveform may be a channel,
reference, or math waveform.
2. Select one of the signal (waveform)
types and then select a category from
the measurement bar.
3. Click the measurement you want in the
measurement tool bar.
easurements are divided into signal types: Pulse, NRZ (Non-Return-to-Zero), and RZ (Return-to-Zero). These
4. Read the results in the measurements
readout.
DSA8200 Quick Start User Manual 43
Page 62

Analyzing Wavef
orms
To see statisti
5. Right click on
to display its context menu.
6. Select Show Statistics to display
measurement statistics in the
measurement
To show annotations:
7. Right click on any measurement readout
to display i
8. Select Show
annotations that indicate which portion of
the waveform is being measured as well
as referen
9. Note the po
measured.
10. Note the reference levels for the
measurement.
cs:
any measurement readout
readout.
ts context menu.
Annotations to display
ce levels for the measurement.
rtion of the waveform being
44 DSA8200 Quick Start User Manual
Page 63

To measure a waveform database:
11. From the application menu bar, select
Setup, and then select Meas.
In the Meas Set
up dialog box, make
sure the measurement (one of Meas 1
through Meas 8) is selected.
12. In the Source tab, check the Use Wfm
Database opt
ion.
Analyzing Wavef
orms
DSA8200 Quick Start User Manual 45
Page 64

Analyzing Wavef
orms
To localize a me
13. Select Meas.
14. Select the Reg
15. Click the On bo
display the gates on screen.
16. Use the G1 (Gate1) and G2 spin controls
to adjust the gates on screen such that
theareatome
gates.
17. Click the Annotations box to display
which portion of the waveform is being
measured a
that measurement.
asurement:
ion tab.
x to turn gating on and to
asure is between the
nd the reference levels for
kTips
Quic
If, at the time you first create a measurement, the measurement source you select is displayed as a waveform database,
the database will automatically be measured. Deselect the User Wfm Database option if you want to measure the
vector waveform instead of the database.
Gate values are entered as a percentage of the waveform, displayed from left to right. If no keyboard is installed, access
the virtual keyboard and use the touch screen to enter values.
You can select and drag the gates to new locations by using a mouse or the touch screen.
46 DSA8200 Quick Start User Manual
Page 65

Turning Off Automatic Measurements
Up to eight automatic measurements can be assigned. Once all eight slots are used, no more can be assigned. If you
need to take another automatic measurement, and all measurement slots are used, make a slot available for the new
measurement or redefine a current measurement slot.
1. Note the assigned measurements. In
this example, measurement slots 1 and
3 have measurements assigned.
2. Select Meas (measurement) from the
Setup dialog box.
3. Use the pulldown list to select Meas 3
(measurement slot 3).
4. Note that measurement slot 3 has a
measureme
(On).
nt assigned and is displayed
Analyzing Wavef
orms
5. Press the Select Meas button to set
measurement slot 3 to None.
6. Note that measurement slot 3 is Not
Defined and no measurement icon is
ayed.
displ
7. Note that measurement slot 1 has a
measurement assigned. It is set to not
lay, but the measurement slot is still
disp
used.
ck Tip
Qui
To easily redefine a measurement slot, select Select Meas and choose a new measurement.
DSA8200 Quick Start User Manual 47
Page 66

Analyzing Wavef
orms
Cursor Measurements
Use cursors to measure amplitude and time quickly and with more accuracy than when using the graticule to take
measurements. Because you position cursors wherever you want on the waveform, they are easier to localize to a waveform
segment or feature than automatic measurements.
1. Press the CURSORS button:
Once for Vertical Bars
Twice for Horizontal Bars
Three times for waveform cursors
2. Press the SELECT button to toggle
selection between the two cursors. The
active cursor is represented by a solid
line.
3. Turn the G eneral Purpose knob to
position each cursor on the waveform to
measure the feature that interests you.
4. Vertical bars (V Bars) measure time
(horizontal) parameters.
5. Horizontal bars (H Bars) measure
itude parameters.
ampl
48 DSA8200 Quick Start User Manual
Page 67

6. Waveform cursors measure vertical and
horizontal parameters simultaneously.
Waveform curs
waveform and track with the waveform
points.
7. Read cursor measurement results on the
display.
ors are attached to the
Analyzing Wavef
orms
8. Click this
readouts on and off.
Quick T
Cursors require that at least one waveform is selected on the screen.
Waveform cursors are not available if a waveform database is selected.
You can drag a cursor to place it relative to the waveform.
You can assign each cursor to a different waveform to measure differences between waveforms. Make these selections
in the C ursor setup dialog box.
button to toggle the cursor
ips
If you use two magnified time base views, you can take precision timing measurements between two distant points on a
waveform. Magnify each point of interest in a separate time base, and then place one cursor on each point. The Δ-time
cursor readout will then reflect the position and resolution of the magnified time bases.
DSA8200 Quick Start User Manual 49
Page 68
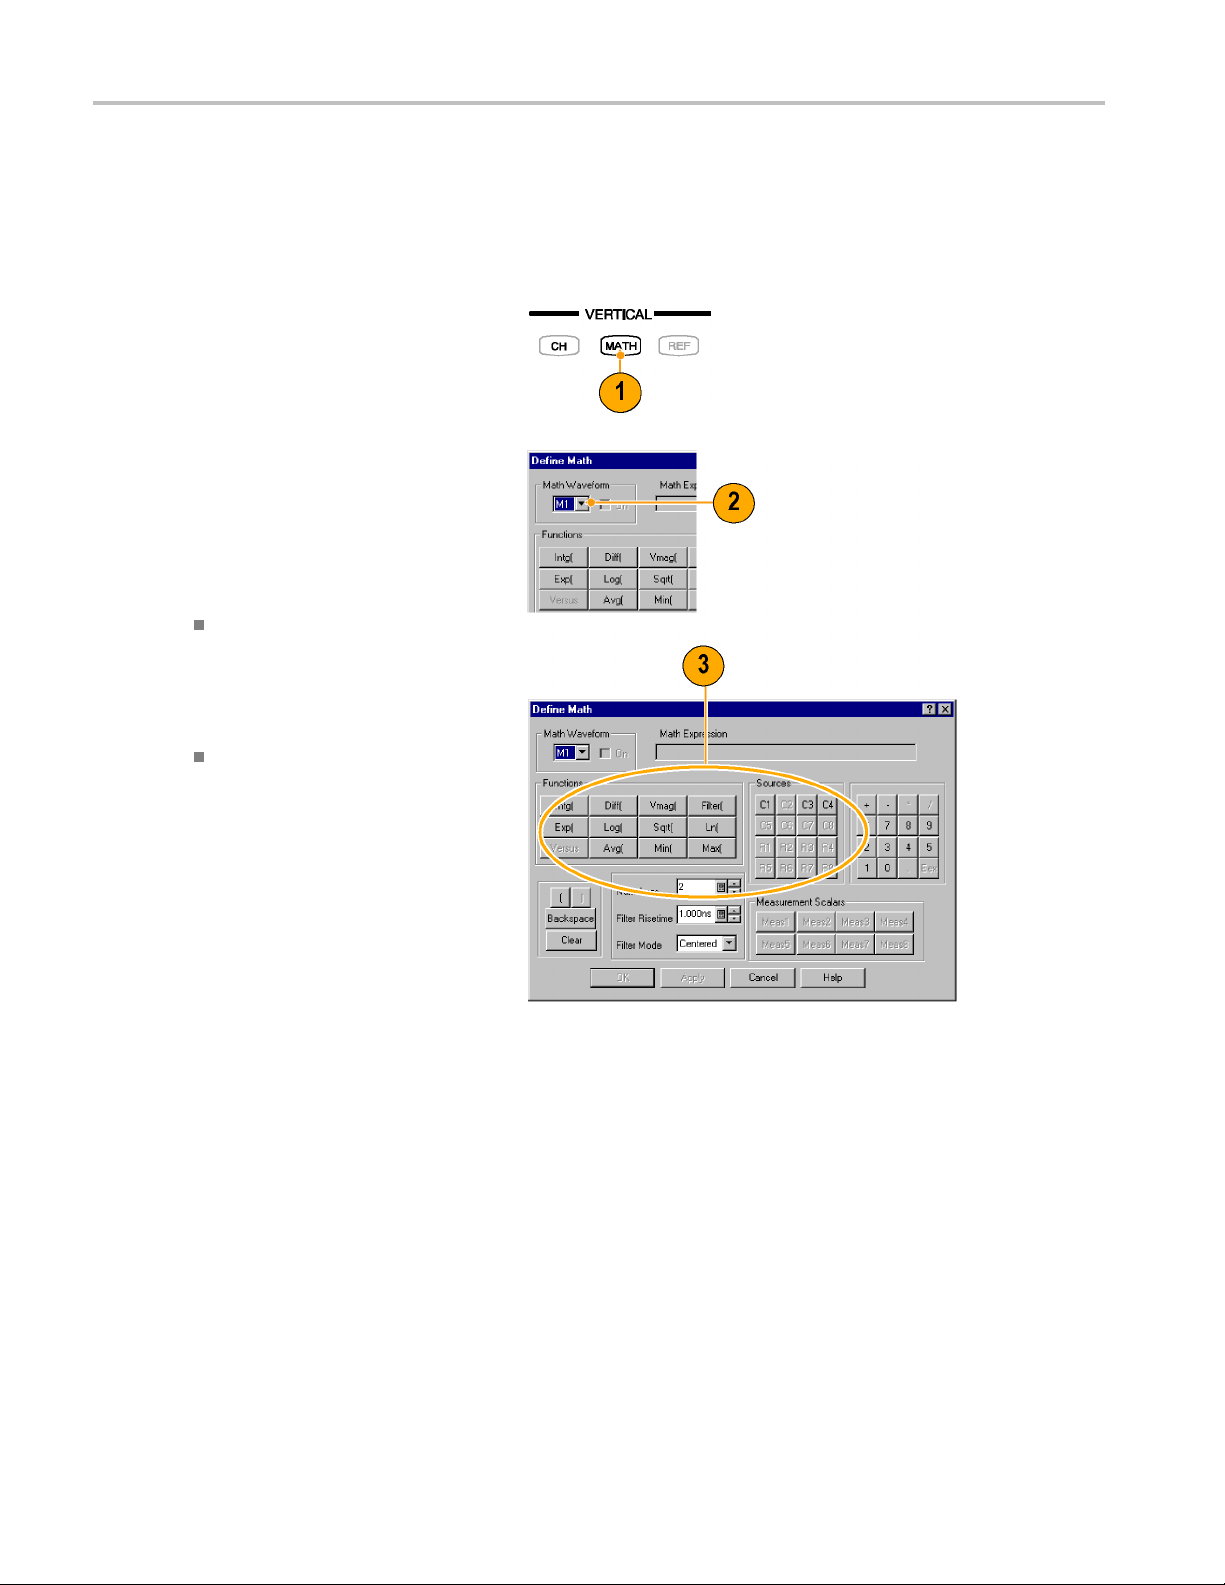
Analyzing Wavef
orms
Math Waveforms
You create math waveforms by creating a math expression using the Define Math dialog box. In that dialog box, you apply
numerical constants, math operators, and functions to operands, w hich can be channels, waveforms, reference waveforms,
measurements (scalars), or fixed scalars. You can display and manipulate these derived math waveforms much like you
can the channel and reference waveforms.
1. Press the Vertical MATH button (once
or twice if needed) to display the Define
Math dialog box.
2. Click the Math Waveform drop-down list
in the dialog box and select one of the
eight available math waveforms.
3. Use the dialog box to defineamath
expression. Some guidelines for creating
your expression follow:
Sources (C1 - C8, R1 - R8, and
Meas 1 - Meas 8) should be set up
before you use them (references and
automated measurement scalars
should be defined).
Elements that appear grayed out
cannot be selected because they
would result in an illegal entry.
50 DSA8200 Quick Start User Manual
Page 69
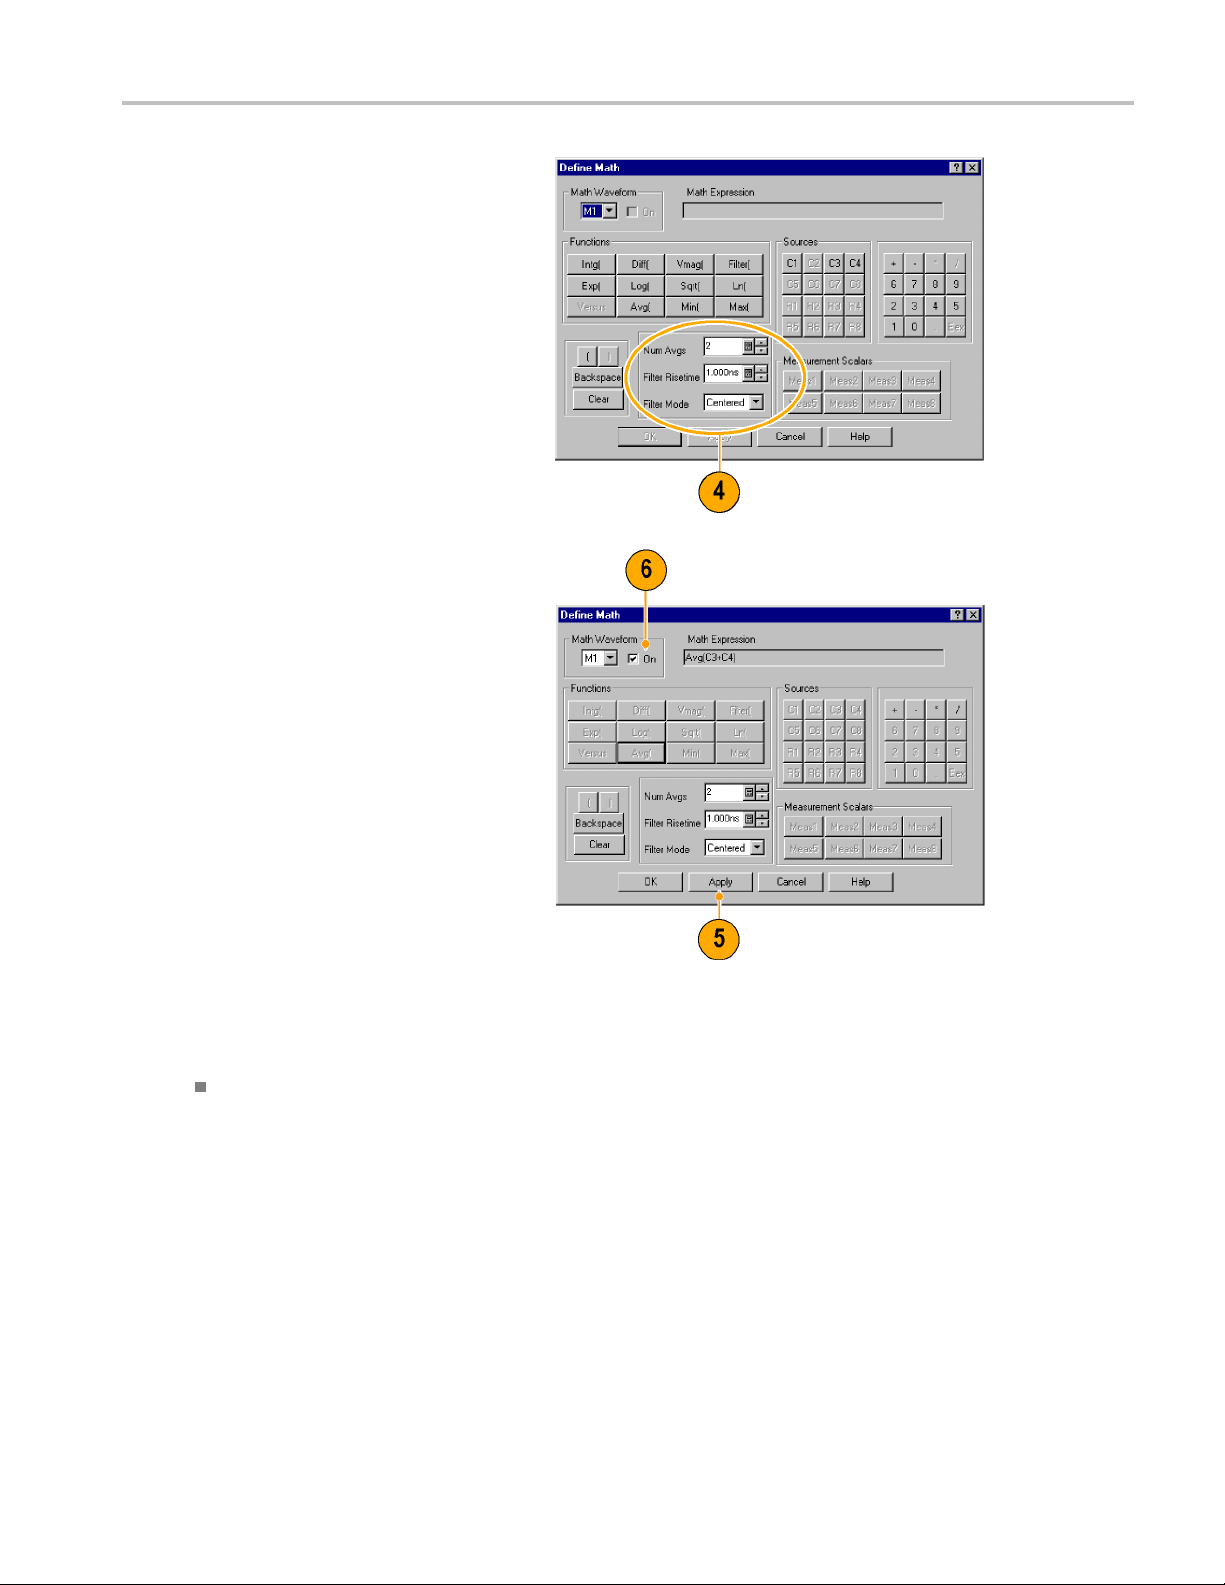
4. Use the filter controls in the dialog box
to apply a filter to the math waveform
defined by the e
5. When you have defined the expression,
click Apply.
6. Select the Math Waveform On box, so
that the waveform displays.
xpression.
Analyzing Wavef
orms
Quick
DSA8200 Quick Start User Manual 51
Tip
If you select a waveform that is already defined, its math expression appears in the dialog box. To use the w aveform,
click the Clear button, which discards its previous math expression.
Page 70

Analyzing Wavef
orms
Waveform Databases
The four available waveform databases can be used for measurements, histogram calculations, mask testing, and generating
a density-style, graded display. Waveform databases may be automatically allocated for measurements, histograms,
and mask testing.
1. Click Wfm Database in the Setup dialog
box.
2. From the pulldown menu under
Database, select one of the four
available databases.
3. Click the Source button to select the
waveform source.
4. Click On to start accumulating data from
the selected source.
5. Click Display to turn on the display of
the waveform database.
6. Select the Persistence mode for the
selected waveform.
7. If you selected Variable persistence, you
can specify the number of waveforms
that are included in the waveform
database.
The following Display Options affect all
waveform databases that you display:
8. Click a grading display option.
9. Click Invert to emphasize the least
occurring pixels by reversing the
intensity/color assignments to each
grading partition.
10. Select one of the four grading methods.
11. If you selected one of the two
Emphasized grading methods, slide the
Emphasize Counts percentage control
to specify the range of counts you want
emphasized.
Quick Tip
tain measurements require the use of a waveform database and automatically set the measurement system to use a
Cer
waveform database if available.
52 DSA8200 Quick Start User Manual
Page 71
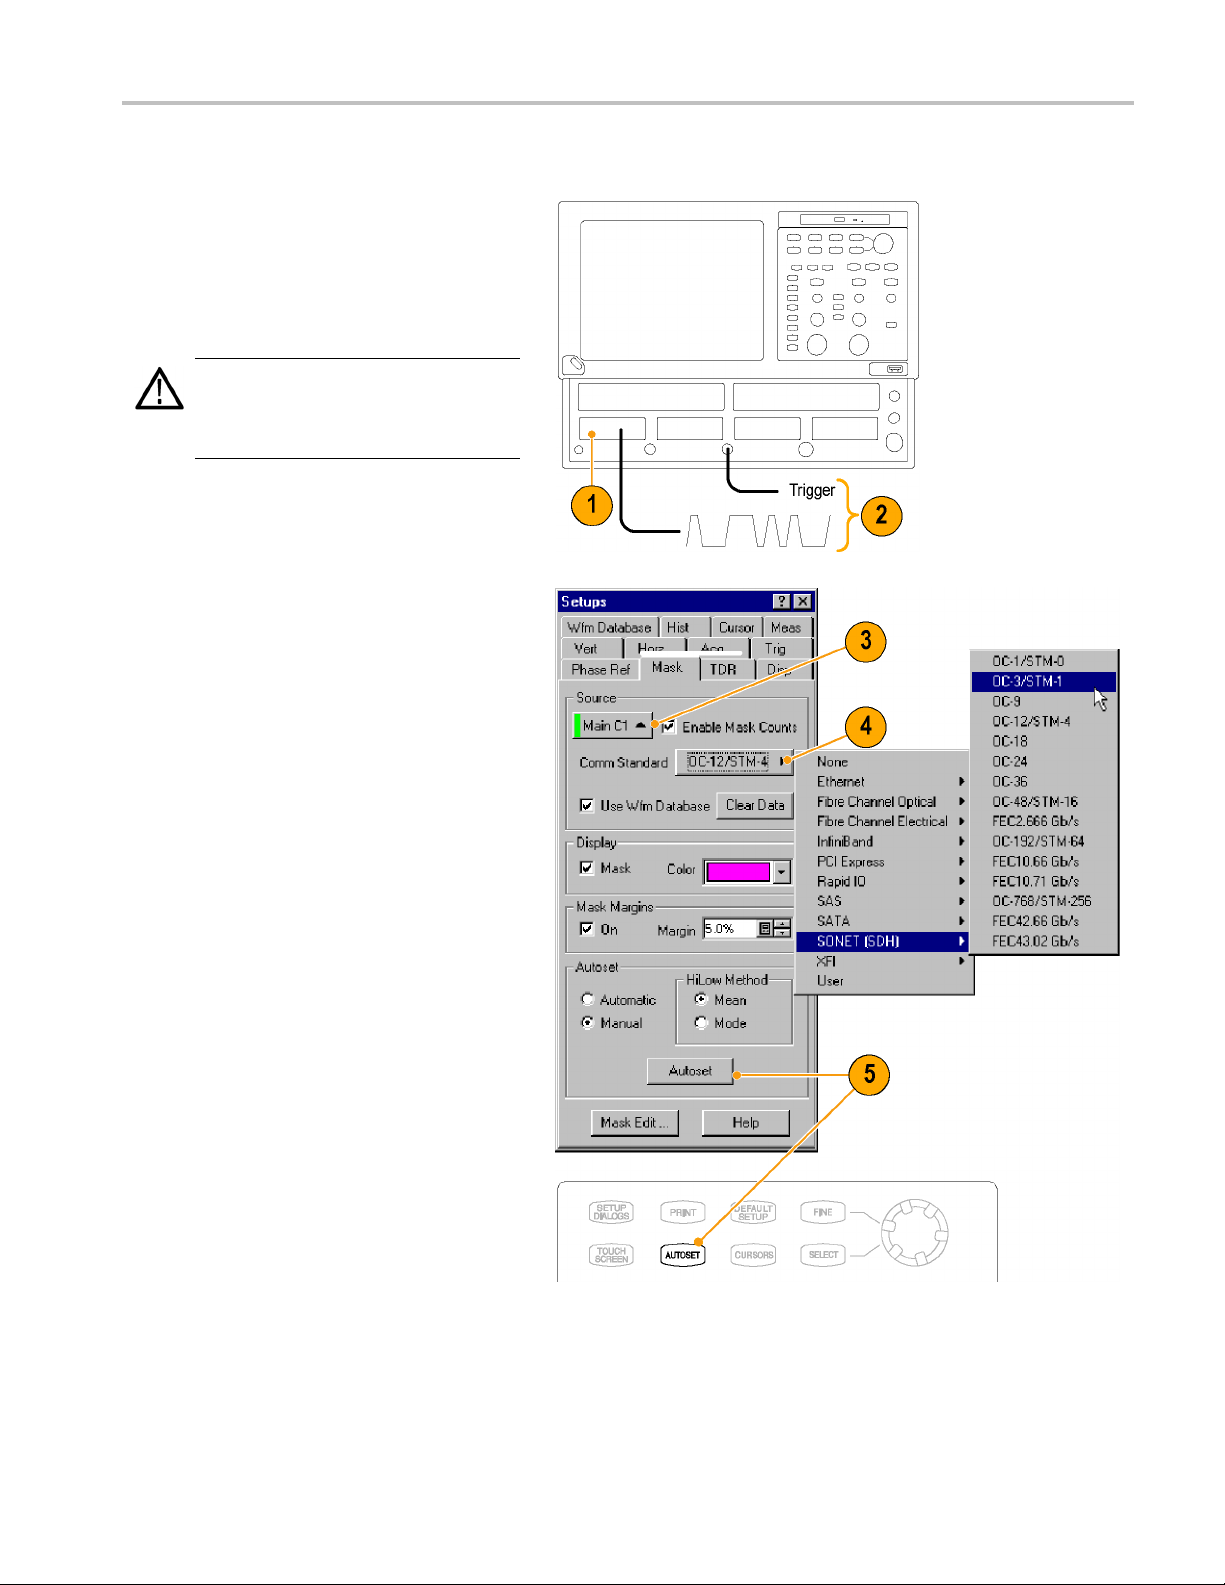
Display a Communication Signal
Analyzing Wavef
orms
1. Carefully ins
the instrument. (See page 6, Instal ling
Modules.) Also, read the user manual for
your specificm
2. Connect sign
module.
CAUTION. Always observe static-safe
procedures
your sampling-module user manual when
connecting signals.
3. Select the channel that you want to
display i
4. Select th
5. Click Au
box or on the front panel.
tall the sampling module in
odule.
als to your sampling
and cautions as outlined in
ntheMasksetupdialogbox.
e communication standard.
toset in the Mask setup dialog
DSA8200 Quick Start User Manual 53
Page 72
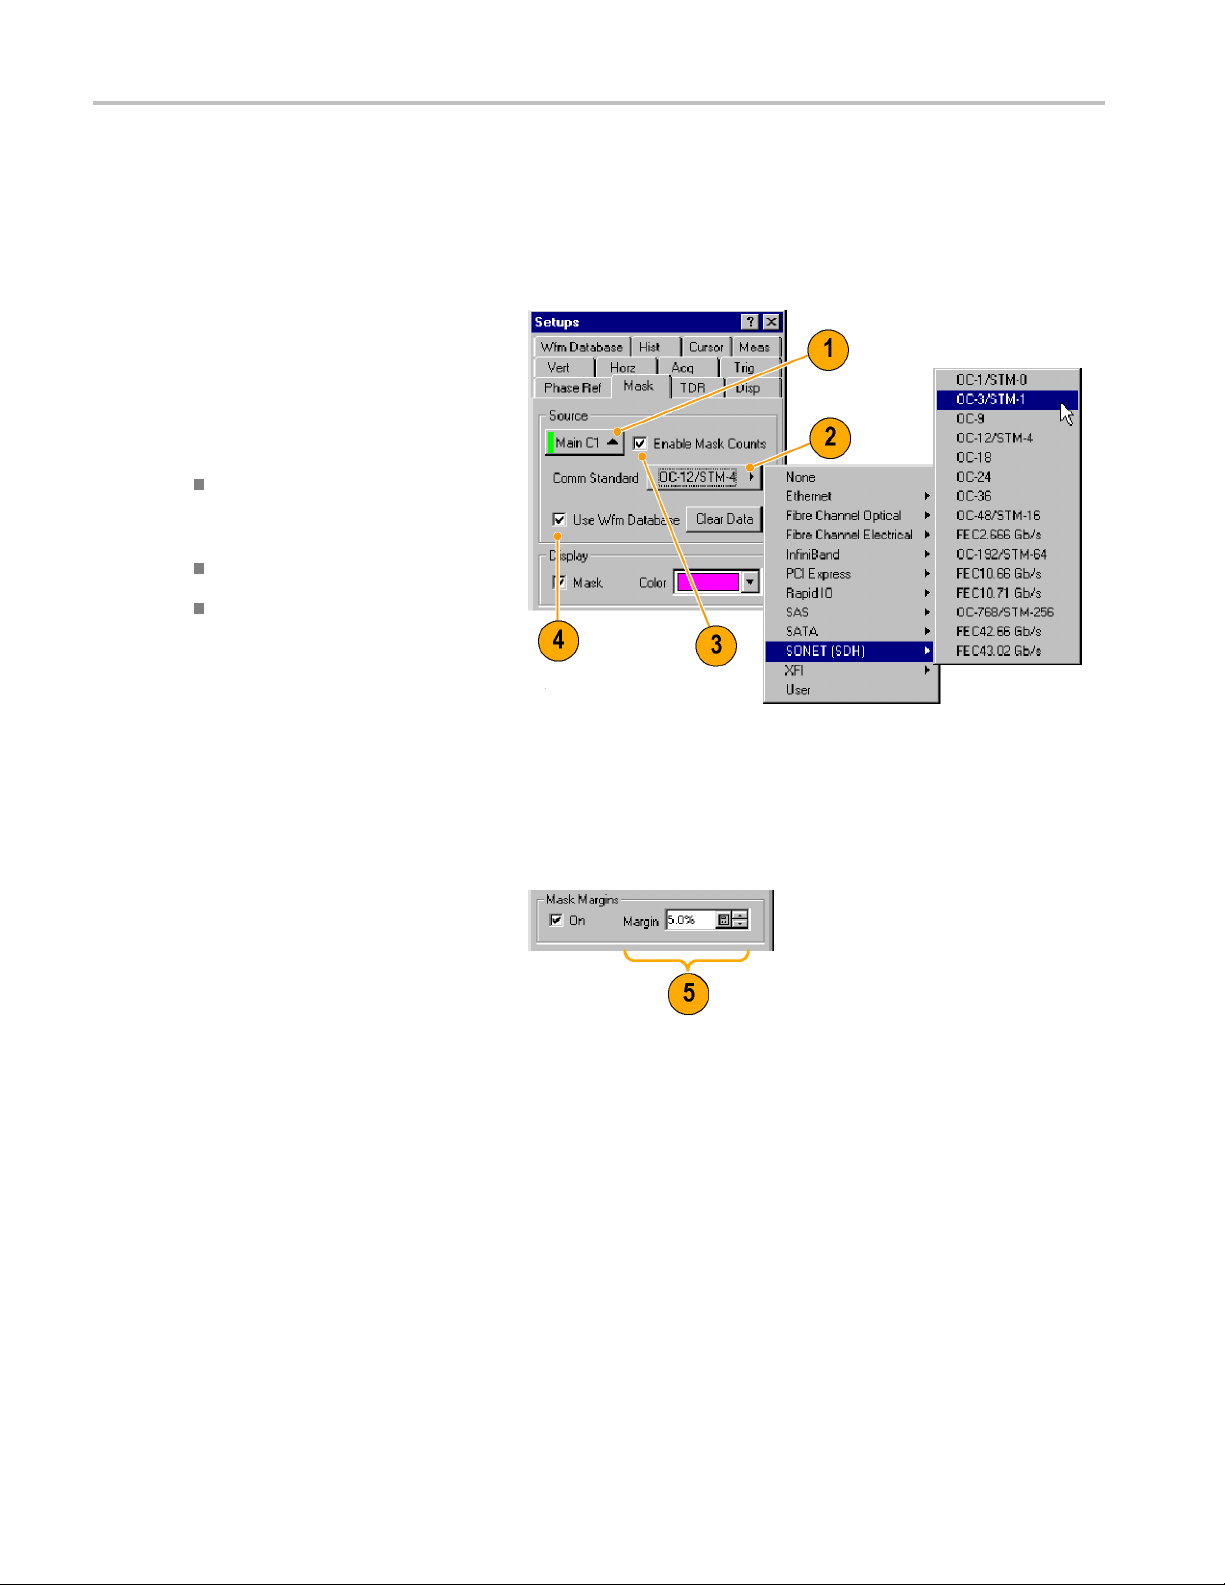
Analyzing Wavef
orms
Display and Analyze Communication Signals Using Mask Testing
Use mask testing to test your waveforms for time or amplitude violations against a predefined industry standard or a
user-defined mask. Mask testing counts waveform samples (called hits or violations) that occur within a specificarea(the
mask). Use the communications-standard masks that this instrument provides (SONET/SDH, Fiber Channel Optical and
Electrical, and Ethernet) to test your signals, or define your own masks.
1. Select the waveform to be mask tested
from the drop-down list under Source.
2. Select a standard mask in the
Mask setup dialog box. S electing a
communication standard or user-defined
mask automatically:
Displays the mask on screen and
autosets for the mask if Automatic is
checked in the dialog box.
Enables mask testing.
Displays mask count statistics in the
mask readout. A mask does not
have to be displayed to have mask
counting enabled.
3. If you want, disable mask counts.
(Selecting a mask in step 2 automatically
enabled them.)
4. Check Use Wfm Database to use a
waveform database as the waveform
source.
5. You can enable margins to explore
design margins of your communications
signal.
54 DSA8200 Quick Start User Manual
Page 73

To autoset the waveform to mask:
6. Click the Autoset button to perform a
manual autoset on the mask-source
waveform.
Analyzing Wavef
orms
7. Select the Hi
determine the High and Low values when
aligning the input signal to the masks.
Mean sets the
mean value of the High level (topline)
and Low level (baseline), taken within
the fixed eye
eye), to align the input signal to the NRZ
mask.
Mode sets t
the High level (topline) and Low level
(baseline), taken across one unit interval
of the eye d
signal to the NRZ mask.
To set a Stop Action:
8. Click Acq in the Setup menu.
9. In the A
Condition option under Stop After.
10. In the Condition pulldown list, select
a mask-related c riteria, such as Mask
Total
the count box.
These settings stop acquisition when
mask v
set.
Low Method used to
Mask Autoset to use the
aperture (center 20% of the
he Mask Autoset to use
iagram, to align the input
cq Setup dialog box, check the
Hits and set a count, such as 1, in
iolations satisfy the criteria you
11. Push the RUN/STOP button to restart
uisition, if stopped.
acq
DSA8200 Quick Start User Manual 55
Page 74

Analyzing Wavef
orms
To restart test
12. To restart a ft
occurs, push the front-panel CLEAR
DATA button.
13. Read the mask-hits count in the readout.
ing:
er a S top After condition
Quick Tips
ing a source that is currently displayed as a waveform database automatically enables mask testing on the
Select
database. To mask test the waveform instead of its database, deselect the Use Wfm Database box.
You can choose to autoset the mask-source waveform to the mask each time you select a new mask standard by
checking Automatic under Autoset.
Pressing the RUN/STOP button after acquisition has stopped due to a Stop After condition being met causes the
ument to acquire one (and only one) additional waveform.
instr
lear D ata button resets all mask counts. In addition, if the source for mask testing is a waveform database, clicking
The C
this button clears the waveform database.
56 DSA8200 Quick Start User Manual
Page 75

FrameScan
Use FrameScan to test a specific bit (or range of bits) in a repeating frame of data. FrameScan acquisitions allow detailed
display and analysis of individual, complete waveforms or of the bit sequences leading up to a failure. This ability to identify
the specific patterns that caused the failure makes the FrameScan mode superior to traditional methods.
1. Select the Horizontal Setup menu.
2. Click Enabled in FrameScan.
3. Click Auto Position.
4. Set the Start Bit to specify the starting bit
location for the scan when FrameScan
Auto Position mode is on.
5. Set the Scan Bits to the number of bits
or subframes you want to acquire.
Analyzing Wavef
orms
Quick Tips
The Start Bit control determines the starting horizontal position that FrameScan uses for each acquisition scanning cycle.
The Auto Position control must be on to use the Start Bit.
DSA8200 Quick Start User Manual 57
Page 76
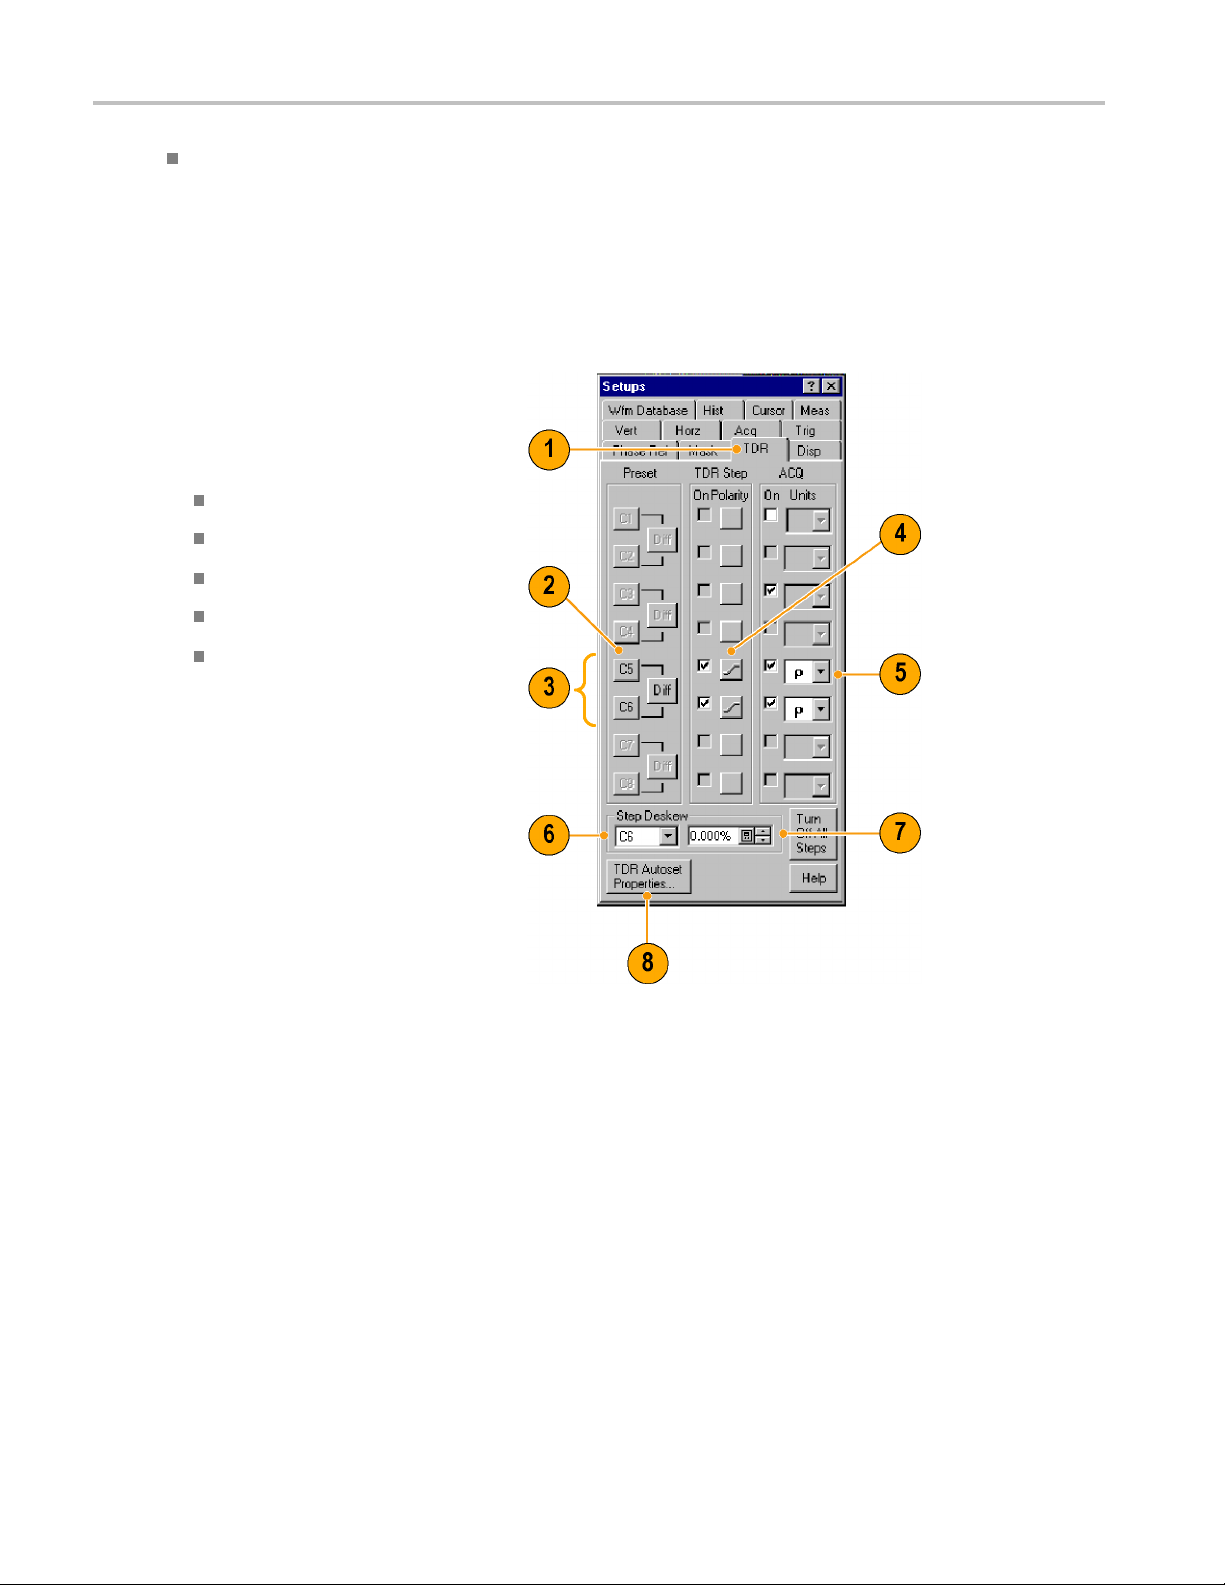
Analyzing Wavef
orms
The Auto Position control is disabled when the Trigger Source is set to Pattern Sync. When using Pattern Sync, use the
Relative Trigg
To Use TDR
To take TDR measurements, you must have a TDR-capable sampling module installed and your network must be attached to
the TDR sampling module.
1. Select TDR from the Setup menu.
2. Click the channel button to automatically
display the incident and reflected s teps
by automating the following tasks:
Turns on the channel.
Turns on a step.
Sets trigger source to Internal Clock.
Sets acquisition to Averaging.
Changes display style to Show
Vectors.
er Bit control in the Pattern Sync configuration settings.
3. Select a channel pair to perform a
differential TDR measurement. Press
Diff to automatically set up the differential
measurement for the channel pair.
All the tasks listed in step 2 are performed
for both channels and the pulse polarity
of the second channel is set to negative.
4. Click the polarity button to toggle the
step edge.
5. Set the vertical scale Units to V (volts), Ω
(ohms), or ρ (rho).
6. If performing differential TDR, select the
channel (TDR module with dual channel
adjustment) or the even-numbered
channel of the channel pair (TDR module
with single channel adjustment) for
deskew adjustment.
7. Set the Deskew percent value.
58 DSA8200 Quick Start User Manual
Page 77

Analyzing Wavef
orms
8. Press TDR Autos
display the Autoset Properties dialog box
to prepare the TDR autoset.
et Properties to
Quick Tips
Use a lower internal clock rate to examine long cables.
For a TDR module with single channel deskew capability, only the even-numbered channel of the module is selectable
for deskew. For a TDR module with dual channel deskew capability, both channels of the module are selectable for
deskew. (See page 72, Skew and Deskewing.)
DSA8200 Quick Start User Manual 59
Page 78

Analyzing Wavef
orms
Phase Reference
Use the Phase Reference module, and the phase-correction timebase that it supports, when you need to acquire with ultra
low jitter. Using this mode reduces trigger jitter in the instrument which lets you measure clock and other phase jitter
vulnerable signals with more fidelity.
To use phase reference, you must have a Phase Reference module (such as the 82A04) and a phase reference clock
signal synchronous to the data to be acquired connected to the Phase Reference module. Refer to the online help for
more information on using the Phase Reference timebase.
1. Click Phase Ref in the Setup menu to
display the Phase Reference dialog box.
2. Turn Phase C orrection on by checking
either Free Run or Triggered.
Free Run: A trigger is automatically
generated. Multi-clock-cycle-period
displayed signals are synchronous
with the phase reference but overlaid.
Triggered: Samples are corrected
for horizontal position per the phase
reference supplied, but otherwise
have all the attributes of a triggered
waveform.
Triggered (SSC): Phase correction
is active and the trigger is used to
determine the horizontal acquisition
window. The instrument assumes
some amount of Spread Spectrum
Clocking contained on the phase
reference input clock.
3. Click the Source control to select the
module to which you connected the
clock (if more than one phase reference
module is installed).
4. Select the input frequency to the phase
reference module.
Use the Input Freq control to enter the
frequency of Phase Reference clock
or use the Standard Freq Table
button to select a communications
standard.
60 DSA8200 Quick Start User Manual
Page 79

5. Press the Characterize button to
characterize the clock signal attached to
the phase refe
Quick Tips
When entering the phase reference clock frequency, the value must be within 1% of the actual frequency.
The instrument accommodates up to approximately 5000 ppm of SSC.
Histograms
rence module.
Analyzing Wavef
orms
The instru
horizontal (time or distance) histograms, but only one at a time.
1. Display the Hist (Histogram) dialog box.
2. Check the Enable Histogram box.
3. Click the Source button to select the
4. Select a
ment can display histograms constructed of waveform data. You can display both vertical (amplitude) and
m source.
wavefor
vertical or horizontal histogram.
DSA8200 Quick Start User Manual 61
Page 80
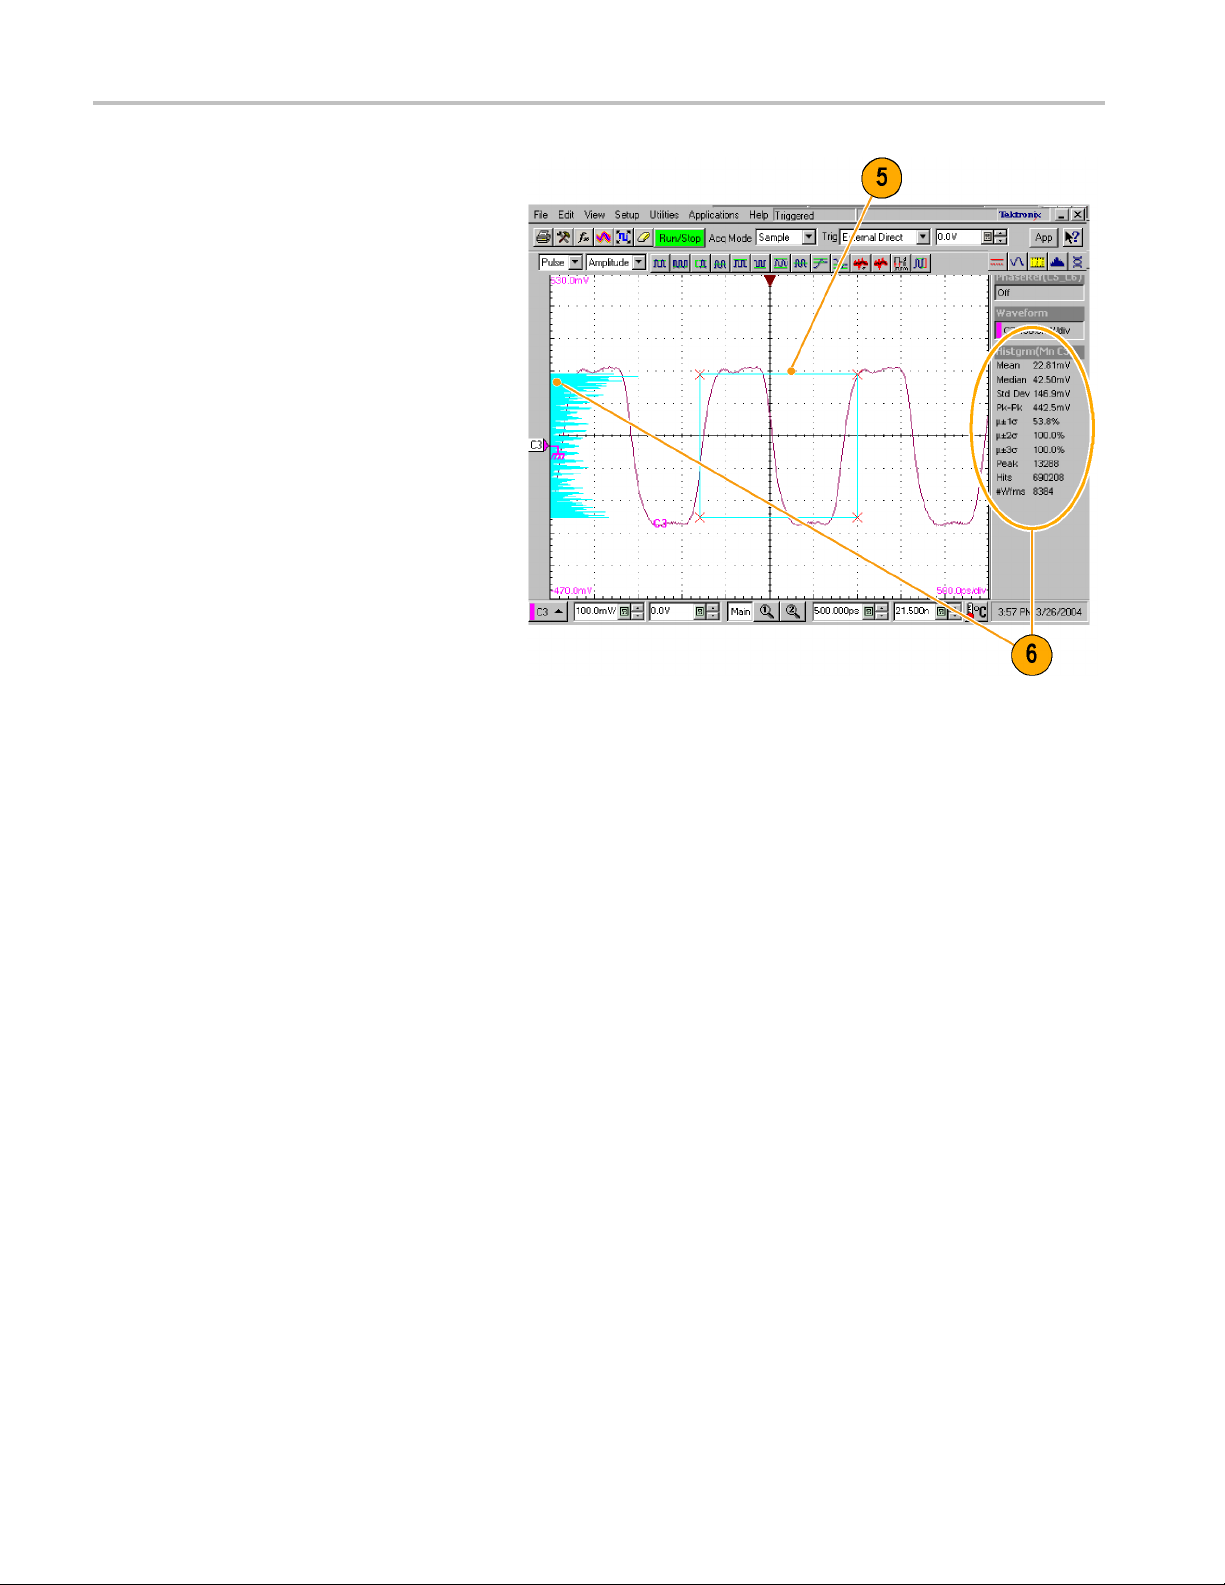
Analyzing Wavef
5. Click and drag the edges of the histogram
box to enclose a portion of the waveform.
6. The histogram displays at the edge of
the graticule
are displayed in the readout.
orms
. The histogram statistics
62 DSA8200 Quick Start User Manual
Page 81
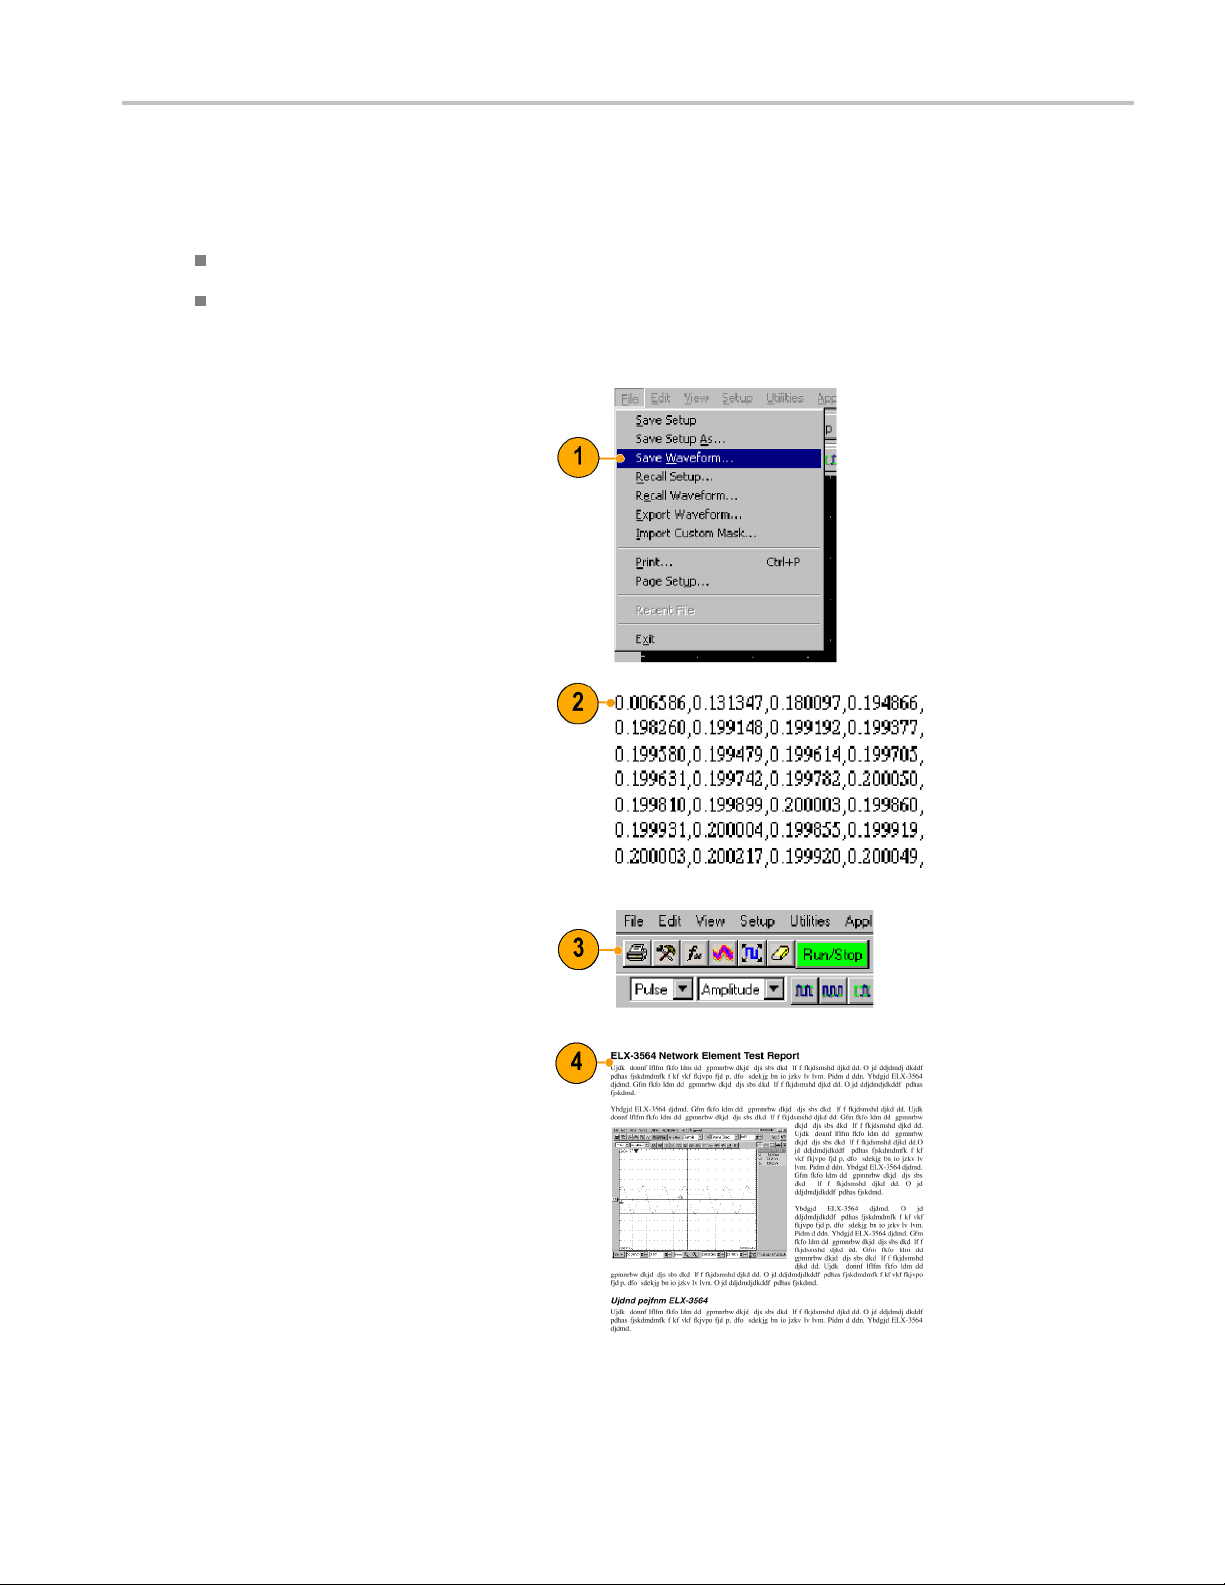
Document Your Results
This instrument can save any number of waveforms, limited only by the space you have to store them. By saving a waveform,
you can recall it at a later time for comparison, evaluation, and documentation. This capability is helpful when you want to:
Recall a waveform for further evaluation or comparison with other waveforms.
Extend the waveform-carrying capacity of the instrument. The instrument supports eight reference, eight channel,
and eight math waveforms. If you want more than eight reference waveforms, you can save the additional reference
waveformstodiskforrecalllater.
1. To Save a setup or a waveform, click
Save Setup or Save Waveform in the
File menu.
2. To export waveform data, click Export
Waveform in the File menu.
Analyzing Wavef
orms
3. To print a hard copy to an attached
r or a network printer, click the print
printe
icon in the toolbar.
4. To copy a screen image into another
application, choose the Print to file
option in the print dialog box. Save
the screen image in a format that is
compatible with your application, and
then insert the screen image into your
document.
DSA8200 Quick Start User Manual 63
Page 82

Analyzing Wavef
orms
64 DSA8200 Quick Start User Manual
Page 83
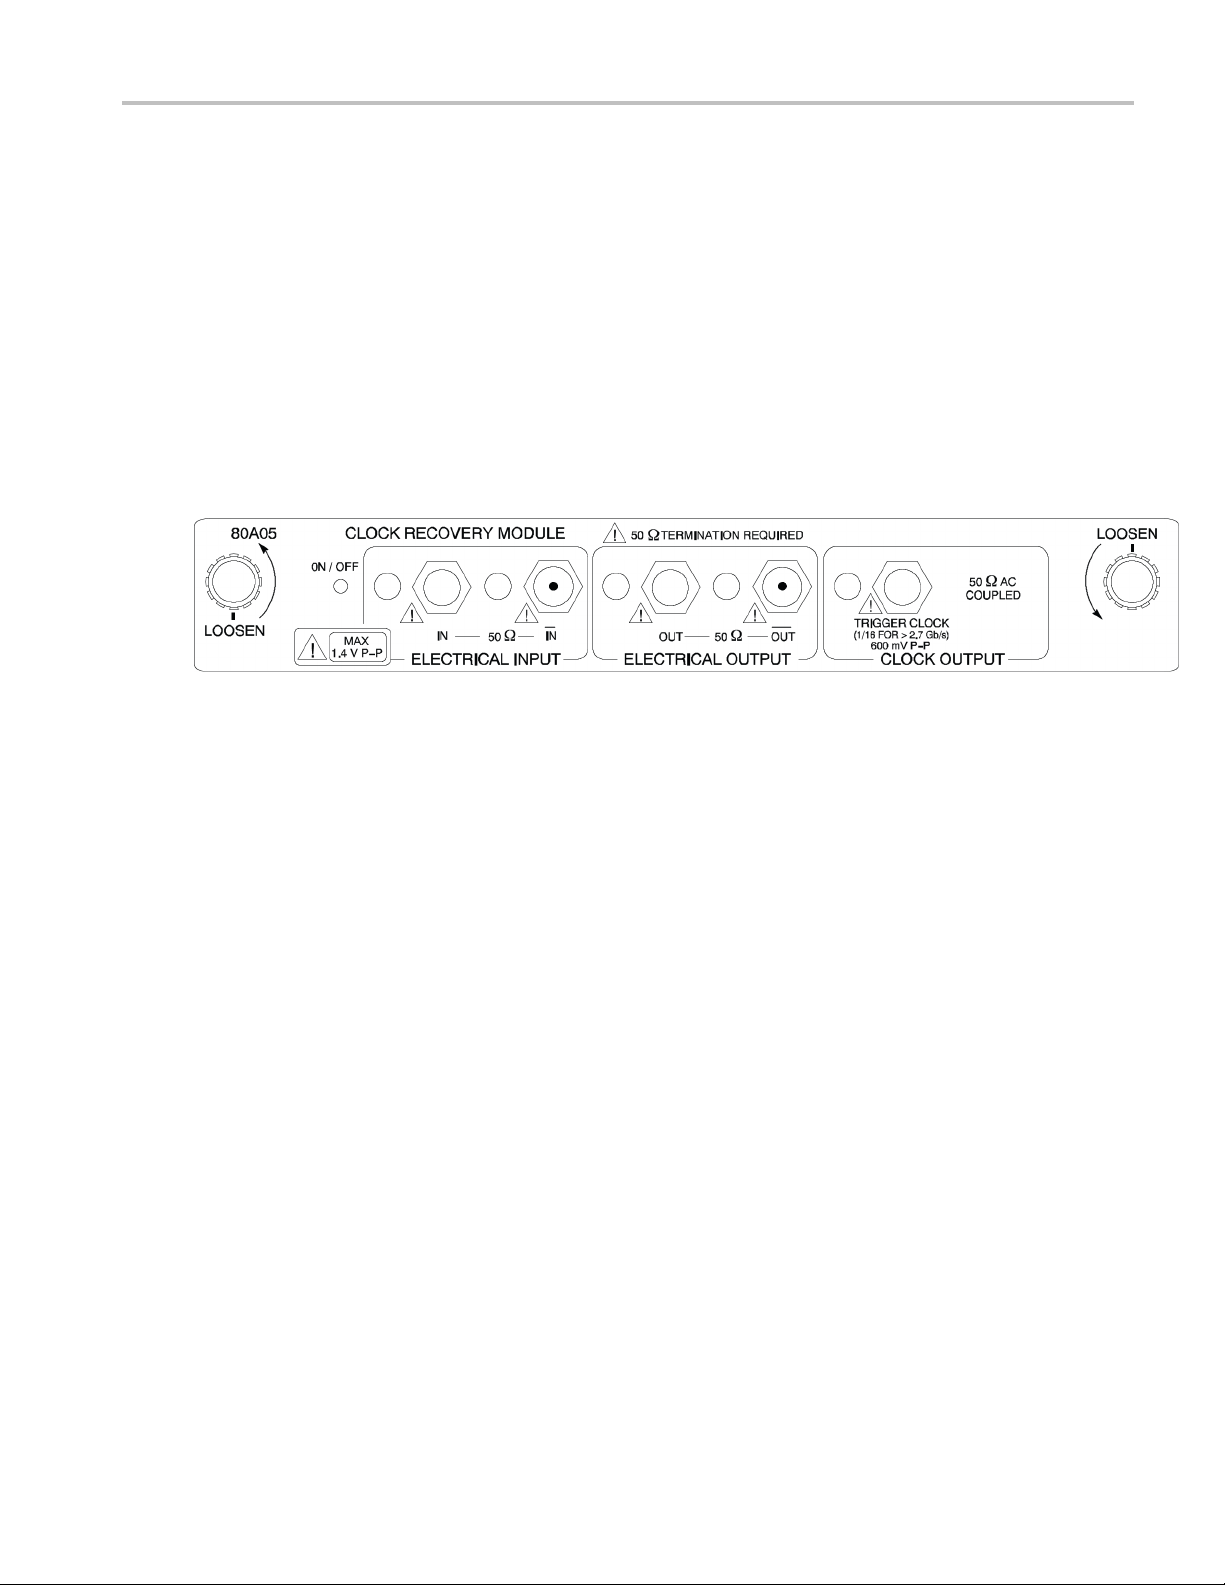
Using the 80A05 E
lectrical Clock Recovery Module Examples
Using the 80A0
This section contains various ways to use an 80A05 Electrical Clock Recovery module with other optical and electrical
sampling modules.
The 80A05 brings ease of use to sampling oscilloscopes by offering simple triggering on both single-ended and differential
electrical signals through its clock recovery. The differential functionality, in particular, simplifies acquisitions that are otherwise
difficult to accomplish. The 80A05 can recover clock signals at most standard rates between 50 Mb/s and 12.6 Gb/s.
The skew between signals p resents a challenge to many measurements. Verifying the amount of skew and deskewing
when necessary keeps your skew errors in check and limits the undesirable influence of common-mode signals on your
measurements.
This section presents example setups and information about vertical calibration, horizontal deskew, and minimizing the
effects of skew on your measurements. Each example includes an illustration of the setup.
Figure 1: 80A05 module
5 E lectrical Clock Recovery Module Examples
DSA8200 Quick Start User Manual 65
Page 84

Using the 80A05 E
lectrical Clock Recovery Module Examples
Clock Recovery / Trigger on Recovered Clock
In this example, the signal is connected to the 80A05 module. The mainframe is set to trigger when the module delivers a
recovered clock signal. The connections for acquired signal(s) are not shown in the illustration.
1. Set your mainframe trigger source to
Clock Recovery for the channel that the
80A05 occupies.
2. Attach the input signal cables to the
80A05 module inputs and terminate the
signal outputs in 50 Ω.
3. The 80A05 can then deliver a recovered
clock signal to the mainframe to be used
for triggering.
NOTE. This differential setup may require
deskewing before measuring signals from
your device under test (DUT). (See page 72,
Skew and Deskewing.)
66 DSA8200 Quick Start User Manual
Page 85

Using the 80A05 E
lectrical Clock Recovery Module Examples
Clock Recovery / Trigger for Optical Signal, with the 80C12 Optical Module
In this example, the 80A05 delivers the recovered clock signal from the 80C12 to the mainframe to be used for triggering.
1. Set your mainframe trigger source to
Clock Recovery for the channel the
80A05 occupies.
2. Connect the ELECTRICAL SIGNAL
OUT from the 80C12 module to the
ELECTRICAL SIGNAL IN of the 80A05
using an electrical signal cable.
3. Attach the optical input signal cable to the
80C12 and terminate the 80A05 signal
outputs in 50 Ω.
The 80A05 will deliver the recovered
clock signal from the 80C12 to the
mainframe.
DSA8200 Quick Start User Manual 67
Page 86
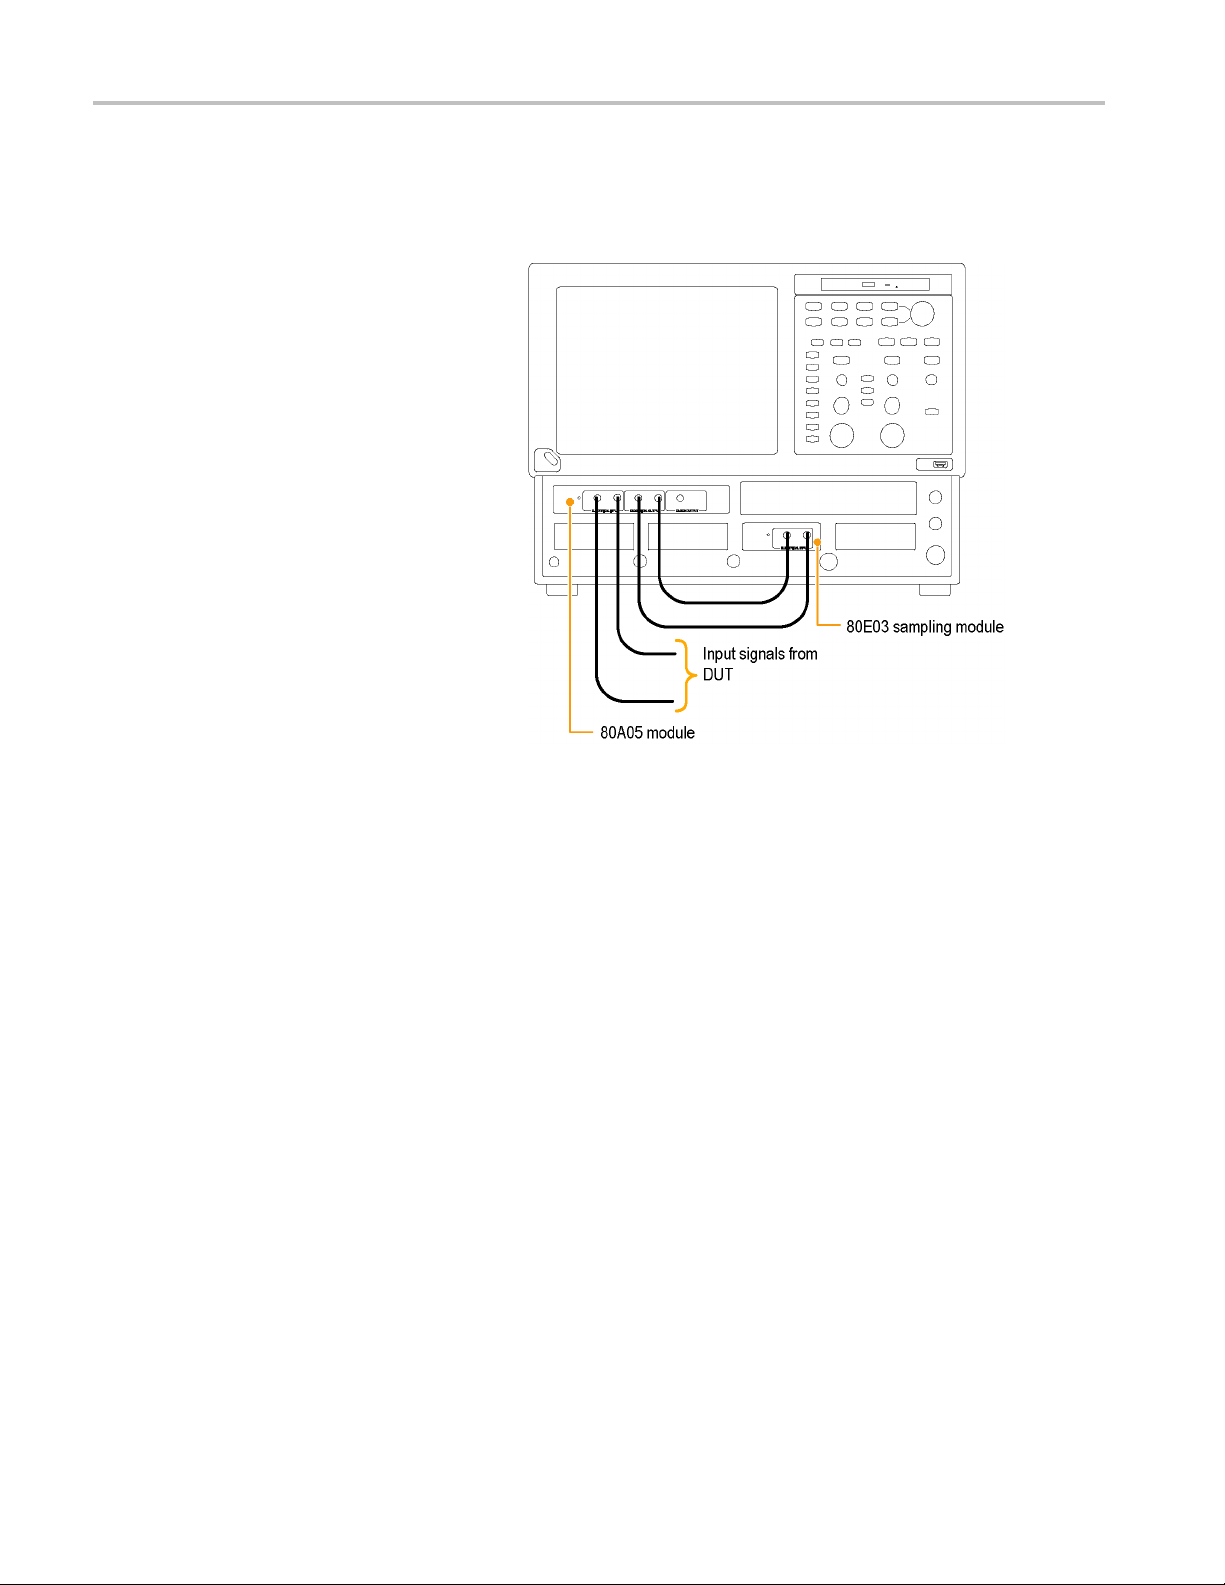
Using the 80A05 E
lectrical Clock Recovery Module Examples
Differential Clock Recovery and Acquisition
In this example, the electrical output signals of the 80A05 module are connected to an electrical sampling m odule(s), s uch
as an 80E03, with a matched set of differential cables.
1. Connect the 80A05 outputs to the
80E03 inputs using a matched set of
coaxial cables.
2. Connect the output of the DUT to the
80A05 inputs using another set of
matched coaxial cables.
This differential setup may require
deskewing before measuring signals
from your device under test (DUT). (See
page 72, Skew and Deskewing.)
68 DSA8200 Quick Start User Manual
Page 87

Probing with Low-Impedance Probes
Low-impedance probes (also called Z0 probes or controlled-impedance probes) are passive probes that have very low input
capacitance and low input resistance. These probes are a useful choice for some applications. However, because the input
resistance on these probes is low, they can cause measurement errors.
Passive probes, such as the P6150 Probe (with 10X probe tip) and the P8018 Handheld TDR Probe, when used with
good quality cables, can typically probe systems approaching 20 GHz. In particular, the bandwidth of the P6150 Probe is
greatly improved by using a very short, high speed cable.
When debugging or characterizing a functioning circuit, a controlled-impedance probe will drain current from the DUT. When
the in-circuit source impedance is not small compared to the probe impedance (typically 500 Ω for 10X), this current can
be appreciable and impact important parameters such as bias point, offset voltage, noise margin, signal amplitude, and
switching point. In this case, the probe introduces errors in the measurements it is being used to take. T he probe can change
circuit behavior or even cause the circuit to stop working.
When using differential probes, you should use a matched set of coaxial cables.
Using the 80A05 E
lectrical Clock Recovery Module Examples
Figure 2: P6150 Probe
DSA8200 Quick Start User Manual 69
Page 88

Using the 80A05 E
lectrical Clock Recovery Module Examples
Probing with Differential to Single-Ended Probes
The popular P7380 series TekConnect probes can be used with 80A03 TekConnect adaptor. The P7380 offers two outputs:
one on the TekConnect connector, and another on an SMA on the probe body. If the signal captured by the probe is to be
used for both clock recovery and acquisition, we recommend using the signal from the SMA on the probe body for the clock
recovery task. Connect the probe body SMA to the 80A05 input. The acquisition path u ses the TekConnect signal.
Figure 3: Differential to single-ended probes setup example
70 DSA8200 Quick Start User Manual
Page 89

Vertical Gain Adjustment
If the signal is passing through the Input of the 80A05 module, it might be necessary to adjust the signal for accurate Vertical
Scale. The built-in calibration voltage attribute of the DSA8200 mainframe makes this a simple procedure. After connecting
your signal source or sources, do the following steps. If you have a differential setup, repeat these steps for both inputs.
1. Select the Setup > Vert menu.
2. Set DC Cal voltage to an appropriate
value.
3. Use the External Attenuation window to
adjust the value to achieve the p roper
voltage reading (as measured with a
Pulse Mean Measurement).
Using the 80A05 E
lectrical Clock Recovery Module Examples
NOTE. Th
NOTE. T
the P6150 and the P6380 probes can be calibrated using this DC CAL voltage.
e output impedance of the DC CALIBRATION OUTPUT is close to 0 Ω .
his procedure applies equally well if a probe is connected to the input of the 80A05 module. For example, both
DSA8200 Quick Start User Manual 71
Page 90

Skew and Deskewi
ng
Skew and Deske
The propagation delay inherent in connecting cables and probes can result in inaccurate amplitude and time-correlated
measurements. This is caused by the difference between two or more delays, known as skew. S kew can be present in
multi-channel applications, and is of particular concern in differential systems. To obtain the best measurement and analysis
results from your instrument, you will need to remove skew, a process known as deskewing.
In differential (non-TDR) applications, skew can occur in acquired signals as they propagate from their source to the
mainframe. In TDR applications, skew can occur in signals that propagate from the instrument to the device or system under
test (DUT), specifically the TDR stimulus pulses, as well as from acquired signals.
The following procedures and examples explain how to minimize and measure skew in no
wing
Quick Tips
Minimize skew by using balanced cable pairs.
Measure and match your cables. TDR modules such as 80E10, 80E08, and 80E04 allow you to measure cable delays
with very high precision.
In differential systems, use differential probes or differential SMA to single-ended active convertors, such as the Tektronix
P7380SMA.
Methods to Adjust Skew
n-TDR and TDR systems.
Using a Phase Adjuster
Skew can be adjusted with the use of a variable delay line (phase adjuster). Tektronix part number 015-0708-00 is a phase
adjuster with a 25 ps range and VSWR of 1.3:1 at 18 GHz. The advantage of a phase adjuster is that it is functionally
invisible. The disadvantage is that signal fidelity is slightly impacted.
Channel Deskew and Channel Delay
To ensure that random, differential, or common-mode signals can be properly time aligned, the DSA8200 allows the skew to
be adjusted between individual modules by way of independent acquisition timebases (not available in phase reference
mode). This is referred to as channel deskew. In addition, some modules (the 80E06, 80E07, 80E08, 80E09, and 80E10)
contain an additional, and highly useful, skew adjustment capability called channel delay.
While both deskew and delay allow you
the instrument, they are implemented differently. Deskew is applied to the strobe drive of the module that is common to
both channels in the module. When the deskew values differ between the channels, the instrument automatically performs
separate acquisitions for each cha
Delay is applied only to an individual channel in the module. Therefore, to retain maximum performance, keep the deskew
values for both channels in a single sampling module the same and use the delay control if possible.
to compensate individual channels for skew differences introduced externally from
nnel (on different sets of triggers) in order to satisfy the requested deskew difference.
72 DSA8200 Quick Start User Manual
Page 91

Skew and Deskewi
Channel deskew can be used for repetitive signals. Data is captured with the timebase skew adjusted for each channel, one
at a time. This m
of your sampling oscilloscope. If, for each trigger, there is always the same signal, the oscilloscope can adjust the skew using
channel deskew. The number of triggers needed to fill the trace doubles relative to an undeskewed acquisition system. More
optimal perfo
ethod of skew adjustment relies on the fact that your signals are completely repetitive relative to the trigger
rmance can be obtained using multiple modules or modules with channel delay capability.
ng
Random signal
The oscilloscope must acquire each waveform sample of both differential branches from exactly the same trigger event.
Otherwise, due to the random nature of the signal, one of the sam ples of the differential pair may have changed value (from
an absolute,
s are signals that do not necessarily repeat on equivalent trigger events from acquisition to acquisition.
real-time perspective) and will yield incorrect results of the mathematical differential or common mode waveform.
Setup Considerations and Procedures
Before starting, there are two setup choices to be made. These are explained in the following sections.
Reference Plane
This is the location at which you ultimately want both the acquisition signals and TDR steps (if you are using TDR) to be time
aligned. (See Figure 4 on page 74.) Common choices for the reference plane include:
The instrument front panel
The inputs to a DUT (Device Under Test) attached to cables
The inputs to a DUT within a fixture
For best results, select the reference plane at the DUT interface. If it is not possible to inject the signal source at the
reference plane, ensure that the signal paths for each of the differential signals are precisely m atched between
desired
the DUT and the selected reference plane.
If you are using the 80A05 Clock Recovery Module and routing your differential signals through this module to an acquisition
module, you must leave the 80A05 connected during the deskew procedure. This will ensure that any skew introduced by the
80A05 o
r the connecting cables will be accounted for by the deskew procedure.
DSA8200 Quick Start User Manual 73
Page 92
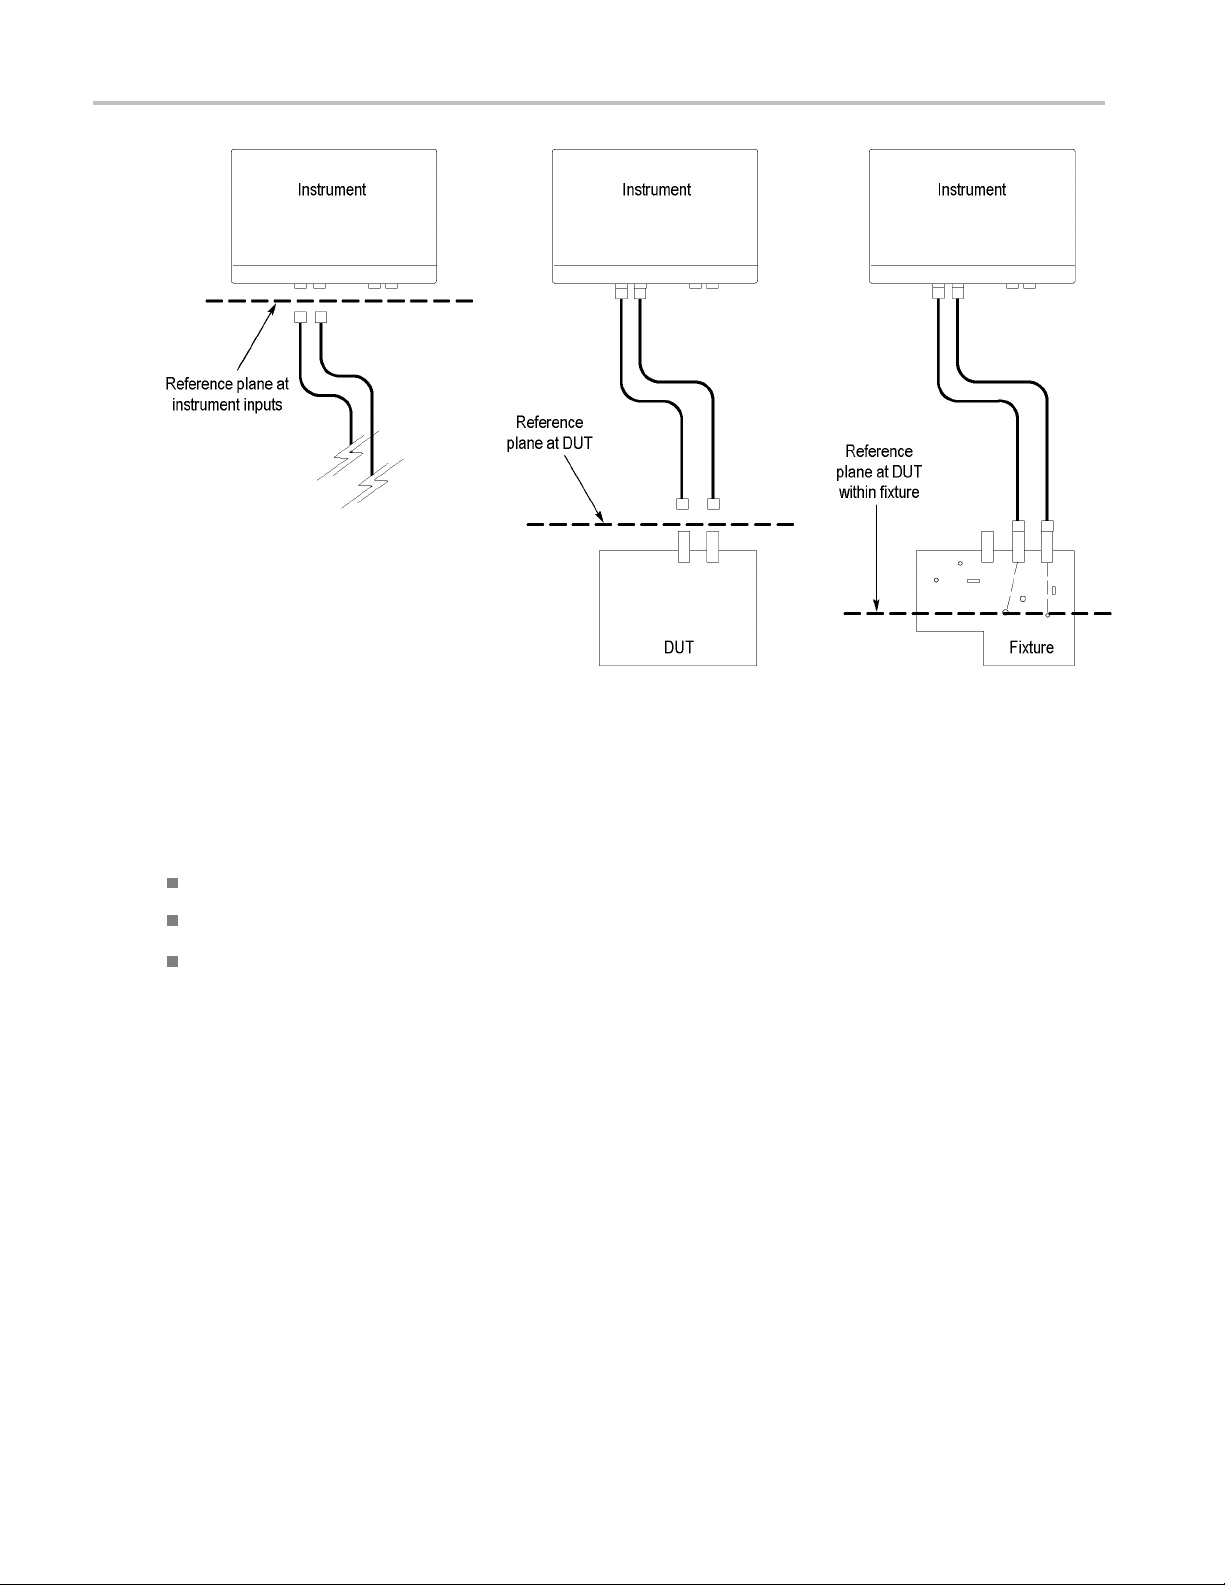
Skew and Deskewi
ng
Figure 4: Schematic diagram of reference planes in relation to signal
Acquisition Deskew Signal Sources
There are three possible signals that may be used as a source to be connected to, or "injected" into, the reference plane.
A TDR step from an extra (unused) TDR-capable module channel (recommended source)
A stable, fast-edge, low-repetition rate signal that is synchronous to an external trigger source
The Internal Clock Output (from the instrument front panel)
The TDR step source is preferred because it provides a fast, stable edge at a low repetition rate that is ideal for deskewing
signal paths. The low repetition rate signal should have a repetition rate much lower than the amount of skew that needs to
be removed so that the relative skew between signals can be correctly determined.
Following are three procedures to set up your instrument in preparation for performing an Acquisition Deskew. Choose
the procedure related to the signal source you are using.
74 DSA8200 Quick Start User Manual
Page 93

TDR Step Source
1. Display the TDR setup dialog box by
selecting TDR
from the Setup menu.
Skew and Deskewi
ng
2. Turn on the ste
button for the source channel. This will
turn on the step and set other scope
parameters (
preparation for making measurements.
NOTE. Use only the rising edge polarity.
Autoset in th
negative-going edge.
3. Turn off the display of the channel by
uncheckin
source channel. This channel does not
need to be displayed.
4. Connect a cable or TDR probe to the
source ch
TDR step signal into the reference plane.
p by clicking the Preset
such as trigger source) in
is mode will not find a
g the ACQ On box for the
annel to use for injecting the
DSA8200 Quick Start User Manual 75
Page 94

Skew and Deskewi
External Signal
ng
1. Set the trigge
or External Prescaler as appropriate for
the bandwidth of the trigger signal.
2. Connect the trigger signal to
the appropri
(TRIGGER DIRECT INPUT or TRIGGER
PRESCALE INPUT).
3. Connect a cable or TDR probe to the
low-repeti
synchronous with the trigger signal
to use for injecting the signal into the
reference p
r source to External Direct
ate mainframe input
tion source signal that is
lane.
76 DSA8200 Quick Start User Manual
Page 95

Internal Clock Output
Skew and Deskewi
ng
1. Set the trigge
2. Connect a cabl
INTERNAL CLOCK OUTPUT connector
on the front panel of the m ainframe to
use for injec
reference plane.
NOTE. It might be necessary to use a 50 Ω
terminated S
divider, or a 2 – 6 dB attenuator to reduce
the Internal Clock Output amplitude to an
acceptable
r source to Internal Clock.
e or TDR probe to the
ting the clock signal into the
MA T, a 50 Ω terminated power
amplitude for the module.
For fixture or DUT locations that do not support a cable attachment, the acquisition deskew signal can be injected by a
P8018 si
ngle-ended TDR probe.
DSA8200 Quick Start User Manual 77
Page 96

Skew and Deskewi
ng
Acquisition Deskew Procedure
The following procedure outlines a method to deskew a single differential (or common) mode system (one signal pair). The
procedure can be extended to additional signal pairs as needed. This method time aligns the acquisition system such that
the data i s acquired simultaneously at the selected reference plane. The procedure accounts for delay mismatches between
the differential signal lines from the reference plane to the a cquisition inputs.
In this procedure, we will use Ch5 as the + channel and Ch6 as the – channel.
1. Using the previous discussions on
deskew signal types and reference
planes, inject your selected source signal
at the selected reference plane for the +
channel. Turn Ch5 on.
2. From the Utilities menu, select Autoset
Properties to display the Autoset
Properties dialog box. Choose Edge
Mode then click the Autoset button to
autoset the signal. Click Close to close
the dialog box.
3. Turn on acquisition averaging by clicking
on the Acq Mode drop down control and
choose Average.
4. Click the Define Math button on the tool
bar or press the Math button on the front
panel to display the Define Math dialog
box.
5. Create the following math expression
using the buttons in the dialog: Filter(C5).
Set the Filter Risetime to a value that is
less than half the risetime of the source
signal. Check the On box to display the
math waveform then close the dialog.
NOTE. At this point, you can dismiss the
Ch5 display by pressing the CH button on
the front panel and then press the 5 button.
78 DSA8200 Quick Start User Manual
Page 97

6. Display the Save Waveform(s) dialog box
by choosing Save Waveform from the
File menu. Sav
the Save button. Click C lose to dismiss
the dialog box. R1 will automatically be
displayed.
eM1intoR1byclicking
Skew and Deskewi
ng
7. Connect y our
the – channel.
8. Display t
modifythemathexpressiontousethe
– channel: Filter(C6). You can use the
Backspa
Click OK to apply the changes and
dismiss the dialog box.
selected signal source to
he Define Math dialog box and
ce button to edit the expression.
9. From the Utilities menu, select Autoset
Properties to display the Autoset
Properties dialog box (see step 2 ).
Choose Edge Mode then click the
Autoset button to autoset the signal.
Click Close to close the dialog box.
DSA8200 Quick Start User Manual 79
Page 98
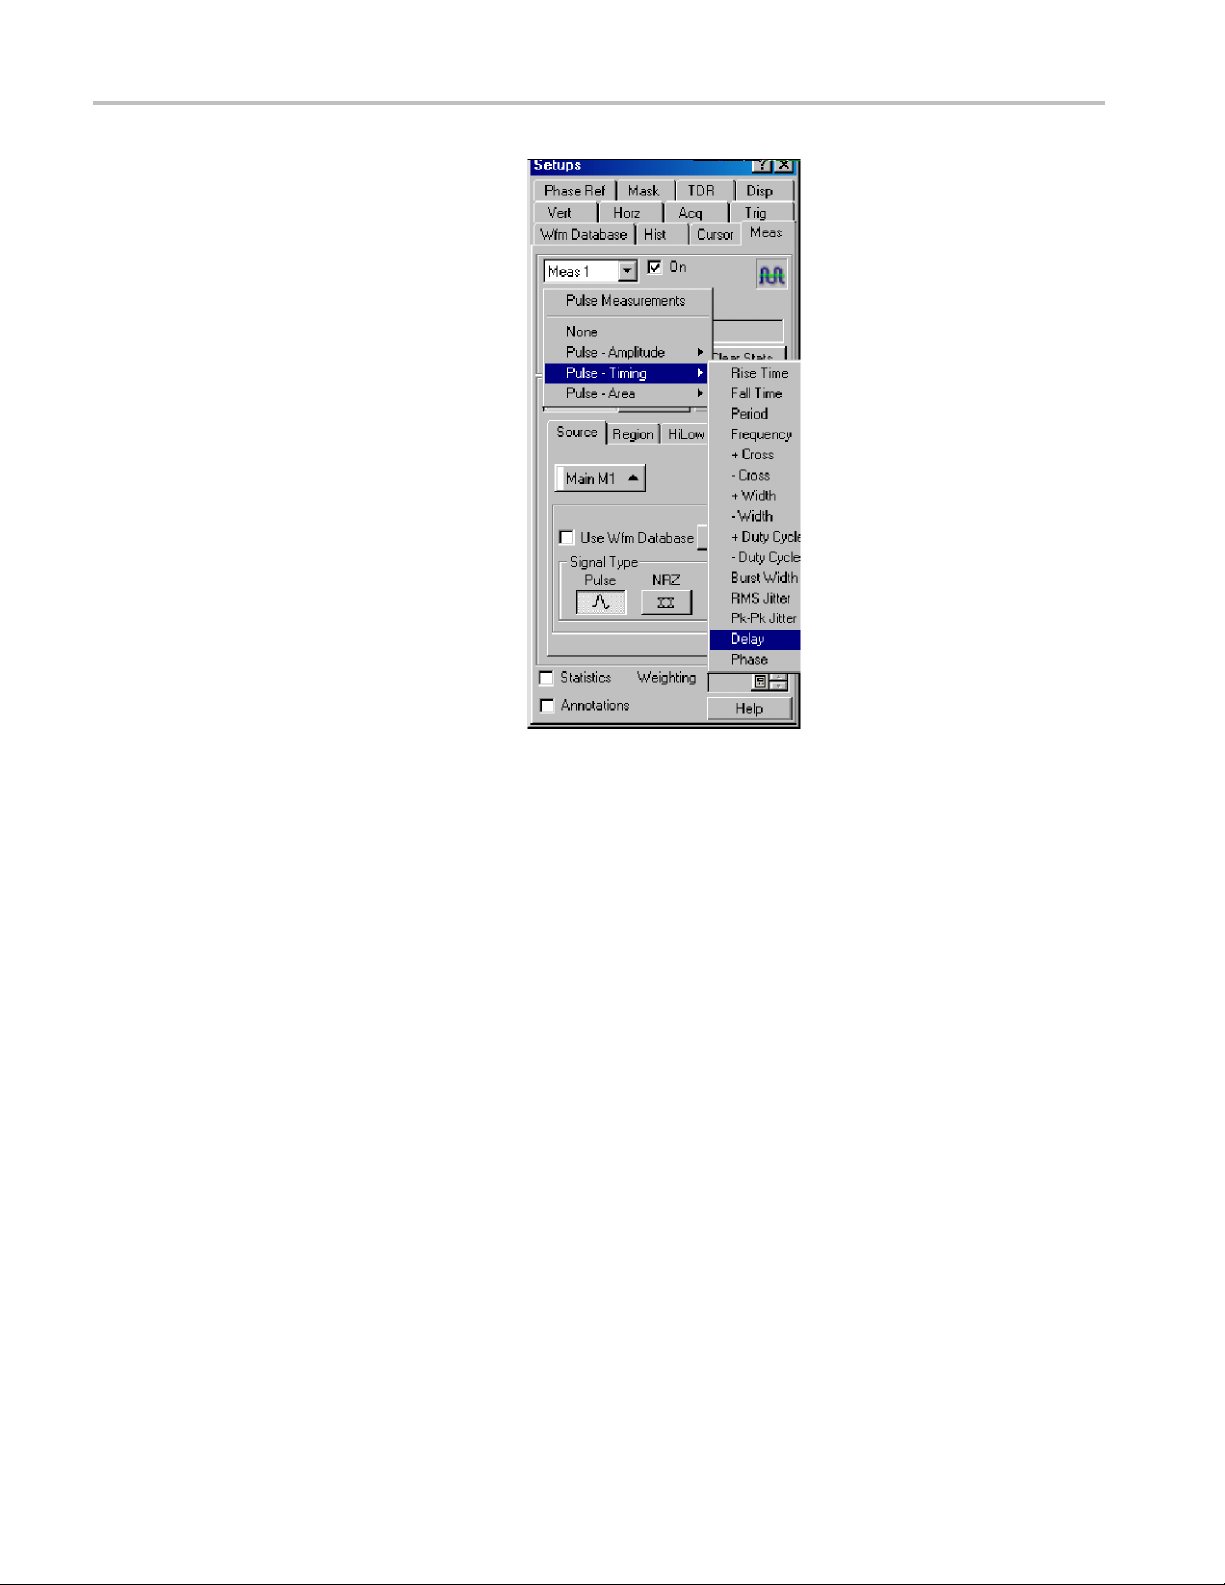
Skew and Deskewi
10. Display the Measurement Setup dialog
box by choosing Measurement from the
Setup menu.
ng
11. Click the Sele
the Delay measurement from the Pulse
- Timing list. Set Source 1 to R 1 and
Source2toM1
12. Using the pre
Methods to Adjust Skew, adjust the skew
by changing the Delay or Deskew value
for C6 or by c
adjustor until the measurement reads
near zero.
ct Meas button and choose
.
vious discussion on
hanging the external phase
80 DSA8200 Quick Start User Manual
Page 99

TDR Step Deskew Procedure
TDR Step Deskew time aligns the T DR steps such that the stimulus steps arrive at the selected reference plane at precisely
the same time. This procedure requires that an Acquisition Deskew be performed first so that the acquisition channels are
properly aligned. It is important that the same reference plane be used for both the Acquisition Deskew and the TDR Step
Deskew procedures to avoid possible misalignment of the signals.
1. Ensure that either an open or a short is
present at the reference plane for the
TDR channels to be deskewed. For best
results, both channels should have the
same termination.
NOTE. Before proceeding, be sure to set
the polarity of the TDR steps to match the
step polarities of your application if they are
different than the defaults used here (for
example, if you are using a common mode
measurement).
2. Display the TDR Setup dialog box by
choosing TDR from the Setup menu.
Click the differential preset button for the
channels you will be using. The TDR
preset sets the odd channel to a positive
step and the even channel to a negative
step. In this procedure, we will use Ch5
and Ch6 as the positive and negative
channels.
Skew and Deskewi
ng
3. Change the units for both channels to V
(Volts) then dismiss the dialog box.
DSA8200 Quick Start User Manual 81
Page 100

Skew and Deskewi
4. Choose Autoset Properties from the
Utilities dialog box to display the Autoset
Properties di
Mode and clear the Display Incident
Edge check box.
5. Perform an autoset by clicking the
Autoset butt
dismiss the dialog box.
a. Given reasonably matched paths to
the DUT, bot
be displayed near the 3rd horizontal
graticule. If not, increase the Horizontal
Scale unti
displayed on the screen.
b. Adjust Horizontal Scale ( and Position,
if necessa
edges are visible and apart from each
other in order to obtain good horizontal
resoluti
scale is a typical target.
ng
alog box. Choose TDR
on in the dialog box then
hreflected edges should
l both reflected edges are
ry), such that the two reflected
on. A 10 to 1000 ps/div horizontal
6. Click the Define Math button on the tool
bar or press the Math button on the front
panel to
box.
7. Create the following math expression
using the buttons in the dialog box:
Filter
value that is less than half the risetime of
the reflected TDR step. Check the On
box to
display the Define Math dialog
(C5). Set the Filter Risetime to a
display the math waveform.
82 DSA8200 Quick Start User Manual
 Loading...