

Page 1

Advanced Power Analysis
Printed Application Help
*P077001810*
077-0018-10
Page 2

Page 3

Advanced Power Analysis
Printed Application Help
www.tek.com
077-0018-10
Page 4

Copyright © Tektronix. All rights reserved. Licensed software products are owned by Tektronix or its subsidiaries
or suppliers, and are protected by national copyright laws and international treaty provisions. Tektronix products
are covered by U.S. and foreign patents, issued and pending. Information in this publication supersedes that in all
previously published material. Specifications and price change privileges reserved.
TEKTRONIX and TEK are registered trademarks of Tektronix, Inc.
Contacting Tektronix
Tektronix, Inc.
14150 SW Karl Braun Drive
P.O. Box 500
Beaverton, OR 97077
USA
For product information, sales, service, and technical support:
■
In North America, call 1-800-833-9200.
■
Worldwide, visit www.tek.com to find contacts in your area.
Page 5

Table of Contents
Welcome ............................................................................................................................................. ix
General safety summary
General safety summary ................................................................................................................. 1
Introduction
Online help and related documentation .......................................................................................... 3
Printing from online help ................................................................................................................ 3
Related documentation ................................................................................................................... 4
Conventions .................................................................................................................................... 4
Feedback ......................................................................................................................................... 4
Getting started
Introduction and product description .............................................................................................. 7
Compatibility .................................................................................................................................. 8
Requirements and restrictions ........................................................................................................ 9
Current probes ................................................................................................................................ 9
Voltage probes .............................................................................................................................. 10
Updates through the web site ........................................................................................................ 12
Installing the application .............................................................................................................. 12
Operating basics
About basic operations ................................................................................................................. 13
About basic operations ............................................................................................................ 13
Application interface ............................................................................................................... 13
Application interface menu controls ....................................................................................... 13
Basic application functions ........................................................................................................... 14
Application directories and file names .................................................................................... 14
File name extensions ............................................................................................................... 14
Returning to the application .................................................................................................... 15
Saving and recalling setups .......................................................................................................... 15
Saving a setup .......................................................................................................................... 15
Recalling a saved setup ........................................................................................................... 16
Recalling the default setup ...................................................................................................... 16
Advanced Power Analysis i
Page 6

Table of Contents
Utilities ......................................................................................................................................... 17
DeGauss ................................................................................................................................... 17
Auto Zero ................................................................................................................................ 17
Preferences setup ..................................................................................................................... 18
Deskew .................................................................................................................................... 19
Deskewing probes and channels .............................................................................................. 22
Advanced power measurement and analysis
Setting up DPOPWR to take measurements ................................................................................. 29
Setting up the software ............................................................................................................ 29
Table of options-Source configuration .................................................................................... 30
Table of measurements and configurations-Timing analysis .................................................. 33
Table of measurements and configurations-Magnetics ........................................................... 35
Table of measurements and configurations-Input analysis ..................................................... 37
Table of measurements and configurations-Output analysis .................................................. 40
Table of measurements and configurations-Amplitude .......................................................... 42
Taking a new measurement .......................................................................................................... 43
About taking measurements .................................................................................................... 43
Viewing results ........................................................................................................................ 43
Plot components and features .................................................................................................. 45
Viewing plots .......................................................................................................................... 51
Reports ..................................................................................................................................... 54
Selecting a measurement ......................................................................................................... 57
Source configuration ............................................................................................................... 58
Selecting and configuring measurements ................................................................................ 61
Configuring global settings ..................................................................................................... 64
Configuring options ................................................................................................................. 65
Configuring edges ................................................................................................................... 65
Control panel ........................................................................................................................... 66
Switching measurement and analysis ........................................................................................... 67
Switching loss .......................................................................................................................... 67
Hi-Power finder ....................................................................................................................... 85
RDS(on) ................................................................................................................................... 90
di-dt ......................................................................................................................................... 94
dv-dt ......................................................................................................................................... 97
Safe operating area ................................................................................................................ 100
Safe operating area X-Y ........................................................................................................ 107
Timing measurement and analysis ............................................................................................. 109
Pulse width ............................................................................................................................ 109
ii Advanced Power Analysis
Page 7

Duty cycle .............................................................................................................................. 112
Period ..................................................................................................................................... 114
Frequency .............................................................................................................................. 116
Skew ...................................................................................................................................... 118
Magnetics measurement and analysis ......................................................................................... 121
Inductance ............................................................................................................................. 121
Magnetic property ................................................................................................................. 124
Magnetic loss ......................................................................................................................... 131
I vs (integral-of)V .................................................................................................................. 132
Input measurement and analysis ................................................................................................. 135
Power quality ......................................................................................................................... 135
Current harmonics ................................................................................................................. 138
Voltage harmonics ................................................................................................................. 151
Total power quality ............................................................................................................... 154
Inrush current ........................................................................................................................ 163
Input capacitance ................................................................................................................... 165
Output measurement and analysis .............................................................................................. 167
Line ripple ............................................................................................................................. 167
Spectral analysis .................................................................................................................... 169
Switching ripple .................................................................................................................... 175
Turn-On time ......................................................................................................................... 177
Amplitude ................................................................................................................................... 179
Cycle min .............................................................................................................................. 179
Cycle max .............................................................................................................................. 182
Cycle peak-to-peak (Pk-Pk) .................................................................................................. 185
High ....................................................................................................................................... 188
Low ........................................................................................................................................ 190
High-low ................................................................................................................................ 193
Table of Contents
Tutorial
Introduction to the tutorial .......................................................................................................... 195
Reference waveform and mask files ........................................................................................... 195
Starting the application ............................................................................................................... 196
Setting up the oscilloscope ......................................................................................................... 196
Measuring Switching Loss ......................................................................................................... 197
Measuring Magnetics ................................................................................................................. 199
Advanced Power Analysis iii
Page 8

Table of Contents
Application examples
About application examples ....................................................................................................... 203
To increase efficiency in a switching power supply ................................................................... 203
Measure Switching Loss ....................................................................................................... 203
Measure Hi-Power finder ...................................................................................................... 205
Measure magnetic loss .......................................................................................................... 207
GPIB commands
DPOPWR LAUnch ..................................................................................................................... 211
DPOPWR:ADDMeas ................................................................................................................ 211
DPOPWR:CLEARALLMeas ..................................................................................................... 214
DPOPWR:CLEARALLPlots ...................................................................................................... 214
DPOPWR:FREerun .................................................................................................................... 214
DPOPWR:GENREPAS .............................................................................................................. 215
DPOPWR:GENREPort .............................................................................................................. 215
DPOPWR:LASTError? .............................................................................................................. 216
DPOPWR:MEAS(x):ACCMAx? ............................................................................................... 216
DPOPWR:MEAS(x):ACCMEAn? ............................................................................................. 217
DPOPWR:MEAS(x):ACCMIn? ................................................................................................. 217
DPOPWR:MEAS(x):ACCPKTopk? .......................................................................................... 218
DPOPWR:MEAS(x):ACCPOPulation? ..................................................................................... 218
DPOPWR:MEAS(x):ACCResult? ............................................................................................. 219
DPOPWR:MEAS(x):ACCSTDdev? .......................................................................................... 219
DPOPWR:MEAS(x):ACQmode ................................................................................................ 220
DPOPWR:MEAS(x):ADDPLOT ............................................................................................... 220
DPOPWR:MEAS(x):AUTOZero ............................................................................................... 222
DPOPWR:MEAS(x):BWLimit .................................................................................................. 222
DPOPWR:MEAS(x):COUPling ................................................................................................. 223
DPOPWR:MEAS(x):CURGATing ............................................................................................ 223
DPOPWR:MEAS(x):CURRENTMAx? ..................................................................................... 224
DPOPWR:MEAS(x):CURRENTMEAn? .................................................................................. 224
DPOPWR:MEAS(x):CURRENTMIn? ...................................................................................... 225
DPOPWR:MEAS(x):CURRENTPKTopk? ................................................................................ 225
DPOPWR:MEAS(x):CURRENTPOPulation? ........................................................................... 226
DPOPWR:MEAS(x):CURRENTResult? ................................................................................... 226
DPOPWR:MEAS(x):CURRENTSTDdev? ................................................................................ 227
DPOPWR:MEAS(x):CUSTomname? ........................................................................................ 227
iv Advanced Power Analysis
Page 9

DPOPWR:MEAS(x):DEGauss .................................................................................................. 228
DPOPWR:MEAS(x):GATESOURce ......................................................................................... 228
DPOPWR:MEAS(x):ISOURce .................................................................................................. 229
DPOPWR:MEAS(x):NAMe? ..................................................................................................... 229
DPOPWR:MEAS(x):SELectmeas .............................................................................................. 230
DPOPWR:MEAS(x):SOURCEAPPLYAll ................................................................................ 230
DPOPWR:MEAS(x):SOURCEAutoset ..................................................................................... 231
DPOPWR:MEAS(x):VSOURce ................................................................................................ 232
DPOPWR:OPC? ......................................................................................................................... 232
DPOPWR:RECalc ...................................................................................................................... 233
DPOPWR:SELECTEDMeas? .................................................................................................... 233
DPOPWR:SINgle ....................................................................................................................... 234
DPOPWR:Stop ........................................................................................................................... 234
DPOPWR:VERsion? .................................................................................................................. 234
Table of Contents
Reference
Error codes for DPOPWR .......................................................................................................... 235
Error codes for DPOPWR cont. ................................................................................................. 239
Correlation of measurement to configurations ........................................................................... 260
Correlation of measurement to plots .......................................................................................... 262
Parameters .................................................................................................................................. 264
About application parameters ................................................................................................ 264
Sequencer parameters ............................................................................................................ 264
Measurement menu parameters ............................................................................................. 264
Configure measurements menu parameters .......................................................................... 265
Source configuration parameters ........................................................................................... 265
Configure Hi-Power finder and switching loss parameters ................................................... 265
Configure magnetics parameters ........................................................................................... 267
Configure SOA parameters ................................................................................................... 268
SOA mask .............................................................................................................................. 268
Configure di-dt parameters .................................................................................................... 268
Configure dv-dt parameters ................................................................................................... 268
Configure current harmonics parameters .............................................................................. 269
Configure voltage harmonics parameters .............................................................................. 269
Configure total power quality parameters ............................................................................. 270
Configure line ripple parameters ........................................................................................... 270
Configure switching ripple parameters ................................................................................. 271
Configure Turn-On time parameters ..................................................................................... 271
Configure pulse width timing analysis parameters ............................................................... 271
Advanced Power Analysis v
Page 10

Table of Contents
Configure period timing analysis parameters ........................................................................ 272
Configure duty cycle timing analysis parameters ................................................................. 272
Configure frequency parameters ........................................................................................... 272
Utilities menu ........................................................................................................................ 273
Static deskew ......................................................................................................................... 274
Prevailing switch mode power supply (SMPS) .......................................................................... 276
Switching loss (PFC) .................................................................................................................. 278
Switch current spikes during turn ON ................................................................................... 278
Cursor placement ................................................................................................................... 278
REF level computation for noisy VG source ........................................................................ 281
How to compare between plot and result .............................................................................. 282
Algorithms
About Algorithms ....................................................................................................................... 285
Options configuration ................................................................................................................. 285
Switching analysis ...................................................................................................................... 286
Switching loss ........................................................................................................................ 286
Benefits of Vg Source and SWL configuration ..................................................................... 292
Switching loss - PFC ............................................................................................................. 296
Hi-Power finder ..................................................................................................................... 300
Safe operating area ................................................................................................................ 300
RDS(on) ................................................................................................................................. 302
di-dt ....................................................................................................................................... 302
dv-dt ....................................................................................................................................... 302
Timing analysis ........................................................................................................................... 303
Skew ........................................................................................................................................... 305
Magnetics .................................................................................................................................... 306
Input analysis .............................................................................................................................. 308
Power quality ......................................................................................................................... 308
Current/Voltage harmonics ................................................................................................... 311
Total power quality ............................................................................................................... 315
In-Rush current ...................................................................................................................... 315
Input capacitance ................................................................................................................... 316
Output analysis ........................................................................................................................... 316
Ripple line and ripple switching ............................................................................................ 316
Spectral analysis .................................................................................................................... 316
Turn-On time ......................................................................................................................... 319
Amplitude ................................................................................................................................... 319
High ....................................................................................................................................... 319
vi Advanced Power Analysis
Page 11

Table of Contents
Low ........................................................................................................................................ 319
High-Low .............................................................................................................................. 320
Cycle min .............................................................................................................................. 320
Cycle max .............................................................................................................................. 320
Cycle peak-to-peak (Pk-Pk) .................................................................................................. 320
Appendix
Appendix A ................................................................................................................................. 321
Appendix B ................................................................................................................................. 322
Glossary
AC signal .................................................................................................................................... 323
Electrical power dissipation ........................................................................................................ 324
Harmonics ................................................................................................................................... 324
In rush ......................................................................................................................................... 327
Input capacitance ........................................................................................................................ 327
RMS value (voltage)(voltage) .................................................................................................... 327
Transfer impedance .................................................................................................................... 328
Advanced Power Analysis vii
Page 12

Table of Contents
viii Advanced Power Analysis
Page 13

Welcome
Advanced Power Measurement and Analysis software allows power supply
designers to configure multiple measurements with custom defined settings,
measure and analyze power dissipation in switching devices, and measure and
analyze magnetic parameters in a single acquisition. The addition of new
measurements such as Inrush current, Capacitance, and Reactive power provides
more insight into the input / output characterization of power supplies. Designers
who otherwise spend a lot of time manually analyzing power dissipations per
cycle can now, with the Switching loss plot and the Time trend plot, measure
power dissipation at all switching cycles graphically. A single .mht format with
the append feature provides an easy way to generate reports that include
measurements, test results, and plot images. This solution elevates your
productivity to a new level and helps SMPS designers meet pre-compliance
requirements.
Advanced Power Measurement and Analysis software with version > 2.0.0 runs
on DPO/DSA7000C, MSO/DPO5000/B, MSO/DSA/DPO70000C, DPO/
DSA700000D, and MSO/DPO/DSA70000DX series oscilloscopes with
Windows 7 64-bit OS. For WinXP series oscilloscopes DPOPWR solution
version is 1.0.13.
Features and benefits
The software includes the following key features:
■
New measurements such as Inrush current, Capacitance, Reactive power and
Switching loss trajectory plot which provide more insight to Input/output
characterization.
■
Custom source Autoset for vertical and horizontal sets the scope parameters
automatically, increasing your productivity and measurement repeatability.
■
Automatic computation of line frequency provide more accurate results to
Voltage and current Harmonics.
■
Automatic detection of PFC circuit waveforms and prompts the user to use
VG for noisy/ringing switching waveforms.
■
Multiple measurements can be run at same time for single acquisition,
providing correlated power measurements.
■
Synchronization of Time trend plot with actual waveform allow you to
observe the variation of measurements over time.
■
Automatic detection of probes, AutoZero / Degauss, and de-skew utilities.
■
Reference waveform helps you to do post analysis now available for all
measurements.
■
Seamless integration of the application with the oscilloscope allows you to
switch between application and scope easily and debug more effectively.
Advanced Power Analysis ix
Page 14

Welcome
Key measurements
■
Global configuration features such as acquisition mode (HiRes), cursor
gating, coupling, and BW limits are applied uniformly across a group of
measurements.
■
Programmatic interface command support.
The key measurements of DPOPWR include the following:
■
Switching Loss measurement computes TON, TOFF, and total loss values
and trajectory plot of ON and OFF values for all switching cycles.
■
Hi Power Finder identifies all the peaks in the power waveform (MATH) and
has interactive detail results. It allows traversing between the peak values and
the result shows energy and loss values for each ON-ON switching cycle.
■
RDS(on) and SOA, measures dynamic internal resistance and customizable
Safe Operating Area mask testing with linear and log scales. SOA X-Y
RDS(on) does not support reference waveforms.
■
Magnetics measurements compute total magnetic loss, inductance of core and
shows graph of relationship between B and H.
■
Power Quality measurement, computes THD, True Power, Apparent Power,
Power Factor, and Crest Factor. All these analysis outputs are shown in a
quick view in the Summary results table.
■
Current Harmonics enables all precompliance testing to cover EN61000-3-2,
EN61000-3-2 AM14, and MIL 1399 (400 Hz) standards. User defined mode
displays up to the 100th harmonic in both table and bar graph formats.
■
Voltage Harmonics provide a frequency-domain view of the AC voltage,
such as at the output of an inverter.
■
Inrush current measurement identifies the peak currents based on configured
threshold level.
■
Capacitance measurement computes peak capacitance value above
configured threshold value.
■
Timing/Modulation analysis displays a time-trend plot of the cycle-to-cycle
variations in the modulated switching signal based on positive and negative
pulse width, positive and negative duty cycle, frequency, period, and skew
measurements.
■
Amplitude measurement computes High, Low, High-Low, Cycle Min, Cycle
Max and Cycle Pk-Pk. All these analysis outputs are shown in the Results
table, Time trend, and Histogram plots.
What do you want to do?
Study online help and related documentation
Read product description
Go to installation procedures
x Advanced Power Analysis
Page 15

General safety summary
General safety summary
Review the following safety precautions to avoid injury and prevent damage to
the measurement instrument or any products connected to it. To avoid potential
hazards, use the software and measurement instrument only as specified.
While using this software, you may need to access other parts of the system.
Read the general safety summary and specification sections in other equipment
manuals for warnings, cautions, and ratings related to operating the system with
this software.
To avoid fire and personal
injury
Terms in this manual
Connect and disconnect properly. Connect the probe output to the
measurement instrument before connecting the probe to the circuit under test.
Disconnect the probe input and the probe ground from the circuit under test
before disconnecting the probe from the measurement instrument.
Observe all terminal ratings. To avoid fire or shock hazard, observe all ratings
and markings on the measurement instrument and other equipment used with this
software. Consult the individual product manuals for further ratings information
before making connections to the circuit under test.
Do not operate with suspected failures. If you suspect there is damage to the
measurement instrument or other equipment being used with this software, have
it inspected by qualified service personnel.
These terms may appear in this manual:
WARNING. Warning statements identify conditions or practices that could
result in injury or loss of life.
CAUTION. Caution statements identify conditions or practices that could result
in damage to the measurement instrument or other property.
Advanced Power Analysis 1
Page 16
General safety summary
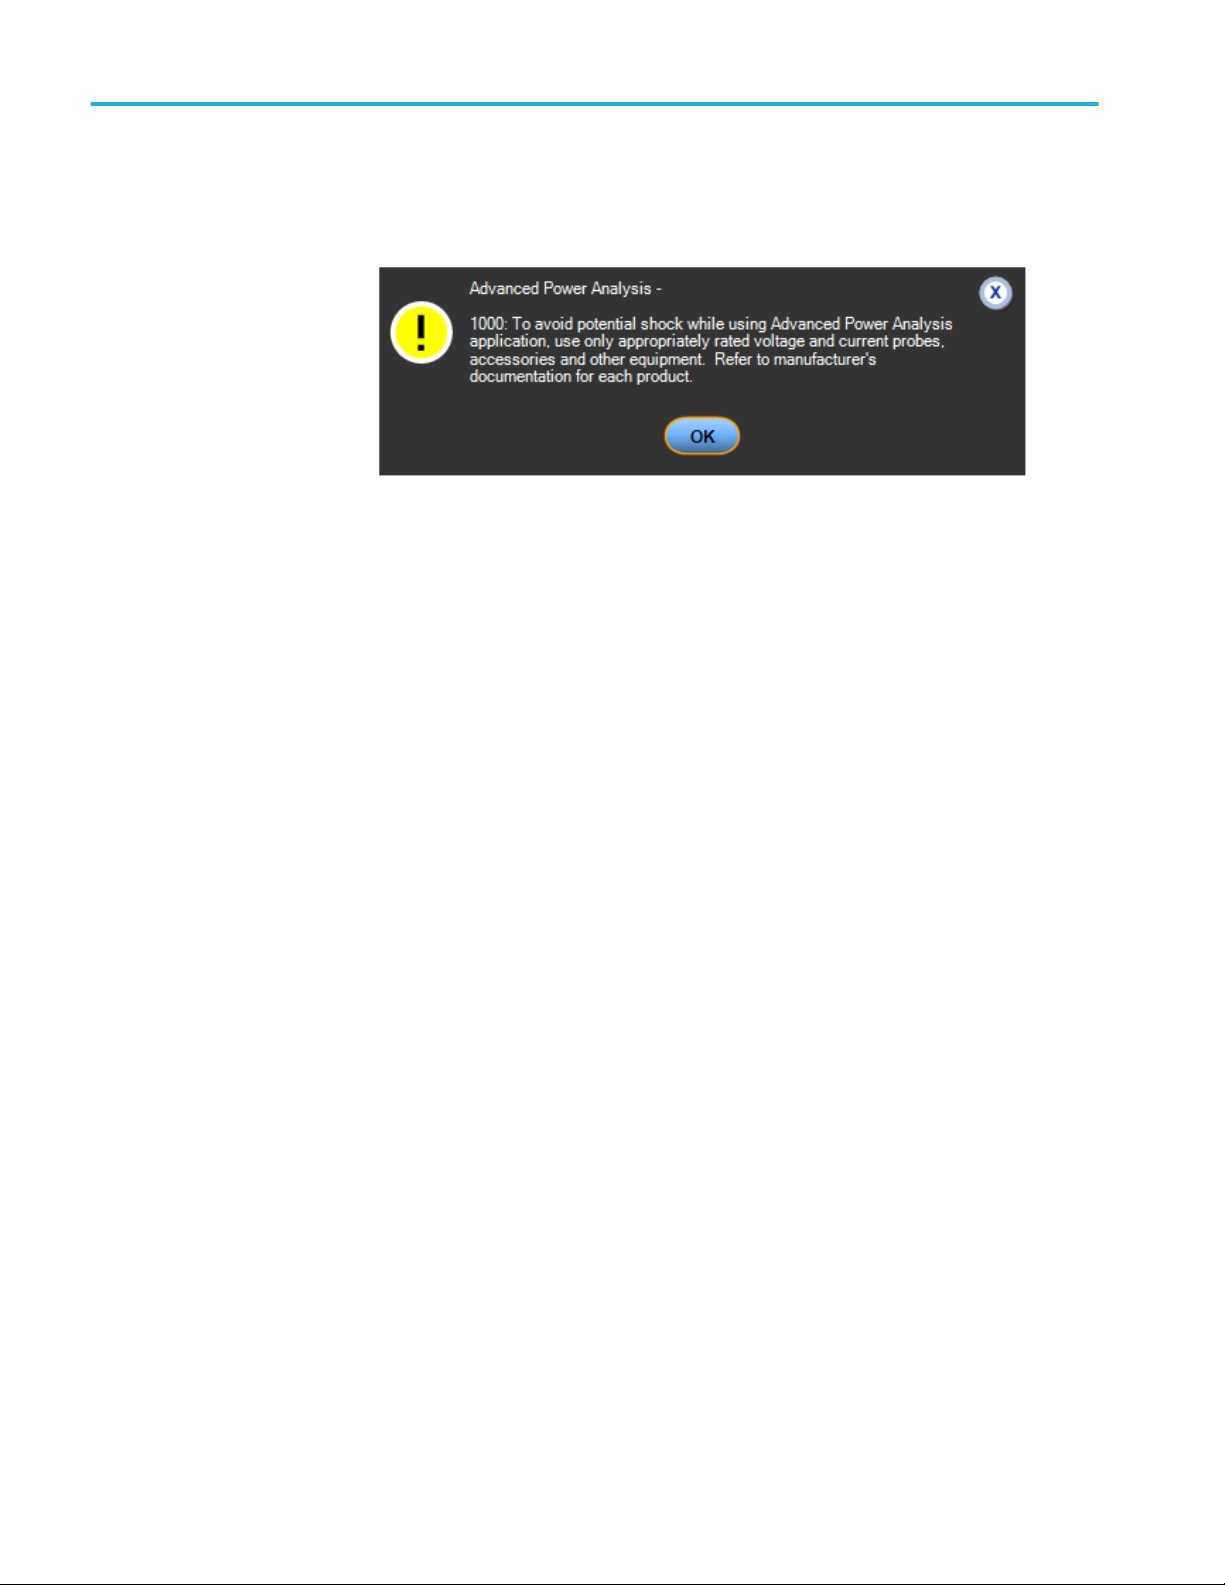
Terms in the application
When launched from the oscilloscope menu, the application displays a caution
dialog box, warning you to use only appropriately rated voltage and current
probes, accessories, and other equipment. Click OK.
2 Advanced Power Analysis
Page 17

Introduction
Online help and related documentation
Access the information on how to operate the application with the oscilloscope
through the following related documents and online help.
What do you want to do?
Conventions
Related Documentation
Contact Tektronix
Provide feedback on this Tektronix product
Printing from online help
Some online help topics have color in the examples of the displayed application.
To print this type of topic on a monochrome printer, some information may not
print because of certain colors. Instead, you should print the topic from the PDF
(portable document format) file that corresponds to the online help.
Advanced Power Analysis 3
Page 18

Introduction
Related documentation
In addition to the online help, you can access other information on how to operate
the oscilloscope through the following related documents:
■
Oscilloscope Information: The user manual and user online help for your
oscilloscope provide general information on how to operate the oscilloscope.
TIP. You can download PDF versions of many user manuals from the Tektronix
Web site.
■
Programmer Information: The online programmer guide for your
oscilloscope provides details on how to use GPIB commands to control the
oscilloscope.
Conventions
Online help uses the following conventions:
Feedback
■
Refers to the DPOPWR Power Measurements solution as Advanced Power
Analysis Application.
■
When steps require a sequence of selections using the application interface,
the ">" delimiter marks each transition between a menu and an option. For
example, one of the steps to save a setup file would appear as File> Save.
■
The Source Configuration Panel is common to many measurements.
■
GP knob refers to the general-purpose knob.
Tektronix values your feedback on our products. To help us serve you better,
please send us your suggestions, ideas, or comments on your oscilloscope.
Direct your feedback using e-mail to
techsupport@tektronix.com or FAX at (503) 627-5695
and include the following information. Please be as specific as possible.
4 Advanced Power Analysis
Page 19

Introduction
■
General information:
Oscilloscope model number and hardware options, if any
■
Probes used
■
Your name, company, mailing address, phone number, FAX number
■
Please indicate if you would like to be contacted by Tektronix about your
suggestion or comments
■
Application specific
information:
Software version number
■
Description of the problem such that technical support can duplicate the
problem
■
If possible, save the oscilloscope and application setup files as .set files
■
If possible, save the waveform on which you are performing the
measurement as a .wfm file
Once you have gathered this information, contact technical support by phone or
through e-mail. If using e-mail, be sure to enter in the subject line "DPOPWR
Problem," and attach the .set and .wfm files.
Advanced Power Analysis 5
Page 20

Introduction
6 Advanced Power Analysis
Page 21

Getting started
Introduction and product description
Advanced Power Measurement and Analysis software (DPOPWR) with version
> 2.0.0 runs on DPO/DSA7000C, MSO/DPO5000/B, MSO/DSA/DPO70000C,
DPO/DSA700000D, and MSO/DPO/DSA70000DX series oscilloscopes with
Windows 7 64-bit OS. For WinXP series oscilloscopes DPOPWR solution
version is 1.0.13. It allows you to acquire, measure, and analyze various
switching power supply signals at multiple test points. The application provides
simple and direct way to obtain results about switching devices, magnetic
components, and compliance tests to EN 61000-3-2 standard for Switch mode
Power supply. The features of DPOPWR are:
■
Switching Analysis: It analyzes the switching devices in the power supply,
such as FET (Field Effect Transistor), BJT ( BiPolar Junction Transistor),
and IGBT (Integrated Gated BiPolar Junction Transistor). The measurements
include Switching Loss, Trajectory plot with ON and OFF values for all
switching cycles, Hi-Power Finder, Safe Operating Area (SOA), SOA X-Y
(DPX), Dynamic Resistance RDS(on), di/dt, and dv/dt.
■
Timing Analysis: It analyzes the switching devices in the power supply,
such as FET, BJT, and IGBT. The measurements include Pulse Width
modulation, Period modulation, Duty Cycle modulation, Frequency
measurement, and Skew.
■
Magnetics: It measures Inductance, Magnetic Property, Magnetic Loss, and
.
■
Input Analysis: It measures Power Quality, Current Harmonics (upto 100th
harmonic value is displayed in table and bar graph format), Voltage
Harmonics, Total Power Quality, In Rush Current, and Capacitance.
■
Output Analysis: It measures Line Ripple, Switching Ripple, Turn-On
Time, and Spectral Analysis. Spectral Analysis analyses the electromagnetic
interference frequency and measures the noise/ripple frequency range at
output DC voltage. Support of POE specification filter in Spectral
Measurement.
■
Amplitude: It measures High, Low, High-Low, Cycle Min, Cycle Max and
Cycle Pk-Pk for periodic waveforms.
■
A Report tool with append capability to create and print custom reports
in .mht format.
■
SOA Overlay, Deskew, Auto detect of probes, DeGauss Autoset,
Autocalc loss without Vg, and SOA Mask Editor utilities.
Advanced Power Analysis 7
Page 22

Getting started
What do you want to do?
Compatibility
Current probes
Compatibility
Requirements and restrictions
Installing the application
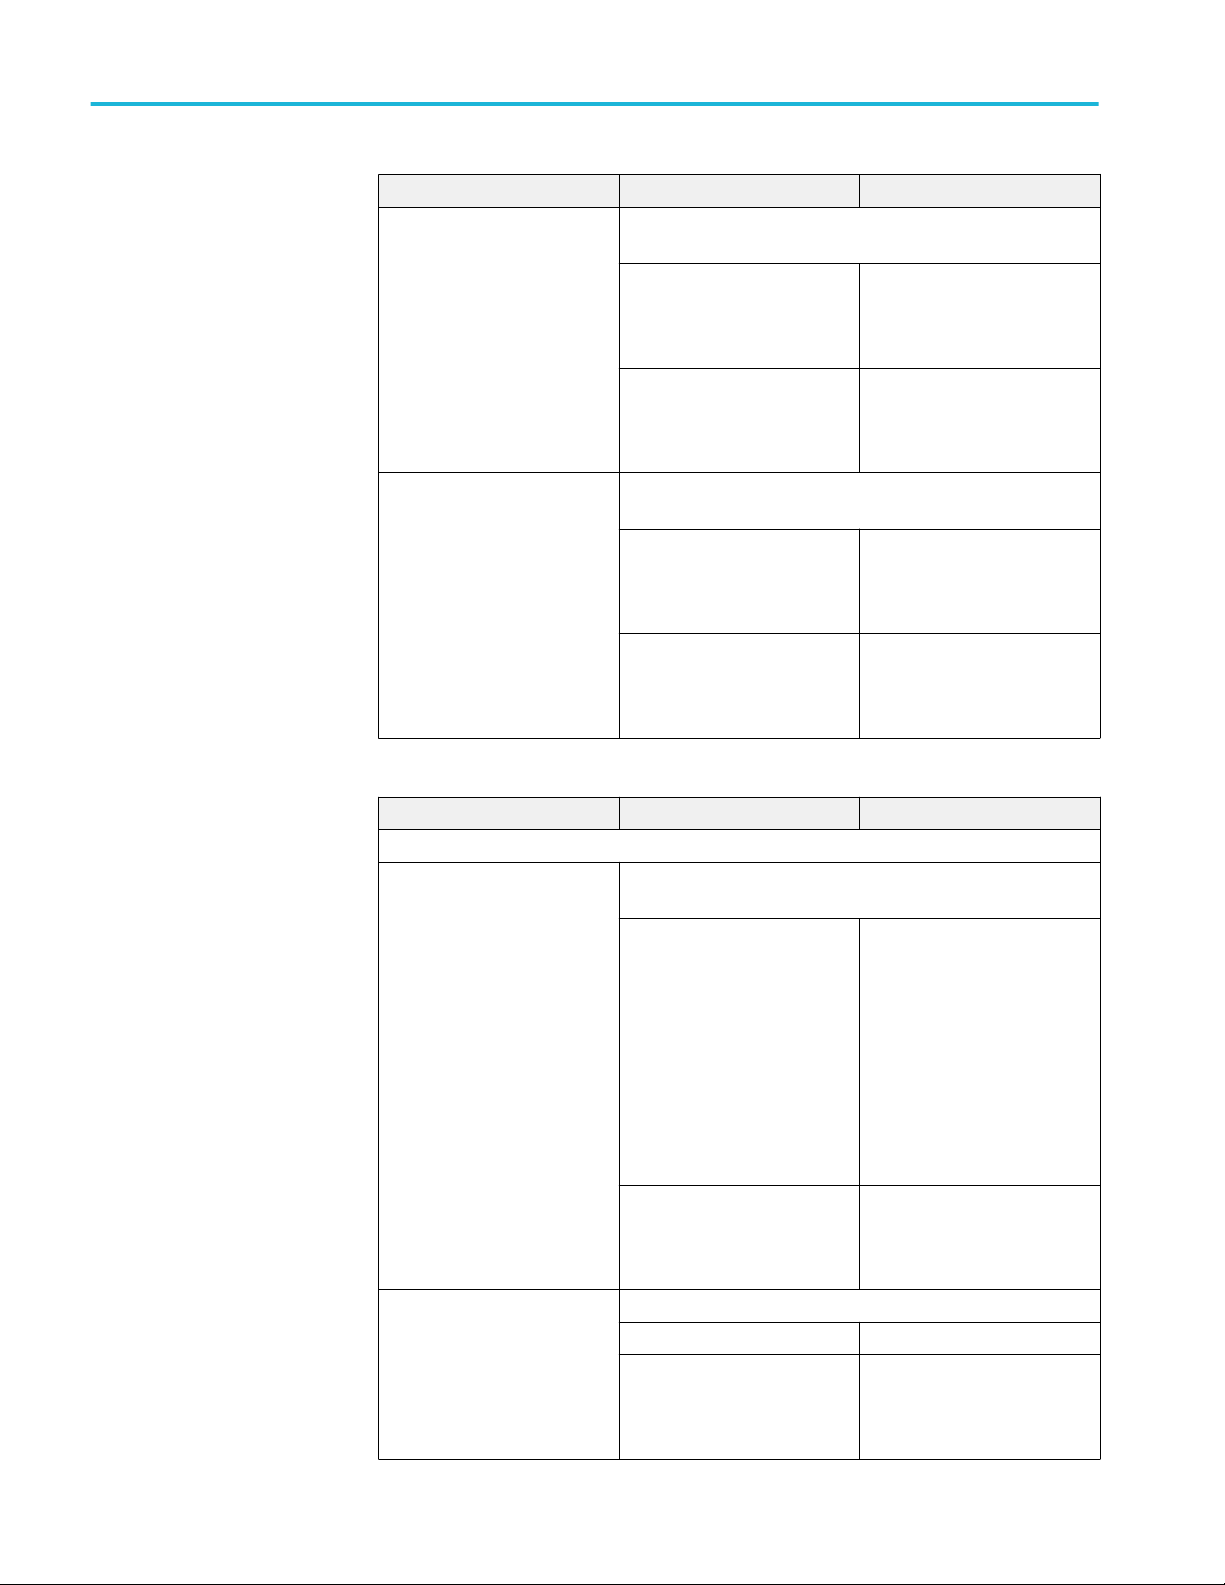
To view number of channels required for any measurement, click Help > About
TekScope. The oscilloscope displays the channel dependencies in option panel.
Measurement Name Number of Channels
Switching Analysis
di /dt 1
dv /dt 1
Hi-Power Finder 2 - 3
RDS(On) 2
SOA 2
SOA X-Y (DPX) 2
Switching Loss 2 - 3
Timing Analysis
Duty Cycle 1
Frequency 1
Period 1
Pulse Width 1
Skew 2
Magnetics
I vs ∫V 2
Magnetic Loss 2
Magnetic Property 2 - 4
Inductance 2
Input Analysis
In Rush Current 1
Input Capacitance 2
Current Harmonics 2
Power Quality 2
Total Power Quality 2
Voltage Harmonics 1
Output Analysis
Line Ripple 1
Switching Ripple 1
8 Advanced Power Analysis
Page 23

Measurement Name Number of Channels
Spectral Analysis 1
Turn-On time 2 to 4
Amplitude
High 1
Low 1
High Low 1
Cycle Min 1
Cycle Max 1
Cycle Pk-Pk 1
Requirements and restrictions
Install Microsoft .NET Framework Version 4.0 as a prerequisite prior to
installing DPOPWR application. Microsoft Windows Internet browser is required
to view report.
Getting started
Current probes
The application supports the following probes:
■
AM503B series with A6302
■
AM503B series with A6302XL
■
AM503B series with A6303
■
AM503B series with A6303XL
■
AM503B series with A6304XL
■
AM503 Series with A6312
■
TCP0020
■
TCP0030
■
TCP0030A
■
TCP0150
■
TCP202
■
TCP2020
■
TCP202A
■
TCP202A and TPA-BNC
■
TCPA300 with TCP303
■
TCPA300 with TCP303 and TPA-BNC
Advanced Power Analysis 9
Page 24

Getting started
Voltage probes
■
TCPA300 with TCP305
■
TCPA300 with TCP305 and TPA-BNC
■
TCPA300 with TCP305A
■
TCPA300 with TCP305A and TPA-BNC
■
TCPA300 with TCP312
■
TCPA300 with TCP312 and TPA-BNC
■
TCPA300 with TCP312A
■
TCPA300 with TCP312A and TPA-BNC
■
TCPA400 with TCP404XL
■
TCPA400 with TCP404XL and TPA-BNC
■
TekVPI TCP0030
The application supports the following probes:
■
P5050
■
P5050B
■
P5100
■
P5100A
■
P5200A
■
P5200A
■
P5202A
■
P5205
■
P5205A
■
P5210
■
P5210A
■
P6015A (10 ft)
■
P6015A (25 ft)
■
P6021A
■
P6131 (1.3 m)
■
P6131 (2 m)
■
P6138A
■
P6139A
■
P6139B
■
P6158
10 Advanced Power Analysis
Page 25

■
P6243
■
P6245
■
P6246
■
P6247
■
P6248
■
P6250
■
P6251
■
TAP1500
■
TAP2500
■
TDP0500
■
TDP1000
■
TDP1500
■
TDP3500
Getting started
Voltage probes
■
TekVPI TAP1500
■
TekVPI TAP2500
■
TekVPI TPA-BNC
■
THDP0100
■
THDP0200
■
TMDP0200
■
TPP0500
■
TPP0500B
■
TPP0502
■
TPP0850
■
TPP1000
The application supports the Deskew Fixture (Tektronix part number: 067-1686XX).
NOTE. For further information about probes visit www.tek.com/probes.
NOTE. If you are using external fixtures to measure Turn-On Time and Ripple,
then enter the external attenuation factor values in the Vertical > External
Attenuation menu for accurate results.
Advanced Power Analysis 11
Page 26

Getting started
Updates through the web site
Find information about DPOPWR and other applications at the Tektronix Inc.
Web site, www.tektronix.com. Check this site for updates and free applications.
To install an application update, you must download it from the Tektronix Web
site to the oscilloscope hard disk.
NOTE. Refer to the Readme.txt file on the web site for steps to install and more
information.
Installing the application
Your instrument comes with the application preinstalled on the hard drive.
NOTE. If you install the new Advanced Power Analysis application, the old
DPOPWR application is uninstalled.
12 Advanced Power Analysis
Page 27

Operating basics
About basic operations
About basic operations
Application interface
Application interface
menu controls
This section contains information on:
Application interface
Using basic oscilloscope functions
Setting up the software
Saving and recall setups
The application uses a Microsoft Windows interface.
Application directories and file names
Application interface menu controls
NOTE. The oscilloscope application shrinks to half size and appears in the top
half of the display when the application is running.
Item Description
Menu bar Located at the top of the oscilloscope that is used to start the
application
Tab Labeled group of options containing similar items
Area Enclosed visual frame with a set of related options
Option button Button that defines a particular command or task
Drop-Down List box Box that contains a list of items from which you can select one
item
Field Box that you use to type in text, or to enter a value with the
Keypad or a Multipurpose knob
Check Boxes Square box that you use to select or clear preferences
Scroll bar Vertical or horizontal bar at the side or bottom of a display area
that is used for moving around in that area
Browse Displays a window where you can look through a list of
directories and files
Command button Button that initiates an immediate action
Advanced Power Analysis 13
Page 28
Operating basics
Item Description
Keypad Appears when you select the box and enter a value
MP / GP knob Select the multipurpose ( MP or GP ) knob to display a line
between the knob and the box; turn the knob on the oscilloscope
to select a value
Basic application functions
Application directories
and file names
File name extensions
The application uses directories to save and recall setup files and uses file name
extensions to identify the file type.
The following table lists default directory names.
Directory Used For
C: \ Users\Public\Tektronix\TekApplications
\Advanced Power Analysis\Waveforms\
C:\User\<Current User>\Tektronix
\TekApplicaitons\Advanced Power Analysis
\Reports\
C:\User\Public\Tektronix\TekApplicaitons
\Advanced Power Analysis\SOA Mask\
C:\User\<current user>\Tektronix
\TekApplicaitons\Advanced Power Analysis
\SwitchingLoss\
Stores the waveforms used for the tutorial
Stores the default reports
Stores the SOA mask data as a comma
separated value file
Stores the per cycle loss information of
Switching loss in csv format
See also.
File name extensions
Extension Description
.csv Is a file that uses a “comma separated variable” format
.ini Is an application setup file
.set Is an oscilloscope setup file saved and recalled with an .ini file; both the
files will have the same file name
.wfm Is a waveform file that can be recalled into a reference memory
.mht Is the file format for reports
.jpg Is the format of the image file of the various plots
.msk Is the format of the SOA mask file
14 Advanced Power Analysis
Page 29
Operating basics
Returning to the
application
When you access oscilloscope functions, the oscilloscope fills the display. Access
oscilloscope functions in the following ways:
■
Choose the Menu on the oscilloscope and access the application
■
Push front-panel buttons
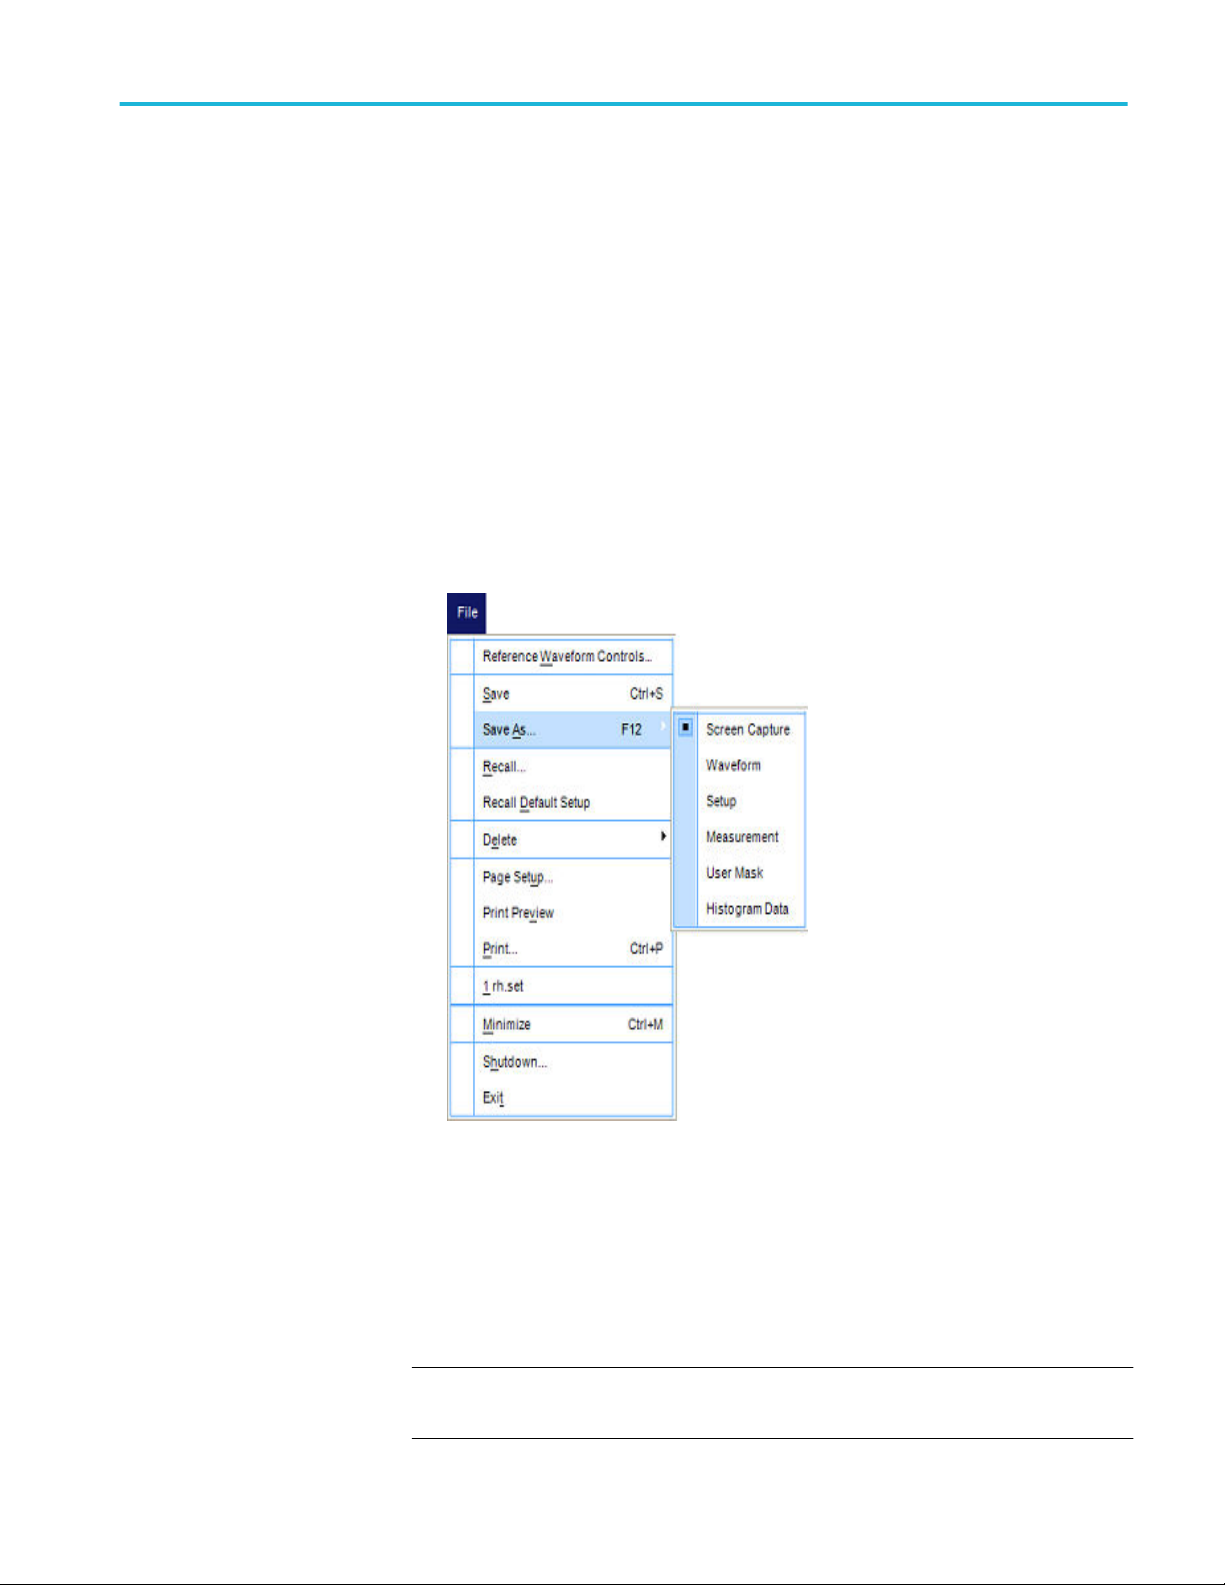
Saving and recalling setups
Saving a setup
To save the application state and the oscilloscope settings to a setup file, follow
these steps:
1. Select File> Save As> Setup.
2. Select the Save menu.
3. Select the directory to save the setup file.
4. Select or enter a file name. The application appends an ".xml" extension to
the name of setup files.
5. Choose Save.
NOTE. While saving a Report, the application does not validate for the available
size in the drive.
Advanced Power Analysis 15
Page 30
Operating basics
Recalling a saved setup
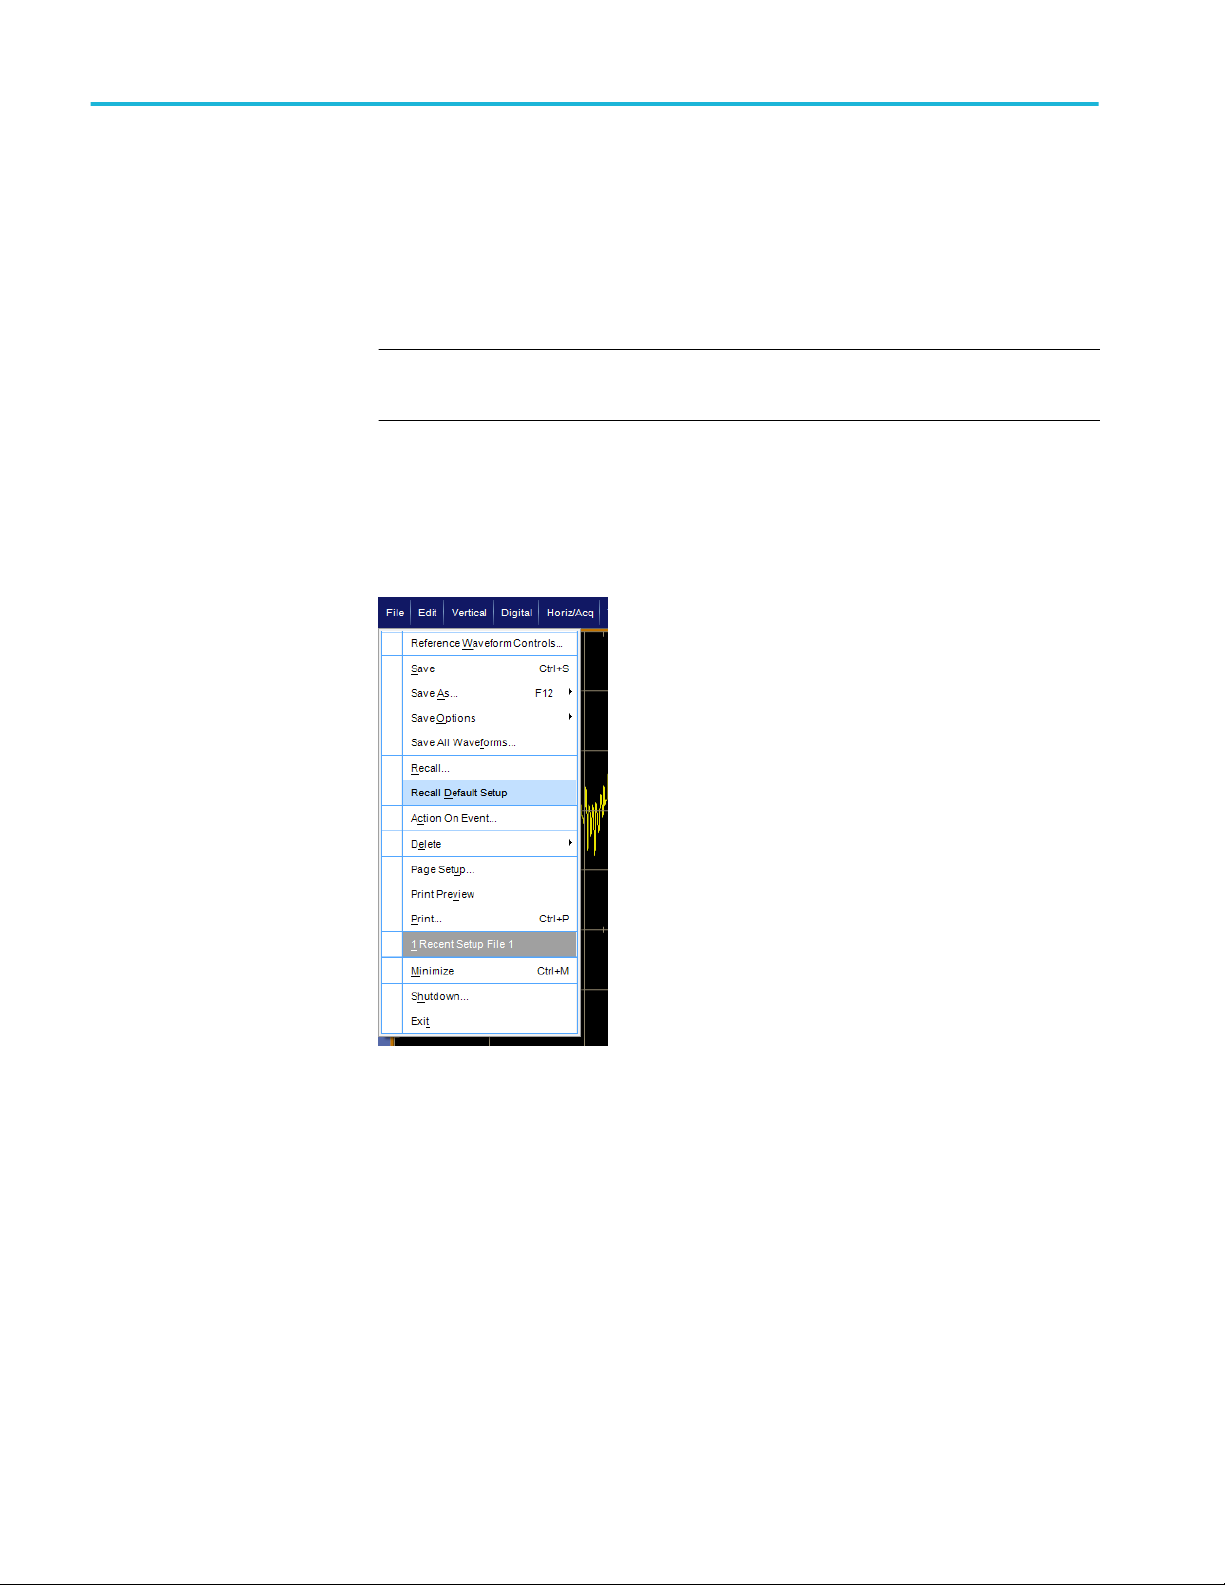
Recalling the default setup
To recall the application setup and the oscilloscope settings from a saved setup
file, follow these steps:
1. Select File> Recall.
2. Select the directory from which you can recall the application settings.
3. Select or enter a file name.
NOTE. The application also recalls the oscilloscope setup from a ".xml" file when
you recall an application setup.
To recall the application settings from the Default setup file Select File> Recall
Default Setup.
16 Advanced Power Analysis
Page 31

Utilities
Operating basics
DeGauss
Degaussing is a mandatory operation for current probes. Every current probe
must be degaussed before using it.
Degaussing a current probe requires:
■
Current probe jaws should be closed before it is degaussed
■
Probe should not be connected to any active point or no signal in the probe
The application checks the Degauss status of each probe at the beginning of
every autoset and the application prompts to degauss the probe if necessary.
Select a measurement, and launch the source control window, select the DeGauss button. This will guide you through the De-Gauss process.
Alternatively, you can do it manually by pressing the degauss button on the
current probe.
Auto Zero
Advanced Power Analysis 17
AutoZero is a feature which computes vertical zero-volt error (DC offset) and
compensates during acquisition. When AutoZero button is pressed the scope
makes acquisitions and measurements, to adjust the offset. AutoZero is useful for
voltage probes which are used to measure current.
To perform AutoZero, connect the voltage probe and short the input terminals
together.
Page 32

Operating basics
Preferences setup
NOTE. Ensure no input signals are connected to probe tips.
NOTE. Auto Zero is applicable for voltage probes.
■
Click I-Probe Settings to display TCP, Shunt, Custom and AM503S Settings.
Click the TCP button if you are using TCP series probes.
NOTE. If you are using a TCA-1MEG probe, terminate the input side with
50 Ohms for a current probe that does not automatically change the
termination. If you are using a TCA to BNC probe, you do not have to
terminate the input side.
18 Advanced Power Analysis
Page 33

Operating basics
Deskew
MSO/DPO5000/B series oscilloscopes: Deskewing Probes and Channels
To ensure accurate results, deskew the probes before taking measurements from
your device under test.
The application provides you two deskew options. They are:
■
Static deskew
■
Real time deskew using TEK-DPG (Deskew Pulse Generator) or an external
source
Deskew can be accessed using the Preferences dialog box.
NOTE. For THDP probes, it is recommended that you use static deskew because
of Noise.
NOTE. Connect the probes to the fastest transition while using the external signal
mode.
Advanced Power Analysis 19
Page 34

Operating basics
To deskew a current probe perform these steps:
1. Select the IProbe tab.
2. Select the current sources and probes by selecting the source and probe from
the Current Sources and Current Probes drop-down lists.
3. After configuring the current probe, select Deskew Static or Deskew Real
Time tab and click Perform Deskew to start the deskew procedure.
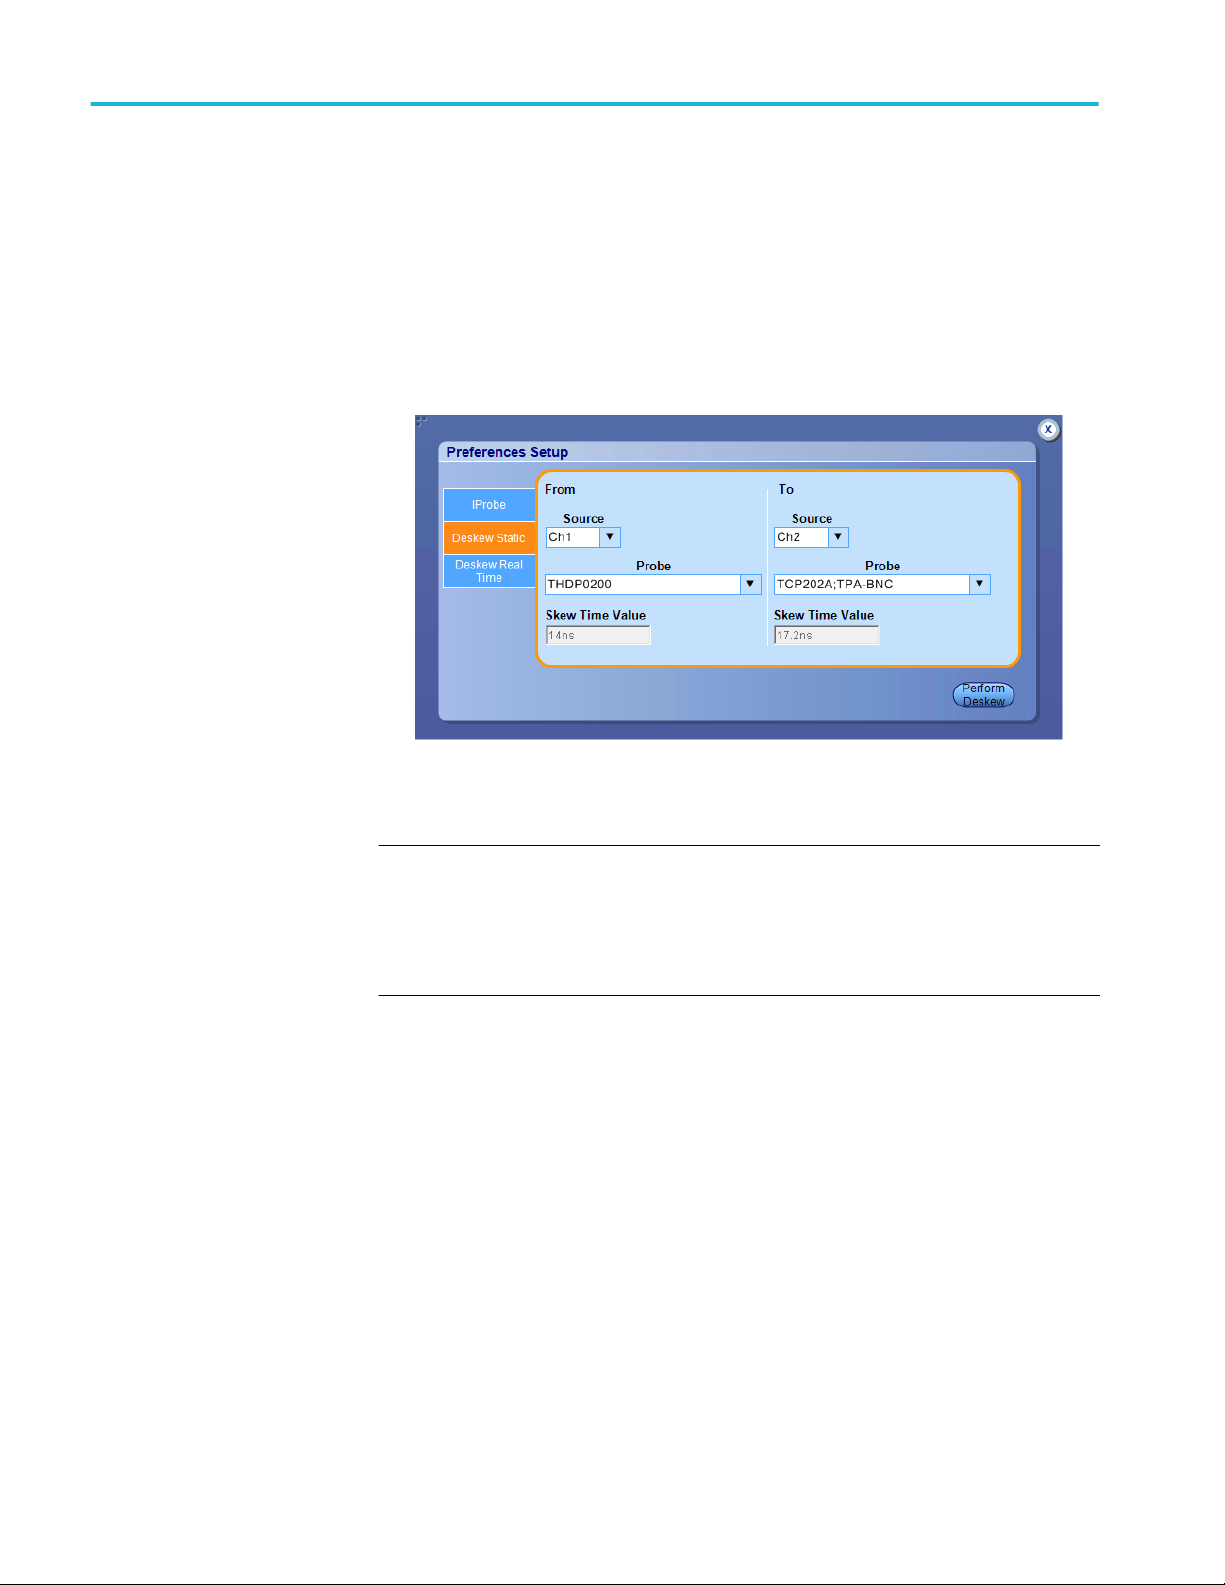
To perform a static deskew perform these steps:
1. Select the Deskew Static tab.
2. Select the To and From sources by selecting the sources from the Source
drop-down lists.
3. Select the To and From probes by selecting the probes from the Probe dropdown lists.
4. Click Perform Deskew to start the deskew procedure.
20 Advanced Power Analysis
Page 35

Operating basics
To perform a real time deskew perform these steps:
1. Select the Deskew Real Time tab.
2. Select the To and From sources by selecting the sources from the Source
drop-down lists.
3. To change the reference level or hysteresis values, double click the text box
and enter the desired value using the pop up keyboard.
4. Select the Slope as either Rise or Fall.
5. Select the Source as Tektronix DeSkew Fixture and Pulse generator (TEK-
DPG).
6. Set Ch1 to Voltage, Ch2 to Current.
7. Connect the probe tips to the Deskew fixture, and connect the TEK-DPG to
Ch3.
8. Select Output enable on the TEK-DPG probe.
9. Click Perform Deskew to start the deskew procedure.
A popup asks whether you want to do an autoset or not. Click Yes to allow
the application to set up the oscilloscope for deskew; click No if you have
already set up the oscilloscope and just want to perform deskew.
Advanced Power Analysis 21
Page 36

Operating basics
Deskewing probes and
channels
Static deskew. Static deskew automatically sets the deskew based on the probe
type supported. The propagation values of the probes are fixed. You do not need
an external deskew fixture to deskew the channels.
The application supports the following combination between any two-channel
probes for DPO/DSA7000C, MSO/DPO5000/B, MSO/DSA/DPO70000C, DPO/
DSA700000D, and MSO/DPO/DSA70000DX series oscilloscopes:
Probe Model Skew in ns
AM503B w/ A6302 30.1
AM503B w/ A6303 55.0
AM503B w/ A6312 30.1
AM503B w/ A6302XL 60.3
AM503B w/ A6303XL 105.0
AM503B w/ A6304XL 105.0
P5050 5.5
P5050B 6.0
P5100 14.9
P5100A 6.0
P5200 20.0
P5200A 21.0
P5202A 18.0
P5205 17.3
P5205A 18.0
P5210 20.3
P5210A 18.0
P6015A (10 ft) 14.7
P6015A (25 ft) 33.3
P6021A 9.0
P6131 (1.3 m) 6.3
P6131 (2 m) 9.1
P6138A 6.3
P6139A 6.3
P6139B 6.0
P6158 5.0
P6243 5.3
P6245 5.3
P6246 7.7
P6247 7.3
P6248 6.8
P6250 6.5
P6251 6.5
22 Advanced Power Analysis
Page 37

Operating basics
Probe Model Skew in ns
TAP1500 5.3
TAP2500 5.3
TCP0020 16.6
TCP0030 14.6
TPP1000 5.67
TCP0030A 14.5
TCP0150 21.0
TCP202 17.3
TCP202A 17.2
TCP2020 17.0
TCP202A;TPA-BNC 17.2
TCPA300 w/ TCP303 40.0
TCPA300 w/ TCP303 + TPA-BNC 40.3
TCPA300 w/ TCP305 19.0
TCPA300 w/ TCP305 + TPA-BNC 19.3
TCPA300 w/ TCP305A 19.0
TCPA300 w/ TCP305A + TPA-BNC 19.3
TCPA300 w/ TCP312 17.0
TCPA300 w/ TCP312 + TPA-BNC 17.3
TCPA300 w/ TCP312A 17.0
TCPA300 w/ TCP312A + TPA-BNC 17.3
TCPA400 w/ TCP404XL 80.0
TCPA400 w/ TCP404XL + TPA-BNC 80.3
TDP0500 6.5
TDP1000 6.5
TDP1500 5.4
TDP3500 5.3
TekVPI TCP0030 14.6
TekVPI TAP1500 5.3
TekVPI TAP2500 5.3
TekVPI TPA-BNC 0.25
THDP0100 16.0
THDP0200 14.0
TMDP0200 14.0
TPP0500 5.3
TPP0500B 5.3
TPP0502 5.3
TPP0850 6.1
Advanced Power Analysis 23
Page 38
Operating basics
Follow these steps to perform the Static Deskew:
1. Select Analyze> Advanced Power Analysis, and then select Preferences.
2. Click the Deskew Static tab.
3. In the From panel, select the Source and the corresponding Probe type.
4. In the To panel, select the Source and the corresponding Probe type.
5. Click Perform Deskew to deskew the selected probe.
NOTE. Static deskew is performed between any two channels of your choice.
Retain the From panel parameters and change the To panel parameters to
perform deskew for more than two channels. If you are using a Custom probe, the
application adjusts the deskew and sets the value when you perform static
deskew.
24 Advanced Power Analysis
Page 39

Operating basics
DPO70000 series oscilloscopes. DPO/DSA7000C, MSO/DSA/DPO70000C,
DPO/DSA700000D, and MSO/DPO/DSA70000DX series oscilloscopes.
Use the Aux Output signal (DPO7000C) and the Deskew fixture (Tektronix part
number: 067-1686-XX) to deskew the probes and channels.
Follow these steps to deskew with an internal source:
1. Connect the AUX OUT of the oscilloscope to the B side input of the deskew
fixture to deskew the voltage probe and current probe.
2. Follow the instructions for the Probe Calibration and Deskew fixture to make
the connections.
3. Set up the oscilloscope as follows:
■
Use the Horizontal Scale knob to set the oscilloscope to an acquisition
rate so that there are two or more samples on the deskew edge.
■
Use the Vertical Scale and Position knobs to adjust and display the
signals on the screen.
■
Set the Record Length so that there are more samples for the edges in the
acquisition. It is recommend that you set the record length to
25000 points.
4. To start the application, select Analyze > Advanced Power Analysis, and
then select Preferences.
5. Select the Deskew Real Time tab. Click the Internal Source button in the
Source panel.
6. In the From panel, set the Source to Ch1. The remaining channels are
deskewed to the Source waveform, which is the reference point.
7. In the To panel, set the Source to Ch2, the channel to be deskewed.
8. To start the deskew utility, click the Perform Deskew button and confirm the
operation.
Advanced Power Analysis 25
Page 40

Operating basics
9. Use Ch1 as the reference point and deskew the remaining channels.
The following figure shows a waveform before and after deskew.
Figure 1: Waveform before deskew
Figure 2: Waveform after deskew
10. Only 1 edge is displayed on the screen, and you can see that the skew has
been removed.
26 Advanced Power Analysis
Page 41

Operating basics
NOTE. The oscilloscope setup is saved before deskew and recalled after deskew.
If the acquisition setup is in Stop condition before saving the setup, the setup with
the stop condition is recalled. When deskew recalls this setup, the application
does not display the waveform. To view the waveform, push the Run or the Stop
button in the oscilloscope application.
See also.
Static deskew
Deskewing using a power deskew fixture
Deskewing using a power deskew fixture. The Power Measurements Deskew
Fixture with Tektronix part number (067-1686-XX), supports up to 150 A AC/
DC current probes.
Follow these steps to deskew:
■
Connect the AUX OUT of the oscilloscope to the J1, J2 ( Cal signal input)
input of the deskew fixture to deskew the voltage probe and current probe.
■
Follow the steps 2-10 in the topic Deskewing in DPO/DSA7000C, MSO/
DSA/DPO70000C, DPO/DSA700000D, and MSO/DPO/
DSA70000DX series oscilloscope to complete the procedure.
Advanced Power Analysis 27
Page 42

Operating basics
28 Advanced Power Analysis
Page 43

Advanced power measurement and analysis
Setting up DPOPWR to take measurements
Setting up the software
Setup the application to view waveform analysis results in table format. You can
also view the results in 2D plot format or save as report for later analysis.
The following are the categories of measurements. Click the link for
measurements in that category:
1. Switching analysis
2. Timing analysis
3. Magnetics
4. Input analysis
5. Output analysis
6. Amplitude
Advanced Power Analysis 29
Page 44

Advanced power measurement and analysis
Table of options-Source
configuration
Area Option Description
Source selection panel Current (I)
Voltage (V)
Gate Voltage(Vg)
Current Source
■
Select Ch1-Ch4 for live
waveform
■
Select Ref1- Ref4 for the
Ref waveform
Voltage Source
■
Select Ch1-Ch4 for live
waveform
■
Select Math1- Math4 for
the Ref waveform
Gate Voltage
■
Select Ch1-Ch4 for live
waveform
■
Select Math1- Math4 for
the Ref waveform
Gate selection is applicable for
the selected measurements. It
will sync with gate or edge
source selection under the
configuration of the selected
measurements.
NOTE. Availability of Ch3, Ch4,
Ref3, Ref4 depends on the
oscilloscope.
30 Advanced Power Analysis
Page 45

Advanced power measurement and analysis
Table of measurements and configurations-Switching analysis.
Measurement SubType/Configurations Description
Switching Analysis
Switching Analysis Analyzes the power dissipated
in the switching cycles across a
switching device.
Switching Loss Measures the instantaneous minimum and maximum average
energy consumed across the switching device. The loss is
measured on each cycle of the acquired waveform. The results
include minimum, maximum and the average loss and energy for
the complete cycles in a single record.
Type PWM Type
Device
PFC Type
OnOffLevel Autocalc loss without Vg
Units
Device
V-Level
I-Level
Math Destination
Options Units
Ref Level
Hysteresis
Filter Current
Signal Condition
Log Switching Cycles
Global Coupling
BW Limit
Cursor Gating
Acquisition Mode
1
1
Acquires atleast one cycle of input line frequency and turns on cursor gating.
Advanced Power Analysis 31
Page 46

Advanced power measurement and analysis
Measurement SubType/Configurations Description
Hi-Power Finder Hi Power Finder analyzes the power loss in switching
components, ensuring that the instantaneous power remains
within the specified limits.
PWMType Fixed
Variable
OnOffLevel Units
Device
V-Level
I-Level
Math Destination
Edges Units
Ref Level
Hysteresis
Filter Current
Global Coupling
BW Limit
Cursor Gating
Acquisition Mode
Safe Operating Area (SOA) Plots the Voltage and Current waveform in a single record in XY
mode. The Enable mask check box is enabled only for SOA
Normal. Use the Mask Editor to apply the mask to the SOA Plot
only for SOA Normal option.
Mask Editor Enable
X Co-ord.
Y Co-ord.
Add
Update
Clear
Clear All
Save
Recall
Graph
Preview
Global Coupling
BW Limit
Cursor Gating
Acquisition Mode
SOA X-Y (DPX) Sets up the oscilloscope in XY mode with infinite persistence for
the voltage and current waveforms.
RDS(on) Method V/I
dV/dI
Global Coupling
BW Limit
Cursor Gating
Acquisition Mode
32 Advanced Power Analysis
Page 47

Advanced power measurement and analysis
Measurement SubType/Configurations Description
dv/dt Measures the differentiation of the voltage dv/dt
Options Units
Ref Level
Hysteresis
Ref High
Ref Low
Global Coupling
BW Limit
Cursor Gating
Acquisition Mode
di/dt Measures the differentiation of the current di/dt
Options Units
Ref Level
Hysteresis
Ref High
Ref Low
Global Coupling
BW Limit
Cursor Gating
Acquisition Mode
Table of measurements
and configurations-Timing
analysis
Measurement SubType/Configurations Description
Modulation Analysis
Pulse Width Is a trend plot of the pulse width variation for the acquired
waveform. It is the time difference between the leading and the
trailing edge of a pulse.
Edges Polarity
■
Positive
■
Negative
Options Units
Ref Level
Hysteresis
Global Coupling
BW Limit
Cursor Gating
Acquisition Mode
Advanced Power Analysis 33
Page 48

Advanced power measurement and analysis
Measurement SubType/Configurations Description
Period Is a trend plot of the variation of the period measured from a
leading edge to a leading edge or a trailing edge to a trailing
edge.
Edges Edge Type
■
Rise
■
Fall
Options Units
Ref Level
Hysteresis
Global Coupling
BW Limit
Cursor Gating
Acquisition Mode
Duty Cycle Measures the duty cycle of the waveform and is a trend plot. The
duty cycle can be a positive or a negative duty cycle.
Edges Edge Type
■
Rise
■
Fall
Polarity
■
Positive
■
Negative
Options Units
Ref Level
Hysteresis
Global Coupling
BW Limit
Cursor Gating
Acquisition Mode
Frequency Is a trend plot of the variation of the frequency of the signal.
Edges Edge Type
■
Rise
■
Fall
Options Units
Ref Level
Hysteresis
Global Coupling
BW Limit
Cursor Gating
Acquisition Mode
Time Analysis
34 Advanced Power Analysis
Page 49

Advanced power measurement and analysis
Measurement SubType/Configurations Description
Skew The Skew measurement calculates the difference in time
between the designated edge on a principle waveform to the
designated edge on another waveform.
Edges From Edge
■
Rise
■
Fall
■
Both
To Edge
■
Same as From
■
Inverse of From
Options Units
Ref Level
Hysteresis
Global Coupling
BW Limit
Cursor Gating
Acquisition Mode
Table of measurements
and configurations-
Magnetics
Measurement SubType /Configurations Description
Inductance Edges Edge Source
Options Units
Ref Level
Hysteresis
Global Coupling
BW Limit
Cursor Gating
Acquisition Mode
Advanced Power Analysis 35
Page 50

Advanced power measurement and analysis
Measurement SubType /Configurations Description
Magnetic Property Source Voltage Source
Freq and Duty
■
Fixed
■
Variable
Physical Chars1 Units
Cross Section Area
Magnetic Length
Physical Chars2 Primary Winding:
■
Single
■
Multiple
# of Turns (Primary Winding)
Secondary Windings:
■
# of Winding
■
Two
■
More
■
Magnetizing Current
■
Winding1 Source:
■
# of Turns
■
Winding 2 Source:
■
# of Turns
Options Units
Ref Level
Hysteresis
Global Coupling
BW Limit
Cursor Gating
Acquisition Mode
Magnetic Loss Global Coupling
BW Limit
Cursor Gating
Acquisition Mode
I vs ∫V Plots the integral of the voltage waveform and the current
waveform in a XY plot. Integral of V is proportional to B and the
current waveform I is proportional to H.
Global Coupling
BW Limit
Cursor Gating
Acquisition Mode
36 Advanced Power Analysis
Page 51

Advanced power measurement and analysis
Table of measurements
and configurations-Input
analysis
Measurement SubType / Configurations Description
Select input analysis
Power quality Measures the effects of distortions caused by nonlinear loads,
including the power supply itself.
Global Coupling
BW limit
Cursor gating
Acquisition mode
Current harmonics Captures the predefined limit values for the harmonics. This will
be used to compare the measured value of the harmonics.
Standard Type
■
61000-3-2
■
AM - 14
■
MIL 1399
Line Frequency
■
Auto: Calculates input
signal frequency
automatically.
■
50 Hz
■
60 Hz
■
Custom: User is allowed to
set the Line frequency in
range 1 Hz to 4000 Hz
using numerical keypad.
Harmonics Order
■
For 61000-3-2 and AM
14 type, range is 40 to
100 harmonics.
■
For MIL 1399, range is
50 to 100 harmonics.
I-Probe impedance Impedance table
Edit
Harmonics Class
Harmonic
Edit
Input power
Power factor
Filter check box
Fundamental current
Global Coupling
BW limit
Cursor gating
Acquisition mode
Advanced Power Analysis 37
Page 52

Advanced power measurement and analysis
Measurement SubType / Configurations Description
Voltage harmonics Captures the predefined limit values for the harmonics. This will
be used to compare the measured value of the harmonics.
Line Frequency
Global Coupling
■
Auto: Calculates input
signal frequency
automatically.
■
50 Hz
■
60 Hz
■
Custom: User is allowed to
set the Line frequency in
range 1 Hz to 4000 Hz
using numerical keypad.
BW limit
Cursor gating
Acquisition mode
38 Advanced Power Analysis
Page 53

Advanced power measurement and analysis
Measurement SubType /Configurations Description
Total Power Quality Measures and displays:
■
RMS value of the current and voltage
■
True power
■
Apparent power
■
Crest factor of current and voltage, Current harmonics
■
Reactive Power
■
Power factor
■
Total harmonic distortion
It is a combination of Power Quality and Current Harmonics
measurement.
Standard Type
■
61000-3-2
■
AM - 14
■
MIL 1399
Line Frequency
■
Auto: Calculates input
signal frequency
automatically.
■
50 Hz
■
60 Hz
■
Custom: User is allowed to
set the Line frequency in
range 1 Hz to 4000 Hz
using numerical keypad.
I Probe The impedance of the current
probe and the frequency can be
edited in this table and is used
to calculate the current
harmonics value. In the default
state, I-probe is not enabled.
Impedance table
Edit
Harmonics Table Class
Harmonic
Edit
Input Power
Power Factor
Filter check box
Fundamental Current
Global Coupling
BW Limit
Cursor Gating
Acquisition Mode
Advanced Power Analysis 39
Page 54
Advanced power measurement and analysis
Measurement SubType /Configurations Description
In Rush Current Measures both positive and negative peaks of inrush current for
a switching power supply during in-circuit operation.
Options Units
Ref Level
Hysteresis
Peak (Amps)
Global Coupling
BW Limit
Cursor Gating
Acquisition Mode
Input Capacitance Measures capacitance above Ref Level using input current and
voltage for switching power supply during in-circuit operation.
Options Units
Ref Level
Hysteresis
Peak (Amps)
Global Coupling
BW Limit
Cursor Gating
Acquisition Mode
Table of measurements
and configurations-Output
analysis
Measurement SubType /Configurations Description
Select Output Analysis
Line Ripple Measures the amount of AC-output signal related to the input line
frequency
Line Ripple Freq Measures the:
■
AC component voltage
present on a DC.
■
Low frequency AC voltage
in the peak-to-peak
voltage.
50 Hz
60 Hz
400 Hz
Global Coupling
Bandwidth Limit
Cursor Gating
Acquisition Mode
Switching Ripple Measures the maximum AC voltage present on a DC
Ripple Freq Switching Ripple Frequency
Global Coupling
BW Limit
Cursor Gating
Acquisition Mode
40 Advanced Power Analysis
Page 55

Advanced power measurement and analysis
Measurement SubType /Configurations Description
Select Spectral Analysis
Spectral Analysis Analyzes, measures and displays the frequency component in a
signal based on the selected Start, Stop and RBW values.
Spectral Config Frequency Start
Frequency Stop
Window Type
Res BW
Update
Auto Setup
DC Block
Log Results
Filter type (POE Specific
Filter) :
■
PoE 500 Hz
■
PoE 500 Hz-150 KHz
■
PoE 150 KHz-500 KHz
■
PoE 500 KHz- 1 MHz
Filter Source
Global Coupling
BW Limit
Cursor Gating
Acquisition Mode
Advanced Power Analysis 41
Page 56

Advanced power measurement and analysis
Measurement SubType /Configurations Description
Turn On Time Measures the time delay difference between the input voltage
applied to the system and the time to develop the steady state
output voltage.
Input Convertor
DC-DC
AC-DC
Frequency
Source
Maximum Voltage
Trigger Level
Max Turn on Time
Output Source1
On
Off
Max Voltage
Source2
On
Off
Max Voltage
Source3
On
Off
Max Voltage
Global Coupling
BW Limit
Cursor Gating
Acquisition Mode
Table of measurements
and configurations-
Amplitude
Measurement SubType /Configurations Description
High
Low
High-Low
Edge Measure the Center X% of the
signal
Methods
Options Units
Ref Level
Hysteresis
Global Coupling
BW Limit
Cursor Gating
Acquisition Mode
42 Advanced Power Analysis
Page 57
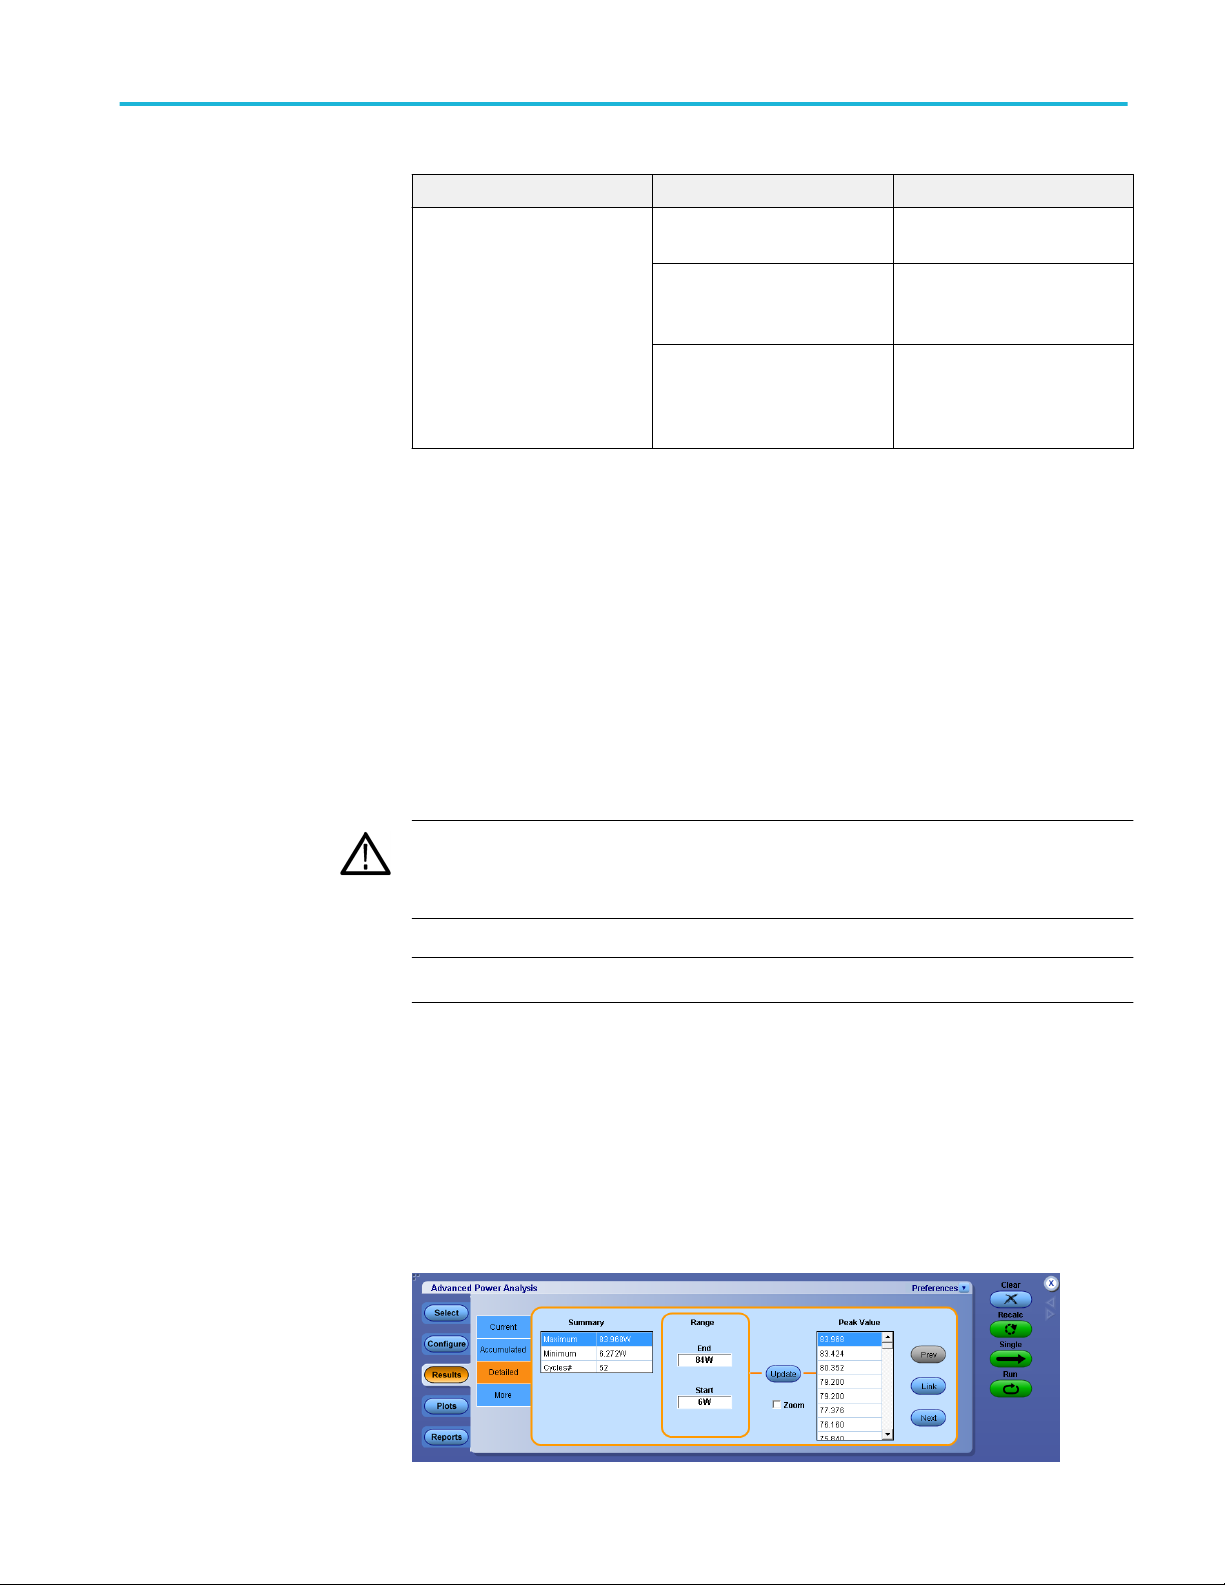
Advanced power measurement and analysis
Measurement SubType /Configurations Description
Cycle Min
Cycle Max
Cycle Pk-Pk
Signal Type AC
DC
Options Units
Ref Level
Hysteresis
Global Coupling
BW Limit
Cursor Gating
Acquisition Mode
Taking a new measurement
About taking
measurements
Viewing results
To take measurements:
1. Connect the required voltage and the current probe to the DUT.
2. Set the Current source and the Voltage source on the Source Configuration
panel.
3. Select and run the measurements to view the acquired waveform results. You
can also view the results in 2D plot format or save as report for later analysis.
WARNING.
When connecting to a circuit with hazardous voltages, see the
warnings for the individual products and verify that the probes and other
components used are within their ratings. Also refer to the for more information.
When you run any measurement, select Real Time Sampling Mode.
NOTE.
Summary result and detailed result are displayed for successfully completed
measurement. Select Results > Detailed to view detailed result. The details
displayed vary for the measurements.
Select the Detailed Results tab to view details of the results. Details vary
depending on the displayed measurements.
Advanced Power Analysis 43
Page 58

Advanced power measurement and analysis
Summary results can be current and accumulated. Current shows the results for
the current acquisition. Accumulated shows the statistics of all acquisitions
(previous and current). Select the Accumulated tab to view the summary of the
measurement.
The application displays the statistics for selected measurements in the results
menu. The statistics displayed are the following:
■
Max: The maximum value calculated using Max(X) = Most Positive Value
of X.
■
Min: The minimum value calculated using Min(X) = Most Negative Value
of X.
■
Mean: The mean value calculated using the following equation:
■
Std Dev The standard deviation value calculated using the following
equation:
■
Peak-Peak: . The peak to peak value calculated using the following
equation:
44 Advanced Power Analysis
Page 59

Advanced power measurement and analysis
■
Population. Population is the total number of events or observations over
which the other statistics were calculated. The Population (X) will represent
the number of cycles of the waveform, and for measurements where cycles
are not meaningful, Population shows as number of acquisitions.
■
Result. This field indicates whether the measurement is success or fail. If
there was any error during the analysis, then fail is displayed. When the
measurement is in RUN state, Not Available is displayed and changes to
Success or Failure depending on the measurement outcome.
NOTE. Modifying the configuration clears the previously calculated results in
table.
Select the More tab to view additional measurement results. The details displayed
vary for the measurements.
Plot components and
features
Use the plots menu bar to control plot details and features.
Menu item Description
Select X or Y or both axes to enable the zoom in and
zoom out of the selected axis.
Reset the plot window to the initial state.
Use hand option to pan the plot window and move around
the displayed waveform.
Moves the plot cursors to the center of the display area.
Advanced Power Analysis 45
Page 60

Advanced power measurement and analysis
Menu item Description
Set Plot cursors as horizontal, vertical, or both. Show
Legend will display the cursor position.
Connects the plot data points using linear interpolation.
Saves the plot image in .png format. The default directory
is C:\Users\<users>\Tektronix\TekApplications\Advanced
Power Analysis\Images\
Displays additional details about the plot like traversing
between peaks, different vertical scale.
If there is more than one plot, the Layout button is
enabled. Use the Summary Layout to arrange the plots
either horizontally or vertically. A maximum of 4 plots are
displayed at a time
Plot view. When you have multiple plots, select either a Grid and Flow view from
the Layout (multiple plots) view selector.
Multiple plot options.
Multiple plot options.
46 Advanced Power Analysis
Page 61

Advanced power measurement and analysis
Grid view. Multiple plots can viewed and compared simultaneously. Grid view is
recommended to view and compare plots side by side. By default Grid view is
selected. The number adjacent to Grid specify the number of plots to display side
by side for each row. The maximum number allowed is 4.
■
Grid 1 (1*1): Displays one plot in row.
■
Grid 2 (1*2): Displays two plots side by side in row.
■
Grid 3 (1*3): Displays three plots side by side in row.
Advanced Power Analysis 47
Page 62

Advanced power measurement and analysis
■
Grid 4 (1*4): Displays four plots side by side in row.
48 Advanced Power Analysis
Page 63

Advanced power measurement and analysis
Flow view. The plot window arranges plots based on the size. By default plots are
aligned in single row. You can adjust the size of the plot window to change the
configuration to see the selected plots. For example below Flow view displays
four plots arranged in single row (4*1). Flow view is useful to view one plot at a
time.
Flow view.
Advanced Power Analysis 49
Page 64

Advanced power measurement and analysis
50 Advanced Power Analysis
Page 65

Advanced power measurement and analysis
Flow view.
Viewing plots
Successful completion of measurements generate plots. Select Analysis >
Advanced Power Analysis, and then select the Plots navigation tab to configure
and view the plots for the selected measurements.
NOTE. A maximum of four plots can be added, and they are displayed in a single
window. Double-clicking the plot will toggle between full screen and compact
size. See Plot components and features for additional details.
Click Plot button to add the plot to the plots table. Click Clear button to remove
the selected plot and click Clear All to remove all plots from the table. Click
Show Plots button to display the plots.
A Magnetic BH Curve plot is shown in this example.
Advanced Power Analysis 51
Page 66

Advanced power measurement and analysis
Double click the plot to show added detailed results. Click a point on the plot to
show detail for that point.
NOTE. The plot operation may become slow with higher record length updates.
Do not perform any operation on the application user interface during record
length updates. During FREE RUN, the application uses large amount of plot
data for longer record lengths. To stop the FREE RUN, Click Stop on the RUN/
STOP button of the oscilloscope. Continue sequencing by pressing the RUN.
52 Advanced Power Analysis
Page 67

Advanced power measurement and analysis
Plot autoscale. By default, the plots will autoscale based on the selected mask
range. For example, if a mask violation happens, then only the region of violation
is shown when the plot is displayed. To view the complete data on the plot
window, click the Reset button in the plot tool box.
Figure 3: Plot with violation
Figure 4: Reset to get the complete rendering
NOTE. If there is no mask violation, then resetting will render the plot to complete
display area.
Advanced Power Analysis 53
Page 68

Advanced power measurement and analysis
Position cursors to center. This is used to position the cursors to center. The
close-up view of the waveform will make the cursor lines move out of the screen.
Position cursors to center helps to move the cursors to center of the display area.
Figure 5: Plot with cursor enabled
Reports
Figure 6: Plot cursors positioned to center
Successful completion of measurements generate reports. Select Reports to set up
and view the report.
54 Advanced Power Analysis
Page 69

Advanced power measurement and analysis
To design your report do the following steps:
1. In the Report Name pane, click browse, navigate to the directory and select
the report or double-click in the field, enter the path and the file name using
the pop-up keyboard.
2. Check the Auto increment report name if duplicate box to auto increment the
report name if its already exists. The auto generated report name is of
YYMMDD_HHMMSS_savedfile.mht format.
3. Check View report after generating to open the generated report.
4. In the Content To Save pane, check the items you want included in your
report.
■
Include results summary includes the results summary status in the
generated report.
■
Included detailed results includes the measurement result details in the
generated report.
■
Include plot images includes the plot images like measurement plots and
the oscilloscope waveform in the generated report.
■
Include user comments includes any comments in the generated report.
To add comments, click the Add Comment button.
■
Include setup configuration includes setup information like DPOPWR
version, oscilloscope version, and status in the generated report.
■
Include complete application configuration includes the complete
configuration details in the generated report.
5. Click the Append button to add the current settings to an existing report.
6. Click the Save or Save As buttons to save the report changes in the default
report directory. The report name is modified based on Auto increment report
name if duplicate option.
7. Click the View button to display the report. An example report is shown in
the following images.
Advanced Power Analysis 55
Page 70

Advanced power measurement and analysis
Figure 7: Report
Figure 8: Plot
Figure 9: Oscilloscope Waveform
56 Advanced Power Analysis
Page 71

Advanced power measurement and analysis
Selecting a measurement
To take a measurement, select Analyze > Advanced Power Analysis. The
application launches with the Select tab (default) displaying the category of
measurements.
There are six categories of measurements:
■
Switching analysis
■
Timing analysis
■
Magnetics
■
Input analysis
■
Output analysis
■
Amplitude
The measurements in each category are shown in the following table:
Switching
analysis
Switching Loss Pulse Width Inductance Power Quality Line Ripple High
Hi-Power
Finder
SOA Duty Cycle Magnetic
SOA X-Y
(DPX)
dv/dt Skew Input
di/dt Voltage
RDS(on)
Timing
analysis
Period Magnetic Loss Current
Frequency Ivs ∫V In Rush
Magnetics Input analysis Output
Harmonics
Total Power
Property
Quality
Current
Capacitance
Harmonics
Amplitude
analysis
Switching
Ripple
Spectral
Analysis
Turn-On Time Cycle Min
Cycle Max
Cycle Pk-Pk
Low
High Low
Select the measurements and configure the measurement settings, the waveform
source, and the probe settings. Click the Results tab for statistical results.
Advanced Power Analysis 57
Page 72

Advanced power measurement and analysis
Source configuration
Source configuration panel. The following image shows the source configuration
panel.
WARNING. When connecting to a circuit with hazardous voltages, see the
warnings for the individual products and verify that the probes and other
components are used within their ratings. Refer to the General Safety Summary.
Follow these steps to configure the options in the source configuration panel:
1. Select the Ref option to use a reference waveform of the oscilloscope. Select
the Ch option to acquire the waveform from the unit under test. The default
selection is Ch1.
■
If you select the Live source, the default Voltage source is Ch1 and the
Current source is Ch2. The available selections are: Ch1, Ch2, Ch3, Ch4,
Math1, Math2, Math3 and Math4. The Math selections are available only
if you select Live and not Ref channels. Use the buttons in the Voltage
and the Current field to select specific channels. Ripple supports REF.
Except for SOA X-Y( DPX) all measurements support both REF and
Live channels. You do not have the Math selections here.
58 Advanced Power Analysis
Page 73

Advanced power measurement and analysis
■
If you select the Ref option, the default Voltage source is Ref1 and the
Current source is Ref2. Use the buttons in the Voltage and the Current
field to select specific channels.
NOTE. When Math is chosen as a voltage source, it should be
independent of the selected math destination. The math destination is
defined with a predefined function only if the selected math destination is
independent of any selected measurement or any math definition. User
cannot select the same channel source in the Voltage and Current field.
Example: If you select Ch1 in the Voltage field and Ch1 in the Current
field and select Run, the application displays an error message "Conflict
in selection of voltage source and current source." The Voltage and
Current source selection is dependent on the measurement selected.
Double-click the Vg Level field and use the keypad that appears to enter the
values. The acceptable range of Vg values are 0 V to 50 V and the default
value is 1.5 V, if you have selected the Vg option in Source configuration
window. You can change the default value of the start of switch ON when
you select the gate voltage. The default value is 5% of the maximum of Vg or
1.5 V of Vg, whichever is lower.
2. Press the Vert Scale, Horiz Res, or Vert & Horiz buttons in the Source
Autoset panel to automatically set the scale and resolution to the best settings
for the measurement.
3. Press Undo in the Source Autoset panel to revert to the last autoset operation.
Advanced Power Analysis 59
Page 74

Advanced power measurement and analysis
Source autoset. Source Autoset automatically adjust the oscilloscope vertical and/
or horizontal settings according to the measurement group for the live sources
(Ch1-Ch4). The Source Autoset panel includes the following buttons:
■
Vert Scale
■
Horiz Res
■
Vert & Horiz
■
Undo
Clicking Vertical Scale automatically checks the peak-to-peak level of live
sources. The vertical scale and offset of the signals with peak-to-peak value less
than six divisions are adjusted to eight divisions. If the maximum or minimum
value of a signal is clipped, the vertical scale and offset are adjusted so that the
peak-to-peak value is eight or higher divisions. An error message is displayed
when clipping is detected.
Clicking the Horiz Res adjusts the time base for live channels so that at least
10 complete cycles for very low frequency (200 Hz) and more cycles for higher
signal frequencies are displayed. The measurements in Switching Loss,
Modulation Analysis and Magnetic Property set up the oscilloscope in similar
way. The measurements such as Spectral, Line Ripple, and Switching Ripple
under Input and Output Analysis set up differently, Since the horizontal time base
is set based on the Resolution Bandwidth (RBW) and ripple frequency.
Clicking Vert & Horiz defines the vertical and the horizontal settings for all
channel sources. It also applies autoset on each channel before performing the
vertical scale and horizontal resolution autoset.
60 Advanced Power Analysis
Page 75

Advanced power measurement and analysis
NOTE. Autoset accounts for the deskew value. If the deskew value is less than the
sample interval set by autoset, then the deskew value is rounded to 0.0 s by the
oscilloscope. This can be seen in the Vertical >Deskew menu. In this situation, it
is recommended that you use a higher sample rate.
Selecting and configuring
measurements
1. From the oscilloscope menu bar, select Analyze > Advanced Power Analysis.
The application launches with the Select tab (default) displaying the category
of measurements.
2. Click SOA in Switching Analysis tab.
Follow the steps to use the SOA Mask Editor:
1. Select the Enable check box in the Mask pane to apply the mask to the SOA
plot.
2. Double-click the Mask X and Mask Y fields and use the keypad that appears
to set the XY coordinates of mask values.
■
Click the Add button to add the mask values as a new mask point.
■
Click the Update button to update the selected mask point with the new
mask values.
■
Click the Recall button to retrieve a saved mask from the default
directory or the directory where you have saved the mask.
Advanced Power Analysis 61
Page 76

Advanced power measurement and analysis
3. Click the Graph button to preview the mask.
4. Configure SOA and click Run to display the SOA Plot with the mask in the
background.
62 Advanced Power Analysis
Page 77

Advanced power measurement and analysis
5. Select scale as Log and follow steps 1 to 4 to generate a mask for log.
6. Click the Save button to save the mask in .msk file. The default directory is
C:\User\Public\Tektronix\TekApplications\Advanced Power Analysis\SOA
Mask\. The SOA plot displays the Pass/Fail region in different colors.
7. Mask can be created graphically by clicking Graph button or by entering
coordinates in the mask editor.
In Graph mode, you can construct the graph by free hand drawing using
mouse clicks. Once the drawing is completed click Apply.
Advanced Power Analysis 63
Page 78

Advanced power measurement and analysis
8. Click the close button and you can observe the mask editor is filled with
mask points which are from the Graph.
9. You can switch between Log and Linear Mask creation, by selecting the
appropriate buttons.
You can set the Mask Values and define a mask. Select the Clear button to
remove the selected mask point, select the Clear All button to remove all mask
points.
Configuring global
settings
The Global tab settings apply to all measurements.
In the Global tab make the following settings:
■
Set the coupling: AC or DC.
■
Select the bandwidth limit from the Bandwidth limit pane: 20 MHz,
250 MHz or the Full option. The Full option refers to the maximum
bandwidth available in an oscilloscope. These options may not be available
on all supported oscilloscopes. Please refer to your oscilloscope bandwidth
options.
■
Turn cursor gating On or Off: Select On to enable gated measurement to
analyze a specific section of the waveform. When you enable Cursor Gating
and then click Run or Single, the application displays a message “Place the
cursors at the appropriate region of the waveform". Position the cursor as
required. If you select Yes, the application analyzes and plots the time trend
of the selected section of the waveform between the cursors.
■
Select the acquisition mode: Hi Res, Average, or Sample mode. When
average mode is selected, you can change the average value (in the
oscilloscope Horizontal acquisition menu). By default the average value is set
to 16.
64 Advanced Power Analysis
Page 79

Advanced power measurement and analysis
Configuring options
To set the Units, Ref Level, Hysteresis, Log Switching Cycles, Signal Condition,
and Filter Current, select the Options tab.
1. Enable the Signal Condition option. If you enable the Signal Condition
option, the application resets the switch current to zero after the switch OFF
to the next switch ON. If you select the Filter Current option, the switch
current has ringing at the low levels during switch ON.
2. Enable the Filter Current option. If you select the Filter Current option, the
switch current has ringing at the low levels during switch ON. The default
value is 5% of the maximum of Vg or 1.5 V of Vg, whichever is lower.
3. Enable the Log Switching cycles to log the switching cycles in a .csv file.
Configuring edges
4. Select the Percentage option in the Units drop-down menu to set the Ref
Level, Hysteresis, V-Level, and I-Level values as a percentage or the
Absolute option to set the absolute value of the peak-to-peak signal.
5. Double-click the Ref Level field and use the keypad that appears to set the
absolute or the percentage of the ref level value.
6. Double-click the Hysteresis field and use the keypad that appears to set the
absolute or the percentage of the hysteresis value.
To set the edge polarity, select the Edges tab and select either Positive or
Negative polarity.
Advanced Power Analysis 65
Page 80

Advanced power measurement and analysis
Control panel
The Control Panel appears on the right of the application window. Using this
panel, you can start or stop the sequence of processes for the application and the
oscilloscope to acquire information from the waveform.
The control panel includes Show Plots when a plot is selected:
The following list describes each of these controls:
■
Clear clears the current result display and resets any statistical results and
autoset ref levels
■
Recalc runs the selected measurements on the current acquisition
■
Single initiates a new acquisition and runs the selected measurements
■
Run initiates a new acquisition and runs the selected measurements
repeatedly until Stop is clicked. Run is used only for live sources
■
Show Plots displays the plot summary window. This button appears in the
control panel only when a plot is selected
66 Advanced Power Analysis
Page 81

Advanced power measurement and analysis
Switching measurement and analysis
Switching loss
Selecting and configuring measurements-Switching loss.
1. From the oscilloscope menu bar, Select Analyze > Advanced Power
Analysis, and then press the Select navigation tab to display the default
screen.
2. Click Switching Analysis to display the Switching Analysis screen.
3. Click Switching Loss in the Switching Analysis pane. Click Configure.
NOTE. Perform vertical and horizontal source Autoset for optimal signals.
NOTE. We recommend you to use the Hi-Res acquisition mode to analyze
switching loss.
1. The Switching Loss option calculates the amount of power dissipated across
the switching device under the steady state of operation. The results vary
according to the selected measurement.
2. Configure the parameters by clicking the Type, On-Off Level, Options, and
Global tabs.
Switching loss
Advanced Power Analysis 67
Page 82

Advanced power measurement and analysis
Switching loss edge source.
In the Edge Source pane, follow the steps given to configure the Switching Loss
Control Signal parameters:
1. The Edge Source is the Voltage source configured in the Source
Configuration Panel.
The application identifies:
■
The edges on the switch voltage
■
The Switch On and Switch Off portions using the switch voltage and
switch current
2. Select the Percentage option in the Units drop-down menu to set the Ref
Level and Hysteresis values as a percentage or the Absolute option to set the
absolute value of the peak-to-peak signal.
3. Double-click the Ref Level field and use the keypad that appears to set the
absolute or the percentage of the ref level value or double-click the
Hysteresis field and use the keypad that appears to set the absolute or the
percentage of the hysteresis value.
If the measurement is successful, the application automatically displays the
results.
68 Advanced Power Analysis
Page 83

Advanced power measurement and analysis
Switching loss type. In the Type tab, use the following steps to configure the
Switching Loss parameters:
1. In the Device pane, click the User button to enable the switching device type
options. Select either the MOSFET or the BJT / GBT switching device. If
you select MOSFET, double-click the RDS field and use the keypad that
appears to enter the RDS value that is available in the data sheet, for the
specified temperature of operation. If you select the Auto button, the
application calculates the total power loss and energy using the switch
voltage and current and checks for the vertical scale of the switch voltage. If
the switch voltage scale is greater than ten volts per division, the application
displays a warning message: "Vertical Scale of Switch Voltage > 10 V and
the user defined RDSon is not selected. So the calculated energy and loss
may not be accurate."
When PFC is selected, application sets up the oscilloscope to acquire at least
20 milliseconds duration or at least two cycles of line frequency (50 or
60 Hz). For more details about PFC type, Click here
If the measurement is successful, the application automatically displays the
results.
NOTE. When PFC type is selected, it turns ON the Cursor gating. When PFC type
is unchecked, the cursors will retain the previous state. Users can use Global
configuration to control the cursors ON and OFF.
Advanced Power Analysis 69
Page 84

Advanced power measurement and analysis
Switching loss TOn and TOff ref levels. In the TOn and TOff Levels pane, follow
the steps to configure the Switching Loss TOn and TOff RefLevel (V-level and Ilevel) parameters:
1. Select the semiconductor type (DUT) from the Device drop-down menu. The
available options are: N-Channel and P-Channel. In an N-Channel device, the
Switch Voltage, Switch Current and the Gate Voltage are positive. In a PChannel device, the Gate Voltage can either be positive and negative or only
negative.
2. Select the Percentage option in the Units drop-down menu to set the Ref
Level and Hysteresis values as a percentage or the Absolute option to set the
absolute value of the peak-to-peak signal.
3. Double-click the V-Level field and use the keypad that appears to set the
absolute or the percentage of the V-level value. The V-Level value for the
Start of TOn is five percent of the switch current and for Stop of TOn is five
percent of the maximum switch voltage.
4. Double-click the I-Level field and use the keypad that appears to set the
absolute value or the percentage of the I-level value.
5. Select the math destination from the drop-down menu. The default
destination is Math1.
NOTE. When switching current or voltage amplitude varies in an envelope shape.
The TOn and TOff levels should be in Absolute Units for accurate results.
If the measurement is successful, the application automatically displays the
results.
70 Advanced Power Analysis
Page 85
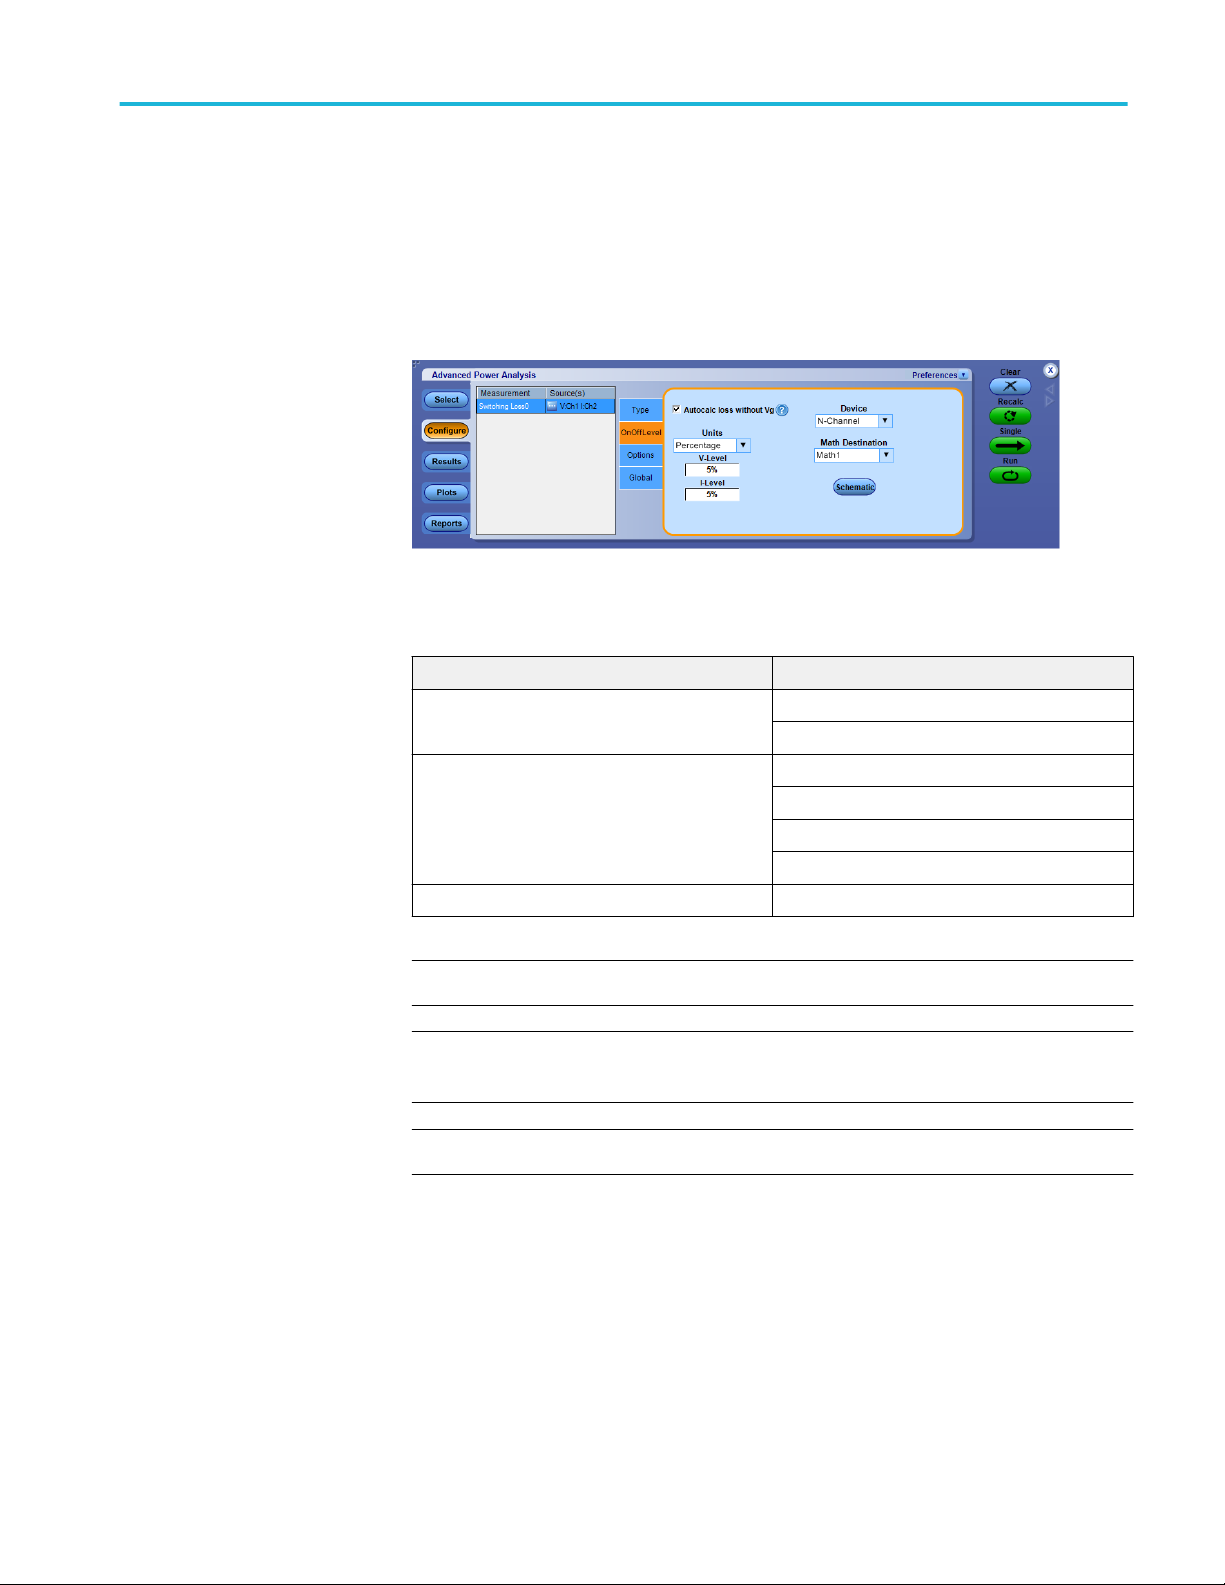
Advanced power measurement and analysis
Switching loss - Autocalc loss without Vg. Select Autocalc loss without Vg for
automatic computation of switching loss without using gate voltage source. User
can configure V-Level and I-Level in OnOffLevel tab (percentage units) to define
the start and stop of loss regions. The V and I levels is updated in Absolute Units
and Optimal Reflevel in Options tab, after the Run.
Table 1: Settings disabled when Autocalc loss without Vg is selected
Configuration tab Settings
OnOffLevel V-Level when Units is Absolute
I-Level when Units is Absolute
Options Units
Edge RefLevel
Filter Current
Signal Condition
Type PFC Type
NOTE. Make sure the record length is 10K, having 10 switching cycles.
NOTE. Gate Voltage(Vg) in source configuration is disabled when Autocalc is
selected.
NOTE. This method is not recommended for PFC type.
This method is recommended, when switching voltage is ringing in nature and
switching current has spikes. However when both voltage and current have very
bad ringing as shown in the following figure, then it is suggested to use gate
voltage source for correct results.
Advanced Power Analysis 71
Page 86
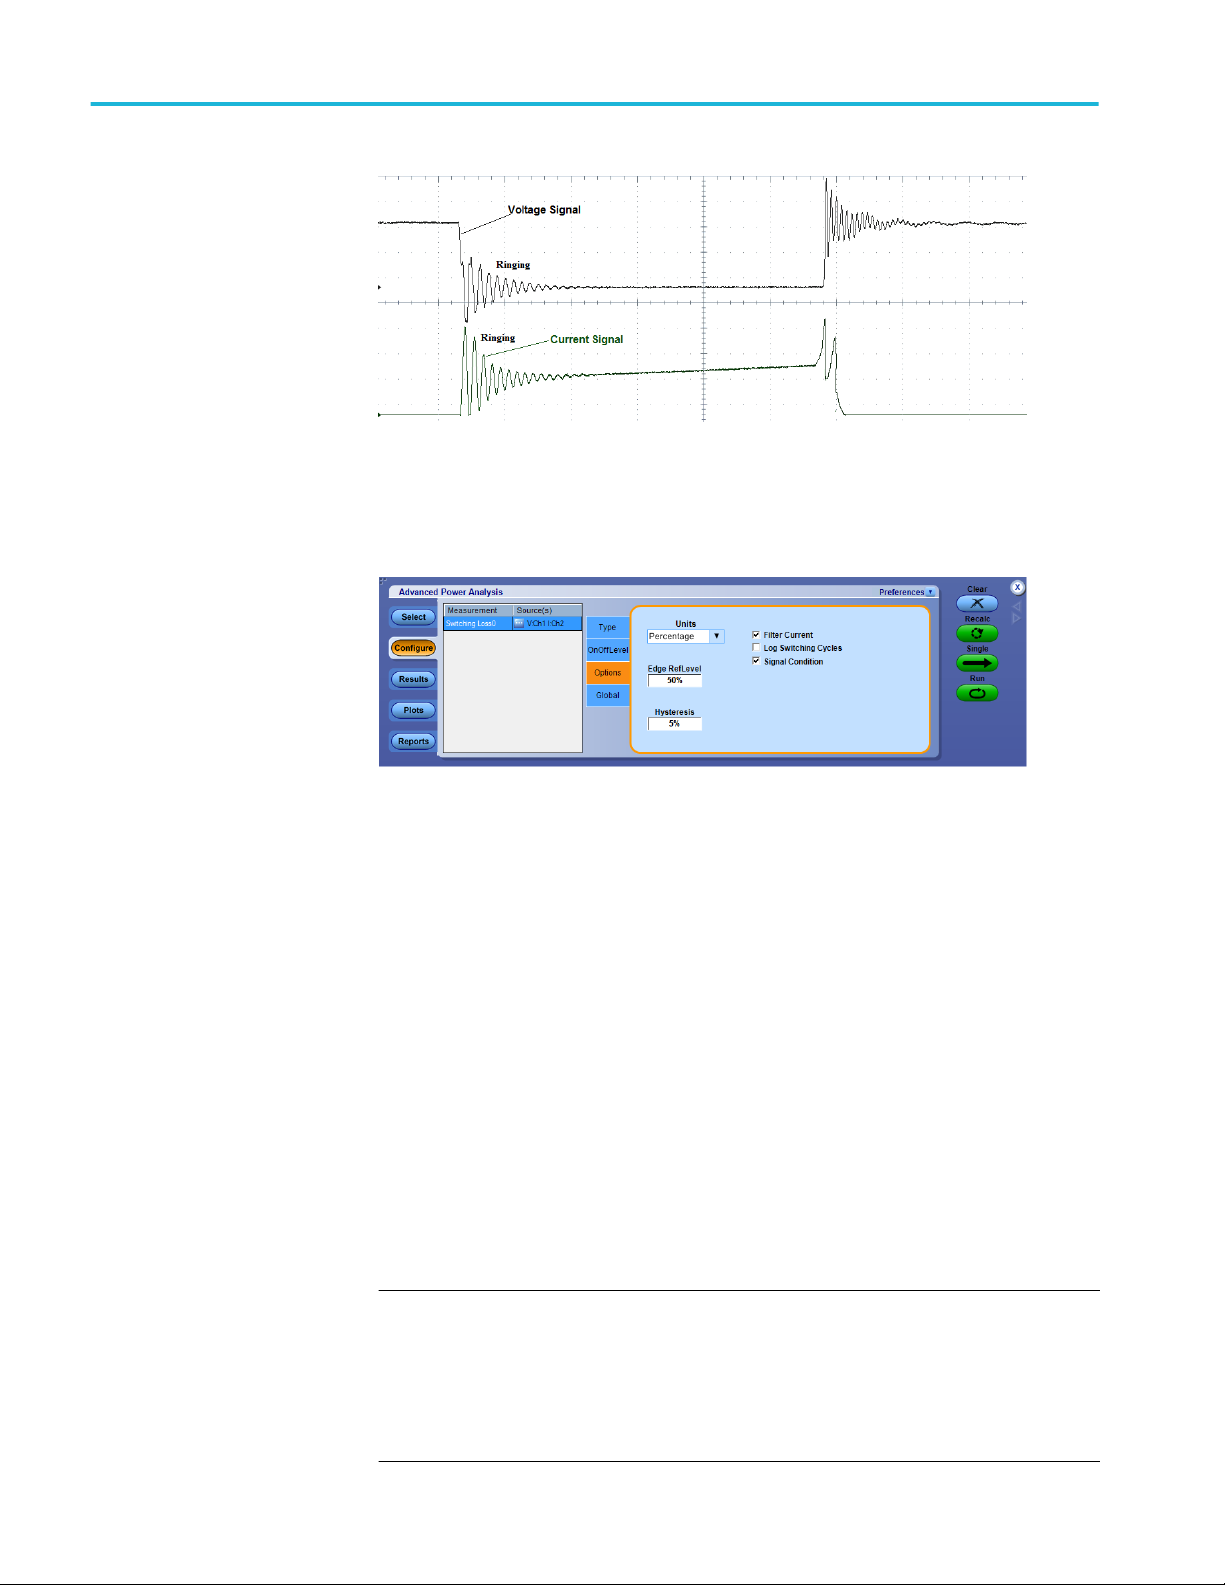
Advanced power measurement and analysis
Switching loss options. In the Options tab, follow the steps to configure the
Switching Loss Options parameters:
1. If current signal has ringing at low level during Switch-ON, enable the Signal
Condition and Filter Current Options. The default value is 5% of the
maximum of Vg or 1.5 V of Vg, whichever is lower.
2. Select the Percentage option in the Units drop-down menu to set the Ref
Level and Hysteresis values as a percentage or the Absolute option to set the
absolute value of the peak-to-peak signal.
3. Double-click the Ref Level field and use the keypad that appears to set the
absolute or the percentage of the ref level value.
4. Double-click the Hysteresis field and use the keypad that appears to set the
absolute or the percentage of the hysteresis value.
5. To globally set the coupling, bandwidth limit, cursor gating, and acquisition
mode, see Configuring global settings.
6. Press Run to acquire the data.
If the measurement is successful, the application automatically displays the
results.
NOTE.
■
It is not recommend to use cursor position in SW Cycle in case of noisy VG
source and plot may not place the cursors properly.
■
It is recommend for Switching loss measurement for PFC and other
topologies to have at least 10 complete switching cycles to measure properly.
72 Advanced Power Analysis
Page 87
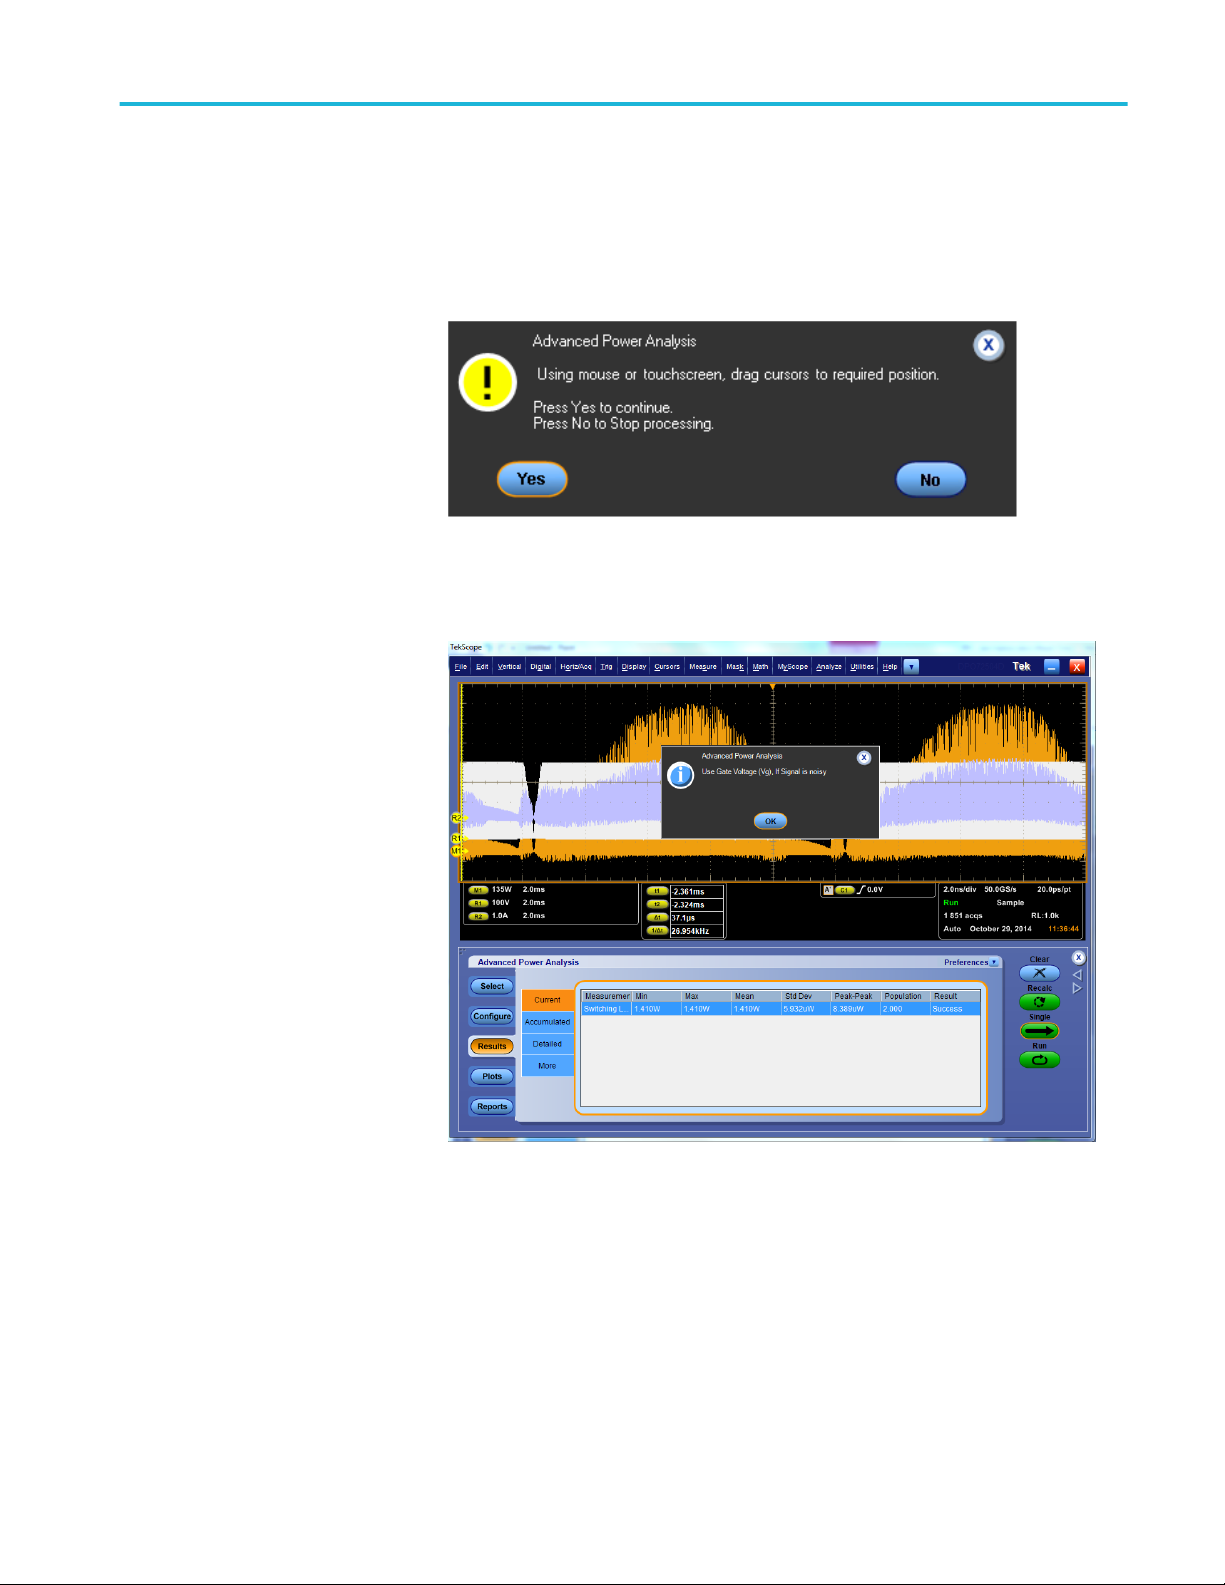
Advanced power measurement and analysis
Switching loss - PFC. This section describes the flow when you run the
measurement with PFC selected.
1. Application allows you to place cursors for region of interest.
2. It suggests using gate voltage for PFC signals.
Advanced Power Analysis 73
Page 88
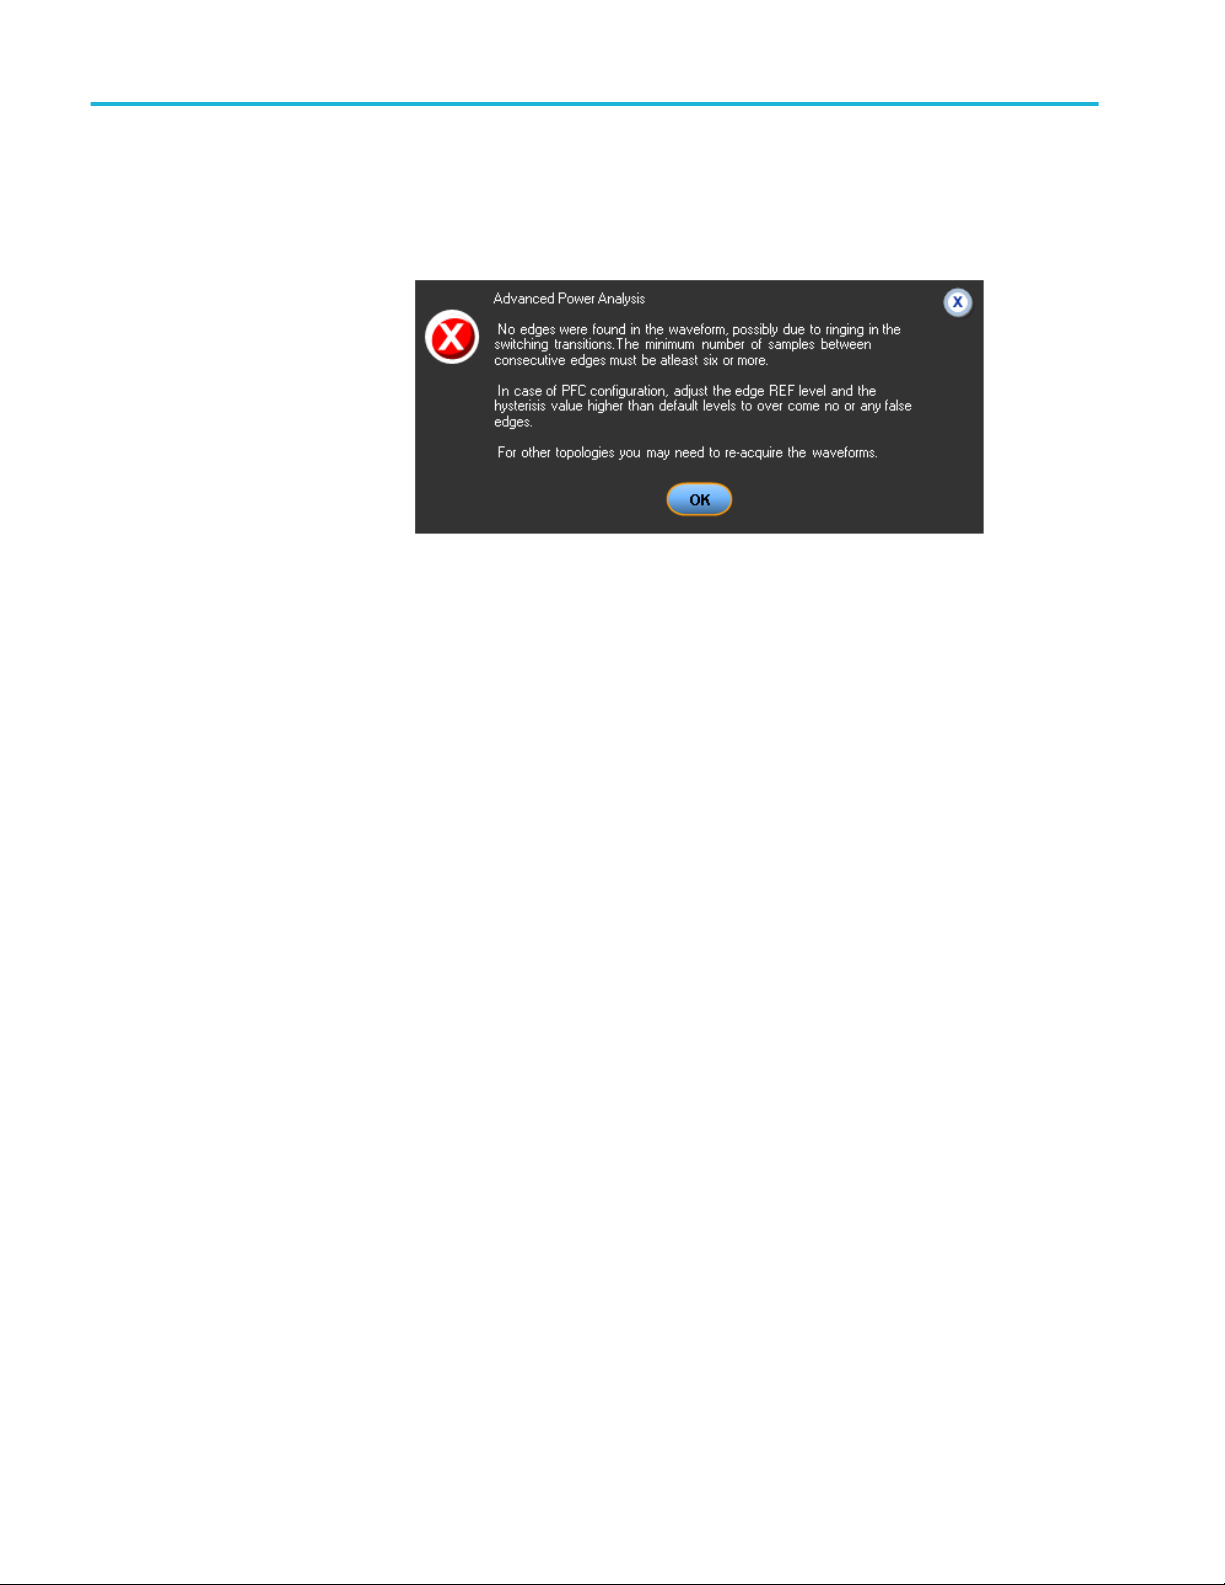
Advanced power measurement and analysis
3. If the application detects ringing with Vg and pops up error message, then
adjust REF level as described in REF level computation for noisy VG source.
4. By observation Switch voltage is good, so change to Vds and then run the
measurement.
74 Advanced Power Analysis
Page 89

Advanced power measurement and analysis
Switching Loss PFC - Cursor gating. Cursor gating is used to ensure that the
switching loss measurements represent the losses across all of the switching
cycles within an integer number of line-voltage-half-cycles, usually one halfcycle of line period frequency. For AC/DC switching power supply, designers
design heat sink to remove all heat energy dissipated by the device under steady
state operation. This dissipated heat is proportional to the measured loss across
the device. During initial phase, the current will be very low and the switching
voltage is in DC mode. So the average loss is measured for region of interest that
is for one line period of the acquired waveform.
The cursors should be placed near the zero crossings of the line voltage such that
time duration of half cycle of 50/60 Hz is covered. Place the cursors, by zooming
the switching waveforms and observe where the current goes to zero. By placing
the cursors near the zero crossing of the line voltage, the exact cursor placement
is less critical because the switching losses are lowest around the line voltage
zero crossings, and any measurement errors are minimized. You can make sure
half a cycle region of 100/120 Hz between the cursors.
Switching waveforms where the current goes to zero
Switching waveforms with cursors near zero crossing
It is recommended to use gate voltage as edge source in case of PFC topology for
post-processing. The switch voltage can vary in duty cycle and operating
frequency as shown in the following image. The switch voltage can operate in
Advanced Power Analysis 75
Page 90

Advanced power measurement and analysis
both continuous conduction mode and discontinuous conduction modes, hence
switching cycle cannot be identified using the switch voltage. So the gate drive
signal is used to identify the correct switching cycles and also the gate voltage
will be a clean pulse and does not have ringing as it is from IC.
The following figure shows the duty and frequency variation. Ref1 is the switch
voltage captured across the switching device and Ref2 is the gate drive signal.
Ref1 goes into discontinuous conduction mode within the switching cycle.
76 Advanced Power Analysis
Page 91

Advanced power measurement and analysis
Viewing results-Switching loss. Do not disturb the oscilloscope settings during the
post analysis of the results. Changing settings will put the oscilloscope into
Preview mode. This could lead to incorrect interpretation of results.
Select Analyze > Advanced Power Analysis > Results, from the oscilloscope
menu bar, and then press Current for current results. Current results show
statistics of Total Average Loss values,
Select Analyze > Advanced Power Analysis > Results, from the oscilloscope
menu bar, and then press Detailed for detailed results. Detailed result shows
TON, TOFF and Conduction loss and energy statistics.
Advanced Power Analysis 77
Page 92

Advanced power measurement and analysis
The application displays the results for the Switching Loss measurement in two
panes: Power Loss and Energy.
1. In the Power Loss column, the Min field displays the minimum loss in the
acquisition in Watts. The Max displays the maximum loss in the acquisition
in Watts. The Average Loss is the sum of TOn average, TOff average and the
Conduction Loss.
2. In the Energy column, the Min field displays the minimum of all the energy
values calculated for each cycle. The Max field displays the maximum of all
the energy values calculated for each cycle in Watts. The Average energy
displays the sum of TOn energy, TOff energy and the Conduction energy in
Joules.
NOTE. Total Avg in the Detailed result tab includes conduction loss and is
computed result for entire acquisition.
NOTE. Negative switching loss results may be due to the DC offset in the voltage
and current probes used. To avoid this, compensate the probes for DC offset and
also run Signal Path Compensation option (SPC) on the oscilloscope before
starting the application. Make sure to use only DC coupling.
NOTE. Gate voltage is recommended as edge source for PFC and topologies such
as Flyback technologies as application is not able to compute edges on Switching
Voltage and Current waveforms due to ringing which leads to false edges.
78 Advanced Power Analysis
Page 93

Advanced power measurement and analysis
NOTE. The TOn and TOff definitions for switching loss measurements when gate
voltage is selected are as follows:
■
TOn is defined as the time from the gating signal turns on to the time that the
switching device turns on.
■
TOff is defined as the time from the gating signal turns off to the time that the
switching device turns off.
Switching loss plots. If the Switching ON OFF plot is selected, click Show Plots
to display the plot.
The Plot View allows you to view the plots for all cycle and single cycle based
table values.
■
All SW Cycles: Displays the plots for all cycle table values.
■
SW Cycle: Displays the plots for the selected Cursor Position:
■
Cycle: The selected switching cycle is zoomed and the scope cursors are
placed between start of Turn-on and stop of Turn-off.
Switching Loss plot when Cursor Position > Cycle is selected
Advanced Power Analysis 79
Page 94

Advanced power measurement and analysis
■
OnLoss: The selected switching cycle Turn-on loss is zoomed and the
scope cursors are placed between start and stop of Turn-on loss region. .
Switching Loss plot when Cursor Position > OnLoss is selected
■
OffLoss: The selected switching cycle Turn-off loss is zoomed and the
scope cursors are placed between start and stop of Turn-off loss region. .
Switching Loss plot when Cursor Position > OffLoss is selected
80 Advanced Power Analysis
Page 95

Advanced power measurement and analysis
■
ConductionLoss: The selected switching cycle conduction Loss is
zoomed and the scope cursors are placed between stop of Turn-on and
start of Turn-off. .
Switching Loss plot when Cursor Position > ConductionLoss is
selected
Advanced Power Analysis 81
Page 96

Advanced power measurement and analysis
NOTE. The Plot View and the Marker Value table for Switching loss plots is
displayed in Details view.
NOTE. Sometimes plot view for selected cycles show either ON or OFF region
only. This happens with PFC waveforms when you select 50 / 60Hz region. Load
PFC waveforms, and select cursors at 120Hz region, RUN the measurement, to
get plot and results. I n plot view to individual cycles, observe that only OFF
cycle is present since there is no ON loss or zero ON loss on the time domain
waveform or vice versa. So you will not see ON-OFF pair in the plot.
See also.
Selecting and configuring measurements-Switching loss
Plot components and features
82 Advanced Power Analysis
Page 97
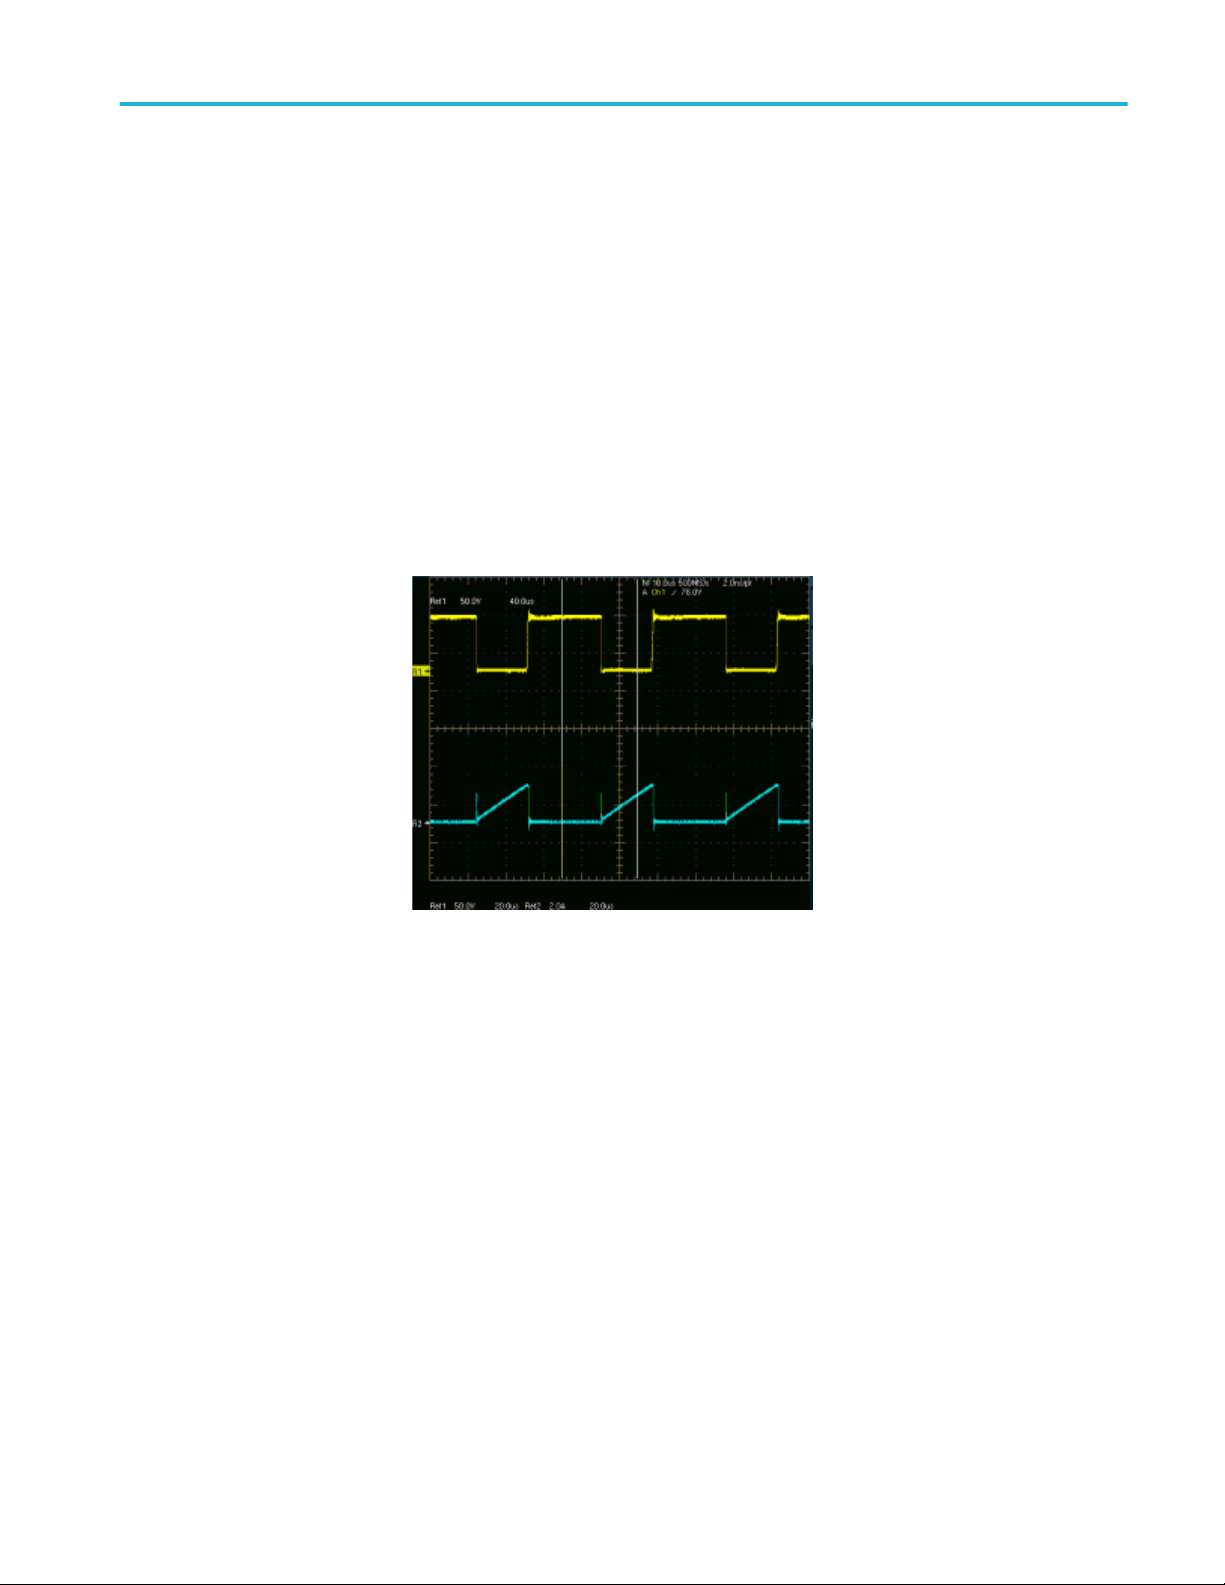
Advanced power measurement and analysis
Troubleshooting switching loss results.
The figure on the left shows the current waveform of a switching device. The
figure on the right shows the zoomed signal. During Turn On of the switch
current, a spike occurs as shown in the previous figures. If you configure the Ivalue in the TOn and TOff tab to 5 %, during analysis, the application converts
the 5% value to the absolute as the product of (5/100) and maximum of the
switch current. The maximum of the switch current indicates the spike in the
signal. This is valid only during TOn. The calculated maximum switch current
value is used to identify the stop of Turn Off. Since you are using the maximum
spike values to calculate TOn and TOff, the stop of TOn value is inaccurate. To
overcome this, enter the reference value only in Absolute units.
What do you do when you get zero values in the switching loss results?
■
When you clear the Filter Current check box in the Options tab, and the
switching current waveform is similar to the one in the previous figure, the
application finds the start of Ton from the cursor 2 position. The algorithm
searches from the cursor 2 position for the configured level and logs on to the
first level. In this case, the start of TOn is calculated after the stop of Ton and
the energy and loss is zero.
■
When the configured I-level is out of the signal range, the TOn and TOff
energy and the loss is zero, the application displays a warning message.
Advanced Power Analysis 83
Page 98
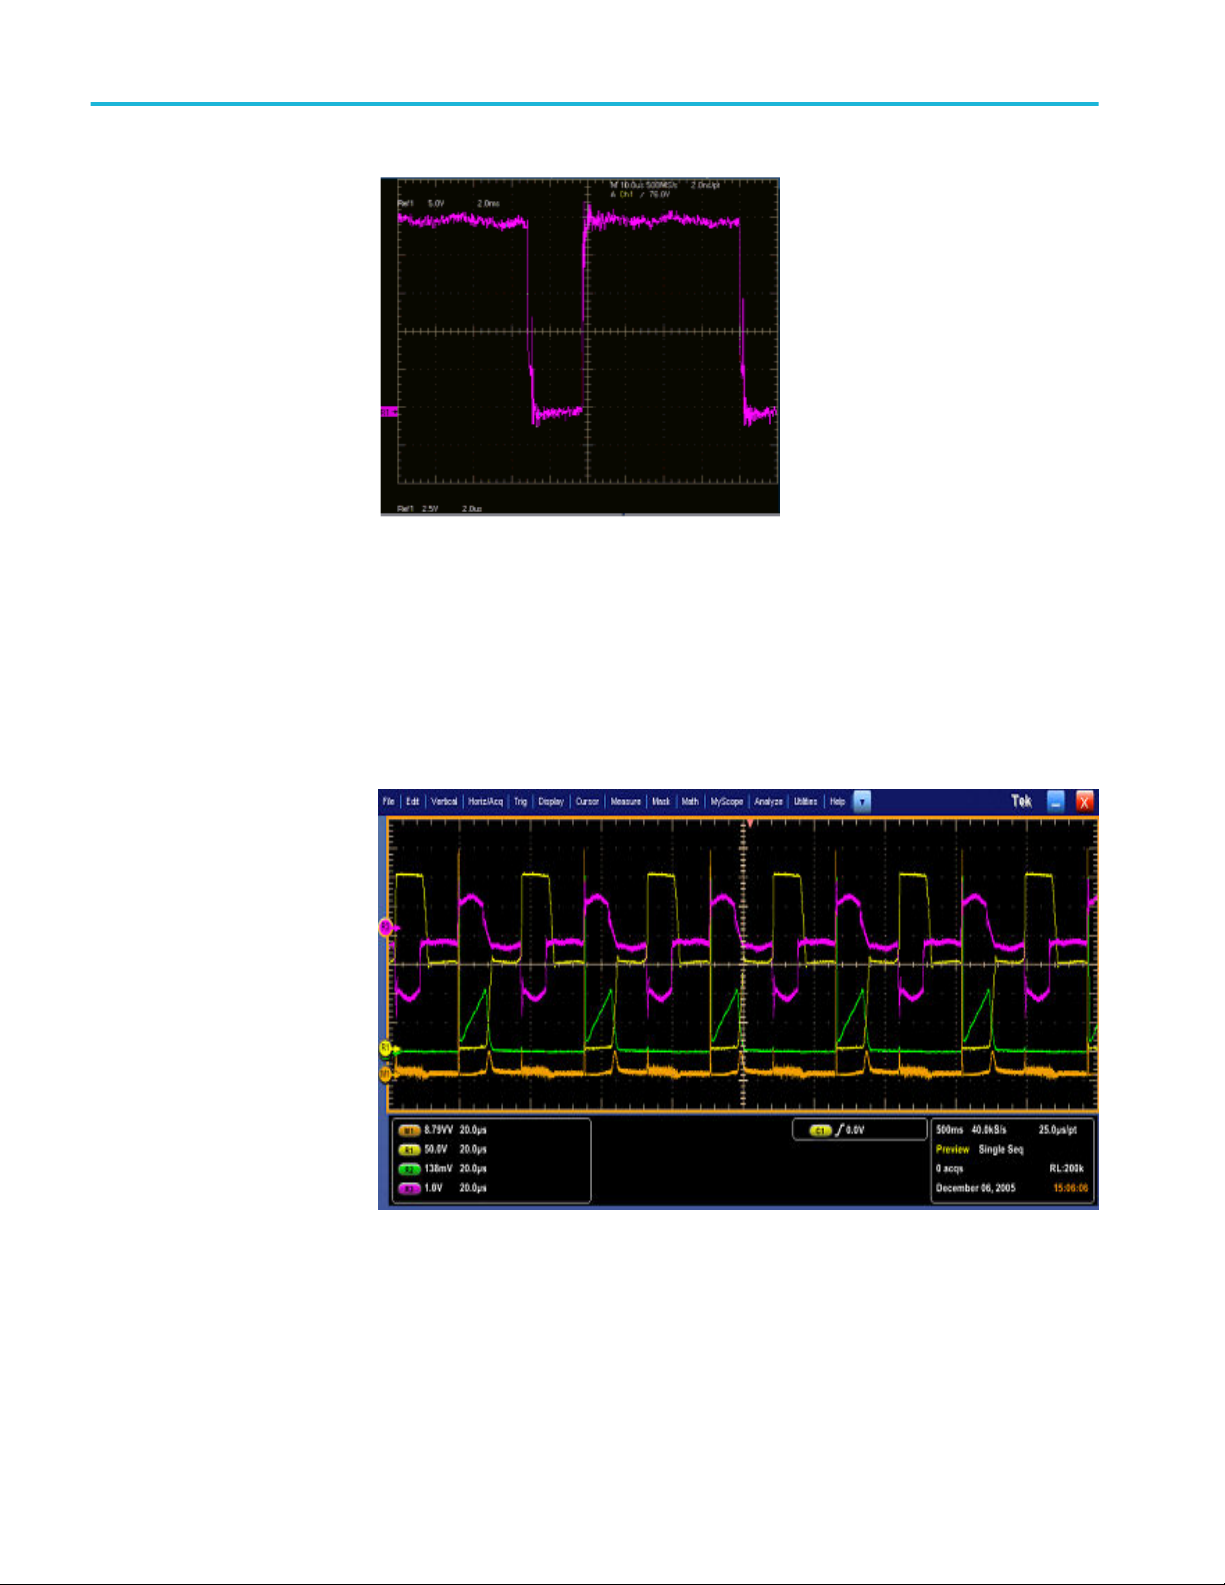
Advanced power measurement and analysis
■
If you select the Vg option button in the Edge Finder tab, the gate voltage
should be a clean pulse without any glitch or ringing as shown in the
previous figure. The gate voltage is used to identify the edges, TOn or TOff
portions. When a glitch occurs, the application displays incorrect results. This
type of signal can result in multiple edges (wrong edges) within a switching
cycle.
If the signal (Push Pull device) is similar to the one shown in the previous
figures, configure the Ref level only at the switching portion of the voltage. The
switching occurs only at the lower portion of the switch voltage. Enter the Ref
value as 30% which falls midway between the lower switching portion.
If you have selected the P-channel device, the switching voltage and current is
negative and the gate voltage is negative or positive and negative. The
application inverts the waveform and analyzes it like the one on an N-channel
84 Advanced Power Analysis
Page 99

Advanced power measurement and analysis
device. Select the Vertical Setup > Invert option in the oscilloscope menu to
invert the switch voltage, current, gate, and set the device to N-channel.
Hi-Power finder
Selecting and configuring measurements-Hi-Power finder.
1. From the oscilloscope menu bar, Select Analyze > Advanced Power
Analysis, and then press the Select navigation tab to display the default
screen.
2. Click Switching Analysis to display the switching analysis measurements
screen.
3. Click Hi-Power Finder in the Switching analysis pane. Hi-Power Finder
calculates the instantaneous peak power on the switching waveform. The
results vary according to the selected measurement.
4. Click Configure. You can configure the parameters by clicking the PWM
Type, On-Off Level, Edges, and Global tabs.
NOTE. The waveform height should be >8 divisions, which is possible by using
vertical Autoset, divisions to take the measurements. It is recommend that you use
the Hi-Res acquisition mode to analyze Hi-Power Finder.
Hi-Power finder.
Hi-Power finder edge source.
Follow the steps given below to configure the Hi-Power finder parameters in the
Edge Source pane:
1. The Edge Source is the Voltage source configured in the Source Selection
Panel.
The application identifies:
■
The edges on the switch voltage
■
The Switch On and Switch Off portions using the switch voltage and
switch current
2. Select the Percentage option in the Units drop-down box to set the Ref Level
and Hysteresis values as a percentage or the Absolute option to set the
absolute value of the peak-to-peak signal.
3. Double-click the Ref Level field and use the keypad that appears to set the
absolute or the percentage of the ref level value or double-click the
Hysteresis field and use the keypad that appears to set the absolute or the
percentage of the hysteresis value.
If the measurement is successful, the application automatically displays the
results.
Advanced Power Analysis 85
Page 100

Advanced power measurement and analysis
Hi-Power finder type. Follow the steps given below to configure the Hi-Power
Finder parameters in the Type tab:
1. Click the Variable button if a switching device operates with a variable Duty
Cycle with or without Discontinuous Conduction Mode. If the Variable
option is selected, the voltage edge source selection in the On-Off Level tab
switches to Vg (gate drive signal). If the Fixed option is selected, the
application measures the switching loss for all the topologies with a constant
duty cycle.
If the measurement is successful, the application automatically displays the
results.
86 Advanced Power Analysis
 Loading...