

Page 1

DPOJET
Jitter
, Noise and Eye Diagram Analysis Solution
Application Help
*P077004831*
077-0048-31
Page 2

Page 3

DPOJET
Jitter
, Noise and Eye Diagram Analysis Solution
Application Help
Register now!
Click the following link to protect your product.
www.tek.com/register
*P077004831*
077-0048-31
Page 4

Copyright © Tektronix. All rights reserved. Licensed software products are owned by Tektronix or its subsidiaries or suppliers, and are
protected by national copyright laws and international treaty provisions. T
and pending. Information in this publication supersedes that in all previously published material. Specifications and price change privileges
reserved.
TEKTRONIX and TEK are registered trademarks of Tektronix, Inc.
Tektronix, Inc.
14150 SW Karl Braun Drive
P.O. Box 500
Beaverton, OR 97077
USA
For product information, sales, service, and technical support:
• In North America, call 1-800-833-9200.
• Worldwide, visit www.tek.com to find contacts in your area.
ektronix products are covered by U.S. and foreign patents, issued
Page 5

Table of Contents
Table of Contents
List of Figures..............................................................................................................................................................................20
List of Tables............................................................................................................................................................................... 27
Welcome..................................................................................................................................................................................... 33
Introduction to the application..................................................................................................................................................... 34
Related documentation........................................................................................................................................................ 34
Conventions......................................................................................................................................................................... 34
Technical support................................................................................................................................................................. 35
Customer feedback..............................................................................................................................................................35
Getting started.............................................................................................................................................................................37
Product description.............................................................................................................................................................. 37
DPOJET option levels..........................................................................................................................................................37
Compatibility........................................................................................................................................................................ 38
Requirements and restrictions............................................................................................................................................. 38
Supported probes................................................................................................................................................................ 39
Installing the application.......................................................................................................................................................39
About DPOJET.................................................................................................................................................................... 40
Operating basics......................................................................................................................................................................... 41
About basic operations........................................................................................................................................................ 41
Starting the application................................................................................................................................................. 41
Application interface menu controls..............................................................................................................................41
Virtual keypad............................................................................................................................................................... 41
Tips on DPOJET user interface.................................................................................................................................... 42
Basic oscilloscope functions................................................................................................................................................ 42
Application directories...................................................................................................................................................42
File name extensions....................................................................................................................................................43
Application menu shortcuts...........................................................................................................................................44
Returning to the application.......................................................................................................................................... 45
Warning log notifiers..................................................................................................................................................... 45
Saving and recalling setups................................................................................................................................................. 46
Saving a setup.............................................................................................................................................................. 46
Recalling a saved setup................................................................................................................................................46
Recalling the default setup........................................................................................................................................... 46
Jitter, Noise and Eye Diagram Analysis...................................................................................................................................... 47
About Jitter, Noise and Eye-diagram analysis..................................................................................................................... 47
Setting up DPOJET to take measurements......................................................................................................................... 49
Setting up the application for analysis.......................................................................................................................... 49
Deskew for accurate measurement.............................................................................................................................. 50
Selecting a measurement............................................................................................................................................. 51
Table of measurements-Period/Freq.............................................................................................................................52
Table of measurements-Jitter........................................................................................................................................53
Table of measurements-Noise...................................................................................................................................... 55
Table of measurements-Time....................................................................................................................................... 57
Table of measurements-Eye......................................................................................................................................... 58
Table of measurements-Amplitude............................................................................................................................... 59
DPOJET Jitter, Noise and Eye Diagram Analysis Solution Application Help 5
Page 6

Table of Contents
Table of measurements-Standard.................................................................................................................................60
T
est point selection in the standard tab........................................................................................................................ 64
Configuring measurements..................................................................................................................................................65
About configuring a measurement................................................................................................................................65
General......................................................................................................................................................................... 66
Global........................................................................................................................................................................... 66
Filters............................................................................................................................................................................ 71
Clock recovery.............................................................................................................................................................. 76
Bit config....................................................................................................................................................................... 89
BER.............................................................................................................................................................................. 97
RJ-DJ............................................................................................................................................................................98
RN-DN........................................................................................................................................................................ 100
Bus state.....................................................................................................................................................................103
Custom gating.............................................................................................................................................................105
Edges..........................................................................................................................................................................106
SSC.............................................................................................................................................................................119
Margin.........................................................................................................................................................................120
DFE.............................................................................................................................................................................120
General configuration (DPOJET)....................................................................................................................................... 122
One touch jitter........................................................................................................................................................... 122
Serial Data/Jitter guide................................................................................................................................................124
Source configuration...................................................................................................................................................131
Preferences setup.......................................................................................................................................................147
Export data and measurement....................................................................................................................................153
Data logging................................................................................................................................................................157
Sequencing.................................................................................................................................................................166
Limits.......................................................................................................................................................................... 166
Measurement summary.............................................................................................................................................. 169
Results as statistics........................................................................................................................................................... 172
Viewing statistical results............................................................................................................................................172
Export results to ref waveform.................................................................................................................................... 175
Bit rate and pattern length detection...........................................................................................................................176
Result as plots................................................................................................................................................................... 177
About plots..................................................................................................................................................................177
Plot usage...................................................................................................................................................................179
Selecting plots............................................................................................................................................................ 181
Configuring plots.........................................................................................................................................................182
Viewing plots...............................................................................................................................................................199
Reports.............................................................................................................................................................................. 203
About reports.............................................................................................................................................................. 203
Tutorial...................................................................................................................................................................................... 208
Introduction to the tutorial.................................................................................................................................................. 208
Setting up the oscilloscope................................................................................................................................................ 208
Starting the application...................................................................................................................................................... 208
Waveform files................................................................................................................................................................... 208
Recalling a waveform file................................................................................................................................................... 208
Taking a period measurement............................................................................................................................................209
Taking a Gated skew measurement...................................................................................................................................210
Taking a TIE measurement................................................................................................................................................ 212
DPOJET Jitter, Noise and Eye Diagram Analysis Solution Application Help 6
Page 7

Table of Contents
Taking an eye height and width measurement...................................................................................................................213
Summary tutorial
................................................................................................................................................................214
Stopping the tutorial........................................................................................................................................................... 215
Returning to the tutorial......................................................................................................................................................215
Parameters................................................................................................................................................................................216
About parameters.............................................................................................................................................................. 216
Measurement select parameters....................................................................................................................................... 216
Autoset parameters............................................................................................................................................................217
Ref level menu parameters................................................................................................................................................217
Preferences parameters.................................................................................................................................................... 218
Deskew parameters........................................................................................................................................................... 219
Data logging parameters....................................................................................................................................................220
Control panel parameters.................................................................................................................................................. 221
Configure measurement parameters................................................................................................................................. 221
Bit config parameters..................................................................................................................................................221
BER parameters......................................................................................................................................................... 222
Edges parameters...................................................................................................................................................... 222
Clock recovery parameters.........................................................................................................................................225
SSC parameters......................................................................................................................................................... 228
RJ-DJ analysis parameters.........................................................................................................................................228
RN-DN analysis parameters....................................................................................................................................... 229
Filters parameters.......................................................................................................................................................230
Bus state.....................................................................................................................................................................230
General parameters....................................................................................................................................................231
Global parameters...................................................................................................................................................... 231
Margin parameters......................................................................................................................................................232
DFE parameters..........................................................................................................................................................232
Plots................................................................................................................................................................................... 233
Histogram plot parameters..........................................................................................................................................233
Eye diagram plot parameters......................................................................................................................................233
Spectrum plot parameters...........................................................................................................................................234
Time trend plot parameters.........................................................................................................................................234
Phase noise plot parameters...................................................................................................................................... 235
Bathtub plot parameters............................................................................................................................................. 235
Transfer function plot parameters...............................................................................................................................235
Composite jitter histogram plot parameters................................................................................................................ 235
Noise bathtub plot parameters....................................................................................................................................236
BER Eye contour plot paramters................................................................................................................................ 236
Composite noise histogram plot parameters.............................................................................................................. 236
BER Eye plot parameters........................................................................................................................................... 237
Correlated Eye plot parameters..................................................................................................................................237
PDF Eye plot parameters............................................................................................................................................237
Reports.............................................................................................................................................................................. 237
Reference..................................................................................................................................................................................239
Progress bar status messages.......................................................................................................................................... 239
Breakdown of jitter (Jitter map).......................................................................................................................................... 242
Breakdown of noise (Noise map).......................................................................................................................................244
Error codes........................................................................................................................................................................ 246
Measurement range limit values........................................................................................................................................ 252
DPOJET Jitter, Noise and Eye Diagram Analysis Solution Application Help 7
Page 8

Table of Contents
Measurement units............................................................................................................................................................ 258
Custom mask file requirements
......................................................................................................................................... 259
Correlation of measurement to configuration.....................................................................................................................260
Algorithms................................................................................................................................................................................. 268
About algorithms................................................................................................................................................................ 268
Period/Freq measurements............................................................................................................................................... 268
Period......................................................................................................................................................................... 268
Positive and negative width........................................................................................................................................ 269
Frequency...................................................................................................................................................................269
N-Period......................................................................................................................................................................269
Positive and negative duty cycle.................................................................................................................................270
CC-Period................................................................................................................................................................... 270
Positive and negative CC duty....................................................................................................................................271
Data rate..................................................................................................................................................................... 271
Jitter measurements.......................................................................................................................................................... 272
TIE.............................................................................................................................................................................. 272
RJ............................................................................................................................................................................... 272
RJ(h)........................................................................................................................................................................... 272
RJ(v)........................................................................................................................................................................... 272
Dual dirac random jitter...............................................................................................................................................273
Jitter summary............................................................................................................................................................ 273
TJ@BER.....................................................................................................................................................................273
DJ............................................................................................................................................................................... 273
Dual Dirac deterministic jitter...................................................................................................................................... 273
Phase noise................................................................................................................................................................ 273
PJ................................................................................................................................................................................273
PJ(h)........................................................................................................................................................................... 274
PJ(v)........................................................................................................................................................................... 274
NPJ............................................................................................................................................................................. 274
DDJ.............................................................................................................................................................................274
DCD............................................................................................................................................................................ 274
J2................................................................................................................................................................................ 274
J9................................................................................................................................................................................ 274
SRJ............................................................................................................................................................................. 275
F/N.............................................................................................................................................................................. 275
PJrms..........................................................................................................................................................................276
SJ@Freq.....................................................................................................................................................................276
Clock Pk-Pk................................................................................................................................................................ 276
Noise measurements......................................................................................................................................................... 276
TN@BER.................................................................................................................................................................... 276
RN...............................................................................................................................................................................276
RN(v).......................................................................................................................................................................... 277
RN(h).......................................................................................................................................................................... 277
DN...............................................................................................................................................................................277
PN...............................................................................................................................................................................277
PN(v)...........................................................................................................................................................................277
PN(h).......................................................................................................................................................................... 278
DDN(0)........................................................................................................................................................................278
DDN(1)........................................................................................................................................................................278
DPOJET Jitter, Noise and Eye Diagram Analysis Solution Application Help 8
Page 9

Table of Contents
DDN............................................................................................................................................................................ 278
NPN
............................................................................................................................................................................ 278
Unit Amplitude............................................................................................................................................................ 279
Noise summary...........................................................................................................................................................279
Timing measurements........................................................................................................................................................279
Rise time.....................................................................................................................................................................279
Fall time...................................................................................................................................................................... 279
Gated Skew................................................................................................................................................................ 280
Skew........................................................................................................................................................................... 280
High time.....................................................................................................................................................................280
Low time..................................................................................................................................................................... 280
Setup.......................................................................................................................................................................... 281
Rising Slew Rate measurement algorithm..................................................................................................................281
Fall slew rate...............................................................................................................................................................282
Hold............................................................................................................................................................................ 282
SSC profile..................................................................................................................................................................283
SSC MOD rate............................................................................................................................................................283
SSC FREQ DEV MIN..................................................................................................................................................283
SSC FREQ DEV MAX................................................................................................................................................ 283
SSC FREQ DEV......................................................................................................................................................... 283
tCMD-CMD................................................................................................................................................................. 284
Time Outside Level measurement algorithm.............................................................................................................. 284
Eye diagram measurements.............................................................................................................................................. 284
Eye width.................................................................................................................................................................... 284
Width@BER................................................................................................................................................................285
Eye height...................................................................................................................................................................285
Height@BER.............................................................................................................................................................. 286
Eye high......................................................................................................................................................................286
Eye low....................................................................................................................................................................... 286
Q-factor.......................................................................................................................................................................287
Mask hits.....................................................................................................................................................................287
Autofit mask hits......................................................................................................................................................... 287
V-Widest Open Eye.................................................................................................................................................... 288
DFE eye height........................................................................................................................................................... 288
DFE eye width............................................................................................................................................................ 288
DFE eye diagram........................................................................................................................................................288
Amplitude measurements.................................................................................................................................................. 288
AC RMS......................................................................................................................................................................288
High............................................................................................................................................................................ 289
Low............................................................................................................................................................................. 289
DC common mode......................................................................................................................................................290
AC common mode...................................................................................................................................................... 290
T/nT ratio.................................................................................................................................................................... 290
High-Low.....................................................................................................................................................................291
V-Diff-Xovr...................................................................................................................................................................292
Overshoot................................................................................................................................................................... 293
Undershoot................................................................................................................................................................. 293
Cycle max................................................................................................................................................................... 293
Cycle min.................................................................................................................................................................... 294
DPOJET Jitter, Noise and Eye Diagram Analysis Solution Application Help 9
Page 10

Table of Contents
Cycle Pk-Pk................................................................................................................................................................ 294
Standard-Specific measurements
......................................................................................................................................294
PCIe T-Tx-Diff-PP.......................................................................................................................................................294
PCIe T-TX...................................................................................................................................................................295
PCIe T-Tx-Fall.............................................................................................................................................................295
PCIe Tmin-Pulse.........................................................................................................................................................296
PCIe DeEmph.............................................................................................................................................................296
PCIe T-Tx-Rise........................................................................................................................................................... 297
PCIe UI....................................................................................................................................................................... 297
PCIe Med-Mx-Jitter.....................................................................................................................................................297
PCIe T-RF-Mismch..................................................................................................................................................... 298
PCIe MAX-MIN ratio................................................................................................................................................... 298
PCIe SSC PROFILE................................................................................................................................................... 299
PCIe SSC FREQ DEV................................................................................................................................................ 299
PCIe AC common mode............................................................................................................................................. 299
USB VTx-Diff-PP.........................................................................................................................................................299
USB TCdr-Slew-Max...................................................................................................................................................300
USB Tmin-Pulse-Tj..................................................................................................................................................... 300
USB Tmin-Pulse-Dj.....................................................................................................................................................301
USB SSC MOD RATE................................................................................................................................................ 301
USB SSC FREQ-DEV-MAX........................................................................................................................................301
USB SSC FREQ-DEV-MIN.........................................................................................................................................301
USB SSC PROFILE....................................................................................................................................................302
USB UI........................................................................................................................................................................302
USB AC common mode..............................................................................................................................................302
Average optical power................................................................................................................................................ 302
Extinction ratio............................................................................................................................................................ 302
Optical modulation amplitude......................................................................................................................................302
Optical high.................................................................................................................................................................303
Optical low.................................................................................................................................................................. 303
Eye Crossing Level.....................................................................................................................................................303
Eye Crossing Time......................................................................................................................................................304
Eye Crossing Percent................................................................................................................................................. 304
Mask Hit Ratio.............................................................................................................................................................304
Mask Margin............................................................................................................................................................... 305
Jitter separation................................................................................................................................................................. 305
Jitter analysis through RJ-DJ separation.................................................................................................................... 305
RJ-DJ separation via spectrum analysis.....................................................................................................................305
RJ-DJ separation for arbitrary patterns.......................................................................................................................305
Separation of Non-Periodic jitter (NPJ).......................................................................................................................306
Estimation of TJ@BER and eye Width@BER............................................................................................................ 306
Jitter estimation using Dual-Dirac models...................................................................................................................306
Joint Jitter/Noise analysis.................................................................................................................................................. 307
Differences between Jitter-Only and Jitter+Noise analysis.........................................................................................307
Use of Jitter+Noise analysis when DJAN is not enabled............................................................................................ 307
Basic steps in joint Jitter+Noise analysis.................................................................................................................... 308
Noise model component interrelationships.................................................................................................................308
Results............................................................................................................................................................................... 309
GPIB commands....................................................................................................................................................................... 311
DPOJET Jitter, Noise and Eye Diagram Analysis Solution Application Help 10
Page 11

Table of Contents
About the GPIB program....................................................................................................................................................311
GPIB reference materials
...................................................................................................................................................311
Argument types.................................................................................................................................................................. 311
DPOJET:ACTIVATE........................................................................................................................................................... 311
DPOJET:ADDMeas............................................................................................................................................................312
DPOJET:APPLYAll............................................................................................................................................................. 312
DPOJET:BITRatestate....................................................................................................................................................... 312
DPOJET:CLEARALLMeas................................................................................................................................................. 313
DPOJET:DATAratelimits.....................................................................................................................................................313
DPOJET:DESKEW.............................................................................................................................................................313
DPOJET:DESKEW:DESKEWchannel................................................................................................................................313
DPOJET:DESKEW:DESKEWHysteresis........................................................................................................................... 314
DPOJET:DESKEW:DESKEWMidlevel...............................................................................................................................314
DPOJET:DESKEW:EDGE..................................................................................................................................................314
DPOJET:DESKEW:MAXimum........................................................................................................................................... 315
DPOJET:DESKEW:MINimum............................................................................................................................................ 315
DPOJET:DESKEW:REFChannel....................................................................................................................................... 315
DPOJET:DESKEW:REFHysteresis....................................................................................................................................315
DPOJET:DESKEW:REFMidlevel....................................................................................................................................... 316
DPOJET:DIRacmodel........................................................................................................................................................ 316
DPOJET:EXPORT..............................................................................................................................................................316
DPOJET:EXPORTRaw...................................................................................................................................................... 317
DPOJET:GATING...............................................................................................................................................................317
DPOJET:HALTFreerunonlimfail..........................................................................................................................................317
DPOJET:HIGHPerfrendering............................................................................................................................................. 317
DPOJET:INTERp............................................................................................................................................................... 318
DPOJET:JITtermode?........................................................................................................................................................ 318
DPOJET:JITtermodel......................................................................................................................................................... 318
DPOJET:ANALYSISMETHOD........................................................................................................................................... 318
DPOJET:LASTError?......................................................................................................................................................... 319
DPOJET:LIMITRise............................................................................................................................................................319
DPOJET:MINBUJUI........................................................................................................................................................... 319
DPOJET:LIMits:FILEName................................................................................................................................................ 319
DPOJET:LIMits:STATE.......................................................................................................................................................320
DPOJET:LOGging:MEASurements:FOLDer......................................................................................................................320
DPOJET:LOGging:MEASurements:STATE........................................................................................................................320
DPOJET:LOGging:SNAPshot............................................................................................................................................ 321
DPOJET:LOGging:STATistics:FILEName.......................................................................................................................... 321
DPOJET:LOGging:STATistics:STATE................................................................................................................................ 321
DPOJET:LOGging:WORSTcase:FOLDer...........................................................................................................................321
DPOJET:LOGging:WORSTcase:STATE............................................................................................................................322
DPOJET:MEAS<x>............................................................................................................................................................ 322
DPOJET:MEAS<x>:BER:TARGETBER............................................................................................................................. 322
DPOJET:MEAS<x>:BITCfgmethod....................................................................................................................................323
DPOJET:MEAS<x>:BITPcnt.............................................................................................................................................. 323
DPOJET:MEAS<x>:BITConfig:STARTPercent.................................................................................................................. 323
DPOJET:MEAS<x>:BITConfig:ENDPercent...................................................................................................................... 323
DPOJET:MEAS<x>:BITConfig:NUMBins...........................................................................................................................324
DPOJET:MEAS<x>:BITConfig:ABSRELstate.................................................................................................................... 324
DPOJET Jitter, Noise and Eye Diagram Analysis Solution Application Help 11
Page 12

Table of Contents
DPOJET:MEAS<x>:BITType..............................................................................................................................................324
DPOJET
:MEAS<x>:BUSState:CLOCKPolarity..................................................................................................................325
DPOJET:MEAS<x>:BUSState:FROMPattern.................................................................................................................... 325
DPOJET:MEAS<x>:BUSState:FROMSymbol....................................................................................................................325
DPOJET:MEAS<x>:BUSState:MEASUREType.................................................................................................................326
DPOJET:MEAS<x>:BUSState:MEASUREFrom................................................................................................................ 326
DPOJET:MEAS<x>:BUSState:MEASURETO....................................................................................................................326
DPOJET:MEAS<x>:BUSState:TOPattern..........................................................................................................................326
DPOJET:MEAS<x>:BUSState:TOSymbol......................................................................................................................... 327
DPOJET:MEAS<x>:CLOCKRecovery:BHVRSTANdard.................................................................................................... 327
DPOJET:MEAS<x>:CLOCKRecovery:CLOCKBitrate........................................................................................................327
DPOJET:MEAS<x>:CLOCKRecovery:CLOCKFrequency................................................................................................. 328
DPOJET:MEAS<x>:CLOCKRecovery:CLOCKMultiplier....................................................................................................328
DPOJET:MEAS<x>:CLOCKRecovery:CLOCKPath...........................................................................................................328
DPOJET:MEAS<x>:CLOCKRecovery:DAMPing............................................................................................................... 328
DPOJET:MEAS<x>:CLOCKRecovery:DATARate..............................................................................................................329
DPOJET:MEAS<x>:CLOCKRecovery:BWType.................................................................................................................329
DPOJET:MEAS<x>:CLOCKRecovery:LOOPBandwidth....................................................................................................329
DPOJET:MEAS<x>:CLOCKRecovery:MEANAUTOCalculate........................................................................................... 330
DPOJET:MEAS<x>:CLOCKRecovery:METHod................................................................................................................ 330
DPOJET:MEAS<x>:CLOCKRecovery:MODel................................................................................................................... 330
DPOJET:MEAS<x>:CLOCKRecovery:NOMINALOFFset.................................................................................................. 330
DPOJET:MEAS<x>:CLOCKRecovery:NOMINALOFFset:AUTO?..................................................................................... 331
DPOJET:MEAS<x>:CLOCKRecovery:NOMINALOFFset:MANual.................................................................................... 331
DPOJET:MEAS<x>:CLOCKRecovery:NOMINALOFFset:Recalctype............................................................................... 331
DPOJET:MEAS<x>:CLOCKRecovery:NOMINALOFFset:SELECTIONtype......................................................................332
DPOJET:MEAS<x>:CLOCKRecovery:PATTern.................................................................................................................332
DPOJET:MEAS<x>:CLOCKRecovery:STAndard...............................................................................................................332
DPOJET:MEAS<x>:COMMONMode:FILTers:STATE.........................................................................................................332
DPOJET:MEAS<x>:CUSTomname....................................................................................................................................333
DPOJET:MEAS<x>:CUSTOMGATING:SOURCE1GATE..................................................................................................333
DPOJET:MEAS<x>:CUSTOMGATING:SOURCE2GATE..................................................................................................333
DPOJET:MEAS<x>:CUSTOMGATING:FROMedge.......................................................................................................... 334
DPOJET:MEAS<x>:CUSTOMGATING:TOedge................................................................................................................ 334
DPOJET:MEAS<x>:CUSTOMGATING:MEASUREMENTEdge.........................................................................................334
DPOJET:MEAS<x>:DATA?................................................................................................................................................335
DPOJET:MEAS<x>:DFE:RESOlution................................................................................................................................ 335
DPOJET:MEAS<x>:DFE:TAPState....................................................................................................................................335
DPOJET:MEAS<x>:DFE:ABSOLUTEVOLTAGEState.......................................................................................................336
DPOJET:MEAS<x>:DFE:ABSOLUTEVOLTAGEValue...................................................................................................... 336
DPOJET:MEAS<x>:DFE:ABSOLUTETIMEState...............................................................................................................336
DPOJET:MEAS<x>:DFE:ABSOLUTETIMEValue.............................................................................................................. 336
DPOJET:MEAS<x>:DFE:MEASatpercent..........................................................................................................................337
DPOJET:MEAS<x>:DFE:DELAYCOMPENSATION.......................................................................................................... 337
DPOJET:MEAS<x>:DFE:MANUALDELAY........................................................................................................................ 337
DPOJET:MEAS<x>:DISPLAYNAME?................................................................................................................................338
DPOJET:MEAS<x>:DFE:TAPValue................................................................................................................................... 338
DPOJET:MEAS<x>:EDGE1...............................................................................................................................................338
DPOJET:MEAS<x>:EDGE2...............................................................................................................................................338
DPOJET Jitter, Noise and Eye Diagram Analysis Solution Application Help 12
Page 13

Table of Contents
DPOJET:MEAS<x>:EDGEIncre.........................................................................................................................................339
DPOJET
:MEAS<x>:EDGES:FROMLevel.......................................................................................................................... 339
DPOJET:MEAS<x>:EDGES:LEVel....................................................................................................................................339
DPOJET:MEAS<x>:EDGES:SLEWRATETechnique..........................................................................................................340
DPOJET:MEAS<x>:EDGES:SUBRATEDivisor..................................................................................................................340
DPOJET:MEAS<x>:EDGES:EYEHeightstate.................................................................................................................... 340
DPOJET:MEAS<x>:EDGES:VOLTAGEState.....................................................................................................................340
DPOJET:MEAS<x>:EDGES:USERDefinedvoltage............................................................................................................341
DPOJET:MEAS<x>:EDGES:TOLevel................................................................................................................................341
DPOJET:MEAS<x>:FILTers:BLANKingtime.......................................................................................................................341
DPOJET:MEAS<x>:FILTers:HIGHPass:FREQ.................................................................................................................. 342
DPOJET:MEAS<x>:FILTers:HIGHPass:SPEC...................................................................................................................342
DPOJET:MEAS<x>:FILTers:LOWPass:FREQ................................................................................................................... 342
DPOJET:MEAS<x>:FILTers:LOWPass:SPEC................................................................................................................... 342
DPOJET:MEAS<x>:FILTers:SJBAndwidth.........................................................................................................................343
DPOJET:MEAS<x>:FILTers:SJFRequency........................................................................................................................343
DPOJET:MEAS<x>:REFVoltage........................................................................................................................................343
DPOJET:MEAS<x>:FILTers:RAMPtime............................................................................................................................. 344
DPOJET:MEAS<x>:FROMedge........................................................................................................................................ 344
DPOJET:MEAS<x>:HIGHREFVoltage...............................................................................................................................344
DPOJET:MEAS<x>:LOWREFVoltage................................................................................................................................344
DPOJET:MEAS<x>:LOGging:MEASurements:FILEname?...............................................................................................345
DPOJET:MEAS<x>:LOGging:MEASurements:SELect......................................................................................................345
DPOJET:MEAS<x>:LOGging:STATistics:SELect...............................................................................................................345
DPOJET:MEAS<x>:LOGging:WORSTcase:SELect...........................................................................................................345
DPOJET:MEAS<x>:MARGIN:HITCOUNTValue................................................................................................................ 346
DPOJET:MEAS<x>:MARGIN:HITRATIOState...................................................................................................................346
DPOJET:MEAS<x>:MARGIN:HITRATIOValue.................................................................................................................. 346
DPOJET:MEAS<x>:MARGIN:RESOlution.........................................................................................................................347
DPOJET:MEAS<x>:MASKfile............................................................................................................................................ 347
DPOJET:MEAS<x>:MASKOffset:HORIzontal:SELECTIONtype........................................................................................347
DPOJET:MEAS<x>:MASKOffset:HORIzontal:AUTOfit?....................................................................................................348
DPOJET:MEAS<x>:MASKOffset:HORIzontal:MANual......................................................................................................348
DPOJET:MEAS<x>:MEASRange:MAX..............................................................................................................................348
DPOJET:MEAS<x>:MEASRange:MIN...............................................................................................................................348
DPOJET:MEAS<x>:MEASRange:STATE.......................................................................................................................... 349
DPOJET:MEAS<x>:MEASStart......................................................................................................................................... 349
DPOJET:MEAS<x>:N........................................................................................................................................................ 349
DPOJET:MEAS<x>:NAME?...............................................................................................................................................349
DPOJET:MEAS<x>:PHASENoise:HIGHLimit.................................................................................................................... 350
DPOJET:MEAS<x>:PHASENoise:LOWLimit.....................................................................................................................350
DPOJET:MEAS<x>:PLOTFILES........................................................................................................................................350
DPOJET:MEAS<x>:RJDJ:SCOPERN................................................................................................................................350
DPOJET:MEAS<x>:RNDN:SCOPERN..............................................................................................................................351
DPOJET:MEAS<x>:REFVoltage........................................................................................................................................351
DPOJET:MEAS<x>:RESULts?.......................................................................................................................................... 351
DPOJET:MEAS<x>:RESULts:ALLAcqs?...........................................................................................................................352
DPOJET:MEAS<x>:RESULts:ALLAcqs:HITPopulation?................................................................................................... 352
DPOJET:MEAS<x>:RESULts:ALLAcqs:HITS?..................................................................................................................352
DPOJET Jitter, Noise and Eye Diagram Analysis Solution Application Help 13
Page 14

Table of Contents
DPOJET:MEAS<x>:RESULts:ALLacqs:LIMits:STATus?................................................................................................... 352
DPOJET
:MEAS<x>:RESULts:ALLacqs:LIMits:HIgh:STATus?...........................................................................................352
DPOJET:MEAS<x>:RESULts:ALLacqs:LIMits:LOw:STATus?........................................................................................... 353
DPOJET:MEAS<x>:RESULts:ALLAcqs:MAX?.................................................................................................................. 353
DPOJET:MEAS<x>:RESULts:ALLAcqs:MAXCC?.............................................................................................................353
DPOJET:MEAS<x>:RESULts:ALLAcqs:MAXCC:STATus?................................................................................................353
DPOJET:MEAS<x>:RESULts:ALLAcqs:MAXHits?............................................................................................................353
DPOJET:MEAS<x>:RESULts:ALLAcqs:MAX:STATus?.....................................................................................................354
DPOJET:MEAS<x>:RESULts:ALLacqs:MAX:HIGHLimit?.................................................................................................354
DPOJET:MEAS<x>:RESULts:ALLacqs:MAX:HIGHMArgin?............................................................................................. 354
DPOJET:MEAS<x>:RESULts:ALLacqs:MIN:LOWLimit?...................................................................................................354
DPOJET:MEAS<x>:RESULts:ALLacqs:MIN:LOWMArgin?............................................................................................... 354
DPOJET:MEAS<x>:RESULts:ALLAcqs:MEAN?................................................................................................................355
DPOJET:MEAS<x>:RESULts:ALLacqs:MEAN:HIGHLimit?.............................................................................................. 355
DPOJET:MEAS<x>:RESULts:ALLAcqs:MEAN:STATus?.................................................................................................. 355
DPOJET:MEAS<x>:RESULts:ALLAcqs:MIN?................................................................................................................... 355
DPOJET:MEAS<x>:RESULts:ALLAcqs:MINCC?.............................................................................................................. 355
DPOJET:MEAS<x>:RESULts:ALLAcqs:MINCC:STATus?.................................................................................................356
DPOJET:MEAS<x>:RESULts:ALLAcqs:MINHits?............................................................................................................. 356
DPOJET:MEAS<x>:RESULts:ALLAcqs:MIN:STATus?...................................................................................................... 356
DPOJET:MEAS<x>:RESULts:ALLacqs:PK2PK?...............................................................................................................356
DPOJET:MEAS<x>:RESULts:ALLacqs:PK2PK:STATus?................................................................................................. 356
DPOJET:MEAS<x>:RESULts:ALLAcqs:POPUlation?....................................................................................................... 357
DPOJET:MEAS<x>:RESULts:ALLacqs:POPUlation:STATus?.......................................................................................... 357
DPOJET:MEAS<x>:RESULts:ALLAcqs:SEG(x):Hits?.......................................................................................................357
DPOJET:MEAS<x>:RESULts:ALLAcqs:SEG(x):MAXHits?............................................................................................... 357
DPOJET:MEAS<x>:RESULts:ALLAcqs:SEG(x):MINHits?................................................................................................ 357
DPOJET:MEAS<x>:RESULts:ALLAcqs:STDDev?............................................................................................................ 358
DPOJET:MEAS<x>:RESULts:ALLacqs:STDDEV:STATus?...............................................................................................358
DPOJET:MEAS<x>:RESULts:CURRentacq:MAX?........................................................................................................... 358
DPOJET:MEAS<x>:RESULts:CURRentacq:MAXCC?...................................................................................................... 358
DPOJET:MEAS<x>:RESULts:CURRentacq:MAXCC:STATus?.........................................................................................358
DPOJET:MEAS<x>:RESULts:CURRentacq:MAX:STATus?.............................................................................................. 359
DPOJET:MEAS<x>:RESULts:CURRentacq:MEAN?.........................................................................................................359
DPOJET:MEAS<x>:RESULts:CURRentacq:MEAN:STATus?........................................................................................... 359
DPOJET:MEAS<x>:RESULts:CURRentacq:MIN?.............................................................................................................359
DPOJET:MEAS<x>:RESULts:CURRentacq:MINCC?....................................................................................................... 359
DPOJET:MEAS<x>:RESULts:CURRentacq:MINCC:STATus?.......................................................................................... 360
DPOJET:MEAS<x>:RESULts:CURRentacq:MIN:STATus?............................................................................................... 360
DPOJET:MEAS<x>:RESULts:CURRentacq:PK2PK?........................................................................................................360
DPOJET:MEAS<x>:RESULts:CURRentacq:PK2PK:STATus?.......................................................................................... 360
DPOJET:MEAS<x>:RESULts:CURRentacq:POPUlation?................................................................................................ 360
DPOJET:MEAS<x>:RESULts:CURRentacq:POPUlation:STATus?................................................................................... 361
DPOJET:MEAS<x>:RESULts:CURRentacq:STDDev?......................................................................................................361
DPOJET:MEAS<x>:RESULts:CURRentacq:STDDev:STATus?........................................................................................ 361
DPOJET:MEAS<x>:RESULts:GETAll................................................................................................................................ 361
DPOJET:MEAS<x>:RESULTS:STATus?........................................................................................................................... 362
DPOJET:MEAS<x>:RESULts:VIew?................................................................................................................................. 362
DPOJET:MEAS<x>:RJDJ:BER..........................................................................................................................................362
DPOJET Jitter, Noise and Eye Diagram Analysis Solution Application Help 14
Page 15

Table of Contents
DPOJET:MEAS<x>:RJDJ:DETECTPLEN..........................................................................................................................362
DPOJET
:MEAS<x>:RJDJ:PATLen.....................................................................................................................................363
DPOJET:MEAS<x>:RJDJ:TYPe........................................................................................................................................ 363
DPOJET:MEAS<x>:RJDJ:WINDOwlength.........................................................................................................................363
DPOJET:MEAS<x>:RNDN:BER........................................................................................................................................ 363
DPOJET:MEAS<x>:RNDN:AUTODETECTpattern............................................................................................................ 364
DPOJET:MEAS<x>:RNDN:PATLen................................................................................................................................... 364
DPOJET:MEAS<x>:RNDN:TYPe.......................................................................................................................................364
DPOJET:MEAS<x>:RNDN:WINDOwlength.......................................................................................................................364
DPOJET:MEAS<x>:SIGNALType...................................................................................................................................... 365
DPOJET:MEAS<x>:SOUrce1............................................................................................................................................ 365
DPOJET:MEAS<x>:SOUrce2............................................................................................................................................ 365
DPOJET:MEAS<x>:SSC:NOMinalfreq:AUTO?..................................................................................................................366
DPOJET:MEAS<x>:SSC:NOMinalfreq:MANual.................................................................................................................366
DPOJET:MEAS<x>:SSC:NOMinalfreq:SELECTIONtype.................................................................................................. 366
DPOJET:MEAS<x>:TIMEDATa?........................................................................................................................................366
DPOJET:MEAS<x>:TOEdge..............................................................................................................................................367
DPOJET:MEAS<x>:ZOOMEVENT.................................................................................................................................... 367
DPOJET:NOISEENABLED................................................................................................................................................ 367
DPOJET:NUMPlot?............................................................................................................................................................368
DPOJET:NUMMeas?......................................................................................................................................................... 368
DPOJET:OPTICALUNITType.............................................................................................................................................368
DPOJET:ADDPlot.............................................................................................................................................................. 368
DPOJET:CLEARALLPlots..................................................................................................................................................369
DPOJET:PLOT<x>:COMPOSITEJitterhist:VERTical:SCALE............................................................................................ 369
DPOJET:PLOT<x>:COMPOSITEJitterhist:NUMBins.........................................................................................................369
DPOJET:PLOT<x>:COMPOSITEJitterhist:TJ....................................................................................................................369
DPOJET:PLOT<x>:COMPOSITEJitterhist:RJNPJ.............................................................................................................370
DPOJET:PLOT<x>:COMPOSITEJitterhist:PJ....................................................................................................................370
DPOJET:PLOT<x>:COMPOSITEJitterhist:DDJDCD......................................................................................................... 370
DPOJET:PLOT<x>:CURRENTUISACquired..................................................................................................................... 371
DPOJET:PLOT<x>:CURRENTUISANalyzed.....................................................................................................................371
DPOJET:PLOT<x>:DATA:XDATa?.....................................................................................................................................371
DPOJET:PLOT<x>:DATA:XDATa:TJ?................................................................................................................................372
DPOJET:PLOT<x>:DATA:XDATa:RJBUJ?.........................................................................................................................372
DPOJET:PLOT<x>:DATA:XDATa:PJ?................................................................................................................................372
DPOJET:PLOT<x>:DATA:XDATa:DDJDCD?.....................................................................................................................373
DPOJET:PLOT<x>:DATA:XDATa:TN.................................................................................................................................373
DPOJET:PLOT<x>:DATA:XDATa:RNNPN.........................................................................................................................373
DPOJET:PLOT<x>:DATA:XDATa:PN.................................................................................................................................374
DPOJET:PLOT<x>:DATA:XDATa:DDNZERO....................................................................................................................374
DPOJET:PLOT<x>:DATA:XDATa:DDNONE...................................................................................................................... 374
DPOJET:PLOT<x>:DATA:YDATa?.....................................................................................................................................375
DPOJET:PLOT<x>:DATA:YDATa:TJ?................................................................................................................................375
DPOJET:PLOT<x>:DATA:YDATa:RJBUJ?.........................................................................................................................375
DPOJET:PLOT<x>:DATA:YDATa:PJ?................................................................................................................................376
DPOJET:PLOT<x>:DATA:YDATa:DDJDCD?.....................................................................................................................376
DPOJET:PLOT<x>:DATA:YDATa:TN.................................................................................................................................376
DPOJET:PLOT<x>:DATA:YDATa:RNNPN.........................................................................................................................377
DPOJET Jitter, Noise and Eye Diagram Analysis Solution Application Help 15
Page 16

Table of Contents
DPOJET:PLOT<x>:DATA:YDATa:PN.................................................................................................................................377
DPOJET
:PLOT<x>:DATA:YDATa:DDNONE...................................................................................................................... 378
DPOJET:PLOT<x>:DATA:YDATa:DDNZERO....................................................................................................................378
DPOJET:PLOT<x>:XUnits?............................................................................................................................................... 378
DPOJET:PLOT<x>:YUnits?............................................................................................................................................... 379
DPOJET:PLOT<x>:SOUrce?............................................................................................................................................. 379
DPOJET:PLOT<x>:TREND:TYPe......................................................................................................................................379
DPOJET:PLOT<x>:TYPe?.................................................................................................................................................379
DPOJET:PLOT<x>:BATHtub:BER..................................................................................................................................... 380
DPOJET:PLOT<x>:BATHtub:VERTical:SCALE.................................................................................................................380
DPOJET:PLOT<x>:EYE:ALIGNment.................................................................................................................................380
DPOJET:PLOT<x>:EYE:HORizontal:AUTOscale..............................................................................................................381
DPOJET:PLOT<x>:EYE:HORizontal:RESolution.............................................................................................................. 381
DPOJET:PLOT<x>:EYE:INTERPolationtype..................................................................................................................... 381
DPOJET:PLOT<x>:EYE:MASKfile.....................................................................................................................................381
DPOJET:PLOT<x>:EYE:STATE.........................................................................................................................................382
DPOJET:PLOT<x>:EYE:SUPERImpose............................................................................................................................382
DPOJET:PLOT<x>:EYE:VERTICALAlignment.................................................................................................................. 382
DPOJET:PLOT<x>:EYE:VERTScale................................................................................................................................. 383
DPOJET:PLOT<x>:EYE:HORIZScale............................................................................................................................... 383
DPOJET:PLOT<x>:EYE:VERTical:YAXISMAx.................................................................................................................. 383
DPOJET:PLOT<x>:EYE:VERTical:YAXISMIn....................................................................................................................384
DPOJET:PLOT<x>:EYE:HORizontal:XAXISMAx...............................................................................................................384
DPOJET:PLOT<x>:EYE:HORizontal:XAXISMIn................................................................................................................384
DPOJET:PLOT<x>:TOTALUISAnalyzed?..........................................................................................................................384
DPOJET:PLOT<x>:TOTALUISAcquired?.......................................................................................................................... 385
DPOJET:PLOT<x>:HISTOgram:HORizontal:SPAN...........................................................................................................385
DPOJET:PLOT<x>:HISTOgram:AUTOset.........................................................................................................................385
DPOJET:PLOT<x>:HISTOgram:HORizontal:AUTOscale..................................................................................................385
DPOJET:PLOT<x>:HISTOgram:HORizontal:CENter.........................................................................................................386
DPOJET:PLOT<x>:HISTOgram:HORizontal:SPAN...........................................................................................................386
DPOJET:PLOT<x>:HISTOgram:NUMBins.........................................................................................................................386
DPOJET:PLOT<x>:HISTOgram:VERTical:SCALE............................................................................................................387
DPOJET:PLOT<x>:PHASEnoise:BASEline.......................................................................................................................387
DPOJET:PLOT<x>:PHASEnoise:SMOOTHENINGFilter...................................................................................................388
DPOJET:PLOT<x>:SPECtrum:BASE................................................................................................................................ 388
DPOJET:PLOT<x>:SPECtrum:HORizontal:SCALE...........................................................................................................388
DPOJET:PLOT<x>:SPECtrum:MODE............................................................................................................................... 388
DPOJET:PLOT<x>:SPECtrum:VERTical:SCALE.............................................................................................................. 389
DPOJET:PLOT<x>:TRANSfer:DENominator.....................................................................................................................389
DPOJET:PLOT<x>:TRANSfer:HORizontal:SCALE........................................................................................................... 389
DPOJET:PLOT<x>:TRANSfer:MODE................................................................................................................................390
DPOJET:PLOT<x>:TRANSfer:NUMerator.........................................................................................................................390
DPOJET:PLOT<x>:TRANSfer:VERTical:SCALE...............................................................................................................390
DPOJET:PLOT<x>:BERContour:ALIGNment....................................................................................................................391
DPOJET:PLOT<x>:BERContour:HORizontal:AUTOscale.................................................................................................391
DPOJET:PLOT<x>:BERContour:HORizontal:RESolution................................................................................................. 391
DPOJET:PLOT<x>:BERContour:MASK.............................................................................................................................391
DPOJET:PLOT<x>:BERContour:MASKFile.......................................................................................................................392
DPOJET Jitter, Noise and Eye Diagram Analysis Solution Application Help 16
Page 17

Table of Contents
DPOJET:PLOT<x>:BERContour:SUPERImpose...............................................................................................................392
DPOJET
:PLOT<x>:BERContour:BER1E6V.......................................................................................................................392
DPOJET:PLOT<x>:BERContour:BER1E9V.......................................................................................................................392
DPOJET:PLOT<x>:BERContour:BER1E12V.....................................................................................................................393
DPOJET:PLOT<x>:BERContour:BER1E15V.....................................................................................................................393
DPOJET:PLOT<x>:BERContour:BER1E18V.....................................................................................................................393
DPOJET:PLOT<x>:BERContour:TARGETBER................................................................................................................. 394
DPOJET:PLOT<x>:VERTBATHtub:BER............................................................................................................................394
DPOJET:PLOT<x>:VERTBATHtub:YAXISUnits.................................................................................................................394
DPOJET:PLOT<x>:VERTBATHtub:HORIzontal:SCALE....................................................................................................394
DPOJET:PLOT<x>:CORRELATEDEye:BER1E6V............................................................................................................ 395
DPOJET:PLOT<x>:EXPORTRaw......................................................................................................................................395
DPOJET:PLOT<x>:CORRELATEDEye:BER1E9V............................................................................................................ 395
DPOJET:PLOT<x>:CORRELATEDEye:BER1E12V.......................................................................................................... 395
DPOJET:PLOT<x>:CORRELATEDEye:BER1E15V.......................................................................................................... 396
DPOJET:PLOT<x>:CORRELATEDEye:BER1E18V.......................................................................................................... 396
DPOJET:PLOT<x>:CORRELATEDEye:TARGETBER.......................................................................................................396
DPOJET:PLOT<x>:CORRELATEDEye:EYEHEIGHT........................................................................................................397
DPOJET:PLOT<x>:CORRELATEDEye:EYEWIDTH......................................................................................................... 397
DPOJET:PLOT<x>:PDFEye:BER1E6V............................................................................................................................. 397
DPOJET:PLOT<x>:PDFEye:BER1E9V............................................................................................................................. 397
DPOJET:PLOT<x>:PDFEye:BER1E12V........................................................................................................................... 398
DPOJET:PLOT<x>:PDFEye:BER1E15V........................................................................................................................... 398
DPOJET:PLOT<x>:PDFEye:BER1E18V........................................................................................................................... 398
DPOJET:PLOT<x>:PDFEye:TARGETBER........................................................................................................................399
DPOJET:PLOT<x>:BEREye:BER1E6V............................................................................................................................. 399
DPOJET:PLOT<x>:BEREye:BER1E9V............................................................................................................................. 399
DPOJET:PLOT<x>:BEREye:BER1E12V........................................................................................................................... 399
DPOJET:PLOT<x>:BEREye:BER1E15V........................................................................................................................... 400
DPOJET:PLOT<x>:BEREye:BER1E18V........................................................................................................................... 400
DPOJET:PLOT<x>:BEREye:TARGETBER........................................................................................................................400
DPOJET:PLOT<x>:COMPOSITENoisehist:HORIzontal:SCALE....................................................................................... 401
DPOJET:PLOT<x>:COMPOSITENoisehist:NUMBins....................................................................................................... 401
DPOJET:PLOT<x>:COMPOSITENoisehist:TN..................................................................................................................401
DPOJET:PLOT<x>:COMPOSITENoisehist:RNNPN..........................................................................................................401
DPOJET:PLOT<x>:COMPOSITENoisehist:PN..................................................................................................................402
DPOJET:PLOT<x>:COMPOSITENoisehist:DDNZERO.....................................................................................................402
DPOJET:PLOT<x>:COMPOSITENoisehist:DDNONE.......................................................................................................402
DPOJET:PLOT<X>:EYE:EYEVerticalscale........................................................................................................................403
DPOJET:PLOT<X>:EYE:INTERPOLATIONFactor............................................................................................................ 403
DPOJET:POPULATION:CONDition................................................................................................................................... 403
DPOJET:POPULATION:LIMIT........................................................................................................................................... 403
DPOJET:POPULATION:LIMITBY...................................................................................................................................... 404
DPOJET:POPULATION:STATE......................................................................................................................................... 404
DPOJET:QUALify:ACTIVE.................................................................................................................................................404
DPOJET:QUALify:SOUrce................................................................................................................................................. 404
DPOJET:QUALify:STATE...................................................................................................................................................405
DPOJET:REFLevel:CH<x>:MIDZero................................................................................................................................. 405
DPOJET:REFLevels:AUTOSet.......................................................................................................................................... 405
DPOJET Jitter, Noise and Eye Diagram Analysis Solution Application Help 17
Page 18

Table of Contents
DPOJET:REFLevels:AUTOset:STATE?.............................................................................................................................406
DPOJET
:REFLevels:CH<x>:AUTOSet.............................................................................................................................. 406
DPOJET:REFLevels:CH<x>:ABSolute.............................................................................................................................. 406
DPOJET:REFLevels:CH<x>:ABSolute:RISEHigh..............................................................................................................406
DPOJET:REFLevels:CH<x>:ABSolute:RISELow...............................................................................................................406
DPOJET:REFLevels:CH<x>:ABSolute:RISEMid............................................................................................................... 407
DPOJET:REFLevels:CH<x>:ABSolute:FALLHigh..............................................................................................................407
DPOJET:REFLevels:CH<x>:ABSolute:FALLLow...............................................................................................................407
DPOJET:REFLevels:CH<x>:ABSolute:FALLMid............................................................................................................... 407
DPOJET:REFLevels:CH<x>:ABSolute:HYSTeresis...........................................................................................................408
DPOJET:REFLevels:CH<x>:BASETop.............................................................................................................................. 408
DPOJET:REFLevels:CH<x>:PERcent............................................................................................................................... 408
DPOJET:REFLevels:CH<x>:PERcent:FALLHigh...............................................................................................................408
DPOJET:REFLevels:CH<x>:PERcent:FALLLow............................................................................................................... 409
DPOJET:REFLevels:CH<x>:PERcent:FALLMid................................................................................................................409
DPOJET:REFLevels:CH<x>:PERcent:PERCENTReflevel................................................................................................ 409
DPOJET:REFLevels:CH<x>:PERcent:HYSTeresis............................................................................................................410
DPOJET:REFLevels:CH<x>:PERcent:RISEHigh...............................................................................................................410
DPOJET:REFLevels:CH<x>:PERcent:RISELow............................................................................................................... 410
DPOJET:REFLevels:CH<x>:PERcent:RISEMid................................................................................................................ 410
DPOJET:REPORT..............................................................................................................................................................411
DPOJET:REPORT:APPlicationconfig.................................................................................................................................411
DPOJET:REPORT:AUTOincrement................................................................................................................................... 411
DPOJET:REPORT:COMments...........................................................................................................................................411
DPOJET:REPORT:DETailedresults....................................................................................................................................412
DPOJET:REPORT:ENABlecomments................................................................................................................................412
DPOJET:REPORT:GETIMAGE..........................................................................................................................................412
DPOJET:REPORT:GETIMAGEName................................................................................................................................ 412
DPOJET:REPORT:GETXMLReport................................................................................................................................... 412
DPOJET:REPORT:PASSFailresults...................................................................................................................................413
DPOJET:REPORT:PLOTimages........................................................................................................................................413
DPOJET:REPORT:REPORTName.................................................................................................................................... 413
DPOJET:REPORT:SETupconfig........................................................................................................................................ 413
DPOJET:REPORT:SAVEWaveforms................................................................................................................................. 414
DPOJET:REPORT:SETIMAGEPath...................................................................................................................................414
DPOJET:REPORT:STATE?................................................................................................................................................414
DPOJET:REPORT:VIEWreport.......................................................................................................................................... 414
DPOJET:RESULts:STATus?.............................................................................................................................................. 415
DPOJET:RESULts:VIew.................................................................................................................................................... 415
DPOJET:RESULts:GETALLResults?................................................................................................................................. 415
DPOJET:SAVE................................................................................................................................................................... 415
DPOJET:SAVEALLPLOTS.................................................................................................................................................416
DPOJET:SETIMAGETPath................................................................................................................................................ 416
DPOJET:SETLOGGINGPath............................................................................................................................................. 416
DPOJET:SETREPORTPath...............................................................................................................................................416
DPOJET:SHOWMEASWARNing....................................................................................................................................... 417
DPOJET:SNC:ACTIvate.....................................................................................................................................................417
DPOJET:SNC:CLOse........................................................................................................................................................ 417
DPOJET:SOURCEAutoset.................................................................................................................................................417
DPOJET Jitter, Noise and Eye Diagram Analysis Solution Application Help 18
Page 19

Table of Contents
DPOJET:SOURCEAutoset:HORizontal:UICount............................................................................................................... 418
DPOJET
:SOURCEAutoset:HORizontal:UIValue................................................................................................................418
DPOJET:SOURCEAutoset:STATE?...................................................................................................................................418
DPOJET:STATE................................................................................................................................................................. 418
DPOJET:TDCOMPensation............................................................................................................................................... 419
DPOJET:UNITType............................................................................................................................................................419
DPOJET:LOCKRJ.............................................................................................................................................................. 419
DPOJET:LOCKRJValue..................................................................................................................................................... 419
DPOJET:PLOT<x>:BATHtub:XAXISUnits..........................................................................................................................420
DPOJET:PLOT<x>:NOISEBATHtub:YAXISUnits...............................................................................................................420
DPOJET:VERTUNITType...................................................................................................................................................420
DPOJET:VERsion?............................................................................................................................................................ 421
Index......................................................................................................................................................................................... 422
DPOJET Jitter, Noise and Eye Diagram Analysis Solution Application Help 19
Page 20

List of Figures
List of Figures
Figure 1: About DPOJET............................................................................................................................................................ 40
Figure 2: Virtual keypad.............................................................................................................................................................. 42
Figure 3: Warning log notifiers(Error)..........................................................................................................................................45
Figure 4: Warning log notifiers(Warning).....................................................................................................................................45
Figure 5: Control panel................................................................................................................................................................47
Figure 6: Control panel (Show Plots).......................................................................................................................................... 48
Figure 7: Navigation panel.......................................................................................................................................................... 49
Figure 8: Deskew setup.............................................................................................................................................................. 51
Figure 9: Deskew summary channel source and deskew values............................................................................................... 51
Figure 10: Jitter Only measurements are enabled...................................................................................................................... 52
Figure 11: Jitter/Noise measurements are enabled.....................................................................................................................52
Figure 12: Test point selection in the standard tab......................................................................................................................64
Figure 13: Test point selection in the standard tab (Measurements).......................................................................................... 64
Figure 14: Test point selection in the standard tab (Measurements with show plots)................................................................. 65
Figure 15: General configuration.................................................................................................................................................66
Figure 16: Global Configuration.................................................................................................................................................. 67
Figure 17: Global-Gating.............................................................................................................................................................67
Figure 18: Global-Qualify............................................................................................................................................................ 68
Figure 19: Global-Population...................................................................................................................................................... 70
Figure 20: Configuring population limit........................................................................................................................................70
Figure 21: Filters (High Pass, Low Pass, SSC).......................................................................................................................... 71
Figure 22: Band Pass Filtering....................................................................................................................................................72
Figure 23: Filter........................................................................................................................................................................... 72
Figure 24: Filter (High Pass Frequency)..................................................................................................................................... 73
Figure 25: Brick wall filter............................................................................................................................................................ 73
Figure 26: Advanced filter configuration......................................................................................................................................75
Figure 27: Configuring Filters for SJ@Freq................................................................................................................................ 76
Figure 28: Constant clock recovery.............................................................................................................................................77
Figure 29: Constant clock - mean............................................................................................................................................... 78
Figure 30: Constant clock - median............................................................................................................................................ 78
Figure 31: Constant clock - fixed.................................................................................................................................................79
Figure 32: Clock recovery advanced setup.................................................................................................................................80
DPOJET Jitter, Noise and Eye Diagram Analysis Solution Application Help 20
Page 21

List of Figures
Figure 33: PLL clock recovery setup...........................................................................................................................................81
Figure 34: PLL standard BW
.......................................................................................................................................................82
Figure 35: PLL custom BW......................................................................................................................................................... 83
Figure 36: Explicit Clock-Edge.................................................................................................................................................... 84
Figure 37: Advanced explicit Clock-Edge................................................................................................................................... 85
Figure 38: Explicit Clock-PLL...................................................................................................................................................... 86
Figure 39: Nominal Clock Offset Relative to Data.......................................................................................................................87
Figure 40: Bit config for eye height............................................................................................................................................. 89
Figure 41: Bit config for eye high, low, and Q-Factor..................................................................................................................89
Figure 42: Bit config for Height@BER.........................................................................................................................................90
Figure 43: Bit config for Height@BER.........................................................................................................................................91
Figure 44: Bit config for TN@BER.............................................................................................................................................. 91
Figure 45: Bit config for mask hits...............................................................................................................................................92
Figure 46: Bit config for autofit mask hits measurement............................................................................................................. 93
Figure 47: Bit config for mask hits ratio measurement................................................................................................................95
Figure 48: Bit config for mask margin measurement.................................................................................................................. 95
Figure 49: Bit config for amplitude measurements......................................................................................................................96
Figure 50: Bit config for PCI express measurements..................................................................................................................97
Figure 51: BER configure panel.................................................................................................................................................. 97
Figure 52: RJ-DJ......................................................................................................................................................................... 98
Figure 53: RJ-DJ analysis of repeating pattern...........................................................................................................................99
Figure 54: RJ-DJ analysis of arbitrary pattern...........................................................................................................................100
Figure 55: RN-DN..................................................................................................................................................................... 101
Figure 56: RN-DN analysis for repeating pattern...................................................................................................................... 102
Figure 57: RN-DN analysis for arbitrary pattern........................................................................................................................103
Figure 58: Configuring bus states............................................................................................................................................. 103
Figure 59: Configuring bus states (tCKSRE)............................................................................................................................ 104
Figure 60: Configuring bus states (tBurst-CMD measurement)................................................................................................ 104
Figure 61: Configuring bus states (Required symbol bit pattern)..............................................................................................104
Figure 62: Configuring edges - Jitter only................................................................................................................................. 106
Figure 63: Configuring edges - Jitter + Noise............................................................................................................................107
Figure 64: Configuring edges - Jitter + Noise............................................................................................................................107
Figure 65: Configuring edges for skew measurements.............................................................................................................108
Figure 66: Configuring edges for differential CrossOver voltage measurements......................................................................109
Figure 67: Configuring edges for phase noise measurements................................................................................................. 109
DPOJET Jitter, Noise and Eye Diagram Analysis Solution Application Help 21
Page 22

List of Figures
Figure 68: Configuring edges for N-Period measurements.......................................................................................................110
Figure 69: Configuring edges for setup/hold
..............................................................................................................................111
Figure 70: Configuring edges for CC-Period/Duty cycle measurements................................................................................... 111
Figure 71: Configuring edges for DCD measurement............................................................................................................... 112
Figure 72: Configuring edges for Overshoot/Undershoot measurements.................................................................................112
Figure 73: Configuring edges for rise slew rate.........................................................................................................................113
Figure 74: Configuration options for fall slew rate .................................................................................................................... 113
Figure 75: Configuring edges for time outside level.................................................................................................................. 114
Figure 76: Configuring edges for F/N measurements - Jitter Only............................................................................................115
Figure 77: Configuring edges for F/N measurements - Jitter + Noise....................................................................................... 116
Figure 78: Configuring edges for DDR tCH(avg) and DDR tCL(avg)........................................................................................ 116
Figure 79: Configuring edges for DDR tERR(m-n)....................................................................................................................117
Figure 80: Configuring edges for DDR tERR(n)........................................................................................................................ 117
Figure 81: Configuring edges for DDR tHZDQ and DDR tLZDQ...............................................................................................118
Figure 82: Configuring edges for DDRtJIT(per) DDRtCK(avg) and DDRtJIT(duty)...................................................................118
Figure 83: Configuring edges for DDR VIH.DQ(AC), VIH.DQ(DC), VIL.DQ(AC), and VIL.DQ(DC)..........................................119
Figure 84: Spread spectrum clock.............................................................................................................................................119
Figure 85: Margin config for mask margin.................................................................................................................................120
Figure 86: DFE configuration for DFE EH.................................................................................................................................121
Figure 87: DFE configuration for DFE EW................................................................................................................................ 121
Figure 88: DFE configuration for DFE Eye Diagram................................................................................................................. 122
Figure 89: One touch jitter.........................................................................................................................................................123
Figure 90: Plot after One Touch Jitter is performed.................................................................................................................. 124
Figure 91: Select measurement................................................................................................................................................ 125
Figure 92: Configure measurement-Skew................................................................................................................................ 126
Figure 93: Configure measurement-Jitter summary..................................................................................................................127
Figure 94: Select sources (Measurement source).................................................................................................................... 128
Figure 95: Select sources (Two source measurements)...........................................................................................................128
Figure 96: Configure autoset.....................................................................................................................................................129
Figure 97: Period and Frequency measurement.......................................................................................................................130
Figure 98: Results..................................................................................................................................................................... 130
Figure 99: Measurement table.................................................................................................................................................. 131
Figure 100: Source configuration ............................................................................................................................................. 131
Figure 101: Results................................................................................................................................................................... 132
Figure 102: Plots....................................................................................................................................................................... 132
DPOJET Jitter, Noise and Eye Diagram Analysis Solution Application Help 22
Page 23

List of Figures
Figure 103: Data snapshot........................................................................................................................................................132
Figure 104: Data logging
...........................................................................................................................................................133
Figure 105: Measurement summary......................................................................................................................................... 133
Figure 106: Export results to Ref.............................................................................................................................................. 134
Figure 107: Source measurements (Period1)........................................................................................................................... 135
Figure 108: Source measurements (Setup1)............................................................................................................................ 135
Figure 109: Autoset configuration options.................................................................................................................................136
Figure 110: Bus setup............................................................................................................................................................... 137
Figure 111: configuration of bus................................................................................................................................................ 137
Figure 112: Source Configuration..............................................................................................................................................138
Figure 113: Source Configuration..............................................................................................................................................138
Figure 114: Digital channels......................................................................................................................................................139
Figure 115: Digital channels......................................................................................................................................................140
Figure 116: Source Configurations............................................................................................................................................140
Figure 117: Ref levels................................................................................................................................................................141
Figure 118: Reference levels in percentages............................................................................................................................144
Figure 119: Reference levels manually.....................................................................................................................................144
Figure 120: Reference levels in percentages (Advanced not checked)....................................................................................144
Figure 121: Reference levels manually (Advanced not checked)............................................................................................. 145
Figure 122: Min - Max............................................................................................................................................................... 147
Figure 123: Preferences Setup-General................................................................................................................................... 148
Figure 124: Preferences Setup-Measurement.......................................................................................................................... 149
Figure 125: Analysis Method - Jitter Only................................................................................................................................. 150
Figure 126: Analysis Method - Jitter + Noise............................................................................................................................ 151
Figure 127: Preferences-Path defaults..................................................................................................................................... 152
Figure 128: Export data snapshot-Statistics............................................................................................................................. 153
Figure 129: Export data snapshot-Measurement......................................................................................................................155
Figure 130: View Log File Names............................................................................................................................................. 156
Figure 131: Export measurement..............................................................................................................................................157
Figure 132: Data logging-Statistics........................................................................................................................................... 157
Figure 133: Data Logging-Measurement.................................................................................................................................. 159
Figure 134: View log file names................................................................................................................................................ 160
Figure 135: View log file names (Global > Qualify)...................................................................................................................161
Figure 136: View log file names (Math).....................................................................................................................................161
Figure 137: Data logging-Worst case........................................................................................................................................162
DPOJET Jitter, Noise and Eye Diagram Analysis Solution Application Help 23
Page 24

List of Figures
Figure 138: View log file names................................................................................................................................................ 163
Figure 139: V
iew log file names (Global > Qualify)................................................................................................................... 164
Figure 140: View log file names (Math).....................................................................................................................................164
Figure 141: Logging worst case for mask hits measurement....................................................................................................165
Figure 142: Logging worst case for mask hits measurement (maximum and minimum values)...............................................165
Figure 143: Sequencing (Progress indicator)............................................................................................................................166
Figure 144: Pass/Fail Limit Setup............................................................................................................................................. 168
Figure 145: Limits for mask hits................................................................................................................................................ 169
Figure 146: Limits for mask hits (Result)...................................................................................................................................169
Figure 147: Measurement configuration summary-Measurement............................................................................................ 169
Figure 148: Measurement summary-Ref levels........................................................................................................................ 170
Figure 149: Measurement Summary-Misc................................................................................................................................ 171
Figure 150: Viewing statistical results....................................................................................................................................... 172
Figure 151: Viewing statistical results (Vector measurement)...................................................................................................173
Figure 152: Results with Error Notification................................................................................................................................174
Figure 153: Results with Warning Notification...........................................................................................................................174
Figure 154: Overall Test Result.................................................................................................................................................174
Figure 155: Overall Test Result (Fail)........................................................................................................................................175
Figure 156: Summary................................................................................................................................................................175
Figure 157: Detailed results...................................................................................................................................................... 175
Figure 158: Export results to ref waveform............................................................................................................................... 176
Figure 159: Bit rate and pattern length detection...................................................................................................................... 177
Figure 160: Plots....................................................................................................................................................................... 177
Figure 161: Bathtub Curve plot................................................................................................................................................. 180
Figure 162: Selecting plots........................................................................................................................................................181
Figure 163: Configuring plots.................................................................................................................................................... 182
Figure 164: Configuring a bathtub plot......................................................................................................................................183
Figure 165: Configuring a spectrum plot................................................................................................................................... 184
Figure 166: Configuring a time trend.........................................................................................................................................185
Figure 167: Configuring a histogram plot.................................................................................................................................. 185
Figure 168: Configuring a transfer plot......................................................................................................................................186
Figure 169: Configuring a phase noise plot.............................................................................................................................. 187
Figure 170: Configuring an eye diagram plot for eye height..................................................................................................... 188
Figure 171: Configuring an eye diagram for mask hits............................................................................................................. 190
Figure 172: Configuring an eye diagram for DFE measurements.............................................................................................192
DPOJET Jitter, Noise and Eye Diagram Analysis Solution Application Help 24
Page 25

List of Figures
Figure 173: Configuring a composite jitter histogram plot.........................................................................................................194
Figure 174: Configuring a composite noise histogram plot
....................................................................................................... 195
Figure 175: Configuring a noise bathtub plot............................................................................................................................ 196
Figure 176: Configure a BER Eye contour plot......................................................................................................................... 197
Figure 177: Configure a BER Eye plot...................................................................................................................................... 198
Figure 178: Configure a Correlated Eye plot.............................................................................................................................198
Figure 179: Configure a PDF Eye plot...................................................................................................................................... 199
Figure 180: Plot toolbar functions............................................................................................................................................. 200
Figure 181: Reports.................................................................................................................................................................. 203
Figure 182: Append Reports..................................................................................................................................................... 205
Figure 183: Reports compatibility..............................................................................................................................................205
Figure 184: Print Background Color and Images...................................................................................................................... 206
Figure 185: Add Comments...................................................................................................................................................... 207
Figure 186: Recalling a waveform file....................................................................................................................................... 209
Figure 187: Setting up a Period Measurement......................................................................................................................... 209
Figure 188: Period Measurement plot.......................................................................................................................................210
Figure 189: custom_gating_selection....................................................................................................................................... 210
Figure 190: Custom_gating_window......................................................................................................................................... 211
Figure 191: Gatedskew_Navig_Panel.......................................................................................................................................211
Figure 192: DPOJET plots........................................................................................................................................................ 212
Figure 193: TIE measurement.................................................................................................................................................. 212
Figure 194: Plots for TIE measurement.................................................................................................................................... 212
Figure 195: Height and Width measurement............................................................................................................................ 213
Figure 196: Plot summary window............................................................................................................................................ 214
Figure 197: Time Trend plot......................................................................................................................................................214
Figure 198: Math1 for TIE1 and TIE2........................................................................................................................................215
Figure 199: Time Trend plots for TIE1, TIE2 and Spectrum plots for TIE1, TIE2......................................................................215
Figure 200: Jitter map - Spectral Only...................................................................................................................................... 243
Figure 201: Jitter map - Spectral + BUJ....................................................................................................................................244
Figure 202: Noise map - Spectral Only..................................................................................................................................... 245
Figure 203: Noise map - Spectral + BUJ...................................................................................................................................245
Figure 204: Rising Slew Rate measurement algorithm.............................................................................................................281
Figure 205: Fall slew rate..........................................................................................................................................................282
Figure 206: tCMD-CMD............................................................................................................................................................ 284
Figure 207: Time Outside Level measurement algorithm......................................................................................................... 284
DPOJET Jitter, Noise and Eye Diagram Analysis Solution Application Help 25
Page 26

List of Figures
Figure 208: Eye high................................................................................................................................................................. 286
Figure 209: Eye low
.................................................................................................................................................................. 287
Figure 210: T/nT ratio................................................................................................................................................................291
Figure 211: High-Low................................................................................................................................................................292
Figure 212: Overshoot.............................................................................................................................................................. 293
Figure 213: Undershoot............................................................................................................................................................ 293
Figure 214: PCIe T-Tx-Fall........................................................................................................................................................296
Figure 215: PCIe T-Tx-Rise...................................................................................................................................................... 297
Figure 216: PCIe MAX-MIN ratio.............................................................................................................................................. 298
Figure 217: USB VTx-Diff-PP....................................................................................................................................................300
Figure 218: Eye Crossing Level................................................................................................................................................ 304
Figure 219: Noise model component interrelationships............................................................................................................ 309
DPOJET Jitter, Noise and Eye Diagram Analysis Solution Application Help 26
Page 27

List of Tables
List of Tables
Table 1: List of reference documents.......................................................................................................................................... 34
Table 2: Icon descriptions............................................................................................................................................................34
Table 3: Application menu controls descriptions......................................................................................................................... 41
Table 4: Application directories................................................................................................................................................... 43
Table 5: File name extensions.....................................................................................................................................................43
Table 6: Application shortcuts..................................................................................................................................................... 44
Table 7: Control panel selections................................................................................................................................................ 47
Table 8: Navigation panel functions............................................................................................................................................ 48
Table 9: Period/Frequency measurements definitions................................................................................................................ 53
Table 10: Jitter measurements definitions...................................................................................................................................53
Table 11: Noise measurements definitions..................................................................................................................................56
Table 12: Time measurements definitions...................................................................................................................................57
Table 13: Eye measurements definitions.................................................................................................................................... 58
Table 14: Amplitude measurements definitions...........................................................................................................................60
Table 15: Standard-specific measurements definitions...............................................................................................................61
Table 16: General options........................................................................................................................................................... 66
Table 17: Global-Gating options..................................................................................................................................................67
Table 18: Global-Qualify options................................................................................................................................................. 68
Table 19: Qualify-Configure options............................................................................................................................................ 68
Table 20: Global-Population options........................................................................................................................................... 70
Table 21: Population-Configure options...................................................................................................................................... 70
Table 22: Filter options................................................................................................................................................................ 72
Table 23: Filter options................................................................................................................................................................ 73
Table 24: Advanced filter configuration options...........................................................................................................................75
Table 25: Configuring Filters for SJ@FREQ............................................................................................................................... 76
Table 26: Constant clock - mean options.................................................................................................................................... 78
Table 27: Constant clock - median options................................................................................................................................. 79
Table 28: Advanced clock recovery options................................................................................................................................ 80
Table 29: PLL-standard clock recovery options.......................................................................................................................... 82
Table 30: PLL-Custom clock recovery options............................................................................................................................ 83
Table 31: Explicit-Clock edge options......................................................................................................................................... 84
Table 32: Advanced explicit-Clock edge options.........................................................................................................................85
DPOJET Jitter, Noise and Eye Diagram Analysis Solution Application Help 27
Page 28

List of Tables
Table 33: Explicit Clock-PLL options........................................................................................................................................... 86
T
able 34: Advanced Explicit-Clock PLL options.......................................................................................................................... 87
Table 35: Bit config for eye height............................................................................................................................................... 89
Table 36: Bit config for eye high, low, and Q-Factor....................................................................................................................89
Table 37: Bit config for Height@BER.......................................................................................................................................... 90
Table 38: Bit config for Height@BER.......................................................................................................................................... 91
Table 39: Bit config for TN@BER................................................................................................................................................91
Table 40: Bit config for mask hits................................................................................................................................................ 92
Table 41: Bit config for autofit mask hits measurement...............................................................................................................93
Table 42: Bit config for mask hits ratio measurement................................................................................................................. 95
Table 43: Bit config for mask margin measurement.................................................................................................................... 95
Table 44: Bit config for amplitude measurements....................................................................................................................... 96
Table 45: Bit config for PCI express measurements................................................................................................................... 97
Table 46: BER configure............................................................................................................................................................. 97
Table 47: RJ-DJ analysis of repeating options............................................................................................................................ 98
Table 48: RN-DN analysis of repeating options........................................................................................................................ 101
Table 49: Bus state options....................................................................................................................................................... 104
Table 50: Configuration for custom gating.................................................................................................................................105
Table 51: Configuring edges - Jitter only...................................................................................................................................106
Table 52: Configuring edges - Jitter + Noise............................................................................................................................. 107
Table 53: Configuring edges - Jitter + Noise............................................................................................................................. 107
Table 54: Configuring edges for skew measurements.............................................................................................................. 108
Table 55: Configuring edges for differential CrossOver voltage measurements....................................................................... 109
Table 56: Configuring edges for phase noise measurements................................................................................................... 109
Table 57: Configuring edges for N-Period measurements.........................................................................................................110
Table 58: Configuring edges for setup/hold............................................................................................................................... 111
Table 59: Configuring edges for CC-Period/Duty cycle measurements.....................................................................................111
Table 60: Configuring edges for DCD measurement.................................................................................................................112
Table 61: Configuration options for rise slew rate .....................................................................................................................113
Table 62: Configuration options for fall slew rate ......................................................................................................................113
Table 63: Configuring edges for time outside level....................................................................................................................114
Table 64: Configuring edges for F/N measurements - Jitter Only..............................................................................................115
Table 65: Configuring edges for F/N measurements - Jitter + Noise.........................................................................................116
Table 66: Configuring edges for DDR tERR(m-n)......................................................................................................................117
Table 67: Configuring edges for DDR tERR(n)..........................................................................................................................118
DPOJET Jitter, Noise and Eye Diagram Analysis Solution Application Help 28
Page 29

List of Tables
Table 68: Configuring edges for DDRtJIT(per) DDRtCK(avg) and DDRtJIT(duty).................................................................... 118
T
able 69: Configuring edges for DDR VIH.DQ(AC), VIH.DQ(DC), VIL.DQ(AC), and VIL.DQ(DC)........................................... 119
Table 70: Spread spectrum clock.............................................................................................................................................. 120
Table 71: Margin config for mask margin.................................................................................................................................. 120
Table 72: DFE configuration for DFE EH.................................................................................................................................. 121
Table 73: DFE configuration for DFE EW..................................................................................................................................121
Table 74: DFE configuration for DFE Eye Diagram...................................................................................................................122
Table 75: Measurements and available plots............................................................................................................................ 129
Table 76: Autoset configuration options.................................................................................................................................... 136
Table 77: Digital channels......................................................................................................................................................... 139
Table 78: Digital channels......................................................................................................................................................... 140
Table 79: Configure sources ref levels autoset configuration....................................................................................................143
Table 80: Configure sources ref levels configuration................................................................................................................ 145
Table 81: Autoset ref level configuration................................................................................................................................... 146
Table 82: Preferences-General options.....................................................................................................................................148
Table 83: Preferences-Measurement options........................................................................................................................... 149
Table 84: Preferences-Jitter Decomp options........................................................................................................................... 151
Table 85: Preferences-Path defaults options............................................................................................................................ 153
Table 86: Data snapshot- Statistics options.............................................................................................................................. 154
Table 87: Data snapshot- Measurement options.......................................................................................................................155
Table 88: Log-Statistics options................................................................................................................................................ 158
Table 89: Log-Measurements options....................................................................................................................................... 159
Table 90: Log-Worst case options.............................................................................................................................................162
Table 91: Limits options.............................................................................................................................................................168
Table 92: Measurement configuration information.................................................................................................................... 169
Table 93: Ref level configuration information............................................................................................................................ 170
Table 94: Miscellaneous configuration information................................................................................................................... 171
Table 95: Results menu options................................................................................................................................................ 172
Table 96: Plot type definitions................................................................................................................................................... 178
Table 97: Plot selections........................................................................................................................................................... 182
Table 98: Configuring a bathtub plot......................................................................................................................................... 183
Table 99: Configuring a spectrum plot.......................................................................................................................................184
Table 100: Configuring a time trend.......................................................................................................................................... 185
Table 101: Configuring a histogram plot....................................................................................................................................185
Table 102: Configuring a transfer plot....................................................................................................................................... 186
DPOJET Jitter, Noise and Eye Diagram Analysis Solution Application Help 29
Page 30

List of Tables
Table 103: Configuring a phase noise plot................................................................................................................................ 188
T
able 104: Configuring an eye diagram plot for eye height.......................................................................................................188
Table 105: Configuring an eye diagram for mask hits............................................................................................................... 191
Table 106: Configuring an eye diagram for DFE measurements.............................................................................................. 192
Table 107: Composite jitter histogram plot................................................................................................................................ 194
Table 108: Composite noise histogram plot.............................................................................................................................. 195
Table 109: Configuring a noise bathtub plot..............................................................................................................................196
Table 110: Configure a BER Eye contour plot...........................................................................................................................197
Table 111: Configure a BER Eye plot........................................................................................................................................198
Table 112: Configure a Correlated Eye plot...............................................................................................................................198
Table 113: Configure a PDF Eye plot........................................................................................................................................ 199
Table 114: Plot toolbar functions............................................................................................................................................... 200
Table 115: Zoom functions in a plot...........................................................................................................................................201
Table 116: Cursor functions in a plot......................................................................................................................................... 202
Table 117: Report generation options........................................................................................................................................203
Table 118: Comment options.....................................................................................................................................................207
Table 119: Source parameters.................................................................................................................................................. 216
Table 120: Ref level menu parameters..................................................................................................................................... 217
Table 121: Autoset Ref Levels Parameters...............................................................................................................................217
Table 122: Preferences parameters.......................................................................................................................................... 218
Table 123: Deskew parameters.................................................................................................................................................219
Table 124: Data logging parameters......................................................................................................................................... 220
Table 125: Bit config parameters...............................................................................................................................................221
Table 126: Mask Hits, Autofit Mask Hits parameters.................................................................................................................222
Table 127: BER parameters...................................................................................................................................................... 222
Table 128: Edges parameters................................................................................................................................................... 222
Table 129: N-Period parameters............................................................................................................................................... 223
Table 130: Positive and Negative duty cycle, CC Period parameters....................................................................................... 223
Table 131: Phase noise parameters..........................................................................................................................................223
Table 132: DCD parameters......................................................................................................................................................223
Table 133: F/N parameters........................................................................................................................................................224
Table 134: Skew parameters.....................................................................................................................................................224
Table 135: Setup and Hold parameters.....................................................................................................................................224
Table 136: Rise slew rate parameters.......................................................................................................................................224
Table 137: Fall slew rate parameters........................................................................................................................................ 225
DPOJET Jitter, Noise and Eye Diagram Analysis Solution Application Help 30
Page 31

List of Tables
Table 138: Time outside level parameters.................................................................................................................................225
T
able 139: Overshoot/Undershoot parameters......................................................................................................................... 225
Table 140: V-Diff-Xovr parameters............................................................................................................................................ 225
Table 141: CrossOver parameters............................................................................................................................................ 225
Table 142: PLL Clock recovery method parameters................................................................................................................. 226
Table 143: Constant clock recovery method parameters.......................................................................................................... 227
Table 144: Explicit clock recovery method parameters............................................................................................................. 227
Table 145: Advanced clock recovery configuration parameters................................................................................................227
Table 146: SSC parameters...................................................................................................................................................... 228
Table 147: RJ-DJ analysis parameters..................................................................................................................................... 228
Table 148: RN-DN analysis parameters....................................................................................................................................229
Table 149: Filters parameters....................................................................................................................................................230
Table 150: Filter configuration for SJ@Freq..............................................................................................................................230
Table 151: Advanced filter configure parameters......................................................................................................................230
Table 152: Bus state options..................................................................................................................................................... 230
Table 153: General parameters.................................................................................................................................................231
Table 154: Global parameters................................................................................................................................................... 232
Table 155: Margin parameters.................................................................................................................................................. 232
Table 156: DFE parameters...................................................................................................................................................... 233
Table 157: Histogram plot parameters...................................................................................................................................... 233
Table 158: Eye diagram plot parameters.................................................................................................................................. 234
Table 159: Spectrum plot parameters....................................................................................................................................... 234
Table 160: Time trend plot parameters......................................................................................................................................234
Table 161: Phase noise plot parameters...................................................................................................................................235
Table 162: Bathtub plot parameters.......................................................................................................................................... 235
Table 163: Transfer function plot parameters............................................................................................................................235
Table 164: Composite jitter histogram plot parameters.............................................................................................................236
Table 165: Noise bathtub plot parameters................................................................................................................................ 236
Table 166: Noise bathtub plot parameters................................................................................................................................ 236
Table 167: Composite noise histogram plot parameters........................................................................................................... 236
Table 168: BER Eye plot parameters........................................................................................................................................ 237
Table 169: Correlated Eye plot parameters...............................................................................................................................237
Table 170: PDF Eye plot parameters........................................................................................................................................ 237
Table 171: Reports parameters.................................................................................................................................................238
Table 172: Progress bar status messages................................................................................................................................ 239
DPOJET Jitter, Noise and Eye Diagram Analysis Solution Application Help 31
Page 32

List of Tables
Table 173: Error codes.............................................................................................................................................................. 246
T
able 174: Measurement range limit values..............................................................................................................................252
Table 175: Measurement units.................................................................................................................................................. 259
Table 176: Period/Freq measurements..................................................................................................................................... 260
Table 177: Jitter measurements................................................................................................................................................ 261
Table 178: Noise measurements...............................................................................................................................................263
Table 179: Timing measurements............................................................................................................................................. 263
Table 180: Eye measurements..................................................................................................................................................264
Table 181: Amplitude measurements........................................................................................................................................265
Table 182: Standard-specific measurements............................................................................................................................ 265
Table 183: Argument types........................................................................................................................................................311
DPOJET Jitter, Noise and Eye Diagram Analysis Solution Application Help 32
Page 33

Welcome
Welcome
DPOJET is a jitter, noise, timing, and eye analysis tool for Tektronix Performance Digital Oscilloscopes (DPO5000/B, MSO5000/B,
DPO7000C, DPO70000C/D/DX, DSA70000C/D, MSO70000/C/DX, DPO72304SX, DPO73304SX, DPO75002SX, DPO75902SX, and
DPO77002SX series). DPOJET enables you to achieve new levels of productivity, efficiency, and measurement reliability on complex
clock, digital, and serial data signals. DPOJET revolutionized jitter analysis by adding noise analysis.
Some of the features of DPOJET are:
• Advanced Jitter, Noise and Timing Analysis for clocks and data signals, with up to 99 simultaneous measurements on 12 analog and
16 digital sources.
• Jitter Guide/Serial Data wizard for easy configuration of popular measurement sets.
• One Touch Jitter wizard for quick jitter summaries.
• Accurate jitter decomposition and TJ (BER) estimation using industry-accepted methods.
• Isolate jitter and noise due to crosstalk, and make random and deterministic estimations in the presence of crosstalk.
• Comprehensive measurement statistics.
• Random Jitter (RJ) Lock value for analysis.
• BER analysis of serial data rates.
• BUJ analysis of both clock and data signals.
• Flexible measurement/statistic logging and export capabilities.
• Sophisticated plots for graphical analysis such as Histograms, Time Trends, Eye Diagrams, Spectrums, Bathtub Plots, BER Eye
Contour, Composite Jitter Histogram, Composite Noise Histogram, Noise Bathtub, BER eye, Correlated Eye, PDF Eye and Real-Time
Eye® diagrams with transition and non-transition bit separation.
• Tektronix patented Programmable PLL software clock recovery.
• Standards-specific support for clock recovery and jitter separation methods.
• Capture and storage of worst-case waveforms for subsequent analysis.
• Thorough remote programmability using oscilloscope-like syntax.
• Optical measurements are added under optical standard tab: Average Optical Power, Extinction Ratio, Optical Modulation Amplitude,
Optical High, Optical Low, Eye Crossing Level, Eye Crossing Time, Eye Crossing Percent, Mask Hit Ratio, and Mask Margin.
• Characterizing and compensating oscilloscope vertical noise from the measured result.
DPOJET Jitter, Noise and Eye Diagram Analysis Solution Application Help 33
Page 34

Introduction to the application
Introduction to the application
Related documentation
ektronix manuals are available at: www.tektronix.com/manuals and www.tektronix.com/software. Use the following table to determine the
T
document that you need:
Table 1: List of reference documents
For information on: Refer to:
• Operating the Oscilloscope Oscilloscope user manual.
Oscilloscope user online help.
• Software warranty
List of available applications
•
• Compatible oscilloscopes
• Relevant software and firmware version numbers
• Applying a new option key label
• Installing an application
• Enabling an application
• Downloading updates from the Tektronix Web site
Optional Applications Software on Windows-Based Oscilloscopes
Installation Manual, which is provided on the Optional Applications
Software on Windows-Based Oscilloscopes CD-ROM, in the
Documents directory.
Conventions
Online Help uses the following conventions:
When steps require sequence of selections using the application interface, the “>” delimiter marks each transition between a menu and
•
an option. For example, Analyze > Wizard > One Touch Jitter.
• The terms “DPOJET application” and “application” refer to DPOJET.
• The term “oscilloscope” refers to any product on which this application runs.
• The term “DUT” is an abbreviation for Device Under Test.
• The term “select” is a generic term that applies to the methods of choosing an option: with a mouse or with the touch screen.
• User interface screen graphics are taken from a DPO7000 series oscilloscope.
You can find a PDF (portable document format) file for this document in the Documents directory on the Optional Applications Software on
Windows-Based Oscilloscopes DVD. The DVD booklet only contains information on installing the application from the DVD and on how to
apply a new label. You can also find the PDF and the Online Help at Start > All Programs > TekApplications > DPOJET.
Table 2: Icon descriptions
Icon Meaning
This icon identifies important information.
Table continued…
DPOJET Jitter, Noise and Eye Diagram Analysis Solution Application Help 34
Page 35

Introduction to the application
Icon Meaning
This icon identifies conditions or practices that could result in loss of data.
This icon identifies additional information that will help you use the application more efficiently.
Technical support
ektronix welcomes your comments about products and services. Contact Tektronix through mail, telephone, or the Web site. Click
T
Contacting Tektronix for more information.
Tektronix also welcomes your feedback. Click Customer feedback for suggestions for providing feedback to Tektronix.
Customer feedback
Tektronix values your feedback on our products. To help us serve you better, please send us your suggestions, ideas, or other comments
you may have regarding the application or oscilloscope.
Direct your feedback via email to
techsupport@tektronix.com
Or FAX at (503) 627-5695, and include the following information:
General Information
• Oscilloscope model number (for example, DPO/MSO5000, DPO7000, DSA/DPO/MSO70000 series) and hardware options, if any.
• Software version number.
• Probes used.
Application-specific Information
• Description of the problem such that technical support can duplicate the problem.
• If possible, save the oscilloscope and application setup files as .set and associated .xml files.
• If possible, save the waveform on which you are performing the measurement as a .wfm file.
Once you have gathered this information, contact technical support by phone or through e-mail. In the subject field, please indicate
“DPOJET Problem” and attach the .set, .xml and .wfm files to your e-mail. If there is any query related to the actual measurement
results, then you can generate a .mht report and send it.
The following items are important, but optional:
• Your name
• Your company
• Your mailing address
• Your phone number
• Your FAX number
Enter your suggestion. Please be as specific as possible.
Please indicate if you would like to be contacted by Tektronix regarding your suggestion or comments.
DPOJET Jitter, Noise and Eye Diagram Analysis Solution Application Help 35
Page 36

Introduction to the application
To include screen shots of the oscilloscope waveform and DPOJET user interface, from your oscilloscope menu bar, click File > Save As >
Screen Capture. T
name in the Save As dialog box, select an image file format (For example:.bmp or .png or .jpeg), choose a save location and select Save.
You can then attach the file(s) to your e-mail (depending on the capabilities of your e-mail editor).
o include screenshots of the DPOJET plots, select the floppy-disk icon from the plots toolbar. In either case, enter a file
DPOJET Jitter, Noise and Eye Diagram Analysis Solution Application Help 36
Page 37

Getting started
Product description
Getting started
DPOJET is a jitter
DPO7000C, DPO70000C/D/DX, DSA70000C/D, MSO70000/C/DX, DPO72304SX, DPO73304SX, DPO75002SX, DPO75902SX, and
DPO77002SX series). DPOJET enables you to achieve new levels of productivity, efficiency, and measurement reliability on complex
clock, digital, and serial data signals. DPOJET answers the challenge with a jitter and noise breakdown extended to properly classify the
bounded uncorrelated disturbers in their own category, increasing the accuracy of the jitter/noise result.
The application provides the following features:
• One Touch Jitter Summary.
• Measurement Setup Wizard.
• Isolate jitter and noise due to crosstalk, and make random and deterministic estimations in the presence of crosstalk.
• Qualify the waveform measurement within a selected result range by General.
• Limit the waveform (data) analysis by Gating, applying a Qualifier or configuring population limits.
• High pass and low pass measurement filters.
• Random Jitter (RJ) Lock value for analysis.
• Auto-detection of signal type (clock or data), bit rate, and pattern length.
• Different architectures for clock recovery to establish a reference clock, the edges of which can be used as a basis for timing
comparisons.
• RJ-DJ and RN-DN decomposition on repeating and arbitrary data patterns.
• BER analysis of serial data rates.
• BUJ analysis of both clock and data signals.
• Eye diagrams with transition and non-transition bits separation.
• Show results as numeric and graphical displays.
• Different types of two-dimensional display plots for easier analysis of results.
• Automatic reference level autoset for eye diagrams, jitter, noise and timing measurements.
• Preferences shortcut to set up options available at the Select panel.
Jitter Analysis Jitter Analysis is the measurement of Time Interval Error (TIE), advanced RJ-DJ
Noise Analysis Noise Analysis is the set of measurements (RN, NN, DDN, ..) that are analogous to Jitter
Timing Analysis Timing analysis is the measurement of period, setup, hold, skew, and other edge-to-edge
Eye Diagram Analysis Eye diagram analysis is the plotting and measurement of eye diagrams and masks.
• Oscilloscope vertical noise compensation from measurement result.
, noise, timing, and eye diagram analysis tool for Tektronix Performance Digital Oscilloscopes (DPO5000/B, MSO5000/B,
decomposition, and other clock to data edge relationships.
component measurements (RJ, PJ, DDJ, ..).
data timing relationships.
DPOJET option levels
The DPOJET application of
the following order codes:
• DJE – Jitter and Eye Diagram Analysis Tools - Essentials
• DJA – Jitter and Eye Diagram Analysis Tools - Advanced
• DJAN – Noise Analysis Tools - Requires DJA
DPOJET Jitter, Noise and Eye Diagram Analysis Solution Application Help 37
fers three different levels of features, depending on how it is configured. The configurations are determined by
Page 38

Getting started
Note: The application name “Jitter and Eye Diagram Analysis T
is "Noise Analysis Tools" and it requires DJA enabled. However, Help > About DPOJET indicates the configured option level.
Save/Recall is compatible between the option levels. If a setup file saved in DJA is recalled in DJE, only the capabilities available
in DJE will be recalled. If a setup file saved in DJAN is recalled in DJA or DJE, only the capabilities available in DJA or DJE will be
recalled.
ools” is the same for DJE, DJA. The application name for DJAN
Jitter and Eye Diagram Analysis Tools - Essentials
Use Essentials for basic timing and jitter analysis. Essentials of
• Period, Frequency and Time Interval Error analysis.
• Timing parametrics such as rise/fall times, pulse width and duty cycle.
• Many graphical tools such as histograms, time trends, and spectrums.
• Configurable HTML report generation.
• Logging features for recording individual measurements, statistics, or worst-case waveforms.
• Comprehensive remote control using oscilloscope-like GPIB syntax.
• A wizard interface to ease common setup tasks.
Note: Summary V
iew and Overall Test Result are not available for DJE.
fers:
Jitter and Eye Diagram Analysis Tools-Advanced
The Advanced configuration of
• Jitter separation (RJ-DJ analysis).
• Eye measurements.
• Amplitude measurements.
• Measurement filters.
• Eye diagrams, bathtub plots or Mask Hits waveform plots.
• Pass/Fail limits capability.
• RJ Lock value
fers all the features of Essentials, and adds the following:
Note: Option DJA is required for PCI Express Gen1/Gen2/Gen3 measurements and for DDRA measurements.
Noise Analysis Tools - Requires DJA
The Noise Analysis T
• Jitter separation RJ(h), RJ(v), PJ(h), PJ(v).
• Noise measurements RN, RN(v), RN(h), DN, DDN, DDN(1), DDN(0), PN, PN(v), PN(h), NPN, TN@BER, Unit Amplitude.
• Plots related to composite Jitter+Noise analysis, such as BER Eye, Correlated Eye and PDF Eye.
• Noise measurement plots such as BER Eye contour, Noise Bathtub, Composite Noise Histogram.
ools configuration offers all the features of Advanced and adds the following:
Compatibility
For information on oscilloscope compatibility, refer to the Optional Application Software on Microsoft Windows Based Oscilloscopes
Installation Manual, Tektronix part number 077-0067-XX. The manual is available as a PDF file.
Requirements and restrictions
DPOJET requires Matlab MCR (Matlab Compiler Runtime) 8.0 for 64-bit oscilloscopes. DPOJET requires .Net framework v4 or higher for
64-bit oscilloscopes.
DPOJET Jitter, Noise and Eye Diagram Analysis Solution Application Help 38
Page 39

Supported probes
The application supports the following probes:
TAP1500
•
• TAP2500
• TAP3500
• P5100
• P6015
• P6101A
• P6139A
• P6241
• P6243
• P6245
• P6249
• P6150
• P6158
• P7240
• P7260
• P7330
• P7340A
• P7350
• P7350SMA
• P7360A
• P7380A
• P7380SMA
• P7313A
• P7313SMA
• All P75XX, P76XX and P77XX probes
Getting started
Installing the application
Refer to the Optional Applications Software on Windows-Based Oscilloscopes Installation Manual for the following information:
• Software warranty.
• List of available applications, compatible oscilloscopes, and relevant software and firmware version numbers.
• Applying a new option installation key label.
• Installing an application.
• Enabling an application.
• Downloading updates from the Tektronix Web site.
You can find a PDF (portable document format) file for this document in the Documents directory on the Optional Applications Software on
Windows-Based Oscilloscopes DVD. The DVD booklet contains information on how to install the application from the DVD and on how to
apply a new option installation key label.
DPOJET Jitter, Noise and Eye Diagram Analysis Solution Application Help 39
Page 40

About DPOJET
Getting started
Click Help > About DPOJET to view application details such as the release software version number
Figure 1: About DPOJET
, application name, and copyright.
Note: The version displayed above is indicative only
the application installed.
, the version number displayed will vary depending upon the exact version of
DPOJET Jitter, Noise and Eye Diagram Analysis Solution Application Help 40
Page 41

Operating basics
Operating basics
About basic operations
Starting the application
On the oscilloscope menu bar, click Analyze > Jitter and Eye Analysis (DPOJET) > Select to open the application.
Application interface menu controls
Table 3: Application menu controls descriptions
Item Description
Tab Shortcut to a menu in the menu bar or a category of menu options; most tabs are short
cuts.
Area Visual frame with a set of related options.
Option button Button that defines a particular command or task.
Field A box to type in text, or to enter a value with the Keypad or a Multipurpose knob.
Check Boxes Use to select or clear preferences.
Scroll bar Vertical or horizontal bar at the side or bottom of a display area that can be used for moving
around in that area.
Browse Displays a window where to look through a list of directories and files.
Command button
Virtual Keypad icon
MP knob references (a or b) Identifiers that show which Multi Purpose Knob (MPK) may be used as an alternate
Button that initiates an immediate action such as Run command button in the
control panel.
Click to use on-screen keypad to enter alphanumeric values.
means to control a parameter; turn the knob on the oscilloscope front panel to adjust
the corresponding parameter Also, the value can be entered directly on the MPK display
component.
Virtual keypad
Select the icon and use the virtual keypad to enter alphanumeric values, such as reference voltage levels.
DPOJET Jitter, Noise and Eye Diagram Analysis Solution Application Help 41
Page 42

Figure 2: Virtual keypad
ips on DPOJET user interface
T
The following tips help you with the application user interface:
Operating basics
• Use the Serial Data/Jitter Guide to rapidly set up and initiate sets of commonly used measurements. After running the Serial Data/Jitter
Guide, you can modify the configuration parameters to meet specific needs.
• Select a measurement to create a measurement and add it to the current measurement table. New measurements initially use the
same source as the earlier measurement, or the most recently used source. Click
other source parameters such as the reference levels.
Select any measurement multiple times to create multiple copies. This may be useful if you wish to run the same measurement with
•
different configuration options.
• Use the Single button
again before processing has completed will interrupt the processing cycle.
Use the Run button
•
acquisition.
Use the Recalc button
•
performing a new acquisition. This is useful if you wish to modify a configuration parameter and re-run the measurements on the
current waveform.
to obtain a single set of measurements from a single new waveform acquisition. Pushing the button
to continuously acquire and accumulate measurements. Push the button again to interrupt the current
to perform measurements on the waveform currently displayed on the oscilloscope, that is without
to change the measurement source or adjust
Basic oscilloscope functions
Application directories
The installation directory for DPOJET is C:\Program Files\TekApplications\DPOJET. During installation, the
application sets up directories for various functions such as to save setup files. The file name extension is used to identify the file
type.
DPOJET Jitter, Noise and Eye Diagram Analysis Solution Application Help 42
Page 43

Table 4: Application directories
Default directory Used for
Operating basics
C:\%USERPROFILE%
\Tektronix\TekApplications\DPOJET\Images
C:\Users\Public\Tektronix\TekApplications
\DPOJET\Limits
C:\Users\Public\Tektronix\TekApplications
\DPOJET\Patterns
C:\%USERPROFILE%
\Tektronix\TekApplications\DPOJET\Logs
1
C:\Users\Public\Tektronix\TekApplications
\DPOJET\Masks
C:\%USERPROFILE%
\Tektronix\TekApplications\DPOJET\Reports
1
C:\%USERPROFILE%
\Tektronix\TekApplications\DPOJET\Data
1
Exported plot files.
1
Pass/fail limits files.
Bit patterns.
Log files. Consists of three subfolders:
• Statistics for statistics log files (.csv)
• Measurements for measurement log files (.csv) and
aveforms for worst case waveforms (.wfm)
• W
Mask files for various serial data standards. For Example - PCIE,
FBDIMM, SATA.
Report files (.mht ).
Error log file, DPOJETErrors.log.
C:\Users\Public\Tektronix\TekApplications
\DPOJET\Examples
File name extensions
Table 5: File name extensions
File Extension Description
.csv
.xml
.set
.mht
Table continued…
1
%USERPROFILE% represents your user location.
Ascii file containing Comma Separated Values. This file format may be read by any ascii text editor
(such as Notepad) or may be imported into spreadsheets such as Excel.
Ascii file containing measurement setup information, limits or other data in Extensible Markup
Language.
Binary file containing oscilloscope setup information in a proprietary format.
An HTML archive file, compatible with common Windows applications; and contain the full report,
including text and graphics.
Various tutorial and support files.
DPOJET Jitter, Noise and Eye Diagram Analysis Solution Application Help 43
Page 44

File Extension Description
Operating basics
.msk
.wfm
A user mask file.
Binary file containing an oscilloscope waveform record in a recallable, proprietary format.
Application menu shortcuts
The DPOJET application provides shortcuts for navigating the user interface. Use Alt+ A for the Analyze menu and Alt+A+J for Jitter and
Eye Analysis (DPOJET). Use Alt+A+E for PCI Express and Alt+A+U for USB 3.0 Essentials.
Note: is common for all submenus except the Help menu.
Table 6: Application shortcuts
Menu Items SubMenu Shortcut
Wizard One Touch Jitter Alt +A+J+J
Serial Data/Jitter Wizard Alt +A+J+W
Select Alt +A+J+S
Configure Alt +A+J+C
Results Alt +A+J+R
Plots Alt +A+J+P
Reports Alt +A+J+O
Export Data Snapshot Alt +A+J+E+D
Measurement Summary Alt +A+J+E+S
Data Logging Alt +A+J+L
Preferences Alt +A+J+F
Limits Alt +A+J+I
Global Configuration Alt +A+J+G
Measurement Summary Alt +A+J+M
Deskew Alt +A+J+K
Help
About DPOJET Alt +H+J
Table continued…
DPOJET Jitter, Noise and Eye Diagram Analysis Solution Application Help 44
Page 45

Operating basics
Menu Items SubMenu Shortcut
Help on Jitter and Eye Analysis Alt +H+T
Help on PCI Express MOI Alt+H+M
Help on USB 3.0 MOI Alt+H+U
Returning to the application
When you access oscilloscope functions, the DPOJET control windows may be replaced by the oscilloscope control windows or by the
oscilloscope graticule. Access oscilloscope functions in the following ways:
From the menu bar on the oscilloscope, choose Analyze > Jitter and Eye Analysis (DPOJET) > Select.
•
• Alternatively, switch between recently used control panels using the forward or backward arrows
panel.
on the right corner of the control
Warning log notifiers
Warning Log Notifiers display error messages or warnings. Warnings ( ) or Error ( ) messages are also shown in the results tab.
ou can click View Log to view the error log information in a text editor. Click OK to discard the displayed error message.
Y
Figure 3: Warning log notifiers(Error)
ou can set the duration for which the warning notification should appear on the screen in the Preferences dialog box or click OK to
Y
discard the warning information.
Figure 4: Warning log notifiers(Warning)
Note: The error or warning log is saved as DPOJETErrors.log in subfolder
location.
DPOJET Jitter, Noise and Eye Diagram Analysis Solution Application Help 45
, where %USERPROFILE% represents your user
Page 46

Saving and recalling setups
Saving a setup
Operating basics
The DPOJET application state is automatically saved with the oscilloscope state. T
follow these steps:
1. Click File > Save As > Setup.
2. In the file browser, select the directory to save the setup file.
3. Select or enter a file name. The application appends *_DPOJET.xml to store DPOJET setup, and *.set to store oscilloscope
settings.
4. Click Save.
Note: After the oscilloscope application is started, DPOJET needs to be launched at least once before any saved DPOJET
configuration can be recalled.
o save the oscilloscope settings and application state,
Recalling a saved setup
T
o recall the default application setup and oscilloscope settings, do the following steps:
1. Click File > Recall.
2. Select the directory in the file browser to recall the setup file.
3. Select a .set file and click Recall.
Note: Only .set files can be selected for recall; any corresponding _DPOJET
if DPOJET has been launched at least once since the oscilloscope application was started. If DPOJET has not been launched at
least once, the oscilloscope settings will be recalled but the DPOJET configuration will be ignored.
.xml file in the same directory will be recalled as well,
Recalling the default setup
T
o recall the default application and oscilloscope settings, click File > Recall Default Setup.
DPOJET Jitter, Noise and Eye Diagram Analysis Solution Application Help 46
Page 47

Jitter, Noise and Eye Diagram Analysis
Jitter, Noise and Eye Diagram Analysis
About Jitter, Noise and Eye-diagram analysis
This section describes the DPOJET measurement and their analysis for real-time oscilloscopes. Using Navigation panel and Control panel
DPOJET measurements are selected and analysed.
Control panel
The Control panel appears on the right of the application window. Using this panel, you can start or stop the sequence of processes for the
application and the oscilloscope to acquire information from the waveform. The controls are Clear, Recalc, Single and Run. The following
table describes each of these controls:
Figure 5: Control panel
Table 7: Control panel selections
Item Description
Clear Clears the current result display and resets any statistical results and autoset ref levels.
Recalc Runs the selected measurements on the current acquisition.
Single Initiates a new acquisition and runs the selected measurements.
Run Initiates a new acquisition and runs the selected measurements repeatedly until Stop is
clicked. Used only for live sources.
Show Plots Displays the plot summary window when clicked. This button appears in the control panel
only when a plot is selected.
DDR Analysis Shortcut to access the DDRA application from DPOJET. Appears in the control panel only
when DDRA is opened using Analyze > DDR Analysis.
The control panel with Show Plots is as shown:
DPOJET Jitter, Noise and Eye Diagram Analysis Solution Application Help 47
Page 48

Figure 6: Control panel (Show Plots)
Navigation panel
Jitter, Noise and Eye Diagram Analysis
The Navigation panel appears on the left of the application window
Reports.
. It consists of the following tabs: Select, Configure, Results, Plots and
Table 8: Navigation panel functions
Tab Description
Select Displays the various measurements available for selection. By default, this tab is
highlighted. Y
Eye and Amplitude tabs.
Configure Displays the configuration for the selected measurement.
Results Displays the result for the selected measurement.
Plots Displays the result as a two-dimensional plot for additional measurement analysis. You can
select and configure plots for selected measurements.
Reports Displays the configuration for generating reports in .mht format. Allows you to select
results, plots and details.
ou can click any measurement categorized with Period/Freq, Jitter, Time,
DPOJET Jitter, Noise and Eye Diagram Analysis Solution Application Help 48
Page 49

Figure 7: Navigation panel
Setting up DPOJET to take measurements
Setting up the application for analysis
Jitter, Noise and Eye Diagram Analysis
In general, setting up the application for analysis consists of these steps:
1. Selecting one or more measurements
2. Configuring parameters for the selected measurements
3. Configuring any global parameters
4. Adding plots to visual measurement results
Steps 2-4 are optional, and step 4 can be done either before or after measurement results have been calculated. In addition to this manual
process, several wizard interfaces (One T
Selecting measurements is accomplished by first selecting a measurement category (Period and Frequency, Jitter and Noise, Time, Eye,
Amplitude, or Standard-Specific Measurements) and then choosing specific measurements. A measurement may be selected multiple
times, for example to run on different waveform sources or to run on the same waveform source with different parameters.
Refer to the following sections for more details on various measurements:
Table of measurements-Period/Freq on page 52
Table of measurements-Jitter on page 53
Table of measurements-Noise on page 55
Table of measurements-Time on page 57
Table of measurements-Eye on page 58
Table of measurements-Amplitude on page 59
Table of measurements-Standard on page 60
ouch Jitter, Serial Data/Jitter Guide) are available that can streamline the process.
Related topics
Selecting a measurement
Deskew for accurate measurement
DPOJET Jitter, Noise and Eye Diagram Analysis Solution Application Help 49
Page 50

Jitter, Noise and Eye Diagram Analysis
Deskew for accurate measurement
o ensure accurate results for two-channel measurements and differential signals acquired on two channels, it is important to first deskew
T
the probes and oscilloscope channels before you take measurements of your DUT.
The application includes an automated deskew utility that you can use to deskew any pair of oscilloscope channels.
o produce the best deskew results, you should connect the probes to the fastest slew rate signals from your DUT.
Note: T
Connecting to a device under test (DUT)
Y
ou can use any compatible probes or cable interface to connect between your DUT and oscilloscope.
Warning: T
except with the properly rated probe tips. Refer to the probe manual for proper use. Failure to do so may cause injury or death.
Refer to the General Safety Summary in your oscilloscope manual.
o avoid electric shock, remove power from the DUT before connecting the probes. Do not touch exposed conductors
Deskewing on Oscilloscopes with bandwidth extension
Some T
ektronix oscilloscopes feature software-based bandwidth extension. The bandwidth extension may be enabled on a per-channel
basis.
Enabling or disabling bandwidth extension on any channel affects the skew on that channel. Thus, you should deskew probes and
channels after you make such configuration changes. Bandwidth Extension provides improved timing accuracy, phase matching, and
amplitude accuracy. It also will provide noise reduction. Bandwidth extension should be used at all times.
Steps to deskew probes and channels
To deskew probes and oscilloscope channels, follow these steps:
1. Refer to Connecting to a Device Under Test before starting the procedure.
2. Connect both probes to the fastest signal in your DUT.
Set up the oscilloscope as follows:
1. Use the Horizontal Scale knob to set the oscilloscope to an acquisition rate so that there is at least two, preferably five, samples per
edge or more samples on the deskew edge.
2. Use the Vertical Scale and Position knobs to adjust the signals to fill the display without missing any part of the signals.
3. Set the Record Length so that there are more than 100 edges in the acquisition.
4. Launch the DPOJET application.
5. Click Analyze > Jitter and Eye Analysis (DPOJET) > Deskew.
DPOJET Jitter, Noise and Eye Diagram Analysis Solution Application Help 50
Page 51

Jitter, Noise and Eye Diagram Analysis
Figure 8: Deskew setup
6. Set the Reference channel source to Ch1. The source waveform is the reference point used to deskew the remaining channels.
7. Set the Channel to be Deskewed source as Ch2.
8. T
o start the process, click Perform Deskew.
9. Repeat steps 7 and 8 for other Ch waveforms.
10. Select Summary to view the deskew values.
Figure 9: Deskew summary channel source and deskew values
Selecting a measurement
T
o take a measurement, click Analyze > Jitter and Eye Analysis (DPOJET) > Select.
You can select measurements listed under the following categories:
• Period/Freq: Click here to view the measurements grouped under Period/Freq.
• Jitter: Click here to view the measurements grouped under Jitter.
• Noise: Click here to view the measurements grouped under Noise.
• Time: Click here to view the measurements grouped under Time.
• Eye: Click here to view the measurements grouped under Eye.
• Amplitude: Click here to view the measurements grouped under Amplitude.
DPOJET Jitter, Noise and Eye Diagram Analysis Solution Application Help 51
Page 52

• Standard: Click here to view the measurements grouped under Standard.
Jitter, Noise and Eye Diagram Analysis
Note: Noise measurements are accessible only when DJAN - Noise Analysis T
• When the Analysis Method is Jitter Only, Jitter tab is displayed and only jitter measurements are accessible under Select panel. Click
Analyze > Jitter and Eye Analysis (DPOJET) > Preferences > Jitter Decomp to select the analysis method as Jitter Only
Figure 10: Jitter Only measurements are enabled
•
When the Analysis Method is Jitter + Noise, Jitter tab will be displayed as Jitter/Noise with measurements under Select panel. You can
also see two radio button for selecting Jitter or Noise measurements. By default Jitter measurements are selected. Click Analyze >
Jitter and Eye Analysis (DPOJET) > Preferences > Jitter Decomp to select the analysis method as Jitter + Noise.
ools is enabled.
.
Figure 11: Jitter/Noise measurements are enabled
Note: Preferences-Jitter decomp on page 150
The application provides you different methods to set up the application:
•
Wizard
The Serial Data/Jitter Guide allows you to set up, configure, and run the selected set of measurements without requiring any
knowledge of the control menus. However, it does not provide access to many of the advanced features.
• Measurement Setup sequence
The Measurement Setup Sequence buttons in the left navigation panel shows the logical order you would follow to set up the
application if you do not use the Wizard.
Alternatively, click Analyze > [application name] to personalize DPOJET for a specific standard. For example, to take a PCI Express
measurement, click Analyze > PCI Express and for USB 3.0 Essentials measurement, click Analyze > USB 3.0 Essentials.
allows you to enable or disable Noise measurements.
Related topics
DPOJET option levels on page 37
Table of measurements-Period/Freq
Definitions of the period and frequency-related measurements are given in the following table:
DPOJET Jitter, Noise and Eye Diagram Analysis Solution Application Help 52
Page 53

Jitter, Noise and Eye Diagram Analysis
Table 9: Period/Frequency measurements definitions
Measurement Description
Period For clock signals, the elapsed time between consecutive crossings of the mid reference voltage level in
the direction specified; one measurement is recorded per crossing pair
time between consecutive crossings of the mid reference voltage in opposite directions divided by the
estimated number of unit intervals for that pair of crossings; one measurement is recorded per unit
interval so N consecutive bits of the same polarity result in N identical period measurements.
Frequency The inverse of the period for each cycle or unit interval.
CC–Period The cycle-to-cycle period; the difference in period measurements from one cycle to the next, that is the
first difference of the Period measurement.
N–Period The duration of N periods.
Pos Width Amount of time the waveform remains above the mid reference voltage level.
Neg Width Amount of time the waveform remains below the mid reference voltage level.
. For data signals, the elapsed
+Duty Cycle The ratio of positive width to period, expressed in %.
–Duty Cycle The ratio of negative width to period, expressed in %.
+CC–Duty The difference between two consecutive positive widths.
–CC–Duty The difference between two consecutive negative widths.
Data Rate This measurement calculates the inverse of the mean duration of all cycles defined by the consecutive
starting and stopping edges if the signal is clock and mean duration of the unit intervals, if the signal is
data.
Table of measurements-Jitter
By default, the application enables analysis of all jitter components except non-periodic jitter (NPJ). This is because NPJ (a form of
bounded uncorrelated jitter (BUJ) that isn’t periodic) is less frequently encountered and its analysis typically requires longer waveforms,
multiple waveforms, or both. The default processing mode is called Spectral Only
mode to Spectral + BUJ. This is done either from the Preferences-Jitter Decomp panel or from the Jitter map.
Definitions of the jitter-related measurements are given in the following table.
Note: All jitter measurements except TIE are statistical measurements that require suf
effects can be observed and the random jitter can be modeled.
Table 10: Jitter measurements definitions
. To enable analysis of NPJ, you must set the processing
ficient record length so that all deterministic
Measurement Description
TIE Time interval error is the difference in time between an edge in the source waveform and the
corresponding edge in a reference clock or explicitly by another source signal. The reference clock is
determined by a clock recovery process.
Table continued…
DPOJET Jitter, Noise and Eye Diagram Analysis Solution Application Help 53
Page 54

Jitter, Noise and Eye Diagram Analysis
Measurement Description
RJ Random jitter is the statistics for all timing errors not exhibiting deterministic behavior, based on the
assumption that they follow a Gaussian distribution. If the Jitter separation model is set to Spectral
+ BUJ, the Gaussian assumption is further validated and jitter appearing to be non-Gaussian is
excluded. Random jitter is characterized by its standard deviation.
RJ–δδ Dual-dirac random jitter is random jitter as defined above, but calculated based on a simplified
assumption that the histogram of all deterministic jitter can modeled as a pair of equal-magnitude dirac
functions (impulses known as delta-functions).
DJ Deterministic jitter is the statistics for all timing errors that follow deterministic behavior. Deterministic
jitter is characterized by its peak-to-peak value.
DJ–δδ Dual-dirac random jitter is random jitter as defined above, but calculated on the same simplified model
as described under RJ–
δδ.
PJ Periodic jitter is the statistics for that portion of the deterministic jitter which is periodic, but for which
the period is not correlated with any data in the waveform.
DDJ Data-dependent jitter is the statistics for that portion of the deterministic jitter directly correlated with
the data pattern in the waveform.
DCD Duty cycle distortion is the statistics for that portion of the deterministic jitter directly correlated with
signal polarity, that is the difference in the mean timing error on positive edges versus that on negative
edges.
TJ@BER Total jitter at a specified bit error rate (BER). This combines the random and deterministic effects, and
predicts a peak-to-peak jitter that will only be exceeded with a probability equal to the BER.
Jitter Summary This is not an individual measurement but a convenience function. Pressing this button automatically
adds a set of eleven jitter-related measurements with a single action. The measurements are: TIE, RJ,
RJ–δδ, DJ, DJ–δδ, PJ, SRJ, DDJ, DCD, TJ@BER, and Width@BER.
Phase Noise The RMS magnitude for all integrated timing jitter falling between two specified frequency limits. This
measurement is only applicable for clock signals.
NPJ 2
Non-Period Jitter is the statistics for that portion of the non-deterministic jitter that has a bounded
distribution. It is characterized by its dual-dirac amplitude (that is, the amount by which its presence
causes an additional separation of the two Gaussian distributions in the dual-dirac model).
J2 Total jitter at a bit error rate (BER) value of 2.5E-3. This statistical value predicts a peak-to-peak jitter
that will only be exceeded with a probability equal to the BER.
J9 Total jitter at a bit error rate (BER) value of 2.5E-10. This statistical value predicts a peak-to-peak jitter
that will only be exceeded with a probability equal to the BER.
Table continued…
2
The NPJ measurement is only available when the Jitter Separation Model is set to Spectral + BUJ under DPOJET Preferences Setup.
DPOJET Jitter, Noise and Eye Diagram Analysis Solution Application Help 54
Page 55

Jitter, Noise and Eye Diagram Analysis
Measurement Description
F/N The peak-to-peak amplitude of periodic jitter occurring at a rate that divides the data rate by an integer.
(When a deterministic jitter component could be interpreted either as F/N or DDJ, it is treated as DDJ
by convention.)
SRJ Sub-rate jitter is jitter at rates that integrally divide the data rate. SRJ typically results when a data
stream has been created by multiplexing multiple lower-rate streams. SRJ is a subcomponent of PJ,
and can be further isolated into F/N components.
RJ(h) RJ(h) is that component of measured RJ which is due to direct phase modulation.
RJ(v) RJ(v) is that component of measured RJ which is due to vertical waveform fluctuations, appearing as
phase fluctuations due to AM-to-PM conversion on the waveform rising or falling edges.
PJ(h) PJ(h) is that component of measured PJ which is due to direct phase modulation.
PJ(v) PJ(v) is that component of measured PJ which is due to vertical waveform fluctuations, appearing as
phase fluctuations due to AM-to-PM conversion on the waveform rising or falling edges.
PJrms Periodic Jitter RMS (PJrms) is the root mean square amplitude for that portion of the deterministic jitter
which is periodic but for which the period is not correlated with any data pattern in the waveform. A
single PJrms value is determined for each acquisition, by means of RJ-DJ separation analysis.
SJ@Freq
PkPkClkRJ PkPkClkRJ is the random component value of the histogram data.
PkPkClkDJ PkPkClkDJ is the deterministic component value of the histogram data.
PkPkClkTJ PkPkClkTJ is equal to RJ*2*Q@BER+DJ.
SJ@Freq is a Sinusoidal Jitter measurement which reports the peak to peak amplitude of energy
within the narrow spectral band specified by the user
acquisition, by means of TIE spectral analysis.
. A single SJ@Freq value is determined for each
Related topics
Breakdown of jitter (Jitter map)
Preferences jitter decomp
able of measurements-Noise
T
When DPOJET application is first launched, the noise analysis is disabled and no noise measurements appear for selection. To enable
noise measurements, click Preferences > Jitter Decomp and select the Analysis Method as Jitter + Noise. This option will not appear
unless your scope has the optional Jitter + Noise package (DJAN).
The application doesn't attempt to detect non-periodic Bounded Uncorrelated Noise (NPN). This is because NPN is less frequently
encountered and its analysis typically requires longer waveforms, multiple waveforms, or both. The default processing mode is called
Spectral Only. To enable analysis of NPN, you must set the processing mode to Spectral + BUJ. This is done either from the Preferences
jitter decomp panel or from the Noise map. The following table describes the measurements under Noise.
DPOJET Jitter, Noise and Eye Diagram Analysis Solution Application Help 55
Page 56

Jitter, Noise and Eye Diagram Analysis
Table 11: Noise measurements definitions
Measurement Description
RN Random noise (RN) is the RMS magnitude of all non-deterministic Gaussian-distributed vertical
deviations from the nominal bit amplitude at the specified UI of
RN(v) RN(v) is that component of measured RN which is due to direct amplitude modulation.
RN(h) RN(h) is that component of measured RN which is due to phase modulation, appearing as noise
fluctuations due to PM-to-AM conversion near the center of the unit interval.
DN Deterministic noise (DN) is the peak-to-peak amplitude for all amplitude variations from nominal bit
amplitudes that exhibit deterministic (non-random) behavior.
DDN Data dependent noise (DDN) is the total vertical eye closure due to bit pattern-correlated vertical
variations, at the center of the eye. It is the sum of the positive peak DDN(0) relative to the nominal low
level, and the negative peak DDN(1) relative to the nominal high level.
DDN(0) Data dependent noise 0 (DDN0) is the peak-to-peak amplitude for all bit pattern-correlated vertical
variations of low bits from the nominal low level, at the specified UI offset.
fset of each bit interval.
DDN(1) Data dependent noise 1 (DDN1) is the peak-to-peak amplitude for all bit pattern-correlated vertical
variations of high bits from the nominal high level, at the specified UI offset.
PN Periodic noise (PN) is the peak-to-peak amplitude for that portion of the deterministic noise which is
periodic, but for which the period is not correlated with any data pattern in the waveform.
PN(v) PN(v) is that component of measured PN which is due to direct amplitude modulation.
PN(h) PN(h) is that component of measured PN which is due to phase modulation, appearing as noise
fluctuations due to PM-to-AM conversion near the center of the unit interval.
NPN
3
Non-Periodic noise (NPN) is the dual-dirac magnitude of that portion of the bounded uncorrelated
noise that is not periodic. Bounded uncorrelated noise (BUN) is the collection of amplitude variations
that is not correlated to data pattern but which is bounded in vertical amplitude (i.e. does not grow
larger as the observation interval is increased). BUN is composed of PN plus NPN.
TN@BER Total noise at a specified bit error rate (BER). This extrapolated value statistically predicts a peak-to-
peak vertical eye closure (at the specified horizontal bit offset) that will only be exceeded with a
probability equal to the BER. It is typically not equal to the actual vertical eye closure for a given
observation interval.
Unit Amplitude Unit Amplitude is the difference between nominal high and low values, and it is used to normalize all
the other noise measurements if the units are switched from absolute to normalized. The nominal high
level is the mean value of the distribution that represents DDN(1), and the nominal low level is the
mean value of the distribution that represents DDN(0).
Table continued…
3
The NPN measurement is only available when the Jitter Separation Model is set to Spectral + BUJ under DPOJET Preferences Setup.
DPOJET Jitter, Noise and Eye Diagram Analysis Solution Application Help 56
Page 57

Jitter, Noise and Eye Diagram Analysis
Measurement Description
Noise Summary This is not an individual measurement but a convenience function. Pressing this button automatically
adds a set of nine noise-related measurements with a single action. The measurements are: RN, DN,
PN, DDN, DDN0, DDN1, TN@BER and NPN3.
Related topics
Breakdown of noise (Noise map)
Preferences jitter decomp
T
able of measurements-Time
Definitions of the time-related measurements are given in the following table:
Table 12: Time measurements definitions
Measurement Description
Rise Time Elapsed time between the Low reference level crossing and the High reference level crossing on the
rising edge of the waveform
Fall Time Elapsed time between the High reference level crossing and the Low reference level crossing on the
falling edge of the waveform
High Time Amount of time the waveform remains above the high reference voltage level
Low Time Amount of time the waveform remains below the low reference voltage level
Setup
4
Elapsed time between the designated edge of a data waveform and that of a clock waveform, based
on the respective mid reference level crossings
Hold
4
Elapsed time between the designated edge of a clock waveform and that of a data waveform, based
on the respective mid reference level crossings
Rise Slew Rate Rate of change of voltage between the two chosen reference level crossings on the rising edges of the
waveform
Fall Slew Rate Rate of change of voltage between the two chosen reference level crossings on the falling edges of the
waveform
Skew
4
Time difference between two similar edges on two waveforms assuming that every edge in one
waveform has a corresponding edge (either the same or opposite polarity) in the other waveform; edge
locations are determined by the mid reference voltage level.
Gated Skew Time difference between two corresponding edges on two gates on two/single waveform. Edge
locations are determined by the mid reference voltage level.
Table continued…
4
wo Source Measurements.
T
DPOJET Jitter, Noise and Eye Diagram Analysis Solution Application Help 57
Page 58

Jitter, Noise and Eye Diagram Analysis
Measurement Description
SSC Profile SSC Profile is not intended to serve as a measurement. It is a vehicle for showing the SSC modulation
profile versus time, using a time trend plot.
SSC Mod Rate SSC Mod Rate computes the SSC modulating frequency.
SSC Freq Dev SSC frequency deviation in ppm (parts per million), measured at each inflection point in the modulation
profile
SSC Freq Dev Min The minimum frequency shift as a function of time
SSC Freq Dev Max The maximum frequency shift as a function of time
Time Outside Level. Time Outside Level Ring Back is defined as the time interval of overshoot or undershoot.
tCMD-CMD 5
tCMD-CMD is a timing measurement and it measures the elapsed time between two logic states on a
specified digital bus.
Table of measurements-Eye
Definitions of the eye-related measurements are given in the following table:
Table 13: Eye measurements definitions
Measurement Description
Autofit Mask Hits The number of unit intervals for which mask violations occurred. A mask violation occurs when, during
a unit interval, the waveform passes through a segment of the defined mask. Autofit mask hits are
separately tailed for Segment 1 (upper), Segment 2 (Center) and Segment 3 (lower) and the total for
all three segments is also reported. Autofit Mask Hits reports mask hits in terms of Pixel (not UI) and
only the Segment 2 (Middle) is considered as criteria for mask hits calculation and it will move the
mask a location where the minimum or zero hits are happening.
Height The measured clear vertical eye opening at the center of the unit interval. Height = High(min) –
Low(max)
Height@BER The eye height at a specified Bit Error Rate
Width Measured clear horizontal eye opening at the middle reference level.
Width = UI(mean) – TIE(max) – TIE(min)
Table continued…
5
This measurement is available only on 64-bit MSO instruments.
DPOJET Jitter, Noise and Eye Diagram Analysis Solution Application Help 58
Page 59

Jitter, Noise and Eye Diagram Analysis
Measurement Description
Width@BER The horizontal eye opening projected to correspond to a specified Bit Error Rate. This number is
obtained by measuring the jitter on the waveform, performing RJ-DJ separation analysis, creating
a bathtub curve, and reporting the bathtub width at the appropriate error rate. This eye width may
not match the observed eye width because it is a statistical measure. The measurement requires a
ficient record length so that all deterministic effects can be observed and the random jitter can be
suf
modeled.
Width(BER) = UI(mean) – TJ(BER)
Mask Hits The number of unit intervals for which mask violations occurred. A mask violation occurs when, during
a unit interval, the waveform passes through a segment of the defined mask. Mask hits are separately
tallied for Segment 1 (upper), Segment 2 (center-of-eye mask) and Segment 3 (lower), and the total
for all three segments is also reported. Thus, as many as three hits can be added to the total count
for each unit interval. The population for this measurement gives the total number of unit intervals
observed.
Eye High The voltage at a selected horizontal position across the unit interval, for all High bits in the waveform.
Eye Low The voltage at the selected horizontal position across the unit interval, for all Low bits in the waveform.
Q-Factor Quality Factor is the ratio of vertical eye opening to rms vertical noise.
DFE EW This measurement is used to calculate the Eye Width of input waveform in a non-parametric manner
from the rendered eye diagram. The rendered plot is processed to come up with the optimal eye width
value. The measurement also comes with dedicated configuration panel tab “DFE”.
The DFE tab allows you to adjust the configuration parameters such as DFE tap value, measurement
point as a % of peak to peak of the signal, and the resolution of the measurement.
DFE EH
DFE Eye Diagram
V-Widest Open Eye This measurement measures the voltage at the widest eye opening in the search range from 40% to
This measurement is used to calculate the Eye Height of input waveform in a non-parametric manner
from the rendered eye diagram. The rendered plot is processed to come up with the optimal eye height
value. The measurement also comes with dedicated configuration panel tab “DFE”
This DFE tab allows you to adjust the configuration parameters such as DFE tap value, measurement
point as a % of UI of the signal, and the resolution of the measurement.
This measurement is used to render the Eye Diagram representation of input waveform with or without
a mask file specified.
By default, this measurement is executed without any mask, but the configuration panel also gives you
the option to specify a particular mask file.
60% of the eye amplitude.
Table of measurements-Amplitude
Definitions of the amplitude-related measurements are given in the following table:
DPOJET Jitter, Noise and Eye Diagram Analysis Solution Application Help 59
Page 60

Jitter, Noise and Eye Diagram Analysis
Table 14: Amplitude measurements definitions
Measurement Description
AC RMS The true Root Mean Square voltage, minus any DC component, of the waveform data points that are
above the Mean signal level.
High The High Amplitude measurement calculates the nominal amplitude of a “1” bit, in one of two ways
depending on the selected Method. Note that the Mean method results in one measurement value for
each “1” bit of the selected type, whereas the Mode method results in a single measurement value for
the entire waveform record.
Low The Low Amplitude measurement calculates the nominal amplitude of a “0” bit, in one of two ways
depending on the selected Method. Note that the Mean method results in one measurement value for
each “0” bit of the selected type, whereas the Mode method results in a single measurement value for
the entire waveform record.
High–Low Difference between High and Low amplitude measurements that bound each selected transition. This
value is always expressed as a positive number
, regardless of whether the transition is rising or falling.
DC Common Mode
AC Common Mode
4
Common-mode voltage for the two sources.
4
The common mode voltage between two single-ended signals. AC is defined as all the frequency
.
components above the cutoff frequency (30 kHz).
T/nT-Ratio Ratio of the transition eye-voltage to the nearest subsequent non-transition eye voltage, expressed in
decibels.
V–Diff –Xovr
4
Voltage level at the crossover voltage of a differential signal pair.
Overshoot Difference between the positive-going peak amplitude and the reference voltage level, for each
waveform event that exceeds the reference level.
Undershoot Difference between the negative-going peak amplitude and the reference voltage level (expressed as a
positive number), for each waveform event that exceeds the reference level.
Cycle Pk-Pk Difference between the maximum and minimum voltage for each cycle, where a cycle is defined as
a positive half-cycle followed by a negative half-cycle or a negative half-cycle followed by a positive
half-cycle. Half-cycles are determined by the mid reference level crossings.
Cycle Min Defined as the peak negative voltage for each negative half-cycle, where half-cycles are determined by
the mid reference level crossings.
Cycle Max Defined as the peak positive voltage for each positive half-cycle, where half-cycles are determined by
the mid reference level crossings.
Table of measurements-Standard
Standard-specific measurements in the this category may include timing, jitter
measurements that have been modified to support a specific standard or otherwise deviate from the generic measurements. Use the
DPOJET Jitter, Noise and Eye Diagram Analysis Solution Application Help 60
, amplitude or eye measurements. Generally, they are
Page 61

Jitter, Noise and Eye Diagram Analysis
Standard drop-down list to view the DDR, PCI Express, USB and Optical measurements. Use the T
est point selection when available, to
select the setup file specific to the standard. Their measurement definitions are given in the following table:
Table 15: Standard-specific measurements definitions
Measurement Description
PCI Express
PCIe T-Tx-Diff-PP Defined as the change in voltage level across a transition in the waveform. It is the peak-to-peak
ferential voltage swing.
dif
PCIe T-TX Defined as the measured clear horizontal eye opening at the middle reference level.
PCIe T-Tx-Fall Defined as the time difference between the VRefLo(20%) reference level crossing and the
VRefHi(80%) reference level crossing on the falling edge of the waveform.
PCIe Tmin-Pulse Defined as the single pulse width measured from one transition center to the next.
PCIe DeEmph Defined as the ratio of the transition eye-voltage to the nearest subsequent non-transition eye voltage,
expressed in decibels.
PCIe T-Tx-Rise Defined as the time difference between the VRefHi(80%) reference level crossing and the
VRefLo(20%) reference level crossing on the rising edge of the waveform.
PCIe UI For clock signals, the elapsed time between consecutive crossings of the mid reference voltage level in
the direction specified; one measurement is recorded per crossing pair. For data signals, the elapsed
time between consecutive crossings of the mid reference voltage in opposite directions divided by the
estimated number of unit intervals for that pair of crossings; one measurement is recorded per unit
interval so N consecutive bits of the same polarity result in N identical period measurements.
PCIe Med-Mx-Jitter Defined as the maximum time between the jitter median and the maximum deviation from the median.
PCIe T-RF-Mismch Defined as the mismatch between Rise time (TRise) and Fall time (TFall).
PCIe MAX-MIN Ratio 6
Defined as the voltage range ratio over which a particular receiver must operate for consecutive UI.
PCIe SSC FREQ DEV Defined as the SSC frequency deviation in ppm (parts per million).
PCIe SSC PROFILE Shows the modulation profile of the SSC.
PCIe AC Common Mode
7
The common mode voltage between two single-ended signals. AC is defined as all the frequency
components above the cutof
f frequency (30 kHz).
T-TX-DDJ Defined as the time delta between the PDF’s mean for each zero crossing point and the corresponding
recovered clock edge.
Table continued…
6
Custom name for PCIe MAX-MIN Ratio is PCIe VRX-MAX-MIN Ratio.
7
T
wo Source Measurements.
DPOJET Jitter, Noise and Eye Diagram Analysis Solution Application Help 61
Page 62

Jitter, Noise and Eye Diagram Analysis
Measurement Description
T-TX-UTJ Referenced to a recovered data clock generated by means of a CDR tracking function. Uncorrelated
total jitter may be derived after removing the DDJ component from each PDF and combining the PDFs
for all edges in the pattern.
T-TX-UDJDD Defined as uncorrelated jitter at the zero crossing point and the corresponding recovered clock edge.
T-TX-UPW-TJ Defined as an edge-to-edge phenomenon on consecutive edges.
T-TX-UPW-DJDD Defined as uncorrelated PWJ at the zero crossing.
V-TX-NO-EQ Defined by setting c-1 and c+1 to zero and measuring the p-p voltage on the 64-ones/64-zeroes
segment of the compliance pattern.
V-TX- EIEOS Defined by setting c+1 coef
ficient value of –0.33 and a c-1 coefficient of 0.0 and measuring the p-p
voltage on the 8-ones/8-zeroes segment of the compliance pattern, where the pattern is repeated for a
total of 128 UI.
ps21TX Measured by comparing the 64-zeroes/64- ones p-p voltage (V111) against a 1010 pattern (V101).
V-TX-BOOST When c-1 and c+1 are non-zero, measure the PP voltage on the 64-ones/64-zeroes segment of the
compliance pattern and with immediate single transition bit voltage.
USB 3.0 Essentials
USB VTx-Diff-PP Defined as the change in voltage level across a transition in the waveform. It is the peak-to-peak
ferential voltage swing.
dif
USB TCdr-Slew-Max
8
This measurement finds the peak-to-peak period jitter. Period jitter can be obtained by taking the first
difference of the filtered phase jitter.
USB Tmin-Pulse-Tj Defined as the single pulse width measured from one transition center to the next including all jitter
sources.
USB Tmin-Pulse-Dj Defined as the minimum pulse width with only deterministic jitter components.
USB SSC MOD RATE Defined as the SSC modulation rate in terms of Hz.
USB SSC FREQ DEV MAX Defined as the maximum frequency shift as a function of time.
USB SSC FREQ DEV MIN Defined as the minimum frequency shift as a function of time.
USB SSC PROFILE Shows the modulation profile of the SSC.
Table continued…
8
o run a slew rate measurement, you need a waveform with minimum record length of 5 MB.
T
DPOJET Jitter, Noise and Eye Diagram Analysis Solution Application Help 62
Page 63

Jitter, Noise and Eye Diagram Analysis
Measurement Description
USB UI For clock signals, defined as he elapsed time between consecutive crossings of the mid reference
voltage level in the direction specified; one measurement is recorded per crossing pair
. For data
signals, defined as the elapsed time between consecutive crossings of the mid reference voltage in
opposite directions divided by the estimated number of unit intervals for that pair of crossings; one
measurement is recorded per unit interval so that N consecutive bits of the same polarity result in N
identical period measurements.
USB AC Common Mode
9
The common mode voltage between two single-ended signals. AC is defined as all the frequency
components above the cutoff frequency (30 kHz).
Optical
AOP (Average optical power) The true average component of an optical signal, in Watts.
ER (Extinction ratio) The ratio of average power levels of the logic 1 level (High) to the logic 0 level (Low) of an optical
signal. All level determinations are made within the Eye Aperture.
The Eye Aperture is adjustable and defaults to 20% of the signal bit time.
OMA (Optical modulation
amplitude)
The difference between the average power levels of the logic 1 level (High) to the logic 0 level (Low) of
an optical signal. All level determinations are made within the Eye Aperture.
The Eye Aperture is adjustable and defaults to 20% of the signal bit time.
Optical High The Optical High measurement calculates the nominal amplitude of a “1” bit, in one of two ways
depending on the selected Method. Note that the Mean method results in one measurement value for
each “1” bit of the selected type, whereas the Mode method results in a single measurement value for
the entire waveform record.
Optical Low The Optical Low measurement calculates the nominal amplitude of a “0” bit, in one of two ways
depending on the selected Method. Note that the Mean method results in one measurement value for
each “0” bit of the selected type, whereas the Mode method results in a single measurement value for
the entire waveform record.
Eye Crossing Level
The Eye Crossing Level measurement lists the voltage/watts level where the rising and falling edges of
the eye waveform intersect (PCross 1 and PCross2). The measurement algorithm searches for the eye
waveform with narrowest crossing width.
Eye Crossing Time
The Eye Crossing Time measurement is the time of a single eye crossing waveform in seconds
(TCross1).
Eye Crossing Percent
Eye Crossing Percent measurement is an eye crossing point expressed as a percentage of the eye
waveform height.
Mask Hit Ratio A Mask Hit Ratio is the ratio of number of UI that have a mask hit and total number of UI observed.
Mask Hit Ratio = (# of UI that have a mask hit) / (total # of
UI observed)
Table continued…
9
wo Source Measurements
T
DPOJET Jitter, Noise and Eye Diagram Analysis Solution Application Help 63
Page 64

Jitter, Noise and Eye Diagram Analysis
Measurement Description
Mask Margin The concept of margin allows for more information to be shared than merely Pass/Fail decision. We
assume the position of level values and unit interval boundary as 100% and original mask location as
0%. Hence a 20% mask margin implies that the mask violations does not occur even after scaling the
original mask by this amount.
Test point selection in the standard tab
est Point Selection is available only for PCI Express, USB, and MIPI standards. You can either use the Test Point “Setup” button or File >
T
Recall option to select the setup file for the selected standard.
The Test Point shows “None Selected” if no test point is specified. Click Setup to navigate to the directory, which contains the setup files
specific to the standard.
The setup file with oscilloscope settings and test measurements replaces any selected measurements and oscilloscope settings before
specifying the test point. A warning message is displayed as shown:
Figure 12: Test point selection in the standard tab
Once the test point is selected, the measurements associated with the test point are displayed in the measurement table and the
configuration specific to the standard is recalled. However
can save the setup file to recall. The Test Point field displays only the Test point name. A tool tip displays the entire file name as shown:
Figure 13: Test point selection in the standard tab (Measurements)
When you select PCI Express from the Standards list, a hint saying “This standard contains Gen1 and Gen2 measurements” as shown:
, you can still add the measurements specific to the standard. At any time, you
DPOJET Jitter, Noise and Eye Diagram Analysis Solution Application Help 64
Page 65

Figure 14: Test point selection in the standard tab (Measurements with show plots)
Configuring measurements
About configuring a measurement
Y
ou can configure the measurements listed under the following categories:
• Period/Freq
• Jitter/Noise
• Time
• Eye
• Amplitude
• Standard
Jitter, Noise and Eye Diagram Analysis
Note: Configuration for respective measurements are displayed only when measurement is selected.
Note: When noise measurements are enabled, Jitter tab is displayed as Jitter/Noise.
Related topics
Correlation of measurement to configuration on page 260
About global on page
General on page 66
About filters on page 71
About clock recovery on page 76
Bit config on page 89
BER on page 97
RJ-DJ on page 98
RN-DN on page 100
Configuring bus states on page 103
Custom gating on page 105
Edges on page 106
66
Spread spectrum clocking (SSC) on page 119
Margin on page 120
DPOJET Jitter, Noise and Eye Diagram Analysis Solution Application Help 65
Page 66

Jitter, Noise and Eye Diagram Analysis
General
Configuration tab allows you to customize the measurement name and qualify the measurement within a selected result range. The
General tab appears same for all the measurements but is not common. The values are dif
set the custom name per measurement here. Use the virtual keyboard to enter the measurement name of your choice. Measurements
selected in DDRA are the custom names for the measurements defined in DPOJET. A tool tip displays the custom name and the
DPOJET-based measurement name (in brackets) on moving the mouse over the row in the measurement table, results, data snapshot,
and measurement configuration summary.
ferent for different measurements. You can
Note: Custom measurement names revert to their DPOJET
configuration screen.
Figure 15: General configuration
-based measurement names on being cleared in the General
Table 16: General options
Item Description
Off Disables the application from using the specified measurement limits.
On Enables the application to use the specified measurement limits.
Max or Min value Specify the maximum and minimum range of valid measurement values measurements. The default
values for the Measurement Range Limits options vary by measurement.
Custom Measurement Name Option to modify the measurement name. Allows adding a user-specified name to any measurement.
This is useful for aligning DPOJET measurements with a user measurement list or standard.
Note: If a max value smaller than the min value is entered, it is accepted and the min value is also silently reduced to the same
value. Likewise, if a min value larger than the max is entered, both are set to that value.
Global
About global
This configuration tab is common for all measurements. Y
by setting the measurement population limits. Access the Global configuration directly from the oscilloscope menu under Analyze > Jitter
and Eye Analysis (DPOJET) > Global Configuration.
• Gating on page 67
• Qualify on page 67
• Population on page 69
DPOJET Jitter, Noise and Eye Diagram Analysis Solution Application Help 66
ou can limit the waveform data analysis by Gating, by applying a Qualifier, or
Page 67

Jitter, Noise and Eye Diagram Analysis
Figure 16: Global Configuration
Gating
Gating allows you to focus the analysis on a specific area of the waveform bounded by a gated region, which is a way to filter unnecessary
information.
Y
ou can set up a gated region in one of the following ways:
• Zoom
• Cursors
Figure 17: Global-Gating
Table 17: Global-Gating options
Item Description
Off No gating occurs; application takes measurements over the entire waveform.
Zoom Zooms the specified region of the source waveform to take measurements within the selected area.
The region of waveform within the zoom is analyzed.
Cursors Gates the waveform with Vertical cursors. The region of waveform within the cursors is analyzed.
Qualify
Qualifiers allows you to limit the application to more narrowly defined conditions before taking measurements. All sources for the
measurements and Qualify input must have the same Horizontal Sample Rate, Record Length, and Position to ensure that measurements
function properly
measured even if multiple qualified regions are present. For all other measurements, the entire waveform is processed.
. For measurements which require clock recovery such as TIE or eye measurements, only the first qualified region will be
DPOJET Jitter, Noise and Eye Diagram Analysis Solution Application Help 67
Page 68

Jitter, Noise and Eye Diagram Analysis
Figure 18: Global-Qualify
Table 18: Global-Qualify options
Item Description
Off Disables the application from using the defined conditions while taking measurements.
On Enables the application to use the defined conditions while taking measurements.
Configure Displays the Configuring qualify with logic on page
68 dialog box.
Configuring qualify with logic
Table 19: Qualify-Configure options
Source Ch1-Ch4, Ref1-Ref4, Math1-Math4 Search0-Search8
Configuration
Panel
Table continued…
DPOJET Jitter, Noise and Eye Diagram Analysis Solution Application Help 68
Page 69

Jitter, Noise and Eye Diagram Analysis
Source Ch1-Ch4, Ref1-Ref4, Math1-Math4 Search0-Search8
Configure
options
Item Description
Source
10
Selects a waveform to qualify the signal or clock
source used for the measurement. The input
source waveforms or files are Ch1-Ch4, Ref1Ref4, and Math1-Math4.
Mid Shows the vertical reference level of the qualifier
waveform.
11
Hysteresis Shows the amount of hysteresis applied to the
vertical reference level of the qualifier waveform.
Hysteresis prevents small amounts of noise in
a waveform from producing multiple threshold
crossings.
Active
12
High
Enables measurements in regions 12 where the
qualifier waveform exceeds the mid reference
level.
Selects a waveform to qualify the signal or clock
source used for the measurement. The input
source waveforms or files are Search0-Search8.
Displays the burst control type selected in DDRA
when you turn on the qualifier
. Also indicates that
ASM is turned on.
12
Low
Enables measurements in regions12 where the
qualifier waveform falls below the mid reference
level.
OK Accepts the changes and closes the window.
Search behavior in DPOJET
When search is configured, the application analyzes the identified marks on the source waveform. Read and Write bursts are selected
in ASM when search is selected as the qualify source. Each Mark indicates the start and stop of a burst. These marks are used by the
DPOJET measurement when the qualify source is configured to Search. You can configure up to eight searches (Search1 – Search8) in
ASM (Advanced Search and Mark)and Search0 for visual search. The same search number gets reflected in DPOJET. Search is used for
Multiple burst analysis. For more details, refer to your oscilloscope online help.
Population
The Population control allows you to limit the amount of waveform data that is analyzed. This is often done in industry standards to make
sure that there is consistency between measurement techniques.
10
Measurement and Qualify sources must have the same Horizontal Sample Rate, Record Length, and Position to ensure that measurements function properly
11
The default behavior for all reference levels is to automatically adjust based on the signal amplitude after a Clear operation, unless you disable the autoset check box
in the source configuration panel. Whether you use the Qualify with Logic dialog box to adjust the levels or not, be aware that the levels may change if automatic
adjustment is still enabled. For more information, refer to Automatic versus manual reference voltage levels.
12
For measurements that require clock recovery, only the first qualified region will be measured even if multiple qualified regions are present.
.
DPOJET Jitter, Noise and Eye Diagram Analysis Solution Application Help 69
Page 70

Jitter, Noise and Eye Diagram Analysis
Figure 19: Global-Population
Table 20: Global-Population options
Item Description
Off Disables the application from using a Population limit while taking measurements.
On
Enables the application to use a Population limit while taking measurements.
13
Configure Displays the Configuring population limit on page 70 dialog box. This allows you to set a limit on a
maximum population to obtain, for selected measurements.
Configuring population limit
Figure 20: Configuring population limit
Table 21: Population-Configure options
Item Description
Population The limit determines the population of measurement observations that will be accumulated. Some
measurements may accumulate observations more quickly than others.
Acquisitions The limit determines the number of acquisition cycles that will be performed.
Table continued…
13
If population limit is turned ON for the Mask Hits measurement, then unselect Enable high-performance eye rendering in Preferences-
Measurement on page
148 for accurate results.
DPOJET Jitter, Noise and Eye Diagram Analysis Solution Application Help 70
Page 71

Jitter, Noise and Eye Diagram Analysis
Item Description
Each Measurement Each measurement stops accumulating as soon as it reaches the specified limit. Sequencing does not
stop until all measurements have reached the limit, at which time every measurement will have exactly
the limit.
Last Measurement Sequencing continues and all measurements continue accumulating until the last (slowest
accumulating) measurement reaches the limit, at which time they all stop. When sequencing stops, all
measurements except one may have higher population than the limit.
Limit Specifies the number of acquisitions or measurements the application takes before sequencing stops.
Population limit is not applicable for Mask Hits.
OK Accepts the changes and closes the window.
Filters
About filters
This configuration tab allows you to modify the measurement data by applying a High Pass filter to block low frequency band components
or a Low Pass filter to block high frequency band components. For Example, Selecting a 1 MHz high pass filter can reduce the ef
SSC on results.
fect of
For some measurements (Period, Frequency, TIE, +Duty Cycle, –Duty Cycle, +CC Duty, – CC Duty, CC–Period, Positive Width, Negative
Width, N–Period, Rise Time, Fall Time, Low Time, High Time, DC Common Mode, High–Low, High, Low, T/nT Ratio, PCIe T-Tx-Rise,
PCIe T-Tx-Fall, PCIe T-RF-Mismch, PCIe UI, USB UI, PCIe SSC FREQ DEV, USB TCdr-Slew-Max, USB SSC FREQ DEV, USB SSC
MOD RATE and USB SSC PROFILE), the measurements versus time waveform (time trend) that is derived from the original oscilloscope
waveform can be filtered before it is passed to the statistics and plotting subsystems.
Figure 21: Filters (High Pass, Low Pass, SSC)
DPOJET Jitter, Noise and Eye Diagram Analysis Solution Application Help 71
Page 72

Jitter, Noise and Eye Diagram Analysis
Band Pass Filtering
ou can create a band pass filter by enabling both the High Pass and the Low Pass filters on a measurement. The cut-off frequency for the
Y
Low Pass filter must be greater than or equal to the cut-off frequency for the High Pass filter.
You should be aware that setting the cut-off frequencies close to each other may effectively filter out all of the measurement data, or
all but a small amount of timing noise. This diagram shows the spectrum of the measurement data passed to the statistics and plotting
subsystems when you use both the High Pass and the Low Pass filters.
Figure 22: Band Pass Filtering
High Pass filters attenuate low frequencies, and filter out DC values entirely
. When a high pass filter is added to a period or frequency
measurement, the mean value of the filtered measurement goes to zero. This can be seen by creating a Time Trend plot of a
high-pass-filtered period or frequency measurement. Although this is the correct theoretical behavior for the filtered measurement, it is not
very useful if the Results panel reports that the mean period or frequency is zero. For this reason, the mean values that appear in the
results panels for Period and Frequency measurements are the values before the filter.
Figure 23: Filter
Table 22: Filter options
Item Description
Filter Spec When enabled, blocks the low frequency band and passes only the high frequency band of the
Freq (F1) 14
waveform; defined as 1st order
High Pass filter cut-off frequency at which the filter magnitude falls by 3 dB.
, 2nd order, 3rd order Butterworth and No filter, being the default.
Filter Spec When enabled, blocks the high frequency band and passes only the low frequency band of the
Freq (F2)14
waveform; defined as 1st order
Low Pass filter cut-off frequency at which the filter magnitude falls by 3 dB.
, 2nd order, 3rd order Butterworth, and No filter, being the default.
Table continued…
14
Includes a 3 dB cut-of
f frequency.
DPOJET Jitter, Noise and Eye Diagram Analysis Solution Application Help 72
Page 73

Item Description
Jitter, Noise and Eye Diagram Analysis
Advanced Displays the Advanced filter configuration on page
Apply to All Settings of the measurement are applied to all measurements with those settings.
Measurements such as AC Common Mode, PCIe AC Common Mode, and USB AC Common Mode use a high-pass sliding window filter.
This filter is applied to remove low frequency common mode noise. It has a 30 kHz cutof
Figure 24: Filter (High Pass Frequency)
73 dialog box.
f frequency.
Table 23: Filter options
Item Description
High Pass Frequency
Off High pass frequency is set to Off. Default configuration of High pass frequency for measurements is
f.
Of
On High pass frequency is set to On.
Brick wall filter configuration
Measurements such as PCIe DeEmph and PCIe Med-Mx Jitter use the Brick Wall filter. A brick wall filter is applied to the PCIe signal to
remove the low frequency jitter components. The PCI Express application applies the filter as per the PCIe specification. A Brick Wall filter
has a very sharp cut-off frequency.
Figure 25: Brick wall filter
Advanced filter configuration
The measurement filters are implemented using infinite impulse response (IIR) designs. As with any causal filter
the filter’s output in response to the arrival of the input signal. It is usually desirable to exclude this transient from the measurement results.
, a transient may occur at
DPOJET Jitter, Noise and Eye Diagram Analysis Solution Application Help 73
Page 74

Jitter, Noise and Eye Diagram Analysis
In the DPOJET application, the filter transient is managed in two ways. First, the input to the filter is gently “ramped up” from zero to its
full value over some ramp time tr. Second, the output of the ramp is “blanked” over some duration tb, so that the remaining ef
transient are omitted from measurement results, statistics and plots. The sequence of operations is depicted here:
The ramp function has a raised-cosine profile and is defined in the time domain as:
fects of any
You may adjust the ramp time tr by means of the Advanced control panel. If you wish to turn of
Similarly, you can adjust the blanking duration tb by means of the Advanced control panel. Setting the blanking duration to 0 will allow you
to see the entire filtered measurement, including any transients.
Both, the ramp time tr and the blanking duration tb, are set relative to the reciprocal of the lowest filter frequency Fc. By default, both of
these parameters are set to 1/Fc. Since they are normalized to the filter frequency, they will automatically adjust if you change the filter
cut-off frequency.
The complete set of signal processing options, together with representative waveforms that suggest how the options affect the
measurement vector, are shown here:
f the ramp function, set the ramp time to 0.
DPOJET Jitter, Noise and Eye Diagram Analysis Solution Application Help 74
Page 75

Jitter, Noise and Eye Diagram Analysis
Figure 26: Advanced filter configuration
Table 24: Advanced filter configuration options
Item Description
Ramp Time Duration of the raised-cosine smoothing function applied to the measurement vector before the vector
is filtered.
Table continued…
DPOJET Jitter, Noise and Eye Diagram Analysis Solution Application Help 75
Page 76

Jitter, Noise and Eye Diagram Analysis
Item Description
Blanking Time Duration of the filter’s output that is suppressed. The blanked portion of the output is not included in
the measurement statistics, or in any plots.
OK Accepts changes and closes.
Configuring Filters for SJ@Freq
This configuration tab allows you to select the SJ Frequency and SJ Bandwidth.
Figure 27: Configuring Filters for SJ@Freq
Table 25: Configuring Filters for SJ@FREQ
Item Description
SJ Frequency
SJ Bandwidth
Note: The peak to peak amplitude of energy within this spectral band is reported as a Sinusoidal Jitter
The frequency at which Sinusoidal Jitter measurement is calculated.
Narrow band around which Sinusoidal Jitter measurement is calculated. A high limit of 1 MHz will be
optimal.
.
Clock recovery
About clock recovery
Clock recovery refers to the process of establishing a reference clock, the edges of which can be used as a basis for timing comparisons.
The Clock Recovery configuration tab allows you to select one of the following clock recovery methods:
Constant clock - mean on page 77
Constant clock - median on page 78
Constant clock - fixed on page 79
PLL standard BW on page 81
PLL custom BW on page 82
Explicit Clock-Edge on page 84
Explicit Clock-PLL on page 86
Behavioral on page
DPOJET Jitter, Noise and Eye Diagram Analysis Solution Application Help 76
88
Page 77

Jitter, Noise and Eye Diagram Analysis
The first five methods derive the reference clock from the same channel upon which the measurement is defined. This is the conventional
method of clock recovery for serial data communications, where no separate clock is available. Explicit Clock-Edge and Explicit Clock-PLL
methods derive the reference clock from a channel other than the one upon which the measurement is defined.
About constant clock recovery
In Constant Clock Recovery, the clock is assumed to be of the form A*sin (2Π ft +Φ), where the frequency (f) and phase (Φ) are treated as
unknown constants. Once a source waveform has been acquired and the edges extracted, one or both of these constants are determined
using linear regression, so that the recovered clock minimizes the mean squared sum of the Time Interval Error (TIE) for that waveform.
If Constant Clock - Mean is selected as the clock recovery method, both the frequency and the phase are chosen to minimize the mean
squared error.
If Constant Clock - Fixed is selected as the clock recovery method, the precise frequency specified is used but the phase is chosen so that
the median error between the recovered and measured edges is zero.
If Constant Clock - Median is selected as the clock recovery method, the phase is chosen so that the median error between the recovered
and measured edges is zero.
Figure 28: Constant clock recovery
Constant clock - mean
This method provides the following options that control how the clock recovery is performed:
Auto Calc First Acq
•
• Auto Calc Every Acq
Selecting Autocalc First Acq will allow the clock-recovery algorithm to choose a new best-fit clock frequency and phase only on the first
acquisition. Subsequent acquisitions will choose a best fit on clock phase but retain the clock frequency found on the first acquisition.
Selecting Autocalc Every Acq will allow the clock-recovery algorithm to choose a new best-fit clock frequency and phase for each new
oscilloscope acquisition.
Clearing the measurement results by choosing Clear on the sequencing panel will reset the clock recovery so that both frequency and
phase are optimized on the subsequent acquisition.
DPOJET Jitter, Noise and Eye Diagram Analysis Solution Application Help 77
Page 78

Jitter, Noise and Eye Diagram Analysis
Figure 29: Constant clock - mean
Table 26: Constant clock - mean options
Item Description
Auto Calc First Acq Calculates the best fit of the initial acquisition or the first acquisition after clearing results, and then
uses the value until you clear the results.
Auto Calc Every Acq Calculates the best fit for each acquisition (default).
Apply to All
Apply Applies the current clock recovery configuration to all selected measurement(s), PLL-Standard clock
recovery options that have Clock Recovery as configuration tab.
Advanced Displays the Clock recovery advanced setup on page 79 dialog box.
Constant clock - median
This method provides the following options that control how the clock recovery is performed:
Auto Calc First Acq
•
• Auto Calc Every Acq
Selecting Autocalc First Acq will allow the clock-recovery algorithm to choose a new best-fit clock frequency and phase only on the first
acquisition. Subsequent acquisitions will choose a best fit on clock phase but retain the clock frequency found on the first acquisition.
Selecting Autocalc Every Acq will allow the clock-recovery algorithm to choose a new best-fit clock frequency and phase for each new
oscilloscope acquisition.
Clearing the measurement results by choosing Clear on the sequencing panel will reset the clock recovery so that both frequency and
phase are optimized on the subsequent acquisition.
Figure 30: Constant clock - median
DPOJET Jitter, Noise and Eye Diagram Analysis Solution Application Help 78
Page 79

Jitter, Noise and Eye Diagram Analysis
Table 27: Constant clock - median options
Item Description
Auto Calc First Acq Calculates the best fit of the initial acquisition or the first acquisition after clearing results, and then
uses the value until you clear the results.
Auto Calc Every Acq Calculates the best fit for each acquisition (default).
Apply to All
Apply Applies the current clock recovery configuration to all selected measurement(s) that have Clock
Recovery as the configuration tab.
Advanced Displays the Clock recovery advanced setup on page 79 dialog box.
Constant clock - fixed
This method provides a single option that controls how the clock recovery is performed. With Fixed Constant Clock recovery
is made to derive information about the actual data rate from the signal under test. Instead, the precise frequency that you specify will be
used. (However, the clock phase will be chosen so that the median difference between the recovered and measured edges is zero.)
Figure 31: Constant clock - fixed
Note: Click to apply the clock recovery configuration to all selected measurement(s) that have Clock Recovery as configuration
tab.
, no attempt
Clock recovery advanced setup
The Advanced Clock Recovery methods can be used when unusually high noise or ambiguous data patterns defeats normal clock
recovery methods. Under most normal operating conditions, these methods are not required nor recommended.
Nominal Data Rate and Known Data Pattern are the two advanced clock recovery methods.
In Nominal Data Rate, you can provide the nominal data rate to the clock recovery algorithm. Normally
and determines the data rate automatically. Setting this parameter to Manual allows you to provide a starting point or hint to the clock
recovery algorithm. This is useful when the data pattern makes data rate detection ambiguous. As an example, a “1 1 0 0 1 1 0 0” pattern
at 8 Gb/s would otherwise be detected as a “1 0 1 0” pattern at 4 Gb/s. Setting the bit rate to 8 Gb/s will cause the proper unit interval and
pattern length to be identified.
, the application analyzes your data
In Known Data Pattern, the pattern is specified by using an ASCII text file containing the characters 1 and 0. The file may contain other
characters, spaces and tabs for formatting purposes, but they will be ignored. Several files for commonly used patterns are included with
the application, and you may use these as examples if you wish to create your own pattern files. Click Browse to modify the default
location for pattern files.
DPOJET Jitter, Noise and Eye Diagram Analysis Solution Application Help 79
Page 80

Jitter, Noise and Eye Diagram Analysis
Note: The last line of the pattern file must end with a CR/LF
Figure 32: Clock recovery advanced setup
. Without the CR/LF, you will receive a too many bits error message.
Table 28: Advanced clock recovery options
Item Description
Auto Enables automatic detection of the data rate on the first acquisition following a Clear or configuration
change.
Manual Allows you to manually specify the nominal data rate. This is useful when the data pattern makes data
rate detection ambiguous. As an example, a “1 1 0 0 1 1 0 0” pattern at 8 Gb/s would otherwise be
detected as a “1 0 1 0” pattern at 4 Gb/s.
Bit Rate In Manual configuration, allows you to specify the approximate data rate in bits per second (b/s). In
Auto configuration, displays the detected data rate.
Off, On Enables (On) or disables (Off) advanced clock recovery through a known data pattern.
Pattern File Name
Browse Selects a file to use for the data pattern.
OK Accepts changes and closes.
About PLL clock recovery setup
When PLL-based clock recovery is selected, the application simulates the behavior of the hardware Phase Locked Loop clock recovery
circuit. This is a feedback loop in which the V
of the input waveform. Such loops are frequently used to recover the clock in communication links that do not transmit the clock as a
separate signal. The PLL parameters in the application may be adjusted to simulate with the behavior of a receiver in such a link, within
certain guidelines.
Note: The ef
factors such as damping, transition density and type.
fective transfer function of a PLL loop is not equal to the PLL Loop BW setting. The Transfer function depends on the
oltage-Controlled Oscillator (VCO) is used to track or follow slow variations in the bit rate
DPOJET Jitter, Noise and Eye Diagram Analysis Solution Application Help 80
Page 81

Figure 33: PLL clock recovery setup
Note: PLL response is not instantaneous. This causes some signals to have a ramped trend at the beginning of a waveform as
the PLL locks to the applied signal. T
when you select PLL Custom BW, PLL Standard BW or Explicit Clock-PLL as the clock recovery method. PLL blanking is used by
measurements such as TIE, RJ, RJ-δδ, DJ, DJ-δδ, PJ, TJ@BER, High Voltage, Low Voltage, High-Low, T n/t Ratio, Eye Width,
Eye Height, Width@BER, Height@BER, Rise Time and Fall Time.
About PLL loop BW versus JTF BW
Jitter, Noise and Eye Diagram Analysis
o avoid a PLL start-up transient, part of the output is blanked out. This is applicable only
Phase locked loops are characterized according to their bandwidth (BW), and several dif
terminology used for these bandwidths is described here, since it varies somewhat across different industries.
• Loop BW (or Closed Loop BW) is the frequency at which the closed-loop gain has fallen to -3 dB (half power) relative to unity-gain. The
closed-loop gain function has the character of a low-pass filter.
• JTF BW (Jitter Transfer Function BW or Error Function BW) is the frequency below which input jitter to a tracking loop is removed. The
JTF BW has a high-pass filter characteristic.
For Type I loops, the Loop BW and the JTF BW are always equal. For Type II loops, these two bandwidths are different, and their ratio
depends on the PLL damping factor. You can choose to specify either bandwidth, and the other is displayed for reference.
ferent bandwidths are commonly used. The
PLL standard BW
The PLL control area provides control over the phase-locked loop used for clock recovery. You can choose the loop bandwidth and the
loop order, and if a Type II loop is chosen, you can specify the damping factor.
To set the loop bandwidth automatically, based on a serial standard, select PLL: Standard BW as the clock recovery method. From the
Standard: b/s list box, select the standard that matches your data link. For example, choose “PCI-E: 2.5” to test a 2.5 Gbit/second PCI
Express link. In this case, the PLL bandwidth will be set to 1.5 MHz, which is 1/1667 of the baud rate as specified in PCI Express standard.
You can use the PLL Model list box to choose between Type I and Type II loop. A Type I loop has a transfer function that approaches zero
frequency with a slope of 1/s and a Type II loop approaches zero frequency with a 1/s2 slope (In much of the PLL literature, these terms
are used interchangeably with First-Order and Second-Order loops. For a thorough discussion of loop type versus order, see Frequency
Synthesis by Phase Lock, by William Egan).
Note: Although it is possible to configure a T
dynamic performance. This is because Type II loops have less phase margin than Type I loops. A preferred alternative to using a
Type II PLL with a bandwidth close to its baud rate is to use a second order high-pass measurement filter to emulate the effects of
the PLL.
ype II PLL with a bandwidth up to 1/10 of the baud rate, such a loop will have poor
DPOJET Jitter, Noise and Eye Diagram Analysis Solution Application Help 81
Page 82

Jitter, Noise and Eye Diagram Analysis
Figure 34: PLL standard BW
Table 29: PLL-standard clock recovery options
Item Description
PLL Model Selects between a Type I or Type II phase-locked loop.
Damping Use the keypad to specify the damping ratio of the PLL. It is enabled only for Type II phase-locked
loop.
Loop BW Displays the Closed Loop bandwidth that has been configured based on the current standard.
JTF BW Displays the Jitter Transfer Function bandwidth that has been configured based on the current
standard.
Standard: b/s Implicitly sets the loop bandwidth of the clock recovery PLL, based on selection of the industry
standard and data rate in bits/second.
Apply to All Applies the current clock recovery configuration to all selected measurements that have user-
configurable clock recovery
Apply Applies the current clock recovery configuration to all selected measurement(s) that have Clock
Recovery as the configuration tab.
Advanced Displays the Clock Recovery Advanced Setup. For more details, refer to the Clock recovery advanced
setup.
.
Related topics
About PLL loop BW versus JTF BW on page 81
PLL custom BW
The PLL control area provides control over the phase-locked loop used for clock recovery
loop order, and if a Type II loop is chosen, you can specify the damping factor.
. You can choose the loop bandwidth and the
To manually control the loop bandwidth, select PLL: Custom BW as the clock recovery method and use the BW control to choose the
–3 dB bandwidth, in Hz.
DPOJET Jitter, Noise and Eye Diagram Analysis Solution Application Help 82
Page 83

Jitter, Noise and Eye Diagram Analysis
You can use the PLL Model list box to choose between a Type I and Type II loop. A Type I loop has a transfer function that approaches
zero frequency with a slope of 1/s and a T
ype II loop approaches zero frequency with a 1/s2 slope. (In much of the PLL literature,
these terms are used interchangeably with First-Order and Second-Order loops. For a thorough discussion of loop type versus order, see
Frequency Synthesis by Phase Lock, by William Egan).
If you choose a Type II loop, you can use the radio buttons to select whether you will directly control the Loop BW (low-pass function) or
the JTF BW (high-pass function). You must also select the Damping Factor for a Type II loop.
Note: Although it is possible to configure a Type II PLL with a bandwidth up to 1/10 of the baud rate, such a loop will have poor
dynamic performance. This is because Type II loops have less phase margin than Type I loops. A preferred alternative to using a
Type II PLL with a high bandwidth is to use a 2 order high-pass measurement filter to emulate the effects of the PLL.
Figure 35: PLL custom BW
Table 30: PLL-Custom clock recovery options
Item Description
PLL Model Selects between Type I or Type II phase-locked loop.
Damping Use the keypad to specify the damping ratio of the PLL. It is enabled only for Type II phase-locked
loop.
JTF BW Explicitly sets the JTF bandwidth of the clock recovery PLL when the PLL Model is Type II and the JTF
BW radio button is selected.
Loop BW Explicitly sets the Loop bandwidth of the clock recovery PLL when the PLL Model is Type II and the
Loop BW radio button is selected.
Apply to All Applies the current clock recovery configuration to all selected measurements that have user-
configurable clock recovery
.
Table continued…
DPOJET Jitter, Noise and Eye Diagram Analysis Solution Application Help 83
Page 84

Jitter, Noise and Eye Diagram Analysis
Item Description
Apply Applies the current clock recovery configuration to all selected measurement(s) that have Clock
Recovery as the configuration tab.
Advanced Displays the Clock Recovery Advanced Setup. For more details, refer to the Clock recovery advanced
setup.
Related Topics
About PLL loop BW versus JTF BW on page
81
About explicit clock recovery
In Explicit Clock Recovery, the reference clock is not derived from the measurement’s target source at all, but is instead taken from a
separately-identified source. Since the source used for the measurement now differs from the source used to derive the reference clock,
selecting this type of clock recovery converts the measurement from a single-source measurement to a dual-source measurement. The
reference clock source is always shown on the right when the two sources appear in a measurement table. Changing the clock-recovery
method back to a non-explicit clock method will change the measurement back to a single-source measurement.
Explicit Clock-Edge
Select Explicit Clock-Edge method if you want to use the edges found in the selected clock source (possibly multiplied up by an integral
number). If the Clock Multiplier is set to 1 (the default), only these edges will be used. If the Clock Multiplier is set to a number N other
than 1, linear interpolation will be used between each pair of actual edges to create N-1 additional reference edges. The interpolated edge
times, combined with the actual edges, give a total of N reference edge times per actual edge.
Figure 36: Explicit Clock-Edge
Table 31: Explicit-Clock edge options
Item Description
Clock Source Select Ch1 to Ch4, Ref1 to Ref4, or Math1 to Math4 as reference source for clock recovery.
Clock Edge Specify whether the rising, falling or both edges of selected source should be considered.
Clock Multiplier Specify the number of edges to be used.
Apply to All
Apply Applies the current clock recovery configuration to all selected measurement(s) that have Clock
Recovery as the configuration tab.
Table continued…
DPOJET Jitter, Noise and Eye Diagram Analysis Solution Application Help 84
Page 85

Jitter, Noise and Eye Diagram Analysis
Item Description
Advanced Displays the Advanced explicit clock-edge dialog wherein you can adjust the timing relation between
reference clock source and data source.
Advanced explicit Clock-Edge
o compare the reference clock times to the edge times from the data source, some assumptions must be made about how they align.
T
The default assumption is that each data source edge is associated with the reference clock edge to which it is nearest in time. This
assumption may not be optimum, for example if the probes for the reference clock and data signal have different cable lengths.
To change the way the reference clock edges and data edges are associated, you can control the Nominal clock Offset Relative to Data.
Figure 37: Advanced explicit Clock-Edge
Table 32: Advanced explicit-Clock edge options
Item Description
Auto Automatically calculates the clock data skew and shifts the reference clock edges before the
application associates each data edge with the closest clock edge.
Manual Specify a time delay (positive or negative) to shift the reference clock edge before the application
associates each data edge with the closet data edge.
Recalculate
When required Recalculates the nominal clock offset value whenever a new measurement is added or results are
cleared or there are any measurement configuration changes.
Every acquisition Recalculates the nominal clock offset value for every acquisition.
Related topics
Ef
fect of nominal clock offset on eye diagrams on page 88
DPOJET Jitter, Noise and Eye Diagram Analysis Solution Application Help 85
Page 86

Jitter, Noise and Eye Diagram Analysis
Explicit Clock-PLL
Select Explicit Clock-PLL as the clock recovery method if you want to feed the edges from the selected clock source through a PLL rather
than using them directly
out of the PLL will be used as the reference edges for the target measurement. If the Clock Multiplier is set to a number N other than 1, the
output of the PLL will have N edges per actual edge.
Figure 38: Explicit Clock-PLL
Table 33: Explicit Clock-PLL options
Item Description
Clock Source Select Ch1 to Ch4, Ref1 to Ref4 or Math1 to Math4 as reference source for clock recovery.
. The actual edges from the clock source will be used to drive a software PLL model, and the edge times coming
Clock Edge Specify whether the rising, falling or both edges of selected source should be considered.
Clock Multiplier Specify the number of edges to be used.
Apply to All
Apply Applies the current clock recovery configuration to all selected measurement(s) that have Clock
Recovery as configuration tab.
Advanced Displays the Advanced explicit clock-PLL dialog wherein you can adjust the timing relation between
reference clock source and data source.
Advanced explicit Clock-PLL
In the Advanced Explicit Clock- PLL, you can specify the PLL type, bandwidth, damping factor and nominal clock of
Damping numeric input is enabled only for Type II phase-locked loop.
fset relative to data.
Nominal Clock Offset Relative to Data
To compare the reference clock times to the edge times from the data source, some assumptions must be made about how they align.
The default assumption is that each data source edge is associated with the reference clock edge to which it is nearest in time. This
assumption may not be optimum, for example if the probes for the reference clock and data signal have different cable lengths.
To change the way the reference clock edges and data edges are associated, you can control the Nominal clock Offset Relative to Data.
DPOJET Jitter, Noise and Eye Diagram Analysis Solution Application Help 86
Page 87

Figure 39: Nominal Clock Offset Relative to Data
Jitter, Noise and Eye Diagram Analysis
Table 34: Advanced Explicit-Clock PLL options
Item Description
PLL Settings for Explicit Clock
JTF BW Explicitly sets the JTF bandwidth of the clock recovery PLL when the PLL Model is Type II and the JTF
BW radio button is selected.
Loop BW Explicitly sets the Loop bandwidth of the clock recovery PLL when the PLL Model is Type II and the
Loop BW radio button is selected.
PLL Model Selects between Type I or Type II phase-locked loop.
Damping Use the keypad to specify the damping ratio of the PLL. It is enabled only for Type II phase-locked
loop.
Auto Automatically calculates the clock data skew and shifts the reference clock edges before the
application associates each data edge with the closest clock edge.
Manual Specify a time delay (positive or negative) to shift the reference clock edge before the application
associates each data edge with the closet data edge.
Recalculate
When required Recalculates the nominal clock offset value whenever a new measurement is added or results are
cleared or there are any measurement configuration changes.
Every acquisition Calculates the nominal clock offset value for every acquisition.
DPOJET Jitter, Noise and Eye Diagram Analysis Solution Application Help 87
Page 88

Jitter, Noise and Eye Diagram Analysis
Related topics
fect of nominal clock offset on eye diagrams on page 88
Ef
Effect of nominal clock offset on eye diagrams
Nominal Clock Offset does not affect the eye diagrams directly. Data and clock timing relationship is maintained ignoring the clock offset
value. The clock offset still affects the eye diagram shape indirectly through edge labeling and TIE measurement but not with alignment.
When Explicit Clock Recovery is used, the Nominal Clock Offset does not affect eye diagram alignment. The relative alignment between
data and clock is maintained as acquired. An absolute alignment is controlled by Ref Clock Alignment setting in Eye Diagram plot
configuration panel. To ensure proper alignment between data and clock it is important to properly deskew oscilloscope channels.
Behavioral
Select Behavioral option for technology specific clock recovery method.
PCIe Gen5
PCIe Gen5 specification specifies a specific CDR function to be used for analyzing scope-based waveforms for jitter
shown below for 32 GT/s waveforms:
. This CDR function is
DPOJET Jitter, Noise and Eye Diagram Analysis Solution Application Help 88
Page 89

Bit config
Bit config for eye height measurements
Jitter, Noise and Eye Diagram Analysis
This configuration tab allows you to select which waveform bit types (T
eye height.
Figure 40: Bit config for eye height
ransition bits, Non-Transition or All Bits) are included when taking
Table 35: Bit config for eye height
Item Description
Bit Type
All Bits Eye analysis includes both transition and non-transition bits.
Transition Eye analysis only on transition bits.
Non-Transition Eye analysis only on non-transition bits.
Bit config for eye high eye low and Q-Factor measurements
This configuration tab allows you to select which waveform bit types (T
eye height. This configuration tab also allows you to set the percent of unit interval where the measurement is taken.
Figure 41: Bit config for eye high, low, and Q-Factor
Table 36: Bit config for eye high, low, and Q-Factor
Item Description
Bit Type
All Bits Eye analysis includes both transition and non-transition bits.
Table continued…
ransition bits, Non-Transition or All Bits) are included when taking
DPOJET Jitter, Noise and Eye Diagram Analysis Solution Application Help 89
Page 90

Item Description
Transition Eye analysis only on transition bits.
Non-Transition Eye analysis only on non-transition bits.
Jitter, Noise and Eye Diagram Analysis
Measure at X% of the Unit
Interval
Sets the horizontal position where the measurement is taken, as a percentage of the Unit Interval.
Bit config for Height@BER measurements - Jitter Only
This configuration tab is displayed for the Height@BER measurement when the analysis method selected is Jitter Only (Preferences >
Jitter Decomp > Analysis Method) .
Figure 42: Bit config for Height@BER
Table 37: Bit config for Height@BER
Item Description
Bit Type
All Bits Eye analysis includes both transition and non-transition bits.
Transition Eye analysis only on transition bits.
Non-Transition Eye analysis only on non-transition bits.
Measurement Range (UI %)
Start Start % value of UI
End End % value of UI
# of Bins The resolution by the number of bins into which Span is divided.
Bit config for Height@BER measurements - Jitter + Noise
This configuration tab is displayed for the Height@BER measurement when the analysis method selected is Jitter + Noise (Preferences >
Jitter Decomp > Analysis Method).
DPOJET Jitter, Noise and Eye Diagram Analysis Solution Application Help 90
Page 91

Jitter, Noise and Eye Diagram Analysis
Figure 43: Bit config for Height@BER
Table 38: Bit config for Height@BER
Item Description
Signal Type
Clock Clock Forces the signal to be interpreted as a Clock. Measurements will take place on the edges
specified by the Clock Edge control.
Data Data Forces the signal to be interpreted as a Data. Both rising and falling edges are used.
Auto Allows the application to automatically detect whether the signal is clock or data. If the signal is a clock,
the Clock Edge control will determine which edges are used; otherwise the Clock Edge control will
have no ef
fect.
Vertical Position
Measure at X% of the Unit
Interval
Sets the horizontal position where the measurement is taken, as a percentage of the Unit Interval.
Bit config for TN@BER measurement
This configuration tab is displayed for the TN@BER measurement.
Figure 44: Bit config for TN@BER
Table 39: Bit config for TN@BER
Item Description
Signal Type
Clock Clock Forces the signal to be interpreted as a Clock. Measurements will take place on the edges
specified by the Clock Edge control.
Table continued…
DPOJET Jitter, Noise and Eye Diagram Analysis Solution Application Help 91
Page 92

Jitter, Noise and Eye Diagram Analysis
Item Description
Data Data Forces the signal to be interpreted as a Data. Both rising and falling edges are used.
Auto Allows the application to automatically detect whether the signal is clock or data. If the signal is a clock,
the Clock Edge control will determine which edges are used; otherwise the Clock Edge control will
have no ef
Vertical Position
fect.
Measure at X% of the Unit
Interval
Sets the horizontal position where the measurement is taken, as a percentage of the Unit Interval.
Bit config for mask hits measurements
This configuration tab allows you to select the waveform bit type (All Bits, T
hits measurements.
Figure 45: Bit config for mask hits
Table 40: Bit config for mask hits
Item Description
Bit Type
ransition, or Non-Transition) and the mask to be used for Mask
All Bits Eye analysis includes both transition and non-transition bits.
Transition Eye analysis only on transition bits.
Non-Transition Eye analysis only on non-transition bits.
Mask
Browse Allows selection of the mask file. (If none of the supplied mask files meets your need, you may create a
custom mask file with a text editor by using one of the existing mask specification files as a template.)
Table continued…
DPOJET Jitter, Noise and Eye Diagram Analysis Solution Application Help 92
Page 93

Item Description
Mask There are two types of mask coordinates:
• Absolute: Select to define the mask in terms of absolute values. The units defining the polygon X
and Y values are in the waveforms horizontal and vertical coordinates.
• Relative: Select to define the mask in terms of normalized values. The horizontal axis is
normalized to the Unit Interval and the vertical axis is normalized to Nominal1 and Nominal0.
Normalized levels of 0 and 1 represent logic zero and one respectively
means of the lower and upper halves of the central 0.2 UI of the eye.
Relative Mask Math:
Nominal1 = <Vertical Value of 1>
Nominal0 = <Vertical Value of 0>
UI = <Time Interval of Symbols>
UICenter = <Time at Center of UI>
Jitter, Noise and Eye Diagram Analysis
. These are defined by the
hRelativeStart = 0.5
vValue(y) = (y*(Nominal1 – Nominal0)) + Nominal0
hValue(x) = (x – hRelativeStart-0.5)*UI + UICenter
Bit config for autofit mask hits measurement
This configuration tab allows you to select the waveform bit type (All Bits, T
Mask hits measurements and Advance options.
Figure 46: Bit config for autofit mask hits measurement
Table 41: Bit config for autofit mask hits measurement
Bit config for mask hits Description
ransition, or Non-Transition) and the mask to be used for Autofit
Bit Type
All Bits Eye analysis includes both transition and non-transition bits.
Table continued…
DPOJET Jitter, Noise and Eye Diagram Analysis Solution Application Help 93
Page 94

Jitter, Noise and Eye Diagram Analysis
Bit config for mask hits Description
Transition Eye analysis only on transition bits.
Non-Transition Eye analysis only on non-transition bits.
Mask
Browse Allows selection of the mask file. (If none of the supplied mask files meets your need, you may create a
custom mask file with a text editor by using one of the existing mask specification files as a template.)
Mask • Absolute: Select to define the mask in terms of absolute values. The units defining the polygon X
and Y values are in waveforms horizontal and vertical coordinates.
Relative: Select to define the mask in terms of normalized values. The horizontal axis is normalized
•
to the Unit Interval and the vertical axis is normalized to Nominal1 and Nominal0. Normalized
levels of 0 and 1 represent logic zero and one respectively.
Advance Displays the Mask Offset dialog box.
Autofit configuration: When Autofit is clicked, If “Autofit” configuration is selected, the backend
algorithm automatically identifies the best location where the pixel hits are either minimum or zero in an
eye diagram. The “Horizontal Mask Of
Manual configuration: If Manual configuration is selected, the positive offset value will move the
mask to the right side and negative offset value will move the mask to left side of eye diagram. We
should add a short line of text at the bottom of the Horizontal section: “A positive value moves the
mask to the right”. There will be no mask movement for this particular configuration (Manual = 0
seconds).
Bit config for mask hits ratio measurement
This configuration tab allows you to select the waveform bit type (All Bits, T
hits measurements.
fset” value will get updated in Autofit text box.
ransition, or Non-Transition) and the mask to be used for Mask
DPOJET Jitter, Noise and Eye Diagram Analysis Solution Application Help 94
Page 95

Figure 47: Bit config for mask hits ratio measurement
Table 42: Bit config for mask hits ratio measurement
Item Description
Bit Type
All Bits Eye analysis includes both transition and non-transition bits.
Transition Eye analysis only on transition bits.
Non-Transition Eye analysis only on non-transition bits.
Jitter, Noise and Eye Diagram Analysis
Mask
Browse Allows selection of the mask file. (If none of the supplied mask files meets your need, you may create a
custom mask file with a text editor by using one of the existing mask specification files as a template.)
Bit config for mask margin measurement
This configuration tab allows you to select the waveform bit type (All Bits, T
hits measurements.
Figure 48: Bit config for mask margin measurement
Table 43: Bit config for mask margin measurement
Item Description
ransition, or Non-Transition) and the mask to be used for Mask
Bit Type
All Bits Eye analysis includes both transition and non-transition bits.
Transition Eye analysis only on transition bits.
Table continued…
DPOJET Jitter, Noise and Eye Diagram Analysis Solution Application Help 95
Page 96
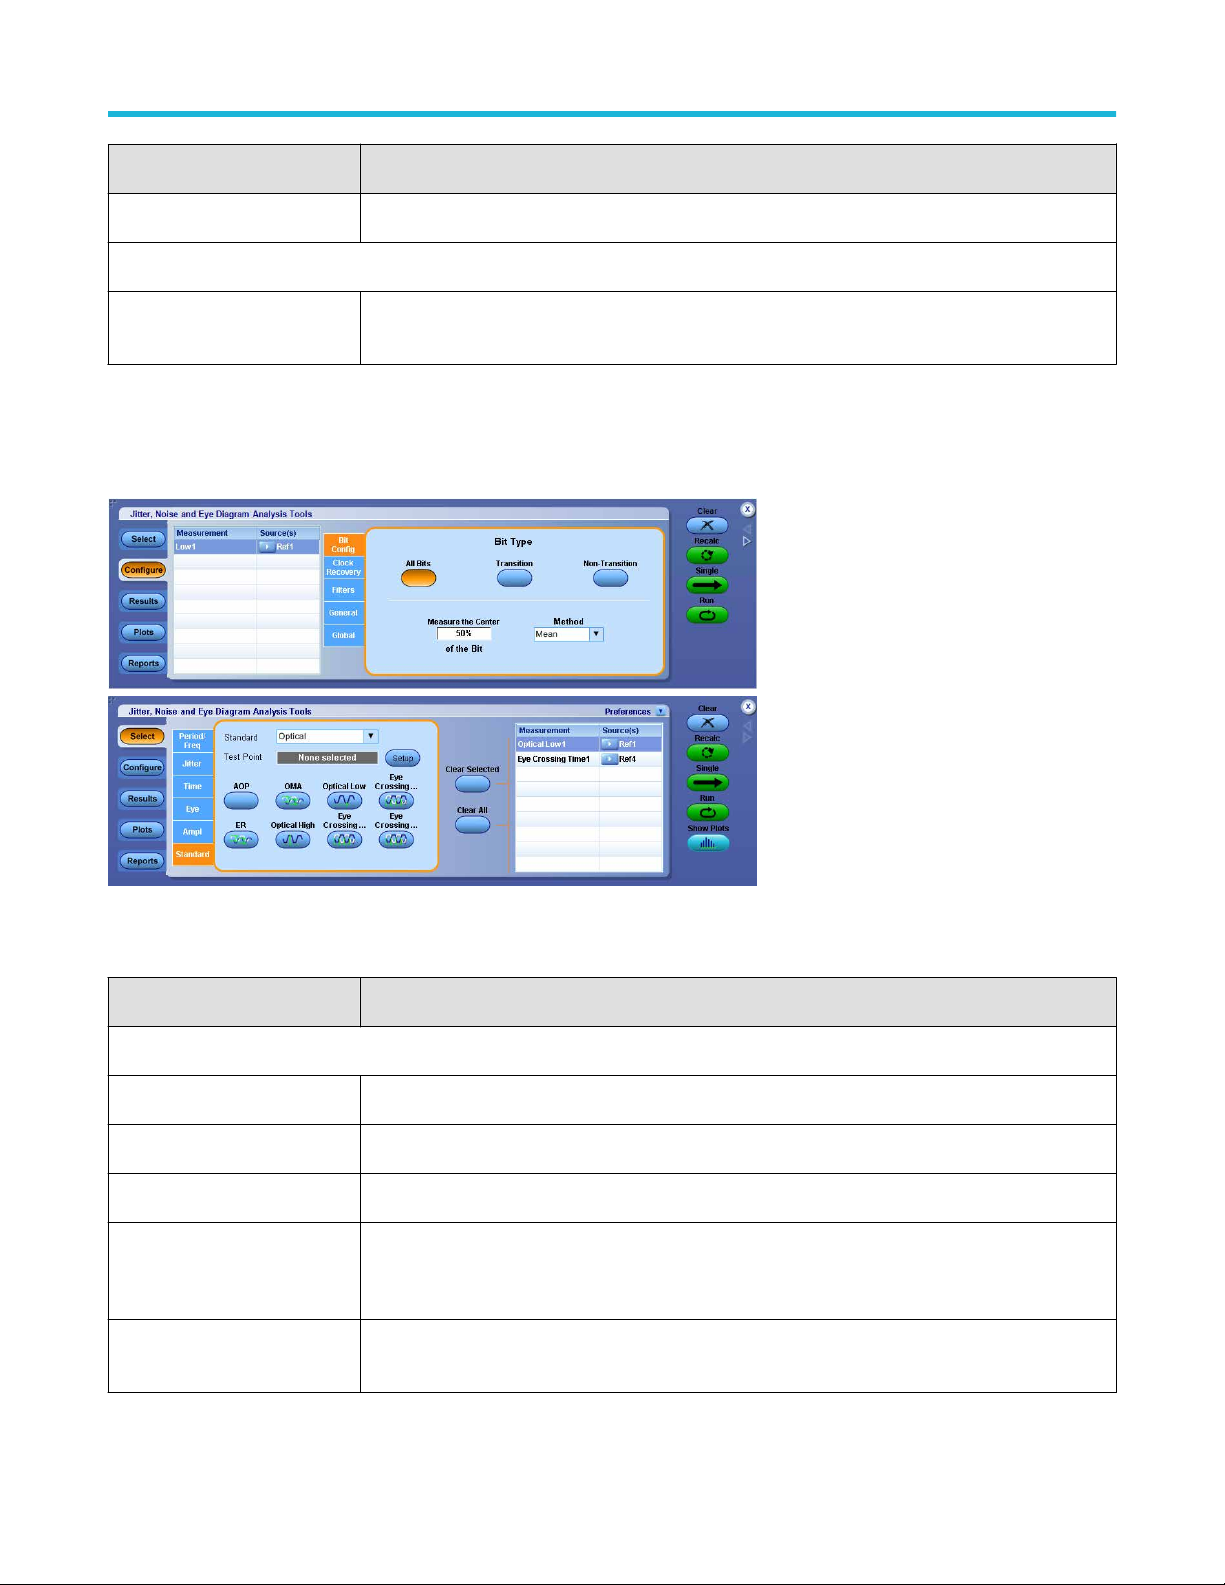
Jitter, Noise and Eye Diagram Analysis
Item Description
Non-Transition Eye analysis only on non-transition bits.
Mask
Browse Allows selection of the mask file. (If none of the supplied mask files meets your need, you may create a
custom mask file with a text editor by using one of the existing mask specification files as a template.)
Bit config for amplitude measurements
This configuration tab is present only for High, Low and High–Low measurements. Y
Transition, Non-Transition) and method.
Figure 49: Bit config for amplitude measurements
Table 44: Bit config for amplitude measurements
Item Description
ou can select the waveform bit type (All Bits,
Bit Type
All Bits Eye analysis includes both transition and non-transition bits.
Transition Eye analysis only on transition bits.
Non-Transition Eye analysis only on non-transition bits.
Measure the Center X% of the
Bit
Method Determines whether the Mean value or the Median of the selected distribution is used for the
DPOJET Jitter, Noise and Eye Diagram Analysis Solution Application Help 96
Determines what percentage (1 to 100) of a unit interval, centered in the middle of the bit, shall be
included in each measurement. The waveform points selected by the percentage form a distribution
(vertical histogram) from which a single value is extracted, based on the Method control.
measurement value for each unit interval.
Page 97
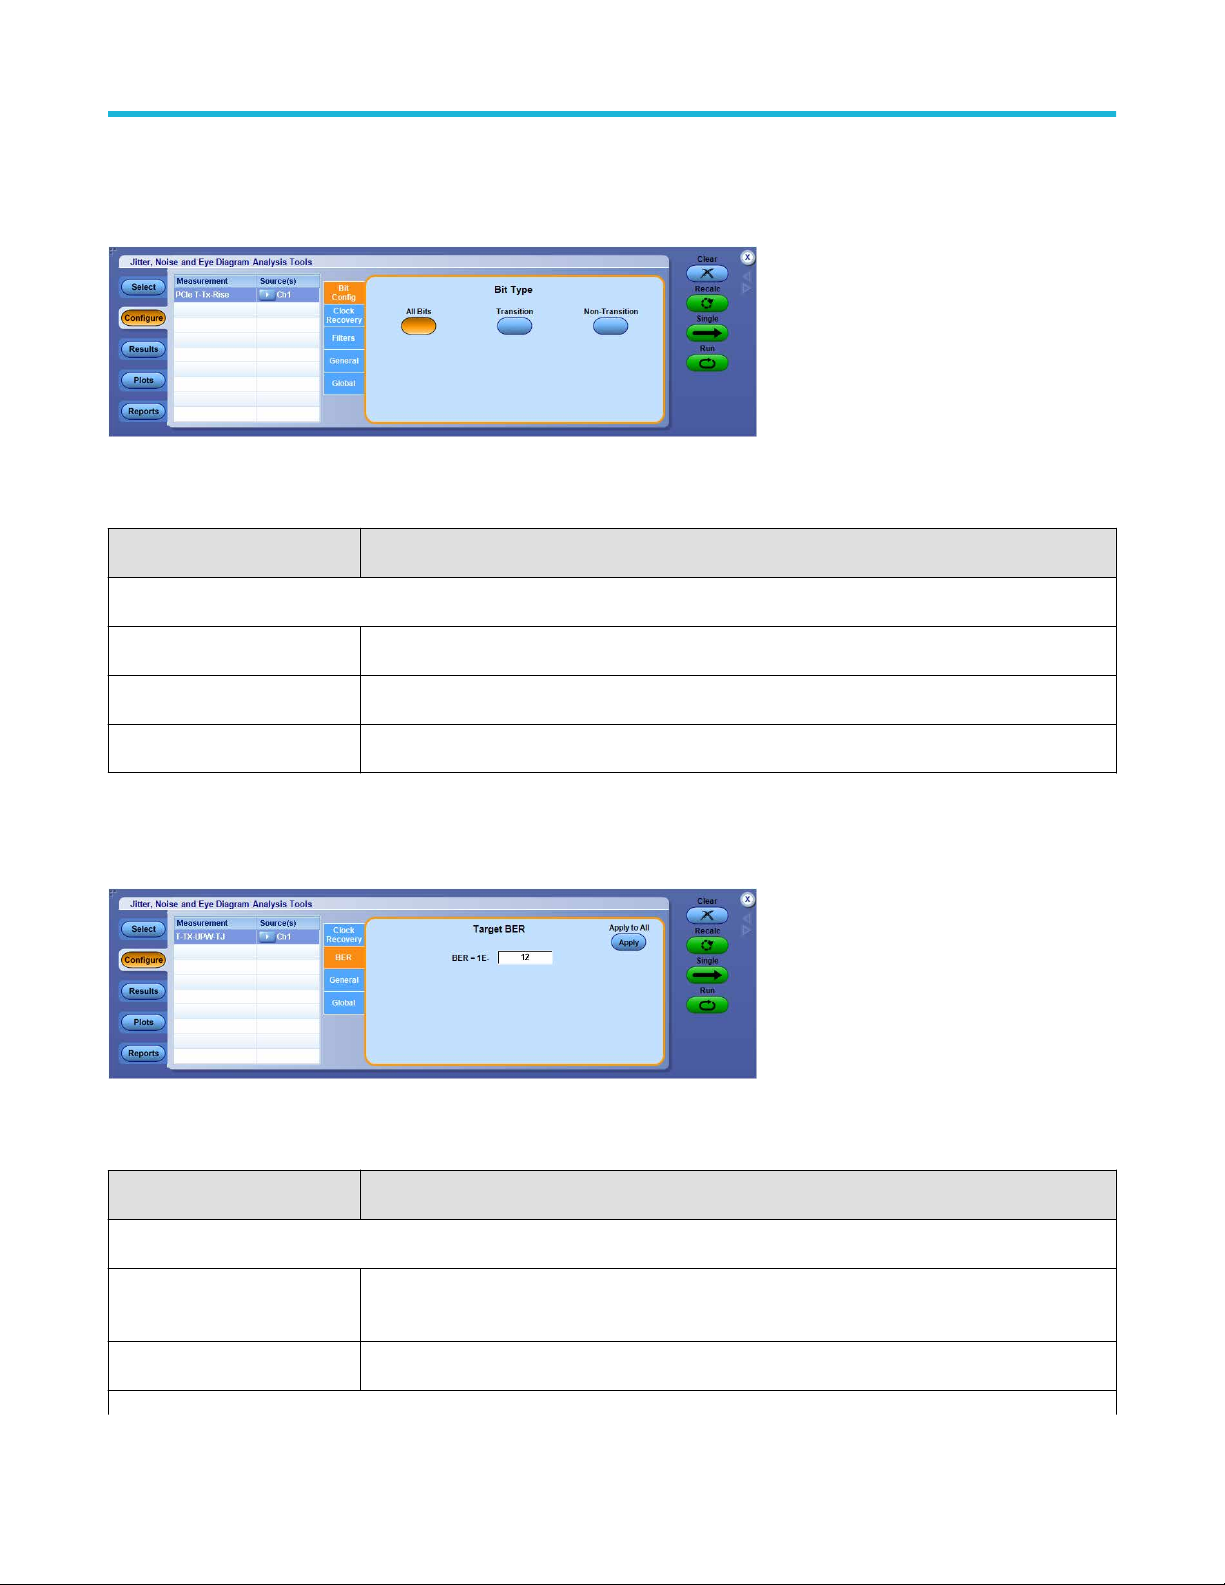
Bit config for PCI express measurements
Jitter, Noise and Eye Diagram Analysis
This configuration tab allows you to select which waveform bit types (T
Express measurements, PCIe T-Tx-Rise and PCIe T-Tx-Fall.
Figure 50: Bit config for PCI express measurements
ransition, Non-Transition or All Bits) are included when taking PCI
Table 45: Bit config for PCI express measurements
Item Description
Bit Type
All Bits Analysis includes both transition and non-transition bits.
Transition Analysis only on transition bits.
Non-Transition Analysis only on non-transition bits.
BER
The BER configure panel is available for T
Figure 51: BER configure panel
Table 46: BER configure
Item Description
Target BER
BER= 1E-? Sets the Bit Error Rate exponent, thereby setting the statistical level at which Total Jitter and Eye
Apply To All
Table continued…
-TX-UTJ, T-TX-UDJDD, T-TX-UPW-TJ, T-TX-UPW-DJDD, PkPkClkTJ measurements.
Opening are reported.
DPOJET Jitter, Noise and Eye Diagram Analysis Solution Application Help 97
Page 98

Jitter, Noise and Eye Diagram Analysis
Item Description
Apply Applies the Target BER value to both Jitter Target BER and Target BER for all the measurements that
have the BER as the configuration tab.
RJ-DJ
About RJ-DJ
This configuration tab allows you to select an appropriate decomposition method for jitter analysis. The RJ-DJ decomposition analysis
divides the timing jitter into various categories and uses the results to predict the total jitter at a selected bit error rate (BER).
The DPOJET application of
fers two methods of RJ-DJ analysis:
• A method based on spectral analysis that is appropriate for cyclically repeating data patterns.
• A method that works for arbitrary data sequences.
This tab allows you to configure the decomposition method based on the data pattern. By default, the decomposition method is selected
automatically based on the detected bit pattern. This is the recommended configuration.
Figure 52: RJ-DJ
Table 47: RJ-DJ analysis of repeating options
Item Description
Pattern Detection/Control
Auto [Preferred] Causes the data pattern to be detected automatically on the first acquisition following a “Clear” or
configuration change. Based on this detection, the Pattern T
ype and associated controls are then
configured optimally for the given record length.
Manual Allows (and requires) that the Pattern Type and associated controls be set manually.
Pattern Type
Pattern Type - Repeating
If the data signal is repeating pattern of N bits, then Repeating pattern type should be selected.
15
Pattern Type - Arbitrary If the data signal is non-repeating pattern, or is unknown then Arbitrary pattern type should be
selected.
Table continued…
15
A minimum of 50 repeats of the pattern must be present.
DPOJET Jitter, Noise and Eye Diagram Analysis Solution Application Help 98
Page 99

Jitter, Noise and Eye Diagram Analysis
Item Description
Pattern Length (Present only when the Pattern Type is Repeating.) When Pattern Detection is Auto, this field shows
the detected pattern length. When Pattern Detection is Manual, this control must be set to match the
actual pattern length. If the manually-set pattern length is inconsistent with the detected pattern length,
processing will continue but a warning will be logged.
Window Length (Only present when the Pattern Type is Arbitrary.) Determines the number of unit intervals over which
pattern correlation ef
impulse response of the serial data transmitter and channel have settled.
Target BER
BER= 1E-? Sets the Bit Error Rate exponent, thereby setting the statistical level at which Total Jitter, Total Noise
and Eye Opening are reported.
Note: T
BER mask test and PDF mask test measurements.
Apply To All
Apply Applies all settings on this configuration tab to all other measurements that have an RJ-DJ tab.
fects are analyzed. The window should be set to a large enough value that the
arget BER configuration is available only for TJ@BER, Width@BER, Height@BER,
Noise Compensation
Scope RN(rms)
Sets the scope vertical noise in terms of RMS.
Note: Noise Compensation is available only in Jitter+Noise decomposition method for
TJ@BER, RJ, RJ - dual dirac and Width@BER measurements.
Related topics
RJ-DJ analysis of arbitrary pattern
RJ-DJ analysis of repeating patterns on page 99
on page 100
RJ-DJ analysis of repeating patterns
This method of RJ-DJ analysis uses a Fourier transform of the time-interval error signal to identify and separate jitter components. It is
described in the Fibre Channel - Methodologies for Jitter and Signal Quality Specification (MJSQ) and has wide industry acceptance.
This method requires that the data signal be composed of a pattern of N bits that are repeated over and over. A minimum of 50 repeats of
the pattern must be present. If you select Manual configuration, you must enter the pattern length (N), although it is not necessary to know
the specific bits that make up the pattern. If you use the default “Auto” configuration, this method will be selected if possible and configured
based on the detected bit pattern.
Figure 53: RJ-DJ analysis of repeating pattern
DPOJET Jitter, Noise and Eye Diagram Analysis Solution Application Help 99
Page 100

Jitter, Noise and Eye Diagram Analysis
RJ-DJ analysis of arbitrary pattern
When the data pattern is not repeating, or is unknown, a second method of RJ-DJ analysis may be used. (It may also be used if the pattern
is repeating, and correlates well with the Spectral method in this case.) This method assumes that the Inter Symbol Interference (ISI) from
a given edge only af
string of zeros, the signal may require three or four bit periods to fully settle to the “high” state.
In this method, an analysis window with a width of K+1 bits is slid along the waveform. For each position of the window, the time interval
error of the rightmost bit in the window is stored, along with the K-bit pattern that preceded it. After the window has been slid across all
positions, it is possible to calculate the component of the jitter that is correlated with each observed K-bit pattern, by averaging together all
the observed errors associated with that specific pattern.
In the configuration menu for the arbitrary-pattern method, the Window Length field allows you to select how many bits are included in the
sliding window. The window should include enough bits to allow the impulse response of the system under test to settle, usually 5 to 10
bits. The disadvantage of increasing the window length is that it uses more memory and requires additional processing time and greater
measurement population to form an answer. If the measurement population is not sufficient at the end of a processing cycle to calculate an
answer, the results table displays <Min# of UI.
Prior versions of DPOJET allowed direct control of the minimum number of observations required for each data pattern, before a result
would be produced. This minimum is now set internally to 10. DPOJET always uses all available observations; this control only set the
minimum allowable.
The arbitrary pattern approach for measuring jitter may not be appropriate if there are very-long-duration memory effects in your data link.
An example would be if there are impedance mismatch reflections that arrive long enough after the initial edge to fall outside the analysis
window.
fects a relatively small number of subsequent bits. For example, in a band-limited link where a string of ones follows a
Figure 54: RJ-DJ analysis of arbitrary pattern
RN-DN
About RN-DN
This configuration tab allows you to select an appropriate decomposition method for noise analysis. The RN-DN decomposition analysis
divides the noise into various categories and uses the results to predict the total jitter at a selected bit error rate (BER).
The DPOJET application of
• A method based on spectral analysis that is appropriate for cyclically repeating data patterns.
• A method that works for arbitrary data sequences.
This tab allows you to configure the decomposition method based on the data pattern. By default, the decomposition method is selected
automatically based on the detected bit pattern. This is the recommended configuration.
fers two methods of RN-DN analysis:
DPOJET Jitter, Noise and Eye Diagram Analysis Solution Application Help 100
 Loading...