

Page 1

xx
DataVu-PC
Analysis Software
ZZZ
Quick Start Guide
Register now!
Click the following link to protect your product.
► www.tek.com/register
www.tek.com
077-1347-01
Page 2

Copyright © Tektronix. All rights reserved. Licensed software products are owned by Tektronix or its subsidiaries or suppliers, and are
protected by na
tional copyright laws and international treaty provisions.
Tektronix pro
previously published material. Specifications and price change privileges reserved.
TEKTRONIX and TEK are registered trademarks of Tektronix, Inc.
ducts are covered by U.S. and foreign patents, issued and pending. Information in this publication supersedes that in all
Contacting Tektronix
Tektronix, Inc.
14150 SW Karl Braun Drive
P.O. Box 500
Beaverton, OR 97077
USA
For product i nformation, sales, service, and technical support:
In North America, call 1-800-833-9200.
Worldwide, visit www.tek.com to find contacts in your area.
Page 3

DataVu-PC Quick Start Guide
1
Preface
Hardware Requirements
The minimum and recommended specifications are as follows:
Supported Operating
Systems
Windows 7™ 64-bit
Windows 8™ 64-bit
Windows 10™ 64-bit
RAM
Minimum: 1 GB
Recommended: ≥ 4 GB
Local Disk Free Space
Minimum: 400 MB
Recommended: ≥ 1GB
LAN
Internet connection for
software activation
Installation
Note
: Some features may be hindered on PCs with limited
specifications. It is highly recommended to turn off any power-saving
mode that may be running on the device while using DataVu-PC.
To install DataVu-PC on Windows™:
1. In Windows Explorer, navigate to the location of the setup file
and double-click it.
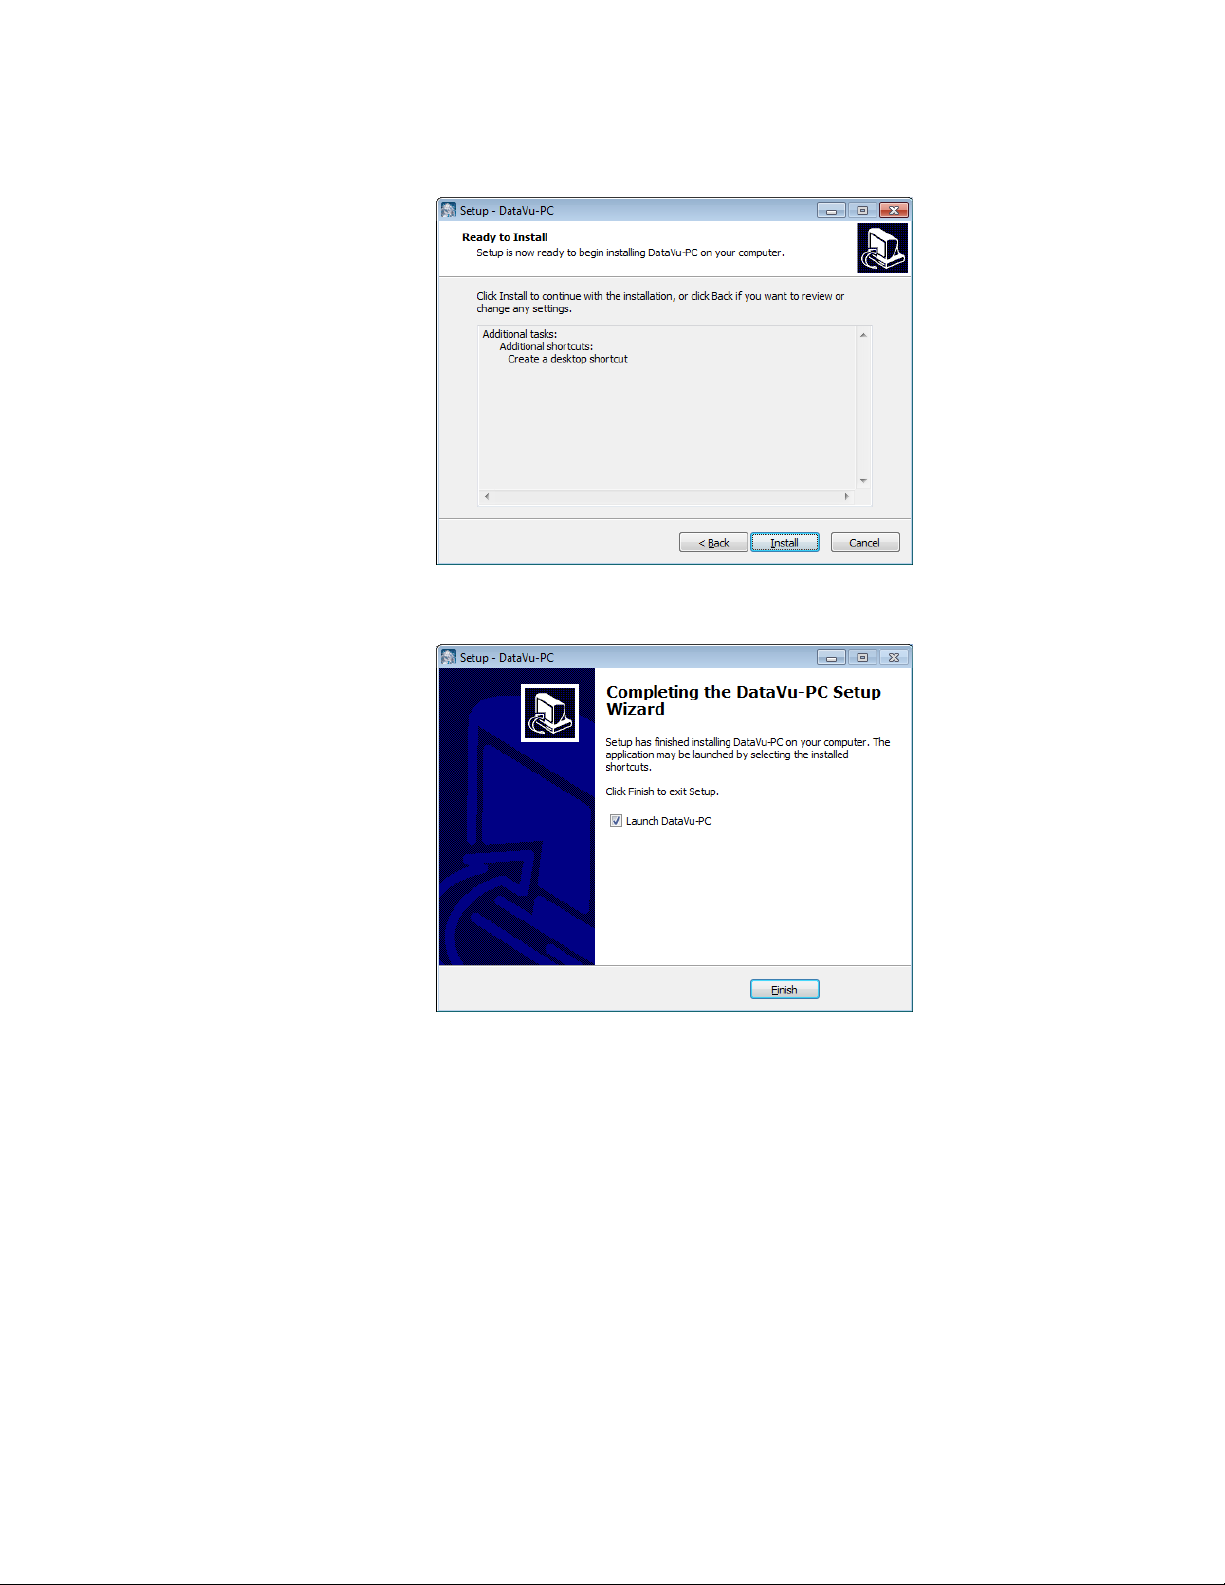
2. Select whether or not to create a desktop shortcut, then select
Next to continue.
Page 4
DataVu-PC Quick Start Guide
2
3. Select Install to begin the installation.
4. Select Finish to complete the installation.
Licensing
DataVu-PC requires either a 30-day trial license or full license to function
beyond Preview Mode.
Preview Mode
If no demo or full licenses are installed, DataVu-PC will default to
Preview Mode. This mode allows the following operations:
● Playback of files of all bandwidth files limited to the first 100 ms
(Playback Control settings are restricted)
● Use one channel of RSA LiveVu with up to 100 ms of recording
● Change basic display settings
● Full conversion of 12-bit to 16-bit files in the Export window
● Full conversion of .R3F files to IQ file formats
● License Manager operations
Page 5

DataVu-PC Quick Start Guide
3
Purchasing a
License
To purchase optional application licenses, contact your local Tektronix
Account Manager. After purchasing a license, you will receive an email
with a list of the applications purchased and the URL to the Tektronix
Product License Web page, where you will create an account and
manage your licenses: http://www.Tek.com/products/product-license
The product license page provides an inventory of the license(s) in your
account. It enables you to check out or check in a license and view the
history of licenses.
Optional applications are enabled by one of the following license types:
License type
Description
Node-Locked License
(NL)
This license is permanently assigned to a
specific host id
Floating License (FL)
This license can be moved between
different host ids
Adding a
License
To add a license:
1. If necessary, purchase a trial or full license through the Tektronix
website.
a. Click on the purchase link to open Tektronix’s licensing
page.
b. Follow the steps on the page to purchase a license.
c. Enter the DataVu-PC Host ID when prompted (click the
clipboard icon to the right of the Host ID to copy).
2. Download the .lic license key.
3. Click License Manager in the lower-left corner of the DataVu-PC
main screen.
4. Add the license to DataVu-PC by clicking Add License and
navigating to the .lic license key.
Page 6

DataVu-PC Quick Start Guide
4
Removing a
License
Licenses may be removed by selecting a license and clicking Remove
License. This is necessary if a floating license is to be used on another
instrument.
1. Click License Manager in the lower-left corner of the DataVu-PC
main screen.
2. Select the desired license by clicking on it.
3. Click Remove License.
4. Select the desired location for the exit license file to be saved.
5. Navigate to your Tektronix Product License account page and
check in the saved exit license file.
Moving a
License to a
Different Host
You can return a purchased license and then reassign it to a different
host, as indicated below.
Node-Locked License (NL) – This license type can be reassigned no
more than two times. This allows you to reassign the license in the case
of an upgrade to a new Windows platform, for example.
Floating License (FL) – This license type can be reassigned an
unlimited number of times. When assigning a floating license, you need
to specify the HOST ID and the duration the feature is to be enabled on
the host. After the license expires, the feature is automatically disabled
on that host and the license is then available to be assigned to a
different host.
Free trial license (FT) – This license type expires after 30 days.
Introduction
to DataVuPC
DataVu-PC makes vector signal analysis as easy as playing your favorite
video: simply play, pause, seek, loop, zoom in/out, speed up/slow down.
Search functions including pulse search and power threshold search
enable the user to quickly find and view signals of interest.
Supported input file types include .xdat, .siqd, .tiq, and .r3f RF data
files.
Page 7
DataVu-PC Quick Start Guide
5
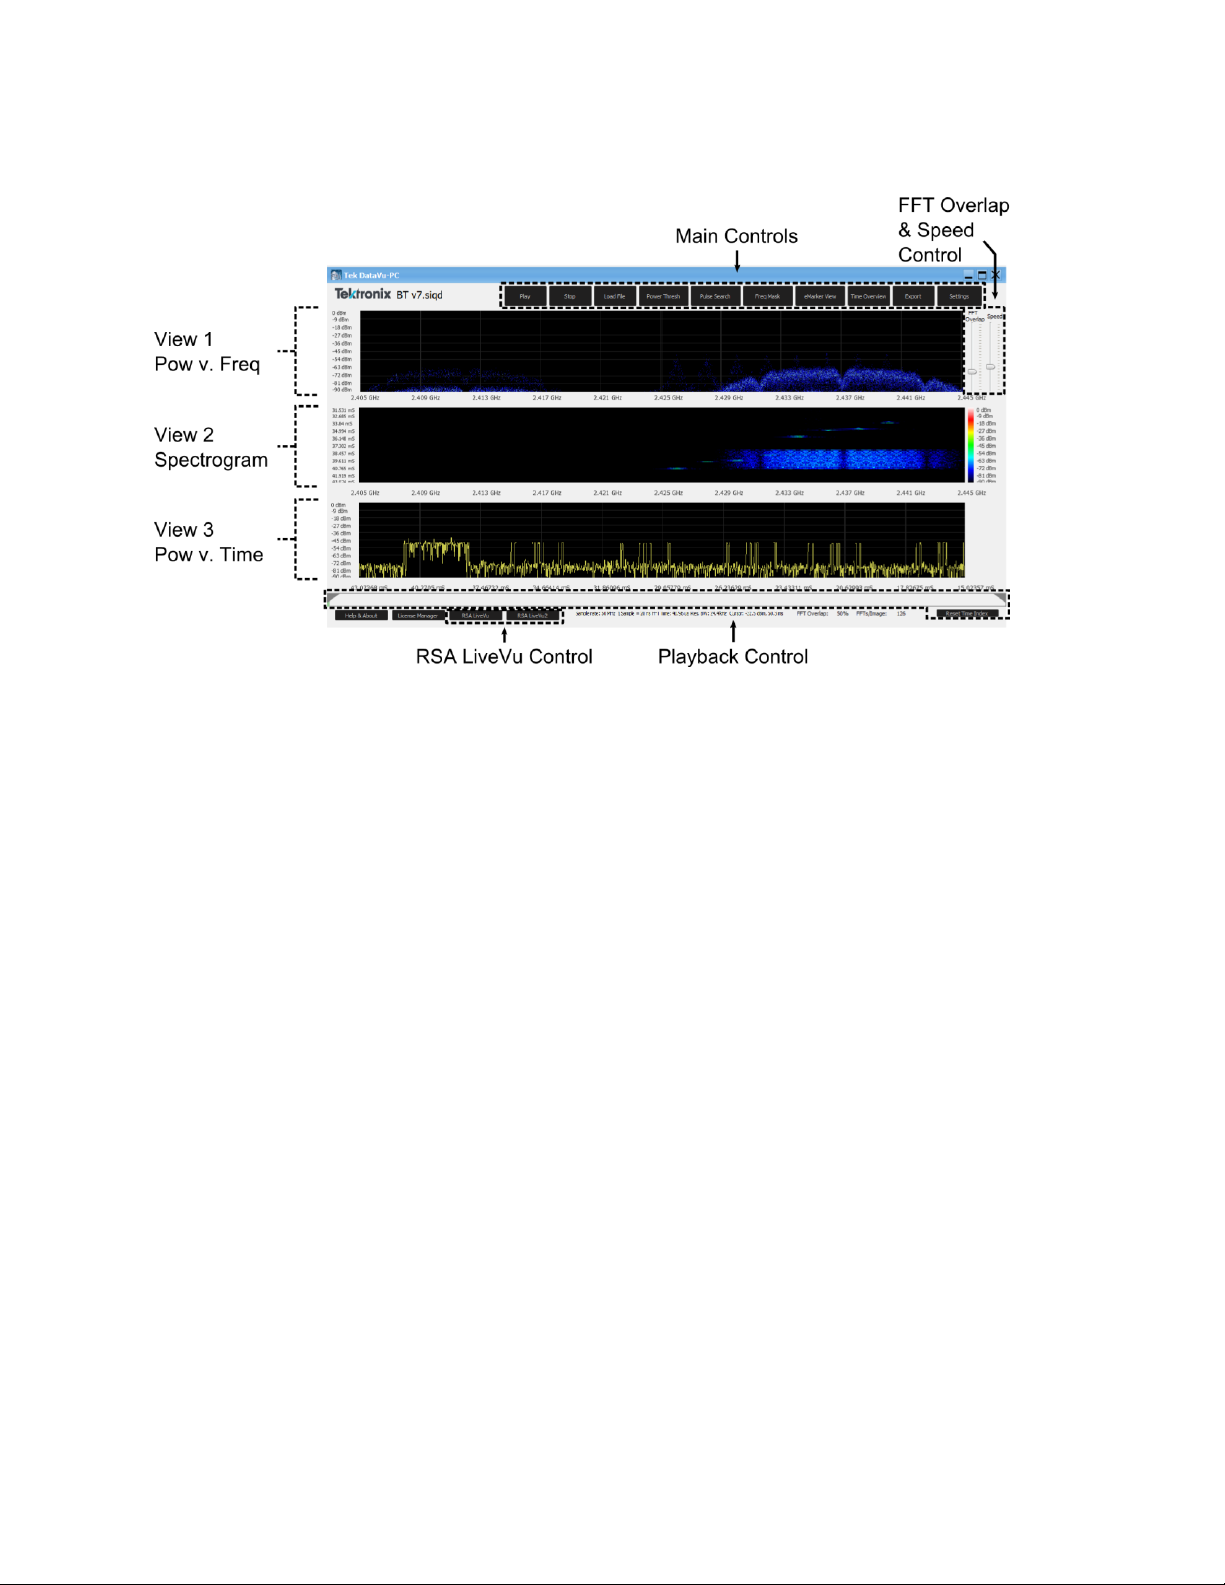
The main screen controls and views are as follows:
Main Controls
Play/Pause
– Toggles between playing and pausing playback of the
loaded file. If no file has been loaded, the file selection dialog appears.
Stop
– Stops playback, resetting the playback index to the start index.
Load File
– Brings up the file selection dialog. Browse to and select an
RF data file of .xdat, .siqd, .tiq, or .r3f file types.
Power Threshold Search
– Searches through the loaded file and finds
instances where the specified power threshold is met or exceeded.
Results are presented in a separate window. Right-click a result to jump
to that portion of the file, or set that result as the start index or stop
index.
Pulse Search
– Searches through the loaded file and finds pulses where
the specified pulse power threshold is met or exceeded. Results are
presented in a separate window. Right-click a result to jump to that
portion of the file, or set that result as the start index or stop index.
Freq Mask
– Search for and mark events that violate a defined
frequency mask. This is especially useful for pinpointing spurious
signals within a transmission, or any signal that otherwise violates a
desired power level and frequency range.
eMarker View
– Allows you to manage the eMarkers associated with the
loaded file. eMarkers can be deleted, edited, added, imported, or
saved.
Page 8

DataVu-PC Quick Start Guide
6
Time Overview
– Displays, in a separate window, a power vs. time
overview of the entire file with maximum power in yellow, average
power in blue, and minimum power in purple. Click and drag to zoom
into specific sections of the file. Right-click within the overview to add
an eMarker to that point in the file, or set that point as the start index or
stop index.
Export
– Exports the loaded file. Select the file format, start index, stop
index, output location, and file name. Conversion between file types is
supported.
RSA LiveVu
and
RSA LiveVu2
- Displays, in a separate window, real-time
streaming data from 1 or 2 connected RSA600A, RSA500A, or RSA306B
Signal Analyzer(s). Recording of streaming data is possible up to 40MHz
bandwidth for either free running or triggered data.
Playback Information
– The FFT time, sample time resolution, resolution
bandwidth and current cursor information will all be listed at the bottom
of the application.
Settings
– Opens a menu for controlling finer DataVu-PC settings:
Page 9

DataVu-PC Quick Start Guide
7
General Settings
Set the Start and Stop Time Indexes of
the selected file. Modifying these fields
is the same as setting the Start and
Stop Indexes in the Playback Control
bar, Export Window, Time Overview or
selected by eMarkers. The indices will
apply to all functions including searches.
Set the playback to continuously loop,
or play once.
General Spectrum
Settings
Change the FFT Windowing function
and the FFT length to fine-tune the
Spectrum displays.
Persistence
Spectrum Settings
Enable or disable the Persistence
Spectrum view.
Set the Maximum and Minimum Power
for the Spectrum view.
Set Max Hold Trace on/off.
Set the Decay of the spectrum to Short,
Medium, Long, or Infinite.
Spectrogram Scale
Enable or disable the Spectrogram view.
Set the Maximum and Minimum Power
for the Spectrogram view.
Power v. Time Scale
Enable or disable the Power v. Time
view.
Set the Maximum and Minimum Power
for the Power v. Time view.
Views
Views may be enabled or disabled in the Settings menu. There are a
total of 3 possible views, with a possible 1 to 3 views concurrently
displayed, excluding the Time Overview view.
When all views are enabled, the following order is established:
View 1 (top view) shows a Power (y axis) v. Frequency (x axis)
display of the waveform in the loaded file. Mouse over this view
to show the frequency and power (dBm).
View 2 (middle view) shows a Spectrogram display. Mouse over
the spectrogram to show the frequency, power (dBm), and time.
View 3 (bottom view) shows a Power v. Time display. Mouse
over this view to see the power (dBm).
Page 10

DataVu-PC Quick Start Guide
8
Time Input
The following units may be used on any time-based text entry in
DataVu-PC: (e.g. “200 us”, “5 M”) The time interval per sample is
displayed in the Playback Information section at the bottom of the main
window.
Input Label
Unit
M
Minute
s
Second
ms
Millisecond
us
Microseconds
ns
Nanoseconds
Samples or blank
Samples
FFT Overlap &
Speed Control
Bars
The FFT Overlap bar sets the FFT Overlap size/Time Skip Interval. A
higher overlap percentage will cause greater probability of intercept for
short pulses. When the slider is set below the halfway point, FFT
Overlap mode is enabled, and every sample in the file will be used.
When the slider is set above the halfway point, Time Skip is enabled,
which causes the playback to go faster, but some samples in the file will
be skipped. The current FFT Overlap percentage or Time Skip Interval
will be displayed in the bottom right of the main screen.
The Speed bar sets the Number of FFTs per display frame. A higher
value will compute more samples into each image. The actual display
graph’s Frames Per Seconds (FPS) will fluctuate based on PC
performance.
Playback Control
The Playback Control Bar shows the progress of the playback within the
loaded file. Jump to any part of the playback by left-clicking within the
Playback Control Bar.
The Start and Stop Indexes set where the playback should begin and
end. The Start and Stop Indexes can be set by either right-clicking
within the Playback Control Bar, or dragging the Start/Stop Index Flags.
Select Reset Time Index to reset the Start and Stop Indexes to the
beginning and end of the loaded file.
Add an eMarker to the file by right-clicking on the Playback Control Bar
and selecting Add eMarker Here.
When a file contains over 1,000 eMarkers, a second Playback Control
Bar will display. When a file contains over 50,000 eMarkers, a third
Playback Control Bar will display. Up to 2,000,000 eMarkers can be
displayed.
Page 11

DataVu-PC Quick Start Guide
9
The main (top) Playback Control Bar will be split into 50 divisions,
showing how many eMarkers are contained in each division. The top
bar will continue to show the full file playback progress, with the current
division highlighted in black. The bottom bar(s) will show the progress
through the current division. The bottom bar(s) act(s) as a zoom
function for the playback within the current division.
eMarkers
eMarkers
provide a convenient way to “tag” an event within a recording
for future analysis. eMarkers are stored in a compressed format to an
.emrk file. Currently, there is a limit of 3,000,000 markers that can be
found and saved.
In DataVu-PC, the term
markers
is used to refer to legacy XML
formatted markers stored as .xmrk files.
An eMarker may have the following properties:
Start Time
(Required)
The point in time that the event begins.
If no time unit label is entered, samples
will be used.
Stop Time
(Optional)
The point in time that the event ends.
If no Stop Time is specified, the
eMarker serves as a simple tag denoting
a single point in time.
Start Frequency
(Optional)
The point in frequency that the event
begins. The Start and Stop Frequency
properties are mostly used to denote a
signal’s changing frequency from
beginning to end, such as with a radar
chirp.
Stop Frequency
(Optional)
The point in frequency that the event
ends.
Start Power (dBm)
(Optional)
The power level of the event at its
beginning.
Stop Power (dBm)
(Optional)
The power level of the event at its end.
Comments
(Optional)
An informational field that can be used
to convey any desired extra information
(e.g.,
Signal Spike 1
).
Page 12

DataVu-PC Quick Start Guide
10
eMarkers will be added by any search or by importing marker files.
eMarkers can also be manually added in the following ways:
1.
Views
– right-click on any view, including Time Overview, and
select Add eMarker Here. Time and power will be pre-filled;
frequency will be pre-filled for all views except Power v. Time.
2.
Playback Control Bar
– right-click on the Playback Control Bar
and select Add eMarker Here. Time will be pre-filled.
3.
Manually
– select eMarker View and then Add eMarker.
eMarkers can be viewed and managed in the eMarker View window.
Left-click on any field, excluding Pulse Duration and PRI, to edit it
manually. Right-click on any eMarker to jump to the eMarker’s time
position in the recording, set the eMarker as the start index or stop
index, or delete the eMarker altogether.
All eMarkers can be cleared by selecting Delete All. Add an eMarker
manually by selecting Add eMarker. Import another eMarker or marker
file by selecting Import Markers. Note that this operation is additive –
the eMarkers or markers in the imported file are added to the existing
eMarkers (if only the imported eMarkers are desired, first clear all
existing eMarkers by selecting Delete All). Save eMarkers to the
associated loaded file by selecting Save eMarkers.
eMarkers can also be exported as PDWs into a tab-delimited format with
column headers.
Page 13

DataVu-PC Quick Start Guide
11
Time Overview
Time Overview shows, in a separate window, a power vs. time overview
of the entire file with maximum power in yellow, average power in blue,
and minimum power in purple.
Click and drag to zoom into specific sections of the file. Right-click
within the overview to add an eMarker to that point in the file or set that
point as the start index or stop index.
Frequency Mask
The Frequency Mask function is a tool that can be used to search for
and mark events that violate a defined frequency mask. This is
especially useful for pinpointing spurious signals within a transmission,
or any signal that otherwise violates a desired power level and
frequency range.
A frequency mask is a line composed of at least 2 points. Points can be
added or removed visually by right-clicking the display at the desired
location, or manually by clicking
Add Point
or
Remove Point
. Points can
also be moved within the display by dragging. The list of frequency
mask points and their power and frequency is shown at the left of the
window.
Clicking
Auto-Mask
automatically creates a mask around the current
signal trace, at a slightly higher power level. This powerful function
Page 14

DataVu-PC Quick Start Guide
12
allows for the creation of a very precise mask that can detect a spurious
signal within a standard transmission. The amount of points used in the
creation of the Auto-Mask can be increased or decreased by adjusting
Automask Points
.
The entire frequency mask can be adjusted slightly up or down by
clicking
Raise All Points
or
Lower All Points
.
The maximum and minimum display power can be adjusted with
Max
Display Power
and
Min Display Power
. The
Mask Bandwidth
can also be
modified.
Once the desired frequency mask has been created, click
Start
to begin
searching for violations of the frequency mask. After the processing has
finished, a list of eMarkers will display, representing events that violated
the frequency mask.
Frequency mask profiles can be saved (
Save
) and later loaded (
Load
).
All points can be cleared (
Clear
), or a completely fresh mask created
(
New
).
Search results will be displayed in eMarkers. The current FFT Overlap
and FFT Length settings will be used for the search. A higher overlap
percentage and longer FFT length will take more time but will have
better time and frequency resolution, respectively.
RSA LiveVu
DataVu-PC can view real-time streaming data from 1 or 2 connected
RSA600A, RSA500A, or RSA306B Signal Analyzer(s). Each Channel can
record up to 40 MHz of bandwidth for any duration up to the maximum
storage available. External and RF Threshold triggers are supported on
each channel.
Max Display Power
Increase or decrease the maximum
display power.
Page 15

DataVu-PC Quick Start Guide
13
Min Display Power
Increase or decrease the minimum
display power.
Display Mode
Select
Spectrum Traces
or
DPX View.
The Spectrum Traces display can show
a much wider bandwidth than the
graphical DPX histogram display.
Pause/Resume
Pauses or resumes the display video.
Preset
Presets the connected Signal Analyzer
to default settings.
Preamp
Turn the Signal Analyzer Preamp on or
off.
CF
Modify the center frequency of the
Signal Analyzer.
Span
Modify the Span of the Signal Analyzer.
Supported DPX Bandwidths:
9.965 kHz
19.531 kHz
39.062 kHz
78.125 kHz
156.25 kHz
312.5 kHz
625 kHz
1.25 MHz
2.5 MHz
5 MH
10 MHz
20 MHz
40 MHz
Trace View can display the max span.
Ref lvl
Modify the Reference Level of the Signal
Analyzer.
Res BW
Modify the Resolution Bandwidth of the
Signal Analyzer.
Capture Type
Select
Free Run
or
Triggered
. A Free
Run capture begins immediately after
pressing Start. A Triggered capture
begins after the Trigger Type condition
is met.
Page 16

DataVu-PC Quick Start Guide
14
Trigger Type
Select
External
or
RF Power Trig
.
External sets the capture to begin when
the Signal Analyzer receives a TTL level
trigger on its Trigger port. RF Power
Trig will trigger the capture to start
once a signal has reached the RF
Trigger Level.
RF Trigger Level
Sets the level that a signal must reach
to trigger a RF Power Trig triggered
capture.
Record Duration
Sets the length of time data should be
captured.
Location
Sets the file path and file name and file
type of the capture file. The supported
file types include: .xdat, .siqd/h, or .tiq.
Start Capture
Starts the capture of data or waits for
an incoming trigger stimulus. The
capture start can be forced while
waiting for the incoming trigger.
Spectrum Traces is the default display, because it can show a much
wider bandwidth than the graphical DPX histogram display. Once a
signal of interest is noted, click on it within the display to switch to the
DPX display to see the signal in greater detail. If both LiveVu displays
are showing, the other window will zoom into the signal of interest. In
DPX mode, the center frequency can be adjusted by clicking and
dragging on the screen in the desired direction. The LiveVu displays will
stop operation and close when another operation is started, such as
playing a file or running a search.
Captures of variable duration up to 40MHz bandwidth can be made for
later post-processing and analysis. Captures may be started manually,
or by an external trigger or RF trigger. Sufficient USB bus speed and
hard disk speed is required for full span captures. To install the USB
driver for the Tek RSA spectrum analyzers. Download the RSA API at
the Tektronix website.
Note: Any recording with a span equal or less than 2.5 MHz will be
recorded as a 32-bit .TIQ file. This will occur regardless of what file type
is selected. DataVu-PC supports 32-bit TIQ files for all features.
Page 17
DataVu-PC Quick Start Guide
15
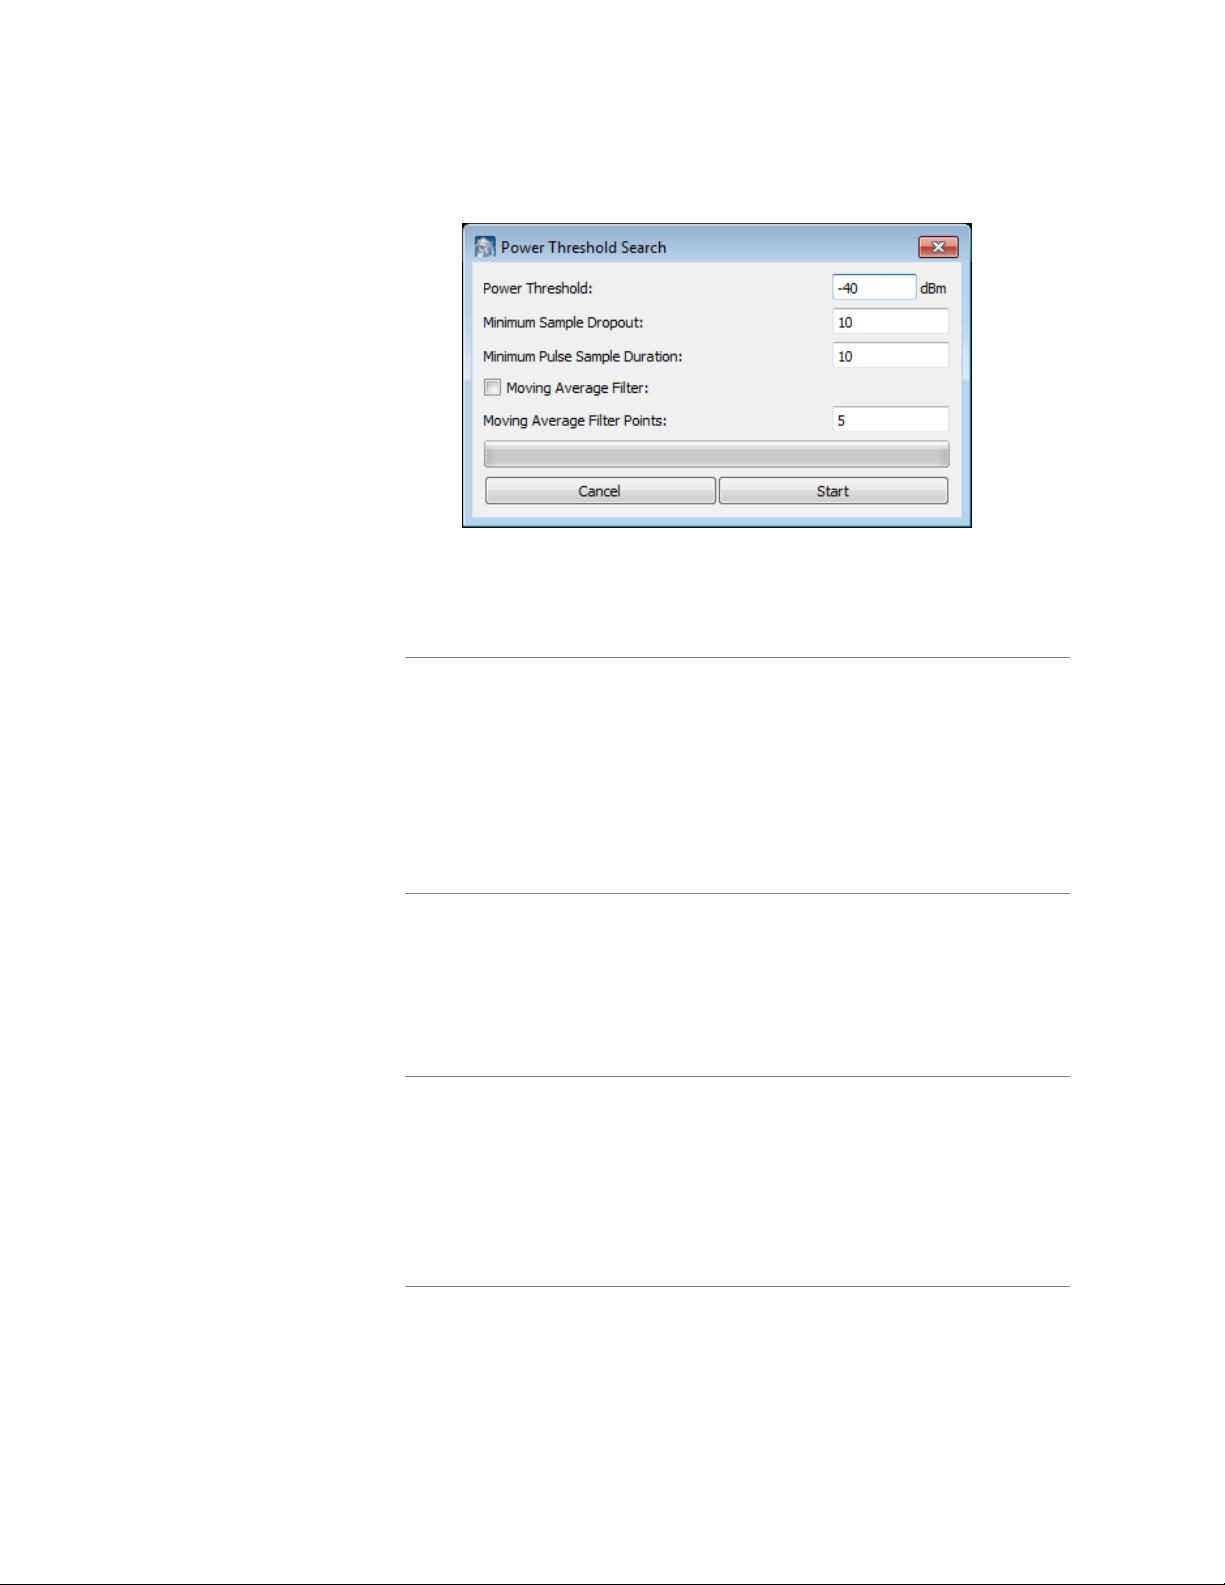
Power Threshold Search
The Power Threshold Search searches through the loaded file and finds
instances where the specified power threshold is met or exceeded.
Power Threshold
(dBm)
The power level of the signal in dBm
that needs to be met for the search to
mark the event as a positive result.
Minimum Dropout
Samples
Sets how long the event may drop
below the input threshold before the
signal is marked as another event (e.g.,
if set to 40 samples, the signal may
drop below the input threshold up to 40
samples before the signal is marked as
another event). If no time unit label is
entered, samples will be used.
Minimum Pulse
Duration
Sets how long the shortest event can be
(e.g., if set to 2 samples, the signal
must cross the Power Threshold for 2
samples to be marked as a positive
result). If no time unit label is entered,
samples will be used.
Moving Average
Filter
Performs a moving average calculation
on the recorded data as the search is
performed. This operation helps to
filter out signal spikes that may produce
false positive results. Using the moving
average filter will increase the
processing time of the search.
Page 18
DataVu-PC Quick Start Guide
16
Moving Average
Points
The number of sample points that the
moving average calculation is performed
on for each sample. The value is
rounded to an odd number. Half of this
value’s sample points are calculated on
each side of the middle calculation point
(e.g., if a value of 5 is used, 2 sample
points on each side of the middle
sample point are used for the moving
average calculation).
Results are presented in the eMarker view. Right-click a result to jump
to that portion of the file or set that result as the start index or stop
index.
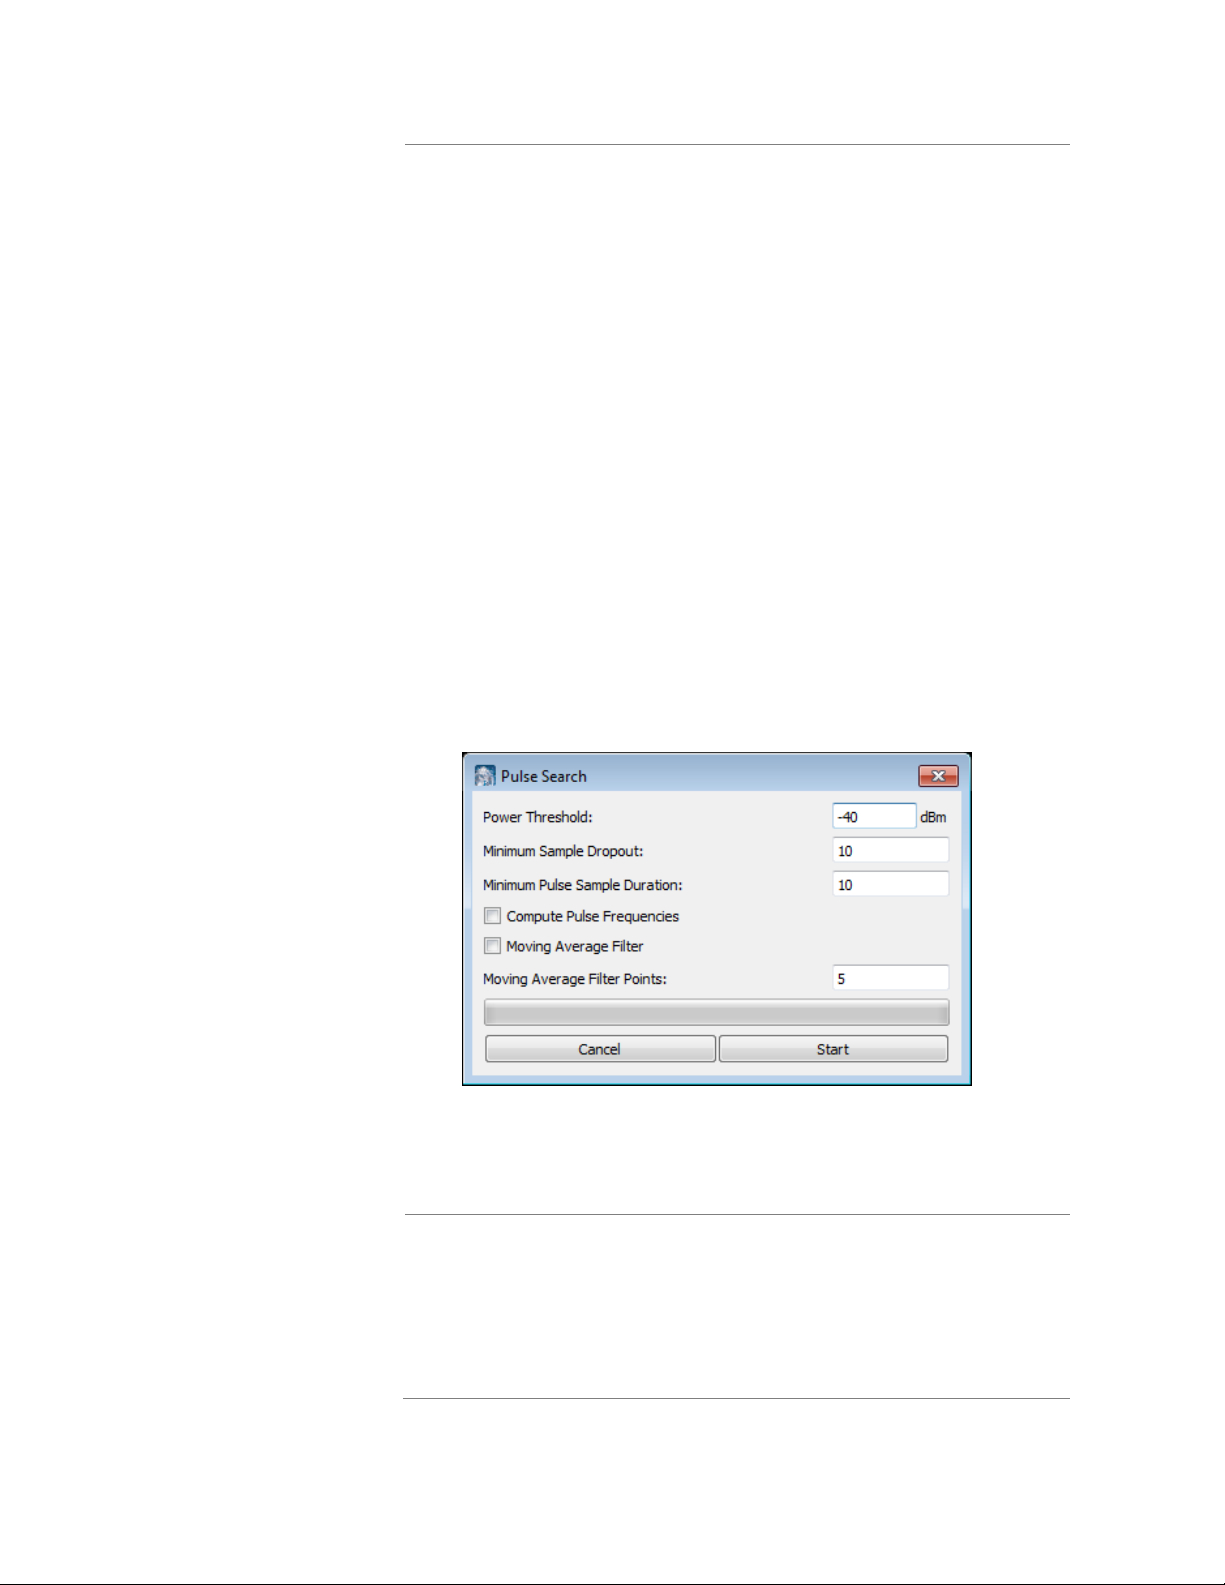
Pulse Search
The Pulse Search searches through the loaded file and finds pulses and
pulse description information. The Pulse search is a two-pass search
where the power threshold is used as a reference point to identify
pulses and the start and stop of the pulse will be determined by a 3 dBdown point from the RMS of the peak power of the pulse. This ensures
consistent pulse measurements and results.
Power Threshold
(dBm)
The power level of the signal in dBm
that needs to be met for the search to
mark the event as a positive result.
Page 19

DataVu-PC Quick Start Guide
17
Minimum Sample
Dropout
Sets how long the event may drop
below the input threshold before the
signal is marked as another event (e.g.,
if set to 40 samples, the signal may
drop below the input threshold up to 40
samples before the signal is marked as
another event). If no time unit label is
entered, samples will be used.
Minimum Pulse
Duration
Sets how long the shortest event can be
(e.g., if set to 2 samples, the signal
must cross the Power Threshold for 2
samples to be marked as a positive
result). If no time unit label is entered,
samples will be used.
Compute Pulse
Frequencies
Computes the start and stop
frequencies of the pulse.
Moving Average
Filter
Performs a moving average calculation
on the recorded data as the search is
performed. This operation helps to
filter out signal spikes that may produce
false positive results. Using the moving
average filter will increase the
processing time of the search.
Moving Average
Points
The number of sample points that the
moving average calculation is performed
on for each sample. The value is
rounded to an odd number. Half of this
value’s sample points are calculated on
each side of the middle calculation point
(e.g., if a value of 5 is used, 2 sample
points on each side of the middle
sample point are used for the moving
average calculation).
Results are presented in the eMarker view. Right-click a result to jump
to that portion of the file, or set that result as the start index or stop
index.
 Loading...