

Page 1

User Manual
CSA8000B Communications Signal Analyzer
TDS8000B Digital Sampling Oscilloscope
071-1099-03
This document applies to firmware version 2.0
and above.
www.tektronix.com
Page 2

Copyright © Tektronix, Inc. All rights reserved. Licensed software products are owned by Tektronix or its suppliers and
are protected by United States copyright laws and international treaty provisions.
Use, duplication, or disclosure by the Government is subject to restrictions as set forth in subparagraph (c)(1)(ii) of the
Rights in Technical Data and Computer Software clause at DFARS 252.227-7013, or subparagraphs (c)(1) and (2) of the
Commercial Computer Software -- Restricted Rights clause at FAR 52.227-19, as applicable.
Tektronix products are covered by U.S. and foreign patents, issued and pending. Information in this publication supercedes
that in all previously published material. Specifications and price change privileges reserved.
Tektronix, Inc., P.O. Box 500, Beaverton, OR 97077
TEKTRONIX and TEK are registered trademarks of Tektronix, Inc.
FrameScan is a registered trademark of Tektronix, Inc.
Page 3

WARRANTY
Tektronix warrants that the products that it manufactures and sells will be free from defects in materials and
workmanship for a period of one (1) year from the date of shipment. If this product proves defective during its
warranty period, Tektronix, at its option, will either repair the defective product without charge for parts and labor,
or provide a replacement in exchange for the defective product.
This warranty applies only to products returned to the designated Tektronix depot or the Tektronix authorized
representative from which the product was originally purchased. For products returned to other locations,
Customer will be assessed an applicable service charge. The preceding limitation shall not apply within the
European Economic Area, where products may be returned for warranty service to the nearest designated service
depot regardless of the place of purchase.
In order to obtain service under this warranty, Customer must provide the applicable office of Tektronix or its
authorized representative with notice of the defect before the expiration of t he warranty period and make suitable
arrangements for the performance of service. Customer shall be responsible for packaging and shipping the
defective product to the service center designated by Tektronix or its representative, with shipping charges
prepaid. Tektronix or its representative shall pay for the return of the product to Customer. Customer shall be
responsible for paying any associated taxes or duties.
This warranty shall not apply to any defect, failure or damage caused by improper use or improper or inadequate
maintenance and care. Tektronix shall not be obligated to furnish service under this warranty:
a) to repair damage resulting from attempts by personnel other than Tektronix representatives to install, repair or
service the product;
b) to repair damage resulting from improper use or connection to incompatible equipment;
c) to repair any damage or malfunction caused by the use of non-Tektronix supplies or consumables;
d) to repair a product that has been modified or integrated with other products when the effect of such
modification or integration increases the time or difficulty of servicing the product; or
e) to repair damage or malfunction resulting from failure to perform user maintenance and cleaning at the
frequency and as prescribed in the user manual (if applicable).
THE ABOVE WARRANTIES ARE GIVEN BY TEKTRONIX WITH RESPECT TO THIS PRODUCT IN LIEU OF
ANY OTHER WARRANTIES, EXPRESS OR IMPLIED. TEKTRONIX AND ITS VENDORS DISCLAIM ANY
IMPLIED WARRANTIES OF MERCHANTABILITY OR FITNESS FOR A PARTICULAR PURPOSE. TEKTRONIX’
RESPONSIBILITY TO REPAIR OR REPLACE DEFECTIVE PRODUCTS IS THE SOLE AND EXCLUSIVE
REMEDY PROVIDED TO THE CUSTOMER FOR BREACH OF THIS WARRANTY. TEKTRONIX AND ITS
VENDORS WILL NOT BE LIABLE FOR ANY INDIRECT, SPECIAL, INCIDENTAL, OR CONSEQUENTIAL
DAMAGES IRRESPECTIVE OF WHETHER TEKTRONIX OR THE VENDOR HAS ADVANCE NOTICE OF THE
POSSIBILITY OF SUCH DAMAGES.
Page 4

Page 5

Table of Contents
Getting Started
General Safety Summary ix...................................
Preface xi...................................................
About This Manual xi...............................................
Related Manuals and Online Documents xii..............................
Conventions xii....................................................
Contacting Tektronix xiii............................................
Product Description 1--1........................................
Models 1--1........................................................
Key Features 1-- 1....................................................
Product Software 1--3................................................
Firmware Upgrade 1--4...............................................
Sampling Modules Supported 1--4......................................
Check the Package Contents 1--7.................................
Installation 1--9...............................................
Check the Environmental Requirements 1--9..............................
Install the Sampling Modules 1--10.......................................
Connect the Peripherals 1--12...........................................
Power On the Instrument 1--13..........................................
Powering Off the Instrument 1--15.......................................
Brightness and Contrast Adjustment (Gamma) 1--15.........................
Back Up User Files 1--15...............................................
Software Installation 1--15..............................................
Description 1--16.................................................
Software Release Notes 1--16........................................
Operating System Reinstallation 1-- 16.................................
System Diagnostics 1--16...........................................
Windows Safe Mode 1--16..........................................
Incoming Inspection 1--17.......................................
Assemble Equipment 1--17.............................................
Perform the Diagnostics 1--18...........................................
Perform the Compensation 1--20.........................................
Perform the Functional Tests 1--21.......................................
Perform the Hardware and Operating System Tests (Windows 98 Only) 1--38.....
Accessories and Options 1--41....................................
Accessories 1--41.....................................................
Standard 1--41....................................................
Optional 1--42....................................................
Options 1--43........................................................
CSA8000B & TDS8000B User Manual
i
Page 6

Table of Contents
Operating Basics
Reference
Operational Maps 2--1.........................................
Documentation Map 2--2.......................................
System Overview Maps 2--4.....................................
Functional Model Map 2--4............................................
Process Overview Map 2-- 6............................................
User Interface Map -- Complete Control and Display 2--7............
Front Panel Map -- Quick Access to Most Often Used Features 2--8....
Display Map -- Single Graticule View 2--9.........................
Display Map -- Multiple Views 2--10...............................
Front Panel I/O Map 2--11.......................................
Rear Panel I/O Map 2--12.......................................
Overview 3--1.................................................
Acquiring Waveforms 3--3......................................
Signal Connection and Scaling 3--4.....................................
Why Use? 3-- 4..................................................
What’s Special? 3 --5..............................................
What’s Excluded? 3--5............................................
Keys to Using 3--5...............................................
To Set Up the Signal Input 3--8.....................................
To Autoset the Instrument 3--11......................................
To Reset the Instrument 3--13........................................
Signal Conditioning Background 3--13................................
Setting Acquisition Controls 3--21.......................................
Why Use? 3-- 21..................................................
What’s Special? 3-- 21..............................................
What’s Excluded? 3--22............................................
Keys to Using 3--22...............................................
To Set Acquisition Modes 3-- 24......................................
To Start and Stop Acquisition 3-- 26...................................
Acquisition Control Background 3--27....................................
Acquisition Hardware 3--27.........................................
Sampling Process 3--27.............................................
Sampling Modes 3--28.............................................
Waveform Record 3--28............................................
Acquisition Cycle 3 --29............................................
FrameScan Acquisitions 3-- 30...........................................
Why Use? 3-- 30..................................................
What’s Special? 3-- 30..............................................
What’s Excluded? 3--31............................................
Keys to Using 3--31...............................................
To Acquire in FrameScan Mode 3--33.................................
To Catch a Bit Error 3--36..........................................
ii
CSA8000B & TDS8000B User Manual
Page 7

Table of Contents
Triggering 3--39................................................
Edge Triggering 3--39.................................................
Why Use? 3-- 39..................................................
What’s Special? 3--39..............................................
Keys to Using 3--40...............................................
To Trigger 3--48..................................................
To Use Gated Trigger 3--50.........................................
Displaying Waveforms 3--53......................................
Using the Waveform Display 3--53.......................................
Why Use? 3-- 55..................................................
What’s Special? 3--55..............................................
What’s Excluded? 3--55............................................
Keys to Using 3--56...............................................
To Display Waveforms in the Main Time Base View 3-- 62................
To Display Waveforms in a Mag View 3-- 64............................
Customizing the Display 3--66..........................................
Why Use? 3-- 66..................................................
What’s Special? 3--66..............................................
Keys to Using 3--66...............................................
To Set Display Styles 3--68.........................................
To Customize the Graticule and Waveforms 3--69.......................
Measuring Waveforms 3--73.....................................
Taking Automatic Measurements 3-- 74....................................
Why Use? 3-- 74..................................................
What’s Measured? 3--74............................................
What’s Special? 3--74..............................................
What’s Excluded? 3--76............................................
Keys to Using 3--76...............................................
To Take Automatic Measurements 3-- 80...............................
To Localize a Measurement 3-- 83....................................
Taking Cursor Measurements 3--85.......................................
Why Use? 3-- 85..................................................
What’s Measured? 3--85............................................
What Sources Can I Measure? 3-- 86..................................
Keys to Using Cursors 3--86.........................................
To Take a Cursor Measurement 3--89.................................
To Set the Cursor Sources 3--90......................................
Optimizing Measurement Accuracy 3--92..................................
Why Use? 3-- 92..................................................
Compensation 3-- 92...............................................
To Compensate the Instrument and Modules 3--92.......................
To Perform Dark-Level and User Wavelength Gain Compensations 3--98.....
Creating Math Waveforms 3--101..................................
Defining Math Waveforms 3--101.........................................
Why Use? 3--102..................................................
What’s Special? 3--102..............................................
What’s Excluded? 3--102............................................
Keys to Using 3--103...............................................
To Define a Math Waveform 3--105....................................
CSA8000B & TDS8000B User Manual
iii
Page 8

Table of Contents
Operations on Math Waveforms 3--107.....................................
Why Use? 3--107..................................................
What’s Excluded? 3--107............................................
Keys to Using 3--108...............................................
To Use Math Waveforms 3--109.......................................
Data Input and Output 3--113.....................................
Saving and Recalling Setups 3-- 113.......................................
Why Use? 3--113..................................................
What’s Special? 3--114..............................................
What’s Excluded? 3--114............................................
Keys to Using 3--114...............................................
To Save Your Setup 3--115...........................................
To Recall Your Setup 3-- 118..........................................
Saving and Recalling Waveforms 3--120...................................
Why Use? 3--120..................................................
What’s Special? 3--120..............................................
What’s Excluded? 3--120............................................
To Save Your Waveform 3--121.......................................
To Recall Your Waveform 3--124......................................
To Clear References 3--127..........................................
Exporting Waveforms and Histograms 3--128...............................
Why Use? 3--128..................................................
Keys to Using 3--128...............................................
To Export Your Waveform 3--128.....................................
To Export Your Histogram 3--129.....................................
To Use an Exported Waveform (or Histogram) 3--129.....................
Printing Waveforms 3--132..............................................
Remote Communication 3-- 139...........................................
Using Masks, Histograms, and Waveform Databases 3--141............
Mask Testing Waveforms 3--141..........................................
Why Use? 3--141..................................................
What’s Special? 3--141..............................................
What’s Excluded? 3--142............................................
Keys to Using 3--142...............................................
To Mask Test a Waveform 3--145......................................
To Edit a Mask 3--149..............................................
Counting Masks 3--151..............................................
To Create a New Mask 3--152........................................
Taking Histograms 3--154...............................................
Why Use? 3--154..................................................
What’s Special? 3--154..............................................
What’s Excluded? 3--155............................................
Keys to Using Histograms 3--155......................................
To Take a Histogram 3--156..........................................
Histogram Statistics 3--158...........................................
iv
CSA8000B & TDS8000B User Manual
Page 9

Appendices
Table of Contents
Using Waveform Databases 3--159........................................
Why Use? 3--159..................................................
What’s Special? 3--159..............................................
What’s Excluded? 3--159............................................
Keys to Using 3--160...............................................
To Set Up a Waveform Database 3--162................................
To Customize the Database Display 3--164..............................
Accessing Online Help 3--167......................................
What’s Available? 3--167...............................................
Why Use? 3--167..................................................
Keys to Using 3--167...............................................
How to Use Online Help 3--168..........................................
Cleaning the Instrument 3-- 175....................................
Exterior Cleaning 3--175................................................
Flat Panel Display Cleaning 3--176........................................
Optical Connector Cleaning 3--176........................................
Appendix A: Specifications A--1..................................
Certifications A--11...................................................
Appendix B: Automatic Measurements Reference B--1..............
Pulse Measurements -- Amplitude B--2...................................
Pulse Measurements -- Timing B--8......................................
Pulse Measurement -- Area B-- 14.........................................
Return-to-Zero (RZ) Measurements -- Amplitude B--15.......................
Return-to-Zero (RZ) Measurements -- Timing B-- 29..........................
Return-to-Zero (RZ) Measurements -- Area B--36............................
Non-Return-to-Zero (NRZ) Measurements -- Amplitude B--37.................
Non-Return-to-Zero (NRZ) Measurements -- Timing B-- 50....................
Non-Return-to-Zero (NRZ) Measurements -- Area B-- 55......................
Measurement Reference Parameters and Methods B--56..............
All Sources B--56.....................................................
Pulse Sources B--57...................................................
RZ Sources B--60.....................................................
NRZ Sources B--62....................................................
Tracking Methods B--68................................................
Mid-reference Level B--69.............................................
To Optimize the Vertical Resolution B--69.................................
Use a Waveform Database B--70.........................................
Glossary
Index
CSA8000B & TDS8000B User Manual
v
Page 10

Table of Contents
List of Figures
Figure 1--1: Compartments for sampling modules 1--11...............
Figure 1 --2: Maximum inputs in three configurations 1--11............
Figure 1--3: Locations of peripheral connectors on rear panel 1--12.....
Figure 1--4: Line fuse and power cord connector locations,
rear panel 1--13.............................................
Figure 1 --5: On/Standby switch location 1--14.......................
Figure 1--6: Compensation dialog box 1--20.........................
Figure 1--7: Hookup for electrical functional tests 1--23...............
Figure 1--8: Channel button location 1--23..........................
Figure 1--9: Channel button location 1--26..........................
Figure 1--10: Optical channel verification 1--27......................
Figure 1--11: Hookup for the time base tests 1--28....................
Figure 1--12: Channel button location 1--29.........................
Figure 1--13: Main time base verification 1--30......................
Figure 1--14: Mag time base verification 1--31.......................
Figure 1--15: Channel button location 1--32.........................
Figure 1--16: Hookup for the gated trigger tests 1--33.................
Figure 1--17: Signal triggered 1--34................................
Figure 1--18: Signal not triggered (signal frozen) 1--35................
Figure 1--19: Signal not triggered (no signal) 1--36...................
Figure 1--20: Signal triggered 1--37................................
Figure 3--1: Acquisition and display controls 3--4...................
Figure 3 --2: Setting vertical scale and position of input channels 3--15...
Figure 3--3: Varying offset positions vertical acquisition
window on waveform amplitude 3--17..........................
Figure 3--4: Horizontal acquisition window definition 3--18...........
Figure 3--5: Common trigger, record length, and acquisition
rate for all channels 3--20.....................................
Figure 3-- 6: Aliasing 3-- 23........................................
Figure 3--7: Channel configuration 3--27...........................
Figure 3--8: Digital acquisition — sampling and digitizing 3--28........
Figure 3--9: The waveform record and its defining parameters 3--29....
Figure 3--10: How FrameScan acquisition works (scanning on
a 127-bit PRBS shown) 3--32..................................
Figure 3--11: Slope and level define the trigger event 3--41.............
vi
CSA8000B & TDS8000B User Manual
Page 11

Table of Contents
Figure 3--12: Triggered versus untriggered displays 3--41.............
Figure 3 --13: Trigger inputs 3--42.................................
Figure 3--14: Holdoff adjustment can prevent false triggers 3--46.......
Figure 3--15: Trigger to End Of Record Time (EORT) 3--47...........
Figure 3--16: Display elements 3--54...............................
Figure 3--17: Horizontal position includes time to Horizontal
Reference 3--59.............................................
Figure 3--18: Graticule, cursor and automatic measurements 3--73.....
Figure 3--19: Measurement annotations on a waveform 3--75..........
Figure 3--20: High/Low tracking methods 3--78......................
Figure 3--21: Reference-level calculation methods 3--79...............
Figure 3--22: Horizontal cursors measure amplitudes 3--86............
Figure 3 --23: Components determining Time cursor readout
values 3--88................................................
Figure 3--24: Functional transformation of an acquired
waveform 3--101.............................................
Figure 3--25: Export dialog box 3--129..............................
Figure 3--26: Creating a user mask 3--144...........................
Figure 3--27: Adding a new vertex 3--144............................
Figure 3--28: Vertical histogram view and statistics on data 3--154.......
Figure 3--29: Normal vector view of a waveform 3--163................
Figure 3--30: Waveform database view of a waveform 3--163............
Figure B--1: Reference-level calculation methods B--56................
Figure B--2: Pulse-reference levels B--57............................
Figure B--3: Pulse crossings and mid-reference level B--58.............
Figure B--4: AOP pulse crossings and mid-reference level B--59........
Figure B--5: Overshoot levels B--59................................
Figure B --6: RZ measurement reference levels B-- 60..................
Figure B --7: RZ crossings B-- 61...................................
Figure B--8: RZ eye--aperture parameters B--62......................
Figure B--9: NRZ measurement reference levels B--63.................
Figure B--10: NRZ crossings B--64.................................
Figure B--1 1: NRZ eye-aperture parameters B--65....................
Figure B--12: NRZ overshoot levels B--66...........................
Figure B--13: NRZ Crossings (OMA) B--67..........................
CSA8000B & TDS8000B User Manual
vii
Page 12

Table of Contents
List of Tables
Table 1--1: Additional accessory connection information 1--13.........
Table 1-- 2: Line fuses 1--13......................................
T able 1--3: Standard accessories 1--41.............................
Table 1--4: Optional accessories 1--42..............................
Table 3-- 1: Application-based triggering 3--43......................
Table 3--2: Defining and displaying waveforms 3--56.................
T able 3--3: Operations performed based on the selected
waveform 3--57............................................
Table 3--4: Equivalent mouse and touchscreen operations 3--61........
Table 3--5: Customizable display attributes 3--66....................
Table 3-- 6: Cursor functions (types) 3--85..........................
Table 3-- 7: Cursor units 3-- 88....................................
Table 3--8: Math expressions and the math waveforms produced 3--103..
Table 3-- 9: Standard masks 3--142.................................
Table 3--10: Histogram statistics 3--158.............................
Table A--1: System -- Signal acquisition A--1.......................
Table A-- 2: System -- Timebase A--2..............................
T a b l e A -- 3 : S y s t e m -- T r i g g e r A -- 3................................
Table A-- 4: System -- Environmental A--6..........................
Table A--5: Power consumption and cooling A--7...................
T a b l e A -- 6 : D i s p l a y A -- 7........................................
T a b l e A -- 7 : P o r t s A -- 8..........................................
Table A--8: Data storage A--9....................................
T able A--9: Mechanical A--10.....................................
Table A--10: Certifications and compliances A--11...................
Table B--1: Pulse Measurements — Amplitude B--2.................
Table B--2: Pulse Measurements -- Timing B--8.....................
Table B--3: Pulse Measurements -- Area B--14.......................
Table B--4: RZ Measurements -- Amplitude B-- 15....................
Table B--5: RZ Measurements -- Timing B--29.......................
Table B--6: RZ Measurements -- Area B--36.........................
Table B--7: NRZ Measurements -- Amplitude B--37..................
Table B--8: NRZ Measurements -- Timing B-- 50.....................
Table B--9: NRZ Measurements -- Area B--55.......................
viii
CSA8000B & TDS8000B User Manual
Page 13

General Safety Summary
Review the following safety precautions to avoid injury and prevent damage to
this product or any products connected to it. To avoid potential hazards, use this
product only as specified.
Only qualified personnel should perform service procedures.
While using this product, you may need to access other parts of the system. Read
the General Safety Summary in other system manuals for warnings and cautions
related to operating the system.
ToAvoidFireor
Personal Injury
Use Proper Power Cord. Use only the power cord specified for this product and
certified for the country of use.
Connect and Disconnect Properly. Do not connect or disconnect probes or test
leads while they are connected to a voltage source.
Ground the Product. This product is grounded through the grounding conductor
of the power cord. To avoid electric shock, the grounding conductor must be
connected to earth ground. Before making connections to the input or output
terminals of the product, ensure that the product is properly grounded.
Observe All Terminal Ratings. To avoid fire or shock hazard, observe all ratings
and markings on the product. Consult the product manual for further ratings
information before making connections to the product.
Do not apply a potential to any terminal, including the common terminal, that
exceeds the maximum rating of that terminal.
Do Not Operate Without Covers. Do not operate this product with covers or panels
removed.
Use Proper Fuse. Use only the fuse type and rating specified for this product.
Avoid Exposed Circuitry. Do not touch exposed connections and components
when power is present.
Wear Eye Protection. Wear eye protection if exposure to high-intensity rays or
laser radiation exists.
Do Not Operate With Suspected Failures. If you suspect there is damage to this
product, have it inspected by qualified service personnel.
Do Not Operate in Wet/Damp Conditions.
Do Not Operate in an Explosive Atmosphere.
Keep Product Surfaces Clean and Dry.
CSA8000B & TDS8000B User Manual
ix
Page 14

General Safety Summary
Provide Proper Ventilation. Refer to the manual’s installation instructions for
details on installing the product so it has proper ventilation.
Symbols and Terms
Terms in this Manual. These terms may appear in this manual:
WARNING. Warning statements identify conditions or practices that could result
in injury or loss of life.
CAUTION. Caution statements identify conditions or practices that could result in
damage to this product or other property.
Terms on the Product. These terms may appear on the product:
DANGER indicates an injury hazard immediately accessible as you read the
marking.
WARNING indicates an injury hazard not immediately accessible as you read the
marking.
CAUTION indicates a hazard to property including the product.
Symbols on the Product. The following symbols may appear on the product:
CAUTION
Refer to Manual
Mains Disconnected
OFF (Power)
WARNING
High Voltage
Mains Connected
ON (Power)
Protective Ground
(Earth) Terminal
Standby
x
CSA8000B & TDS8000B User Manual
Page 15

Preface
About This Manual
This is the user manual for the CSA8000B Communications Signal Analyzer and
TDS8000B Digital Sampling Oscilloscope. It covers the following information:
H Describes the capabilities of the instrument: how to install it and reinstall its
software
H Explains how to operate the instrument: how to control acquisition of,
processing of, and input/output of information
H Lists the specifications and accessories of the instrument
This manual is composed of the following chapters:
H Getting Started shows you how to configure and install your instrument and
provides an incoming inspection procedure.
H Operating Basics uses maps to describe the various interfaces for controlling
the instrument, including the front panel and the software user interface.
These maps provide overviews of the product and its functions from several
viewpoints.
H Reference comprises an encyclopedia of topics (see Overview on page 3--1)
that describe the instrument interface and features, and that give background
and basic information on how to use them. (The online help onboard the
instrument application describes the interface, features, and their usage in
more detail; detailed descriptions of all programming commands are found
in the online CSA8000 & TDS8000 Programmer Guide manual.)
H Appendices provides additional information including the specifications and
automatic measurement definitions.
CSA8000B & TDS8000B User Manual
xi
Page 16

Preface
Related Manuals and Online Documents
This manual is part of a document set of standard-accessory manuals and online
documentation; this manual mainly focuses on installation and background
needed to use the product features. See the following list for other documents
supporting instrument operation and service. (Manual part numbers are listed in
Table 1--3 on page 1--41.)
Manual name Description
CSA8000 & TDS8000 Online Help An online help system, integrated with the User Interface application that ships with this
product.
CSA8000B & TDS8000B References A quick reference to major features of the instrument and how they operate.
CSA8000 & TDS8000 Programmer Guide Part of the online help system this guide comprises an alphabetical listing of the
programming commands and other information related to controlling the instrument over
the GPIB. This is an online document.
Electrical Sampling Modules User Manual The user manual for the electrical sampling modules. Included as a PDF file on the
product software CD or the PDF file can be downloaded from the Tektronix website.
80C00 Series Optical Sampling Modules
User Manual
80A01 Trigger Prescale Limiting Preamplifier Module User Manual
80A02 EOS/ESD Protection Module
Instructions
CSA8000 & TDS8000 Service Manual Describes how to service the instrument to the module level. This optional manual must
The user manual for the optical sampling modules. Included as a PDF file on the product
software CD or the PDF file can be downloaded from the Tektronix website.
The user manual for the 80A01 Trigger Prescale Limiting Preamplifier Module. Included
as a standard accessory if you ordered this module with this instrum ent. Shipped in the
module package, not the main instrument package.
The instructions for the 80A02 EOS/ESD Protection Module. Included as a standard
accessory if you ordered this module with this instrument. Shipped i n the module
package, not the main instrument package.
be ordered separately.
Conventions
xii
For more information on how the product documentation relates to the
instrument operating interfaces and features, see Documentation Map on
page 2--2.
This manual uses the terms vertical acquisition window and horizontal acquisi-
tion window throughout this section and elsewhere. These terms refer to the
vertical and horizontal range of the acquisition window, which defines the
segment of the input signal that the acquisition system acquires.
The terms do not refer to any operating system windows that you might display
on screen.
CSA8000B & TDS8000B User Manual
Page 17

Contacting Tektronix
Preface
Phone 1-800-833-9200*
Address Tektronix, Inc.
Department or name (if known)
14200 SW Karl Braun Drive
P.O. Box 500
Beaverton, OR 97077
USA
Web site www.tektronix.com
Sales support 1-800-833-9200, select option 1*
Service support 1-800-833-9200, select option 2*
Technical support Email: techsupport@tektronix.com
1-800-833-9200, select option 3*
6:00 a.m. -- 5:00 p.m. Pacific time
* This phone number is toll free in North America. After office hours, please leave a
voice mail message.
Outside North America, contact a Tektronix sales office or distributor; see the
Tektronix web site for a list of offices.
CSA8000B & TDS8000B User Manual
xiii
Page 18

Preface
xiv
CSA8000B & TDS8000B User Manual
Page 19

Product Description
This chapter describes your instrument, which is either the CSA8000B Communications Signal Analyzer or the TDS8000B Digital Sampling Oscilloscope, and
its options. Following this description are four sections:
H Check the Package Contents, on page 1--7, shows you how to verify that you
have received all of the parts of your instrument.
H Installation, on page 1--9, shows you how to configure and install the
instrument, as well as how to reinstall the system software included with the
product.
H Incoming Inspection, on page 1--17, provides a procedure for verifying basic
operation and functionality.
H Accessories and Options, on page 1--41, lists the instrument options
available and the standard and optional accessories for this product.
Models
This manual supports two very similar instruments:
Key Features
H The CSA8000B Communications Signal Analyzer.
H The TDS8000B Digital Sampling Oscilloscope.
Differences between the two instruments will be called out when necessary;
otherwise, the material applies to both instruments. The word “instrument” refers
to either product.
The instrument is a high-speed, precision sampling system that finds use in
validation and conformance testing and impedance verification for:
H high-performance semiconductor/computer applications, such as semicon-
ductor testing, TDR characterization of circuit boards, IC packages and
cables, and high-speed serial digital data communications.
H high-performance communications applications, such as design evaluation
and manufacturing test of datacom and telecom components, transceiver
subassemblies, and transmission systems.
The instrument includes a user interface that runs on the Microsoft Windows
operating system as a windowed application. You operate the instrument using
CSA8000B & TDS8000B User Manual
1- 1
Page 20

Product Description
front-panel controls with the mouse and keyboard or with the touch screen. The
installed Windows operating system (MS Windows 98 or MS Windows 2000) is
dependent on the purchase date or product upgrade status.
Key features include:
H industry-leading waveform acquisition and measurement rate, with Sample,
Envelope, and Average acquisition modes.
H support for up to six sampling modules (two large and four small modules)
for a maximum configuration of ten inputs. (Up to eight inputs can be active
at a time. See Maximum Configuration on page 1--11).
H supports integrated optical signal pick-off and clock recovery enabling
accurate triggering on optical communication-signals.
H support for optical modules with several integrated, selectable reference
receivers, which eliminates the need for a multitude of add-on reference
receivers.
H full programmability, with an extensive GPIB-command set and a message-
based interface.
H true differential TDR, with fast step (35 psec reflected risetime) when used
with a TDR-capable sampling module.
H industry-leading trigger bandwidth (12+ GHz) when using the built-in-
prescaler.
H support of both telecom (SONET and SDH) and datacom (Fibre Channel,
Infiniband, and Gigabit Ethernet) optical communication standards.
H powerful built-in measurement capability, including histograms, mask
testing, and automatic measurements.
H automatic measurements operate on Pulses, RZ eye patterns, and NRZ eye
patterns.
H DC to 65 GHz optical bandwidth; DC to 65 GHz electrical bandwidth, with
up to 12.5 GHz triggering.
NOTE. Bandwidth is determined by the specific modules that are installed.
H FrameScan acquisition for isolating data-dependent failures during confor-
mance/performance testing and for examining very low-level repetitive
signals.
1- 2
H support for optical conformance testing of SONET/SDH signals (including
the various forward error correction rates for these telecom rates) from
155 Mbps to 43 Gb/s, 1 and 10 Gb/s FibreChannel signals, 10. 52 Gb/s
CSA8000B & TDS8000B User Manual
Page 21

Product Description
FibreChannel signals, and 1, 2, and 10 Gigabit FibreChannel signals as well
as 2.5 Gb/s Infiniband signals.
NOTE. Support for conformance testing rates is determined by the specific
modules that are installed.
H high precision time base with two modes of operation, locked and short-term
jitter-optimized
H negligible long-term jitter degradation (<0.1 ppm), which substantially
improves the ability to view signals that are delayed far from the trigger
point without distortion.
H improved short-term and long-term trigger jitter.
H a gated trigger option (Option GT) that lets you disable or enable (gate)
triggering based on a TTL signal you connect to the instrument rear panel.
H the GT feature also allows you to use recirculating buffers as part of your test
setup to simulate the effects of very long optical links that are typical of
undersea cables and other long terrestrial links.
Product Software
H analysis and connectivity tools enable the instrument to be controlled from a
variety of local and remote environments and to share data with other
commercially available analysis programs.
H pre-defined, built-in masks in addition to the user-defined masks.
H a large 10-inch color display that supports color grading of waveform data to
show sample density.
H an intuitive UI (User Interface), with built-in online help displayable on
screen.
The instrument includes the following software:
H MS Windows comes preinstalled on the instrument. MS Windows is the
operating system on which the user-interface application of this instrument
runs. The OS Rebuild CDs include the software needed to rebuild the
instrument operating system if that becomes necessary.
H The User Interface (UI) Application (product software) comes preinstalled on
the instrument. This UI application complements the hardware controls of
the front panel, allowing complete set up of all instrument features. The
Product Software CD includes the UI Application for use if reinstalling the
CSA8000B & TDS8000B User Manual
1- 3
Page 22

Product Description
product software becomes necessary. See Software Installation on
page 1--15.
New versions of the software may become available at our web site. See
Contacting Tektronix on page xiii in Preface.
Firmware Upgrade
Tektronix may offer firmware upgrade kits for the instrument. Contact your
Tektronix service representative for more information (see Contacting Tektronix
on page xiii).
Sampling Modules Supported
This product can use the following optical and electrical sampling modules listed
below. These modules, which plug into the instrument, are more fully described
in their respective user manuals. These manuals were shipped with those
sampling modules that were ordered with this product.
The sampling modules listed here were available at the time this manual was
published; see your Tektronix product catalog for current offerings.
Optical Sampling Modules.
H 80C01 -- 622/2488/9953 Mb/s, 12.5/20 GHz optical module.
Clock Recovery (622/2488 Mb/s) added with option CR.
H 80C02 -- 9.953 Gb/s, 20/30 GHz optical module.
Clock Recovery (9.953 Gb/s) added with option CR.
H 80C03 -- 1.063/1.250/2.488/2.500 Gb/s amplified optical module.
Clock Recovery for all rates added with option CR.
This module has been superseded by the 80C07B.
H 80C04 -- 9.953/10.3125 Gb/s, 20/30 GHz optical module.
Clock Recovery (9.953 Gb/s) added with option CR1.
Clock Recovery (9.953 Gb/s and 10.66 Gb/s) added with option CR2.
This module has been superseded by the 80C11.
H 80C05 -- 9.953 Gb/s, 20/30/40 GHz optical module for 10/40 Gb/s NRZ.
This module has been superseded by the 80C10.
1- 4
H 80C06 -- 55 GHz optical module for 40 Gb/s RZ and NRZ telecom.
This module has been superseded by the 80C10.
CSA8000B & TDS8000B User Manual
Page 23

Product Description
H 80C07 -- 155/622/2488 Mb/s amplified optical module.
Clock Recovery for all rates added with option CR1.
This module has been superseded by the 80C07B.
H 80C07B -- 155/622/1063/1250/2125/2488/2500 Mb/s amplified optical
module. (The module is limited to five receivers configured at the time of
order.)
Clock Recovery for all rates (plus 2666 Mb/s) added with option CR1.
H 80C08 -- 9.953/10.31 Gb/s Multi-rate amplified optical module.
Clock Recovery (9.953 and 10.3125 Gb/s) added with option CR1.
This module has been superseded by the 80C08C.
H 80C08B -- 9.953/10.31/10.52 Gb/s Multi-rate amplified optical module.
Clock Recovery (9.953 and 10.3125 Gb/s) added with option CR1.
FibreChannel Clock Recovery (10.3125 and 10.51875 Gb/s) added with
option CR2.
This module has been superseded by the 80C08C.
H 80C08C -- 9.953/10.31/10.52/11.10 Gb/s Multi-rate amplified optical
module.
Clock Recovery (9.953 and 10.3125 Gb/s) added with option CR1. Clock
Recovery (10.3125 and 10.51875 Gb/s) added with option CR2.
Continuous-rate clock recovery added with CR4.
H 80C09 -- 9.953/10.71 Gb/s Multi-rate optical module.
Clock Recovery (9.953 and 10.709 Gb/s) added with option CR1.
This module has been superseded by the 80C11.
H 80C10 -- 65 GHz optical module for 40 Gb/s RZ and NRZ telecom.
H 80C11 -- 9.953/10.31/10.52/10.66/10.71//11.10 Gb/s Multi-rate amplified
optical module.
Clock Recovery (9.953 Gb/s) added with option CR1.
Clock Recovery (9.953 and 10.66 Gb/s) added with option CR2.
Clock Recovery (9.953 and 10.71 Gb/s) added with option CR3.
Continuous-rate clock recovery added with CR4.
Electrical Sampling Modules.
H 80E01 -- A single-channel, 50 GHz sampling module
H 80E02 -- A dual-channel, 12.5 GHz, 50 Ω, sampling module with low noise
H 80E03 -- A dual-channel, 20 GHz sampling module. This model provides the
same features as 80E04, but without the TDR step generators.
CSA8000B & TDS8000B User Manual
1- 5
Page 24

Product Description
H 80E04 -- A dual-channel, 20 GHz TDR sampling module. The TDR step
generator provides 35 ps reflected step risetime. Voltage polarity can be
reversed on either step to provide true differential TDR.
H 80E06 -- A single-channel, 70+ GHz sampling module. This model provides
very high performance bandwidth for general-purpose characterization of
high speed devices and circuits.
Other Modules.
H 80A01 Trigger Prescale Limiting Preamplifier Module -- A single-channel
module providing 8-14 GHz AC coupled 50 Ω limiting preamplification. It
increases the sensitivity of the prescale trigger input of the 8000 Series
instruments to ≤200 mV
pk-pk
.
H 80A02 EOS/ESD Protection Module -- A module that protects the sensitive
input stage of instruments (such as the sampling bridge of Tektronix
electrical TDR sampling modules) from damage due to electro-overstress
(EOS) and electro static discharge (ESD) from the device under test (DUT).
1- 6
CSA8000B & TDS8000B User Manual
Page 25

Check the Package Contents
Verify that you have received all of the parts of your instrument. You should
verify that you have:
H the main instrument.
H all the standard accessories for the main instrument. Standard accessories are
listed in Table 1--3 on page 1--41.
H the correct power cords for your geographical area.
H the OS Rebuild CDs and Product Software CD that include an installation
copy of the software installed on the instrument and all files needed to
rebuild your instrument operating system if necessary. Store the CDs in a
safe location where you can easily retrieve them for maintenance purposes.
NOTE. Keep the certificate of authenticity that accompanies the product-software
CD.
H the 8000 Series Demo Applications Software CD that includes an installa-
tion copy of the software. This CD, which is a separate CD from the
Oscilloscope software, includes the TDR Impedance Measuring application,
which implements the TDR calibration procedures specified by the
IPC-TM-650 test methodology, and the Fast NRZ application, which allows
you to improve throughput for when eye-pattern mask testing.
NOTE. New versions of the product and/or demo application software may
become available at our web sit. See Contacting Tektronix on page xiii.
Remember to fill out and send in the customer registration card. The registration
card is packaged in an envelope in the shipping package.
CSA8000B & TDS8000B User Manual
1- 7
Page 26

Check the Package Contents
1- 8
CSA8000B & TDS8000B User Manual
Page 27

Installation
This section covers installation of the instrument, addressing the following
topics:
H Check the Environment Requirements on page 1--9
H Install the Sampling Modules on page 1--10
H Connect the Peripherals on page 1--12
H Power On the Instrument on page 1--13
H Powering Off the Instrument on page 1--15
H Brightness and Contrast Adjustment (Gamma) on page 1--15
H Back Up User Files on page 1--15
The basic operating software is already installed on the hard disk. If reinstallation of software becomes necessary, see the following topic:
H Software Installation on page 1--15
Check the Environmental Requirements
Read this section before attempting any installation procedures. This section
describes site considerations, power requirements, and ground connections for
your instrument.
Site Considerations
The instrument is designed to operate on a bench or on a cart in the normal
position (on the bottom feet). For proper cooling, at least two inches (5.1 cm) of
clearance is recommended on the rear and sides of the instrument.
You can also operate the instrument while it rests upright on its rear feet. If you
operate the instrument while it is resting on the rear feet, make sure that you
properly route any cables coming out of the rear of the instrument to avoid
damaging them.
CAUTION. Keep the bottom of the instrument clear of obstructions to ensure
proper cooling.
CSA8000B & TDS8000B User Manual
1- 9
Page 28
Installation
Operating Requirements
Rackmount Requirements
Specifications in Appendix A list the operating requirements for the instrument.
Power source and temperature, humidity, and altitude are listed.
If this instrument is rackmounted, see the TDS8000 & CSA8000 Rackmount
Instructions for additional site considerations or operating requirements. This
document ships with the Option 1R (rackmount kit).
Install the Sampling Modules
CAUTION. Do not install or remove any sampling modules while the instrument is
powered on.
Always power the instrument down before attempting to remove or insert any
sampling module.
CAUTION. Sampling modules are inherently vulnerable to static damage. Always
observe static-safe procedures and cautions as outlined in your sampling module
user manual.
Check Your Sampling
Module Manual(s)
Read the appropriate sampling module user manual for instructions on how to
install your sampling modules, and then install them as outlined. (Sampling
modules do not ship preinstalled.)
NOTE. After first installing a sampling module(s) or after moving a sampling
module from one compartment to another, you should run compensation from the
Utilities menu to ensure the instrument meets it specifications. You must run a
compensation (accessed from the Utilities menu) whenever the extender
configuration is changed from that present at the last compensation. In short, if
you install or remove an 80E00 extender, run a compensation. If you exchange a
extender for one of a different length, run a compensation. For instructions on
running a compensation, see Optimizing Measurement Accuracy on page 3--92.
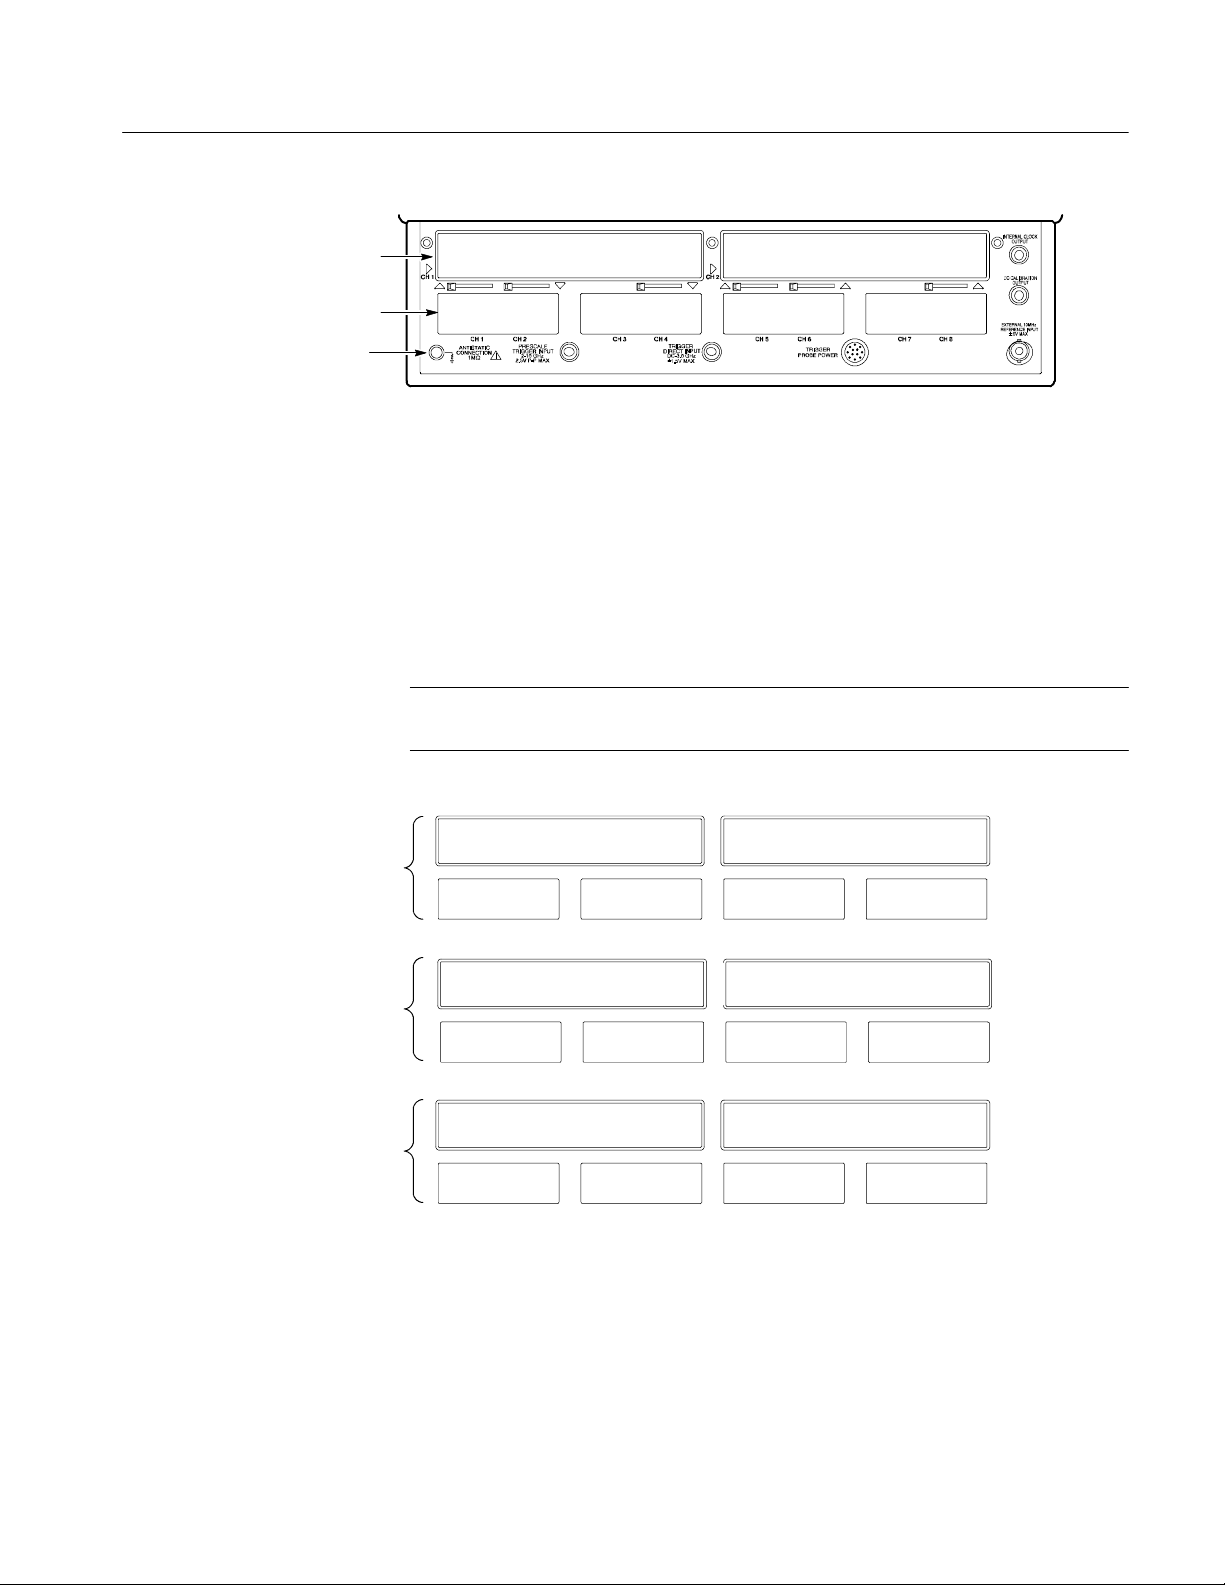
Figure 1--1 shows compartments for both large and small sampling modules,
along with the plug-in connector for the ESD wrist strap that you must use while
installing or removing these modules.
1- 10
CSA8000B & TDS8000B User Manual
Page 29
Large-module compartments (2)
Small-module compartments (4)
Connect ESD wrist strap here
Installation
Figure 1- 1: Compartments for sampling modules
Maximum Configuration
Eight channels: Two large modules and
three small modules
Eight channels: No large and four
small modules
You can install up to two large sampling modules and four small modules for a
total of 10 inputs. Of these 10 inputs, only eight inputs can be active at one time
(see Figure 1--2, top two configurations). Also, note that installing a single large
module in either compartment disables the first small-module compartment (see
note). This configuration (see Figure 1--2, bottom configuration) limits the input
count to seven—one from the large, six from the small compartments.
NOTE. Power is still provided to this small slot, which does allow an 80A01 to
be functional in this slot even when a large module is installed.
CH 1 CH 2
1
N.A.
N.A.
CH 1 CH 2 CH 6CH 3 CH 8CH 5 CH 7
CH 4
CH 6CH 3 CH 8CH 5 CH 7N.A. CH 4
N.A.
Seven channels: One large module,
installed in either compartment, and
three small modules
N.A. CH 6CH 3 CH 5 CH 7N.A. CH 4
1
Not Available
Figure 1- 2: Maximum inputs in three configurations
Install probes, cables, and other connection accessories to your sampling
modules as appropriate for your application and sampling module. Again,
consult your sampling-module and connection-accessory manuals. Continue with
the next section after installing the sampling modules.
CSA8000B & TDS8000B User Manual
CH 1/N.A.
CH 2/N.A.
CH 8
1- 11
Page 30
Installation
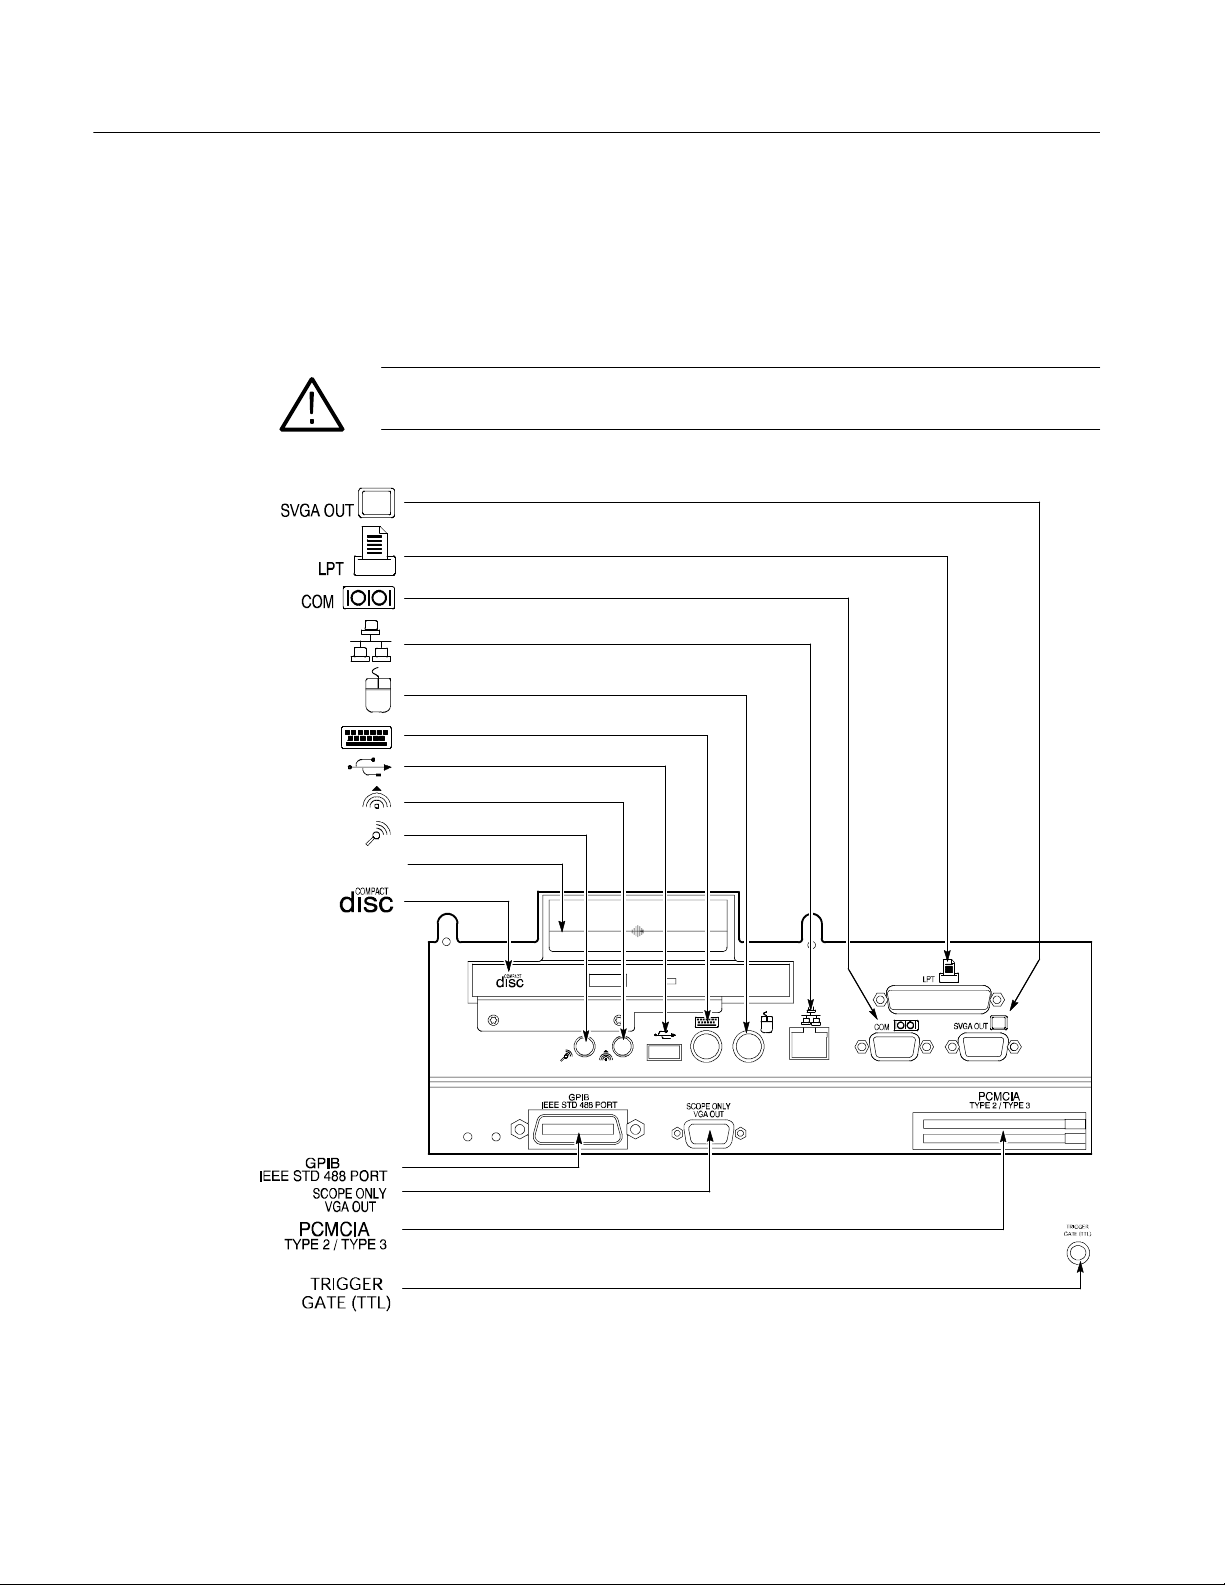
Connect the Peripherals
The peripheral connections are mostly the same as those you would make on a
personal computer. The connection points are shown in Figure 1--3. See
Table 1--1 on page 1--13 for additional connection information.
WARNING. Before installing peripheral acc e ssories to connectors (mouse, keyboard,
etc.), power down the instrument. See Powering Off the Instrument on page 1--15.
Monitor.............
Printer......................
RS-232.................
Network.............................
PS2 mouse
PS2 keyboard
USB................................
Audio line out.......................
Audio line in........................
Removable hard drive.....................
CD drive.........................
GPIB...........
Monitor....................
Card slot
Gated trigger...........
1
.......................
1
2
...........
................
(only available with Option GT)
1
Product ships with a USB keyboard that plugs into the USB port and a USB mouse that plugs into the back of the keyboard
2
PCMCIA card readers are not available on the following products: CSA8000B SN B020338 and above, TDS8000B SN B020346 and above.
Product software version 2.0 (or greater) does not support PCMCIA readers.
Figure 1- 3: Locations of peripheral connectors on rear panel
1- 12
CSA8000B & TDS8000B User Manual
Page 31
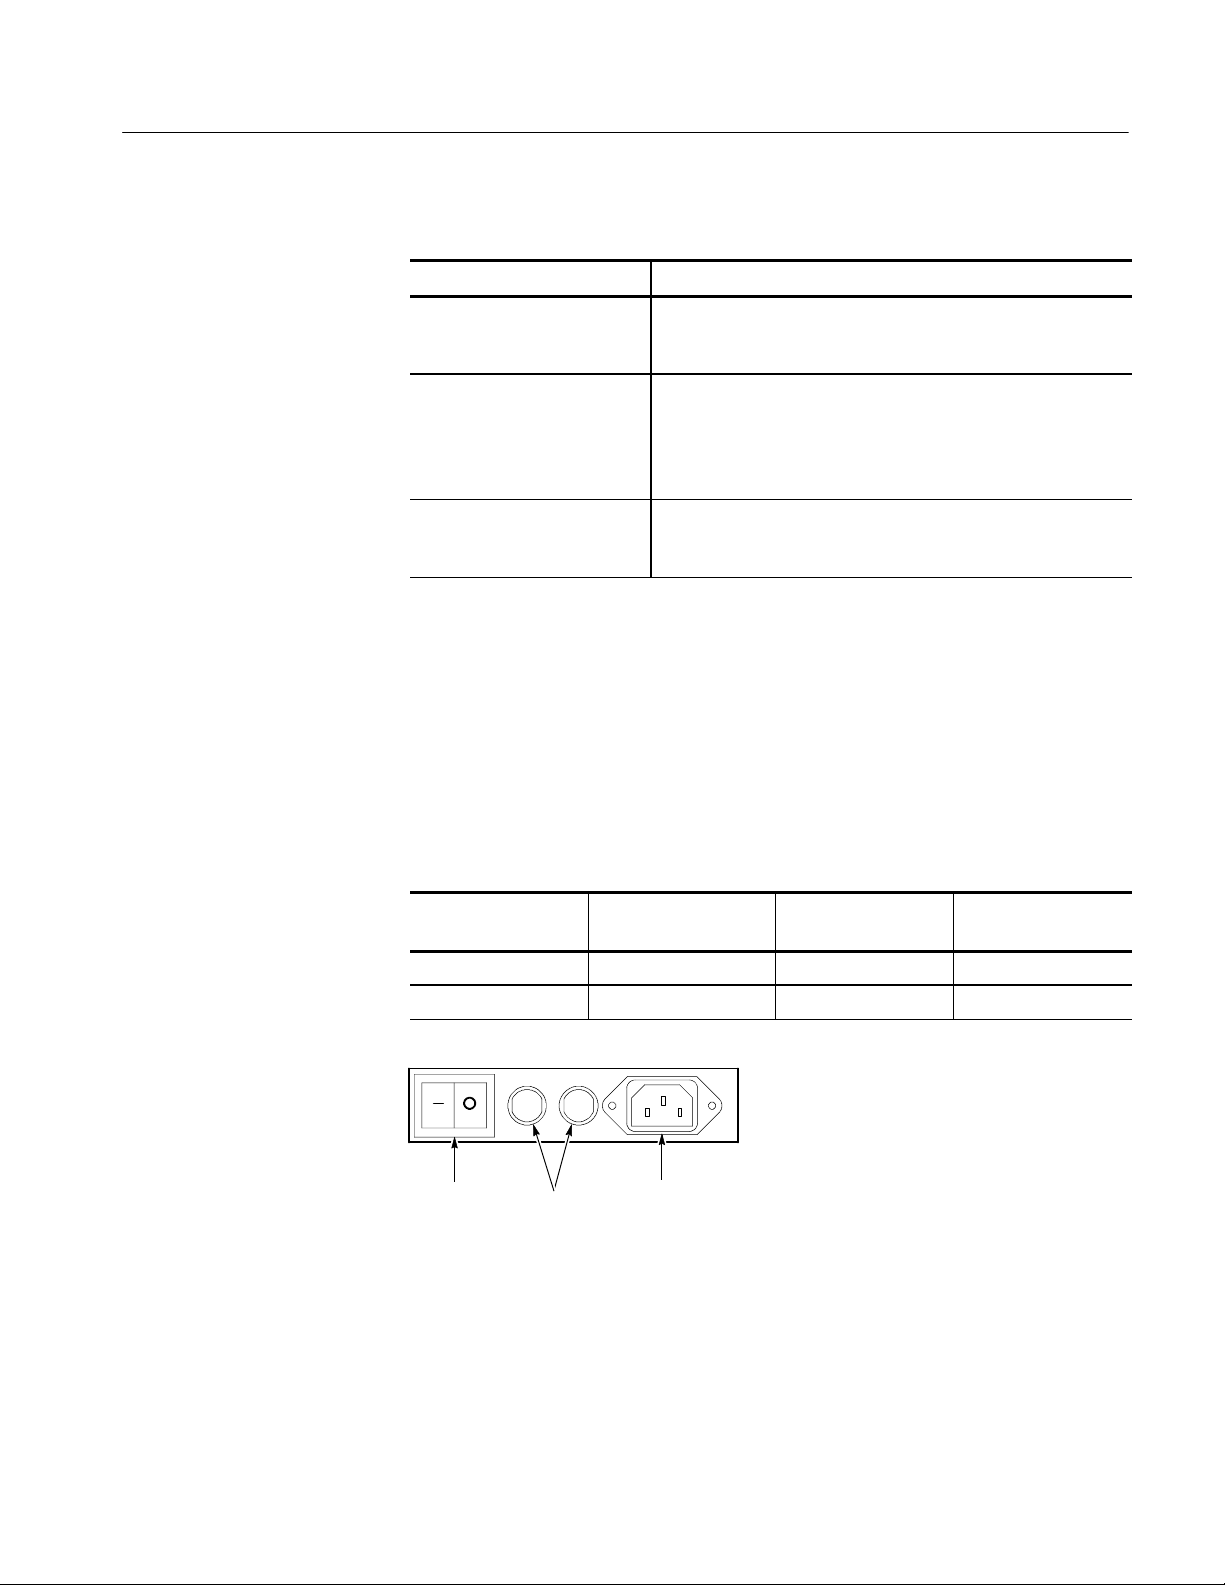
Table 1- 1: Additional accessory connection information
Item Description
Monitor If you use a non-standard monitor, you may need to change the
Printer Connect the printer to the EPP (enhanced parallel port)
Other Refer to the Application release notes on your System Rebuild
Power On the Instrument
Installation
the Windows display settings to achieve the proper resolution
for your monitor.
connector directly. If your printer has a DB-25 connector, use
the adapter cable that came with your printer to connect to the
EPP connector. For information on printer usage, see Printing
Waveforms on page 3-126.
CD for possible additional accessory installation information
not covered in this manual.
Follow these steps to power on the instrument for the first time.
1. Check that the line fuses are correct for your application. Both fuses must be
the same rating and type. Fuse types require a unique cap and fuseholder. See
Table 1--2 and Figure 1--4.
Table 1- 2: Line fuses
Cap & fuseholder
Fuse type Rating Fuse part number
0.25 x 1.250 inch 8 A, fast blow, 250 V 159-0046-00 200-2264-00
5x20mm 6.3 A, fast blow, 250 V 159-0381-00 200-2265-00
Fuses
AC powerPower switch
part number
Figure 1- 4: Line fuse and power cord connector locations, rear panel
CSA8000B & TDS8000B User Manual
1- 13
Page 32

Installation
CAUTION. Connect the keyboard, mouse, and other accessories before applying
power to the product. Connecting the accessories after powering on the
instrument can damage the accessories. T wo exceptions are the USB keyboard
and mouse that ships with the instrument. Both can be plugged or unplugged
without first turning power off.
2. Connect the keyboard and mouse, observing the caution above. Note that the
instrument ships with a USB keyboard, which plugs into the USB port (see
Figure 1--3 on page 1--12 for location) and a USB mouse, which plugs into
the back of the USB keyboard.
NOTE. Connection of the keyboard and mouse is optional. You can operate most
features without them, using the front-panel controls and the touchscreen.
3. Connect the power cord.
4. If you have an external monitor, connect the power cord and power on the
monitor.
Switch
5. Turn the Power switch on at the rear panel. (See Figure 1--4 on page 1--13 for
switch location.)
6. Push the On/Standby switch to power on the instrument (see Figure 1--5 for
the switch location).
Figure 1- 5: On/Standby switch location
7. Wait for the boot routine and low-level self test to complete.
1- 14
8. Follow any instructions on the screen.
The internal setup software will automatically configure your instrument and
install all required devices, depending on the installed accessories.
CSA8000B & TDS8000B User Manual
Page 33

Powering Off the Instrument
The instrument has a built-in soft power-down function that safely powers down
the instrument when you push the On/Standby button. You do not need to close
the UI application or Windows before using the On/Standby button.
To completely remove power to the instrument, first soft power-down the
instrument using the On/Standby button, and then set the power switch on the
rear panel to off.
Brightness and Contrast Adjustment (Gamma)
Although this instrument is set for optimal Gamma display before shipping, you
can adjust it to suit your preferences. If you wish to do so, use the Display
settings located in the Windows Control Panel.
Back Up User Files
Installation
Software Installation
You should back up your user files on a regular basis. Use the Windows Back Up
tool to back up files stored on the hard disk. The Back Up tool is located in the
System Tools folder in the Accessories folder.
1. Minimize the UI application by clicking the minimize (--) button in the
upper-right corner on screen.
2. Click Start in the Task bar to pop up the Start menu.
3. Select Programs > Accessories > System Tools > Backup in the Start menu.
4. Use the backup tool that displays to select your back-up media and to select
the files and folders that you want to back up. Use the Windows online help
for information on using the Backup tool. You can back up to the floppy
drive or to a networked storage device over the ethernet port (rear panel).
5. You can restore the UI application to the screen by clicking its button in the
Windows Task bar.
This section describes how to install the software found on the CSA8000 &
TDS8000 OS Restore and Product Software CDs that accompany this product.
The instrument ships with the product software installed, so only perform these
procedures if reinstallation becomes necessary.
CSA8000B & TDS8000B User Manual
1- 15
Page 34

Installation
Description
Software Release Notes
There are two sets of CDs that ship with this instrument:
H OS Rebuild CD. This 2-disk set contains the operating system for the
instrument. This CD set, which can be used to rebuild the instrument hard
drive, includes the Windows operating system installation.
H Product Software CD. The product software, or UI application, complements
the hardware controls of the front panel, allowing complete set up of all
instrument features. The Product Software CD includes software allowing
you to reinstall the product software without having to rebuild the entire
operating system.
Read the software release notes README.TXT ASCII file if present on the
Product Software CD before performing any installation procedures. This file
contains additional installation and operation information that supercedes other
product documentation.
To view the README.TXT file, open the Notepad Windows accessory and open
the file on the CD. After installation, you can also read the copy from a directory
on the product:
C:\Programs Files\TDSCSA8000\System
Operating System
Reinstallation
System Diagnostics
Windows Safe Mode
If it becomes necessary to reinstall the Windows operating system, use the CDs
and instructions provided with your Windows Operating System Rebuild kit
(shipped with your instrument).
This process will return the hard disk to the its original condition present when
the instrument shipped.
NOTE. All data and programs you may have installed will be lost when reinstalling the Windows Operating System.
In case of instrument problems, you may wish to run the system diagnostics. If
so, see the procedure Perform the Diagnostics, on page 1--18.
If the instrument is turned off before the operating system boots, or if you’ve
installed a third-party product with a driver incompatible with instrument start
up, Windows will open in Safe mode. The touchscreen will be inoperable;
therefore, you must install the standard-accessory mouse and keyboard to operate
the instrument.
When you have finished investigating and removed any barrier to Windows
start-up, you can reboot. If the instrument no longer boots to Safe mode, you can
remove the keyboard and mouse if desired.
1- 16
CSA8000B & TDS8000B User Manual
Page 35

Incoming Inspection
This section contains instructions for performing an incoming inspection of this
instrument. Performance of an incoming inspection is not required to put the
instrument in service.
These instructions verify that the instrument is operating correctly after
shipment, but do not check product specifications. An incoming inspection
includes the following parts:
H Perform the Diagnostics on page 1--18 runs the internal diagnostics.
H Perform a Compensation on page 1--20 runs the self compensation routine.
H Perform the Functional Tests on page 1-- 21 uses the DC CALIBRATION
OUTPUT and the INTERNAL CLOCK OUTPUT connectors to verify that
the instrument is functioning.
H Perform the Hardware and Operating System Tests (Windows 98 only) on
page 1--38 uses a software program called QAPlus/Win to verify instrument
hardware and the MS Windows 98 operating system is functioning.
QAPlus/Win is only available on instruments using the MS Windows 98
operating system. Instruments using the MS Windows 2000 operating
system do not include QAPlus/Win software.
Assemble Equipment
NOTE. The procedures that follow contain instructions based on the menus and
controls supported by the version 1.5 release and later of the instrument
firmware. The procedures will work for earlier versions of software, but the
control and menu names may vary slightly.
If the instrument fails any test within this section, it may need service. To contact
Tektronix for service, see Contacting Tektronix on page xiii of Preface.
Make sure you have put the instrument into service as detailed in Installation
starting on page 1--9. Then assemble the following test equipment and proceed
with the procedures that follow.
To complete the incoming inspections procedures requires the following test
equipment:
H One SMA cable, such as Tektronix part number 174-1427-00.
H One 50 Ω BNC cable, such as Tektronix part number 174-1341-00.
CSA8000B & TDS8000B User Manual
1- 17
Page 36

Incoming Inspection
H One SMA 10X attenuator, such as Tektronix part number 015-1003-00.
H One or more (quantity to match number of electrical channels to compen-
H One 50 Ω terminator cap, such as Tektronix part number 011-0049-02
H One 80E00-series electrical sampling modules installed as outlined in its
H One 80C00-series optical sampling module installed as outlined in its User
H Mouse
H Keyboard
Perform the Diagnostics
The instrument Diagnostics use internal routines to confirm basic functionality
and proper adjustment.
sate) 50 Ω terminators, such as Tektronix part number 015-1022-01
User manual.
manual (optional; test only if purchased with/for your instrument).
Equipment required
Prerequisites First, all sampling modules to be diagnosed must be installed as
None
outlined in their user manuals.
Second, power on the instrument and allow a 20 minute warm-up
before doing this procedure.
1. Set up the instrument: From the application menu bar, select Utilities, and
then select Diagnostics. The Diagnostics dialog box displays. See below.
1- 18
CSA8000B & TDS8000B User Manual
Page 37

2. Select a diagnostics suite:
Incoming Inspection
a. In the dialog box, click the Subsystem Level tab.
b. Select the all the entries by clicking the first entry Control Proc and
dragging down to select the rest. All entries should be highlighted as
shown above.
c. In the Run box, leave Loop and Halt on Failure unchecked.
3. Verify that the diagnostic suite passes:
a. Click the Run button to execute the diagnostics.
b. The diagnostics may take several minutes to complete. Verify that Pass
appears as Status in the dialog box when the diagnostics complete.
c. If instead an error number appears as Status, rerun the diagnostics. If
Fail status continues after rerunning diagnostics and you have allowed
warm up to occur, the module or main instrument may need service.
4. Close the diagnostic dialog box.
End of Procedure
CSA8000B & TDS8000B User Manual
1- 19
Page 38

Incoming Inspection
Perform the Compensation
This procedure uses internal routines to verify that the instrument compensates
properly.
Equipment required
Prerequisites First, all sampling modules to be compensated must be installed as
For sampling modules:
H 50 Ω terminations on all electrical module channels (Tektronix
part number 015-1022-xx).
H Dust covers on all optical module channels.
The sampling modules ship from Tektronix with the proper terminations and dust covers installed.
outlined in their user manuals.
Second, power on the instrument and allow a 20 minute warm-up
before doing this procedure.
1. Run the compensation routines:
a. From the application menu bar, select Utilities, and then select Com-
pensation.
In the Compensation dialog box, the main instrument (mainframe) and
sampling modules are listed. The temperature change from the last
compensation is also listed. See Figure 1--6.
1- 20
Click to select compensate
Choose all as targets
Click to start compensation
Figure 1- 6: Compensation dialog box
CSA8000B & TDS8000B User Manual
Page 39

Incoming Inspection
b. Wait until the Status for all items you wish to compensate changes from
Warm Up to Pass, Fail,orComp Req’d.
c. Under Select Action, click the Compensate option button.
d. From the top pulldown list, choose All (default selection) to select the
main instrument and all its modules as targets to compensate.
e. Click the Execute button to begin the compensation.
f. Follow the instructions to disconnect inputs and install terminations that
will appear on screen; be sure to follow static precautions (see the user
manual for your sampling module) when following these instructions.
NOTE. Failing to install the 50 Ω terminations on electrical inputs can yield
erroneous compensation failures or results.
2. Verify that the compensation routines pass:
a. The compensation may take several minutes to complete. Verify that
b. If instead Fail appears as Status, rerun the compensation. If Fail status
c. If you want to save the compensation constants generated by this
3. Close the compensation dialog box.
End of Procedure
Perform the Functional Tests
These procedures use the DC CALIBRATION OUTPUT and the INTERNAL
CLOCK OUTPUT connectors to further verify that the instrument functions
properly. An SMA cable and a 10x attenuator are required to do these test
procedures.
Pass appears as Status for the main instrument and for all sampling
modules listed in the Compensation dialog box when compensation
completes.
continues after rerunning compensation and you have allowed warm up
to occur, the module or main instrument may need service.
compensation, click the Save option button under Select Action. Click
the Execute button to save the compensation.
The purpose of these procedures is to confirm that the instrument functions
properly. The equipment required is intentionally kept to a minimum.
CSA8000B & TDS8000B User Manual
1- 21
Page 40

Incoming Inspection
STOP. These procedures verify functions; that is, they verify that the instrument
features operate. They do not verify that they operate within limits; therefore, do
not interpret any quantities cited (such as “about five horizontal divisions”) as
limits.
STOP. DO NOT make changes to the front-panel settings that are not called out
in the procedures. Each verification procedure will require you to set the
instrument to default settings before verifying functions. If you make changes to
these settings, other than those called out in the procedure, you may obtain
invalid results. In this case, go back to step 1 and repeat the procedure.
Verify Electrical Input
Channels
Install the test hookup and preset the instrument controls:
Equipment
required
Prerequisites At least one electrical (80E00 series) sampling module must be
One SMA cable, such as Tektronix part number 174-1427-00.
installed as outlined in its user manual.
1. Initialize the instrument: Push the front-panel DEFAULT SETUP button,
and click Yes in the confirmation dialog box.
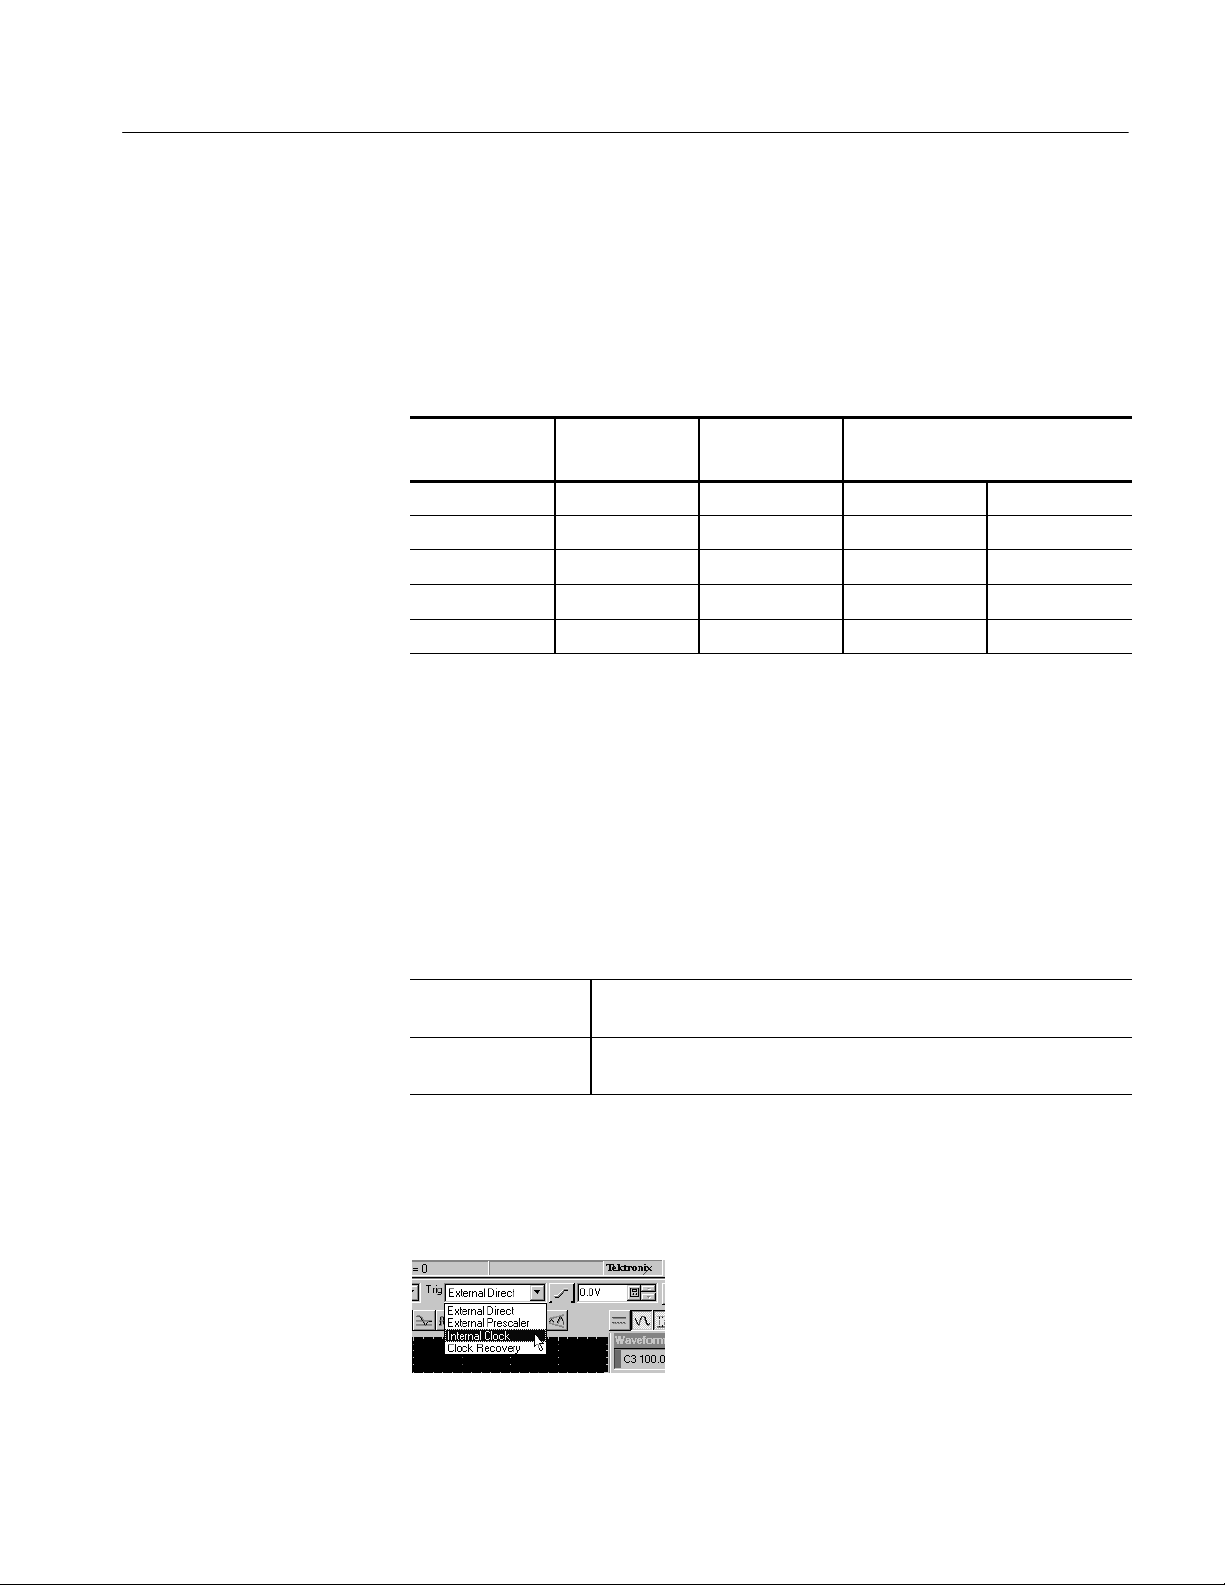
2. Set the Trigger System: In the UI application toolbar, select Internal Clock
from the Trig list box as shown below.
3. Hook up the signal source: Connect the SMA cable from the DC CALIBRA-
TION output to the channel input that you want to test as shown in
Figure 1--7.
1- 22
CSA8000B & TDS8000B User Manual
Page 41

Incoming Inspection
CSA8000/TDS8000
SMA cable from DC calibration
output to 80E00 C3 input
Figure 1- 7: Hookup for electrical functional tests
4. Set the DC CALIBRATOR OUTPUT:
a. Push the Vertical MENU front-panel button. This displays the Vert
Setup dialog box.
NOTE. When an optical module is installed, the optical setup dialog box displays
by default. Click the Basic button to display the basic dialog box.
b. Enter a level of 200 mV in the DC CAL box.
c. Push the Vertical MENU front-panel button again to dismiss the Vert
Setup dialog box.
5. Select the channel to test: Push the channel button for the channel you want
to test. The button lights and the channel display comes on. See Figure 1--8.
Channel
buttons
Figure 1- 8: Channel button location
CSA8000B & TDS8000B User Manual
1- 23
Page 42

Incoming Inspection
6. Verify that the channel is operational: Confirm that the following statements
are true:
H The vertical scale readout for the channel under test shows a setting of
100 mV, and a DC level is at about 2 divisions above center screen.
H The front-panel vertical POSITION knob (for the channel you are
testing) moves the DC level up and down the screen when rotated.
Return the DC level to 2 divisions above center screen before continuing.
H Turning the vertical SCALE knob to 50 mV changes the amplitude of
the DC level to about 4 divisions above center screen, and returning the
knob to 100 mV returns the amplitude to about 2 divisions above center
screen.
7. Verify that the channel acquires in all acquisition modes: Push the
front-panel Acquisition MENU button to display the Acq setup dialog box.
Click each of the three acquisition modes, and confirm that the following
statements are true:
H Sample mode displays an actively acquiring waveform on-screen. (Note
that there is a small amount of noise present on the DC level).
H Average mode displays an actively acquiring waveform on-screen with
the noise reduced.
H Envelope mode displays an actively acquiring waveform on-screen with
the upper and lower extremes of the noise displayed.
8. Close Acquisition setup dialog box: Push the Acquisition MENU button to
close the Acq setup dialog box.
9. Verify the DC accuracy compensation: Do the following substeps:
a. Select Measurement from the Setup menu. In the Meas Setup dialog box
that displays:
H Select as Source the channel under test. For example, select Main C3
for channel 3.
H Select Meas1.
H Set the Select Meas menu to Pulse > Amplitude > Mean.
b. Push the Vertical MENU front-panel button to switch to the Vert Setup
dialog box.
1- 24
CSA8000B & TDS8000B User Manual
Page 43
Incoming Inspection
c. Set the Vertical Scale, Vertical Offset, and DC Calibration Output to the
levels shown in the first row of the table that follows.
d. In Measurement readout on screen, verify that the Mean measurement
for the channel under test falls within the limits given in the table.
e. Repeat steps c and d for each row in the table.
Vertical Scale Vertical Offset DC CAL Output Limits
(mV/div) (mV) (mV) Minimum (mV) Maximum (mV)
100
100 0.0 --450 --461.0 --439.0
100 0.0 0 -- 2 . 0 2.0
100 0.0 450 439.0 461.0
100 1000.0 1000.0 991.0 1009.0
--1000.0 --1000.0 --1009.0 --991.0
Verify Optical Input
Channels
10. Test all channels: Repeat steps 3 through 9 until all electrical input channels
are verified.
11. Remove the test hookup: Disconnect the SMA cable from the channel input
and the DC CALIBRATION output.
After verifying the electrical channels and if you have an 80C00 Series Sampling
Module installed, you can now verify its optical channels. This verification is
done without an input signal.
Equipment
required
Prerequisites At least one optical (80C00 series) sampling module must be installed
None.
as outlined in its user manual.
1. Initialize the instrument: Push the front-panel DEFAULT SETUP button,
and click Yes in the confirmation dialog box.
2. Set the Trigger System: In the UI application toolbar, select Internal Clock
from the Trig list box as shown below.
CSA8000B & TDS8000B User Manual
1- 25
Page 44

Incoming Inspection
3. Select the channel to test: Push the channel button for the channel you want
to test. The button lights amber and the channel displays. See Figure 1--9.
Channel
buttons
Figure 1- 9: Channel button location
4. Verify that the channel is operational: Confirm that the following statements
are true.
H A baseline trace displays at about center screen (see Figure 1--10 on page
1--27) and the vertical scale readout for the channel under test shows a
setting as follows:
H 80C01, 80C02, 80C04, 80C09, and 80C11: 1 mW
80C03: 100 W
80C05: 3 mW
80C06: 6 mW
80C07, and 80C07B: 100 W
80C08, 80C08B, and 80C08C: 200 W
80C10: 3 mW
H Turning the front-panel Vertical POSITION knob (for the channel you
are testing) moves the signal up and down the screen. Return the
baseline trace to center screen before continuing.
H Turning the front-panel Vertical OFFSET knob counterclockwise offsets
the baseline towards the bottom of the screen; turning the knob
clockwise offsets the baseline towards the top of the screen, and
returning the knob to 0.000 offset returns the baseline to center screen.
1- 26
CSA8000B & TDS8000B User Manual
Page 45
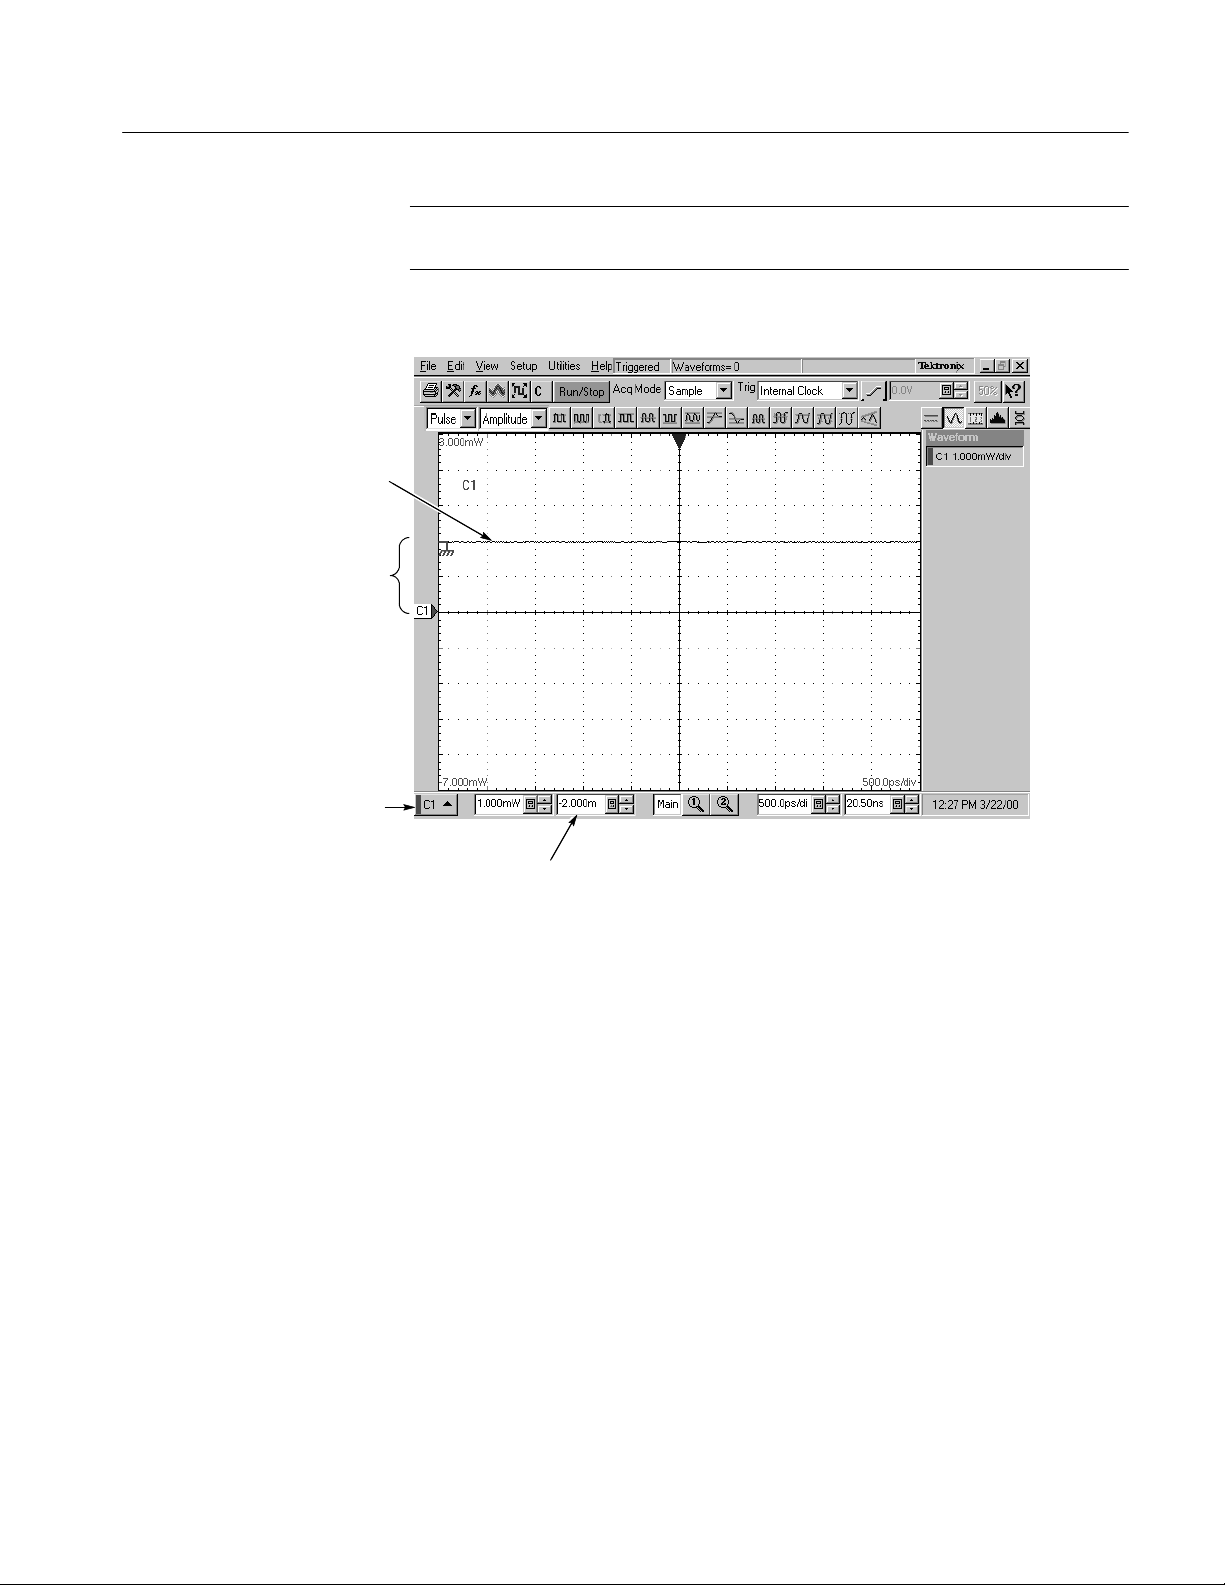
Baseline
Vertical offset
Incoming Inspection
NOTE. If the position knob was set to 0.000, you can confirm this in the Vertical
menu (use Basic button in the dialog box).
Control bar
Vertical offset
setting
Figure 1- 10: Optical channel verification
5. Verify that the channel acquires in all acquisition modes: Push the
front-panel button Acquisition MENU to display the Acq Setup dialog box.
Click each of the three acquisition modes and confirm that the following
statements are true:
H Sample mode displays an actively acquiring waveform on-screen. (Note
that there may be a small amount of noise present on the baseline level).
H Average mode displays an actively acquiring waveform on-screen with
any noise present reduced.
H Envelope mode displays an actively acquiring waveform on-screen with
the upper and lower extremes of the noise displayed.
6. Close Acquisition setup dialog box: Push the Acquisition MENU button to
close the Acq setup dialog box.
CSA8000B & TDS8000B User Manual
1- 27
Page 46
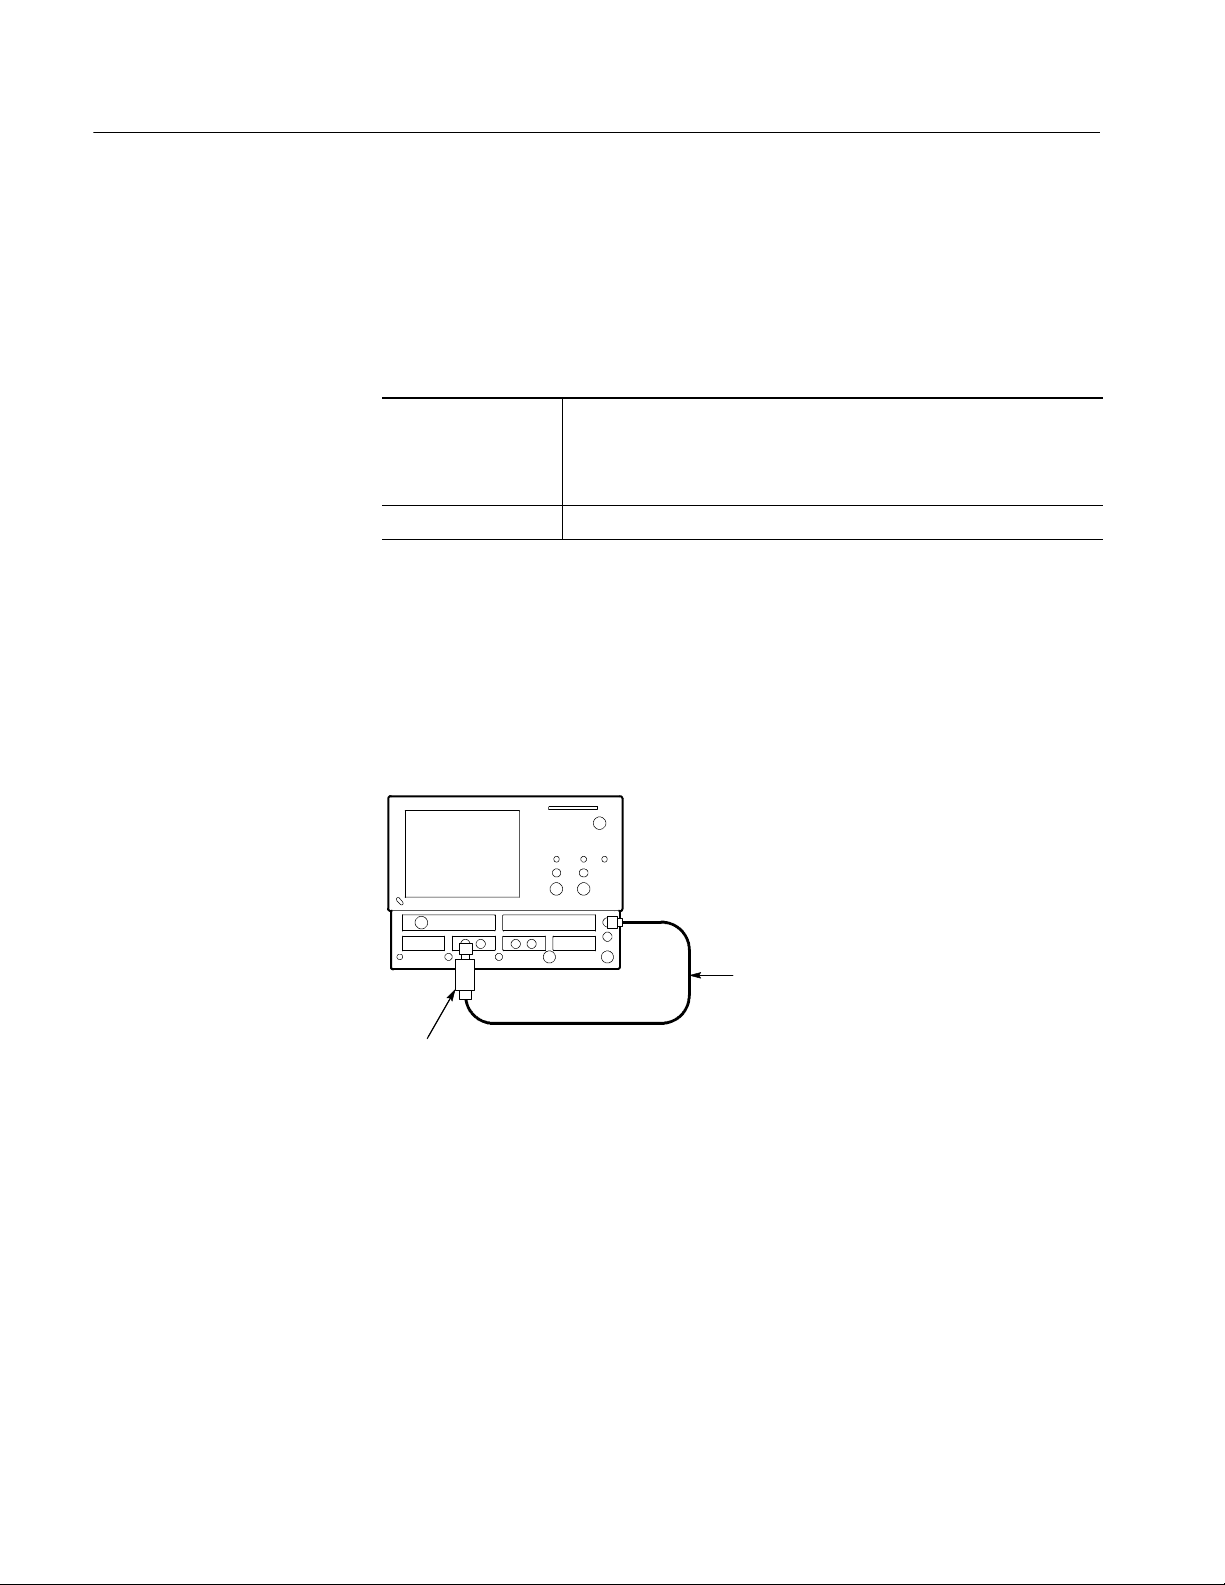
Incoming Inspection
7. Test all channels: Repeat steps 3 through 5 until all optical input channels
are verified.
Verify the
Time Bases Work
After verifying the channels, you can now verify that the time bases function.
This verification is done using a front-panel signal.
Equipment
required
Prerequisites None
One SMA cable, such as Tektronix part number 174-1427-00.
One 10x SMA attenuator, such as Tektronix 015-1003-00.
One electrical (80E00-series) sampling module.
1. Initialize the instrument: Push the front-panel DEFAULT SETUP button,
and click Yes in the confirmation dialog box.
2. Hook up the signal source: Connect the SMA cable from the Internal Clock
output through a 10x attenuator to the 80E00 sampling module input
channel 3 as shown in Figure 1--11.
CSA8000/TDS8000
1- 28
SMA cable from
INTERNAL CLOCK
output to 80E00 C3 input
10x attenuator
Figure 1- 11: Hookup for the time base tests
3. Set up the instrument:
a. Push the Trigger MENU front-panel button to display the Trig Setup
dialog box.
b. Click Internal Clock under Trigger Source in the Trig Setup dialog
box. The Internal Clock rate should be set to 200kHz.
c. Push the Trigger MENU front-panel button again to dismiss the Trig
Setup dialog box.
CSA8000B & TDS8000B User Manual
Page 47
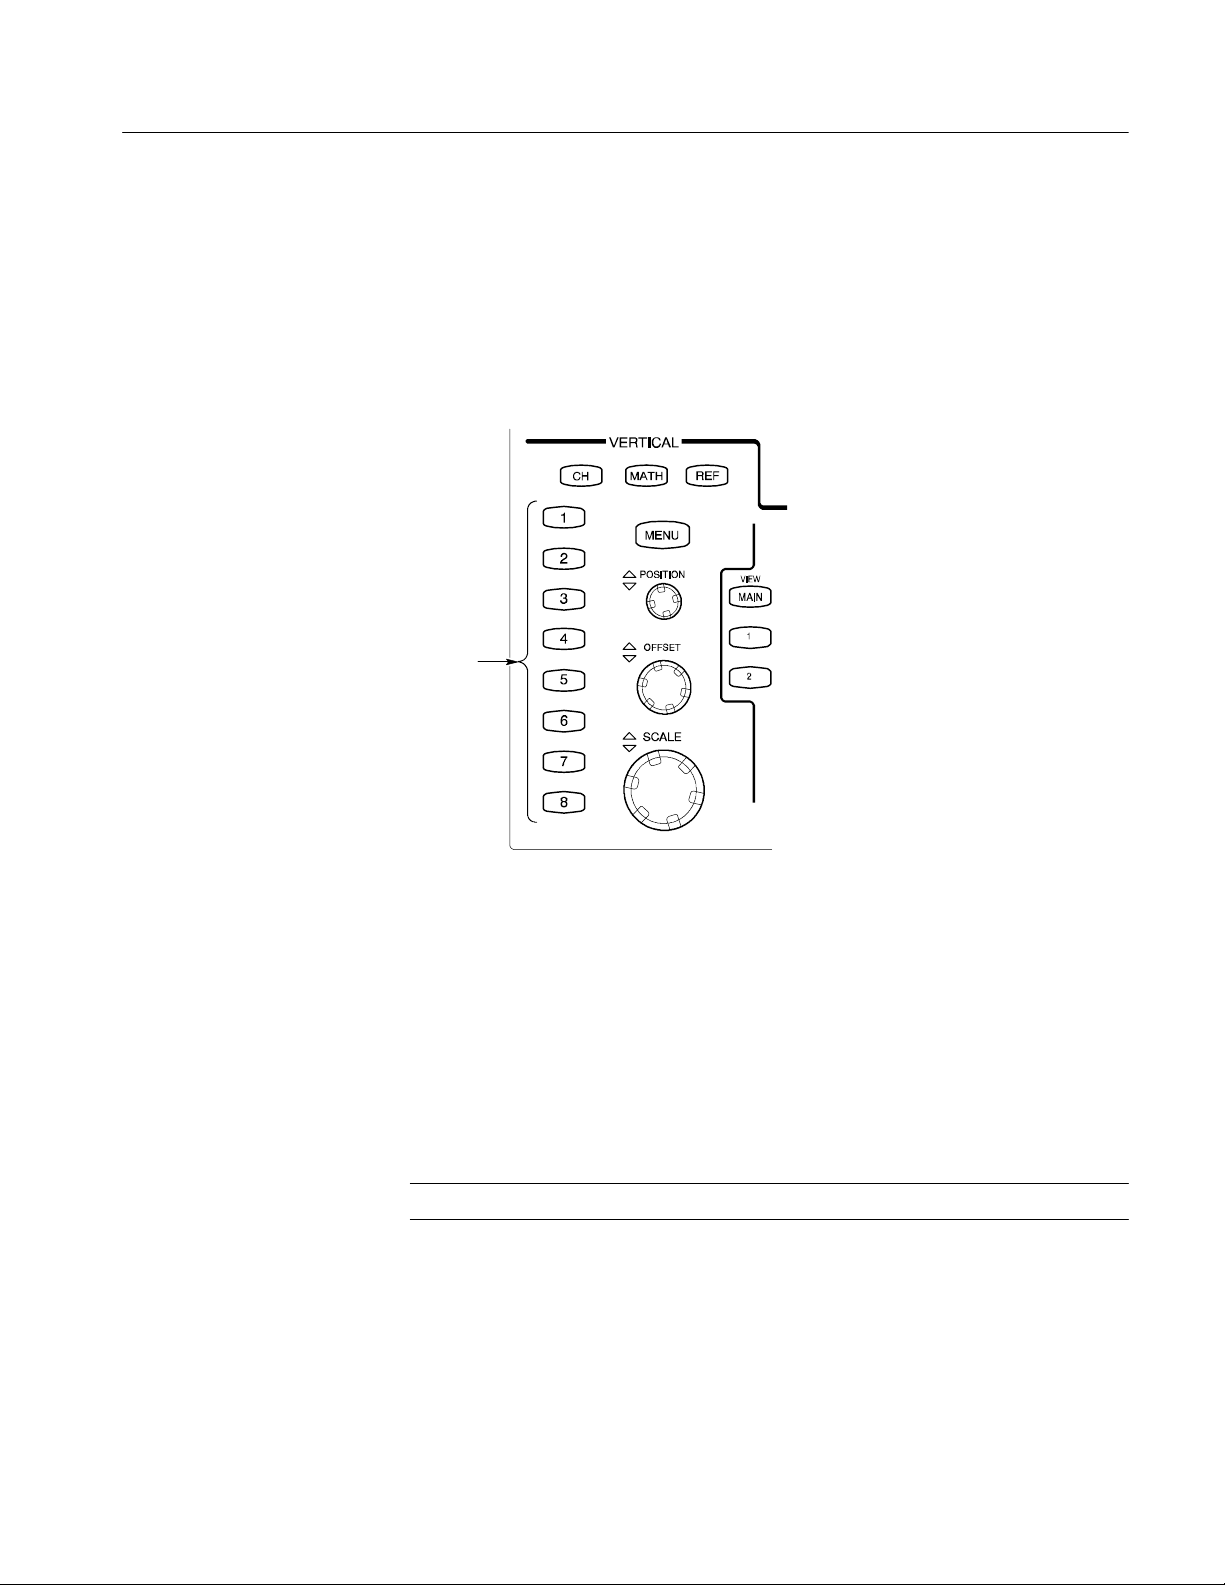
Incoming Inspection
d. Push the channel button for the channel you connected to in step 2. See
Figure 1--12 on page 1--29. The button lights and the channel display
comes on.
e. Turn the Vertical SCALE knob to set the vertical scale to 20 mV/div.
The channel scale readout is displayed in the Control bar at the bottom
of the graticule.
Channel
buttons
Figure 1- 12: Channel button location
4. Set the time base: Set the Horizontal SCALE to 1 s/div. The horizontal
scale readout is displayed in the Control bar at the bottom of the graticule.
a. Set the display for Normal and Show Vectors (enable). See To Set
Display Styles on page 3--68.
b. Rotate vertical OFFSET knob counterclockwise so that the base of the
square wave is about 2 divisions below the center graticule.
NOTE. Otherwise, no vertical trace will be seen for rise and fall.
5. Verify that the Main time base operates: Confirm the following statements
are true:
H One period of the internal clock signal (a square wave) is about five
horizontal divisions on-screen. See Figure 1--13 on page 1--30.
CSA8000B & TDS8000B User Manual
1- 29
Page 48

Incoming Inspection
NOTE. At some temperatures, there may be extraneous data points after the first
half cycle when viewing the front-panel Internal Clock output (as is done in this
step). This behavior may also occur when viewing multiple cycles in TDR mode.
In both cases, this behavior is normal.
H Rotating the Horizontal SCALE knob clockwise expands the waveform
on-screen (more horizontal divisions per waveform period), counterclockwise rotation contracts it, and returning the horizontal scale to
1 s/div returns the period to about five divisions. Leave the time base
set to 1 s/div.
H The horizontal POSITION knob positions the signal left and right
on-screen when rotated.
NOTE. The signal will not move past the minimum position setting.
Internal clock
signal
Control bar
s
Vertical scale
setting
Horizontal
scale setting
Figure 1- 13: Main time base verification
1- 30
CSA8000B & TDS8000B User Manual
Page 49

Incoming Inspection
6. Set up the Mag1 time base:
a. Push the Horizontal View MAG1 button on the front panel. The Mag1
time base view will display under the Main time base view.
b. Set the Horizontal SCALE to 1 s/div. The horizontal scale readout is
displayed in the Control bar at the bottom of the graticule and is now
reading out the scale of the Mag1 time base view.
7. Verify that the Mag1 time base operates: Confirm the following statements.
H The brackets on the Main View waveform (top graticule) areafull-
screen width apart (10 divisions). See Figure 1--14 on page the 1--31.
H One period of the internal clock signal (a square wave) in the Mag view
(bottom graticule) is about five horizontal divisions on-screen. (Matches
the waveform in the top graticule.) See Figure 1--14.
H Rotating the Horizontal SCALE knob clockwise to 500 ns/div expands
the waveform in the bottom graticule to double the period (about
10-horizontal divisions per waveform period) and returning the
Horizontal SCALE knob to 1 s/div returns the period to about five
divisions. Leave the Horizontal Scale set to 1 us/div.
Main time base view
Magtimebaseview
Left mag time base
marker
Figure 1- 14: Mag time base verification
Right mag time base
marker
CSA8000B & TDS8000B User Manual
1- 31
Page 50

Incoming Inspection
8. Verify that the Mag2 time base operates:
a. Push the Mag1 button to remove the display of the Mag1 time base.
b. Perform steps 6 and 7, but use the Mag2 button instead of the Mag1.
Perform Gated Trigger
Test
This test verifies that the Gated Trigger (GT Option) is functional. This test is
done using a front-panel signal and a rear-panel TTL connection.
Equipment
required
Prerequisites This test applies only to instruments that include option GT.
One 50 Ω BNC cable, such as Tektronix part number 174-1341-00
One SMA cable, such as Tektronix part number 174-1427-00
One 50 Ω terminator cap, such as Tektronix part number 011-0049-02.
One SMA 10X attenuator (20 dB attenuator), SMA connector, such as
Tektronix part number 015-1003-00
One electrical (80E00-series) sampling modules.
1. Initialize the instrument: Push the front-panel DEFAULT SETUP button,
and click Yes in the confirmation dialog box.
2. Push the channel 3 button to select it. The button lights and the channel
display comes on. See Figure 1--15.
1- 32
Channel
buttons
Figure 1- 15: Channel button location
CSA8000B & TDS8000B User Manual
Page 51

Incoming Inspection
3. Hook up the signal source: Connect the SMA cable from the Internal Clock
output through a 10x attenuator to 80E00 sampling module input channel 3
as shown in Figure 1--16. Connect BNC cable to External Gate input at rear
panel.
Rear panel
TRIGGER
GATE (TTL)
10x attenuator
BNC cable attached to TRIGGER
GATE (TTL) on the rear panel.
CSA8000/TDS8000
SMA cable from
INTERNAL CLOCK
output to 80E00 C3 input
Figure 1- 16: Hookup for the gated trigger tests
4. Set up the instrument:
a. Push the Trigger MENU front-panel button to display the Trig Setup
dialog box.
b. Click Internal Clock under Trigger Source in the Trig Setup dialog
c. Verify that the Gated Trigger option in Enhanced Triggering section is
d. Turn the Vertical SCALE knob to set the vertical scale to 50 mV/div.
5. Set the time base: Set the Horizontal SCALE to 2 s/div. The horizontal
scale readout is displayed in the Control bar at the bottom of the graticule.
6. Set the display for Normal and Show Vectors (enable). See To Set Display
Styles on page 3--68.
CSA8000B & TDS8000B User Manual
box. The Internal Clock rate should be set to 200kHz.
selected (check box is checked). See To Use Gated Trigger,step4on
page 3--51.
The channel scale readout is displayed in the Control bar at the bottom
of the graticule.
1- 33
Page 52

Incoming Inspection
7. Push the Horizontal MENU button, the Mode in All Timebases must be set
to Lock to Int. 10 MHz.
8. Verify that Triggering occurs: Verify signal is triggered with waveform
on-screen. See Figure 1--17 on page 1--34.
Triggered signal indicator
Internal
clock
signal
Control
bar
Vertical scale
setting
Horizontal
scale setting
Figure 1- 17: Signal triggered
9. Disable trigger: Install 50 Ω terminator cap to the end of the cable that is
attached to the rear-panel gated trigger BNC. See Figure 1--16 on page 1--33.
10. Verify that the Gated Trigger functions: Verify signal is not triggered (gate
disabled). Signal freezes on the screen above to indicate triggering has
stopped. See Figure 1--18 on page 1--35. Note the Not Trigd indication at the
top of the window.
a. Push the CLEAR DATA button.
b. Verify signal is not triggered with no waveform on-screen (see Fig-
ure 1--19 on page 1--36). Note the Not Trigd indication at the top of the
window.
1- 34
CSA8000B & TDS8000B User Manual
Page 53

Untriggered signal indicator
Incoming Inspection
Control
bar
Vertical scale setting Horizontal scale setting
Figure 1- 18: Signal not triggered (signal frozen)
CSA8000B & TDS8000B User Manual
1- 35
Page 54

Incoming Inspection
Untriggered signal indicator
Control
bar
Vertical scale
setting
Horizontal
scale setting
Figure 1- 19: Signal not triggered (no signal)
11. Verify that the Gated Trigger function is enabled: Disconnect 50 Ω
terminator cap from the end of the cable. Verify signal is triggered (gate
enabled) with waveform on-screen. See Figure 1--20 on page 1--37.
1- 36
CSA8000B & TDS8000B User Manual
Page 55

Internal
clock
signal
Incoming Inspection
Triggered signal indicator
Control
bar
Vertical scale setting Horizontal scale setting
Figure 1- 20: Signal triggered
12. Disconnect the test hook up.
End of Functional Test Procedures
CSA8000B & TDS8000B User Manual
1- 37
Page 56

Incoming Inspection
Perform the Hardware and Operating System Tests (Windows 98 Only)
NOTE. The procedures in this section only apply to instruments using the
MS Windows 98 operating system. Instruments using the MS Windows 2000
operating system do not include the QAPlus/Win software.
These procedures verify the instrument hardware functions. A diagnostics
program called QAPlus/Win is used to make the verifications. No equipment is
required.
QA+Win32
QA+Win32 is a comprehensive software application used to check and verify the
operation of the PC hardware in the main instrument. This procedure uses
QA+Win32 to verify the instrument hardware. To run QA+Win32, you must
have either a working keyboard or a working mouse or other pointing device and
have Windows 98 running.
CAUTION. Before running the QA+Win32 tests, be aware of the following
problems and work-arounds.
H The QA+Win32 discrete memory test fails if the system being tested
contains more than 16 megabytes of RAM.
Since your product ships with more than 16 megabytes of RAM, please
follow the procedure for Checking the Hardware and Operating System on
page 1--39.
NOTE. Do not run the memory test from the Memory icon.
H The QA+Win32 hard drive test may report an incorrect number of tracks and
cylinders for your hard drive.
1- 38
This is an internal mapping problem, but has no effect on the results of the
test. Bad sectors on your hard drive are still found and marked.
H The QA+Win32 keyboard test does not respond correctly to keys used by
Windows 98.
Keyboards made for use with Windows contain two or three keys specific to
that operating system. These are usually located on either side of the space
bar. QA+Win32 does not trap these keys when performing the keyboard test.
Do not press them.
CSA8000B & TDS8000B User Manual
Page 57

Incoming Inspection
Checking the Cooling Fan
Operation
Checking the Hardware
and Operating System
Power on the instrument and visually inspect the left side panel of the instrument
to verify that all six cooling fans are rotating.
Equipment
required
Prerequisites The instrument must be powered on and running.
None
To perform a minimal check of the hardware and Windows 98 operating system
of this instrument, perform this procedure to run QA+Win32 diagnostics from
the Windows 98 Start menu.
Equipment
required
Prerequisites A mouse and keyboard must be connected to the instrument and it
None
must be powered on.
1. Push the RUN/STOP front-panel button to stop acquisition.
2. Use CTRL-ALT-DEL to close the TDS/CSA8000 application.
3. Click Start, then select Programs, and then Sykes Diagnostics in the Start
Menu. Finally, click QA+Win32.
NOTE. You may experience a delay before the program starts.
4. Click Tools on the menu bar, then click Customize Test...
5. Click Default and exit this dialog by clicking OK.
6. Select and execute the following tests individually by clicking on the test
buttons (see the illustration on page 1--40) one at a time (see note) and
clicking Start:
a. COM Ports
b. LPT Ports
c. System Board
d. System Info
e. USB
f. Video
CSA8000B & TDS8000B User Manual
1- 39
Page 58
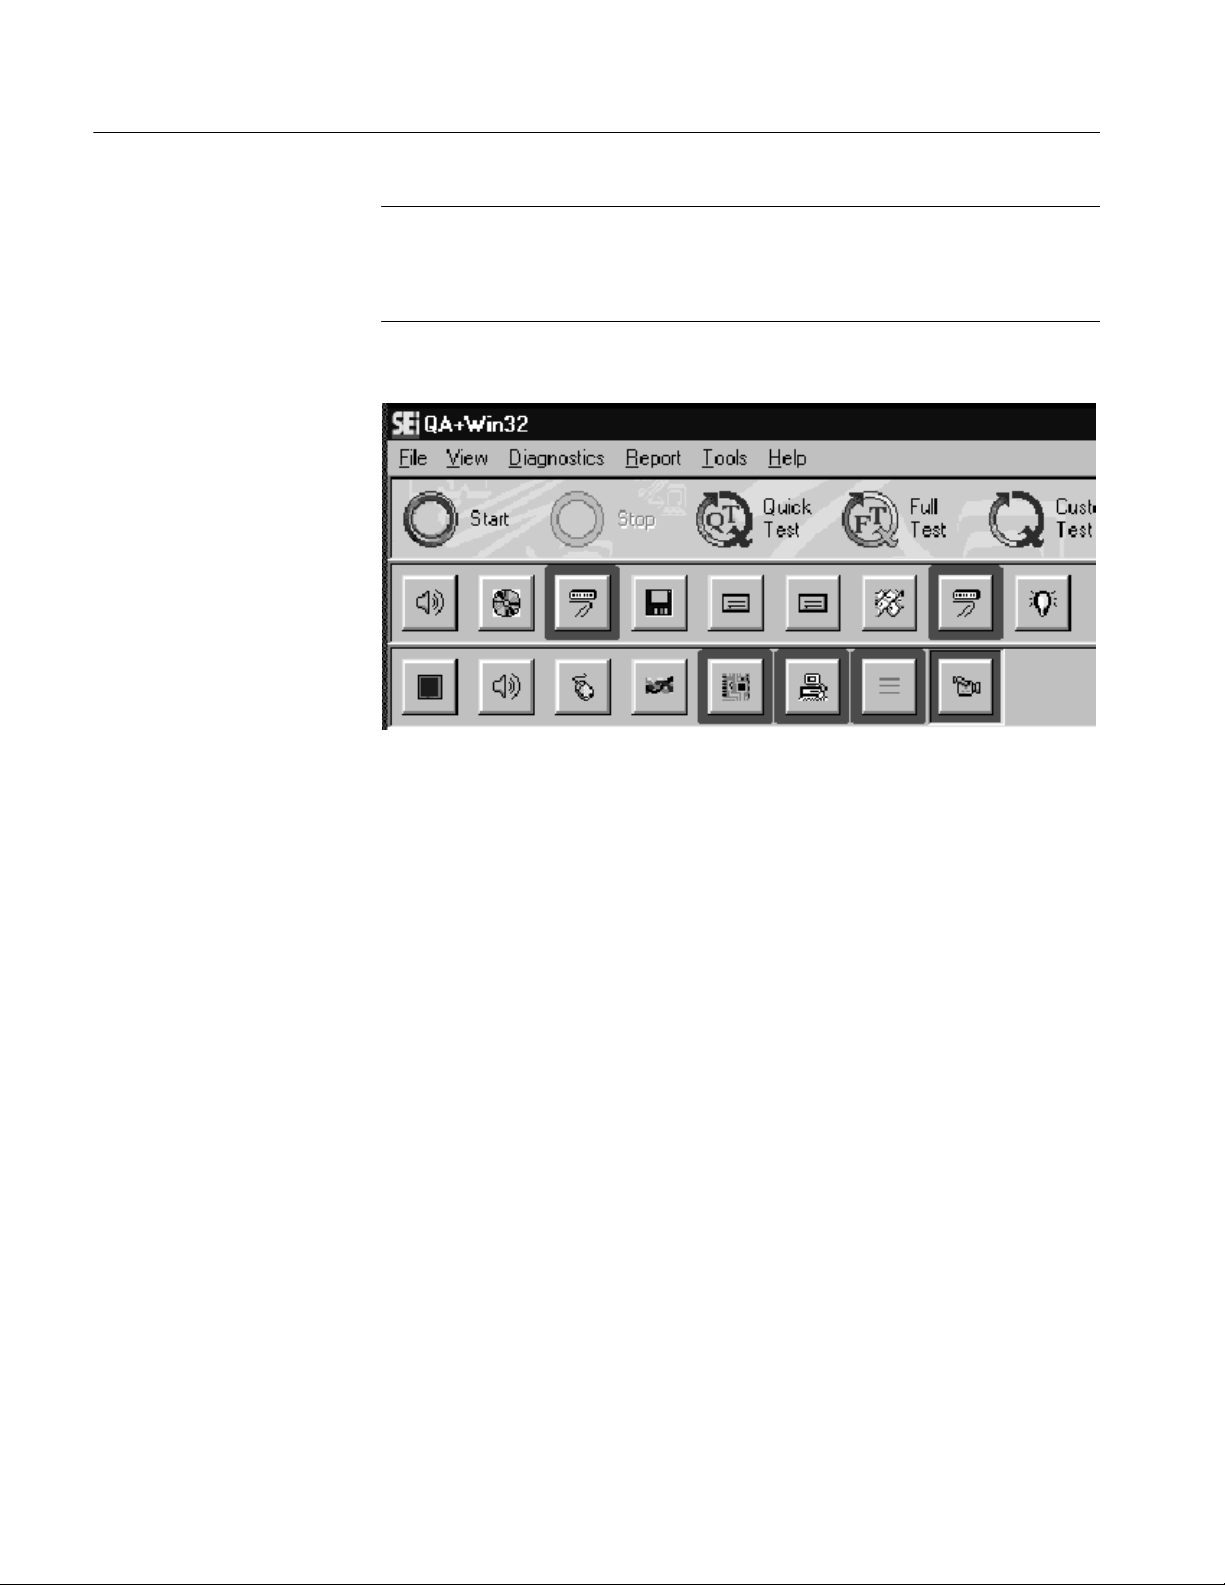
Incoming Inspection
NOTE. A test button is not highlighted until you select it. As you select the button
for each test (tool tip appears when you point to the button), a highlight box
appears around the button. When you click Start, the button blinks until the test
is complete and the highlight box changes color to indicate the test is complete.
Follow any instructions appearing on the screen.
7. Check test results in scrollable results listing in the Test Results window of
the QAPlus test window. All tests should pass.
8. Close the QA+Win32 diagnostics by selecting Exit in the File menu or click
the Control Box (X) in upper right corner.
9. You can restart the TDS/CSA8000 product software application by clicking
Start, then selecting Restart from the Shutdown Windows dialog box.
End of Procedure
1- 40
CSA8000B & TDS8000B User Manual
Page 59

Accessories and Options
This section lists the standard and optional accessories, as well as the product
options available for the instrument at the time this manual was published.
Accessories
Standard
Table 1--3 lists the standard accessories that ship with the instrument.
NOTE. The standard accessories that ship with any instrument modules are not
listed here. Each instrument module ships in its own package. Consult the user
documentation of the module for a list of accessories.
Table 1- 3: Standard accessories
Item Part number
H Certificate of Traceable Calibration for product at i nitial shipment Not orderable
H Business reply card Not orderable
H 1 Windows compatible keyboard 119-6297-00
H 1 Windows compatible mouse 119-6298-00
H 1 Instrument front cover 200-4519-00
H 1 Accessory pouch 016-1441-00
H 2 Touchscreen styluses 119-6107-00
H 1 ESD wrist strap with 6 foot coiled cord 006-3415-04
H CSA8000 & TDS8000 Online Help (part of application software) Not orderable
H CSA8000B & TDS8000B User Manual 071-1099-xx
H CSA8000 & TDS8000 Reference 071-1096-xx
H CSA8000 & TDS8000 Programmer Online Guide (part of
application software)
H Oscilloscope Analysis and Connectivity Made Easy (manual and
CD with connectivity examples)
H CSA8000 & TDS8000 Series Windows 2000 OS Restore Kit 020-2526-xx
H CSA8000 & TDS8000 Series Product Software Kit 020-2527-xx
H 8000 Series Demo Applications Software CD 020-2480-xx
H Power cord Order by option
CSA8000B & TDS8000B User Manual
Not orderable
020-2449-xx
number
1- 41
Page 60

Accessories and Options
Optional
The following accessories are orderable for use with the instrument at the time
this manual was originally published. Consult a current Tektronix catalog for
additions, changes, and details.
Table 1- 4: Optional accessories
Item Part number
H 80A02 EOS/ESD Protection module 80A02
H Sampling Module Extender (1 meter) 012-1568-00
H Sampling Module Extender (2 meter) 012-1569-00
H 3.5Maleto3.5FemaleSMA 015-0552-00
H Slip-on SMA connector 015-0553-00
H 2X Attenuator (SMA Male-to-Female) 015-1001-00
H 5X Attenuator (SMA Male-to-Female) 015-1002-00
H 10X Attenuator (SMA Male-to-Female) 015-1003-00
H Power Divider 015-1014-00
H BNC Female 75 Ω to 50 Ω Type N Minimum Loss Attenuator 131-0112-00
H P6209 4 GHz Active FET Probe P6209
H P6150 9 GHz Passive Probe P6150
H Replacement hard disk drive 119-6241-00
H CSA8000 Series Communications Signal Analyzers
TDS8000 Series Digital Sampling Oscilloscopes
Service Manual
H Calibration Step Generator 067-1338-00
071-0438-xx
1- 42
CSA8000B & TDS8000B User Manual
Page 61

Options
Accessories and Options
The following options can be ordered for the instrument:
H Option 1K: Cart
H Option 1R: Rack Mount Kit (includes hardware and instructions for
converting to rackmount configuration)
H Option GT: Gated Trigger option.
H International Power Cords Options:
H Option A1 -- Universal Euro 220 V, 50 Hz
H Option A2 -- UK 240 V, 50 Hz
H Option A3 -- Australian 240 V, 50 Hz
H Option A5 -- Switzerland 220 V, 50 Hz
H Option AC -- China 220 V, 50 Hz
H Option A99 -- No power cord shipped
H Service offerings:
H Option C3: Three years of calibration services
H Option C5: Five years of calibration services
H Option D1: Calibration data report
H Option D3: Test Data for calibration services in Option C3
H Option D5: Test Data for calibration services in Option C5
H Option R3: Repair warranty extended to cover three years
H Option R5: Repair warranty extended to cover five years
CSA8000B & TDS8000B User Manual
1- 43
Page 62

Accessories and Options
1- 44
CSA8000B & TDS8000B User Manual
Page 63

Operational Maps
This chapter acquaints you with how the instrument functions and operates. It
consists of several maps that describe the system, its operation, and its documentation:
H Documentation Map, on page 2--2, lists the documentation that supports the
H System Overview Maps on page 2--4, describe the high-level operating blocks
H User-Interface Map, on page 2--7, describes the elements of the User Interface
H Front-Panel Map, on page 2--8, describes the elements, such as control
H Display Maps, on pages 2--9 and 2--10, describe elements and operation of
H I/O Maps, on pages 2--11 and 2--12, describe front and rear input/output ports
instrument.
and operating cycle of the instrument.
(UI) application, which provides complete control of the instrument.
buttons, of the instrument front panel and cross references information
relevant to each element.
single-graticule and multiple-graticule displays.
and peripherals on the front and rear panels.
Tutorial procedures are available online, as part of the online help. To display,
select the Setup Procedures from the UI application Help menu.
For information on configuring and installing your instrument, refer to
Chapter 1, Getting Started.
CSA8000B & TDS8000B User Manual
2- 1
Page 64

Documentation Map
c
k
erManu
This instrument ships with documents individually tailored to address different
aspects or parts of the product features and interface. The table below cross
references each document to the instrument features and interfaces it supports.
To read about... Refer to these documents: Description
Standard accessories or packing list Graphical pa
Installation, Specification, & Operation
(overviews)
All about Sampling Modules Electrical, Optical, or Other
Main Us
Reference Manual
CD booklets
Modules User Manual
ing list The graphical packing list is one of the items you
al
should find when you open the instrument box. It
shows all items as they are packaged in the box.
Additionally, all standard accessories are listed on
page 1--41 of this manual.
Read the Reference for a quick overview of
instrument features and their usage.
Read the User Manual for general information
about your instrument — procedures on how to put
it into service, specifications of its performance,
maps of its user interface controls, overviews and
background on its features.
Specific installation information for both the
operating system (OS) and product software is
located in each of the CD booklets accompanying
the CDs.
For more detailed usage information, see Online
Help System, below.
Read these manuals for complete information
about the sampling modules you purchased —
how to install them in the instrument, how to use
them, and how to protect them from ESD.
The user manual for Electrical and Optical
Modules are provided on the product software CD
as PDF files. These are also available for
download on the Tektronix Web site. Other module
user manuals are provided with the module.
2- 2
CSA8000B & TDS8000B User Manual
Page 65

To read about... DescriptionRefer to these documents:
c
ope
A
d
Documentation Map
In Depth Operation and UI Help Online Help System
GPIB Commands
<NR3><Space>
?
Analysis and ConnectivityTools Oscillos
Online Programmers Guide
nalysis an
Connectivity Made Easy
TekVISA Programming
VXIplug&play Driver Help
TekVISA Excel Toolbar Help
Access online help from the instrument for
context-sensitive information on virtually all
controls and elements on screen.
Online help includes a setup guide of procedures
for applying all instrument functions. See
Accessing Online Help on page 3--167.
Access this online guide from the instrument from
its Help menu. Quickly find the syntax for any
command, and copy the command if desired.
Read about communication, error handling, and
other information on GPIB usage.
Information about other products is available on
the Tektronix website. See Contacting Tektronix for
information on how to access our website.
These documents help you use various connectivity and analysis tools that you can install. See
Analysis and Connectivity Support in the
instrument online help (described above) for more
information. Note that earlier instrument models
(TDS8000 and CSA8000) did not ship with these
tools.
You may also want to obtain the optional service manual for this product if you
carry out self-service or performance test this instrument. See Optional
Accessories on page 1--42.
CSA8000B & TDS8000B User Manual
2- 3
Page 66

System Overview Maps
The instrument and its sampling modules comprise a highly capable waveform
acquisition, test, and measurement system. The following model provides
background information on its operation, which, in turn, may provide you insight
on how the instrument can be used.
Functional Model Map
Modular Sampling
Specialization
Input modules
CH1..8
Clock recovery
options only
External trigger
Gated trigger
(option GT )
Page 3--5
inputs
TTL input
Digital Signal Acquisition
Channel
Channel
Channel
Acquisition
system
Page 3--21
Page 3--14
Trigger
system
Page 3--39
Timebase
system
Page
3--101,
3--53
Signal Processing
& Transformation
SP&T
systems
Pages
3--73,
3--101,
3--141
Display, I/O,
&Storage
Chan 1--8
Ref 1--8
Math 1--8
User Interface
& Waveform Display
Page 3--53
The model comprises five high-level subsystems or processes (embodying a
variety of hardware and software functions):
H Modular Sampling Specialization System. Allows you to choose modules
to begin tailoring your waveform acquisition based on the types of signals
you want to acquire: electrical or optical; with clock recovery or without,
with bandwidth filter or not. Provides cost-effective solution for users
needing very high bandwidth with superb time resolution on repetitive
waveforms. Sampling modules determine the size of the vertical acquisition
window for each channel.
2- 4
CSA8000B & TDS8000B User Manual
Page 67

System Overview Maps
H Digital Signal Acquisition System. Acquires a waveform record from each
signal you apply to each channel using the following subsystems:
H Acquisition System. Sets vertical offset for the vertical acquisition
window for each channel. Performs the actual A/D conversion and
storing of digitized samples. Also performs post A/D sample-based
corrections to compensate for non-linearities of various analog circuits.
H Trigger System. Recognizes a specific event of interest on the input
trigger signal and informs the Timebase of the trigger event’s occurrence,
gating the taking of a sample after a controlled, incremental delay (see
page 3--17). The trigger event is defined as time zero for the waveform
record, which means that all samples are displayed relative to this point.
There is no internal trigger pick off from the channels; rather, a trigger
signal must be obtained through the external trigger inputs, from the
system clock, or from the clock recovery when available from optical
modules equipped with clock recovery.
For those CSA8000B and TDS8000B instruments equipped with the
Gated Trigger option (Option GT), the system allows triggering to be
enabled and disabled (gated) based on a TTL signal at a rear-panel input.
See the To Use Gated Trigger section on page 3--51 for more informa-
tion.
H Timebase System. Tells the Acquisition system to take a sample (i.e.
convert from analog to digital) at some specific time relative to the
trigger (or clock) event. In more general terms, synchronizes the
capturing of digital samples in the Acquisition system to the trigger
events generated from the Trigger system.
H Signal Processing Transformation System. Performs a variety of trans-
formations or operations, beginning with the most fundamental data
elements in the system, the channel waveforms. Waveform math operations,
automatic measurements, and histogram generation are examples.
H Display, Input/Output, Storage Systems. Provides display control. Sets the
vertical scale and position of the display, which controls how much of the
vertical acquisition window appears on screen. Provides output (and
sometimes input) of instrument-data elements in a form suitable to the user.
The process overview that follows describes each step in the top-level cycle of
instrument operation.
CSA8000B & TDS8000B User Manual
2- 5
Page 68

System Overview Maps
r
Wav
peractive
Wavefor
m
N
Process Overview Map
Process overview
Yes
Stop
condition?
1
Note: if acquiring when powered down, the oscilloscope may skip the
idle state and resume acquisition starting with step 3.
No
Add one
sample interval
to Delay time
o
Idling...
Implement
setup
Wait for trigger/
accept trigger
Wait Delay time
Take 1 sample
active
pe
channel
eform
record
complete?
Yes
Waveform
available
Reset
Abort
Power On
Process block description
1. The instrument starts in the idle state; it enters this state
upon power up, upon receiving most control setting changes,
1
or upon finishing acquisition tasks.
2. When you toggle its RUN/STOP control to RUN, the
instrument implements its setup based on the current
control settings (upon start up, these are default or last
setup depending on user-set preferences).
3. The instrument then begins waiting for a trigger. No sampling
takes place until triggering criteria are met or a free-run
trigger is forced (Auto-trigger mode only). The instrument
accepts trigger.
4. The instrument then waits a delay time, that is, it delays
taking a sample until a specified time elapses, where:
Delay time = Horizontal Pos. + Ch. Deskew + N sample intervals
In the above calculation, N = Current sample count -- 1
th
For example, if taking the 6
sample in the waveform record,
5 sample intervals are added.
5. The instrument takes one sample for each waveform record
(channel) for each active (on) timebase. This instrument
sequentially samples: one sample is taken per trigger for
each active channel in each displayed timebase.
6. If averaging or enveloping is on, each record becomes part of
a multi-acquisition record that these modes produce (see
page 3--22). The process loops back to step 3 above to
acquire additional records until the number of acquisitions
required for the acquisition mode currently set are processed,
and then processing continues as for step 8 below.
7. If FrameScan mode is on, the acquisition process is
modified. See FrameScan Acquisitions on page 3--30 f or
information on how FrameScan works.
8. At this point the acquisition record is in channel acquisition
memory and is available to the instrument for measurement
of its parameters, display, output, and so on.
The instrument then checks for user-specified stop condition
and either returns to its idle state or continues at step 3,
according to what it finds.
2- 6
CSA8000B & TDS8000B User Manual
Page 69

User Interface Map -- Complete Control and Display
Menu Bar: Access to data I/O,
printing, online help system,
and set-up functions
Tool Bar: Handy access to
key features, including the
setup dialogs, acquisition
modes, triggering modes,
and online help
Measurements Bar: Quick
access to automated
measurements by signal type
and category; click
measurement buttons to
measure the selected waveform
Display: Live, reference, and
math waveforms display here,
along with cursors, masks,
etc. to analyze them
Waveform Bar: Access to
waveform selection (click),
waveform position (drag),
and waveform properties
(right-click)
Controls Bar: Quick access
to waveforms and timebases
for display, and to their scale,
offset, and position controls
for adjustment
Status Bar. Trigger status
and waveform count
Readout Bar. Toggle
individual readouts on and
off by clicking its button
A Readout. Right click
any readout to display a
short-cut menu providing
handy access to
often-used setup controls
and properties for the
feature associated with
the readout
Readouts: Display up
to five readouts in this
area, selectable from
the Readout Bar
CSA8000B & TDS8000B User Manual
2- 7
Page 70

Front Panel Map -- Quick Access to Most Often Used Features
Turn knob to adjust most control fields in setup dialogs.
Press the Select button to switch among fields. Press the
Fine button to toggle between normal and fine adjustment.
Press to start and stop acquisition or clear
all channel waveforms at once. Page 3--26.
Press a Menu button to quickly access the setup dialog for
Press to display measurement cursors and set the knob
and Fine (adjust) and Select buttons to control them.
Press to automatically set up the instrument controls
Press to toggle the touch screen on and off. Use the
touch screen to control UI when you haven’t installed a
Press to display and select a waveform not yet displayed;
Button lights indicate displayed and selected waveforms.
its control group for more detailed set up.
Page 3-- 89.
Press to quickly return to instrument-default
control settings. Page 3--13.
based on selected channels. Page 3--11.
Press to access print dialog for
printing the display. Page 3--131.
Press to display the cluster of Setup Dialogs
for comprehensive set up of the instrument.
mouse. Page 3--60.
Select a waveform type, Channel,
Reference, or Math, to display or adjust on
screen (selected button lights). Page 3 --62.
press to select among displayed waveforms;
press again to turn a selected waveform off.
Page 3--62.
2- 8
Press to display and select a time base view not
selected, or to select among displayed views;
press selected timebase again to toggle it off
(except Main which is always on). Page 3--64.
Turn knobs to vertically scale, position, and
offset selected waveform. Page 3--8.
Turn knobs to Horizontally scale, position,
and set record length of selected waveform.
Page 3--10.
Use controls to set trigger level and lights
to monitor trigger state. Page 3--48.
CSA8000B & TDS8000B User Manual
Page 71

Display Map -- Single Graticule View
Drag cursors to measure
waveforms on screen.
Drag the Horizontal Reference to move
the point around which horizontal scaling
expands and contracts the waveforms.
Drag the Waveform Icon vertically
to position waveform.
Right click on a waveform or its
icon for handy access to often
used setup controls and properties.
Drag ground reference icon to add
offset to a waveform.
Drag across the waveform area to
zoom the boxed waveform segment
to full screen width.
CSA8000B & TDS8000B User Manual
2- 9
Page 72

Display Map -- Multiple Views
Drag the markers to enclose
the portion of waveform to
appear in Mag 2 View.
Drag the markers to enclose
the portion of waveform to
appear in Mag 1 View.
MAIN View
Mag View
Mag View
Drag the border between
graticules to vertically size
Main, Mag1, and Mag2
Views.
2- 10
CSA8000B & TDS8000B User Manual
Page 73

Front Panel I/O Map
Compartments for large
modules, up to two channels
Compartments for small
modules, up to eight channels
ANTISTATIC CONNECTION for
wrist strap, 1 MΩ to ground
TRIGGER
PRESCALE
input
TRIGGER
DIRECT
input
TRIGGER
PROBE
POWER
Floppy disk drive accessible
from Windows
INTERNAL CLOCK OUTPUT
DC CALIBRATION OUTPUT
EXTERNAL 10 MHZ REFERENCE INPUT
98
CSA8000B & TDS8000B User Manual
2- 11
Page 74
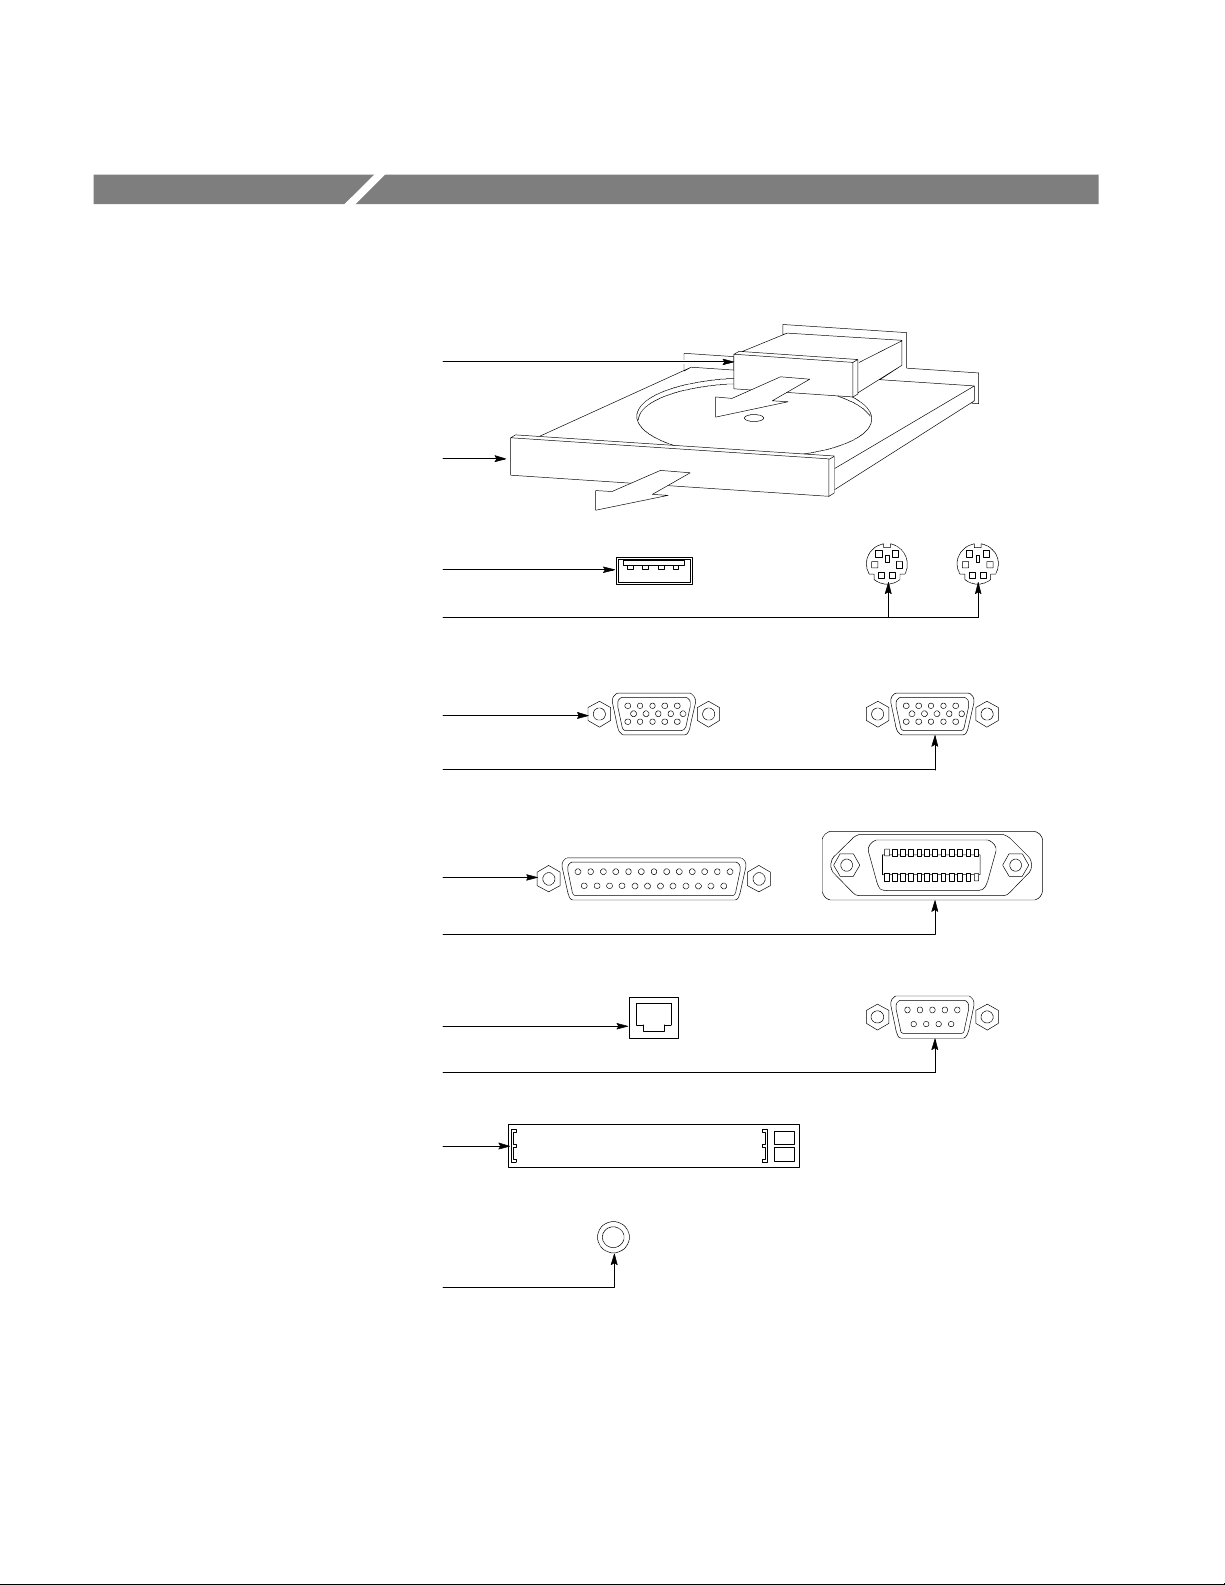
Rear Panel I/O Map
Removable hard disk drive to provide
individual environment for each user or to
secure data, press to release
CDROM drive accessible from
Windows, press to open
USB connector for mouse or
keyboard and mouse
PS-2 connectors for mouse and keyboard
Upper VGA port to connect a second
monitor for side-by-side display
Lower VGA port to connect a
monitor for oscilloscope display
Parallel port (Centronics) to
connect printer or other device
GPIB port to connect to controller
RJ-45 connector to connect to network
COM1 serial port
Card Bus slots for two PCMCIA type-1
cards, two type-2 cards, or one type-3
TRIGGER GATE (TTL)
1
PCMCIA card readers are not available on the following products: CSA8000B SN B020338 and above,
TDS8000B SN B020346 and above. Product software version 2.0 (or greater) does not support PCMCIA readers.
card
1
2- 12
CSA8000B & TDS8000B User Manual
Page 75
Overview
This chapter describes how the many features of the instrument operate. Please
note the following points on using this chapter:
H Each section in this chapter provides background information needed to
operate the instrument effectively as well as the higher-level procedures for
accessing and using the features. These procedures emphasize using the front
panel when possible.
H Lower-level, detailed usage procedures are in the online help system.
The table that follows lists the sections in this chapter.
Section Description Page no.
Acquiring Waveforms Provides an overview of capturing signals and digitizing them into waveforms 3--3
Triggering Provides an overview of the instrument trigger features and their use 3--39
Displaying Waveforms Provides an overview of display operation 3--53
Measuring Waveforms Provides an overview of the the cursors and automatic measurements tools this
instrument provides and how to use them
Creating Math Waveforms Provides an overview of how you can mathematically combine acquired waveforms and
measurement scalars to create a math waveform that supports your data-analysis task
Data Input and Output Provides an overview of the input and output capabilities of your instrument 3--113
Using Masks, Histograms,
and Waveform Databases
Accessing Online Help Provides an overview of the help system, which is integrated as part of the instrument
Cleaning the Instrument Provides instructions on how to clean the exterior of the instrument and its touch screen 3--175
Provides an overview of the statistical tools this instrument provides and how to use
them: mask testing, histograms, and waveform databases
user interface, and describes how to access it
3--73
3--101
3--141
3--167
CSA8000B & TDS8000B User Manual
3- 1
Page 76

Overview
3- 2
CSA8000B & TDS8000B User Manual
Page 77
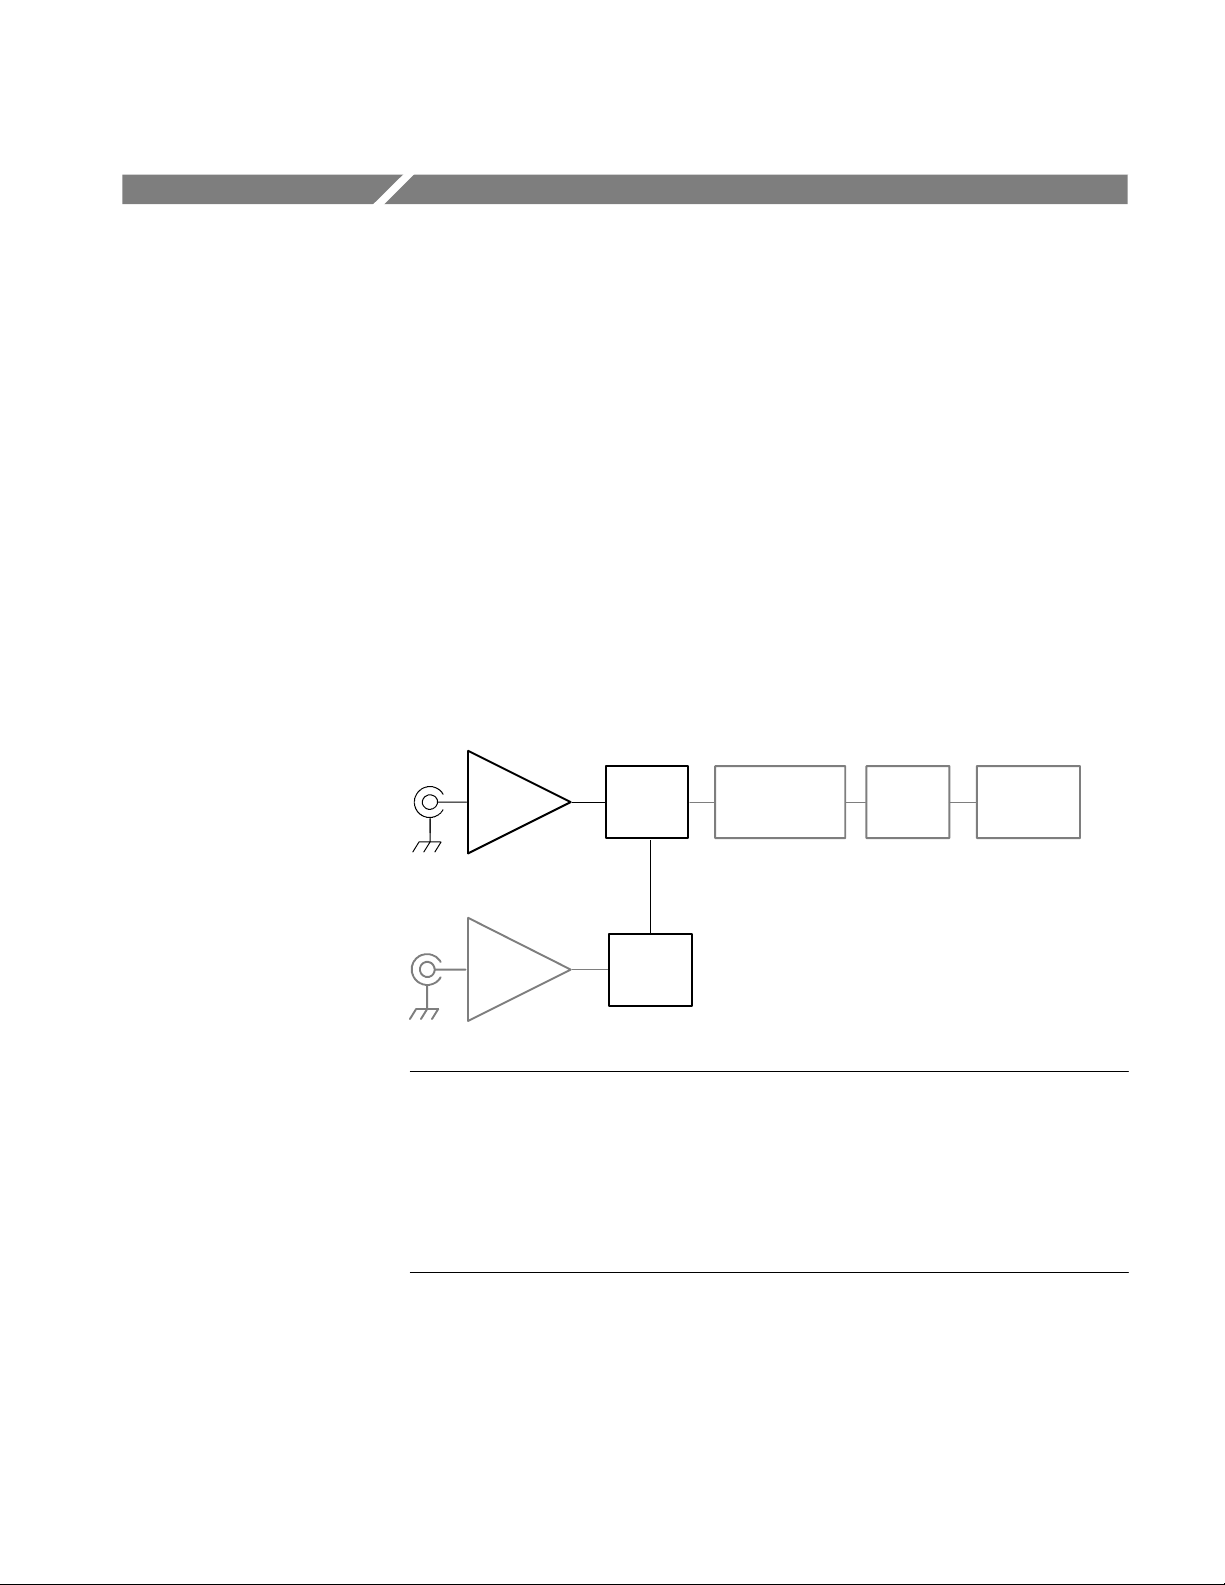
Acquiring Waveforms
Before you can display, measure, or analyze a waveform, you must acquire it
from a signal. This instrument comes equipped with the features you need for
capturing your waveforms. The following topics provide an overview of capturing signals and digitizing them into waveform records:
H Signal Connection and Scaling: How to connect signals to the instrument
channels; how to offset channels and position and scale the time bases for
acquiring waveforms; how to scale and position waveforms in the display.
H Setting Acquisition Contr ols: How to choose the appropr iate acquisition mode
for acquiring your wave for ms; how to start and stop acquisition.
H Acquisition Control Background: Information describing the data-sampling
and acquisition processes.
H FrameScan Acquisitions: How to use FrameScan acquisition to help analyze
pattern-dependent failures in high bit-rate communications signals.
Sampling
module
Trigger
system
Acquisition
system
Time base
system
Signal processing
& transformation
system
Output and
storage
User Interface
and display
NOTE. This section describes how the vertical and horizontal controls define the
acquisition of live, channel waveforms. These controls also define how all
waveforms are displayed, both live and derived waveforms (math and reference
waveforms). The following sections cover display-related usage:
H Displaying Waveforms on page 3--53.
H Creating Math Waveforms on page 3--101.
CSA8000B & TDS8000B User Manual
3- 3
Page 78
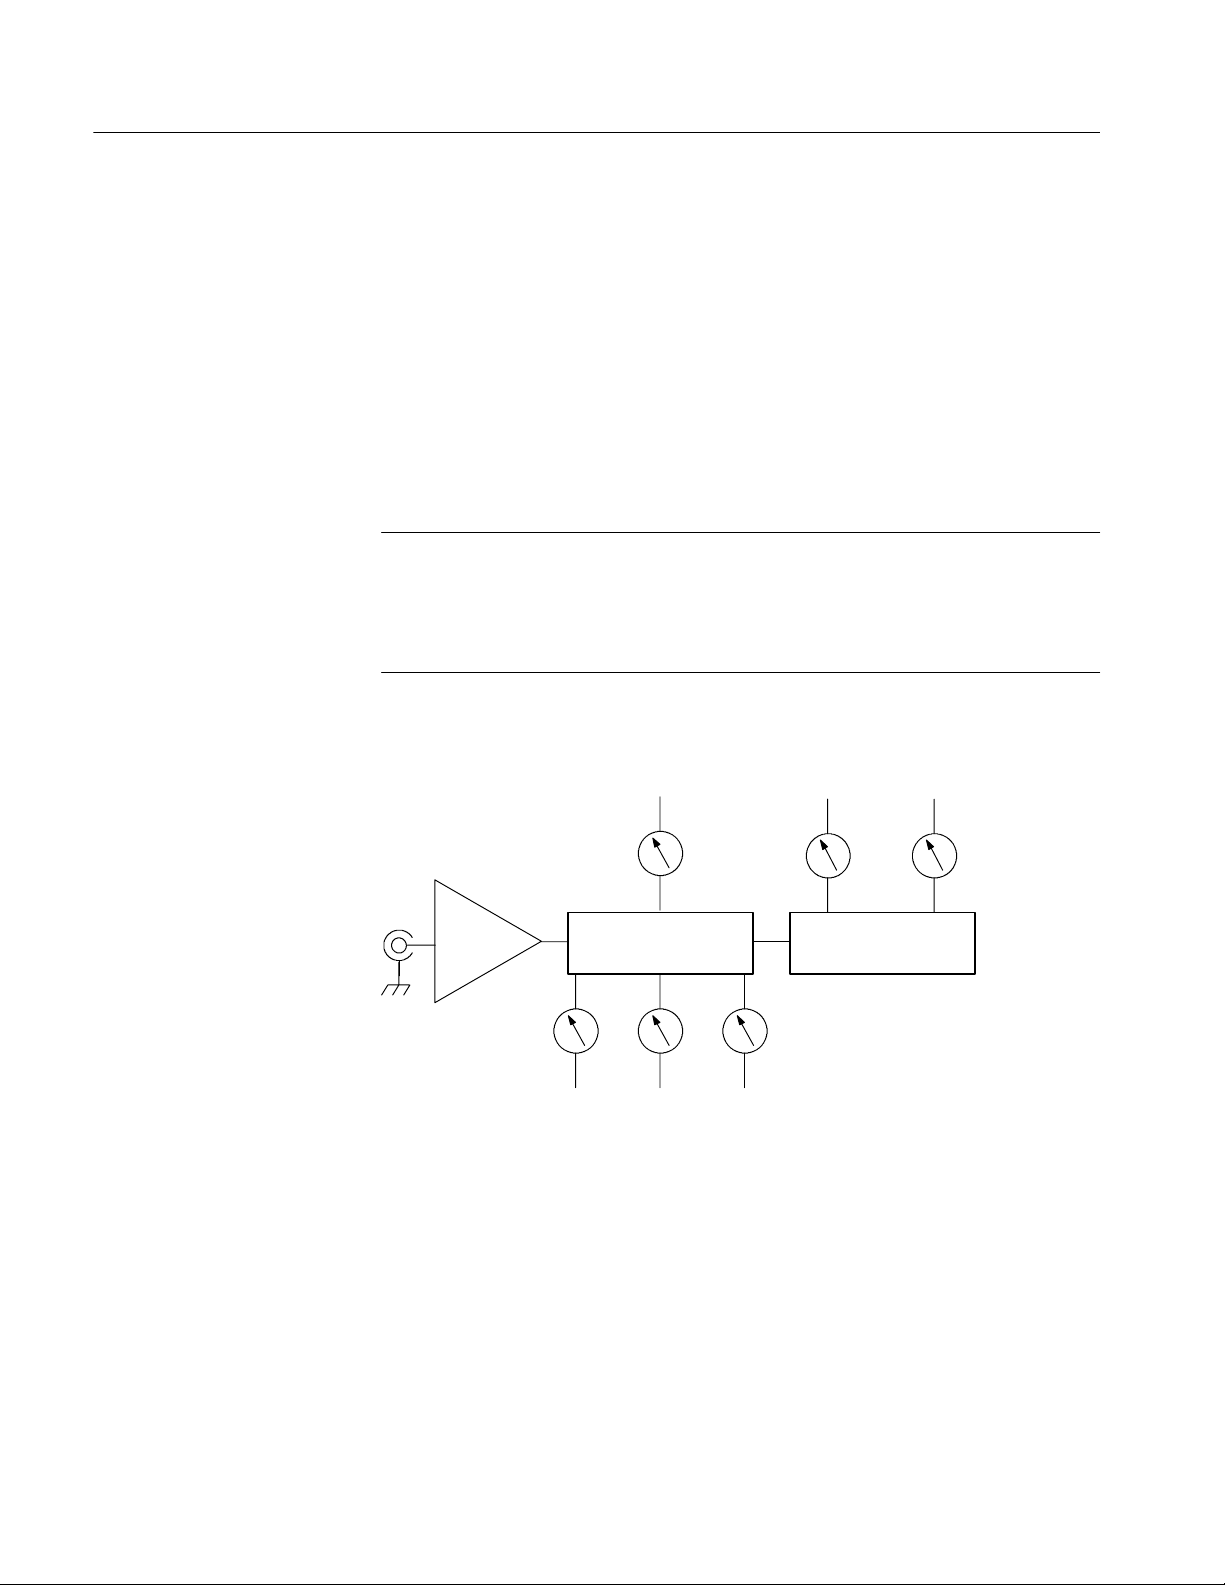
Acquiring Waveforms
Signal Connection and Scaling
This section presents an overview of the instrument features related to setting up
the input signal for digitizing and acquisition. It addresses the following topics:
H Where to find information for installing sampling modules and connecting
input signals
H How to turn on channels and adjust their vertical scale, position, and offset
H How to set the horizontal scale, position, and record length of the Main (time
base) View
NOTE. Terminology: This manual uses the terms vertical acquisition window and
horizontal acquisition window. These terms refer to the vertical and horizontal
range of the acquisition window, which defines the segment of the input signal
that the acquisition system acquires. The terms do not refer to any windows or
display windows on screen. See Conventions on page xii.
Why Use?
Sampling
module
Horizontal
scale
Verti cal
offset
Acquisition
system
Horizontal
position
Horizontal
record
length
Verti cal
position
Verti cal
scale
Display
system
Figure 3- 1: Acquisition and display controls
Use signal conditioning and scaling controls to ensure the instrument acquires
the data that you want to display, measure, or otherwise process. To ensure the
best possible data for further processing, you do the following:
3- 4
H Set vertical scale to adjust the waveform size on screen. Y ou can set vertical
offset to shift the vertical acquisition window up or down on the signal to
capture the portion you want.
CSA8000B & TDS8000B User Manual
Page 79

Acquiring Waveforms
H Set horizontal scale to control the time duration of the horizontal acquisition
window to capture as much as you want of the input signal(s). To control
where in the input signal (data stream) that the horizontal acquisition
window acquires, you set horizontal position to delay the window relative to
a trigger to capture the waveform portion you want. To increase or decrease
the resolution between sample points, change the record length.
For more background on the acquisition window concepts, see Signal Condition-
ing Background on page 3--13.
What’s Special?
What’s Excluded?
Keys to Using
A Versatile Autoset. Autoset can be defined to set up for a waveform edge, period,
or an eye/bit pattern. Pushing the Autoset button automatically sets up the
instrument controls for a usable display based on the property you choose and
the characteristics of the input signal. Autoset is much faster and easier than a
manual control-by-control setup. You can also reset the instrument to its factory
default settings by pushing the Default Setup button.
The vertical offset cannot be adjusted for any reference waveform, because a
reference waveform is a static, saved waveform, and offset adjusts the acquisition hardware for acquiring live waveforms. Also, TDR waveforms, if displayed
in rho or ohm units, cannot be adjusted for vertical offset.
The vertical offset of a math waveform cannot be adjusted directly. You can
adjust the offset of waveform sources (waveforms included in the math
expression) for the math waveform if the sources are live waveforms.
The key points that follow describe operating considerations for setting up input
scaling, offset, and position to properly acquire your waveforms.
Sampling Modules Selection and Signal Connection. Select the sampling module,
optical or electrical, that best fits your sampling task, whether it is connecting to
a fiber or electrical cable to test a digital data stream, or to a test fixture through
SMA cables to characterize a device. The connection to the sampling module
depends on your application.
Tektronix provides 80E00-series (electrical) and 80C00-series (optical) sampling
modules for this instrument; you can read about any sampling module and its
connections in the sampling-module user manual(s) that shipped with your
product. (Insert your sampling-module user manual(s) in Appendix C at the back
of this manual for ready reference.) You can also check your Tektronix catalog
for connection accessories that may support your application.
Up to eight acquisition channels are available, depending on the sampling
modules installed. Each channel can be displayed as a waveform or can
contribute waveform data to other waveforms (math and reference waveforms,
for example).
CSA8000B & TDS8000B User Manual
3- 5
Page 80

Acquiring Waveforms
CAUTION. Install sampling modules before applying power and before connecting them to the signals you want to test. See your sampling-module user manual
for instructions.
CAUTION. Sampling modules are inherently vulnerable to static damage. Always
observe static-safe procedures and cautions as outlined in your sampling-module
user manual.
Coupling Concerns. Electrical sampling modules provide only straight-DC
coupling to their sampling circuits, with no protection. All modules specify a
maximum vertical nondestructive range that limits signals to small levels,
typically about 2 to 3 volts (DC + AC
). (See Specifications in the user
pk-pk
manual for your sampling module for exact limits.) Do not exceed the limit, even
momentarily, as the input channel may be damaged.
All modules also specify a dynamic range that, if exceeded, could cause
acquisition and measurement errors due to nonlinearity. Do not exceed this limit.
(See Specifications in the user manual for your sampling module for exact
limits.)
NOTE. Optical sampling modules may have dynamic range exceeded without
obvious visual indications onscreen because the photo detector and/or filters
used may not necessarily be able to pass through overloaded signals to the
sampler.
Use external attenuators if necessary to prevent exceeding the limits just
described. Note that there are no hardware bandwidth filters in most sampling
modules or in the instrument. (Some optical sampling modules have bandwidth
filters settable from the Vertical Setup menu of the instrument. See the user
manual for your optical sampling module for more information.)
Scaling, Offset, and Positioning Considerations. These key controls determine the
portion of the input signal presented to the acquisition system:
H Set the vertic al offset to display the features of inter est on your waveform
and avoid clipping. (See Note that follows.) Adjust the display control
Vertical Scale to control the portion of the vertica l window displayed on
screen; adjust the display control Vertical Position to position the waveform
on screen. Note that vertical offset affe cts the vertica l acquisition window,
but vertical scale and position do not. These last two controls are display
controls only. Vertical Acquisition Window Considerations on page 3--14
describes the vertical acquisition window.
3- 6
CSA8000B & TDS8000B User Manual
Page 81

Acquiring Waveforms
Clipped
H Set horizontal scale, position, and resolution (record length) so that the
acquired waveform record includes the signal attributes of interest with good
sampling density on the waveform. The settings you make define the
horizontal acquisition window, described in Horizontal Acquisition Window
Considerations on page 3--17. (“Good sample density” might be at least
five samples on each waveform transition when acquiring for timing
measurements. The trade off for increased sample density is increased time
to acquire.)
NOTE. Waveform data outside the vertical acquisition window is clipped; that is,
the data is limited to the minimum and/or maximum boundaries of the vertical
acquisition window. This limiting can cause inaccuracies in amplitude-related
measurements. See Vertical Acquisition Window Considerations on page 3--14.
Trigger and Display. Set basic trigger controls to gate waveform acquisition, and
use the display to interactively set scale, position, and offset waveforms. See the
sections Triggering on page 3--39 and Displaying Waveforms on page 3--53.
Selected Waveform. Many of the controls of this instrument, especially the
vertical controls, operate on the selected waveform. The instrument applies all
actions that only affect one waveform at a time, such as applying a changes to
the vertical control settings, to the selected waveform.
NOTE. You can select a channel waveform, a math waveform, or a reference
waveform. The procedures here describe how to select and set up channel
waveforms for acquisition. See Displaying Waveforms on page 3--53 for
information regarding using the controls for adjusting display of reference and
math waveforms.
CSA8000B & TDS8000B User Manual
3- 7
Page 82

Acquiring Waveforms
Flexible Control Access. The product provides multiple methods for adjusting
acquisition controls. This manual focuses on basic setup through the front panel,
and the use of the User Interface (UI) Application displayed full screen. See the
display maps, beginning on page 2--9, for UI alternatives to controlling vertical
and horizontal setup. The online help system also documents the UI.
To Set Up the Signal Input
Use the procedure that follows when setting up the instrument to scale and
position input signals for acquisition.
CAUTION. Sampling modules are inherently vulnerable to static damage. Always
observe static-safe procedures and cautions as outlined in your sampling-module
user manual.
Overview To set the signal input Related control elements and resources
Prerequisites 1. The instrument must be installed with sampl ing modules
in place. The acquisition system should be set to run
continuously.
See the sampling-module user manuals for sampling
module installation. See page 3--24 for acquisition
setup and page 3--48 for trigger setup in this manual.
Connect the
input signal
Also, an appropriate trigger signal must be routed to the
instrument and triggering must be set up.
2. Connect to the signal to be acquired using proper
probing/connecting techniques. See the user manual for
the sampling module you have chosen.
Note: For more details on controlling vertical setup,
push the Vertical MENU button to display the Vertical
Setup dialog box, and then click its HELP button.
3- 8
CSA8000B & TDS8000B User Manual
Page 83

Overview Related control elements and resourcesTo set the signal input (cont.)
Acquiring Waveforms
Select the input
signal channel
Set the vertical
acquisition
window
3. Push the channel button (turns amber) to assign
the waveform buttons, 1 -- 8, to operate on
channel waveforms. Push a waveform button to
select the signal channel (it displays).
A waveform button lights when its channel is on:
H When on but not selected, its button is lighted
green.
H When on and selected, its button is lighted
amber.
Hint. To select one of the channels already
displayed, you can use a mouse and click its trace
or its reference indicator to select it.
4. Use the Vertical Offset knob to adjust the selected
waveform on screen. Use the Vertical Scale and
Position knobs to adjust the display.
Positioned vertically Scaled vertically
Offset vertically
CSA8000B & TDS8000B User Manual
3- 9
Page 84

Acquiring Waveforms
Overview Related control elements and resourcesTo set the signal input (cont.)
Set the
horizontal
acquisition
window
Continue with
the acquisition
setup
5. Push the View Main buttontomake sure the main time
base view is selected. Use horizontal knobs to scale and
position the waveform on screen and to set sample
resolution.
Positioned horizontallyScaled horizontally
The Resolution knob sets the record length. (See
discussion on page 3--19.)
Push Set to 50% if required to stabilize display.
6. To finish the acquisition setup, you must set the
acquisition mode and start the acquisition.
See To Set Up Acquisition Controls on page 3--24.
For more help 7. For more information on the controls described in this
procedure, push the Vertical or Horizontal MENU
button. Click the HELP buttoninthesetupdialogbox
that displays.
End of Procedure
3- 10
CSA8000B & TDS8000B User Manual
Page 85

Acquiring Waveforms
To Autoset the Instrument
With an input signal connected, use the procedure that follows to autoset based
on the characteristics of the input signal. Autoset operates on the selected
channel only.
Overview To autoset Control elements and resources
Prerequisites 1. The instrument must be installed with sampl ing modules
in place. Signals must be connected to channels. A
triggering source must be provided.
2. At least one channel must be turned on (its front-panel
button lighted).
Execute 3. Push the Autoset button to to execute an autoset on the
selected waveform.
If you use Autoset when one or more channels are
displayed, the instrument uses the selected channel for
horizontal scaling. Vertically, all channels in use are
individually scaled.
Note. Autoset can execute on live waveforms (either
channel or math) in the Main time base.
See the sampling-module user manuals for help with
installing sampling modules. See page 3--48 in this
manual for trigger setup information.
CSA8000B & TDS8000B User Manual
3- 11
Page 86

Acquiring Waveforms
Overview Control elements and resourcesTo autoset (cont.)
Define 4. Click Define Autoset in the Utilities menu to display
the Autoset properties dialog box. To change the autoset
criteria, select from:
H Edge to setup the default autoset for instrument to
acquire the waveform data such that the center
20% of the record contains a rising edge.
H Period to setup the default autoset for instrument
to acquire the waveform data such that the record
contains 2 or 3 periods.
H NRZ Eye to setup the default autoset for instru-
ment to acquire the waveform data as follows:
H one bit (two eye crossings) is displayed over
H the high/low values are displayed over about 6
about 7.5 horizontal divisions, centered on the
screen.
vertical divisions, also centered on screen.
For More
Information
H RZ Eye Pattern to setup the default autoset for
instrument to acquire the waveform data as follows:
H three rise/fall edges are displayed over the
center 6 horizontal divisions, with the first
rising edge placed near the 20% horizontal
location (second division).
H amplitude (the high/low values) is displayed
over the center 5 vertical divisions.
Click OK to set Autoset to use the current criteria. To
execute, push the Autoset button.
5. For more information on the controls described in this
procedure, push/click the HELP button in any dialog
box or select Help Contents and Index in the Help
menu.
End of Procedure
3- 12
CSA8000B & TDS8000B User Manual
Page 87

Acquiring Waveforms
NOTE. Autoset sets the vertical position to zero and adjusts the vertical offset to
center the signal in the display.
If a standard mask is active for the selected waveform, Autoset adjusts the
selected waveform record to match the mask, if possible. Autoset adjusts the
vertical scale and offset, horizontal scale, position, and reference parameters as
required for the mask standard.
To Reset the Instrument
You may want to revert to the factory default setup; if so, use the following
procedure to reset the instrument:
Overview To reset to factory defaults Control elements and resources
Prerequisites 1. The instrument is powered on and running.
See Power On Instrument on page 1--13.
Execute 2. Push the Default Setup button.
End of Procedure
Signal Conditioning
Background
This section contains background information that can help you more effectively
set up the acquisition window of each channel.
Input. This instrument samples sequentially, in order to provide superior
bandwidth and time resolution. Sequential sampling systems sample the input
without scaling it (they have a fixed dynamic range); therefore, input protection
and dynamic range are necessarily limited.
CAUTION. Do not overdrive the inputs. Also observe static-safe procedures and
cautions as outlined in the sampling-module user manual. Sampling modules are
very sensitive to ESD.
CSA8000B & TDS8000B User Manual
3- 13
Page 88

Acquiring Waveforms
Autoset Considerations. Autoset acquires samples from the input signal and
attempts to take the following actions based on the input data:
H Evaluate the amplitude range of the input signals and offset of the vertical
acquisition window to acquire the signal without clipping.
H Set the trigger level to the approximate midlevel of the trigger signal being
applied (either an external trigger or a clock-recovery trigger).
H Evaluate the signal transitions and set the horizontal scale to produce a
waveform display based on the Autoset mode selected: Edge, Period, or
Bit/Eye Pattern.
Sometimes Autoset cannot produce a correct display due to the nature of the
input signal; if so, you may have to adjust the scale, trigger, and acquisition
controls manually. Some conditions that can cause Autoset to fail are:
H no signal present.
H signals with extreme or variable duty cycles.
H signals with multiple or unstable signal periods.
H signals with too low amplitude.
H no recognizable trigger signal.
H no eye diagram waveform present when autosetting in Bit/Eye Pattern
autoset mode.
Vertical Acquisition Window Considerations. The size of the vertical acquisition
window is determined by the operating range of the the sampling module and
any probe connected to it. The vertical offset determines where the vertical
window is positioned relative to ground. Parts of the signal amplitude that fall
within the vertical window are acquired; parts outside (if any) are not (they are
clipped).
As an example, consider that a basic 80E00-series sampling module, with a
maximum 100 mV/div scale, covers 1 volt over 10 divisions. Changing the
vertical scale setting only changes how much of the vertical window displays on
screen; changing vertical position simply changes the space on the screen where
the data is displayed.
You can set the vertical scale, position, and offset of each channel independently
of other channels.
3- 14
CSA8000B & TDS8000B User Manual
Page 89

Acquiring Waveforms
The vertical scale and position controls do not affect the vertical acquisition
window, rather they adjust the display system to display the waveform as
follows:
H The vertical scale (per division) setting determines the portion of the vertical
acquisition window that appears in the graticule, allowing you to scale it to
contain all of the window or only part. Figure 3--2 shows two vertical
acquisition windows that contain the entire waveform, but only one window
contains the entire waveform in the graticule on screen.
a. Volts/Div setting determines the size of the display graticule within the vertical
acquisition window (scale set to 50 mv/div.)
+0.50 volt
Vertical window
+0.25 volt
C1
Graticule
--0.25 volt
--0.50 volt
b. Vertical position can change location of display graticule within ±5 divisions
(position set to --4 divisions)
Vertical window
C1
+0.50 volt
+0.45 volt
Graticule
--0.05 volt
Figure 3- 2: Setting vertical scale and position of input channels
CSA8000B & TDS8000B User Manual
--0.5 volt
3- 15
Page 90

Acquiring Waveforms
NOTE. Amplitude-related automatic measurements (for example, peak-to-peak
and RMS) will be accurate for vertical windows like those shown in
Figure 3--2 a and b on page 3--15 because neither waveform is clipped (that is,
both waveforms are acquired). But if the signal amplitude were to extend outside
the vertical acquisition window, the data acquired becomes clipped. Clipped
data causes inaccurate results if used in amplitude-related automatic measurements. Clipping also causes inaccurate amplitude values in waveforms that are
stored or exported for use in other programs.
H The vertical position adjusts the display of the graticule relative to the
vertical acquisition window (position is a display control). Figure 3--2 b
shows how vertical position moves the waveform graticule vertically in the
vertical acquisition window to place the acquired waveform in the graticule
display. Position does not determine what data is acquired as does vertical
offset.
The vertical offset control affects the vertical acquisition window and the
displayed waveform as follows:
H The vertical range (window) is always centered around the offset value that
is set. Vertical offset is the voltage level at middle of the vertical acquisition
window. With no (zero) offset (see Figure 3--3), that voltage level is zero
(ground).
H As you vary vertical offset, the middle voltage level moves relative to zero.
This moves the vertical acquisition window up and down on the waveform.
With input signals that are smaller than the window, it appears the waveform
moves in the window. Actually, a larger signal shows what really happens:
the offset moves the middle of the vertical acquisition window up and down
on input signal. Figure 3--3 shows how offset moves the acquisition window
to control the portion of the waveform amplitude the window captured.
H Applying a negative offset moves the vertical range down relative to the DC
level of the input signal, moving the waveform up on the display. Likewise,
applying a positive offset moves the vertical range up, moving the waveform
down on the display. See Figure 3--3.
NOTE. On screen, the channel icon in the waveform bar points to the offset value
around which the vertical acquisition window is centered. The offset value
pointed to is relative to the ground reference icon. Both icons are shown in
Figure 3--3.
3- 16
CSA8000B & TDS8000B User Manual
Page 91

Acquiring Waveforms
Vertical window = 1 V peak-to-peak (fixed by sampling module used)
Offset +300 mV
(Near waveform top level)
Offset 0.0 V
(At waveform ground reference)
Offset --300 mV
(Waveform bottom level)
C1
C1
C1
Acquisition window shifts
positive to capture overshoot
Acquisition window shifts
negative to capture preshoot
Figure 3- 3: Varying offset positions vertical acquisition window on waveform
amplitude
NOTE. Measurements use the entire portion of the waveform that the vertical
window captures, not only the portion displayed on screen. Also, waveforms
exported or saved (from the File menu or over the GPIB) contain data from the
entire vertical window, not just the on-screen portion.
Horizontal Acquisition Window Considerations.You define the horizontal
acquisition window, that is, you set several parameters that determine the
segment of an incoming signal that becomes the waveform record when
acquired. (For background, please read Waveform Record on page 3--28.) These
common parameters specify a common horizontal acquisition window that is
CSA8000B & TDS8000B User Manual
3- 17
Page 92
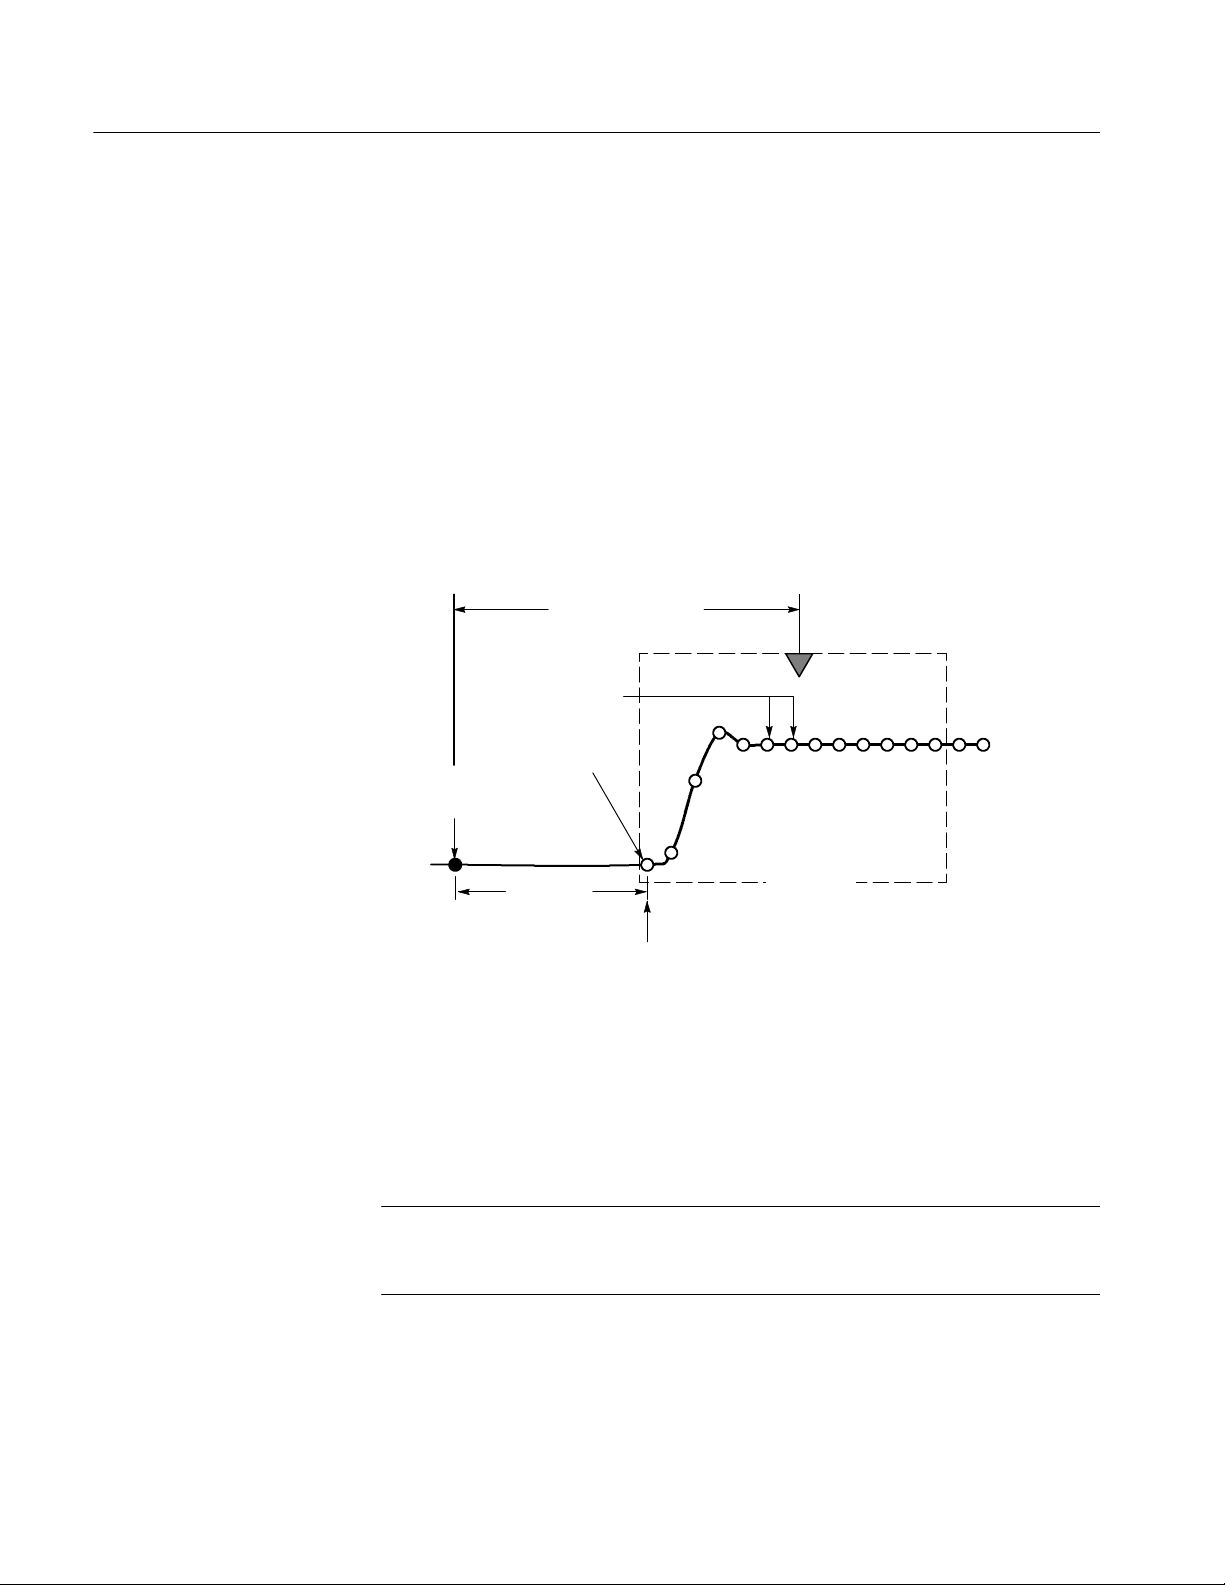
Acquiring Waveforms
applied to all channels in parallel. (See Independent vs. Shared Window on
page 3--20.) These parameters are:
H The external trigger signal that you input and set the trigger system to
recognize determines the point relative to the input waveform that triggers
the instrument.
H The horizontal position you set determines the horizontal delay from the
trigger point to the first sample point in the acquisition window.
H The horizontal scale you set, and the requirement that all waveforms fit
within the 10 horizontal-division display, determines the horizontal duration
of the window relative to any waveform, allowing you to scale it to contain a
waveform edge, a cycle, or several cycles.
Horizontal position
Sample interval
First sampled and
digitized point
Trigger event on
Ext. trigger signal
Horizontal
Horizontal
delay
Time of first point
acquisition
window
Figure 3- 4: Horizontal acquisition window definition
H The record length (along with the horizontal scale) you set for the 10-divi-
sion window determines the sample interval (horizontal point spacing or
resolution) on the waveform.
NOTE. The horizontal position controls the distance to the Horizontal Reference
to indirectly set the time to the first sampled point. See Horizontal Position and
the Horizontal Reference on page 3--59 for a discussion of this relationship.
3- 18
CSA8000B & TDS8000B User Manual
Page 93

Acquiring Waveforms
Horizontal Scale vs. Record Length vs. Sample Interval vs. Resolution. These
parameters all relate to each other and specify the horizontal acquisition window.
Because the horizontal acquisition window must fit in the 10 horizontal division
display, for most cases, you just set the duration of the horizontal acquisition
window (10 divs x the scale setting) as described in (1) below. By also setting a
record length in samples, you indirectly set the resolution/sample interval/sample
rate for the horizontal acquisition window (waveform record). The relationships
between these horizontal elements follow:
1. Time Duration (seconds) = 10 divs (window size) x Horizontal Scale
(sec/div)
2. Time Duration (seconds) = Sample Interval (seconds/sample) x Record
Length (samples),
where:
Time Duration is the horizontal acquisition window time duration
3. Sample Interval (sec/sample) = Resolution (sec/sample) = 1/Sample Rate
(samples/sec)
In (2) above, note that it is Sample Interval that varies indirectly to accommodate
the window time duration (and its scale setting) and the Record Length setting as
these later two elements can be set by you. These elements behave as follows:
H If Record Length or Time Duration vary, Sample Interval varies to accom-
modate, up to highest sample rate/lowest sample interval/highest resolution.
H If you set faster Horizontal Scale settings, decreasing Time Duration, and the
Sample Interval reaches its lower limit, the horizontal scale becomes limited
to a setting compatible with the record length and the lower limit of the
sample interval.
H If you attempt to set longer Record Lengths and the Sample Interval reaches
it lower limit, Time Duration remains constant and the record length
becomes limited. The equation becomes:
Maximum Record Length = Time Duration ÷ Min Sample Interval
For example, at 1 ps/div and 10 divisions, the record length must be no more
than 1000 points:
Max Rec Length 1000 samples = (10 divs x 1ps/div) ÷ 0.01 ps/sample
Max Rec Length = 1000 samples
CSA8000B & TDS8000B User Manual
3- 19
Page 94
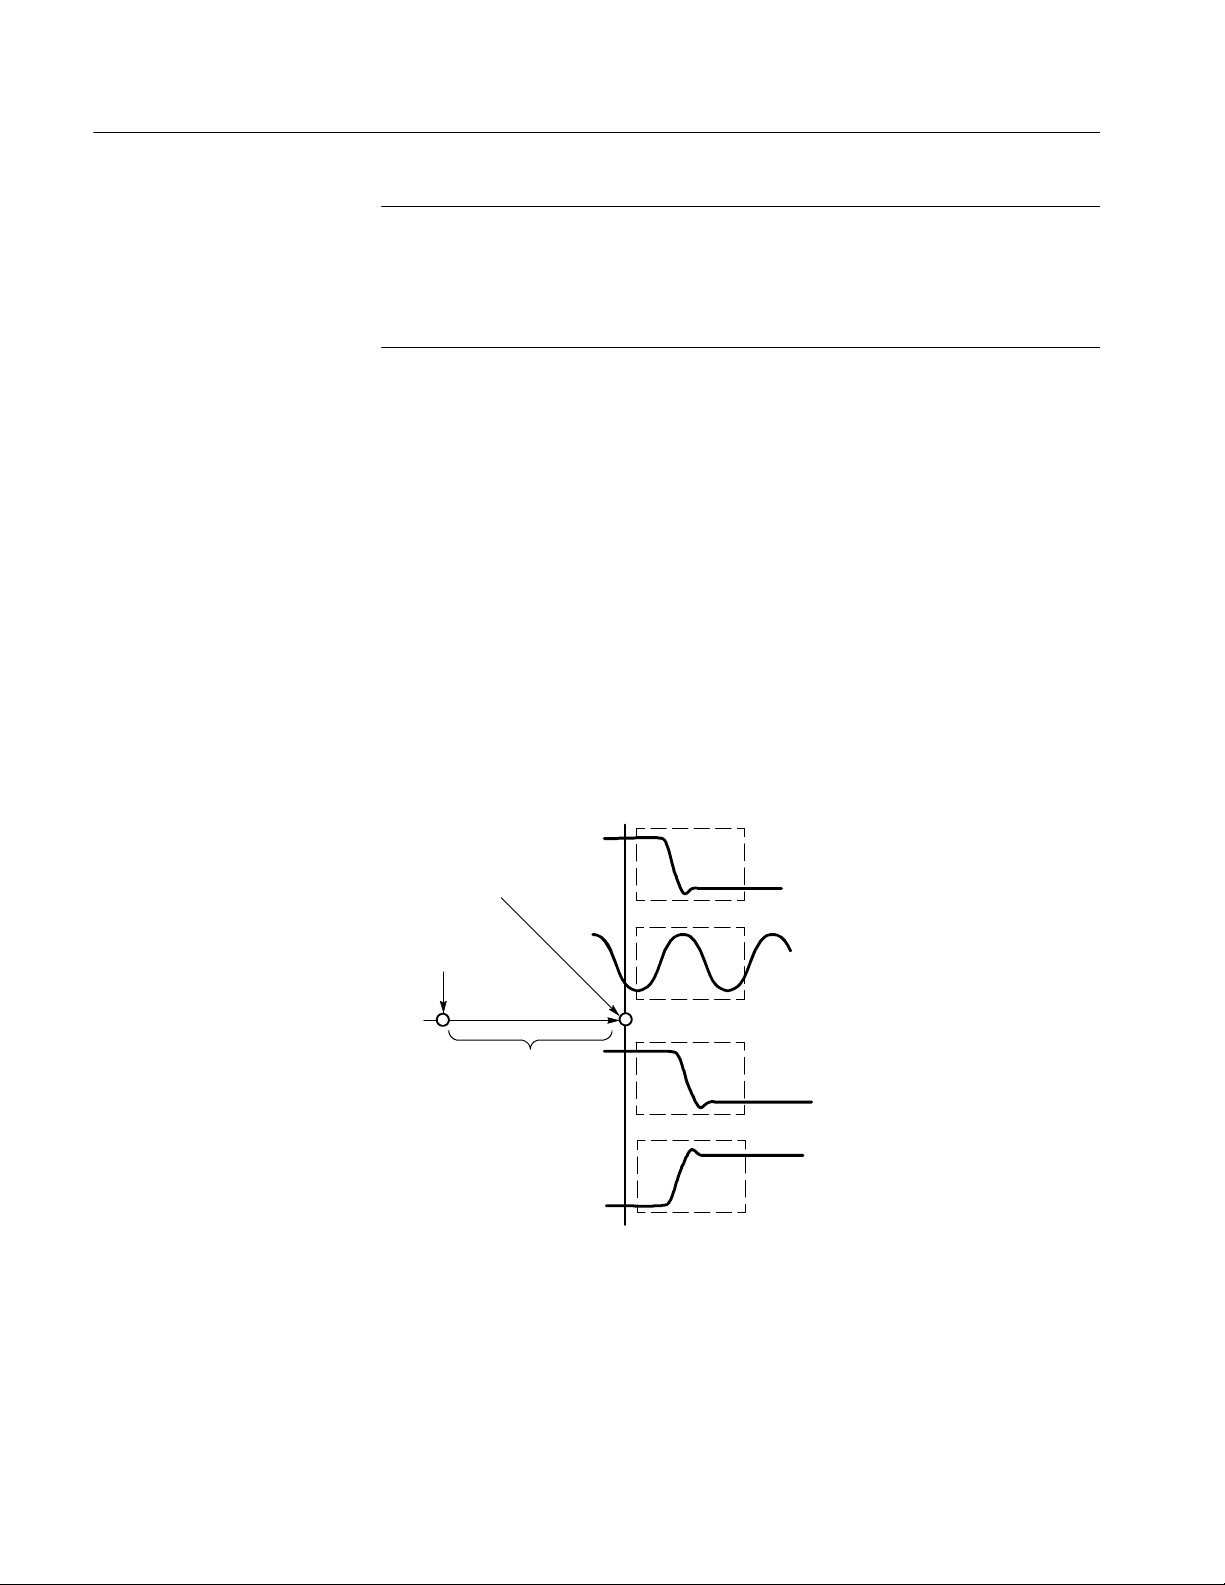
Acquiring Waveforms
NOTE. Resolution and the equivalent elements, sample interval and sample rate
(see equation 3 above), are not settable directly, but are derived. You can,
however, check the resolution at anytime in the r esolution readout (push the
Horizontal Menu button). Also note, that the Resolution knob actually adjusts
the record length to increase sample density (detail).
Independent vs. Shared Window. For a given time base, the instrument applies the
same horizontal acquisition window to all channels from which it acquires data.
Unlike the vertical acquisition window that you set independently for each
channel, the same time/division, resolution (record length), and horizontal delay
(from the same trigger point) that you set for a time base, apply to all channels in
that time base. In other words, one trigger, from a single trigger source, will
locate a common horizontal acquisition window on all active channels, which
you can shift by setting the horizontal position control.
The horizontal acquisition window determines the waveform records extracted
from all signals present at all active channels and math waveforms. You can
think of the horizontal acquisition window as cutting across any input signals
present in the input channels to extract the same slice of time into waveform
records. See Figure 3--5.
Common record start
point and record length
Common trigger
Common horizontal
delay
Ch1 record
Ch2 record
Ch3 record
Ch4 record
Figure 3- 5: Common trigger, record length, and acquisition rate for all channels
3- 20
CSA8000B & TDS8000B User Manual
Page 95
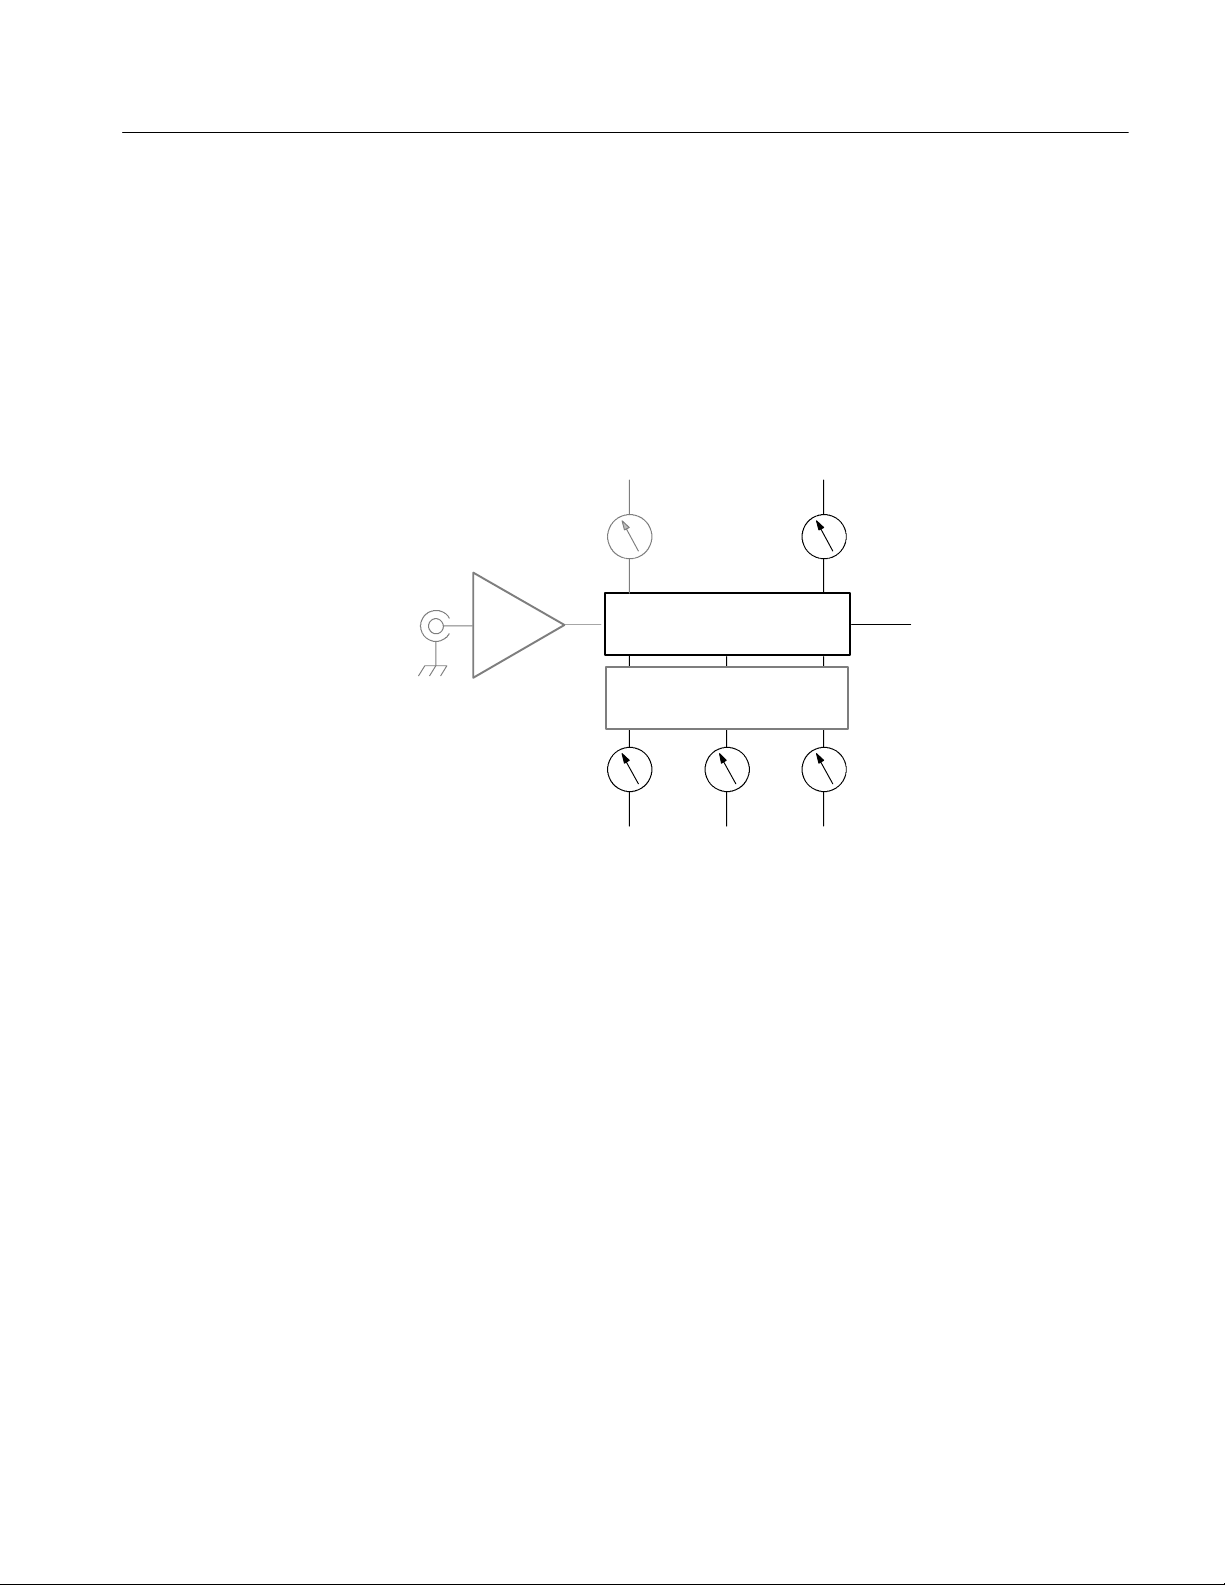
Setting Acquisition Controls
This section overviews the instrument acquisition features—those that start and
stop acquisitions and those that control how the instrument processes the data as
it is acquired (just sampled, or averaged or enveloped). Special features, keys to
using, and operation controls are covered.
Acquiring Waveforms
Why Use?
Sampling
module
Verti cal
offset
Horizontal
scale
Acquisition
system
Time bases
Horizontal
position
Acquisition
mode
Record
length
Use the acquisition controls to optimize and tailor the acquisition of your
waveforms. The mode controls described here operate on the data as the
instrument acquires it—perhaps to reduce noise in the waveform record or to
capture a record of min/max values for each data point in the waveform record.
The acquisition controls also let you start and stop acquisition, as well as take
certain actions after acquisition stops, such as to print the acquired waveform.
What’s Special?
Stop After Options. You can set the condition upon which acquisition stops, such
as after a number of acquisitions or a number of mask hits you specify. You can
set the instrument to save waveforms or print the screen to a file or printer.
FrameScan Acquisition. You can alter the normal acquisition cycle to produce a
waveform record suitable for acquiring and analyzing Pseudo-Random Bit
Streams (PRBS’s), which are contained within a repeating data frame. See
FrameScan Acquisitions on page 3--30 for more information on using FrameScan
acquisitions.
CSA8000B & TDS8000B User Manual
3- 21
Page 96

Acquiring Waveforms
What’s Excluded?
Keys to Using
Envelope acquisition mode can not be used with FrameScan acquisitions; you
must use Sample or Average modes.
The key points that follow describe operating considerations for setting up the
acquisition system so the waveforms acquired best fit your requirements.
Acquisition Modes. Consider the mode you want to use to acquire data:
H Sample - the instrument does no post-processing of acquired samples.
H Average - the instrument processes the number of waveforms you specify
into the acquired waveform, creating a running exponential average of the
input signal.
H Envelope - the instrument retains the running minimum (Min) and maximum
(Max) values in adjacent sample intervals continuously, as subsequent
waveforms are acquired, creating an envelope of all waveforms acquired for
that channel.
Acquiring and displaying a noisy square wave signal illustrates the difference
between the three modes. Note how Average reduces the noise while Envelope
captures its extremes:
3- 22
Sample
Average
Envelope
Acquisition Control. Also, consider how you want to control acquisition; you
have two main options, either settable from the Acquisition Setup dialog box
(push Acquisition MENU to display):
H Run/Stop Button Only - sets the instrument to start and stop the acquisition
only when you use the Run/Stop button, which is available on the front
panel, on the application toolbar, and in the Acquisition Setup dialog box. If
toggled to Run, acquisition will start if a valid trigger occurs. If toggled to
Stop, acquisition stops immediately.
H Condition - in addition to Run/Stop Button, which can always stop
acquisition, the stop-after control provides additional conditions you can
select from to stop an acquisition. See step 4, Set the Stop Mode and Action,
on page 3--25, or access the online help in the Acquisition Setup dialog box
for more information.
CSA8000B & TDS8000B User Manual
Page 97

Acquiring Waveforms
Global Controls. Like the horizontal controls, the acquisition controls apply to all
active channels. For example, channel 1 cannot acquire in Sample mode while
channel 2 acquires in Envelope mode; you cannot stop channel 8 from acquiring
(if turned on) while other channels continue to acquire. Unlike horizontal
controls, acquisition settings extend across time bases: you cannot set a different
sample mode for channels acquired in the Mag1 time base; the sample mode you
set extends across the Main, Mag1 and Mag2 time bases.
Preventing Aliasing. Under certain conditions, a waveform may be aliased on
screen. Read the following description about aliasing and the suggestions for
preventing it.
When a waveform aliases, it appears on screen with a frequency lower than that
of the input signal or it appears unstable even though the TRIG’D light is lit.
Aliasing occurs because the instrument sample interval is too long to construct
an accurate waveform record. (See Figure 3--6.)
Actual high-frequency waveform
Apparent low-frequency
waveform due to aliasing
Sampled points
Figure 3- 6: Aliasing
Methods to Check and Eliminate Aliasing. To quickly check for aliasing, slowly
adjust the horizontal scale to a faster time per division setting. If the shape of the
displayed waveform changes drastically or becomes stable at a faster time base
setting, your waveform was probably aliased. You can also try pressing the
AUTOSET button to eliminate aliasing.
To avoid aliasing, be sure to set resolution so that the instrument samples the
input signal at a rate more than twice as fast as the highest frequency component.
For example, a signal with frequency components of 500 MHz would need to be
sampled with a sample interval less than 1 nanosecond to represent it accurately
andtoavoidaliasing.
CSA8000B & TDS8000B User Manual
3- 23
Page 98

Acquiring Waveforms
To Set Acquisition Modes
Use the procedure that follows to set the data-acquisition mode and specify
acquisition start and stop methods. For more detailed information, display online
help when performing the procedure.
Overview To set acquisitions modes Control elements and resources
Prerequisites 1. Instrument must be installed with sampling modules in
place before powering on the instrument. Instrument
must be powered up, with horizontal and vertical
To select an
Acquisition mode
Select the
Acquisition mode
controls setup. Triggering should also be set up.
2. Push the Acquisition MENU button to display the Acq
Setup dialog box.
3. Click an option button to select the acquisition mode;
choose from the following modes:
H Sample
H Average
See the sampling-module user manuals for sampling
module installation. See page 3--48 for trigger setup.
Set a
sample count
H Envelope
For Average mode only, enter the number of samples to
to average in the Average box.
3- 24
CSA8000B & TDS8000B User Manual
Page 99

Overview Control elements and resourcesTo set acquisitions modes (cont.)
Acquiring Waveforms
Set the Stop
mode and action
4. Under Stop After, click one of the following options:
H Run/Stop Button Only
H Condition
5. If you selected Condition, choose a condition from the
drop-down list, such as Number of Acquisitions or
Mask Total Hits, to stop on. If the condition requires a
count (count box is enabled), enter a count.
6. Select a Stop After action from the drop-down list box.
Choose from the following actions:
H None
H Print Screen to File
H Print Screen to Printer
H Save all Waveforms
Enter a filename for saving to if you’ve selected Print to
File or Save all Waveforms.
7. Click to check Ring Bell if you want audio notice when
acquisition stops.
Start acquisition 8. Push the RUN/STOP front-panel button to begin
acquiring.
End of Procedure
See To Start and Stop Acquisition on page 3--26.
CSA8000B & TDS8000B User Manual
3- 25
Page 100

Acquiring Waveforms
To Start and
Use the procedure that follows to start and stop acquisition.
Stop Acquisition
Overview To start and stop acquisition Control elements and resources
Prerequisites 1. Instrument must be installed with sampling modules in
place before powering on the instrument. Instrument
must be powered up, with horizontal and vertical
To start
acquiring
To s top
acquiring
controls set up. Triggering should also be set up.
2. Make sure all the channels to be acquired are turned on
(use the channel buttons; see page 3--9 if needed).
Then push the RUN/STOP button to begin acquiring.
3. Push the RUN/STOP button to stop acquisition.
Acquisition will also stop when acquisition finishes if a
selected stop condition is satisfied (see step 4 on
page 3--25) or if triggering ceases while in Normal
trigger mode.
See sampling-module user manuals for sampling
module installation. See page 3--24 for acquisition
setup and page 3--48 for trigger setup in this manual.
To clear an
acquisition
For more
information
4. Push the Acquisition CLEAR DATA button to discard the
acquired data in all channels.
5. For more information on the controls described in this
procedure, push the Acquisition MENU button. Click the
HELP button in the setup dialog box that displays.
Also, see references listed at right.
See To Set Up Acquisition Modes on page 3--24.
End of Procedure
3- 26
CSA8000B & TDS8000B User Manual
 Loading...