

Page 1

Power Analysis Demo Guide
LAB 5: FREQUENCY RESPONSE ANALYSIS
Control Loop Response (Bode Plot) and Power Supply Rejection Ratio (PSRR)
NOTE: Some minor details in the screen shots in this document may differ from the instrument you are using.
NOTE: Always use the latest instrument software for demonstrations. Go to www.tek.com/software and search for “5 Series MSO”
software. Follow the installation instructions on the web page.
1 5-PWR Demo Guide
Page 2

5 Series/Series 6 MSO Power Analysis Lab
POWER TRAINING GUIDE
2 Control Loop Kit Demo Guide
INTRODUCTION
The stability of a control loop determines the closed loop
performance of most key aspects of the power supply.
An unstable power supply can oscillate, resulting in very large
ripple, poor step load response, and excessive noise and EMI.
A power supply does not have to be fully oscillating to be
inadequate. The control loop stability controls PSRR, dynamic
response and output impedance. Poor stability means that all
these responses will also be poor.
Because the performance is not simply pass or fail, and
changes with part tolerances over the life of the power supply, it
is extremely important to understand the initial performance.
The Bode plot is the generally accepted method for assessing
the stability of a loop. A Frequency Response Analyzer, or FRA,
is used to measure the Control Loop Response, popularly
known as Bode plot, and the Power Supply Rejection Ratio
(PSRR); two key metrics of power supply performance.
The Bode plot is ideally measured with a FRA but now, due to
the addition of specialized software, can also be obtained using
oscilloscopes, along with a built-in or external function
generator.
The control loop response computes and plots gain as 20 log
(Vout / Vin). Phase margin is measured at the gain crossover
frequency, which occurs at the frequency where the gain plot
crosses 0 db. The corresponding point on the phase plot gives
the phase margin. The Gain Margin is calculated using the
Phase Margin.
In this app note the Picotest VRTS1.5 demo board (adjustable
regulator board) is used to demonstrate this test.
An injection transformer is used for connecting the FRA to the circuit
being tested for control loop stability measurements. The goal of the
transformer is to inject a signal into the control loop being
measured, without impacting the performance of the loop. In order
to accomplish this to a reasonable degree, the transformer is
isolated and, therefore, is capable of floating on a high voltage, such
as a Power Factor Corrector (PFC), which is often close to 400VDC.
The usable bandwidth of an injection transformer is significantly
greater than the 3dB frequency limits. Because the transformer
bandwidth itself is outside of the measurement, it leads many to
incorrectly believe that the transformer is a non-critical element.
The bandwidth of the transformer is strongly related to the
terminating impedance. Most network analyzers provide a 50Ohm
oscillator source impedance. Assuming this impedance, the optimal
termination resistor is 5 Ohms. This significantly attenuates the
injection signal, which is beneficial, as a common error in Bode
measurements is using a signal which is too large, and therefore not
a small signal measurement. An added benefit of this low value is
that it can always be left in circuit, simplifying the connection to the
network analyzer or scope without appreciably impacting the output
voltage of the circuit being tested.
Picotest supports the oscilloscope stability testing with three
injection transformer options for different circuit applications as
discussed below.
Page 3

5 Series/Series 6 MSO Power Analysis Lab
POWER TRAINING GUIDE
3 Control Loop Kit Demo Guide
Control Loop Analysis
This guide provides step-by-step instructions and introduces the
capabilities of the 5/6Series MSO FRA measurements.
The first step is to set up the test so that the injection signal from
the built-in signal generator can be used to inject an AC signal
into the control loop. An injection resistor (5-10 ohms) in the
feedback path is required. An injection transformer is used to
inject the signal across the resistor.
Shown below is the Bode plot measurement test setup.
What You Will Need
❑
MSO 54 / MSO 64, 5 series / 6 series MSO Scope
❑
5-PWR /6-PWR Power Measurement and Analysis SW
❑
5 -AFG / 6-AFG Arbitrary / Function Generator
❑
Two TPP0502 500 MHz, 2X TekVPI® passive voltage probe
❑
Picotest Injection transformer
(https://www.picotest.com/tektronix.html) to inject signal from
the AWG into your control loop through your injection
resistor
− Picotest J2100A 1Hz - 5MHz, supports PFC regulators
5MHz high enough for most supplies, low distortion, 5
Ohm termination for minimum impact to loop
− Picotest J2101A 10Hz – 45MHz, 10Hz supports off-line
power supplies, 45MHz high enough for state-of-the art
regulators
− Picotest J2110A Active Injector DC-45MHz
❑
Sample DUT Board: Picotest makes two good training test
boards - VRTS1.5 (left) and the VRTS3 (right)
These demonstration boards are self‐contained and
designed to support a wide range of typical distributed
power system measurements including Bode plots and
PSRR. Input power is provided via a USB port.
− 1 BNC-BNC Cable
− 2 sets of banana plug to mini-grabber cables
− DC Power supply (Keithley 2230-3-1 or 8Vmin)
Objectives
- Obtain a basic understanding of the FRA and PSRR
measurements in a power supply.
- Learn how to make FRA measurements with a 5 /6 Series
MSO oscilloscope.
Page 4

5 Series/Series 6 MSO Power Analysis Lab
POWER TRAINING GUIDE
4 Control Loop Kit Demo Guide
CONTROL LOOP MEASUREMENT
This demo setup requires the use of two TPP0502 probes to
measure the Bode plot.
Setting up:
❑
Select Measure Menu of the 5 Series Scope and verify the
PWR option is available. Under the PWR tab Control Loop
Analysis there are three measurements; FRA, PSRR and
Impedance.
❑
Push the front panel Default Setup button of the 5 Series
Scope to set the oscilloscope into a known state.
❑
Tap the Add New Measure button in the upper right corner
of the display to launch the Measurement configuration
menu.
❑
Tap the Power tab at the top of the menu.
❑
Tap the Frequency Response Analysis panel title to
display the panel.
❑
Tap the Control Loop Analysis measurement button.
❑
Connect a TPP0502 probe to channel 1 of the oscilloscope
and connect the + input of the probe to the TP4 (1) test
point.
❑
Connect the - input of the probe to the GND test point at
TP6/TP2.
❑
Connect the 2
nd
TPP0502 probe to channel 2 of the
oscilloscope and connect the + input of the probe to the TP3
(2) test point as shown above.
❑
Connect the – input of the probe to the TP2/TP6 GND test
point at the top of the board.
❑
Connect the oscilloscope AFG Out to the input of
Picotest J2101A injection transformer using a BNC
Cable.
❑
Connect the injection transformer output to the Picotest
VRTS1.5 test board at the input test points to TP4 (- Ve)
and TP3 (+ Ve).
❑
Connect a DC 7-10V power supply to the board.
Signal
Test points
AFG + J2101A
TP3 (Red lead) and TP4 (Black lead)
TPP0502 to Scope
Ch1
TP4 (-Ve) and GND TP2/TP6
TPP0502 to Scope
Ch2
TP3 (+Ve ) and GND TP2/TP6
DC Power Supply
to VRTS1.5
TP1 (+Ve ) and GND TP2/TP6
Note: Please make sure switch 1 is on and 2 is off for a
successful Bode demo. Use a short lead between J2101A
and LDO.
Refer to the below setup diagram and check all these above
connections and test points of Picotest LDO board and injection
transformer.
❑
Tap the Add button.
❑
Tap outside the configuration menu to dismiss it.
Actual connection:
❑
Double-tap the Power 1 measurement results badge in the
Results Bar to launch the configuration menu.
Note: If the software shows the Phase Margin first, please
check connections and re-run the test. Note: the voltage
reference is connected to the output voltage and not to ground.
For this reason, the measurements for both Ch1 and Ch2 are
referenced to Vout and not ground. In most of the applications
the probes will connect to ground.
Page 5
5 Series/Series 6 MSO Power Analysis Lab
POWER TRAINING GUIDE
5 Control Loop Kit Demo Guide
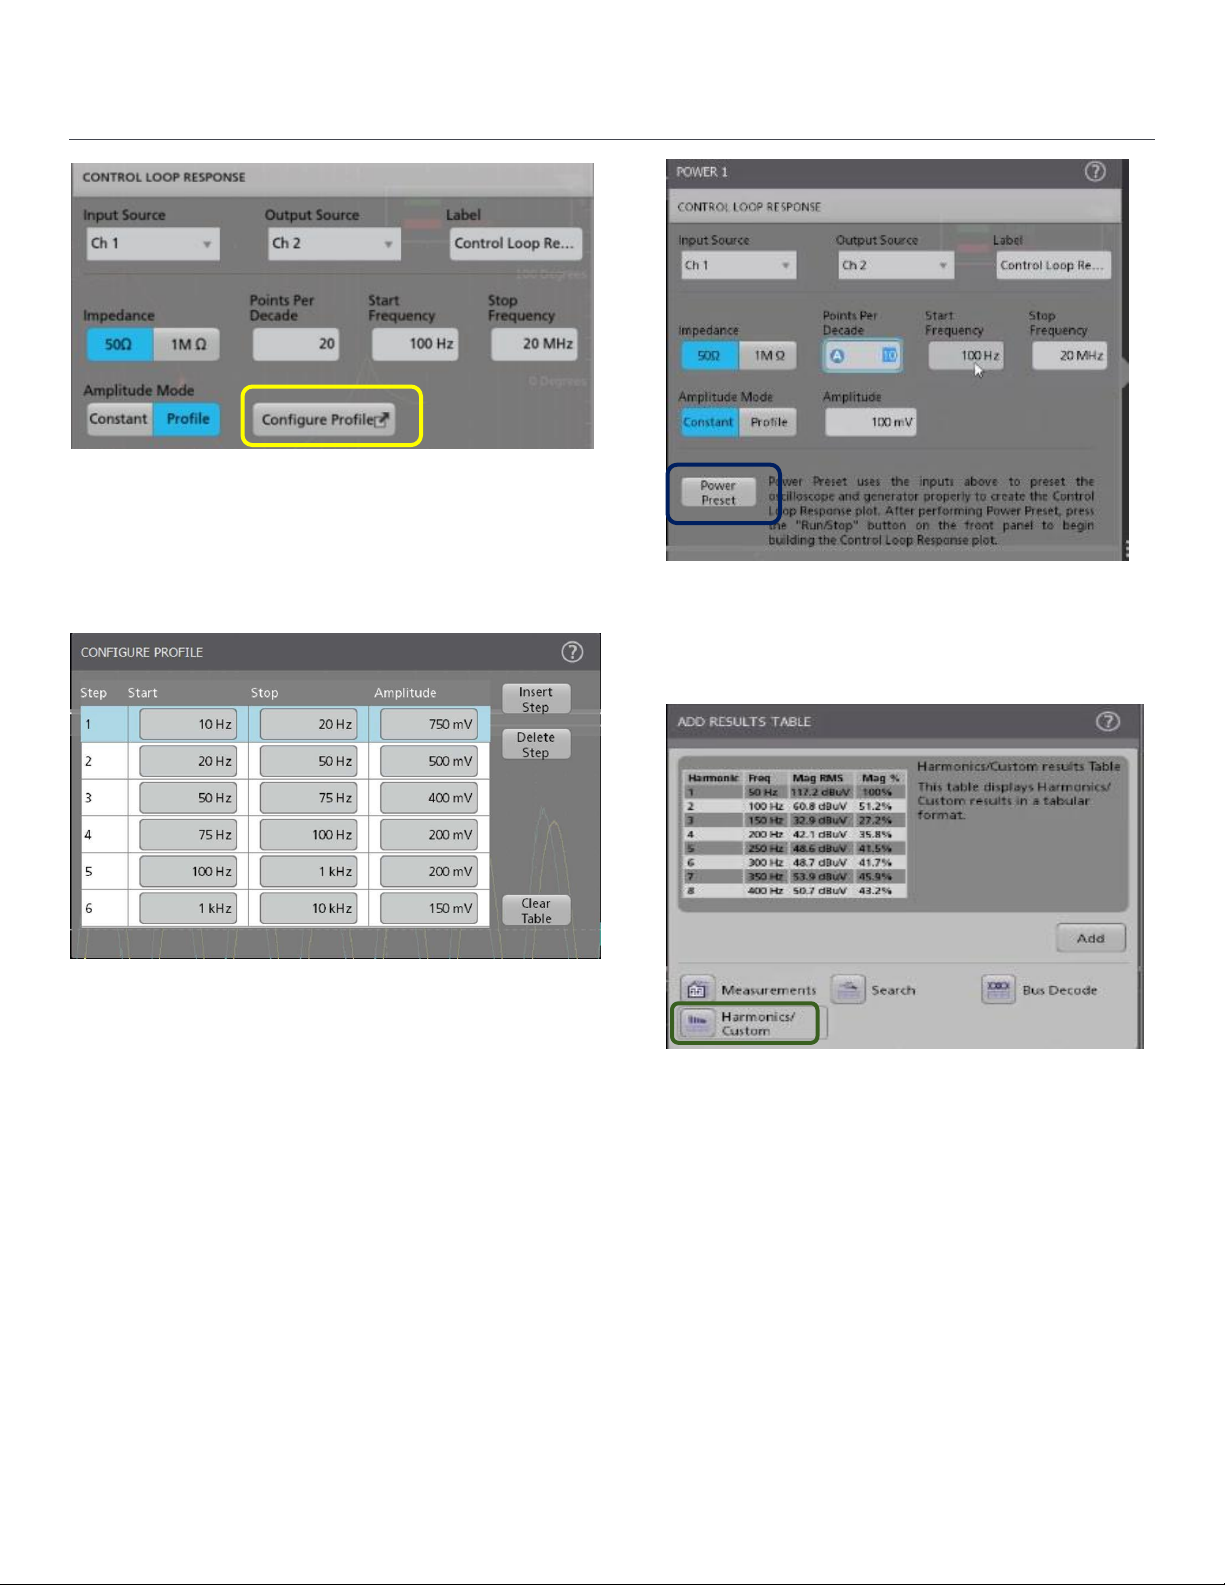
❑
Application supports Constant and Profile Amplitude
methods. The constant amplitude means the same
amplitude is applied at all injection frequencies. The profile
amplitude applies different amplitudes over each frequency
band.
❑
The start and stop frequency, amplitude, and points-perdecade determine the stimulus the generator will inject into
the control loop.
❑
Amplitude profile configuration enables designers to improve
the SNR (Signal to Noise Ratio) by customizing the injection
signal amplitudes for each frequency band.
❑
Users can inject lower amplitudes at frequencies where the
DUT is sensitive and inject higher amplitudes where the
response is less sensitive to distortion.
❑
Configure start and stop frequency values and set the
amplitude values under Constant profile.
❑
Tap the Result Table and select Harmonics table button.
❑
Click on the Power Preset button to start the
measurement.
❑
Select front panel Run button.
❑
Preset will automatically enable the profile values on the
AFG as set earlier.
❑
The measurement will start, and the Phase and Gain
curves will display on the Scope screen.
Page 6

5 Series/Series 6 MSO Power Analysis Lab
POWER TRAINING GUIDE
6 Control Loop Kit Demo Guide
❑
Gain curve crosses zero dB, and the Phase Margin is
calculated.
❑
Phase curve crosses zero-degree and the value of the
Gain margin is calculated.
❑
Bode plot showing Gain and Phase margin and Table
results at various frequencies is shown above.
❑
Users can save session files for future reference.
❑
Reports can be saved in PDF/mht format as
shown.
Page 7

5 Series/Series 6 MSO Power Analysis Lab
POWER TRAINING GUIDE
7 Control Loop Kit Demo Guide
Power Supply Rejection Ratio
To perform a PSRR test, sinusoidal ripple is summed with the
DC input voltage. The frequency of the ripple is swept over a
user defined bandwidth. A DC + AC summing device, such as
Picotest’s J2120A line injector, is required for this measurement.
The scope and associated software measures both the
modulated input and output levels and then computes
the rejection ratio (gain or attenuation) as 20Log
(Vin/Vout) at each frequency within the swept band. The
diagram shows the PSRR test setup.
❑
A line injector allows the input DC supply voltage to be AC
modulated by the signal source signal. It must be capable of
modulating over the frequency of interest as well as
supporting the DC voltage and DC current requirements of
the DUT.
RECOMMENDED SETUPS
❑
MSO 54 / MSO 64, 5 series / 6 series MSO Scope
❑
5-PWR /6-PWR Power Measurement and Analysis SW
❑
5 -AFG / 6-AFG Arbitrary / Function Generator
❑
Two TPP0502 500 MHz, 2X TekVPI® passive voltage
probes
❑
Line Injector
(https://www.picotest.com/tektronix.html)
▪ Picotest J2120A Line Injector – Maximum input voltage
50V/5A, Variable voltage drop 1.5-3.5V, Modulation
input impedance 10k Ohms, Usable bandwidth 1010MHz
▪ Picotest J2121A Line Injector – High powered,
Maximum input voltage 400V/20A, isolated current
monitor, regulated voltage drop 0.75V, Modulation input
impedance 50 Ohms, Usable bandwidth 10-1MHz
PSRR MEASUREMENT
❑
Select Measure Menu of the 5 Series Scope and verify the
PWR option is available. Under the PWR tab Frequency
Response Analysis has three measurements; Control
Loop Response (Bode plot), PSRR, and Impedance.
❑
Push the front panel Default Setup button of the 5 Series
Scope to set the oscilloscope into a known state.
❑
Tap the Power tab at the top of the menu.
❑
Tap the Frequency Response Analysis panel title to
display the panel.
❑
Double click the PSRR measurement button.
❑
Or select PSRR and tap the Add button.
❑
Tap the Add New Measure button in the upper right corner
of the display to launch the Measurement configuration
menu.
❑
Or right click Power 1 and select Configure Power 1.
Page 8

5 Series/Series 6 MSO Power Analysis Lab
POWER TRAINING GUIDE
8 Control Loop Kit Demo Guide
❑
Verify that the Input Source is set to Ch 1 and the Output
Source is set to Ch 2.
❑
Tap outside the configuration menu to dismiss it.
Refer to the setup diagram below and verify that all the
connections and test points for the Picotest VRTS1.5 board
and line injector are set as required.
SETTING UP THE DUT FOR PSRR
❑
Push the front panel Default Setup button of the 5/6
Series Scope to set the oscilloscope into a known state.
❑
Connect a TPP0502 probe to channel 1 of the oscilloscope.
❑
Connect the + input of the TPP0502 probe to the +INPUT
test point at TP1.
❑
Connect the - input of the probe to the GND test point.
❑
Connect the 2
nd
TPP0502 probe to channel 2 of the
oscilloscope.
❑
Connect the + input of the TPP probe to the +OUTPUT test
point i.e.TP5 as shown above.
❑
Connect the – input of the TPP probe to the GND test point
at the top of the board.
❑
Connect oscilloscope AFG Out to the input of Picotest
J2120A line injector using a BNC cable.
❑
Connect a DC 7V-10V power supply to the input of the
J2120A.
❑
Connect the output of the J2120A to the input of the demo
board, Positive to +Vin, Negative to -Vin.
❑
Verify that the Input Source is set to Ch 1 and the Output
Source is set to Ch 2.
❑
Application supports constant and profile amplitude
methods. The constant amplitude means the same
amplitude is applied at all frequencies. The profile amplitude
applies different amplitudes at each frequency band.
❑
Configure start and stop frequency values and set the
amplitude values under Constant profile.
❑
Click on the Power Preset button to start the measurement.
❑
Select front panel Run button.
❑
Preset will automatically enable the profile values on the
AFG as set earlier.
❑
The user can choose between two amplitude modes
such as constant or profiled amplitude.
Page 9

5 Series/Series 6 MSO Power Analysis Lab
POWER TRAINING GUIDE
9 Control Loop Kit Demo Guide
❑
The measurement will start, and the curve will display
on the Scope screen. The measurement badge shows
the Max and Min PSRR values with frequencies.
❑
Shown below is a sample PSRR plot using the Picotest
VRTS1.5 board.
❑
The user can save the session files for future reference.
❑
Reports can be saved in PDF/mht format.
Find more valuable resources at TEK.COM
❑
Report generated in PDF format.
Visit this link to view the Power App note:
https://www.tek.com/document/application-note/power-supplymeasurement-and-analysis-4-5-6-pwr-application-software
Copyright © 2016, Tektronix. All rights reserved. Tektronix products are covered by U.S. and foreign patents, issued and pending.
Information in this publication supersedes that in all previously published material. Specification and price change privileges
reserved. TEKTRONIX and TEK are registered trademarks of Tektronix, Inc. All other trade names referenced are the service
marks, trademarks or registered trademarks of their respective companies.
03-14-2019
 Loading...