

Page 1

x
Tektronix BitAlyzer BA1500, BA1600
Bit Error Rate Analyzer
ZZZ
Quick Start User Manual
*P071297900*
071-2979-00
Page 2

Page 3

xx
Tektronix BitAlyzer BA1500, BA1600
Bit Error Rate Analyzer
ZZZ
Quick Start User Manual
www.tektronix.com
071-2979-00
Page 4

Copyright © Tektronix. All rights reserved. Licensed software products are owned by Tektronix or its subsidiaries or suppliers, and are
protected by na
tional copyright laws and international treaty provisions.
Tektronix pro
previously published material. S peci fications and price change privileges reserved.
TEKTRONIX and TEK are registered trademarks of Tektronix, Inc.
BitAlyzer and Error Location Analysis are registered trademarks of Tektronix, Inc.
ducts are covered by U.S. and foreign patents, issued and pending. Information in this publication supersedes that in all
Contacting Tektronix
Tektronix, Inc.
14150 SW Karl Braun Drive
P.O. Box 500
Beaverton, OR 97077
USA
For product information, sales, service, and technical support:
In North America, call 1-800-833-9200.
Worldwide, visit www.tektronix.com to find contacts in your area.
Page 5

Table of Contents
General Safety Summary ... . .. . .. . .. . ... ... ... . .. . .. . .. . .. . .. . ... ... . .. . .. . .. . .. . .. . ... ... ... ... . .. . .. . .. . .. . .. . ... ... ... . .. . .. . .. . .. iii
Compliance I
Preface................................................................................................................................ vii
Installation.............................................................................................................................. 1
Operation............................................................................................................................... 5
How to Us
Operating System Restore ........................................................................................................... 29
Specifications .........................................................................................................................30
Index
nformation ............................................................................................................... v
Safety Compliance............................................................................................................... v
Environmental Considerations................................................................................................... vi
Documentation .................................................................................................................. vii
Operating
Preventing ESD .................................................................................................................. 2
Connections . . .. . .. . .. . .. . ... ... . .. . .. . .. . .. . ... ... ... ... . .. . .. . .. . .. . ... ... ... . .. . .. . .. . .. . .. . ... ... . .. . .. . .. . .. . ... ... ... ... . ... 2
Power On.........................................................................................................................4
Display Description............................................................................................................... 5
Generato
Detector Fundamentals .. . ... ... . .. . .. . .. . ... ... ... . .. . .. . .. . ... ... . .. . .. . .. . ... ... ... . .. . .. . .. . ... ... ... . .. . .. . .. . ... . .. . .. . .. . . 8
Important Settings to De fine Analysis .. . .. . .. . .. . .. . .. . .. . .. . ... ... ... ... ... ... ... ... . .. . .. . .. . .. . .. . .. . .. . .. . .. . .. . .. . .. . .. . .. . 9
Example 1: Configure Pattern Generator and Error Detector . .. . ... ... . .. . .. . .. . .. . .. . .. . ... ... ... ... ... . .. . .. . .. . .. . .. . .. . .. 11
If Synchronization Is Not Achieved............................................................................................. 15
Reset t
Example 2: Perform Error Location Analysis . .. . .. . .. . ... ... ... ... ... . .. . .. . .. . .. . .. . .. . .. . ... ... ... ... . .. . .. . .. . .. . .. . .. . .. . . 17
Example 3: Eye Diagram ....................................................................................................... 24
Conclu
Requirements.. . .. . .. . .. . .. . ... ... ... . .. . .. . .. . .. . ... ... . .. . .. . .. . .. . ... ... ... . .. . .. . .. . .. . .. . ... ... ... . .. . .. . .. . .. . .. 1
r Fundamentals . .. . ... ... . .. . .. . .. . ... ... . .. . .. . .. . ... . .. . .. . ... ... ... . .. . .. . ... ... . .. . .. . .. . ... . .. . .. . ... ... ... . .. . .. . 7
e the BitAlyzer Analyzer . . .. . .. . .. . .. . .. . ... ... ... . .. . .. . .. . .. . .. . .. . ... ... ... ... . .. . .. . .. . .. . .. . ... ... . .. . .. . .. . .. . .. . .. . 11
o Zero.................................................................................................................... 16
sion....................................................................................................................... 28
Table of Content
s
BitAlyzer Quick Start User Manual i
Page 6

Table of Content
s
ii BitAlyzer Quick Start User Manual
Page 7

General Safety S
ummary
General Safet
Review the following safety precautions to avoid injury and prevent damage to this product or any products connected to it.
To avoid potential hazards, use this product only as specified.
Only qualified personnel should perform service procedures.
While using this product, you may need to access other parts of a larger system. Read the safety sections of the other
component manuals for warnings and cautions related to operating the system.
To Avoid Fire or Personal Injury
Use proper power cord. Use only the power cord specified for this product and certified for the country of use.
Connect and disconnect properly. Do not connect or disconnect probes or test leads while they are connected
to a voltag
Ground th
shock, the grounding conductor must be connected to earth ground. Before making connections to the input or output
terminals of the product, ensure that the product is properly grounded.
Observe all terminal ratings. To avoid fire or shock hazard, observe all ratings and markings on the product. Consult the
product
The inpu
e source.
e product.
manual for further ratings information before making connections to the product.
ts are not rated for connection to mains or Category II, III, or IV circuits.
y Summary
This product is grounded through the grounding conductor of the power cord. To avoid electric
Do not ap
Power d
must remain accessible to the user at all times.
ply a potential to any terminal, including the common terminal, that exceeds the maximum rating of that terminal.
isconnect.
The power cord disconnects the product from the power source. Do not block the power cord; it
Do not operate without covers. Do not operate this product with covers or panels removed.
Do not operate with suspected failures. If you s uspect that there is damage to this product, have it inspected by
qualified service personnel.
Avoid exposed circuitry. Do not touch exposed connections and components when power is present.
Wear eye protection. Wear eye protection if exposure to high-in tensity rays or laser radiation exists.
Do not operate in wet/damp conditions.
Do not operate in an explosive atmosphere.
Keep product surfaces clean and dry.
Provide proper ventilation.
per ventilation.
pro
Refer to the manual's installation instructions for details on installing the product s o it has
BitAlyzer Quick Start User Manual iii
Page 8
General Safety S
Terms in This Manual
These terms may appear in this manual:
WARNING. Warning statements identify conditions or practices thatcould result in injury or loss of life.
CAUTION. Caution statements identify conditions or practices that could result in damage to this product or other property.
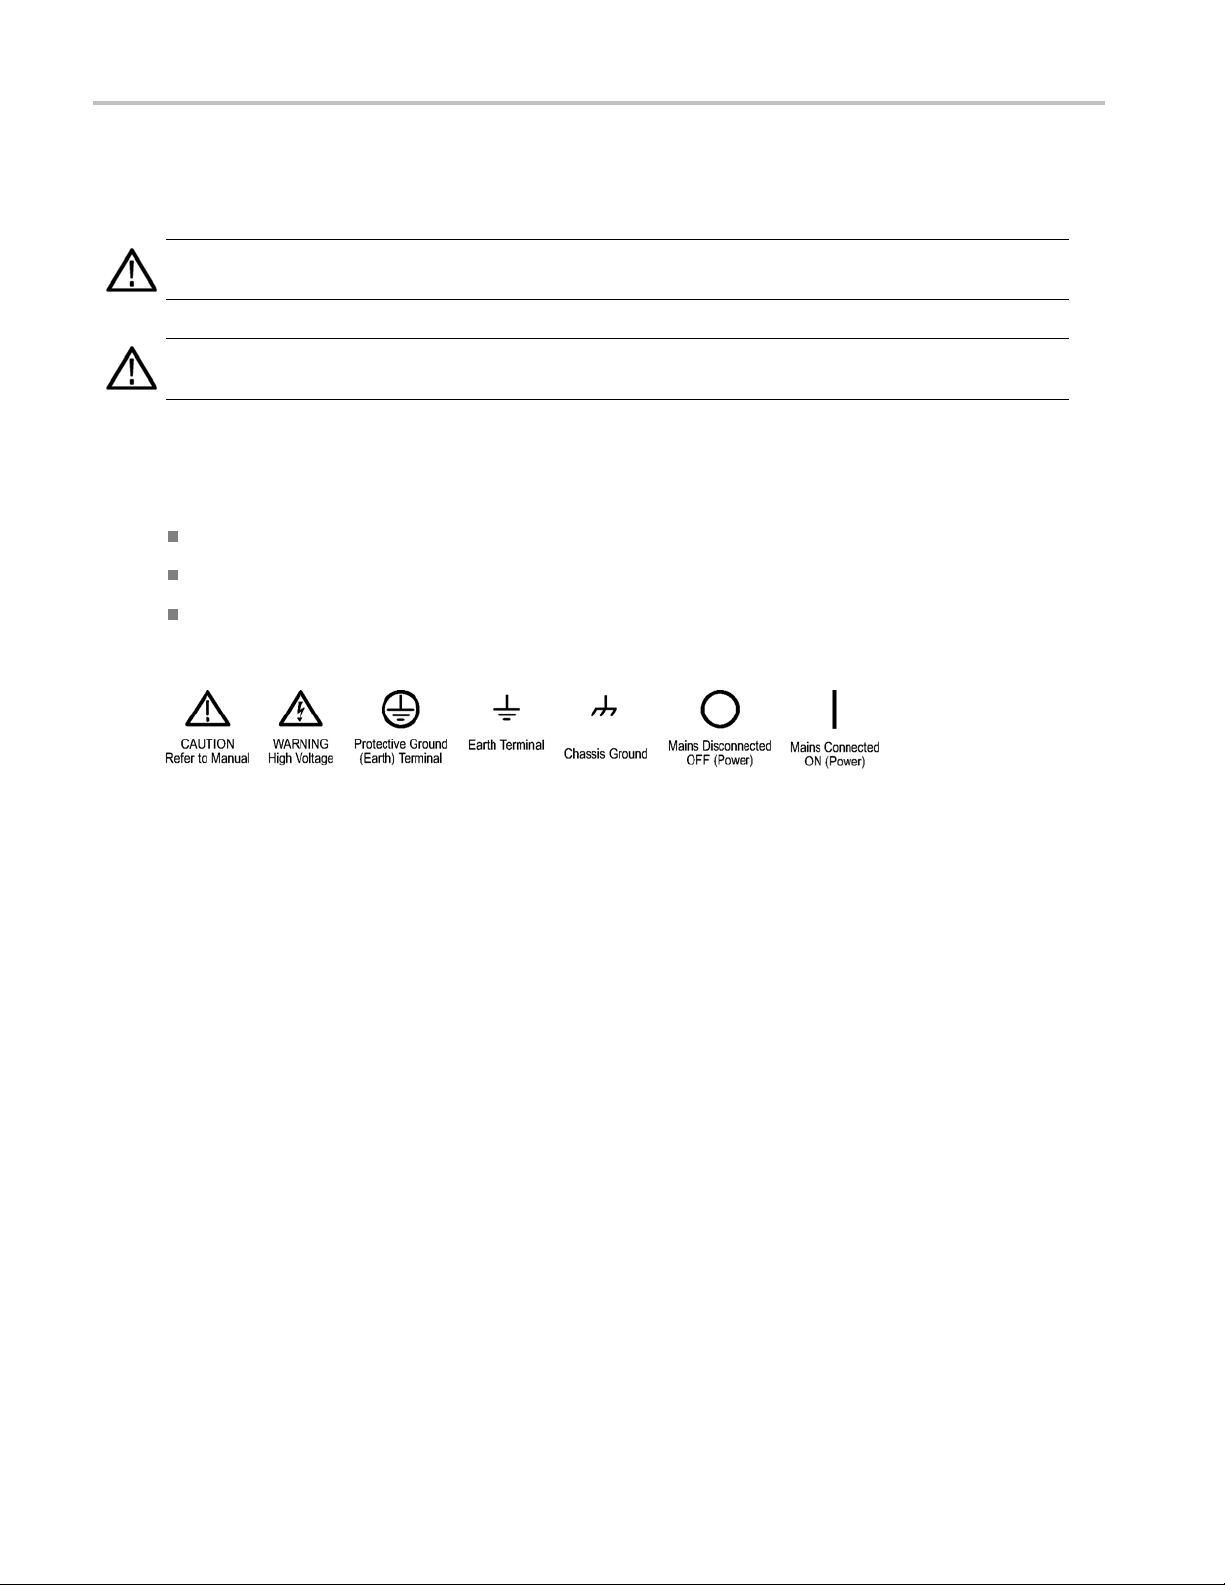
Symbols and Terms on the Product
These terms may appear on the product:
DANGER indicates an injury hazard immediately accessible as you read the marking.
WARNING indicates an injury hazard not immediately accessible as you r ead the marking.
CAUTION indicates a hazard to property including the product.
The following symbol(s) may appear on the product:
ummary
iv BitAlyzer Quick Start User Manual
Page 9

Compliance Info
rmation
Compliance In
This product is intended for sale and use within the United States only.
This section lists safety and environmental standards with which the instrument complies.
Safety Compliance
U.S. Nationally Recognized Testing Laboratory Listing
UL 61010-1:2004, 2ndEdition. Standard for electrical measuring and test equipment.
Canadian Certification
CAN/CSA-C22.2 No. 61010-1:2004. Safety requirements for electrical equipment for measurement, control, and
ry use. Part 1.
laborato
Additional Compliances
IEC 61010-1: 2001. Safety requirements for electrical equipment for m easurement, control, and laboratory use.
Equipment Type
formation
Test and measuring equipment.
Safety Class
Class 1 – grounded product.
Pollution Degree Description
A measure of the contaminants that could occur in the environment around and within a product. Typically the internal
ironment inside a product is considered to be the same as the external. Products should be used only i n the environment
env
for which they are rated.
Pollution Degree 1. No pollution or only dry, nonconductive pollution occurs. Products in this category are generally
encapsulated, hermetically sealed, or located in clean rooms.
Pollution Degree 2. Normally only dry, nonconductive pollution occurs. Occasionally a temporary conductivity that is
used by condensation must be expected. This location is a typical office/home environment. Temporary condensation
ca
occurs only when the product is out of service.
Pollution Degree 3. Conductive pollution, or dry, nonconductive pollution that becomes conductive due to condensation.
These are sheltered locations where neither temperature nor humidity is controlled. The area is protected from direct
unshine, rain, or direct wind.
s
ollution Degree 4. Pollution that generates persistent conductivity through conductive dust, rain, or snow. Typical
P
outdoor locations.
BitAlyzer Quick Start User Manual v
Page 10

Compliance Info
Pollution Degree
Pollution Degree 2 (as defined in IEC 61010-1). Note: Rated for indoor use only.
Installation (Overvoltage) Category Descriptions
Terminals on this product may have different installation (overvoltage) category designations. The installation categories are:
Measurement Category IV. For measurements performed at the source of low-voltage installation.
Measurement Category III. For m easurements performed in the building installation.
Measurement Category II. For measurements performed on circuits directly connected to the low-voltage installation.
Measurement Category I. For measurements performed on circuits not directly connected to MAINS.
rmation
Overvolta
Overvoltage Category II (as defined in IEC 61010-1)
ge Category
Environmental Considerations
Product End-of-Life Handling
Observe the following guidelines when recycling an instrument or component:
Equipment recycling. Production of this equipment required the extraction and use of natural resources. The equipment
may con
end of life. To avoid release of such substances into the environment and to reduce the use of natural resources, we
encourage you to recycle this product in an appropriate system that will ensure that most of the materials are reused
or rec
Mercury Notification. This product uses an LCD backlight lamp that contains mercury. Disposal may be regulated due
to environmental considerations. Please c ontact your local authorities or, within the U nited States, refer to the E-cycling
Central Web page (www.eiae.org) for disposal or recycling information.
tain substances that could be harmful to the environment or human health if improperly handled at the product’s
ycled appropriately.
vi BitAlyzer Quick Start User Manual
Page 11

Preface
The Tektronix BitAlyzer Bit Error Ratio Analyzers support serial data interfaces from 100 MHz to 1.5 GHz (BA1500) and
1.6 GHz (BA1600).
The BitAlyzer Analyzer combines a test pattern generator and error detector with advanced physical layer tests in one system.
The Generator produces a controlled data stream. When a clock is provided (either the internal clock synthesized by the
BitAlyzer, or an external clock), data bits of a user-selected data type will be generated. The data pattern can be one of the
predefined pseudo-random bit sequences (PRBS) installed in the Generator memory, or a user-created pattern.
The Error Detector compares the incoming data with a copy of the o riginal. Every bit error is tracked with an accuracy 1,000
times deeper than a sampling oscilloscope. The location of errors can be correlated with the eye diagram, pattern sensitivity,
error free interval, block errors, and other analysis methods. The error detection data can be stored for later analysis.
Documentation
Product Documentation
For information about: See these resources:
Initial Setup This Quick S tart User Manual
Operation and Analysis Online Help installed on instrument
Remote Control Remote control command list (PDF on instrument hard drive)
Specifications Technical Specifications PDF on instrument hard drive
Operating System Restore A separate partition on the instrument hard drive contains an operating system restore file
Preface
BitAlyzer Quick Start User Manual vii
Page 12

Preface
viii BitAlyzer Quick Start User Manual
Page 13

Installation
The BitAlyzer Analyzer is carefully packaged for shipping to ensure against damage. Nonetheless, damage or loss may
occur, and so we recommend you verify the contents of the shipping container, inspect the unit mechanically, and perform
a quick operational test when you first receive your unit.
A clear indicator of potential damage is a damaged shipping container. Please inspect the exterior of the shipping
container(s) to assess any damage. If damage is apparent, we recommend you keep the shipping container and all materials
until the unit is checked out electronically and mechanically. If damage has occurred, we recommend you contact your
shipping agent and Tektronix as soon as possible to report the situation.
The items that were shipped to you include:
BitAlyzer Instrument
Power Cord
USB Keyboard
USB Mouse
OEM Windows XP®Certificate
Registration Card
Installation
Quick Start User Manual
If the shipping container contents are not complete, please notify Tektronix immediately. Other items may be shipped with
your unit depending on optional configurations.
Calibration
Annual factory c alibration is recommended for this equipment. Contact Technical Support to arrange for factory calibration.
enance and Cleaning
Maint
Contact Tektronix Service.
Operating Requirements
e the instrument on a cart or bench. The instrument should rest on its bottom.
Plac
erve the following clearance requirements and dimensions:
Obs
:0in(0cm)
Top
t and right side: 7.6 cm (3 in)
Lef
tom: 0 cm (0 in) standing on feet, flip stands down
Bot
ar: 7.6 cm (3 in)
Re
fore operating the instrument, verify that the ambient temperature is within the specified range: +5°C to +40°C (+41°F
Be
to +104°F).
BitAlyzer Quick Start User Manual 1
Page 14

Installation
Preventing ESD
CAUTION. Adir
the following information.
Electrostatic discharge (ESD) is a concern when handling any electronic equipment. T he instrument is designed with
robust ESD protectio
may damage the instrument. To avoid damage to the instrument, use the following techniques to prevent electrostatic
discharge to the instrument:
Discharge the static voltage from your body by wearin g a grounded antistatic wrist strap while connecting and
disconnecting cabl
A cable that is left
cables before connecting them to the instrument or device under test by momentarily grounding the center conductor of
the cable, or by connecting a 50 Ω termination to one end, prior to attaching the cable to the instrument.
Connections
Connect Peripherals
The BitAlyzer An
Ifyouplantouse
TheLinePowerp
panel, as well as four USB 2.0 ports.
ect electrostatic discharge can damage the instrument input. Tolearn how to avoid this damage, read
n; however it is still possible that large d ischarges of static electricity directly into the signal input
es and adapters. The instrument provides a front panel connection for this purpose.
unconnected on a bench can develop a large static charge. Discharge the static voltage from all
alyzer supports both a mouse and a keyboard in addition to the touch screen.
a mouse and/or keyboard, connect them to any open USB port on the Analyzer before turning on the power.
lug and connectors for ground, network, monitor, Com1, and IEEE-488 (remote control) are on the rear
Clock and Data Con nectors
The BitAlyzer Generator uses either an internal clock or an optional external clock source. The Clock connectors are on the
front panel. 50 Ω SMA cables and connectors are recommended.
A ground connector is provided at the lower left of the front panel.
2 BitAlyzer Quick Start User Manual
Page 15

The connectors for the Data Generator and Error Detector are color-coded for easy identification; blue for the Generator
and green for th
e Detector.
Installation
Generator (Blue) Detector (Green)
Clock+ Out Clock+ In
Clock- Out Clock- In
Data+ Out
Data- Out
Data+ In
Data- In
External Clock In Start Detect In
Pattern Start In Marker (TTL Level) In
Page Select (TTL Level) In Blank (TTL Level) In
Trigger Out Error Out
Trigger Out
BitAlyzer Quick Start User Manual 3
Page 16

Installation
Power On
1. The line power connector is located on the rear panel. Use the included power cord to connect the instrument to a
suitable AC supply.
2. Press the power button on the front panel to turn the instrument on. A green LED lights when the power is on.
The BitAlyzer performs a Self Test at startup. This takes a few minutes, and may report errors if the computer or any of its
peripherals are damaged. If the keyboard is not plugged in, the operating system will report that the driver did not initialize
properly. A keyboard is not necessary and you can ignore this reported error if you do not plan to use one.
If any damage is i ndicated, contact Technical Support.
With self test successfully completed, the operating system l oads.
To power-down the unit, first allow the operating system to perform its shutdown procedures completely. To do so, touch the
Shutdown button on the Control Console. The screen will display a dialog asking if you wish to terminate only the BitAlyzer
application or shut down the entire system.
In the event of power failure or accidental power disconnect, the unit is very resilient. You may find that the next time you
power on, the boot-up sequence takes a few moments longer to verify the hard disk file system integrity.
4 BitAlyzer Quick Start User Manual
Page 17

Operation
Display Description
The screen is touch-sensitive. Make selections and settings by touching the onscreen icons, or if you prefer, use a
mouse and/or keyboard.
The Control Console is on the right side of the touch screen. At the bottom of the screen, a Status Bar shows the state of the
Generator and Detector, BER statistics, and signal source. The center of the screen will show the selected view.
Operation
The Control Console and Status Bar remain visible from all views.
Touch the View button on the Control Console to navigate between views.
The Generator and Detector Views are presented as a s chematic of the generation and detection process. Touching an
n the screen accesses settings and help for that element. For example, touch the Detector Delay icon to open the
icon o
popup menu, make settings, and access help.
ror Analysis Views
Er
In addition to a graphic chart display, analysis views include responsive sections for setting analysis parameters and
controlling the appearance of a view:
BitAlyzer Quick Start User Manual 5
Page 18

Operation
Setup buttons at the top of the screen
The violet Histogram Information Panel below the chart
The Analysis Console (normally hidden to allow m ore room for the chart display)
Physical Layer Tests
Physical Test views include zoom and pan buttons to navigate the chart, and one or more Sidebar panels with access to
measurements, controls, and display options related to the open view.
6 BitAlyzer Quick Start User Manual
Page 19

Generator Fundamentals
Errors are found by sending a controlled bit stream into a channel and then performing a bit-for-bit compare on what comes
out of the channel. The Generator provides this controlled data stream, using either industry common pseudo-random
sequences or a user-defined pattern. The data stream is synchronized to eit her an internal or an external clock, and both
data and clock are then passed to the Detector.
Available Settings
Open the Generator View to explore settings. Each icon on the Generator view opens a menu of its associated parameters.
Select a dat
stream, and the characteristics of those errors. The popup menus for these selections also provide direct access
to context-sensitive Help.
a type, the characteristics of input and output data and clock signals, whether to inject errors into the data
Operation
Data Patt
The Generator uses two types of patterns; either a selection of pseudo-random sequences defined by a generating
polynomial (PRBS), or a user-defined pattern. The user pattern may be a prerecorded file of error information, or a file
created using a Pattern Generation Language (PATLING) to embody particular features.
erns
Creating a Pattern
The Online Help available on your instrument describes the PATLING pattern generation language that can be used to create
ata files matching specific criteria for testing. You can also create a pattern by capturing data from the Detector inputs.
error d
Live Signal Generation
Touch the icons on the Generator view to set the characteristics of a generated signal.
BitAlyzer Quick Start User Manual 7
Page 20

Operation
Detector Fundamentals
The BitAlyzer Error Detector and Analyzer investigates error statistics present in digital channels. Errors are mismatches
between what was expected to be seen and what actually was seen during detection. By comparing a specific, known
pattern bit-by-bit with what is detected on the incoming channel, the Detector cannot only count errors, but can pinpoint the
exact position of errors in the digital channel.
This error location information provides more than just bit error rate testing. Using the exact bit location of errors found in the
data stream, the BitAlyzer measures independent bit and burst error statistics, correlates errors to reveal pattern sensitivities,
displays the probability of having error bursts of different lengths, isolates systematic error sources, and much more,
clarifying error relationships in addition to error counts. The varied types of analysis can reveal previously undetermined
idiosyncrasies of a data channel.
Available Settings
Open the Detector View to access the settings. Icons on the Detector view open menus of associated parameters. Select the
character
these selections also provide direct access to context-sensitive Help.
Selecting the Analysis Type
Touch the View button to open the popup menu of the available views. Touch Error Analysis or Physical Layer Test and
choose a view from these lists. Error Analysis Views include: Basic BER, Block Errors, Burst Length, Correlation, Error
Free Interval, Pattern Sensitivity, Strip Chart, and optional views such as FEC Emulation and 2D Error Map. Physical Layer
Tests include Eye Diagram, BER Contour, Mask Test, Jitter Peak, and Q-Factor.
istics of input data and clock signals, delay, data patterns, and synchronization parameters. The popup menus for
SettingUpaView
The Error Analysis views show an Analysis Engine icon at the bottom left corner that opens an Analysis C onsole where
arameters are set or changed. Each view allows access to its appropriate settings; certain universal settings affect all
most p
views, but can be changed as often as necessary. Touch the violet Histogram Information Panel to set the histogram chart
range and resolution. The settings are described below under “Important Settings.”
ng and Playing Back an Error Data File
Savi
Open the Editor view to open, name, rename, save, or delete an error data file.
To create a file, select View > Error Analysis > Basic BER (or other type of Error Analysis) > Analysis Engine > Error
File > Record File > (enter a fi lename in the file selection dialog) >Runto start a session to be saved. Touch Run again
to stop the session.
To play back a file: beginning from any Error Analysis view, touch Analysis Engine > Play from File > (select filename) >
Open.Thefile will then play back automatically and results will be reflected in all Error Analysis histograms.
Loading a User Pattern. To load a pattern into the Detector RAM, select View > Detector > Error Detector > User
Pattern Mode > (select filename) >Open.
Graph Options. Touch the Chart Setup button at the top of the display, and then touch selections on the popup menu to
control the appearance of a graph. The menu allows you to enable and select cursors, graticule, and log scale.
8 BitAlyzer Quick Start User Manual
Page 21

Important Settings to Define Analysis
Integration Period
The Integration Period is used when calculating error rates. Before dividing the number of errors by the number of bits, you
must first wai
of one error in 1e2 (100) bits, unless you wait 1e2 bits before dividing, you will probably get zero as a division result. In this
case, you would want to wait at least 1e4 (10,000) bits before dividing so there are two significant digits in the division result.
If your integration period is too long, you may wait quite a while before getting an error rate measurement. If it's too short, you
may get "jumpy" error rate measurements. A good rule of thumb i s to take the expected error rate, change the s ign of the
exponent, and add two to the exponent. An expected error ra te of 1e-6 translates to an integration period of 1e8.
Burst error identification is reset upon integration period boundaries.
Burst Minimum Length
The Burst Minimum Length parameter is used to distinguish errors as either being part of a burst or not. Errors that are not
part of bursts are known a s bit errors; these are the small, often random, errors.
During basic error analysis, single bit errors are grouped together using the Burst Error Free Threshold definition described
below. The resulting group is assigned a group length, which is defined to start at the first error of the group and end at
the last error (surrounding error free segments that are larger than the threshold are not included in the burst length).
This length is then compared to the Burst Minimum Length parameter and the group is handled either as a burst or as
bits, depending on the outcome.
t until enough bits are generated for the division result to have significance. For instance, if you have an error rate
Operation
By incrementing the Burst Minimum Length parameter, you specify that fewer and fewer error groups should qualify as bursts.
Burst Error Free Threshold
Burst errors are characterized as groups of single bit errors that are adjacent to one another. The Burst Error Free Threshold
parameter is used to program the degree of adjacency that is required to group single bit errors together to form bursts. An
error free segment that exceeds the threshold terminates a burst, and all bursts are surrounded by error free segments
that exceed the threshold.
Changing the Burst Error Free Threshold will change the shap
specification of a burst.
e of your burst length profiles because it changes the
Data Block Size
A Block is a contiguous number of bits for which an error c ount is calculated. This is useful for channel error correction
analysis. In some cases, error correction block sizes are fixed due to pre-existing packet frame sizes, sector sizes, or
similar system characteristics. If you set the Block definition to a matching size, the Block histogram will show you a profile
of how many errors occur in all the blocks. The shape of this curve will determine an effective value for the trade-off
between error correction strength and coding overhead.
Histogram Data Range
Each histogram view has a Setup button at the top edge. T
x-values for the currently displayed histogram. These limits define the range of data that will be analyzed.
ouch this button to open a setup dialog that sets the Start and End
Changing these values will clear out any existing data in the histogram. The Start value must be zero or greater, and
less than the End value.
BitAlyzer Quick Start User Manual 9
Page 22

Operation
Histogram Bin Mapping. The concept of mapping error positions to histogram bins is important to understanding error
location analy
is a limit of 1,000 unique histogram locations that can be maintained by the BitAlyzer. After this limit is exceeded, then
histogram locations are mapped two bit locations to one bin, and then three-to-one, four-to-one, and so on. This allows you
to trade off hi
sis. A histogram bin is a software data structure that is used for every histogram to maintain information. There
stogram resolution for range.
For a Histogra
is specified as [0,1000], then 1,000 bins are established, from Bin 0 to Bin 999. The bin resolution is one. Bin 0 contains
data [–∞, 1] and Bin 999 contains [999, +∞]. When the range is 1,001 or greater, the bin resolution will be two or more,
as necessary
If you need bo
to see error correlation to a block size of one million bits, set Start to 0 (zero) and End to 1,000,000 to view the overall result.
With this range, each bin in the resulting correlation histogram represents hundreds of correlation bit positions. Once a
correlatio
resolution to the one bin of interest. With new settings, each individual bit position can be uniquely resolved.
m Range [Start, End], the Start value is inclusive and the End value is exclusive. For example, if the range
to include all data within the available bins.
th a large range and detailed resolution, you may have to perform the analysis in multiple steps. For example,
n is found at one bin location, you c an refine the Start and End points to effectively redirect all the histogram bin
10 BitAlyzer Quick Start User Manual
Page 23

How to Use the BitAlyzer Analyzer
The following examples introduce the basic operation of the BA1500 and BA1600. Example 1 steps through configuration of
the Generator and Detector in a way that allows easy confirmation of correct E-to-E operation. Example 2 steps through the
setup for several Error Location Analysis views, and Example 3 introduces the Eye Diagram.
Example 1: Configure Pattern Generator and Error Detector
Use four cables to connect the Generator Clock+/− and Data+/− outputs to the Detector Clock+/− and Data+/− inputs on the
front panel. Then, to verify that the Generator and Detector are operating correctly, make the following settings.
How to Use the Bit
Alyzer Analyzer
Generator
In a few steps, we will set the Generator to output PRBS-7 data at a specified data rate using differential CML voltage levels.
Set External Clock Frequency. View > Generator > SYNTHESIZER > Use Keypad > 500 MHz > OK
1. To u c h View on the Control Console, and select Generator.
2. To u c h the SYNTHESIZER input icon on the Generator view to open the Internal Clock input settings dialog.
Setup
BitAlyzer Quick Start User Manual 11
Page 24

HowtoUsetheBit
3. Touch Use Keypad on the dialog, and
4. Enter 500 MHz using the popup keypad, then touch OK.
5. Verify that the clock rate on the display matches the 500 MHz frequency.
Alyzer Analyzer
Set Data Type to PRBS-7.
Generator > GENERATOR > Pattern > PRBS-7
1. Touch the GENERATOR button in the center of the view to open the Generator settings dialog.
2. Touch Pattern, and
3. Select PRBS-7 from the popup list.
12 BitAlyzer Quick Start User Manual
Page 25

Set Output Logic Family to CML. Generator > CLOCK+ > Link Clock+/−
CLOCK+ > Logic Family > CML
1. Make sure Link Clock +/− Signals is checked.
2. To u c h the CLOCK+ icon to open the Clock output settings dialog.
3. To u c h Logic Family on the dialog, and
4. To u c h CML on the popup list.
How to Use the Bit
Alyzer Analyzer
5. Repeat the same steps beginning with the DATA+ output icon.
6. To u c h the Outputs On/Off button at the top of the display to enable the Clock and Data outputs.
The Pattern Generator is now transmitting PRBS-7 data at 500 Mbit/sec on differential clock and data outputs set to industry
ard CML levels.
stand
Detector Setup
Next, we will set up the Detector to accept differential CML signals and make a bit error rate measurement.
Set Detector Interface Mode and Logic Family. View > Detector > CLOCK > Interface Mode > Differential
w > Detector > CLOCK > Logic Family > CML
Vie
ch View and select Detector.
1. To u
he Detector view, touch the CLOCK input icon to open the settings dialog.
2. On t
uch Interface Mode.
3. To
uch Differential on the popup list.
4. To
BitAlyzer Quick Start User Manual 13
Page 26

HowtoUsetheBit
Alyzer Analyzer
5. Touch CLOCK
6. Touch Logic
7. Touch CML o
8. Touch CLOC
9. In the same
Touch DAT
Touch DAT
again.
Family on the dialog.
n the popup list.
K again, then Optimize Threshold. The optimum threshold wil l b e automatically set.
way, set the Data input interface mode and logic family:
A > Interface Mode > Differential
A > Logic Family > CML
Set Detector Data Type to Automatic Pattern Detect.
Detector > ERROR DETECTOR > Auto Pattern
1. Touch the ERROR DETECTOR icon.
2. Select Auto Pattern from the popup list. This enables the Detector to compare all known PRBS data patterns when
acquiring synchronization.
3. Touch Auto Align to optimize the data measurement point with the incoming data signal. This moves the delay timing and
voltage threshold to find the best sampling point in the received eye for making BER measurements.
14 BitAlyzer Quick Start User Manual
Page 27

How to Use the Bit
You may be asked to recalibrate the delay element when you touch Auto Align. The instrument monitors changes in data
frequency and t
emperature and can automatically recalibrate its built-in variable delay element in less than one second.
Alyzer Analyzer
4. Verify the dat
bottom of the screen.
a pattern type and data rate for both the Generator and Detector, displayed on the Status Bar at the
If Synchronization Is Not Achieved
If the Generator and Detector are not in sync, this situation must remedied before going on. There are certain things
that can cause a no-sync condition:
1. Carefully examine cable connections and polarity, making any corrections needed.
Examine the Generator and Detector views to determine:
2. Status Bar indicates Sync. When sync is achieved, the status bar will show the data type and data rate for both the
Generator and Detector. Otherwise, the bar will be bright yellow, displaying a “No Sync” error message.
3. Data Type is PRBS-7. If not:
Check for correct Data Type setting on the Generator and, if necessary, reset to PRBS-7.
Check for correct Data Type setting on the Detector and, if necessary, reset to Auto Detect.
4. Generator Clock Rate is 500 MHz. If not:
Check for correct Generator Clock setting. If necessary, reset to 500 MHz.
Optimize the Detector Clock Threshold (View > Detector > CLOCK > Optimize T hreshold).
5. Clock +/− and Data +/− output and input Logic Family configurations match. If not:
Check Logic Family configurations (both Logic Type and single-ended/differential mode) for the Generator External
Clock, Clock+/− outputs, and Data+/− outputs. If necessary, set to the same configuration as the Detector inputs.
Check Logic Family configurations for the Detector Clock and Data inputs. If necessary, set to the same configuration
as the Generator outputs.
6. Retry for synchronization.
BitAlyzer Quick Start User Manual 15
Page 28

HowtoUsetheBit
Alyzer Analyzer
Reset to Zero
Reset BER and Resyncs to Zero
Run > Run > Reset Results
1. Touch Run on the C ontrol Console; then touch a second time to stop.
2. Touch the Reset Results button at the top of the screen.
Verify Zero BER/Zero Resyncs
3. Verify that the Detector is showing a data type of PRBS-7
4. The input clock rate m atches the 500 MHz rate being transmitted by the Generator
5. The Detector Results box indicates zero BER and zero resyncs
16 BitAlyzer Quick Start User Manual
Page 29

Example 2: Perform Error Location Analysis
This introduction to Error Location Analysis gives three examples from the available analysis types. Our goal is to turn on
the error injector for 32-bit bursts at the default interval of 312,512 bits, then measure the bit and burst error rates using
the Basic BER View, the Burst Length profile (you should see a spike at 32 bits), and then the Error Free Interval profile
(you should see a spike at error free intervals of 312,480).
Following these s tep-by-step processes will familiarize you with most of parameters, settings, and controls involved in using
the BitAlyzer. After completing the lesson, you will be able to make use of Error Location Analysis without difficulty.
Set Up a Test Case
How to Use the Bit
Alyzer Analyzer
Open the Gen
erator view.
Enable Error Injection. Generator > ERROR INJECT
Let’s generate some error bursts, to see what shows up on the analysis histograms. By enabling the Error Injector in the
Generator, you can set a specific burst error length and interval, and then observe exactly what the Detector finds.
Generator > ERROR INJECT > Mode > Continuous
Touch either the Control Console View button or the Generator field in the Status Bar to open the Generator view.
Touch the ERROR INJECT button.
Touch M ode , then select Continuous from the popup list.
Generator > ERROR INJECT > Type > 32Bit Burst
BitAlyzer Quick Start User Manual 17
Page 30

HowtoUsetheBit
Touch ERROR INJECT again, touch Type , and select 32-Bit Burst.
Generator > ERROR INJECT > Interval > Default (312,512 bits)
Touch ERROR INJECT and check the value displayed as Interval (the number of bits between error injections). The
default value
to reset the default interval of 312,512 bits.
Select the Analysis View
View > Error Analysis > Basic BER
Alyzer Analyzer
is 312,512 bits. If a different interval is displayed, touch Interval and select Default on the popup dialog
Choose the Parameters
For this test case, we are using the Default settings.
18 BitAlyzer Quick Start User Manual
Page 31

Basic BER > Setup > Enable Analysis
Basic BER > Set Default > This Analyzer
How to Use the Bit
Alyzer Analyzer
NOTE. For our test case, we will leave all of these parameters at their default settings.
Basic BER Data
This selection will analyze live data transmission from a Generator.
Basic BER > Run
Touch Run on the Control Console.
Basic error statistics are shown in the Basic BER view, along with the current settings for several important measurement
parameters:
Total Bi t s
Total Errors (B urst Related and Non-Burst Related)
Total Bit Error Rate (Burst Related and Non-Burst Related)
Burst Events
Markers
BitAlyzer Quick Start User Manual 19
Page 32

HowtoUsetheBit
Pattern
Starting Mode
Burst Minimum Length
Burst Error Free Threshold
Integration Period
BER calculations depend upon the values for Burst Minimum Length, Burst Error Free Threshold, and Integration Period.
Because we have set a Burst Length of 32 bits injected every 312,512 bits, and left Burst Error Free Threshold and
Integratio
Alyzer Analyzer
n Period at their default settings (32 bits and 1.00E+09 bits, respectively), the error rates can be predicted:
1. ABurstRela
2. A N on-Burst
3. A Total Err
Note that t
ted Error Rate of 1.02E-04
Related Error Rate of 0.00E+00 (zero), and
or Rate equaling the Burst Related Error Rate
he Basic BER view does indeed show these measurements.
Select Burst Length View
View > Error Analysis > Burst Length
t Length Parameters
Burs
Using the same parameters already set (a 32-bit error injected into the PRBS-7 pattern every 312,512 bits), you would expect
to see an error burst length corresponding to the 32 bits of the injected error.
Burst Length Data
This selection will analyze live data transmission from a Generator.
Make sure that the Detector is in Run mode.
20 BitAlyzer Quick Start User Manual
Page 33

How to Use the Bit
Alyzer Analyzer
As expected, you can clearly see the spike of error bursts on the histogram. To verify the length of 32 bits, zoom in on the
spike.
Touch the Zoom button below the chart, then touch anywhere inside the histogram chart and drag to zoom. To pan, touch the
pan button, and then touch and drag on the chart. You can also show cursors by touch
ing Chart Setup and selecting the
cursor(s) you want displayed. To position a cursor, touch its “handle” (the box showing its position), then drag it into place.
Once you have zoomed in on the data, you can see that the spike of bursts in the data is at a length of 32 bits.
BitAlyzer Quick Start User Manual 21
Page 34

HowtoUsetheBit
Select Error Free Interva l View
View > Error Analysis > Error Free Interval
Alyzer Analyzer
Error Free Interval Parameters
Using the parameters already set (a 32-bit error injected into the PRBS-7 pattern every 312,512 bits), you would expect to
see an error free interval corresponding to that 312,512 number:
[(312,512-bit interval) – (32-bit burst error)] = 312,480-bit Error Free Interval
ror Free Interval Data
Er
This selection will analyze live data transmission from a Generator.
22 BitAlyzer Quick Start User Manual
Page 35

How to Use the Bit
Detector > Run > Auto Center
1. Make sure that the Detector is in Run mode.
2. To u c h Auto Center to scale the chart to fit the data, or touch anywhere inside the histogram chart and drag your finger to
thelefttozoo
There is an obvious spike in the vicinity of 300,000. To verify the precise location, the next section will explain how to adjust
the histogram range and resolution to see an exact bit-for-bit representation of the EFI.
m out so that the anticipated range of data is visible.
Alyzer Analyzer
Adjust Histogram Rang e and Resolution
Basic BER > Information Panel > Hist Start/Hist End/Hist Resolu tio n
Once you
error free interval value. Each histogram contains 1,000 bins, each representing 1/1000 of the data contained in the
histogram range. By adjusting the range start and end values, you can narrow the parameters until the chart reveals
the pre
1. To u c h a
2. To u c h
3. To u c h Hist End and enter 312,550 bits.
4. If the Resolution does not already show “1” touch Hist Resolution and enter 1.
The EFI chart will zoom in precisely on the range specified.
have seen the “rough” data, you can change the histogram range to get one-bit resolutions and show the exact
cise location of your data.
nywhere on the violet Information Panel to open the Histogram Settings dialog.
Hist Start. In this case, we know where the interval should appear, so we can shortcut the trial-and-error method.
Enter 312,450 bits using the keypad, and touch OK.
BitAlyzer Quick Start User Manual 23
Page 36

HowtoUsetheBit
Another way to get an exact bit count is to use the chart cursors:
1. Touch Chart Setup and
2. Enable the Bits cursors.
3. Touch a cursor label and drag the cursor onto the spike. The cursor label will display its exact bit location, thus verifying
Alyzer Analyzer
the Error Free Interval of 312,480 bits.
Example 3: Eye Diagram
Select the Eye Diagram View
View > Physical Layer Test > Eye Diagram
Choose Eye Diagram Parameters
Set up the Eye Diagram to show the areas of most interest:
24 BitAlyzer Quick Start User Manual
Page 37

View > Physical Layer Test > Eye Diagram > Eye Setup
How to Use the Bit
Alyzer Analyzer
1. To u c h the Eye Setup button at the top of the display.
2. From the popup menu, select cursors, set persistence, and s elect whether to measure edges at 80–20% or 90–10%.
(Other than turning on the cursors, you can leave these settings at their defaults for the purpose of our illustration.)
3. To u c h Run on the Control Console.
View Eye Diagram
Display all of the data on one screen.
BitAlyzer Quick Start User Manual 25
Page 38

HowtoUsetheBit
Eye Diagram > Auto Center > Zoom/Pan
1. Touch Auto Center at the top of the screen, to scale the chart so that a complete eye is seen.
Examine your data more closely:
Zoom and pan to see more detail:
1. Touch the Vertical Zoom button at the left edge of the chart. Touch the display and drag up, or turn the front panel
knob clockwise.
2. Touch Horizontal Pan at the bottom of the chart. Touch the display and drag down, or turn the front panel knob
counter-clockwise.
Alyzer Analyzer
Eye Measurements
Make
Use the cursors to make measurements.
26 BitAlyzer Quick Start User Manual
Page 39

How to Use the Bit
Alyzer Analyzer
Touch a cursor “handle” (the measurement box) and drag the cursor into position to measure a feature of the eye. The
measurement sh
own in the box will update automatically.
Or use t he Measurement Sidebar:
1. To u c h the Measure button at the lower left of the screen to open the M easurement Sidebar. Touch a labeled button to
enable that measurement. The selected measurement will remain visible on the eye diagram if the Sidebar is closed.
2. In the illustration, green arrows indicate measurement of the Eye Width at 1.977 picoseconds.
BitAlyzer Quick Start User Manual 27
Page 40

HowtoUsetheBit
Conclusion
To learn more about your BitAlyzer, visit the Error L ocation Analysis section of the Help system on your unit. This help
topic includes a tutorial to introduce the diagnostic creativity of the patented Error Location Analysis process. You will find
a link to Error Location Analysis on the Help Home view, or touch Error Location in the Analysis Console, and then
Help on Error Analysis.
Alyzer Analyzer
28 BitAlyzer Quick Start User Manual
Page 41

Operating Syste
mRestore
Operating Sys
The BitAlyzer Analyzer contains an operating system restore file in a separate partition of the hard drive. Use this file
to restore the instrument operating system.
CAUTION. Using the restore process reformats the hard drive and reinstalls the operating system. All saved data is lost. If
possible, save important files to external media before performing a system restore.
1. Restart the instrument. During the boot-up process you will see the following message at the top of the screen: Acronis
Loader….PressF5 on the keyboard to start the Acronis Startup Recovery Manager.
2. Repeatedly press the F5 key until the Acronis True Image Tool opens. There is a 15-second delay after the message
appears until the instrument proceeds with normal instrument startup. If the instrument does not open the Acronis
application, power off the instrument, then power on the instrument and try again.
3. To u c h Restore.
4. In the Confirmation dialog box, touch Yes to restore the instrument operating system, or No to exit the restore process.
The restore process takes approximately 30 minutes; the actual time depends on the instrument configuration.
NOTE. The System Restore process includes reinstallation of the BitAlyzer application at the revision level installed on
your instrument at the factory. A later version of the application software may be available. For access to firmware/software
updates, contact Technical Support.
tem Restore
BitAlyzer Quick Start User Manual 29
Page 42

Specifications
Specification
Specifications are subject to change.
User Interface
Processor
Operating System Windows XP®
USB Four USB-A connectors on rear panel
Com1
Remote Control Interface
Network Interface 1 GB Ethernet
Size Height: 8.6 in (21.8 cm)
Weight
Power 285 watt
Power Fuse
Temperature
Humidity
Altitude
s
640 x 480 Active Matrix TFT color display
High resolution analog resistive touch screen
1.66 GHz Atom N455
1GByteDRAM
160 GB Hard Drive
D-sub 9
IEEE-488
Ethernet Remote Control via TCP/IP
Width: 16.5 in (41.9 cm)
Depth: 17.5 in (44.5 cm)
<36 lb (<16.3 kg), unpackaged
100-240 V
50/60 Hz
3.15 A, 250 V, 5 mm x 20 mm, fast blow
Operating: +5°C to +40°C, with 11°C/hour maximum gradient,
Non-Operating: −20°C to +60°C, with 20°C/hour maximum gradient, without disk
Operating: 8% to 80% relative humidity (% RH) up to +32°C
Non-Operating: 5% to 95% relative humidity (% RH) up to +30°C
Operating: Up to 3,000 meters (derate maximum operating temperature by
Non-Operating:
AC
±10%
non-condensing, derated 1.0°C per 300 meters above
1,500 meters altitude
media installed in disk drive
5% to 45% RH above +32°C up to +45°C
Non-condensing, and as limited by a Maximum Wet Bulb
Temperature of +29.4°C (derates relative humidity to 32% RH at
+45°C)
5% to 45% RH above +30°C up to +60°C
Non-condensing, and as limited by a Maximum Wet Bulb
Temperature of +29.4°C (derates relative humidity to 11% RH at
+60°C)
1°C per 300 meters above 1,500 meters altitude)
Up to 12,000 meters
30 BitAlyzer Quick Start User Manual
Page 43

Index
Index
A
Altitude Spec
Analysis
Auto Cente
Auto Pattern Detect, 14
ification, 30
Burst Error Free Threshold, 9
Burst Minimu
Data Block Size, 9
Histogram Bit Mapping, 9
Histogram D
Important Settings, 9
Integration Period, 9
m Length, 9
ata Range, 9
r, 25
B
Basic BER View, 18
Analyze D
Set Default, 19
Set Parameters, 18
Blank In C
Burst Error
Burst Error Free Threshold, 9
Burst Le
Burst Data, 20
Select View, 20
Set Par
Burst Minimum Length, 9
ata, 19
onnector, 3
ngth View, 20
ameters, 20
C
Clock
nal Clock Frequency, 11
Exter
External Clock Input, 3
Input, Output, 3
face Mode, 13
Inter
Link +/- Signals, 11, 13
Optimize Threshold, 14
guration, 11
Confi
Detector Setup, 13
Generator Setup, 11
et to Zero, 16
Res
Connections
Blank In, 3
Clock and Dat
Connect Peripherals, 2
Detector, 3
Error Out, 3
Front Panel, 3
Generator, 3
Marker In, 3
Page Select, 3
Pattern Start, 3
Rear Panel
Trigger Out, 3
a Connectors, 2
,2
D
Data
Generato
Input, Output, 3
Interface Mode, 14
Link +/Data Block Size, 9
Detector
Chart Se
Clock and Data Input, 3
Clock Logic Family, 14
Configu
Data Logic Family, 14
Error Data File, 8
Funda
Interface Mode, 13
Selecting Analysis Type, 8
Set Da
Settings, 8
Display, 5
Anal
Control Console, 5
Histogram Information Panel, 6
Pan a
Setup Buttons, 6
Status Bar, 5
r Data Type, 12
Signals, 11, 13
tup, 8
ration, 11
mentals, 8
ta Type, 14
ysis Console, 6
nd Zoom, 26
E
or Free Interval View, 22
Err
EFI Data, 22
Select View, 22
t Parameters, 22
Se
Error Inject, 17
Error Location Analysis, 17
Basic BER Vie
Burst Length View, 20
Error Free Interval View, 22
Error Inject
Examples, 17
Select a View, 18
Set Default
Synchronization, 15
Error Out Connector, 3
External C
Eye Diagram, 24
lock Input, 3
Auto Center, 25
Display, 2
Measurements, 26
Pan and Zoom, 26
Select Vi
Set Parameters, 24
w, 18
,17
s, 19
5
ew, 24
F
Fuse Specification, 30
G
tor
Genera
Clock and Data Output, 3
Clock Logic Family, 13
uration, 11
Config
Data Logic Family, 13
Data Patterns, 7
e Outputs, 13
Enabl
External Clock Frequency, 11
Fundamentals, 7
Signal Generation, 7
Live
Set Data Type, 12
Settings, 7
H
togram
His
Bin Mapping, 10
Data Range, 9
togram Bin Mapping, 10
His
Histogram Data Range, 9
Humidity Specification, 30
BitAlyzer Quick Start User Manual 31
Page 44

Index
I
Inject Errors, 17
Installation, 1
Power On, 4
Shutdown, 4
L
Logic Family, 13
Detector Inp
Generator Clock Output, 13
Generator Data Output, 13
ut, 13
M
Marker In C
Measurements
onnector, 3
Eye Diagram, 26
Sidebar, 2
7
O
Operating System Restore, 29
Operation, 5
e Input Threshold, 14
Optimiz
P
Page Select Connector, 3
Panning a Chart, 26
Pattern Start
Patterns
Auto Pattern Detect, 14
Creating a Pa
Generator Patterns, 7
Power On, 4
Power Specifi
Connector, 3
ttern, 7
cation, 30
R
Reset to Zero, 16
Restore Operating System, 29
S
Safety Sum
Shutdown, 4
Sidebar, 27
Specifica
Synchronization, 15
mary, iii
tions, 30
Troubleshooting, 15
T
Temperature Specification, 30
Trigger O ut Connector, 3
U
Unpacking th
e Box, 1
V
Views
Basic BER, 18
Burst Lengt
Detector, 13
Error Free Interval, 22
Eye Diagra
Measurement Sidebar, 27
h, 20
m, 24
Z
Zooming a Chart, 26
32 BitAlyzer Quick Start User Manual
 Loading...