

Page 1

1500
Quick Start Guide
3475-D Edison Way
Menlo Park, California U.S.A. 94025
Voice (650) 364-1853
Fax (650) 364-5716
Email tech_support@synthesysresearch.com
www.synthesysresearch.com
Page 2

Page 3

BitAlyzer® technology is
registered with the U.S. Patent
and Trademark Office, U.S.
Patent No. 5,414,713
SYNTHESYS RESEARCH INC.
This manual is copyrighted and all righ ts are reserved. No portion of this document
may be reproduced or transmitted in any form or by any means , electronic or
mechanical, including photocopying and recording, for any purpose without the
express written permission of SyntheSys Research Inc.
Products of SyntheSys Research Inc. are covered by U.S. and foreign patents and/or
pending patents .
BitAlyzer is a registered trademark of SyntheSys Research Inc.
BitAlyzer1500 Quick Start Guide
Part Number 0150-702-02.2
18 May 2004
Page 4

Declaration of Conformity
3475-D Edison Way
Menlo Park, California U.S.A. 94025
We declare under our sole responsibility that the
Bit Error Rate Analyzer, Model BitAlyzer 1500
BA1500 Software Version 2.6 and above
are in compliance with the intent of EMC Directive 89/336/EEC for
Electromagnetic Compatibility and the Low Voltage Directive 73/23/EEC.
Compliance was demonstrated to the following specifications:
EN61326-1 Radiated, Class B Standard
EN61326-1 Conducted, Class B Standard
EN61000-3-2 Harmonics Current Emission
EN61000-3-3 Voltage Fluctuations and Flicker
EN61000-4-2 ESD
EN61000-4-3 RF Fields
EN61000-4-4 Fast Transients
EN61000-4-5 Surge Tests
EN61000-4-6 Conducted Immunity/Susceptibility
EN61000-4-11 Voltage Dips and Short Interruptions
UL3111-1 United States Safety Standard
EN61010-1 European Safety Standard
Page 5

Table of Contents
Initial Setup......................................................................................... 1
Unpacking.................................................................................................................1
Technical Support.....................................................................................................2
Calibration.................................................................................................................2
Maintaining Connectors............................................................................................2
Connections..............................................................................................................3
Connect Peripherals.........................................................................................................3
Connect External Clock Source........................................................................................4
Power On..........................................................................................................................5
Display Description...................................................................................................6
Generator Fundamentals................................................................... 8
Available Settings .....................................................................................................8
Data Patterns............................................................................................................8
Creating a Pattern.............................................................................................................8
Saving and Playing Back an Error Data File..................................................................... 8
Live Signal Generation.....................................................................................................8
Detector Fundamentals ..................................................................... 9
Available Settings .....................................................................................................9
Selecting the Analysis Type......................................................................................9
Setting Up a View............................................................................................................. 9
Important Settings to Define Analysis.....................................................................10
Integration Period...........................................................................................................10
Burst Minimum Length....................................................................................................10
Burst Error Free Threshold.............................................................................................11
Data Block Size..............................................................................................................11
Histogram Data Range................................................................................................... 11
BitAlyzer1500 Quick Start Guide Table of Contents
• i
Page 6

How to Use the BitAlyzer1500......................................................... 13
Lesson 1: Configure Pattern Generator and Error Detector ..................................13
1.1 Generator.................................................................................................................13
1.2 Detector...................................................................................................................17
1.3 If Synchronization is Not Achieved ..........................................................................20
1.4 Reset to Zero...........................................................................................................21
Lesson 2: Perform Error Location Analysis............................................................22
2.1 Set Up a Test Case..................................................................................................23
2.2 Select Basic BER View............................................................................................24
2.3 Choose the Parameters...........................................................................................25
2.4 Basic BER Data.......................................................................................................27
2.5 Select Burst Length View.........................................................................................28
2.6 Burst Length Parameters.........................................................................................28
2.7 Burst Length Data....................................................................................................29
2.8 Select Error Free Interval View................................................................................30
2.9 Error Free Interval Parameters................................................................................30
2.10 Error Free Interval Data.........................................................................................31
Lesson 3: Eye Diagram..........................................................................................34
3.1 Select Eye Diagram View........................................................................................34
3.2 Choose Eye Diagram Parameters ...........................................................................35
3.3 View Eye Diagram...................................................................................................36
3.4 Make Eye Measurements........................................................................................38
Conclusion..............................................................................................................40
Index..................................................................................................41
ii • Table of Contents BitAlyzer1500 Quick Start Guide
Page 7

BitAlyzer1500 Quick Start Guide
Initial Setup
Unpacking
The BitAlyzer1500 is carefully packaged for shipping to ensure against
damage. Nonetheless, damage or loss may occur, and so we recommend you
verify the contents of the shipping container, inspect the unit mechanically,
and perform a quick operational test when you first receive your unit.
A clear indicator of potential damage is a damaged shipping container. Please
inspect the exterior of the shipping container(s) to assess any damage. If
damage is apparent, we recommend you keep the shipping container and all
materials until the unit has been checked out electronically and
mechanically. If damage has occurred, we recommend you contact your
shipping agent as well as SyntheSys Research as soon as possible to report the
situation.
The items that were shipped to you include:
1. BitAlyzer1500 Chassis
2. Keyboard
3. Power Cord
4. PS/2 Splitter Cord
5. Serial Mouse
6. OEM WindowsNT
7. Registration Card
8. BA1500 Quick Start Guide
9. BA1500 Remote Control Guide
If the shipping container contents are not complete, please notify SyntheSys
Research immediately. Other items may be shipped with your unit depending
on optional configurations.
BitAlyzer1500 Quick Start Guide
Certificate
• 1
Page 8

Technical Support
Should your unit require repair in the future, you are responsible for
packaging it adequately for return shipment. We recommend you retain the
original shipping container and shipping materials for this purpose.
For service or questions, please contact us at:
Service Department
SyntheSys Research Inc.
3475-D Edison Way
Menlo Park, CA 94025 USA
Voice: 650 364-1853
Fax: 650 364-5716
Email: tech_support@synthesysresearch.com
Website: http://www.synthesysresearch.com
When you contact SyntheSys Research for service, please have your product
model number, serial number, and purchase date information at hand. Our
service department is available from 9:00 a.m. to 5:00 p.m. (Pacific Time),
Monday through Friday.
Calibration
SyntheSys Research recommends an annual factory calibration for this
equipment. Contact our Technical Support to arrange for factory calibration.
Maintaining Connectors
Advances in measurement capabilities make the condition of the physical
connectors and connection techniques more significant than ever.
Keep connectors clean.
Use plastic endcaps during storage. Do not touch mating plane
surfaces. Do not set connectors contact-end-down.
Inspect all connectors before every use. Look for metal particles,
scratches, or dents. Do not use damaged connectors.
Clean the connector threads with compressed air before using. Do not
use abrasives. Do not get liquid onto the plastic support beads.
Align connectors carefully. Make preliminary connection lightly.
To tighten, turn connector nut only. Do not over tighten. Do not apply
bending force to connection. Do not twist or screw in connectors.
2 • Quick Start Guide BitAlyzer1500
Page 9

Connections
Connect Peripherals
The BA1500 supports a touchscreen as well as a mouse and a keyboard.
If you plan to use a mouse and/or keyboard, it is best to connect them before
turning on the power. The connector is located on the rear panel of the
BA1500 (a splitter cable is supplied if you wish to connect both the mouse
and keyboard).
The printer connector is also on the rear panel of the unit.
Printer
Connector
Keyboard/Mouse
Connector
In addition, the Line Power plug and connectors for Ground, Network,
Monitor, Com1, and IEEE-488 (Remote Control) are on the rear panel.
BitAlyzer1500 Quick Start Guide
• 3
Page 10

Connect External Clock Source
The BA1500 Generator uses either its internal clock or an optional external
clock source. The Clock connectors are on the front panel. 50-ohm SMA
cables and connectors are recommended.
Generator
(Blue)
Connectors
Ground
Connector
External
Clock
Connector
Detector
(Green)
Connectors
A Ground connector is provided at the lower left corner the front panel.
Note that the connectors for the Data Generator and Error Detector are color-
coded for easy identification. The connectors on the front panel are:
Generator (Blue) Detector (Green)
Clock+ Output Clock+ Input
Clock– Output Clock– Input
Data+ Output Data+ Input
Data– Output Data– Input
External Clock Input Start Detect Input
Pattern Start Input Marker (TTL Level) Input
Page Select (TTL Level) Input Blank (TTL Level) Input
Trigger Output Error Output
Trigger Output
4 • Quick Start Guide BitAlyzer1500
Page 11

Power On
1. The line power connector is located on the rear panel of the BA1500.
Use the included power cord.
2. Turn on the line power using the power switch on the front panel of
the unit.
1
Line Power
Connector
Power
Switch
2
Upon powering up, the system performs a quick self-check and then the
operating system loads. This takes a few minutes, and may report errors if the
computer or any of its peripherals are damaged. If the keyboard is not plugged
in, WindowsNT® will report that the driver did not initialize properly. A
keyboard is not necessary and this reported error can be ignored if you do not
plan to use one.
If any damage is indicated, contact SyntheSys Research Support at
tech_support@synthesysresearch.com.
BitAlyzer1500 Quick Start Guide
• 5
Page 12
To power-down the unit, first allow the operating system to perform its
shutdown procedures completely. To do so, touch the Shutdown button on
the Control Console. The screen will display a dialog asking if you wish to
terminate only the BA1500 application or shut down the entire system.
In the event of power failure or accidental power disconnect, the unit is very
resilient. You may find that the next time you power up, the boot-up sequence
takes a few moments longer to verify the hard disk file system integrity.
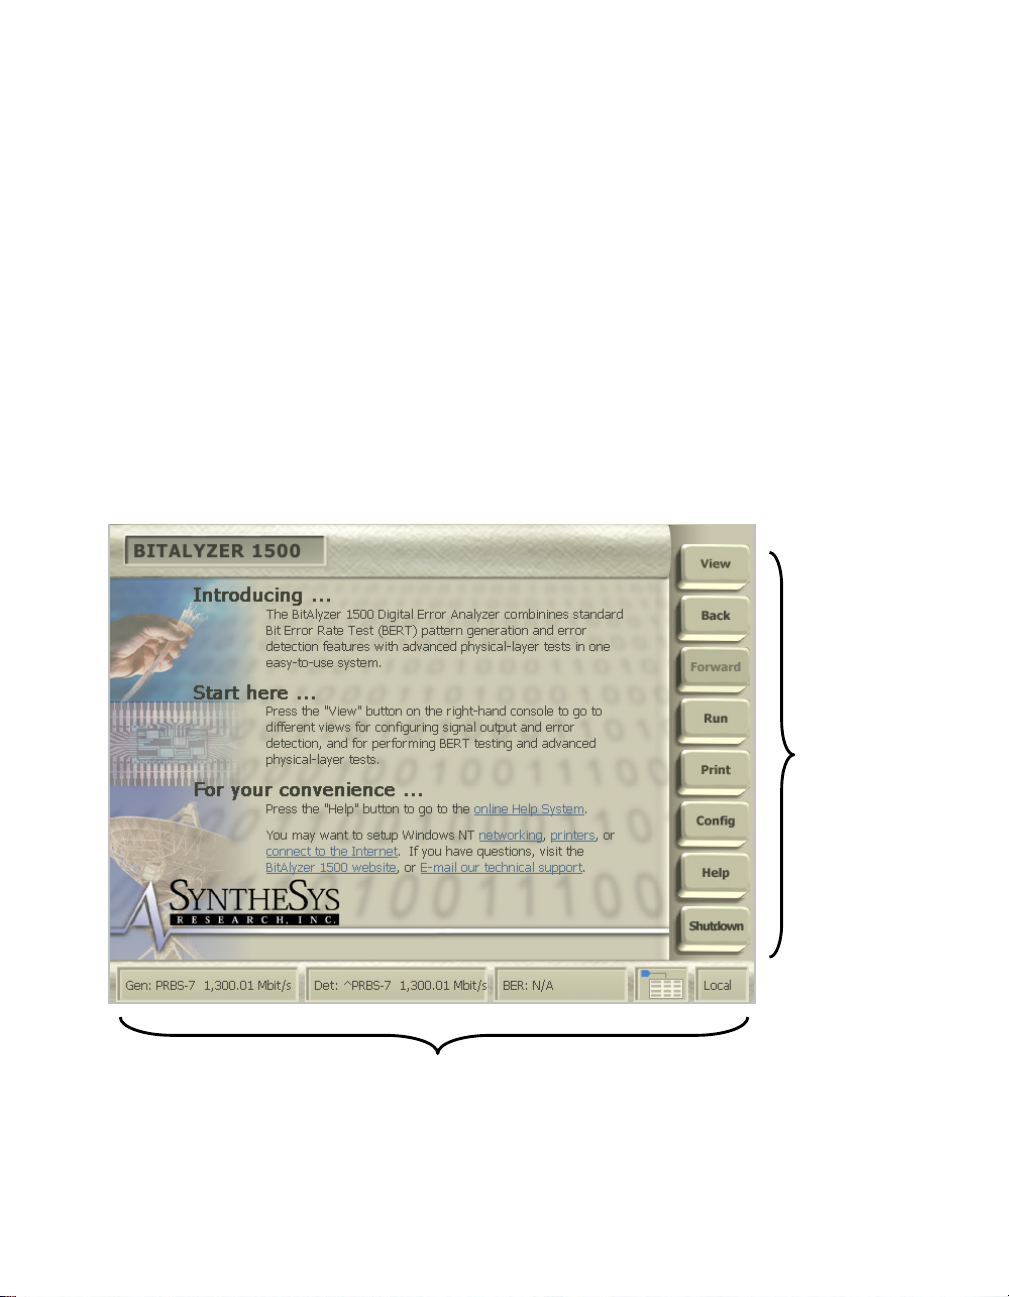
Display Description
The Control Console is permanently displayed on the right side of the touchscreen. At the bottom of the screen is a Status Bar showing the state of the
Generator and Detector, BER statistics, and signal source. The center of the
screen will show the selected view. The first example below is the Home
View:
Control
Console
Status Bar
The Control Console and Status Bar remain visible from all views.
6 • Quick Start Guide BitAlyzer1500
Page 13
A
A
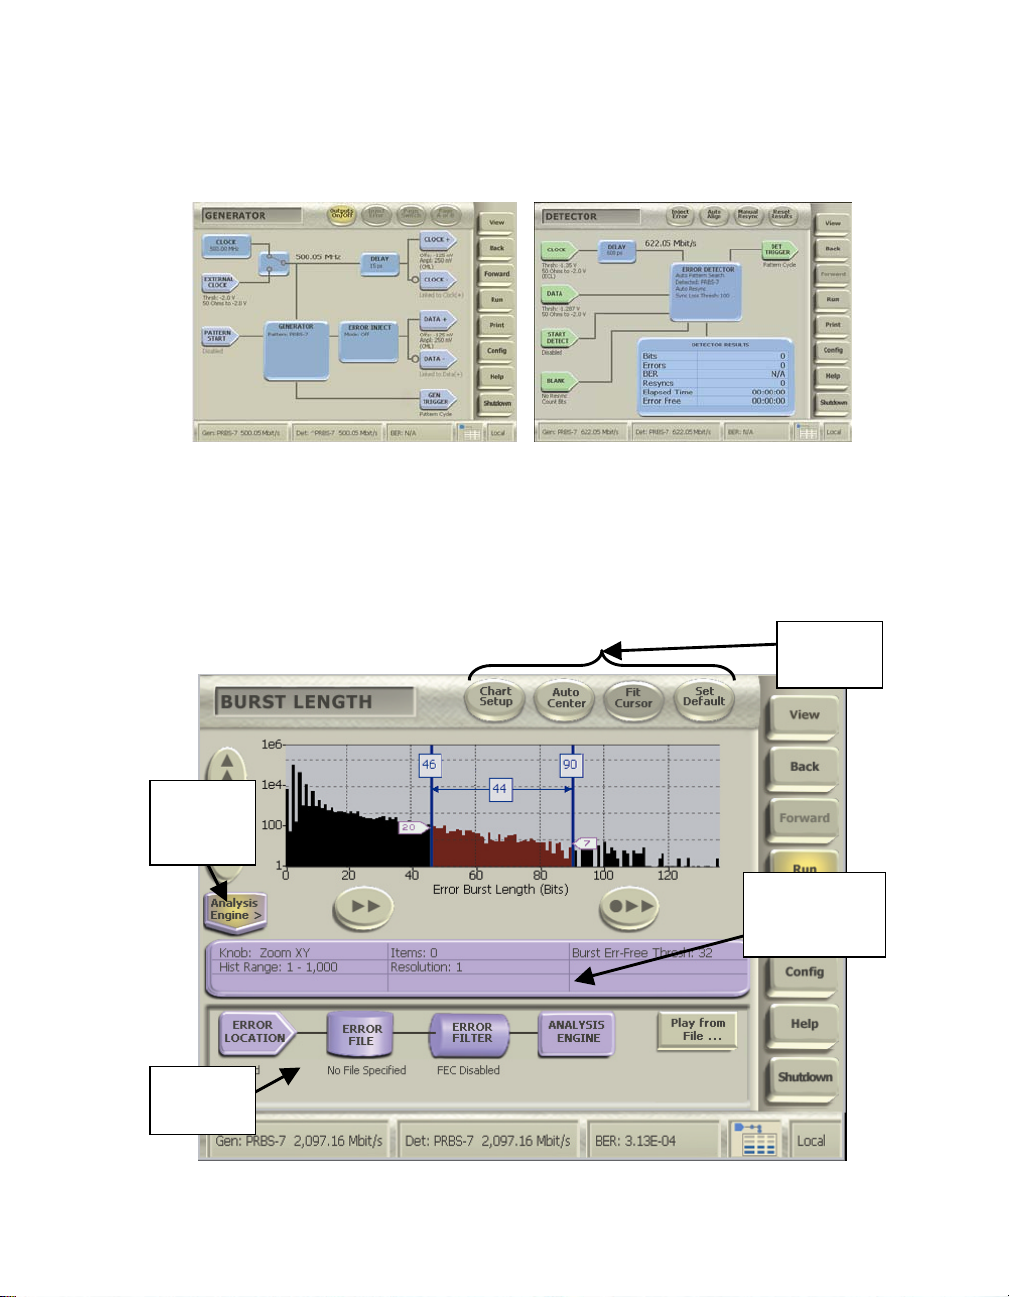
The Generator and Detector Views are presented as a schematic of the
generation or detection process. Touching any of the icons on the screen
accesses settings and help for that element.
In addition to a chart display, Analysis Views include three responsive
sections: Setup buttons across the top, the violet Histogram Information
Panel, and access to the Analysis Console (which is normally hidden, to
allow more room for the chart display). Each of these areas accesses controls
used to set up the appearance of the view and the parameters of the analysis.
nalysis
Engine
Button
nalysis
Console
Setup
Buttons
Histogram
Information
Panel
BitAlyzer1500 Quick Start Guide
• 7
Page 14

Generator Fundamentals
Errors are found by sending a controlled bit stream into a channel and then
performing a bit-for-bit compare on what comes out of the channel. The
Generator provides this controlled data stream, using either industry-common
pseudo-random sequences or a user-defined pattern. The data stream is
synchronized to either an internal or an external clock, and both data and
clock are then passed to the Detector.
Available Settings
Open the Generator View to access the settings. Each icon on the Generator
view opens a menu of its associated parameters. You can select a data type,
the characteristics of input and output data and clock signals, whether or not to
inject errors into the data stream, and the characteristics of those errors. The
pop-up menus for these selections also provide direct access to contextsensitive Help.
Data Patterns
The Generator uses two types of patterns, either a selection of pseudo-random
sequences defined by a generating polynomial (PRBS), or a user-defined
pattern. The user pattern may be a prerecorded file of error information, or a
file created using a Pattern Generation Language (PATLING) to embody
particular features.
Creating a Pattern
The Online Help explains the PATLING pattern generation language. Using
this language, you can create error data files to match specific criteria for
testing. You can also create a pattern by capturing data from the Detector
inputs.
Saving and Playing Back an Error Data File
Open the Editor View to create, open, name, rename, save, or delete an error
data file. Set the Detector Pattern Mode to User Pattern and select a pattern
filename, then touch Run to initiate playback of that file.
Live Signal Generation
Touch the icons on the Generator View to set the characteristics of a
generated signal. Touch the Run button on the Control Console to begin
transmitting.
8 • Quick Start Guide BitAlyzer1500
Page 15

Detector Fundamentals
The BA1500 Error Detector and Analyzer investigates error statistics present
in digital channels. Errors are mismatches between what was expected to be
seen and what was seen during detection. By comparing a specific, known
pattern bit-for-bit with what is detected on the incoming channel, the Detector
can not only count errors, but can pinpoint the exact bit position of errors in
the digital channel.
This error location information provides more than just bit error rate testing.
Using the exact bit location of errors found in the data stream, the BA1500
measures independent bit and burst error statistics, correlates errors to reveal
pattern sensitivities, displays the probability of having error bursts of different
lengths, isolates systematic error sources, and much more, clarifying error
relationships in addition to error counts. The varied types of analysis can
reveal previously undetermined idiosyncrasies of a data channel.
Available Settings
Open the Detector View to access the settings. Each icon on the Detector
view opens a menu of its associated parameters. You can select the
characteristics of input data and clock signals, delay, data patterns, and
synchronization parameters. The pop-up menus for these selections also
provide direct access to context-sensitive Help.
Selecting the Analysis Type
Touch the View button to open the pop-up menu of the available views.
Touch Error Analysis or Physical Layer Test to open second pop-up
lists from which to choose. Error Analysis Views include: Basic BER, Block
Errors, Burst Length, Correlation, Error Free Interval, Pattern Sensitivity,
Strip Chart, and optional views such as FEC Emulation and 2-D Error Map.
Physical Layer Tests include Eye Diagram, BER Contour, Mask Test, Jitter
Peak, and Q-Factor.
Setting Up a View
Each Error Analysis View has an Analysis Engine button at the bottom left
corner that opens an Analysis Console, where most parameters can be set
or changed. Each view has access to its appropriate settings—certain universal
settings affect all views, but can be changed as often as necessary. Touch the
violet Histogram Information Panel to set the Histogram Chart Range
and resolution. The settings are described below under “Important Settings”.
BitAlyzer1500 Quick Start Guide
• 9
Page 16

Graph Options
Touch Chart Setup at the top of the screen, and then touch selections to
control the appearance of a graph. The menu allows you to enable and select
Cursors, Graticule, and Log Scale.
Important Settings to Define Analysis
Integration Period
The Integration Period is used when calculating error rates. Before dividing
the number of errors by the number of bits, you must first wait until enough
bits are generated for the division result to have significance. For instance, if
you have an error rate of one error in 1e2 (100) bits, unless you wait 1e2 bits
before dividing, you will probably get zero as a division result. In this case,
you would want to wait at least 1e4 (10,000) bits before dividing so there
would be two significant digits in the division result.
If your integration period is too long, you may wait awhile before getting an
error rate measurement. If it's too short, you may get "jumpy" error rate
measurements. A good rule of thumb is to take the expected error rate, change
the sign of the exponent, and add two to the exponent. An expected error rate
of 1e-6 translates to an integration period of 1e8.
Burst error identification is reset upon integration period boundaries.
Burst Minimum Length
The Burst Minimum Length parameter is used to distinguish errors as either
being part of a burst or not. Errors that are not part of bursts are known as bit
errors; these are the small, often random, errors.
During basic error analysis, single bit errors are grouped together using the
Burst Error Free Threshold definition described below. The resulting group is
assigned a group length, which is defined to start at the first error of the group
and end at the last error (surrounding error-free segments that are larger than
the threshold are not included in the burst length). This length is then
compared to the Burst Minimum Length parameter and the group is handled
either as a burst or as bits, depending on the outcome.
By incrementing the Burst Minimum Length parameter, you specify that
fewer and fewer error groups should qualify as bursts.
10 • Quick Start Guide BitAlyzer1500
Page 17

Burst Error Free Threshold
Burst errors are characterized as groups of single bit errors that are adjacent to
one another. The Burst Error Free Threshold parameter is used to program the
degree of adjacency that is required to group single bit errors together to form
bursts.
One way to look at the Burst Error Free Threshold is that an error-free
segment that exceeds the threshold terminates a burst, and all bursts are
surrounded by error-free segments that exceed the threshold.
Changing the Burst Error Free Threshold will change the shape of your burst
length profiles because it changes the specification of a burst.
Data Block Size
A Block is a contiguous number of bits for which an error count is calculated.
This is useful for channel error correction analysis. In some cases, error
correction block sizes are fixed due to pre-existing packet frame sizes, sector
sizes, or what-have-you. If you set the BA1500 Block definition to be this
physical size, the Block histogram will show you a profile of how many errors
occur in all the blocks. The shape of this curve will determine an effective
value for the tradeoff between error correction strength and coding overhead.
Histogram Data Range
Each histogram view has a Setup button at the top edge. Touch this button to
open a setup dialog that sets the Start and End x-values for the currently
displayed histogram. These limits define the range of data that will be
analyzed.
Changing these values will clear out any existing data in the histogram. The
Start value must be zero or greater, and less than the End value.
Histogram Bin Mapping
The concept of mapping error positions to histogram bins is important to
understanding error location analysis.
A histogram bin is a software data structure that is used for every histogram to
maintain information. There is a limit of 1000 unique histogram locations that
can be maintained by the BitAlyzer. After this limit is exceeded, then histogram locations are mapped two bit locations to one bin, and then three-to-one,
four-to-one, etc. This allows you to trade off histogram resolution for range.
BitAlyzer1500 Quick Start Guide
• 11
Page 18

For a Histogram Range [Start, End], the Start value is inclusive and the End
value is exclusive. For example, if the range is specified as [0,1000], then
1000 bins are established, from Bin 0 to Bin 999. The bin resolution is one.
Bin 0 contains data [–∞, 1] and Bin 999 contains [999, +∞]. When the range is
greater than or equal to 1001, the bin resolution will be two, or more, as
necessary to include all data within the available bins.
If you need both a large range and detailed resolution, you may have to
perform the analysis in multiple steps. For example, if you want to see error
correlation to a block size of one million bits, you can set Start to 0 (zero) and
End to 1,000,000 to view the overall result. With this range, each bin in the
resulting correlation histogram represents hundreds of correlation bit
positions. Once a correlation is found at one bin location, you can refine the
Start and End points to effectively redirect all the histogram bin resolution to
the one bin of interest. With new settings, you can uniquely resolve each
individual bit position.
12 • Quick Start Guide BitAlyzer1500
Page 19

How to Use the BitAlyzer1500
The following lessons introduce the basic operation of the BA1500. Lesson 1
steps through configuration of the Generator and Detector in a way that allows
you to easily confirm correct E-to-E operation. Lesson 2 presents an example
setup for several Error Location Analysis views, and Lesson 3, the Eye
Diagram.
Lesson 1: Configure Pattern Generator and
Error Detector
Use four cables to connect the Generator Clock+/– and Data+/– to the
Detector Clock+/– and Data+/– on the front panel. Then, to verify that the
Generator and Detector are operating correctly, make the following settings:
1.1 Generator
In a few steps, we will set up the Generator to output PRBS-7 data at a
specified data rate using differential CML voltage levels.
Set External Clock frequency:
1. Touch View on the Control Console, and select the Generator View.
BitAlyzer1500 Quick Start Guide
1
• 13
Page 20

325
4
2. Touch the CLOCK icon on the Generator View to open the Internal
Clock Input settings dialog.
3. Touch Use Keypad on the dialog, and
4. Enter 500 MHz in the pop-up keypad, then touch OK.
5. Verify that the clock rate displayed next to the icon on the Generator
View matches the 500 MHz frequency.
14 • Quick Start Guide BitAlyzer1500
Page 21

Set Data Type to PRBS-7:
1. Touch the GENERATOR button in the center of the view, to open the
Generator settings dialog.
2. Touch Pattern, and
3. Select PRBS-7 from the pop-up list.
1
3
2
BitAlyzer1500 Quick Start Guide
• 15
Page 22

4
625
Set logic family to LVDS:
1. Touch the CLOCK+ Output icon to open the Clock Output setting
dialog.
2. Make sure Link Clock +/- Signals is checked.
3. Touch Logic Family on the dialog, and
4. Touch CML on the pop-up list.
3
1
5. Repeat the same steps using the DATA+ Output icon.
6. Touch Outputs On/Off to enable the Clock and Data outputs.
At this moment, the Pattern Generator is transmitting PRBS-7 data at 500
Mbit/sec on the differential clock and data outputs set to industry-standard
CML levels.
16 • Quick Start Guide BitAlyzer1500
Page 23

4
&
5
1.2 Detector
Next, we will set up the Detector to accept differential CML signals and make
a bit error rate measurement.
Set Logic Family to LVDS:
1. Touch the View button and select the Detector View.
2. On the Detector View, touch the CLOCK Input icon to open the
Clock Input settings dialog.
3. Touch Interface Mode on the dialog, and
4. Touch Differential on the pop-up list.
2
3
5. Touching CLOCK again, touch Logic Family on the dialog, and
6. Touch CML on the pop-up list.
1
BitAlyzer1500 Quick Start Guide
• 17
Page 24

7. In the same way, set the Data Input Logic Family. Begin by
touching the DATA Input icon to open the Data Input settings
dialog.
8. After setting the Interface Mode to Differential, Touch DATA
again and then Logic Family.
9. Touch CML on the pop-up list.
7
8
9
18 • Quick Start Guide BitAlyzer1500
Page 25

4
Set Data Type to Automatic Pattern Detect:
1. Touch the ERROR DETECTOR icon.
2. Select Auto Pattern from the pop-up list. This enables the Detector
to search all its known PRBS data patterns when acquiring
synchronization.
3
1
2
3. Touch Aut o Al i g n to optimize the data measurement point with the
incoming data signal. This moves the delay timing and voltage
threshold to find the optimum sampling point in the received eye for
making BER measurements*.
4. Verify the data pattern type and data rate, displayed on the Status Bar
at the bottom of the screen for both the Generator and Detector.
*
You may be asked to recalibrate the delay element when you touch Auto Align. The instrument
monitors changes in data frequency and temperature and can automatically recalibrate its built-in
variable delay element i n less than one second.
BitAlyzer1500 Quick Start Guide
• 19
Page 26

1.3 If Synchronization is Not Achieved
If the Generator and Detector are not in sync, there is no sense in going on
until the situation is remedied. There are certain things that can cause a nosync condition.
1. Carefully examine cable connections and polarity, making any
corrections needed.
Examine the Generator and Detector views to confirm:
2. Status Bar indicates Sync. When sync is achieved, the status bar will
show the data type and data rate for both the Generator and Detector.
Otherwise, the bar will be bright yellow, displaying a “No Sync” error
message.
3. Data Type is PRBS-7. If not:
Generator and, if necessary, reset to PRBS-7. Check for correct Data
Type setting on Detector and, if necessary, reset to Auto Detect.
4. Generator Clock Rate is 500 MHz. If not:
Clock setting. If necessary, reset to 500 MHz.
5. Clock+/– and Data+/– Output and Input Logic Family configurations
match. If not: Check Logic Family configurations (both Logic Type
and Single-Ended or Differential) for the Generator: External Clock,
Clock+ Output, and Clock– Output, Data+ Output and Data– Output.
If necessary, set to the same configuration as the Detector inputs.
Check Logic Family configurations for the Detector: Clock Input and
Data Input. If necessary, set to the same configuration as the Generator
outputs.
6. Retry for synchronization.
Check for correct Data Type setting on
Check for correct Generator
20 • Quick Start Guide BitAlyzer1500
Page 27

3
4
5
1.4 Reset to Zero
Reset BER and Resyncs to zero:
1. Press Run on the Control Console; press Run a second time to stop.
2. Touch the Reset Results button at the top of the screen.
Verify Zero BER/Zero Resyncs:
2
1
3. Verify that the Detector is showing a data type of PRBS-7, and
4. The input clock rate matches the 500 MHz rate being transmitted by
the Generator.
5. The Detector Results box indicates a BER of zero and no resyncs.
BitAlyzer1500 Quick Start Guide
• 21
Page 28

Lesson 2: Perform Error Location Analysis
This lesson will introduce Error Location Analysis with three examples from
the views available. Our goal is to turn on the error injector for 32-bit bursts at
the default interval of 312,512 bits, then measure the bit and burst error rates
using the Basic BER View, the Burst Length profile (you should see a spike at
32 bits), and then the Error Free Interval profile (you should see a spike at
error free intervals of 312,480).
Following these step-by-step processes will familiarize you with most of
parameters, settings, and controls involved in using the BitAlyzer1500. After
completing the lesson, you will be able to make use of Error Location
Analysis without difficulty.
22 • Quick Start Guide BitAlyzer1500
Page 29

5
6
4
2.1 Set Up a Test Case
Set up Error Injection:
Let’s generate some error bursts, to see what shows up on the analysis
histograms. By enabling the Error Injector in the Generator, you can set a
specific burst error length and interval, and then observe exactly what the
Detector finds.
1. Using either the Control Console View button, or touching the
Generator field in the Status Bar, open the Generator View.
2. Touch the ERROR INJECT button
3. Touch Mode.
4. Select Continuous from the pop-up list.
5. Touching Error Inject again, touch Type, and select 32-Bit Burst.
6. Touch Error Inject, and check the value displayed as Interval (the
number of bits between error injections). The default value is 312,512
bits. If a different interval is displayed, touch Interval and select
Default on the pop-up dialog. This will reset the default interval of
312,512 bits.
1
2
3
BitAlyzer1500 Quick Start Guide
• 23
Page 30

2.2 Select Basic BER View
Select the Basic BER View:
1. On the BA1500 Control Console, touch the View button.
2. Touch Error Analysis.
3. Touch Basic BER on the second pop-up menu.
1
2
3
24 • Quick Start Guide BitAlyzer1500
Page 31
4
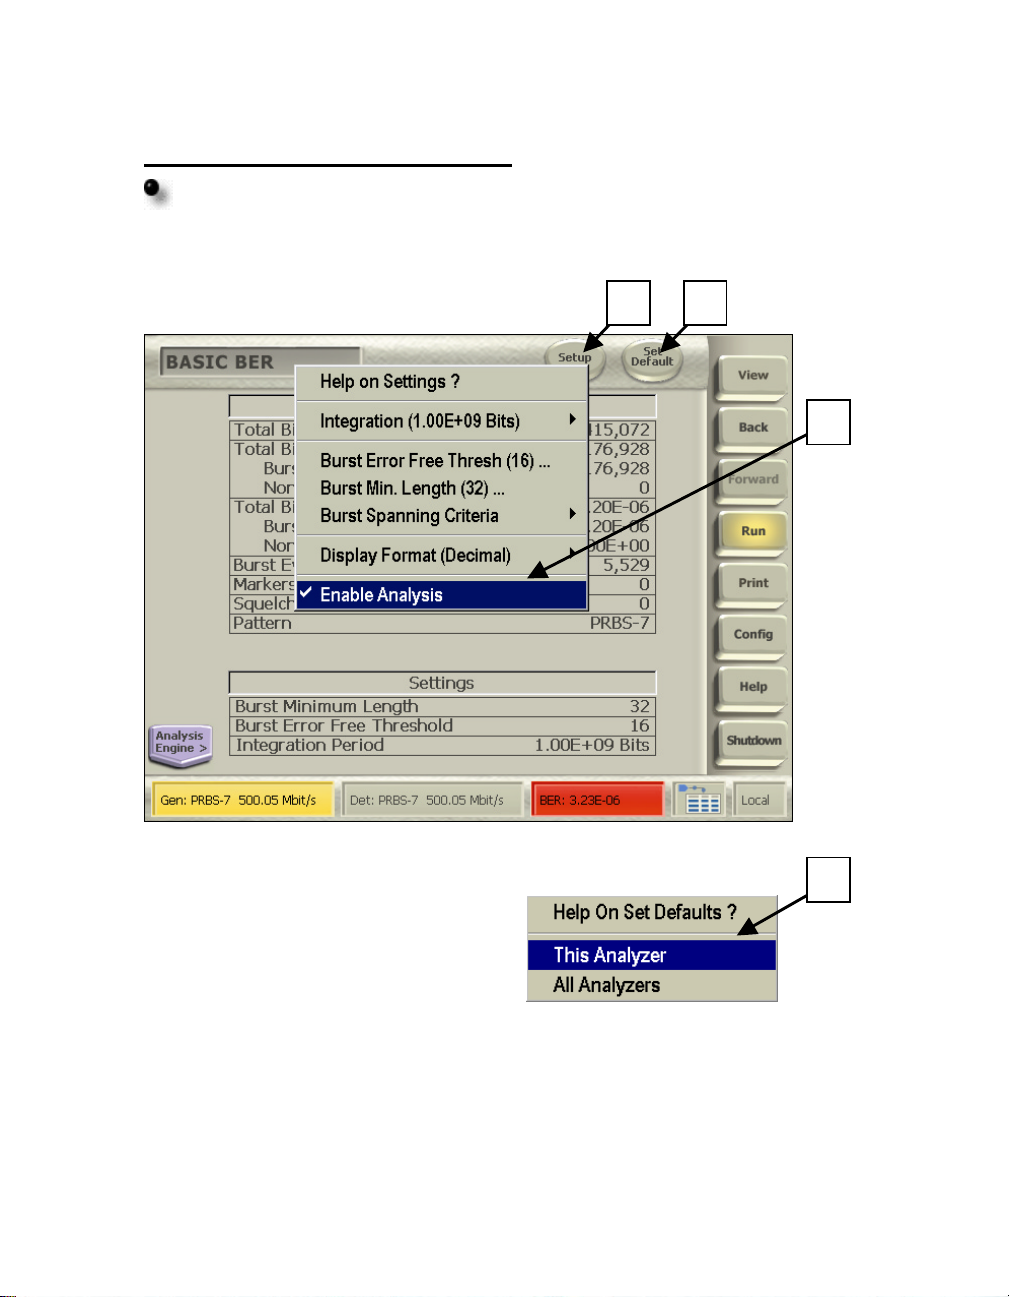
2.3 Choose the Parameters
For this case, use the Default settings:
1. Touch Setup.
2. Touch Enable Analysis.
1
3
2
3. Touch the Set Defaul t button.
4. Touch This Analyzer.
BitAlyzer1500 Quick Start Guide
• 25
Page 32

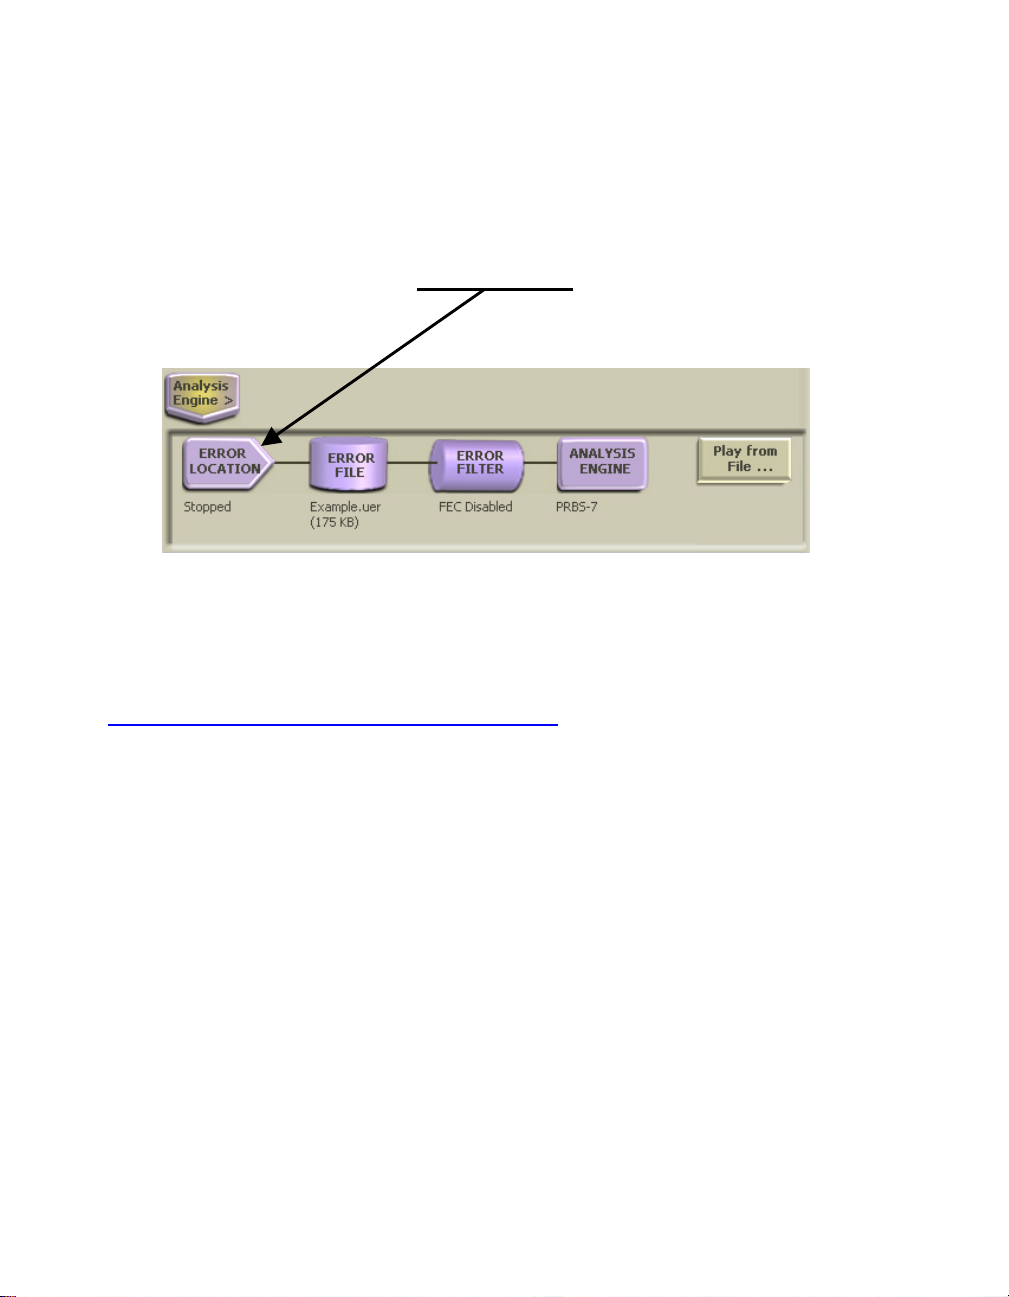
A
If you wanted to change these settings, you would touch Setup, touch the
name of a parameter, and then set it using the pop-up keypad. These settings
are also available from the Analysis Console (touch the violet Analyzer
Engine button to open it, and then touch the Analysis Engine button inside
the console).
For our test case, we will leave all of these parameters at their default settings.
Setup
Button
nalysis
Engine
Buttons
26 • Quick Start Guide BitAlyzer1500
Page 33

4
2.4 Basic BER Data
This selection will analyze live data transmission from a Generator.
1. Touch Run on the Control Console.
2
1
3
The Basic BER display includes Total Bits, Total Errors (Burst Related and
Non-Burst Related), Total Bit Error Rate (Burst Related and Non-Burst
Related), Burst Events, Markers, Pattern, Starting Mode, and Settings for
Burst Minimum Length, Burst Error Free Threshold, and Integration Period.
The BER calculations depend upon your values for Burst Minimum Length,
Burst Error Free Threshold, and Integration Period.
Because we have set a Burst Length of 32 bits, injected every 312,512 bits,
and left Burst Error Free Threshold and Integration Period at their default
settings (32 bits and 1.00E+09 bits, respectively), the error rates can be
predicted:
2. A Burst Related Error Rate of 1.02E–04.
3. A Non-Burst Related Error Rate of 0.00E+00 (zero), and
4. A Total Error Rate equaling the Burst Related Error Rate.
Note that the Basic BER view does indeed show these measurements.
BitAlyzer1500 Quick Start Guide
• 27
Page 34

2.5 Select Burst Length View
To select the Burst Length View:
1. Touch the View button.
2. Touch Error Analysis.
3. Touch Burst Length on the second pop-up menu.
1
2
3
2.6 Burst Length Parameters
Using the same parameters already set (a 32-bit error injected into the
PRBS-7 pattern every 312,512 bits), you would expect to see an error burst
length corresponding to the 32 bits of the injected error.
28 • Quick Start Guide BitAlyzer1500
Page 35

2.7 Burst Length Data
This selection will analyze live data transmission from a Generator.
1. Make sure that the Detector is in Run mode.
1
Horizontal
Pan
Horizontal
Zoom
As expected, you can clearly see the spike of error bursts on the histogram. To
verify the length of 32 bits, zoom in on the spike.
Touch the Zoom button below the chart, then touch anywhere inside the
histogram chart and drag to zoom. To pan, touch the pan button, and then
touch and drag on the chart. You can also bring up cursors by touching Chart
Setup and selecting the cursor(s) you want displayed. To position a cursor,
touch its “handle” (the box showing its position), then drag it into place.
Once you have zoomed in on the data, you can see that the spike of bursts in
the data is at a length of 32 bits.
BitAlyzer1500 Quick Start Guide
• 29
Page 36

2.8 Select Error Free Interval View
To select the Error Free Interval View:
1. Touch the View button.
2. Touch Error Analysis.
3. Touch Error Free Interval on the second pop-up menu.
1
2
3
2.9 Error Free Interval Parameters
Using the same parameters already set (a 32-bit error injected into the
PRBS-7 pattern every 312,512 bits), you would expect to see an error free
interval corresponding to that 312,512 number:
[(312,512-bit interval) – (32-bit burst error)] = 312,480-bit Error Free Interval.
30 • Quick Start Guide BitAlyzer1500
Page 37

2.10 Error Free Interval Data
This selection will analyze live data transmission from a Generator
1. Make sure that the Detector is in Run mode.
2. Touch Auto Center to scale the chart to the data, or touch anywhere
inside the histogram chart and drag your finger to the left to zoom out
so that the anticipated range of data is shown.
2
1
There is an obvious spike in the vicinity of 300,000. To verify the precise
location, the next section will explain how you can adjust the histogram range
and resolution to see an exact bit-for-bit representation of the EFI.
BitAlyzer1500 Quick Start Guide
• 31
Page 38

3
4
Adjust Histogram Range and Resolution
Once you have seen the “rough” data, you can change the histogram range to
get one-bit resolutions and show the exact error free interval value. Each
histogram contains 1000 bins, each representing 1/1000th of the data contained
in the histogram range. By adjusting the range start and end values, you can
narrow the parameters until the chart reveals the precise location of your data.
1. Touch anywhere on the violet Histogram Information Panel to
open the Histogram Settings dialog.
2. Touch Hist(ogram) Start. In this case, we know where the interval
should appear, so we can shortcut the trial-and-error method. Enter
312,450 bits on the keypad, and touch OK.
3. Touch Hist End, and enter 312,550 bits.
4. If the Resolution does not already show “1”, touch Hist Resolution
and enter 1.
1
2
32 • Quick Start Guide BitAlyzer1500
Page 39

The EFI chart will zoom in precisely on the range specified.
1. Another way to get an exact bit-count is to touch Chart Setup and
enable the Bits cursors.
2. Touch a cursor label and drag the cursor onto the spike. The cursor
label will display its exact bit location, thus verifying the Error Free
Interval of 312,480 bits:
[(312,512-bit interval) – (32-bit burst error)] = 312,480-bit Error Free Interval.
BitAlyzer1500 Quick Start Guide
1
2
• 33
Page 40

Lesson 3: Eye Diagram
3.1 Select Eye Diagram View
To select the Eye Diagram View:
1. Touch View.
2. Touch Eye Diagram on the pop-up menu (if you have purchased the
Optional Physical Layer Testing capability, a Physical Layer Tests
item will appear on the View menu. Touch this, and then select Eye
Diagram from the second pop-up menu).
1
2
34 • Quick Start Guide BitAlyzer1500
Page 41

3.2 Choose Eye Diagram Parameters
Set up the Eye Diagram to show the areas of most interest:
1. Touch Eye Setup.
2. Select cursors, set Persistence, and select whether to Measure Edges at
80%-20% or 90%-10%. Other than turning on the cursors, you can
leave these settings at their defaults for the purpose of our illustration.
3. Touch Run on the Control Console.
1
2
3
BitAlyzer1500 Quick Start Guide
• 35
Page 42
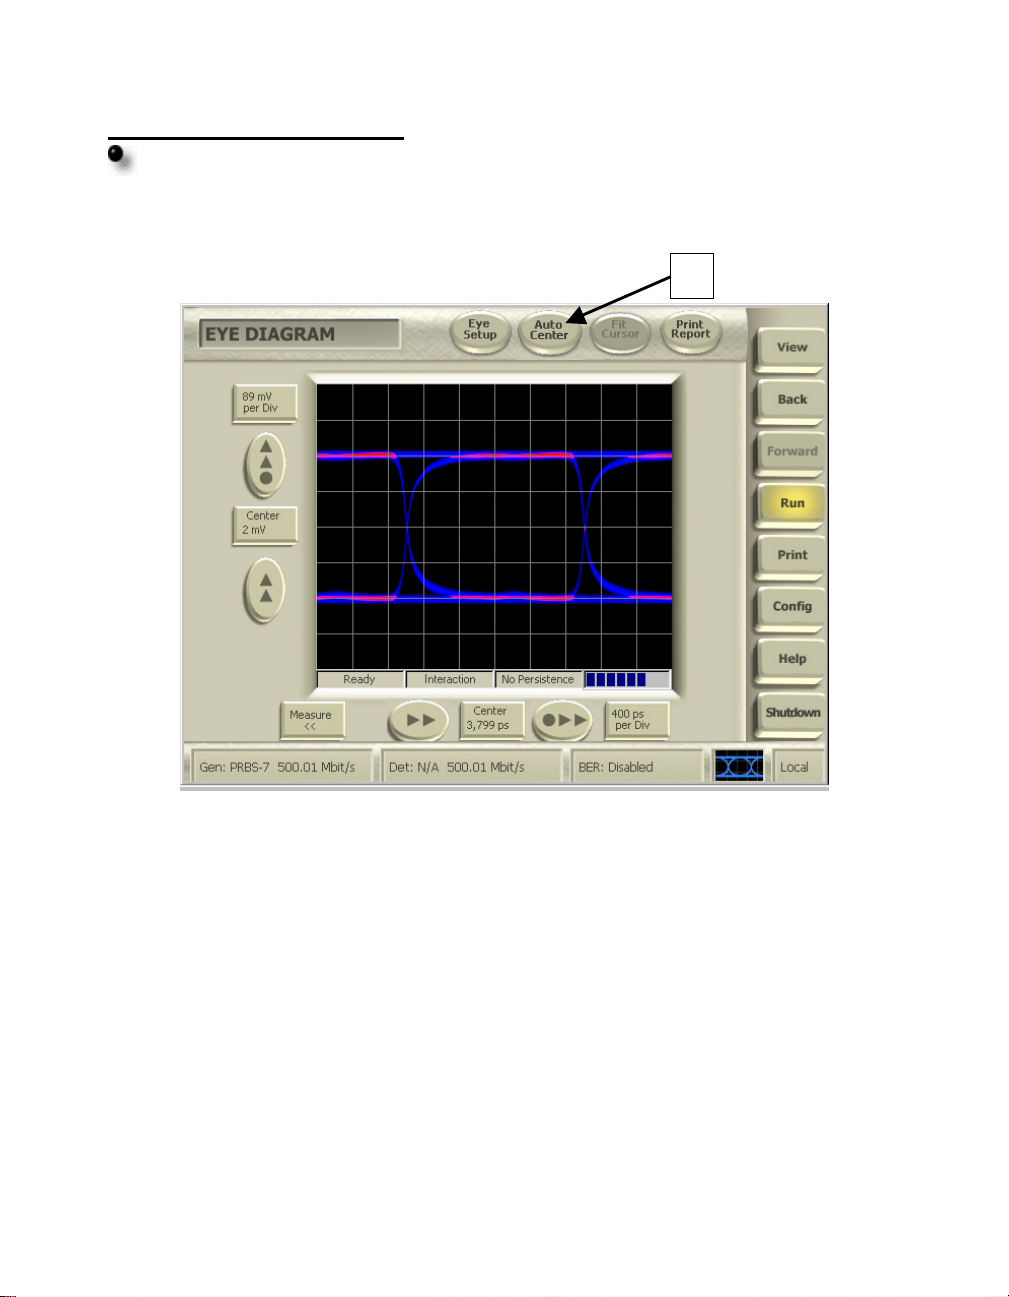
3.3 View Eye Diagram
Display all of the data on one screen:
1. Touch Auto Cente r at the top of the screen, to scale the chart so that
a complete eye can be seen.
1
36 • Quick Start Guide BitAlyzer1500
Page 43

Examine your data more closely:
1. Zoom and pan to see more detail.
! Touch the Vertical Zoom button at the left edge of the chart.
Touch the display and drag up, or turn the front panel knob
clockwise.
! Touch Horizontal Pan at the bottom of the chart. Touch the
display and drag down, or turn the front panel knob counterclockwise.
Zoom
(Vertical)
Pan
(Horizontal)
BitAlyzer1500 Quick Start Guide
• 37
Page 44

3.4 Make Eye Measurements
Use the cursors to make measurements:
1. Touch a cursor “handle” (the measurement box) and drag the cursor
into position to measure a feature of the eye. The measurement shown
in the box will update automatically.
Amplitude
Cursors
1
Time Delay
Cursors
38 • Quick Start Guide BitAlyzer1500
Page 45

Or, touch Measure to use the Measurement Panel:
1. Touch the Measure button at the lower left of the screen to open a
Measurement Panel. Touch a labeled button on the panel to enable that
measurement. The measurement can be displayed on the eye diagram.
2. In the illustration, green arrows indicate measurement of the Eye
Width at 1977 picoseconds.
1
2
Measurement
Panel
BitAlyzer1500 Quick Start Guide
• 39
Page 46
Conclusion
To learn more about your BitAlyzer, visit the Error Location Analysis™
section of the Help system on your unit. This help topic includes a tutorial that
introduces the diagnostic creativity of the patented Error Location Analysis
process. You will find a link to Error Location Analysis on the Home View
page of Help, or you can touch Error Location in the Analysis Console,
and then “Help on Error Analysis.”
Visit the SyntheSys Research, Inc., website to view a video demonstration of
the BitAlyzer1500. The Error Analysis tutorial is also available on our
website:
www.synthesysresearch.com/BA1500.htm.
40 • Quick Start Guide BitAlyzer1500
Page 47

Index
A
Analysis.................................................24
Analysis Engine Button......................9
Basic BER.........................................24
Burst Length .....................................28
Error Free Interval ............................30
Eye Diagram.....................................34
Important Settings.............................10
Selecting a View.................................9
Analysis Console...........................7, 9, 26
Auto Align.............................................19
Auto Center .....................................31, 36
Auto Pattern Detect ...............................19
B
Basic BER Analysis...............................24
Bins........................................................11
Block Size..............................................11
Burst ......................................................11
Error Free Threshold.........................11
Minimum Length..............................10
Burst Error Free Threshold....................11
Burst Length Analysis...........................28
Burst Minimum Length.........................10
C
Calibration...............................................2
Clock
Connectors..........................................4
Frequency .........................................13
Color Coding...........................................4
Configuration
Detector.............................................17
Generator ..........................................13
Connectors
Clock Source.......................................4
Color Coding ......................................4
External Clock....................................4
Front Panel..........................................4
Ground................................................4
IEEE-488 ............................................3
Keyboard.............................................3
Line Power..........................................3
Maintaining.........................................2
Monitor...............................................3
Mouse.................................................3
Network..............................................3
Peripherals..........................................3
Rear Panel...........................................3
Control Console.......................................6
Cursors
Bits and BER Cursors.......................33
Dragging...........................................33
Fit Cursor ..........................................36
Volts and Time Cursors....................38
D
Data Block Size.....................................11
Data Type
Set Detector ......................................19
Set Generator..............................15, 17
Detector...................................................9
Analysis Type.....................................9
Clock Input.......................................17
Configuration....................................17
Data Input.........................................18
Data Type .........................................19
Detector View ...................................17
Fundamentals......................................9
Important Settings.............................10
Logic Family.....................................17
Settings ...............................................9
Test Case...........................................17
Display Description.................................6
E
Email .......................................................2
Error Analysis Views ..............................9
Error Free Interval Analysis..................30
Error Injection .......................................23
Error Location Analysis ........................22
Test Case...........................................23
Error Rates.............................................27
Eye Diagram Analysis...........................34
Measurement Panel...........................39
Measurements...................................38
Setup.................................................35
BitAlyzer1500 Quick Start Guide
• 41
Page 48

F
Fit Cursor...............................................36
G
Generator.................................................8
Clock Input .......................................13
Configuration....................................13
Data Patterns.......................................8
Data Type....................................15, 17
Fundamentals......................................8
Generator View.................................13
Logic Family.....................................16
Settings................................................8
Test Case...........................................23
Ground.................................................3, 4
H
Histogram Bins......................................11
Histogram Data Range...........................11
Setup .................................................32
Histogram Information Panel...............7, 9
I
Important Settings..................................10
Integration Period ..................................10
K
Keypad...................................................14
L
Link Output Signals...............................16
Logic Famil y
Detector.............................................17
Generator ..........................................16
M
Measurement Panel................................39
Measurements........................................38
P
Panning............................................29, 37
Physical Layer Tests..........................9, 34
Power
Connectors..........................................5
Failure.................................................6
Power On ............................................5
Shutdown............................................6
PRBS Patterns..........................................8
R
Reset to Zero..........................................21
S
Self-Test ..................................................5
Settings................................................8, 9
Analysis ............................................10
Analysis Console................................7
Burst Error Free Threshold...............11
Burst Minimum Length ....................10
Data Block Size ................................11
Data Patterns.......................................8
Detector...............................................9
Detector Clock Input.........................17
Detector Logic Family......................17
Error Injection...................................23
Generator ............................................8
Generator Data Type...................15, 17
Generator External Clock .................14
Generator Logic Family....................16
Histogram Data Range......................11
Histogram Information Panel..............7
Important Settings.............................10
Integration Period .......................10, 25
Shipped Items..........................................1
Status Bar.................................................6
Support ....................................................2
Switch....................................................16
Synchronization.....................................20
Sync Not Achieved...........................20
T
Technical Support....................................2
Test Case
Basic BER Data................................27
Basic BER Setup...............................25
Burst Length Analysis ......................28
Burst Length Data.............................29
Burst Length Setup ...........................28
Error Free Interval Data....................31
Error Free Interval Setup ..................30
Eye Diagram.....................................34
Eye Diagram Data.............................36
Eye Diagram Measurements.............38
Eye Diagram Setup...........................35
Generator Setup ................................23
42 • Quick Start Guide BitAlyzer1500
Page 49

U
Unpacking the Box..................................1
V
View
Basic BER.........................................24
Burst Length .....................................28
Chart Setup .......................................10
Detector.........................................7, 17
Editor.................................................. 8
Error Analysis Menu...........................9
Error Free Interval ............................30
Eye Diagram.....................................34
Generator......................................7, 13
Important Settings.............................10
Physical Layer Test Menu..................9
Selecting .............................................9
Setting Up...........................................9
W
Website....................................................2
Z
Zooming..........................................29, 37
BitAlyzer1500 Quick Start Guide
• 43
 Loading...