

Page 1

Page 2

Page 3

Page 4

Instrument Serial Numbers
Each instrument manufactured by Tektronix has a serial number on a panel insert or tag, or stamped on the
chassis. The first letter in the serial number designates the country of manufacture. The last five digits of the
serial number are assigned sequentially and are unique to each instrument. Those manufactured in the
United States have six unique digits. The country of manufacture is identified as follows:
B010000 Tektronix, Inc.,
E200000 Tektronix United
J300000
H700000 Tektronix Holland, NV, Heerenveen, The Netherlands
Instruments manufactured for Tektronix by external vendors outside the United States are assigned a two digit
alpha code to identify the country of manufacture (e.g., JP for Japan, HK for Hong Kong,
Tektronix, Inc., RO.
Printed in U.S.A.
Copyright © Tektronix, Inc., 1992. All rights reserved. Tektronix products are covered by U.S. and foreign
patents, issued and pending. The following are registered trademarks: TEKTRONIX, TEK, TEKPROBE, and
SCOPE-MOBILE.
Sony/Tektronix,
Box
500, Beaverton, OR 97077
Beaverton,
Kingdom,
Japan
Oregon, USA
Ltd., London
IL
for Israel, etc.).
Page 5

WARRANTY
Tektronix warrants that this product will be free from defects in materials and workmanship for a period of
one (1) year from the date of shipment. If any such product proves defective during this warranty period,
Tektronix, at its option, either will repair the defective product without charge for parts and labor, or will provide
a replacement in exchange for the defective product.
In order to obtain service under this warranty, Customer must notify Tektronix of the defect before the
expiration of the warranty period and make suitable arrangements for the performance of service. Customer
shall be responsible for packaging and shipping the defective product to the service center designated by
Tektronix, with shipping charges prepaid. Tektronix shall pay for the return of the product to Customer if the
shipment is to a location within the country in which the Tektronix service center is located. Customer shall be
responsible for paying all shipping charges, duties, taxes, and any other charges for products returned to any
other locations.
This warranty shall not apply to any defect, failure or damage caused by improper use or improper or
inadequate maintenance and care. Tektronix shall not be obligated to furnish service under this warranty a) to
repair damage resulting from attempts by personnel other than Tektronix representatives to install, repair or
service the product; b) to repair damage resulting from improper use or connection to incompatible
equipment; or c) to service a product that has been modified or integrated with other products when the effect
of such modification or integration increases the time or difficulty of servicing the product.
THIS WARRANTY IS GIVEN BY TEKTRONIX WITH RESPECT TO THIS PRODUCT IN LIEU OF ANY
OTHER
IMPLIED WARRANTIES OF MERCHANTABILITY OR FITNESS FOR A PARTICULAR PURPOSE.
TEKTRONIX1 RESPONSIBILITY TO REPAIR OR REPLACE DEFECTIVE PRODUCTS IS THE SOLE AND
EXCLUSIVE REMEDY PROVIDED TO THE CUSTOMER FOR BREACH OF THIS WARRANTY. TEKTRONIX
AND ITS VENDORS WILL NOT BE LIABLE FOR ANY
CONSEQUENTIAL DAMAGES IRRESPECTIVE OF WHETHER TEKTRONIX OR THE VENDOR HAS
ADVANCE NOTICE OF THE POSSIBILITY OF SUCH DAMAGES.
WARRANTIES,
EXPRESSED OR IMPLIED. TEKTRONIX AND ITS VENDORS DISCLAIM ANY
INDIRECT,
SPECIAL, INCIDENTAL, OR
Page 6

Page 7

This manual is one of a set of product manuals for the Tektronix 495 and
programmable 495P Spectrum Analyzers. The manual describes the instru-
ment installation and operation. These instructions assume a thorough
knowledge of frequency domain analysis. The purpose of this manual is to
explain the operation of the 495 and 495P so that measurements will be
meaningful whether made under adverse or laboratory conditions. The
manual organization is shown in the Table of Contents. The manuals that are
available in addition to this 495/495P User Manual include the following:
Standards and
Conventions
Change/History
Information
• 495/495P Service
• 495P Programmer Manual (standard accessory for 495P Option only)
For manual ordering information, contact your local Tektronix Field Office or
representative or refer to the Accessories portion of the Replaceable
chanical Parts list in the 495/495P Service Manual, Volume 2.
Most terminology is consistent with standards adapted by IEEE and IEC. A
glossary of terms is provided in Appendix A. Abbreviations in the documen-
tation are consistent with ANSI
IEEE 488-1978 standard. Copies of ANSI and IEEE standards can be
ordered from the Institute of Electrical and Electronic Engineers Inc.
Any change information that involves manual corrections or additional
information is located behind the Change Information page at the back of
this manual.
Manuals,
Volume 1 and 2
Y1.1-1972.
GPIB
functions conform
Me-
to
the
Unpacking and
Initial Inspection
Storage and
Repackaging
495 & 495P User Manual
Instructions for unpacking and preparing the instrument for use are de-
scribed in Section 3.
Instructions for short- and long-term storage and instrument repackaging for
shipment are described in Section 3.
Page 8

Preface
IF
Preface
Page 9

495 & 495P User Manual
Page 10
Table of Contents
/v
Contents
Page 11
Operation
Table of Contents
495 & 495P User Manual
Page 12
Table of Contents
vi
Contents
Page 13
495 & 495P User Manual
vu
Page 14

List of Figures
via
Contents
Page 15

495 & 495P User Manual
flf
Page 16

List of Tables
Contents
Page 17
Please take a moment to review these safety precautions. They are provided
for your protection and to prevent damage to the spectrum analyzer. This
safety information applies to all operators and service personnel.
Symbols
and
Terms
These
two
terms
aPPear
statements identify conditions or practices that could result in
damage to the equipment or other property.
|
WARNING
l
statements
personal injury or loss of life.
These two terms appear on equipment:
• CAUTION indicates a personal injury hazard not immediately accessible
as one reads the marking, or a hazard to property including the equip-
ment itself.
• DANGER indicates a personal injury hazard immediately accessible as
one reads the marking.
in
manuals:
identify
conditions
or
practices
that
could
result
in
495 & 495P User Manual
XI
Page 18

Safety
Specific
PreC3UtionS
Observe
prevent damage to either the spectrum analyzer or equipment connected to
it.
all of
these
precautions
to
ensure
your
personal
safety
and to
Power Source
The spectrum analyzer is intended to operate from a power source that will
not
apply
more
than
250
VRMS
between
either supply conductor and ground. A protective ground connection,
through the grounding conductor in the power cord, is essential for safe
system operation.
the
supply
conductors
or
Grounding the Spectrum Analyzer
The spectrum analyzer is grounded through the power cord. To avoid elec-
tric shock, plug the power cord into a properly wired receptacle where earth
ground has been verified by a qualified service person. Do this before mak-
ing connections to the input or output terminals of the spectrum analyzer.
Without the protective ground connection, all parts of the spectrum analyzer
are potential shock hazards. This includes knobs and controls that may
appear to be insulators.
between
Use the Proper Power Cord
Use only the power cord and connector specified for your product. Use only
a power cord that is in good condition.
Use the Proper Fuse
To avoid fire hazard, use only the fuse specified m the parts list for your
product, matched by type, voltage rating, and current rating.
Do Not Remove Covers or Panels
To avoid personal injury, do not operate the spectrum analyzer without the
panels or covers.
Electric Overload
Never apply to a connector on the spectrum analyzer a voltage that is outside the range specified for that connector.
Do Not Operate in Explosive Atmospheres
The spectrum analyzer provides no explosion protection from static dis-
charges or arcing components. Do not operate the spectrum analyzer in an
atmosphere of explosive gases.
Xfi
Safety
Page 19

Page 20

Safety
XIV
Safety
Page 21

Product Overview
The TEKTRONIX 495 and programmable 495P Spectrum Analyzers are high
performance, compact, portable instruments. Microcomputer control of most
functions simplifies and enhances operation.
The following is a list of the main instrument features:
• Single and delta marker modes
• Synthesizer frequency accuracy
• Precision signal counting ability
• Precise amplitude measurement capability
• Digital storage display
• Internal memory to retain front-panel settings and displays
• HELP messages (CRT readout) that describe the function of front-panel
keys and controls as well as messages that explain operating errors
• Front-panel DATA ENTRY push buttons
• Ability to plot the display, readout, and graticule
• Ability to hold 8 personalized macros in memory (programmable instru-
ments only)
• 10 Hz to 3 MHz resolution
495 & 495P User Manual
Basic Features
The frequency range is 100
bandwidth of 10 Hz, with a minimum span of 10 Hz/Div, provides measurement resolution that is proportional to the frequency accuracy. Digital stor-
age provides flicker-free displays plus SAVE A, B-SAVE
to compare and subtract displays and save maximum values. In addition to
conventional digital storage features, internal memory stores up to nine
separate displays with their readouts and dot markers, which can be recalled later for additional analysis and comparison. It is also possible to
store up to ten different front-panel control setups for future recall. The
signal counting feature allows the instrument to selectively count a particular
signal out of several that may be present at its input.
Hz
to 1800 MHz. A minimum resolution
A,
and MAX HOLD
1-1
Page 22

General Information
Select center frequency either by the front-panel CENTER/MARKER FREQUENCY control or by the Data Entry push buttons. When using the Data
Entry push buttons, it is not necessary to alter the Span/Div setting regardless of the frequency selected. Other parameters, such as vertical display
and reference
available only under program control of the general purpose interface bus
(GPIB).
level,
are push button selectable with the flexibility previously
Markers
The single and delta markers provide direct readout of frequency and amplitude information of any point along any displayed trace. Relative (delta)
frequency and amplitude information between any two points along any
displayed trace or between traces is also available. The CENTER/MARKER
FREQUENCY control can move the markers, or it can move the display with
a stationary frequency marker. For additional marker information, refer to
Using the Markers Feature in Section 6 of this manual.
Programmable Instrument Features
Firmware Version and
Error Message
Readout
The programmable version of the instrument adds remote control capabilities to the manual instrument features. The front-panel controls (except
those intended exclusively for local use, such as INTENSITY) can be remotely operated through the GPIB port. This allows the spectrum analyzer to
be used with a variety of systems and controllers. Refer to the 495P Pro-
grammer Manual for additional information.
The programmable instrument also adds the macroinstructions (macros)
feature. The instrument memory has 8 kbytes reserved for the construction
of
made-to-order
macros for easy access. Specific macro information is located in the 495P
macros. The macro menu can hold the titles of eight
Programmer Manual.
This feature provides a readout that identifies the version of firmware that is
installed. The readout is momentarily displayed when the power is turned
on. The programmable instrument will flash the firmware version, in addition
to the GPIB address, when the [RESET TO LOCAL] key is pressed.
If the instrument fails to complete any routine or function, an error message
will flash on the screen explaining the failure.
7-2
General Information
Page 23

General Information
Accessories
The Replaceable Mechanical Parts list in the 495/495P
Service
Manual,
Volume 2, contains the part numbers, descriptions, and ordering informa-
tion for all standard and optional accessories offered at this time.
The following list includes all standard accessories currently shipped with
each instrument. Refer to Section 7, Options, for alternate information.
• 50 Q coaxial cable; N to N connector, 72 inch
• 50 0 coaxial cable; BNC to BNC connector,
18
inch
• Adapter; N male to BNC female
• 4A fast-blow
• Power
cord
fuses1;
1
2 each
• Cord clamp
• CRT light filters; 2 - one each amber and grey
• CRT mesh filter
• Rear connector shield
• 495 & 495P User Manual
• 495P Programmer Manual; 495P Only
Options
Section 7, Options contains information on all of the options currently avail-
able for the 495 and
1
1f
the instrument is wired for 220-240 V operation (Options A1, A2, A3, A4,
Option 52 is installed (North American configuration for 220 V with standard power cord),
2A medium-blow fuses are used.
495R
AS)
or if
495 & 495P User Manual
7-3
Page 24

General Information
1-4
General Information
Page 25
This section includes the electrical, physical, and environmental characteris-
tics of this instrument. Any instrument specification changes due to options
are listed in Section 7, Options.
Electrical
Characteristics
The following tables of electrical characteristics and features apply to the
spectrum analyzer after a
front-panel CAL adjustments, except as noted.
• The Performance Requirement statements define characteristics that are
essential to the intended application of the product. Performance
quirement characteristics are normally verifiable by following the
mance Check procedure in the 495/P Service Manual, Volume
• The Supplemental Information column provides more explanation about
related Performance Requirements, or describes typical performance for
characteristics not ordinarily verified by the Performance Check procedure.
The instrument performs an internal processor system check each time
power is turned on. The Functional or Operational Check procedure is
provided in Section 5, Instrument Check Out. This procedure will satisfy most
incoming inspections and will help familiarize you with the instrument capa-
bilities. It does not require external test equipment or technical expertise.
30-minute
warmup, and after performing the
Re-
Perfor-
1.
Verification of Tolerance Values
Perform compliance tests of specified
quirement column, only after a 30-minute warm-up time (except as noted)
and after doing the front-panel CAL procedure. Use measurement instru-
ments that do not affect the values measured. Measurement tolerance of
test equipment should be negligible when compared to the specified toler-
ance. When the tolerance of test equipment is not negligible, the error of the
measuring device should be added to the specified tolerance.
limits,
listed in the Performance Re-
495 & 495P User Manual
2-1
Page 26
Specification
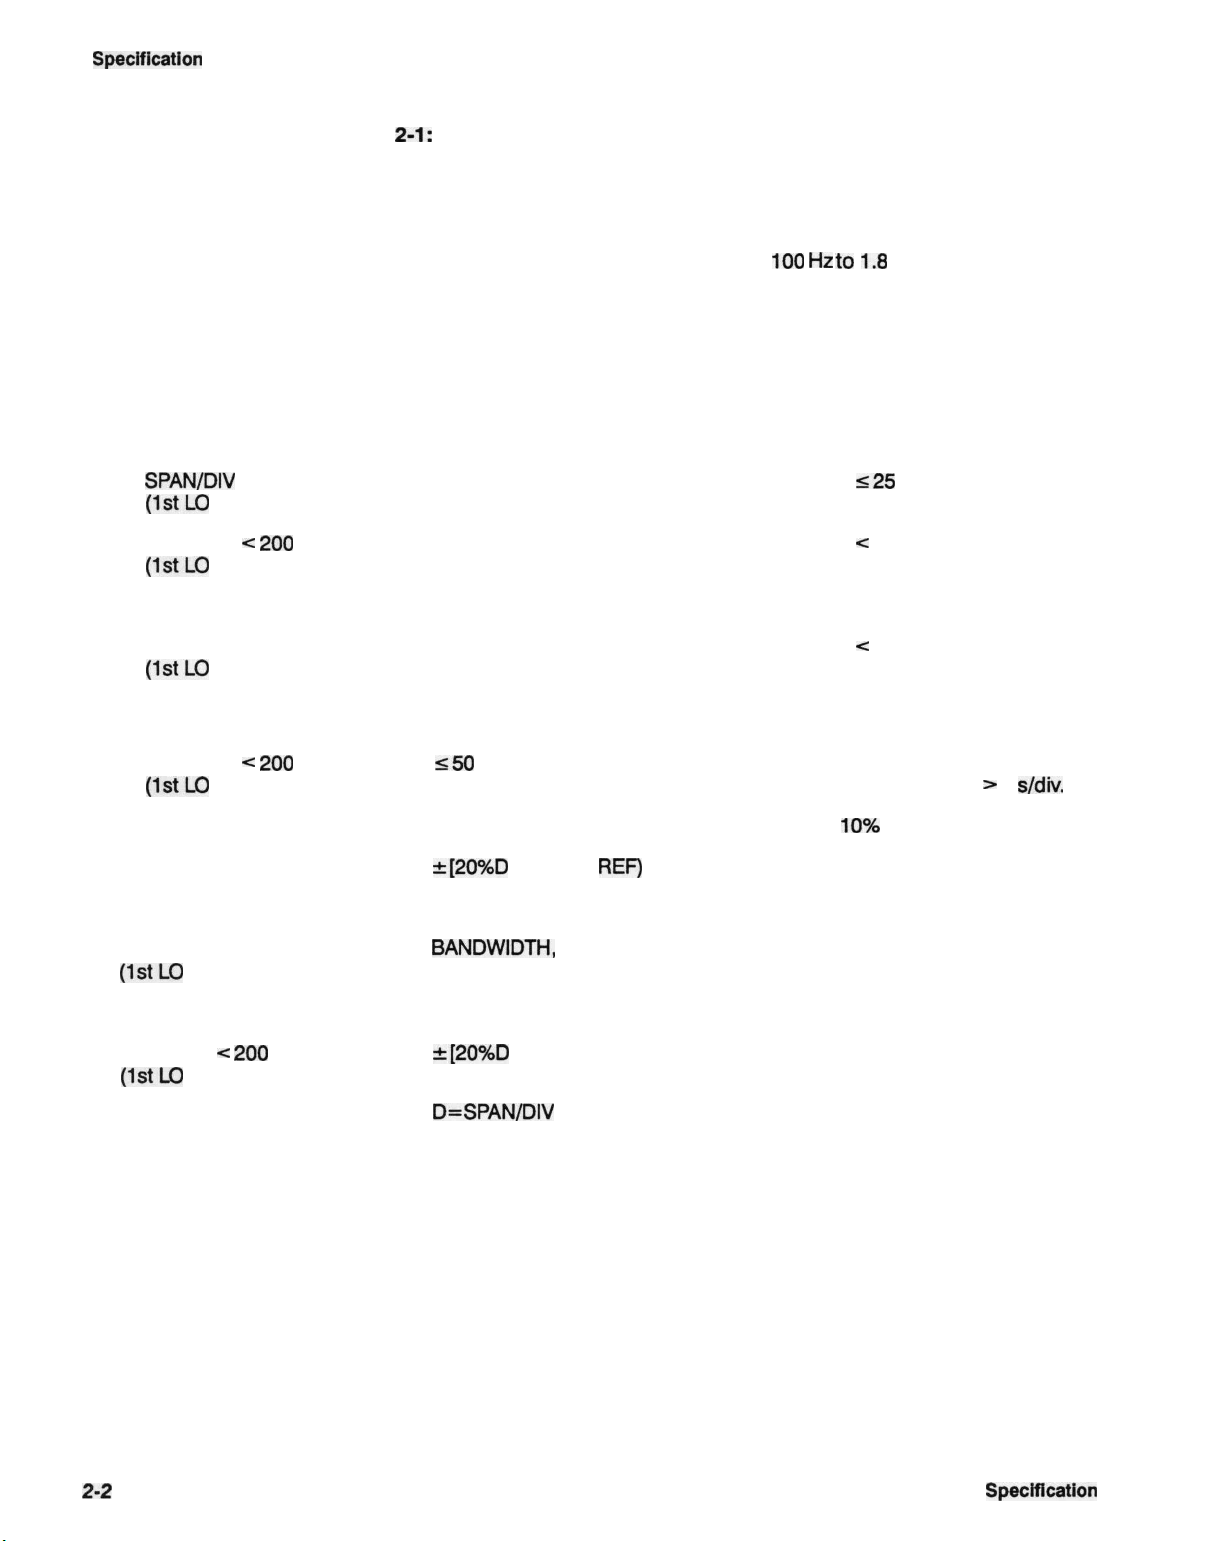
Tabie
2-1:
Frequency Related Characteristics
Characteristic
Center/Marker Frequency
Range
Drift
After 30 minute warmup
SPAN/DIV
(1stl_O
SPAN/DIV < 200
(1stl_O
After 1 hour warmup
SPAN/DIV >200 kHz
(1stLO
SPAN/DIV < 200
(1stl_O
>200 kHz
Unlocked)
kHz
Locked)
Unlocked)
kHz
Locked)
Performance Requirement
<50
Hz per minute
Supplemental Information
100
Hz
to
1.8
GHz.
Tuned by the CENTER/MARKER
FREQUENCY control or the DATA
ENTRY push buttons.
With constant ambient temperature
and fixed center frequency.
Typically
Typically < 150 Hz per minute.
Typically < 5 kHz per minute.
<25
kHz per minute.
Not significant when compared to
residual FM per minute of sweep
time.
Correction will occur at the end of
sweep for sweep times > 5
s/div.
Readout Resolution
Initial Accuracy
SPAN/DIV >200 kHz
(1stLO
SPAN/DIV < 200
(1stLO
Unlocked)
Locked)
kHz
±[20%D + (CF x
REF)
+ 15 kHz]
where:
D=SPAN/DIV or RESOLUTION
BANDWIDTH,
whichever is greater
CF=Center Frequency
REF=Reference Frequency Error
±[20%D + (CF x REF) + 15 Hz]
where:
D=SPAN/DIV
or RESOLUTION
BANDWIDTH, whichever is greater
CF=Center Frequency
REF=Reference Frequency Error
At least
10%
of SPAN/DIV.
Allow a settling time of one second
for each GHz change in CF.
2-2
Specification
Page 27
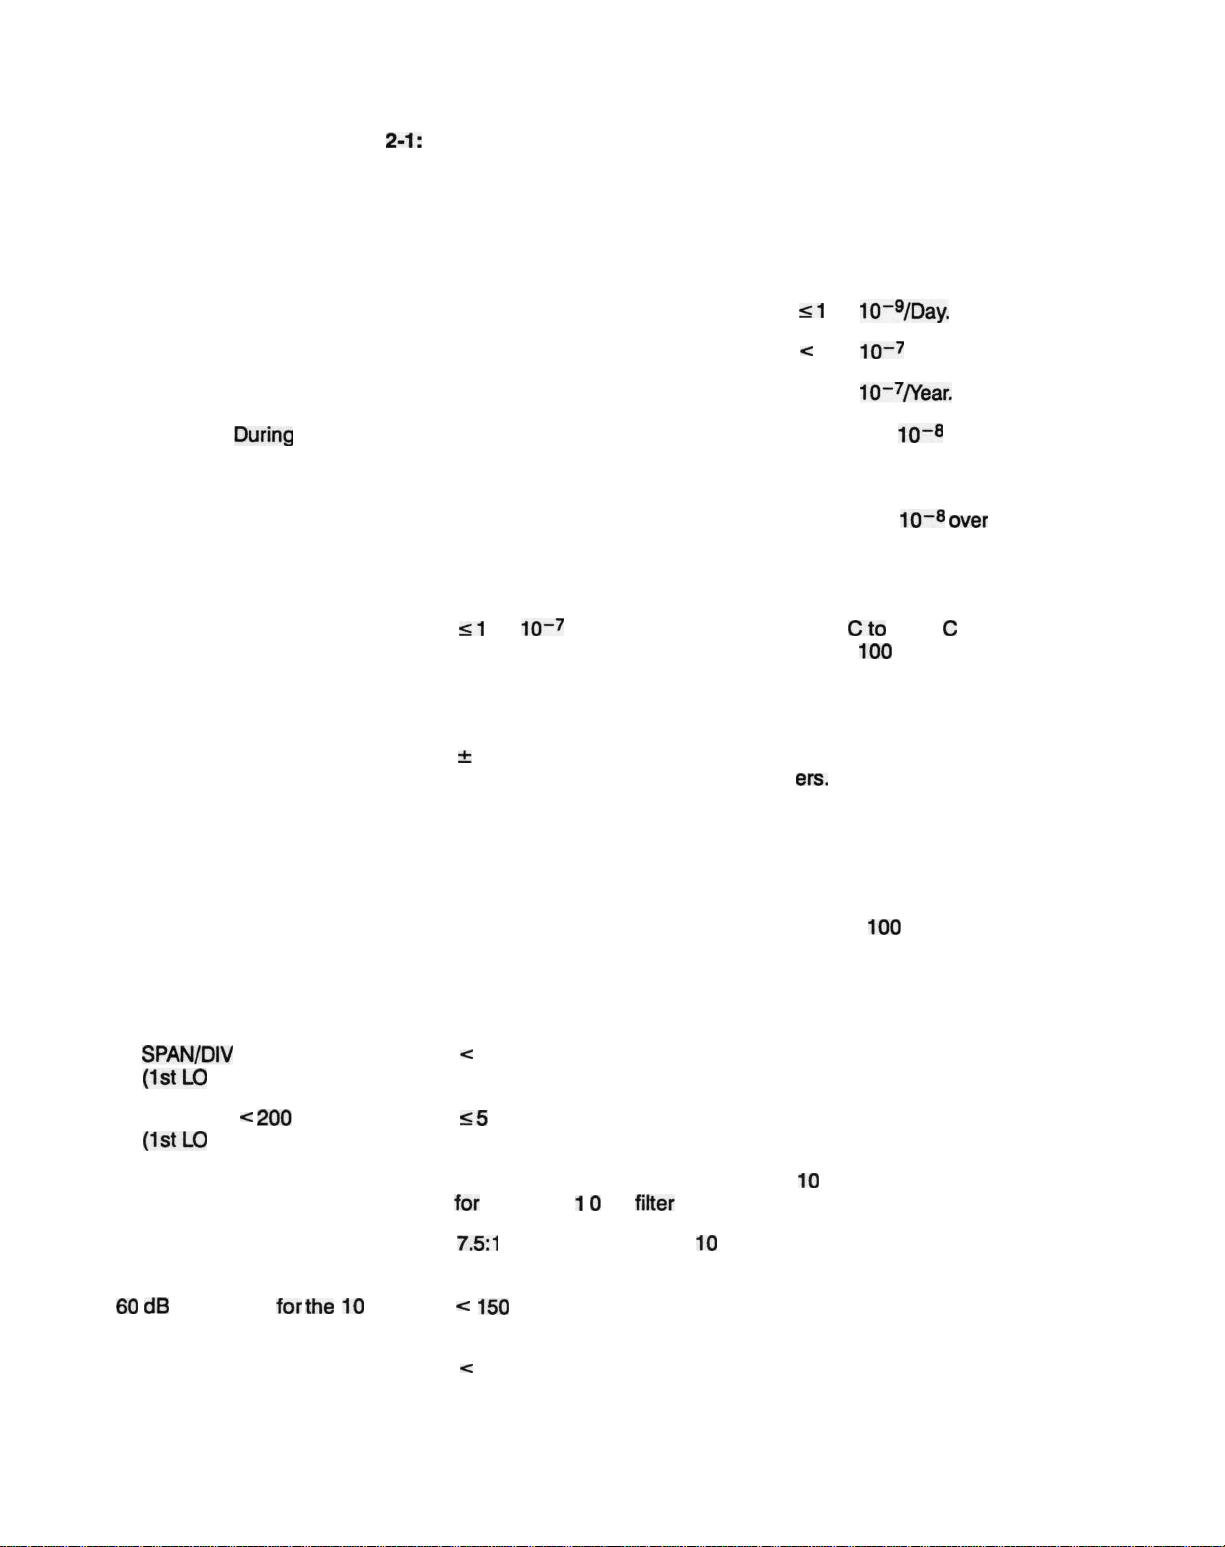
Table
2-1:
Frequency Related Characteristics (Cont.)
Specification
Characteristic
Reference Frequency Error
Aging Rate
Short Term
First 6 months
After first 6 months
Accuracy
+25° C 30 Minutes After
During
Warmup at
Power Up
Temperature Sensitivity
Setability
Signal Counter
Accuracy
(After 30 Minute Warmup)
Performance Requirement
Supplemental Information
<1
x 10~9/Day.
<
1 x
10~7 in first 6 months.
x 10~7/Year.
Within 5 x
10~8 of the frequency
after 24 hours.
Within 2 x
10~8 over
the instru-
ment operating temperature range
of -15° C to +55° C (referenced
to +25° C).
<1 x 10~
7
+20°
range.
Cto
+30° C temperature
100
MHz CAL OUT Refer-
ence.
±
[Counter frequency x Reference Count at center, marker, or A mark-
frequency error) + 5 Hz + 1 LSD]
ers.
Sensitivity
Readout Resolution
Residual FM
SPAN/DIV
(1stLO
SPAN/DIV < 200
(1stLO
>200 kHz
Unlocked)
kHz
Locked)
Static Resolution Bandwidth
(6 dB down)
Shape Factor (60 dB/6 dB)
60
dB
Bandwidth
for
the
10
Filter
Line-related Sidebands
Hz
<
Signal level, at center screen or at
marker, must be 20 dB or more
above the average noise level and
within 60 dB of the reference level.
<
7 kHz total excursion in 20 ms
<5
Hz total excursion in 20 ms
Within 20% of selected bandwidth
for
all but the 1 0
7.5:1
or less for all but the
Hz
filter
10
Hz
filter
150
Hz
<
-55 dBc (47 to 440 Hz)
1 Hz to
selectable with COUNT RESOLU-
TION menu.
100
MHz in decade steps,
Short term, after 1 hour warmup.
10
Hz to 1 MHz in decade steps,
and 3 M Hz.
495 & 495P User Manual
2-3
Page 28

Specification
Table
2-1:
Frequency Related Characteristics (Cont.)
Characteristic
Noise Sidebands
Performance Requirement
<
-70
dBc
at 30X the selected
Supplemental Information
bandwidth for resolution bandwidths of 10 Hz and
<
-75 dBc at 30X the selected
100
Hz
bandwidth for all other resolution
bandwidths
Video Filter Normal
3 MHz
1 MHz
100kHz
10kHz
1 kHz
100 Hz
10 Hz
Pulse Stretcher Fall-Time
30
us/div
(typical).
Frequency Span/Div
Range
10
Hz/divto
1 -2-5 sequence with the
DIV
control), or
170
MHz/div (from the DATA
ENTRY push buttons) to two signif-
icant digits.
In addition, MAX SPAN provides a
full-band display, and ZERO SPAN
provides a 0 Hz display. With
ZERO SPAN, the horizontal axis is
calibrated in
Frequency/div.
Wide
30kHz
30kHz
3kHz
300 Hz
30 Hz
3 Hz
3 Hz
of pulse amplitude
100
MHz/div
(in a
SPAN/
10
Hz/div
Time/div
to
instead of
Narrow
3kHz
3kHz
300 Hz
30 Hz
3 Hz
0.3 Hz
0.3 Hz
Accuracy/Linearity
Span/Div
Span/Div
2-4
>50Hz
<50
Hz
Within 5% of the selected Span/div Measured over the center 8 divi-
sions
Within 10% of the selected
div
Span/
Specification
Page 29

Specification
Table
2-1:
Frequency Related Characteristics (Cont.)
Characteristic Performance Requirement Supplemental Information
Marker(s)
When activated, the marker is a
bright dot positioned by the CEN-
TER/MARKER FREQUENCY control or the DATA ENTRY push but-
tons.
Normal Accuracy/Resolution Identical to Center Frequency ac- For the active trace.
curacy
A
MKR
Accuracy
±1%of
the total span For the active trace. AMKR acti-
vates a second marker at the position of the single marker on the
trace. Parentheses appear on the
marker display line indicating that
the delta mode is active. The display shows the difference in frequency and amplitude. MKR
selects which marker is tuned.
A MKR Resolution
<
10% of
Span/Div.
1«*2
495 & 495P User Manual 2-5
Page 30
Specification
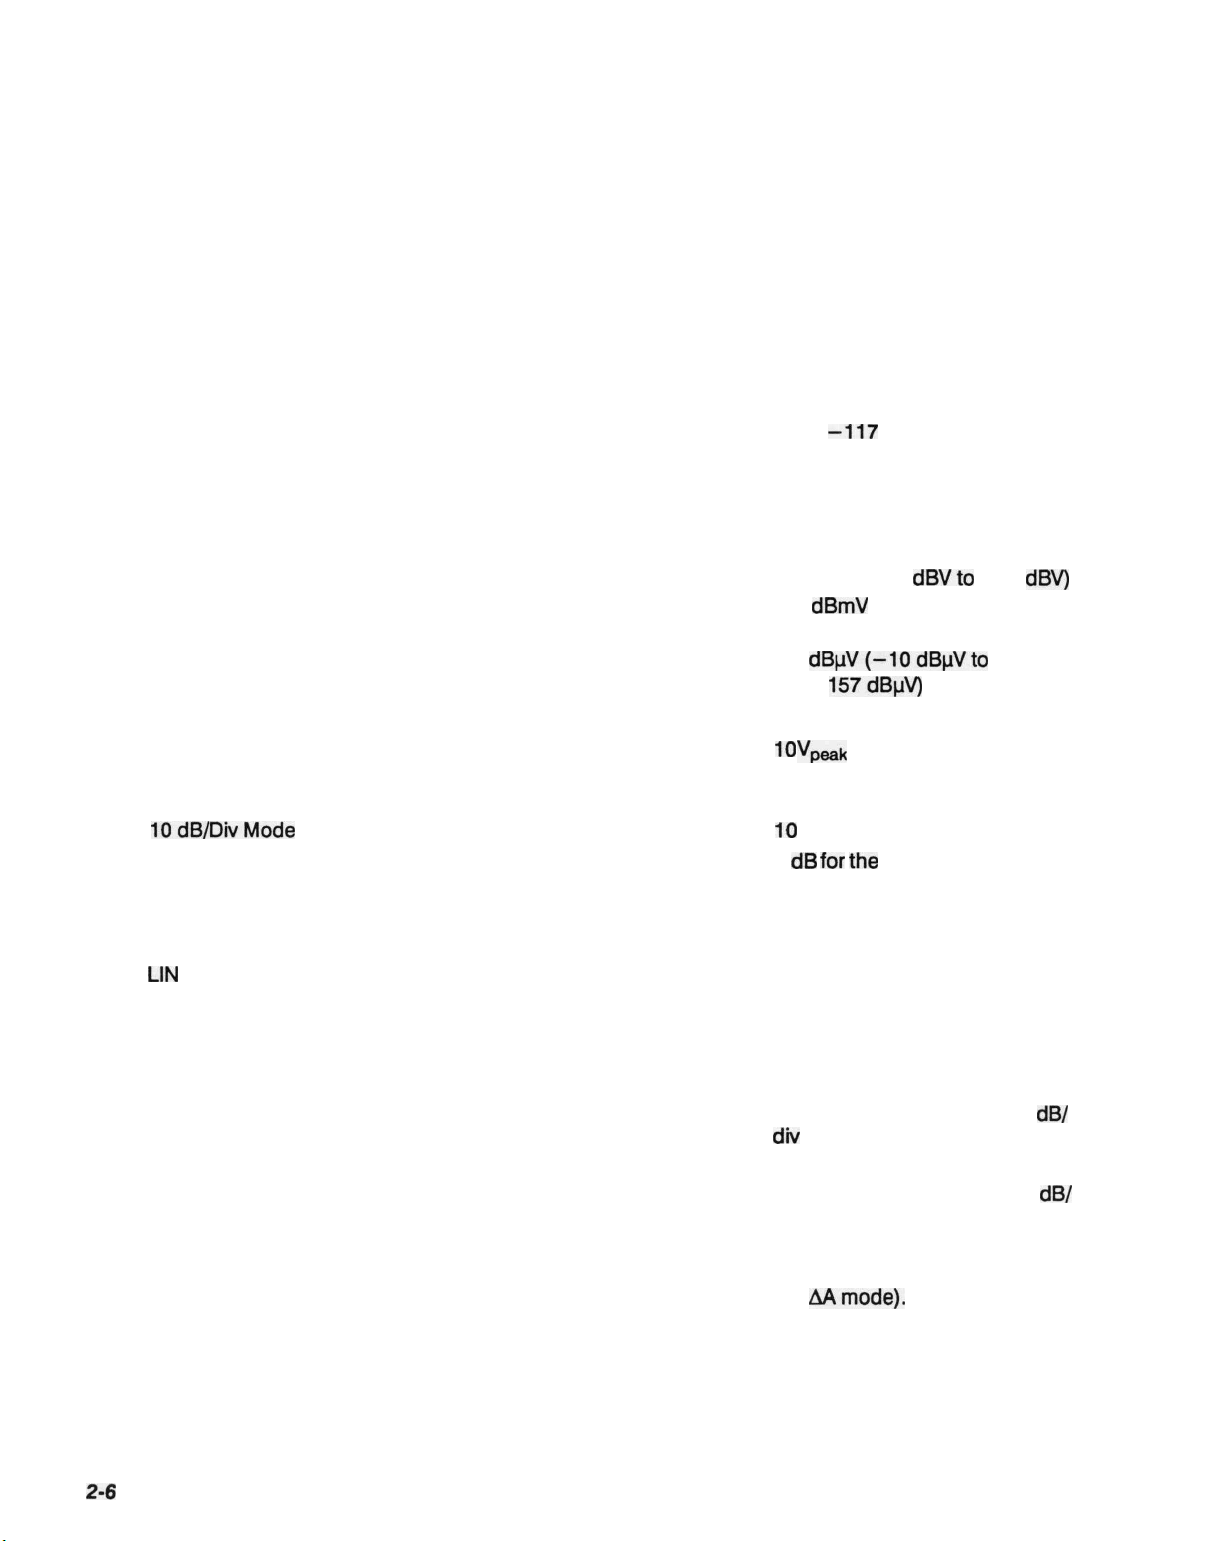
Table 2-2: Amplitude Related Characteristics
Characteristic
Vertical Display Modes
Reference Level
(Top of the graticule)
Range
Log Mode
Linear Mode
Performance Requirement
Supplemental Information
10 dB/div, 2 dB/div, and Linear.
Any integer between 1 to 15 dB/div
can also be selected via the DATA
ENTRY Keypad.
From
-117
dBm to +50 dBm with
no reference offset; +50 dBm in-
cludes 20 dB of IF gain reduction
(+30 dBm is the maximum safe
input).
Alternate reference levels are:
• dBV (-130 dBVto +37
•
dBmV
• dBuV(-10dBuVto
39.6 nV/div to 2.8 V/div (1 W or
10
V
(-70 dBmV to
+97 dBmV)
+
157dBuV)
maximum safe input).
peak
dBV)
Steps
10dB/DivMode
2 dB/Div Mode
LIN
Mode
Set via DATA ENTRY
Keypad
10
dB for the coarse mode.
1
dB
for
the
FINE mode.
1 dB for the coarse mode.
0.25 dB for the FINE mode.
1 -2-5 sequence for coarse
mode.
1 dB equivalent steps for FINE
mode.
Steps correspond to the display
mode in coarse, except for 2
div
where steps are 1 dB.
dB/
In FINE mode:
• 1 dB when the mode is 5
div or more.
• 0.25 dB for display modes of
dB/
4 dB/div or less (referred to as
AAmode).
2-6
Specification
Page 31

Table 2-2: Amplitude Related Characteristics (Cont.)
Specification
Characteristic
Marker(s)
Accuracy
Frequency Response and
Display Flatness
About the mid-point between
two extremes
Accuracy
Performance Requirement
±1.0
dB
Supplemental Information
Identical to REF LEVEL accuracy
plus cumulative error of display
scale. (Dependent on vertical posi-
tion.)
Frequency response is measured
with 10 dB of RF attenuation.
Response is affected by:
• InputVSWR
• Gain variation
• Mixer conversion
Dependent on the following characteristics:
• RF Attenuation Accuracy
• IF Gain Accuracy
• Resolution Bandwidth
• Display Mode
• Calibrator Accuracy
• Frequency Response
•
[Blue-SHIFT]
[CAL] routine
reduces error between resolu-
tion bandwidths at -20 dBm
REF LEVEL. Other REF LEV-
ELs may have larger errors.
• Ambient Temperature Change
(±0.15
cally ±0.05 dB/° C)
dB/°
C maximum, typi-
Display Dynamic Range
Accuracy
10dB/divMode
2 dB/div Mode
LIN
Mode
495 & 495P User Manual
±1.0
dB/10
dB to a maximum cumulative error of ±2.0 dB over
80 dB range
±0.4 dB/2 dB to a maximum cu-
mulative error of
±1.0
dB over
16 dB range
±5%
of
full scale
90 dB maximum for Log Modes
>12dB.
8 divisions for Linear Mode.
Maximum cumulative error of
±4.0 dB over 90 dB range.
2-7
Page 32

Specification
Table 2-2: Amplitude Related Characteristics (Cont.)
Characteristic
RF Attenuator
Range
Accuracy DC to
1800
MHz
Gain Variation Between Resolution
Bandwidths
With Respect to 3 MHz Filter
Between Any Two Filters
IF
Gain
Range
Accuracy
Performance Requirement
Within 0.5
dB/10
dB to a maximum
of 1 dB over the 60 dB range
<±0.4dB
<0.8dB
Supplemental Information
0-60 dB in 10 dB steps.
Measured conditions:
• Measured at -20 dBm
•
MIN
• After CAL routine @ 25° C
87 dB of gain
DISTORTION mode
increase,
20 dB of
gain decrease (MIN NOISE and
REDUCED GAIN modes activated),
in
10dBand
1 dB steps.
1 dB Step
Decade Transitions
-19
to
-20
dBm
-29 to -30 dBm
-39 to -40 dBm
-49 to -50 dBm
-59 to -60 dBm
Maximum Deviation
Range
Over
the
<
0.2 dB/dB step to 0.5 dB/9 dB
steps except at the decade transitions
0.5 dB or less
±2dB
Maximum 1 dB cumulative error
over
10dB.
2-8
Specification
Page 33

Table 2-2: Amplitude Related Characteristics (Cont.)
Specification
Characteristic Performance Requirement
Differential Amplitude
Measurement
Range
Accuracy
Supplemental Information
AA mode provides differential mea-
surements in 0.25 dB increments.
(This is not related to the
AMKR
mode.)
Maximum range of 57.75 dB de-
pendent on Reference Level when
the AA mode was activated.
Typical sensitivity 1 00
Hz to 1 kHz
is -75 dBm at 10 Hz Resolution
Bandwidth.
Equivalent maximum input noise
for each resolution bandwidth.
Measured at 25° C with:
• 0 dB RF attenuation (Min
OdB)
Atten
• Narrow Video Filter On
• Vertical Display 2
dB/div
(5
dB/
divinlOHzRBW)
• Digital Storage On
• Max Hold Off
•
Peak/Average
in Average
• 1 sec Time/Div
• Zero Span
• Input Terminated in 50
O
Spurious Responses
Residual
3rd Order
-
Intermediation
1
00
dBm
or less
Prod- -70 dBm or less
ucts
Harmonic Distortion -60 dBc or less
LO Emission -70 dBm or less
"Option
07 only.
495 & 495P User Manual
"Above 5 MHz.
"Above
10 MHz.
With no input signal.
From any two on-screen signals
within any frequency span.
In MIN DISTORTION mode.
Measured across the entire band,
with -30 dBm input and 0 dB at-
tenuation.
With 0 dB RF Attenuation.
2-9
Page 34

Specification
Table
2-3:
Input Signal Characteristics
Characteristic
RF INPUT
Impedance
VSWRwith
>10dB
RF Attenuation
VSWR with 0 dB
RF Attenuation
Maximum Safe Input
(With 0 dB RF Attenuation)
1 dB Compression Point 0 dBm
(Minimum)
EXT REF IN
Frequency
1 , 2, 5, or
Performance Requirement
10
MHz ±5 PPM
Supplemental Information
Type N female connector. (See Op-
tion 07 characteristics at the end of
this section for supplemental specifications concerning an additional
75 Q input.)
50
Q.
1.3:1 maximum (typically
2.0:1 maximum (typically
+30 dBm (1
75 W peak, pulse width of 1 us or
W)
continuous or
1.2:1).
1.9:1).
less with a maximum duty factor of
0.001 (attenuator limited).
Measured in
with no RF Attenuation.
MIN
NOISE
mode
Power
-
Waveshape
Input Impedance
HORIZ
| TRIG (rear panel)
Sweep Input Voltage Range
Trigger Input Voltage Range
Minimum
Maximum
DC + Peak AC
AC
1 5 dBm to + 1 5 dBm
At least
500 kHz
1.0
Vp_p from
15
Hz to
Sinewave, ECL, or
cycle of
AC=50 Q, DC=500
40%-60%.
TTL,
Q.
with a duty
DC coupled input for external hori-
zontal drive (selected by the EXT
position of the
TIME/DIV
control)
and AC coupled input for external
trigger signals (selected at other
positions of the
0 to +10 V (DC + Peak AC) for full-
TIME/DIV
control).
screen deflection.
Typically 1 MHz at
50V.
30
V
to 10 kHz, then derate lin-
RMS
early to 3.5
VRMS
at
1.5
100
V
.
peak
kHz and
above.
Pulse Width
2-10
0.1
|JS
minimum.
Specification
Page 35

Table
2-3:
Input Signal Characteristics (Cont.)
Specification
Characteristic
MARKER | VIDEO (rear panel)
VIDEO Input Level
MARKER Input Level
ACCESSORY Connector (J104)
Pin1
Performance Requirement
Supplemental Information
External Video input or External
Video Marker input, switched by
pin 1
of
the ACCESSORIES con-
nector.
0 to +4 V for full-screen display
with pin 1
of
the ACCESSORIES
connector low.
0
to-10V.
Interfaces with TEKTRONIX
1405
TV Sideband Adapter.
25-pin connector (not RS-232 compatible).
Provides bi-directional access to
the instrument bus. Also provides
External Video select. All lines are
TTL
compatible.
Maximum voltage on all lines is
±15
V.
External Video Select.
Low selects External VIDEO Input.
High (default) selects Video
MARKER Input.
Pin
2
Pin
3
Pin
4
Pin
5
Pins6-13
Pin
14
Pin
15
Pin
16
•Output
when Internally controlled
a
a
a
a
(pin 4 high)
and Input when externally controlled
Not used.
Not used.
Internal Control.
High (default) selects internal con-
trol. Instrument bus lines are out-
put at the ACCESSORIES connec-
tor.
Low selects External control.
Instrument bus lines at the AC-
CESSORIES connector accept
input from an external controller.
Chassis Ground.
Instrument Bus Address Lines
Instrument Bus Data Valid signal.
Instrument Bus Service Request
signal.
Instrument Bus Poll signal.
(pin
4 low).
7-0.
495 & 495P User Manual
2-11
Page 36

Specification
Table
2-3:
Input Signal Characteristics (Cont.)
Characteristic
Pin
17
Pins
18-25
"Output
when internally controlled (pin 4 high) and input when externally controlled
a
Table
Characteristic
Calibrator (CAL OUT)
1st
LO and 2nd LO OUTPUTS
Performance Requirement
2-4:
Output Signal Characteristics
Performance Requirement
-20
dBm
±0.3
dB at 100 MHz
Supplemental Information
Data Bus Enable input signal for
external controller.
High
(unasserted)
disables exter-
nal data bus.
Low enables external data bus.
Instrument Bus Data lines 0-7.
Active when External Data Bus Enable (pin 17) is low.
(pin
4 low).
Supplemental Information
100
MHz
(phase locked to refer-
ence
oscillator).
Provide access to the output of the
respective local oscillators.
These ports must be terminated in
50 n at all times.
1stl_O
OUTPUT Power
2nd LO OUTPUT Power
VERT Output
HORIZ
PEN LIFT
10
MHz
Output
IF output
+6 dBm to +20
-10
dBm
dBm.
to+15 dBm.
Provides 0.5 V ±5% (open circuit)
of signal per division of video that
is above and below the center line.
Full range is -2.0 V to +2.0 V.
250
mV
maximum ripple. Source
impedance is approximately 1
kQ.
Provides 0.5 V/div (open circuit)
either side of center. Full range
-2.5 V to +2.5 V. Source imped-
ance is approximately 1 kQ.
TTL
compatible, nominal +5 Vto
lift plotter pen.
Output level is approximately
-5 dBm for a full-screen signal at
-30 dBm reference level. Nominal
impedance is approximately 50
Q
2-12
Specification
Page 37

Table
2-4:
Output Signal Characteristics (Cont.)
Specification
Characteristic
IEEE STD 488 PORT
P-Version
Non-P Version (Plotter Output)
PROBE POWER (rear panel)
Outputs
Pin1
Pin
2
Pin
3
Pin
4
ACCESSORIES
(J104)
Performance Requirement
Supplemental Information
In accordance with IEEE 488-78
standard and Tektronix Codes and
Formats standard (version
Implemented as
SR1,
RL1,
Implemented as SH1,
SRO, RLO, PPO, DCO, DTO,
PP1,
SH1,
DC1,
AH1,
DT1,
AHO,
and CO.
81.1).
T5,
L3,
and CO.
T3, LO,
Provides operating voltages for ac-
tive probes.
+5 Vat 100
Ground.
-15V
+15
V at 100 mA maximum.
All inputs and outputs are listed in
Table
tics.
mA
maximum.
at 100 mA maximum.
2-3,
Input Signal Characteris-
Characteristic
Sweep
Sweep Time
Accuracy
Triggering
Internal Trigger Level
EXTERNAL Trigger Input Level
CRT Readout
Table
2-5:
General Characteristics
Performance Requirement
20
us/div
to 5 s/div in 1 -2-5 se-
quence
AUTO)
±5% over center 8
2 divisions or more
1.0
(10
s/div available in
Vp.p minimum
divisions
of signal
Supplemental Information
Triggered, auto, manual
, single
sweep, and external.
INTERNAL, EXTERNAL,
RUN,
and LINE.
EXTERNAL is
AC-coupled
FREE
(15
Hz
to 500 kHz). Maximum external
trigger input is 50 V (DC + Peak
AC).
Displays all parameters listed on
the CRT bezel, plus operating mes-
sages.
495 & 495P User Manual
2-73
Page 38

Specification
Table 2-5: General Characteristics (Cont.)
Characteristic
Battery-Powered
Battery
Life
At +55° C
Ambient Temperature
At +25° C
Ambient Temperature
Lithium (Standard)
Silver (Option 39)
Temperature Range for
Retaining Data
Operating
Non-Operating
Memory
Performance Requirement
Supplemental Information
Instrument settings, macros, dis-
plays, and calibration offsets are
stored in battery-powered non-volatile RAM.
1 -2 years.
At least 5 years.
2-5 years.
-15° C to+55° C.
-30° Cto+85°C.
Characteristic
Line Frequency Range
Line Voltage Range
Line Fuse
115V
Nominal
230 V Nominal
Input
Power
Leakage Current
47-63
Hz
Else
Table
2-6:
Power Requirements
Performance Requirement
47 to 440 Hz
90
VAC
to
132
VAC
180
VAC
to
250
VAC
4A Fast-Blow
2A Slow-Blow
210
W maximum (3.2 A)
Supplemental Information
115 V nominal.
230 V nominal.
At
115V
and
60
Hz.
3.5
mA
maximum.
5 mA maximum.
2-74
Specification
Page 39

Table 2-7: Environmental Characteristics
Specification
Characteristic
Meets
MIL-T-28800C,
Temperature
type III class 3, style C specifications as follows:
Operating
Non-Operating
Humidity
3
Operating
Non-Operating
Altitude
Operating
Non-Operating
Vibration, Operating (instrument secured to a
vibration platform during test)
Description
-15°Cto+55°C.
-62°Cto+85°C.
95% (+5%, -0%) relative humidity.
Five cycles (120 hours) in accordance with
Std-810D, Procedure 3 (modified).
15,000
feet, tested to
40,000
feet,
tested to 50,000 feet.
MIL-Std-810D,
25,000
feet.
Method 514 Procedure I (modified). Res-
MIL-
onant searches in all three axes from 5 Hz to 15 Hz at
0.060" displacement for 7 minutes,
0.040" displacement for 3 minutes, and 25 Hz to 55 Hz
15
Hz to 25 Hz at
at 0.020" displacement for 5 minutes (tested to 0.025").
Dwell for an additional
10
minutes in each axis at the
frequency of the major resonance or at 55 Hz if none
was found. Resonance is defined as twice the input
displacement. Total vibration time is 75 minutes.
Shock (Operating and Non-Operating)
Three guillotine-type shocks of 30 g,
11
ms duration each direction along each major axis;
total of 18 shocks. Tested to 50 g.
Transit Drop (free fall)
8 inch, one per each of six faces and eight corners
(instrument is tested and meets drop height of 12 in-
ches).
Electromagnetic Interference
(EMI)
Meets requirements described in
except as noted.
Test Method
Conducted Emissions
CE01-60Hzto15kHz
CE03-15kHzto50MHz
power leads
•After
storage at temperatures below -15° C, the instrument may not reset when power
instrument to warm up for at least
15
minutes, then turn POWER OFF for 5 seconds and back ON.
one-half
MIL-Std-461B
sine,
Part 4,
Remarks
1
kHz
to
15
kHz
only
15
kHz
to
50
kHz, relaxed
by 15 dB
is
first turned on. If this happens, allow the
495 & 495P User Manual
2-15
Page 40

Specification
Table 2-7: Environmental Characteristics (Cont.)
Characteristic
Conducted Susceptibility
Radiated Emissions
Radiated Susceptibility
Description
Test Method
CS01
-30 Hz to 50 kHz
Remarks
Full limits
power leads
CS02-50 kHz to 400 MHz
Full limits
power leads
CS06-spike power leads Full limits
RE01
-30 Hz to 50 kHz
magnetic field
Relaxed by 10 dB for fun-
damental to
10th harmonic
of power line
Exceptioned, 30 kHz to
36kHz
RE02-14kHzto10GHz
RS01
-30 Hz to 50 kHz
RS02-Magnetic Induction To 5 A only, 60 Hz
RS03-14 kHz to
10
Full limit
Full limit
GHz Up to 1 GHz
Characteristic
Weight
Dimensions
Without Front
Cover,
Handle,
or Feet
With Front Cover, Feet, and Handle
Handle Folded Back Over the Instrument
Handle Fully Extended
Table
2-8:
Physical Requirements
Description
42
Ibs
Including cover and standard accessories, except
manuals.
See the Options Characteristics for alternate specifica-
tions.
6.9 x 12.87 x 19.65 inches
(175 x327 x
9.15 x 15.05 x 23.1 inches
(232
9.15 x 15.05 x 28.85 inches
(232 x 382 x 732.8 mm).
13 oz (19.3 kg) maximum.
499
mm).
x 382 x 587
mm).
2-76
Specification
Page 41

Page 42

Specification
2-78
Specification
Page 43

This section describes spectrum analyzer unpacking, installation, power
requirements, storage information, and repackaging.
Unpacking and Initial
Inspection
Before unpacking the spectrum analyzer, inspect the shipping container for
signs of external damage. If the container is damaged, notify the carrier as
well as Tektronix, Inc. The shipping container contains the basic instrument
and its standard accessories. For a list of the standard accessories, refer to
Section 1, General Information. For ordering information, refer to the list
following the Replaceable Mechanical Parts list in the 495/P Service
al, Volume 2.
If the contents of the shipping container are incomplete, if there is mechanical damage or defect, or if the instrument does not meet operational check
requirements, contact your local Tektronix Field Office or representative.
Keep the shipping container if the instrument is to be stored or shipped to
Tektronix for service or repair. Refer to Storage and Repackaging for Ship-
ment later in this section.
Manu-
Functional Check
The instrument was inspected both mechanically and electrically before
shipment, and it should be free of mechanical damage and meet or exceed
all electrical specifications. Section 5, Instrument Check Out contains procedures to check functional or operational performance. Perform the functional
check procedure to verify that the instrument is operating properly. This
check is intended to satisfy the requirements for most receiving or incoming
inspections. A detailed electrical performance verification procedure in the
495/P Service Manual, Volume 1 provides a check of all specified perfor-
mance requirements, as listed in the Specification section.
495 & 495P User Manual
Air Flow Considerations
The instrument can be operated in any position that allows air flow into the
bottom and out the rear of the instrument. Feet on the four corners allow
ample clearance even if the instrument is stacked with other instruments.
The air is drawn in by a fan through the bottom and expelled out the back.
Avoid locating the instrument where paper, plastic, or any other material
might block the air intake.
3-1
Page 44

Preparation for Use
Front Cover and Accessories Pouch
The front cover provides a dust-tight seal and a convenient place to store
accessories. Use the cover to protect the front panel when storing or trans-
porting the instrument. To remove the
back feet so the name on the handle is facing up and towards you. Pull
slightly out and up on the sides of the cover.
Attached to the inside of the cover is the accessories pouch. To open the
accessories pouch, pull up evenly on the flap.
cover,
stand the instrument on the two
Handle
You can position the handle of the spectrum analyzer at several angles to
serve as a tilt stand. To stack instruments, position the handle at the top rear
of the instrument. To change the handle position, press in at both pivot
points and rotate the handle to the desired position.
Position
WARNING
Removing or replacing the cabinet on the instrument can be hazardous. Only qualified service personnel should attempt to remove
the instrument cabinet.
Rack Adapter Kit
A field-installation kit is available to permit the spectrum analyzer to be rack
mounted in a standard 19-inch-wide rack on a non-tilting slide-out track. We
recommend fan-forced ventilation of the rack enclosure. If the rack-adapter
assembly is installed in an enclosed rack, a minimum depth of 25 inches
behind the front panel is recommended for proper air circulation. The rack
adapter kit comes complete with the
mounting hardware. Contact your local Tektronix Field Office or representa-
tive for additional information and ordering instructions.
slide-out
tracks and all necessary
Power Requirements
Changing the power input can be dangerous.
WARNING
Work safely
Know the intended power source
Set the instrument for the power source
Check the fuse for proper ratings
Use the power cord and plug intended for the power source
3-2 Preparation for Use
Page 45

Preparation for Use
The 495/P operates from a
current-carrying conductors (neutral) at ground (earth) potential.
single-phase
power source that has one of its
Do
not
operate the 495/P from power sources where both current-carrying conductors are isolated or above ground potential (such as
multi-phase system or across the legs of a
wire system). In this method of
operation,
110-220 V single-phase,
only the line conductor has over-
phase-to-phase
on a
three-
current (fuse) protection within the unit. Refer to the Safety Summary at the
front of this manual.
The AC power connector is a
three-wire,
polarized plug with the ground
(earth) lead connected directly to the instrument frame to provide electrical
shock protection. If the unit is connected to any other power source, connect the unit frame to an earth ground.
WARNING
Do not attempt to change the power input requirements.
ity
with safety procedures can result in personal injury. Refer all
power input changes to qualified service personnel. Refer to the
Unfamiliar-
Safety Summary at the front of this manual.
Operate the spectrum analyzer from either
voltage with a range of 90 to
132
or
180
115
VAC or 230 VAC nominal line
to 250 VAC, at 48 to 440 Hz. Power
and voltage requirements are printed on a back-panel plate mounted below
the power input jack. Refer power input changes to qualified service person-
nel. The 495/495P Service Volume 1 contains instructions to change the
input voltage range.
The international power cord and plug configurations are shown in Sec-
tion
7, Options.
Short Term (less than 90 days)
For short term storage, store the instrument in an environment that meets
the non-operating environmental specifications in Section 2 of this manual.
Long Term
For instrument storage of more than 90 days, retain the shipping container
to repackage the instrument. The battery in the instrument does not require
removal. Package the instrument in a vapor barrier bag with a drying agent
and store in a location that meets the non-operating environmental specifications in Section 2 of this manual.
If you have any questions, contact your local Tektronix Field Office or
sentative.
repre-
495 & 495P User Manual
3-3
Page 46

Preparation for Use
Repackaging for
Shipment
When the spectrum analyzer is to be shipped to a Tektronix Service Center
for service or repair, please attach a tag that provides the following information:
• Owner's name and address
• The name of the individual at your firm who can be contacted
• Complete instrument serial number
• Description of the service required.
If the original package is unfit for use or not available, use the following
repackaging information:
1.
To allow for
test strength of 375 pounds
are at least six inches more than the equipment dimensions (refer to
Physical Characteristics in Section 2).
2. Install the instrument front cover, and surround the instrument with
plastic sheeting to protect the finish.
3. Cushion the 495/P on all sides with packing material or plastic foam.
4. Seal the container with shipping tape or a heavy-duty, industrial stapler.
cushioning,
use a corrugated cardboard container with a
(140
kilograms) and inside dimensions that
Transit Case
A
high-impact,
spectrum analyzer to be frequently shipped between sites. A hard transit
case that meets these requirements and has space to hold the instrument's
standard accessories is provided as an optional accessory for the spectrum
analyzer. Contact your local Tektronix representative for additional information and ordering assistance.
ruggedized transit case is recommended if you require your
3-4
Preparation for Use
Page 47

1 Controls, Connectors and Indicators
////
^
This section includes the descriptions of the
modes. It also covers the functions of the controls, selectors, indicators, and
connectors for the
through
greater detail in Section 5, Instrument Check Out.
Included with many of the descriptions are syntax diagrams that graphically
display the function. The ovals and circles indicate a literal element that
must be sent (i.e., push button pressed) exactly as shown. Boxes contain a
name for an element (for example, DATA ENTRY represents numbered push
buttons [0] through
arrows that connect the elements of the syntax diagrams show the possible
paths through the diagram. Parallel paths mean that one, and only one, of
the paths must be followed. A path around an element or group of elements
indicates an optional skip. Arrows indicate the direction that must be followed (usually the flow is to the right; but, if an element may be repeated, an
arrow returns from the right to the left of the
The following examples illustrate basic syntax diagram structure.
4-3
and
495/R
4-11
which are all shown and identified in Figures
through
[9],
4-16.
Some of the functions are described in
units terminators,
instrument's
[.],
and
[BACKSPACE]).
element).
main operating
4-1
The
Operating Modes
495 & 495P User Manual
When DATA ENTRY boxes are part of a command's syntax diagram, there
are numbers shown with the boxes. These numbers represent the valid
range available for that particular command.
Initial Entry Functions (Black-Labels)
Most of the 495P operating modes are selected by a single push button
press or control turn; i.e., [FREE RUN],
[MAX
HOLD],
with all Tektronix 49x-Series Spectrum Analyzers.
PEAK/AVERAGE.
TIME/DIV,
Generally, these selections are the same
[PULSE STRETCHER],
4-7
Page 48

Controls, Connectors, and Indicators
Multiple
([SHIFT]
[Blue-SHIFT]
and two marker operating modes selected with multiple push button presses. Press the [Blue-SHIFT] push button before selecting a blue-labeled
function; i.e.,
menu prompts appear on the screen to guide you.
[Green-SHIFT]
[Green-SHIFT]
[Green-SHIFT]
as [ASSIGN 1], [PEAK
appear on the CRT readout to guide you.
There are also additional marker functions that can be assigned to either
push button [ASSIGN
manner as the labeled functions. The MARKER MENU also has additional
marker functions that can be selected directly from the menu.
Push Button Sequence Functions
push buttons)
Functions
[PLOT],
[STORE
Functions — Most
multiple-push button presses are marker related. Press the
push button before selecting a green-labeled function such
1]
—There
DISP],
FIND].
For many of these functions, menu prompts
or [ASSIGN 2] and then selected in the same
are
many
general
[CAL]. For many of these
of the
operating
operating
modes
modes
functions,
selected
with
Terminating Multiple Push Button Sequences
A [SHIFT] multiple-push button sequence can be terminated at any time.
Push either the [Blue-SHIFT] or [Green-SHIFT] push button once to stop
the sequence and return the 495/P to the previous activity.
DATA ENTRY Functions (Orange Labels)
Some operations require the entry of numerical data; for example, to set
frequency or enter a number to select a choice from a menu. This will be as
part of a multiple-push button sequence. The screen will prompt you when a
number is required. Numbers are entered with the orange-labeled DATA
ENTRY push buttons. Numerical data is entered first, with a units terminator
entered
-20
last;
dBm.
for
example,
[1] [0]
[MHz]
for 10 MHz or [2] [0]
[-dBx]
for
Correcting Numerical Entry Errors
Use the [BACKSPACE] push button to correct errors in numerical data that
have been entered with the orange-labeled DATA ENTRY push buttons.
Each push button press backs the cursor up one space, erasing the number
in that location. You can then enter the correct numerical data and end the
sequence with a units push button.
4-2 Controls, Connectors, and Indicators
Page 49

Page 50

Controls, Connectors, and Indicators
4 COUNT — When this push button is pressed, the signal at the dot
position is counted with up to 1 Hz resolution at any FREQUENCY
SPAN/DIV
[COUNT
setting. The resolution is selected with
RESOLN].
The signal must be 20 dB or more above the
[Blue-SHIFT]
noise level and above a level that is 60 dB down from the REF-
ERENCE LEVEL setting.
5 AF — This push button allows measurement of the frequency differ-
ences. When pressed (lit), the frequency readout goes to zero. The
readout now shows only the
offset,
or deviation, from this reference as
the CENTER FREQUENCY is changed. The resolution of the readout
will be the less accurate of either the current CENTER FREQUENCY
resolution or the CENTER FREQUENCY resolution when [AF] was
activated. Do not confuse this push button with
[A
MKR],
which is described later in this section under Marker Func-
[Green-SHIFT]
tions.
6 [Blue-SHIFT] COUNT RESOLN — This push button sequence
allows you to select the desired counter resolution with the DATA
ENTRY push buttons. Terminate with one of the unit
[kHz], or
[Hz])
push buttons. The counter resolution will be truncated
([GHz],
[MHz],
to the decade that is less than or equal to the selected resolution.
7 CENTER/MARKER FREQUENCY — This control tunes the center
frequency or marker, if selected. Tuning of center frequency is done in
0.1 division increments, regardless of the selected FREQUENCY
SPAN/DIV setting. For marker frequency, tuning is either
0.1 division increments, depending on
how
fast
the control is turned.
O.OI,
0.033, or
In MAX SPAN mode, the center frequency is fixed, and only the fre-
quency dot is tuned. The tuning range in narrow spans is identical to
wide spans.
8
+STEP
mode
— When the instrument is in the Tune Center Frequency
([TUNE
CF/MKR] push button unlit), this push button increases
the CENTER FREQUENCY by steps. The step size is determined by
[Blue-SHIFT] [STEP ENTRY] or [Green-SHIFT] [STEP
SIZE].
[+STEP] later in this section under Marker Functions for alternate
operation.
9 -STEP — When the instrument is in the Tune Center Frequency
mode
([TUNE
the CENTER FREQUENCY by steps. The step size is determined by
[Blue-SHIFT] [STEP ENTRY] or [Green-SHIFT] [STEP
[-STEP]
CF/MKR] push button unlit), this push button increases
SIZE].
later
in
this
section
under
Marker
Functions
for
alternate
operation.
See
See
4-4
Controls, Connectors, and Indicators
Page 51

Controls, Connectors, and Indicators
10
[Blue-SHIFT]
FREQ — This push button sequence allows direct
entry of center or marker frequency to 1 Hz resolution (it will be dis-
played to 100 Hz) using the DATA ENTRY push buttons. If the center
frequency entered is not in the current frequency range, the nearest
frequency range that contains the frequency will be automatically
selected. The center frequency range that can be selected is 0 Hz to
1800 MHz. Values that are entered outside this range will be ignored.
Frequency digits that are entered from the DATA ENTRY push buttons
are terminated with one of the four unit push buttons
[kHz], or
11
POWER — This push-push switch turns the main power supply ON
(green light on) and OFF (in=ON, out=OFF). When power is switched
[Hz]).
([GHz],
off, the current instrument front-panel set-up is stored in memory
register 0 (see Using the Store and Recall Features in Section 5) so
this set-up can be easily recalled. Full RF Attenuation is switched in
when power is switched off to protect the
damage.
1st mixer from overload and
[MHz],
495 & 495P User Manual
4-5
Page 52

Controls, Connectors, and Indicators
12
IDENT
— The
IDENT
mode allows identification of unwanted, internally-generated mixing products, as is generally the case when power at
the input exceeds the reference level by >30 dB. This push button
causes every other trace to be displaced vertically. The
1st and 2
local oscillator frequencies shift so that real, or true, signals are not
displaced horizontally on alternate sweeps, while spurious signals can
be shifted. The FREQUENCY
13 AUTO RESOLN — When this function is on, RESOLUTION
SPAN/DIV
must be 50 kHz or less.
BANDWIDTH is automatically selected to maintain a calibrated display
for,
if possible, the selected FREQUENCY SPAN/DIV,
FILTER,
and VERTICAL DISPLAY modes. When the TIME/DIV control
TIME/DIV,
is in the AUTO position, RESOLUTION BANDWIDTH is selected as a
function of FREQUENCY SPAN/DIV only, and TIME/DIV is selected to
maintain a calibrated display at the highest sweep rate. The RESOLU-
TION BANDWIDTH control will not operate when AUTO RESOLN
mode is on (the message TO CHANGE RESOLUTION AUTO RESOLN
MUST BE OFF will appear on the screen).
4-6
Controls, Connectors, and Indicators
nd
VIDEO
Page 53

Controls, Connectors, and Indicators
14 FREQUENCY
swept by the instrument. The range of this control is
100
MHz/Div.
CRT readout. Selection is in a 1 -2-5 sequence plus MAX SPAN
mode and
DIV
can also be entered with the
button sequence and the DATA ENTRY push buttons. The 495/P will
try to maintain a calibrated display if the
AUTO position or the [AUTO RESOLN] push button is active (lit).
When the FREQUENCY SPAN/DIV is in the MAX SPAN mode, the full
SPAN/DIV
— This control selects the frequency span
10
Hz/Div
The FREQUENCY SPAN/DIV setting is indicated by the
ZERO
SPAN mode, or time domain. FREQUENCY
[Blue-SHIFT]
TIME/DIV
[SPAN/DIV] push
control is in the
band is displayed. A dot near the top of the screen indicates the
CENTER FREQUENCY readout position on the span. This dot and the
center frequency position will be center screen when the FREQUENCY
SPAN/DIV is reduced from the MAX SPAN position. When the markers
are on, they show the frequency position, and the dot goes to center-
screen.
When the FREQUENCY SPAN/DIV is set to ZERO SPAN mode, the
495/P operates like a tunable receiver. The 495/P displays signals
within the resolution bandwidth in the time domain, with the CRT
reading out TIME/DIV instead of FREQUENCY SPAN/DIV.
to
SPAN/
15
RESOLUTION BANDWIDTH — This control selects the bandwidth of
the 495/P. Selected bandwidth is indicated on the CRT readout. The
bandwidth selections are 10 Hz, 100 Hz, 1 kHz, 10 kHz, 100 kHz,
1 MHz, and 3 MHz. TIME/DIV is automatically selected to match the
selected bandwidth when the TIME/DIV control is in the AUTO posi-
tion.
16 [Blue-SHIFT] SPAN/DIV — This push button sequence allows direct
entry of FREQUENCY SPAN/DIV with two significant digits of resolu-
tion. The FREQUENCY SPAN/DIV range that can be selected is 10
Divto
170 MHz/Div. If a value outside the allowable range is entered,
the FREQUENCY SPAN/DIV will switch to 10 Hz if the selected value is
less than
than 170 MHz. Spans entered from the DATA ENTRY push buttons are
terminated with one of the four unit push buttons
[kHz],
10
Hz, or to MAX SPAN mode if the selected value is greater
([GHz],
or
[Hz]).
[MHz],
Hz/
495 & 495P User Manual
4-7
Page 54

Controls, Connectors, and indicators
17
MAX SPAN — When activated, the 495/P sweeps the entire frequency
range. The position of the 495/P's CENTER FREQUENCY is shown
with a dot near the top of the screen. When this function is turned off,
the span returns to the previous FREQUENCY SPAN/DIV setting.
When the markers are on, they show the frequency position, and the
dot goes to center.
18
ZERO SPAN — This push button switches the span to zero for time
domain display. When ZERO SPAN mode is turned off, the FREQUENCY SPAN/DIV returns to its previous value.
19
UNCAL — This indicator lights when the display
amplitude
or frequen-
cy is no longer calibrated; e.g., the sweep rate is not compatible with
the FREQUENCY SPAN/DIV and RESOLUTION BANDWIDTH. Select a
slower sweep rate or larger RESOLUTION BANDWIDTH to return to
calibrated operation.
4-8
Controls, Connectors, and Indicators
Page 55

Controls, Connectors, and Indicators
20 TUNE
21
[Blue-SHIFT]
CF/MKR
pears on the trace of highest priority. The marker can be moved with
the CENTER/MARKER FREQUENCY control. When the push button
is pressed again, the marker remains and does not change its horizontal position. The CENTER/MARKER FREQUENCY control now
adjusts the center frequency.
— When this push button is lit, a single marker ap-
MKR OFF — This push button sequence turns the
marker(s) off.
22
[Green-SHIFT]
1*-MKR-»2
— This push button sequence alternate-
ly selects which marker will be tuned when [Green-SHIFT] [A MKR]
is on.
23
+STEP
[TUNE CF/MKR] push button is
marker frequency by steps (this function is limited to the edge of the
screen when not on an active trace). The step size is determined by
[Green-SHIFT] [STEP SIZE] or [Blue-SHIFT] [STEP
[+STEP] earlier in this section under Frequency for alternate opera-
tion.
— When the instrument is in the tune marker mode (the
lit),
this push button increases the
ENTRY].
See
495 & 495P User Manual 4-9
Page 56

Controls, Connectors, and Indicators
24 -STEP — When the instrument is in the tune marker mode (the
[TUNE CF/MKR] push button is
lit),
this push button decreases the
marker frequency by steps (this function is limited to the edge of the
screen when not on an active trace). The step size is determined by
[Green-SHIFT] [STEP SIZE] or
[-STEP]
tion.
earlier in this section under Frequency tor alternate opera-
[Blue-SHIFT]
[STEP
ENTRY].
See
25 [Green-SHIFT] STEP SIZE — This push button sequence defines
the frequency step of the CENTER
FREQUENCY,
MARKER FREQUEN-
CY, or the DELTA MARKER FREQUENCY, whichever mode is active.
26 [Blue-SHIFT]
MKR
-»
CENTER — This
push button sequence
centers the signal at the active marker by setting the CENTER FRE-
QUENCY equal to the MARKER FREQUENCY (this function is not
available with a stored
27 [Green-SHIFT] dB/Hz — This push button sequence mathematically
trace).
figures the average noise power in a bandwidth at the current marker
position.
28 [Green-SHIFT] MKR
->
REF LVL — This push button sequence
changes the reference level of the top graticule to the present marker
amplitude (this function is not available with a stored trace).
29 [Green-SHIFT] SIGNAL TRACK — This push button sequence
automatically maintains tuning of a drifting signal within limits. While
this mode is active, SIGNAL TRACK will be displayed on the screen.
SIGNAL TRACK IDLE will be displayed when there is no signal above
the threshold. Excessive drift will disable this function. Select SET
SIGNAL THRESHOLD from the MARKER Menu to set the threshold.
30 [Green-SHIFT] ASSIGN 2 — This
push button sequence turns on
the assigned function.
31 [Green-SHIFT] ASSIGN 1 — This
push button sequence turns on
the assigned function.
32 [Green-SHIFT] BANDWIDTH — This push button sequence places
markers on a selected signal and displays the X dB bandwidth (select
ENTER BANDWIDTH NUMBER from the marker menu to set X). The
screen will display NO SIGNAL — BW IDLE when there is no signal at
the marker that meets threshold and bandwidth parameters. Set the
parameters by selecting SET SIGNAL THRESHOLD and ENTER
BANDWIDTH NUMBER after calling up the MARKER Menu each time.
4-70 Controls, Connectors, and Indicators
Page 57

33
[Green-SHIFT]
Controls,
PEAK FIND — This push button sequence places
Connectors, and Indicators
the Primary marker at the peak of the highest on-screen signal.
[Green-SHIFT] [PEAK FIND] locates the left-most peak
center peak of a
cluster),
but it is not a signal processing command
with the built-in intelligence. Peak B would be selected from the cluster
in Figure 4-5A; peak A would be selected in Figure 4-5B because the
low point (B) would stop a search from continuing to the cluster (C).
(or
the
34 [Green-SHIFT]
allows you to set the start and stop frequencies directly from the delta
MKR
START STOP — This push button sequence
marker position (this function is not available with a stored trace).
[Green-SHIFT] [A MKR] must be on for this function to operate.
35 MARKER MENU — This push button calls up a menu display on the
screen that allows selection of one of the available marker commands
that are not permanently assigned to a front-panel push button.
RIGHT NEXT — This moves the Primary marker to the next visible
signal higher than the present marker frequency. If there is no signal to
the right of the Primary marker that meets threshold and signal type
parameters, one of the following messages will be displayed on the
screen (depending on whether CW, PULSE, or SPURS has been
selected as the signal type):
NO CW TO THE RIGHT ABOVE THRESHOLD
NO PULSE TO THE RIGHT ABOVE THRESHOLD
NO SPUR TO THE RIGHT ABOVE THRESHOLD
Select SET SIGNAL THRESHOLD and SET SIGNAL TYPE from the
Marker Menu to set the parameters.
495 & 495P User Manual
LEFT NEXT — This moves the Primary marker to the next visible
signal lower than the present marker frequency. If there is no signal to
the left of the Primary marker that meets threshold and signal type
parameters, one of the following messages will be displayed on the
screen (depending on whether CW, PULSE, or SPURS has been
selected as the signal type):
NO CW TO THE LEFT ABOVE THRESHOLD
NO PULSE TO THE LEFT ABOVE THRESHOLD
NO SPUR TO THE LEFT ABOVE THRESHOLD
Select SET SIGNAL THRESHOLD and SET SIGNAL TYPE from the
MARKER MENU to set the parameters.
4-11
Page 58

Controls, Connectors, and Indicators
NEXT LOWER PEAK — This moves the Primary marker to the signal
with the next lower amplitude, either left or right of the present marker
position. If there is no signal lower than the Primary marker that meets
threshold and signal type parameters, one of the following messages
will be displayed on the screen (depending on whether CW, PULSE, or
SPURS has been selected as the signal type):
NO LOWER CW SIGNAL ABOVE THRESHOLD
NO LOWER PULSE SIGNAL ABOVE THRESHOLD
NO LOWER SPUR ABOVE THRESHOLD
Select SET SIGNAL THRESHOLD and SET SIGNAL TYPE from the
MARKER MENU to set the parameters.
NEXT HIGHER PEAK — This moves the Primary marker to the signal
with the next higher amplitude, either left or right of the present marker
position. If there is no signal higher than the Primary marker that
meets threshold and signal type parameters, one of the following
messages will be displayed on the screen (depending on whether CW,
PULSE, or SPURS has been selected as the signal type):
NO HIGHER CW SIGNAL ABOVE THRESHOLD
NO HIGHER PULSE SIGNAL ABOVE THRESHOLD
NO HIGHER SPUR ABOVE THRESHOLD
Select SET SIGNAL THRESHOLD and SET SIGNAL TYPE from the
MARKER MENU to set the parameters.
SET SIGNAL TYPE — This alters the marker functions to recognize
one of three signal types above the threshold (select SET SIGNAL
THRESHOLD from the MARKER MENU to set the threshold).
CW
— Identifies continuous wave signals and ignores spurious
signals and impulses.
PULSE — Identifies the peak of pulsed RF lobes for either line
(lines must be <2 minor divisions apart) or dense spectra.
SPURS — Identifies all signals.
Figure
4-4
is a signal enlarged to show how the 495/P locates the
signal peak with one of the signal processing functions. The signal
processing functions are RIGHT NEXT, LEFT
PEAK, NEXT HIGHER PEAK. The 495/P measures both the individual
left-most and right-most peaks of a signal. From this reading, the
495/P calculates the exact center of the signal. If this location is a
digital storage point, the marker is positioned here. If, as in Figure
NEXT,
NEXT LOWER
4-4,
the calculated center of the signal is not equal to the maximum digital
storage point, the marker is positioned on the closest point to the
center. At the end of this section are five illustrations (Figure 4-6
through Figure
4-10)
showing the use of this signal finding command.
4-72 Controls, Connectors, and Indicators
Page 59

Controls, Connectors, and Indicators
SET SIGNAL THRESHOLD — This changes the minimum visible
signal level for the marker functions of Right Next, Left
Lower Peak, Next Higher
Peak,
Peak Find, Bandwidth Mode, and
Next,
Next
Signal Track. Select AUTO to automatically set the threshold above the
noise floor.
ASSIGN FUNCTION TO KEY — This displays a menu (ASSIGN
Menu) of additional marker functions that can be assigned to either
the
[Green-SHIFT]
[ASSIGN 1] or
[Green-SHIFT]
[ASSIGN 2]
push buttons. Call up HELP mode for the assigned push button to get
a description of the assigned function. The function will remain as-
signed to the push button, even with power off, until another function
is assigned. The ASSIGN Menu accesses the following functions as
well as RIGHT NEXT, LEFT NEXT, NEXT LOWER PEAK, and NEXT
HIGHER PEAK, which are described under MARKER MENU.
MOVE RIGHT X dB — This allows you to select the number of dB
to move the Primary marker while staying on the trace (horizontal
movement to the right). If there is no level to the right of the Prima-
ry marker that meets threshold, the message NO POINT TO THE
RIGHT TO MOVE TO will be displayed on the screen.
MOVE LEFT X dB — This allows you to select the number of dB
to move the Primary marker while staying on the trace (horizontal
movement to the
left).
If there is no level to the left of the Primary
marker that meets threshold, the message NO POINT TO THE
LEFT TO MOVE TO will be displayed on the screen.
495 & 495P User Manual
4-13
Page 60

Controls, Connectors, and Indicators
FIND PEAK AND CENTER
peak of the highest on-screen signal (refer to the
—This
places the active marker at the
[Green-SHIFT]
[PEAK FIND] description later in this section). If a signal is pres-
ent,
the CENTER FREQUENCY is set equal to the marker frequency. This centers the signal of interest (this is useful when reducing
FREQUENCY
SPAN/DIV
by several settings at once). If there is no
signal above the threshold, the message NO POINT FOUND
ABOVE THE THRESHOLD will be displayed on the screen and the
marker will not move.
ENTER BANDWIDTH NUMBER —This sets the number of dB below
the signal peak at which bandwidth will be calculated when in the
marker BANDWIDTH mode. The number is stored in memory.
GREEN-SHIFT
labeled functions can be directly selected. When GREEN-SHIFT
LOCK
—This
locks
[Green-SHIFT]
on so all green-
LOCK is on, the black-labeled functions associated with green-labeled
functions cannot be accessed. Blue-labeled functions operate normal-
ly. Press
[Green-SHIFT]
to exit this mode.
4-14
Controls,
Connectors, and Indicators
Page 61

Controls, Connectors, and Indicators
36
[Green-SHIFT] A MKR
— This push button sequence is the
on-off
switch for the Delta Marker mode. When activated, a second marker
appears at the position of the single marker on the trace. The symbols
()
will appear on the screen on the marker frequency readout line to
indicate delta frequency and delta amplitude. To use Delta Marker,
press [TUNE
the trace using the CENTER/MARKER FREQUENCY control. Press
[Green-SHIFT] [A MKR] to activate the Delta Marker Mode, and
move one of the markers to the second point of interest. Press
[Green-SHIFT] [A MKR] again to turn delta markers off.
CF/MKR]
and set the marker to one point of interest on
Signal Finding
To the finding routine, a signal consists of a peak above threshold and two
points (one on each side of the peak) that are 3 dB below the peak. The
location of the signal is the highest amplitude point on the signal. Fig-
ures 4-6 through
selected from the MARKER Menu. All of the figures use the signal processing function RIGHT NEXT. Any of the other signal processing functions
(LEFT NEXT, NEXT LOWER PEAK, NEXT HIGHER PEAK work in a similar
manner, according to their specific function. The minimum bandwidth criteria
for CW is defined as the two 3 dB down points that must be <5 kHz (1/2 a
RESOLUTION BANDWIDTH) apart.
4-10
illustrate the use of SET SIGNAL TYPE that can be
495 & 495P User Manual
4-15
Page 62

Controls,
Connectors,
and Indicators
Figures 4-6, 4-7, and 4-8 — If CW is
selected,
the 495/P will not identify
any signal because none of the signals displayed meets the minimum
bandwidth criteria. If PULSE is selected, the signals labeled D, E, and F
would be identified because the other signals in the display are less than 2
minor divisions apart. If the signals were greater than 2 minor divisions
apart, PULSE would identify all labeled signals (A,
B,
C, etc.). If SPURS is
selected, all signals would be identified (A, B, C, etc.).
4-16
Controls, Connectors, and Indicators
Page 63

Controls, Connectors, and Indicators
495 & 495P User Manual
4-77
Page 64

Controls, Connectors, and Indicators
4-78 Controls, Connectors, and Indicators
Page 65

Controls, Connectors, and Indicators
Figure 4-9 — The NEXT RIGHT function begins at the left screen margin.
With this display, all signals are identified by CW, PULSE, and SPURS
modes because the signals meet the minimum bandwidth criteria (i.e., the
selections would be A, B, C, D, and E).
Figure
4-10
— In this example, assume that the threshold is -70
dBm.
If
CW is selected, signals B, E, F, and G would be identified. The other signals
do not meet the minimum bandwidth criteria, and would be ignored. If
PULSE is selected, signals A, B, D, E, F, and G would be identified. Signal C
would be skipped because it is located within 2 minor divisions of signal B.
The PULSE algorithm would not be able to identify signals B and C sepa-
rately. If SPURS is selected, all signals would be identified.
495 & 495P User Manual 4-79
Page 66

Controls, Connectors, and Indicators
37 POSITION T ^ — These screwdriver adjustments position the dis-
play along the horizontal and vertical axes. The
[Blue-SHIFT]
[CAL]
push button sequence will guide you through the adjustment of these
controls. Refer to [Blue-SHIFT] [CAL] for additional information.
38 VIDEO FILTER WIDE — This push button reduces video bandwidth
and high-frequency components for display noise averaging. The
video bandwidth selected is approximately
RESOLUTION BANDWIDTH (1/100 for 3 MHz). Selecting [VIDEO
FILTER WIDE] cancels [VIDEO FILTER
1/30th of the selected
NARROW].
The filter value is
displayed in the lower readout.
4-20 Controls, Connectors, and Indicators
Page 67

Controls, Connectors, and Indicators
39 VIDEO FILTER NARROW — This push button reduces video
bandwidth and high-frequency components for display noise averaging. The video bandwidth selected is approximately
selected RESOLUTION BANDWIDTH
EO FILTER NARROW] cancels [VIDEO FILTER
value is displayed in the lower readout.
40
[Blue-SHIFT]
REF LEVEL — This push button sequence allows
(1/30
for
1/300th of the
10
Hz).
WIDE].
Selecting [VID-
The filter
direct entry of reference level, with 1 dB resolution. The range is
+30
dBm
to
-117
dBm
(+50
dBm
if the MINIMUM NOISE and RE-
DUCED GAIN modes are selected). Values entered outside this range
are ignored (values will be in the selected units; dBm, dBV,
dBuV).
The
[+dBx]
or
[-dBx]
push buttons terminate the reference
dBmV,
level numbers entered.
or
41 [Blue-SHIFT]
entry of the desired amplitude display factor. The range is 1 to 15
Div in 1 dB increments. Numbers outside the allowable range will be
dB/DIV
— This push button sequence allows direct
dB/
ignored. Terminate the dB/div number entered with the [dB] push
button.
42 [Blue-SHIFT] CAL — This push button sequence starts a frequency
and reference level measurement procedure that uses the 495/P CAL
OUT signal. Messages on the screen guide the user through a proce-
dure to adjust the Vertical and Horizontal POSITION, and LOG and
AMPL CAL front panel adjustments. The 495/P then runs an automat-
ic frequency, bandwidth, and relative amplitude measurement routine
for the resolution bandwidth filters.
The frequency measuring routine adjusts CENTER FREQUENCY. It
measures the frequency of each resolution bandwidth filter to reduce
CENTER FREQUENCY variation when changing RESOLUTION BAND-
WIDTH settings. The relative amplitude measuring routine reduces
REFERENCE LEVEL variation when changing RESOLUTION BANDWIDTH settings. To ensure that the 495/P meets frequency and amplitude performance characteristics, run these routines whenever the
instrument's surrounding temperature changes significantly.
Cal
factors that are used internally to correct for the errors measured by
this function are retained in memory when the instrument power is off.
To display these factors, press [Blue-SHIFT]
[LIN].
495
& 495P User Manual 4-21
Page 68

Controls, Connectors, and Indicators
43
MIN
RF ATTEN dB — This control specifies the lowest value of input
attenuation that will be used when REFERENCE LEVEL is selected.
This allows operator-control to protect the front end of the 495/P
against overload or damage from excessive signal level into the 1
st
mixer. Actual attenuation is set according to the MIN RF ATTEN dB,
REFERENCE LEVEL, and [MIN
NOISE/MIN
DISTORTION] selec-
tions. It is displayed on the CRT readout. If the MIN RF ATTEN dB
setting is increased, the IF gain is automatically changed to maintain
the current REFERENCE LEVEL, if possible. The normal position is 0
to obtain the best noise level performance.
44 REFERENCE LEVEL — This control changes the reference level one
step for each stop. Automatic selection of the IF gain and RF Attenua-
tion provide for the best overall noise and distortion performance. In
the LOG VERTICAL DISPLAY mode (FINE mode off), the step size
equals the selected dB/Div factor, except for 2 dB/Div, where step size
is 1 dB. When FINE mode is on, the step size is 1 dB for scale factors
of 5 dB/Div or more and 0.25 dB for VERTICAL DISPLAY factors of less
than 5 dB/Div. When the display factor is less than 5 dB/Div and FINE
mode is on, the Delta A mode is
selected.
Refer to Section 6, Opera-
tion for a description of the Delta A mode.
45
[Blue-SHIFT]
allows the selection of reference level units to be dBm, dBV,
REF LEVEL UNITS — This push button sequence
dBmV,
or
dBuV.
46 AMPL CAL — This screwdriver adjustment, and the LOG CAL adjust-
ment, calibrates the vertical portion of the display. AMPL CAL adjusts
the display amplitude. Press [Blue-SHIFT] [CAL] to initiate a proce-
dure that will guide you through these adjustments. Refer to [Blue-
SHIFT] [CAL] for additional information.
47 LOG CAL — This screwdriver adjustment, and the AMPL CAL adjust-
ment, calibrates the vertical portion of the display. LOG CAL adjusts
the logarithmic gain in dB/Div. Press [Blue-SHIFT] [CAL] to initiate a
procedure that will guide you through these adjustments. Refer to
[Blue-SHIFT] [CAL] for additional information.
48 MIN NOISE/MIN DISTORTION
MIN NOISE — (push button lit) — In this mode, the noise level is
reduced by changing the RF Attenuation and IF gain used for a partic-
ular reference level. Both are reduced 10 dB so noise generated in the
IF stages is decreased. However, intermodulation distortion products
will increase. RF Attenuation must be at least 10 dB for this control to
have any effect.
4-22
MIN DISTORTION — (push button not lit) — In this mode, intermo-
dulation distortion products are minimized.
Controls, Connectors, and Indicators
Page 69

Controls, Connectors, and Indicators
49 FINE (A A IN <5
REFERENCE LEVEL control. When FINE mode is off, the step size
dB/DIV)
— This push button selects step size for the
equals the selected dB/Div factor, except for 2 dB/Div, where step size
is 1 dB. When FINE mode is on, the step size is 1 dB for scale factors
of 5 dB/Div or more and 0.25 dB for VERTICAL DISPLAY factors of less
than 5 dB/Div. When the display factor is less than 5 dB/Div and FINE
mode is on, the Delta A mode is selected.
In the Delta A mode the REFERENCE LEVEL readout goes to 0.00
and the REFERENCE LEVEL control steps in 0.25 dB increments.
dB,
These fine steps provide the means to make accurate relative amplitude measurements over a 48 dB measurement range. Refer to Delta
A mode operation in Section 6, Operation for more details.
50 PULSE STRETCHER — This push button causes the fall-time of pulse
signals to be increased so very narrow pulses can be seen. The effect
is most apparent for pulsed RF signals where pulse width is small
compared to one division of sweep time. Pulse stretcher operation
may be necessary for a digital storage display of such signals, to
ensure that the correct amplitude is displayed.
VERTICAL DISPLAY — These three push buttons select the vertical
display factors. The CRT readout indicates the selection. The vertical
display factor, in the LOG mode, can also be entered with the DATA
ENTRY push buttons.
51
LIN
— With this push button activated, a linear display between zero
volts (bottom graticule line) and the reference level (top graticule line),
scaled in volts/division, is selected (see the REFERENCE LEVEL
description).
NOTE
The sequence
[Blue-SHIFT]
[UN] displays a list of the factors
used to internally correct for frequency and amplitude errors. The
factors shown are as measured with the last
[Blue—SHIFT]
[CAL]
operation. If one of the factors could not be measured at the last
operation, the old value will be noted. This means that the previous-
ly measured value is used. If [ or ] appears next to the amplitude
calibration factor, it means that this filter's amplitude related to the
3 MHz filter is outside the range of correction (correction is set to
the limit). Press [Blue-SHIFT] to exit this display.
52 2 dB/DIV — This push button increases resolution so that each major
graticule division represents 2 dB. Display dynamic range is 16 dB.
53
10
dB/DIV — With this push button activated, the dynamic range of
the display is a calibrated 80 dB with each major graticule division
representing 10 dB. '
495 & 495P User Manual
4-23
Page 70

Controls, Connectors, and Indicators
TRIGGERING
54
TIME/DIV
in a 1 -2-5 sequence in addition to AUTO, MNL, and EXT sweep
modes.
AUTO — (automatic) — This position allows the sweep rate to be
selected automatically to maintain a calibrated display for most FRE-
QUENCY
VERTICAL DISPLAY selections.
EXT — (external sweep) — This position allows the sweep circuit to be
driven by a signal applied to the rear-panel
connector. A voltage ramp of 0 to
horizontal (X) axis.
MNL—
manually swept with the MANUAL SCAN control.
— This control selects sweep rates from 5 s/Div to 20
SPAN/DIV,
RESOLUTION BANDWIDTH, VIDEO FILTER, and
HORIZJTRIG
+10
(Manual)
—This
V will sweep
position allows the spectrum or display to be
10
divisions of
us/Div
(EXT IN)
4-24 Controls, Connectors, and Indicators
Page 71

Controls, Connectors, and Indicators
55 SINGLE SWEEP — When first pressed, this push button activates the
SINGLE-SWEEP mode and stops the current sweep. When pressed
again, the sweep trigger circuit is armed and the READY indicator is lit.
The sweep will run only after it receives a trigger signal. When SINGLE
SWEEP mode is selected, the TRIGGERING selection
RUN, INTernal, LINE, or
GERING selection to cancel SINGLE SWEEP mode.
56 READY — (only used in the SINGLE SWEEP mode) — This indicator
EXTernal)
is not changed. Select any TRIG-
(i.e.,
FREE
lights when the trigger circuit is armed and ready for a trigger signal. It
remains lit until the sweep ends.
57 MANUAL SCAN — With
TIME/DIV
set to the
MNL
position, rotate this
control to manually scan the spectrum.
58 EXT — This push button allows the sweep to be triggered by signals
that are applied through the rear-panel
nector. Other TRIGGERING selections are cancelled, including
SINGLE-SWEEP mode.
HORIZJTRIG
(EXT IN) con-
59 LINE — This push button allows a sample of the AC power line volt-
age to trigger the sweep. Other TRIGGERING selections are can-
celled, including SINGLE-SWEEP mode.
60
INT
— This push button allows the sweep to be triggered by any
signal at the left edge of the display that has an amplitude of 2.0 divi-
sions or more. Other TRIGGERING selections are cancelled, including
SINGLE-SWEEP mode.
61 FREE RUN — This push button allows the sweep to free run without
regard to trigger source. Other TRIGGERING selections are cancelled,
including SINGLE-SWEEP mode.
495 & 495P User Manual 4-25
Page 72

Controls, Connectors, and Indicators
Store/Recall
62
[Blue-SHIFT]
___________
——»{
Blue
STORE
DISP
— This push button sequence starts a
multiple-push button sequence that stores either the A or B waveform
and its associated readout and marker(s) in a numbered
[8])
memory register. Information is held in memory while instrument
([0]
through
power is off. Messages displayed on the screen aid in completing the
multiple-push button sequence. After pressing [Blue-SHIFT]
[STORE
DISP],
a list of the stored displays is shown. Each stored
display is identified by its CENTER FREQUENCY. The number of digits
in a CENTER FREQUENCY in the menu list is an indication of the
FREQUENCY
SPAN/DIV
of that stored display (a larger number of
digits indicates a narrower span). This display includes a prompt
asking for the register number
([0]
through
[8])
into which the display
will be stored. Select the register from the DATA ENTRY push buttons.
When SAVE A mode is
whether the A or B waveform is to be
__________
SHIFT")—»{STORE
on,
there is an operator prompt that asks
_________________
DISP)—H
DATA
saved.
ENTRY
o-s
\-l
/—»<
VIEW
~A~)—v
>——»•
^—»•(
VIEW B
)—'
4-26 Controls, Connectors, and Indicators
Page 73

Controls, Connectors, and Indicators
63
[Blue-SHIFT]
RECALL — This push button sequence starts a multi-
ple-push button sequence that recalls a selected waveform, with its
readout and
[8]).
The waveform is placed in either the A or B display for viewing.
marker(s)
from one of the memory registers
([0]
Information is held in memory while the instrument is off. After press-
ing [Blue-SHIFT] [STORE
shown. Each stored display is identified by its CENTER FREQUENCY
DISP],
a list of the stored displays is
This display includes a prompt asking for the register number
through
from the DATA ENTRY push buttons.
The readout for a recalled A waveform will only be displayed if VIEW B
and B-SAVE A modes are off and VIEW A mode is on. The readout
for a recalled B waveform will only be displayed if both VIEW B or
B-SAVE A modes are on and SINGLE SWEEP mode is selected. The
marker(s) will only be displayed if markers are turned on.
[8])
from which the display will be recalled. Select the register
through
([0]
SAVE A mode is activated to allow the separate display of the A or B
waveform. Remember to turn on SINGLE SWEEP mode before recalling a waveform to B to prevent overwrite by the sweep. The waveform
cannot be recalled into B when in MANUAL or EXTERNAL sweep
modes. Press [Blue-SHIFT] to exit during the sequence.
Digital
Storage — These push
buttons allow either
or
both
sections
of
memory to be selected to provide digital storage. When [VIEW A] and
[VIEW B] are activated, contents of both the A and B memories are dis-
played on the screen. Both sections are updated with each sweep.
64 B-SAVE A — When activated, the 495/P displays the difference
between the B waveform and the A waveform, and automatically turns
on SAVE A mode. The factory-set zero reference line is mid-screen.
Positive differences are displayed above this line and negative differ-
ences appear below the line. Refer any change in the position of the
zero reference line to authorized service personnel.
65 PEAK/AVERAGE — This control selects the vertical position (shown
on the screen by a horizontal line) at which digital storage switches
from peak detection to signal averaging. Signals displayed above the
cursor are peak detected. Signals displayed below the cursor are
digitally averaged.
495 & 495P User Manual 4-27
Page 74

Controls, Connectors, and Indicators
66 MAX HOLD — This push button causes digital storage to retain the
maximum signal amplitude at every storage location (500 locations; or
1000
locations if SAVE A mode is
off).
If SAVE A mode is
on,
the A
waveform is not affected. Use [MAX HOLD] to measure frequency drift
or peak amplitude excursions of a signal.
67 SAVE A — This push button saves the A waveform and its readout.
The readout stored with the waveform is displayed if both [SAVE A]
and [VIEW A] are on, and [VIEW B] and [B-SAVE A] are off. If either
[VIEW B] or [B-SAVE A] is on, the readout reflects the current set-
tings. Turning SAVE A mode off cancels
B—SAVE
A mode if it is on. If
SAVE A mode is off and either [VIEW A] or [VIEW B] is on, both
waveforms will be displayed. The A waveform is not updated by the
sweep if SAVE A mode is on.
68 VIEW B — This push button causes the B waveform to be displayed.
69 VIEW A — This push button causes the A waveform to be displayed. If
SAVE A mode is on and only the A waveform is being viewed, the CRT
readout will show the settings when the A waveform was stored.
4-28 Controls, Connectors, and Indicators
Page 75

Controls, Connectors, and Indicators
70 BACKSPACE — This push button backs the cursor up one space
each time it is pressed, erasing the number in that location. This
allows you to enter correct numerical data before finishing the sequence with a units push button.
71
Green—SHIFT — This push button allows selection of the green-la-
beled front-panel push button functions. Press
time before selecting a green-lettered function.
cancels multiple push button sequence operations.
72
Blue-SHIFT
front-panel push button functions. Press [Blue-SHIFT] each time
before selecting a blue-lettered function. [Blue-SHIFT] also cancels
multiple push button sequence operations.
495 & 495P User Manual 4-29
— This push button allows selection of the blue-labeled
[Qreen-SHIFT]
[Green-SHIFT]
each
also
Page 76

Controls, Connectors, and Indicators
73 RECALL SETTINGS — This push button recalls an instrument front-
panel setup from memory. The screen displays the CENTER FREQUENCY of each stored setup as an aid in identifying the contents of
each register (0-9). The time and minimum RF Attenuation settings
stay at the knob values. Select the desired register number, and the
front-panel controls automatically switch to that setup. The instrument
settings are automatically stored in register 0 when the 495/P is turned
off,
overwriting the settings previously stored there. To return to these
settings, press [RECALL SETTINGS]
74
[Blue-SHIFT]
STORE — This push button sequence allows a front-
[0].
panel setup to be stored in memory. Up to ten settings can be stored
in registers 0-9. The screen displays the CENTER FREQUENCY of
each setup as an aid in identifying the contents of each register. Select
the desired register, and the setup is stored. The instrument settings
are automatically stored in register 0 when the495/P is turned off,
overwriting the settings previously stored there.
75 [Blue-SHIFT] VIDEO FILTER WIDE — (Special Modes Menu; not
identified on the front panel)
—This
push button sequence brings up
a menu from which these special modes may be selected:
• [0] Tracking Generator Mode
•
[1]
Sideband Analyzer Mode
• [2] Reduced Gain Mode
• [3] EOS Corrections Mode
• [4]
Zero-Span
Time Mode
76 PLOT — (495 Only) This push button causes display information to
directly drive a plotter. The plotters that can be driven include the
following:
• Tektronix HC
lating the 4662)
• Hewlett Packard HP7470A, HP7475A, HP7580B, HP7585B, or
HP7486B
•
Gould
Press the [Blue-SHIFT] [SAVE A] push button sequence to select
the plotter type. Refer to Plotting
6310
100,
or
6320
4662 Option
the
01,
4662 Option
31,
or 4663 (emu-
Display in Section 6 for details.
4-30 Controls, Connectors, and Indicators
Page 77

Controls, Connectors, and Indicators
77 Units — The units GHz, MHz, kHz, Hz, +dBx, -dBx, and dB are
available to complete a number-entry function from the front panel.
78
[Blue-SHIFT]
the front panel)
B-SAVE
—The
vertical position of the zero reference line for
A — (Plot
B-Save
A Offset; not identified on
the B-SAVE A display is set with an internal switch selection. However, when using the [PLOT] function, the position of zero reference for
the plot must be entered using this function. The range for the position
is 0 to 255 with
the DATA ENTRY push buttons when prompted by the CRT
125
representing center screen. Enter the position with
message,
and terminate with the [Hz] push button. The entered position is
stored in memory.
79
[Blue-SHIFT]
front panel)
SAVE A — (Select Plotter Type; not identified on the
—This
push button sequence displays the list of the
plotter types available for use with the [PLOT] push button (495 only)
and [Blue-SHIFT] [PLOT] push button sequence
(495Ponly).
the desired plotter type by choosing one of the menu items and enter-
ing the number on the DATA ENTRY push buttons. The choices are
listed below:
Select
• 0=Tektronix 4662 Option 01 or the 4663 in a one-pen setup
• 1 =Tektronix 4662 Option 31 or the 4663 in a two-pen setup
• 2=HP7470A
•
3=Tektronix
HC 100, HP7475A, HP7580B, HP7585B, or HP7586B,
Gould
Any plotter that is compatible with one of these can also be used. The
selected plotter type is stored in memory.
80 [Blue-SHIFT] MAX HOLD — (Instrument Errors; not identified on the
front panel)
—This
push button sequence displays all the detected
instrument errors; for use while troubleshooting.
81 DATA ENTRY — These orange push buttons are used to enter data
directly from the front panel when directed by a message on the CRT.
Numbers — The numbers [0] through [9] and a decimal point are
available to enter data from the front panel.
495 & 495P User Manual 4-31
Page 78

Controls, Connectors, and Indicators
82
[Blue-SHIFT]
PULSE STRETCHER — (Diagnostic Aids; not identi-
fied on the front panel) — This push button sequence displays a menu
of all the available diagnostic aids for use while troubleshooting.
WARNING
MOST OF THE INFORMATION ACCESSED BY PRESSING THE
SEQUENCE [Blue-SHIFT] [PULSE STRETCHER] IS FOR QUAL-
IFIED SERVICE PERSONNEL ONLY.
PROCEDURES CAN RESULT IN PERSONAL INJURY. PERFORM
ONLY THE OPERATIONS THAT CAN BE COMPLETED FROM THE
INSTRUMENT FRONT PANEL. DO NOT ATTEMPT TO REMOVE THE
INSTRUMENT PANELS OR PERFORM ANY INTERNAL OPERA-
TIONS; CONTACT QUALIFIED SERVICE PERSONNEL.
UNFAMILIARITY
WITH SAFETY
83 [Blue-SHIFT] RESET — This push button sequence resets all front-
panel settings to their original condition as if power was just turned on.
84 [Blue-SHIFT] RUN/STOP — This push button sequence has three
functions, depending on the status of macros.
• If a macro is running, press [Blue-SHIFT] [RUN/STOP] to stop
the macro.
• If a macro is stopped, press [Blue-SHIFT] [RUN/STOP] to
restart the macro.
• If no macro is running or stopped, press [Blue-SHIFT]
[RUN/
STOP] to run the last macro that was executed.
85 [Blue-SHIFT] MACRO MENU — This push button sequence selects
a macro to be executed. The title of the macro is displayed next to the
macro number.
86 [Blue-SHIFT] BASELINE CLIP — This push button sequence clips,
or blanks, about one graticule division of the spectrum trace at the
baseline of the display. Use BASELINE CLIP mode to observe the
readout at the bottom of the screen or to eliminate the bright baseline
when photographing displays.
87 [Blue-SHIFT] READOUT — This push button turns CRT readout on
and off. The brightness is proportional to the trace brightness. This
sequence does not affect prompt or help messages.
88 GRAT
ILLUM
— This push button switches the graticule lights from
dim for low-light viewing to bright for photographing displays.
4-32 Controls, Connectors, and Indicators
Page 79

Controls, Connectors, and Indicators
89 HELP — This push button causes text to be displayed on the CRT to
explain the function of a selected front-panel control or push button.
Press the [HELP] push button; then press any push button or turn
most controls for an explanation of their function. Explanations are not
available for the
PEAK/AVERAGE,
INTENSITY, or MANUAL SCAN
controls. Press [HELP] again to exit this mode.
[Blue-SHIFT]
HELP — This push button sequence allows selection
of all explanations for functions called out on the front panel in blue.
[Blue-SHIFT] [HELP] only needs to be pressed once to begin the
selection (i.e., [Blue-SHIFT] [HELP], [REF
[READOUT]).
[Green-SHIFT]
Press [HELP] again to
HELP — This push button sequence allows selection
exit
this mode.
LEVEL],
[PLOT],
of all explanations for functions called out on the front panel in green.
[Green-SHIFT] [HELP] only needs to be pressed once to begin the
selection (i.e., [Green-SHIFT] [HELP],
FIND],
[MKR
START
STOP]).
Press [HELP] again to exit this mode.
[SIGNALTRACK],
For additional information on HELP mode, see Using the HELP Feature
in Section 6.
90
INTENSITY
— This control adjusts the brightness of the CRT trace,
readout, and text. Beam focus is automatically controlled.
[PEAK
495 & 495P User Manual 4-33
Page 80

Controls, Connectors, and Indicators
91 RESET TO
LOCAL/REMOTE
— (495P Only) This push button is lit
when the 495P is in the remote state. While the instrument is remote,
the other front-panel controls are not active except for PEAK/AVER-
AGE,
INTENSITY, and MANUAL SCAN. Indicators still reflect the
current state of front-panel functions. This push button is not lit when
the 495P is in the local state. While the 495P is under local control, no
GPIB
messages are executed that would conflict with front-panel
controls or change the waveforms in digital storage. See Programming
Features in Section 6 for additional information.
92
[Blue-SHIFT]
PLOT — (495P Only) This push button sequence
causes display information to be sent over the GPIB port to directly
drive a plotter. The plotters that can be driven are listed below:
• Tektronix HC
lating the 4662)
• Hewlett Packard HP7470A, HP7475A, HP7580B,
HP7486B
4-34 Controls, Connectors, and Indicators
100,
4662 Option
01,
4662 Option
31,
or 4663 (emu-
HP7585B,
or
Page 81

•
Gould
6310
or
Controls, Connectors, and Indicators
6320
Press the push button sequence
[Blue-SHIFT]
to select the plotter
type. Refer to Plotting The Display in Section 6 for details. This push
button also causes the 495P to update the
93
[Green-SHIFT]
SRQ — (495P Only) This push button sequence
GPIB
address.
sends a service request over the GPIB bus to the controller.
94 ADDRESSED — (495P Only) This indicator lights when the 495P is
addressed to either talk or listen. The characters T, L, and/or S appear
in the CRT readout to indicate talk, listen, and/or SRQ, respectively.
95
ZIA
RF INPUT 50 Q - This 50 Q coaxial input connector is for RF
signals to
1.8
GHz. If the input signal has a DC component, use a
blocking capacitor in line with the signal.
The maximum,
is +30
dBm
non-destructive
or 1 W.
input signal level to the input mixer
The maximum rating of the RF attenuator is +30 dBm (1 W average,
75 W peak pulse width 1
exceed 0.001). Burn-out occurs above 1 W. If
vated and the
exceeded if the signal level is increased to a full-screen display.
Under these conditions the input level will be +40 dBm. Reduce
the level of high-powered signals with external attenuators.
RFATTEN
ms
or less, with a duty cycle that does not
MIN
NOISE is acti-
is 60 dB, the +30 dBm rating will be
Input signals to the mixer must not contain any DC component.
Refer to Signal Application in Section 6.
96
ZJA
97 OUTPUT
RF INPUT 75 n — (Option 07 instruments only) — This connec-
tor provides calibrated 75 Q measurement capability.
(1ST
LO/2ND LO) — These connectors are the outputs of
the respective local oscillators. The connectors must be terminated
into 50 Q when they are not connected to an external device.
495 & 495P User Manual
4-35
Page 82

Controls, Connectors, and Indicators
98 CAL OUT (Calibrator output) — This connector is the source of a
calibrated -20
dBm
(±0.3 dB), 100 MHz signal and a comb of frequency markers 100 MHz apart. This 100 MHz source is the instrument reference frequency.
For Option 07 instruments using the 50 Q input, the signal is the same
as the standard instrument. The signal is +20
using the 75 Q input.
dBmV
(±0.5 dB) when
99 Camera Power — This connector is the source of power for the
Tektronix cameras that have electrically-actuated shutters (either the
C-30BP
Option 01 or the C-9 Option 07 is
recommended).
Single-
sweep reset is not provided.
4-36
Controls, Connectors, and Indicators
Page 83

Controls, Connectors, and Indicators
100
PROBE POWER — This connector provides operating power for
active probe systems. This connector should be used only with compatible probes or accessories specifically designed for use with this
power source.
101
HORIZJTRIG
the TRIGGERING and
(EXT IN) —
TIME/DIV
Horizontal
or triggering modes depend on
selections. In the EXTERNAL TRIG-
GERING mode, the connector is an AC coupled input for trigger
signals. Trigger amplitudes from 1.0 V to 50
mum pulse width or within the frequency range of 15
Vp.p,
with a 0.1 us mini-
Hz
to 1 MHz, are
required for triggering. When the TIME/DIV selection is EXT, the
connector is a DC coupled input for horizontal sweep voltages. Deflec-
tion sensitivity is 1 V/Div. A 0 to
+10
voltage will deflect the beam
across the screen from left to right.
102
MARKERJVIDEO
Option 42 only. See
connector interfaces the 495/P with a Tektronix
(EXT IN) — (Available on instruments without
110
MHz IF for Option 42 instruments.) This
1405
TV Adapter to
display an externally-generated marker.
495 & 495P User Manual 4-37
Page 84

Controls, Connectors, and Indicators
In Option 42 instruments, the MARKER
changed to
110
MHz IF. It provides a
[VIDEO
110
(EXT IN) port is
MHz IF output with a
bandwidth greater than 4.5 MHz. External video signals used for
calibration may be injected into the PEN LIFT connector (see the PEN
LIFT description. This port is not compatible with a TV sideband
adapter.
103
HORIZ
signal. Full range is -2.5 V to +2.5 V. Source impedance is approxi-
mately 1
104
VERT (OUTPUT) — This connector provides access to the video
signal with 0.5 V for each division of displayed video that is above and
below the center line. Source impedance is approximately 1
(OUTPUT) — This connector supplies a 0.5 V/Div horizontal
kQ
NOTE
Both HORIZ and VERT output signals are driven from digital storage
if it is on. Both signals are driven from the 495/P sweep and video
amplifier stage if digital storage is off.
kQ.
105 PEN LIFT (OUTPUT) — This connector provides access to a
compatible signal to lift the pen of a chart recorder during 495/P
sweep retrace. This signal is always derived from the 495/P
regardless of the selection of the digital storage.
In Option 42 instruments, use this connector to input external video
signals if pin 1 of the ACCESSORIES connector is grounded (refer
any questions about this connection to qualified service personnel).
106
10
MHz IF (OUTPUT) — This connector provides access to the output
of the 10 MHz IF. The signal amplitude is about -30
dBm
for a full-
screen display.
107
EXTREFIN
reference signals, within the -15 dBm to
should be no greater than
offset, referenced to
a duty cycle symmetry of 40% to 60%, ECL or TTL.
(EXT IN)
—A
50 O input for 1, 2, 5, or 10 MHz external
+15
dBm level. Phase noise
-110
dBc in a 1 Hz bandwidth at 10 Hz
10
MHz. The input signal must be a sinewave with
TTL
sweep,
4-38
Controls, Connectors, and Indicators
Page 85

Controls, Connectors, and Indicators
108
GPIB ADDRESS — (495P Only) These switches set the value of the
lower five bits of the instrument GPIB address. This value is the instrument's primary address. These switches also select the Talk Only and
Listen Only operating modes, and the message terminator for input
and output. Address 31
(11111)
logically disconnects the 495P from
the bus. Address 0 (00000) is reserved for Tektronix 4050-Series
controllers. If these switches are changed after the instrument is
already active, press [RESET TO LOCAL] or
[Blue-SHIFT]
[PLOT]
to cause the 495P to read them again.
109 IEEE STD 488 PORT (GPIB) — This connector interfaces the 495 to
the selected plotter, and interfaces the 495P to the GPIB bus. The
interface functions provided in the 495 are SH1, AHO, T3, LO, SRO,
RLO, PPO, DCO, DTO, and CO. The interface functions provided in the
495P are
SH1,
AH1,
T5, L3,
SR1,
RL1,
PP1,
DC1,
DT1,
and CO.
Details of how the switches are used in remote control are in the
Programmer manual.
110
J104
ACCESSORY — This connector provides bi-directional access
to the instrument bus. It is not RS 232 compatible. A
TTL
pin 1 selects EXTERNAL VIDEO. Video signals, which are applied to
rear-panel MARKER
(VIDEO,
are connected to the video path ahead
of the video filters.
495P
0 applied to
495 & 495P User Manual 4-39
Page 86

Controls, Connectors, and Indicators
4-40
Controls, Connectors, and Indicators
Page 87

This section includes the basic instrument check-out procedures and prepa-
ration for first-time use. An operational check is included for the front-panel
push buttons and controls, and some of the operating functions. No extra
equipment is required to perform these check-out procedures, and the
instrument cabinet does not need to be removed. Refer any additional
instrument check
out
to qualified service personnel.
Firmware Version
Readout
Error Message
Readout
When the instrument is first turned on, all of the front-panel LEDs will light
up. The front-panel processor firmware versions are then displayed on the
screen for approximately two seconds.
There are error messages to report the following failure conditions:
• Calibration failure
• Power supply failure
• Battery-operated RAM checksum error
Promptly report any error messages to qualified service personnel.
If the instrument detects an internal hardware failure, a failure report comes
on screen and remains for approximately 2 seconds. A status message then
appears and remains for as long as the failure exists. Press [HELP] to bring
error messages to the screen that explain the impact of the failure on instru-
ment operation.
If you attempt to recall a display or setting from a location where nothing is
stored, you will get a checksum error message even though there is not
really an error. This need not be reported to service personnel.
Frequency
Corrections
495 & 495P User Manual
If the oscillator frequency cannot be set due to a hardware
ment will attempt to set the oscillator frequency before each sweep. The
sweep
corrections, press
holdoff
Center frequency accuracy specifications will not be met in this
mode.
time will increase with each try. To disable the oscillator
[Blue-SHIFTJ
[10
NOTE
dB/DIV].
failure,
the instru-
5-7
Page 88

Instrument Check Out
Press
[Blue-SHIFT]
routines. Another failure message will appear if the failure has not been
[10
dB/DIV]
again to enable the oscillator correction
corrected.
Preparation
for Use
^
ne
following
readout, display reference level, and bandwidth. Whenever a [SHIFT] push
button is required in this procedure to precede a multiple-push button
sequence, it is enclosed in brackets; i.e.
procedure
creates a display
and
calibrates
[Blue—SHIFT].
center
frequency
Initial Turn On
1.
Connect the spectrum analyzer power cord to an appropriate power
source (see Power Source and Power Requirements in Section 3 of this
manual) and push the [POWER] switch ON.
When [POWER] is switched ON (power-up), the processor runs a
memory and I/O test. If no processor system problems are found, the
power-up program will complete in approximately 7 seconds. The instru-
ment is now ready to operate.
Figure 5-1 shows the normal CRT readouts following the 7-second
power-up period. If a problem does exist within the instrument, a mes-
sage will appear on the screen. To bypass the failed test and attempt to
use the instrument, press the push button as directed in the error mes-
sage.
However,
performance may not be as specified.
5-2 Instrument Check Out
Page 89

Instrument Check Out
The 495/P operating functions and modes will initialize to the following
power-up states.
READOUT
REFERENCE
CENTER
MARKER
SPAN/DIV
VERTICAL
RF
ATTEN
FREQ
RESOLUTION
TRIGGERING
AUTO
DIGITAL
MIN
NOISE/MIN
ALL
OTHER
...............................................
LEVEL
FREQUENCY
FREQUENCY
..............................................
DISPLAY....................................
.............................................
RANGE
.....................................
RESOLN
STORAGE
PUSH
...................................
...............................
................................
.........................................
BANDWIDTH
..........................................
......................
DISTORTION
BUTTONS
............................
VIEW
......................
................
A &
INACTIVE
ODBM
900MHZ
OMHZ
10DB/
0-1.8
3MHZ
FREE
VIEW
MIN
NOISE
OR OFF
ON
MAX
20DB
RUN
ON
B ON
2. Set the MIN RF ATTEN dB control to 0 (NORM) and the PEAK/AVER-
AGE control fully counterclockwise.
3. Set the
TIME/DIV
control to AUTO, REF LEVEL to -20
dBm,
and adjust
the INTENSITY for the desired brightness. Note that the RF ATTEN
readout is now ODB.
495 & 495P User Manual 5-3
Page 90

Instrument Check Out
4. Apply the CAL OUT signal to the RF INPUT through a 50 Q cable. A dot
marker appears in the upper portion of the screen in the MAX frequency
span/division mode. This marker indicates the location on the display to
which the 495/P frequency is tuned. With a frequency readout of
OMHZ,
the marker is located in the top left portion of the screen.
5. Rotate the CENTER/MARKER FREQUENCY control and watch the dot
marker move across the display. Notice that the CENTER FREQUENCY
readout (top line) remains at 900
MHz,
and the MARKER FREQUENCY
readout (second line) changes according to the position of the marker
(dot).
Display Calibration
6. Harmonics of the
in Figure 5-2. To select
quence
[Blue-SHIFT]
7. Press the push button sequence [Blue-SHIFT]
[MHz] to change the SPAN/DIV to
100
MHz CAL OUT signal will be displayed as shown
100
MHz center frequency, press the key se-
[FREQ] [1] [0] [0]
[MHz].
[SPAN/DIV]
100
MHz. The dot marker is now
[1] [0] [0]
horizontally centered, and the 100 MHz CAL OUT signal is at center
screen.
8. If a message appears on the screen, press [FINE] to continue the
calibration or [Blue-SHIFT] to
exit
the routine.
When the [Blue-SHIFT] [CAL] push button sequence is pressed, the
instrument performs a center frequency and reference level calibration.
Prompts appear on the screen to guide the user through each procedure
step. The routine optimizes horizontal and vertical position, center frequency, reference level, and dynamic range.
This calibration should be done at regular intervals so the instrument can
meet its center frequency and reference level accuracy performance specifi-
cations. It should also be performed any time the instrument ambient tem-
perature is substantially different from the last calibration. An explanation of
reference level accuracy with respect to ambient temperature is described in
Section 2, Specification.
5-4
To observe the results after a calibration is completed, press the push button
sequence [Blue-SHIFT]
[LIN].
A table appears on the screen that shows
the correction factor used to center the resolution bandwidth filters to produce a calibrated center frequency. It also shows the correction that was
required to bring the amplitude of each filter within 0.4 dB of the 3 MHz filter.
1.
To begin the calibration procedure, press the push button sequence
[Blue-SHIFT]
[CAL].
2. A prompt message on the screen guides you through setting the four
front-panel adjustments: Vertical and Horizontal POSITION, and AMPL
and LOG CAL. This sets the absolute reference level for the 3 MHz
resolution bandwidth filter.
Instrument Check Out
Page 91

Instrument Check Out
3. Next the instrument performs an automatic calibration that measures
and corrects for the absolute frequency and amplitude errors of the
filters (relative to 3 MHz). This takes approximately 60 seconds.
4. If a message appears on the screen, refer to Error Message Readout
earlier in this section. The correction factors are held in memory. Press
either [FINE] to continue calibration as instructed, or [SHIFT] to exit the
routine.
Functional or
Operational Check
This procedure uses minimum test equipment to check instrument operating
modes, functions, and basic performance. The procedure checks that the
instrument is operating properly. The internal calibrator and attenuator are
used as the source to check most of the operational characteristics. Since
both are very accurate, this check should satisfy most incoming inspection
or
pre-operational
ize you with the instrument operation. A detailed Performance Check that
verifies all performance requirements in Section 2, Specification is included
in the Service Manual, Volume
check-out requirements. This check will also help familiar-
1.
Equipment Required
The only external equipment used is an
the 50 Q coaxial cable, which are supplied as standard accessories.
N-male-to-BNC-female
adapter and
Preliminary Preparation
Perform the procedure described under Preparation for Use; then allow the
instrument to warm up for at least
check.
15
minutes before proceeding with this
Check Operation of Front-Panel Push Buttons and Controls
495 & 495P User Manual
This procedure checks the operation of all front-panel push buttons and
controls, and ensures that the buttons illuminate when the function is active.
The LED lights on the push button when the function is active. Lighted LEDs
also indicate the allowable selections for any of the multiple function push
buttons. For example, all DATA ENTRY push buttons light after
SHIFT]
or [Blue-SHIFT]
push button can enter data for that selection. Messages are displayed on
[FREQ],
[Blue-SHIFT]
[dB/DIV]
shift functions have been selected. Any lighted
[SPAN/DIV],
[Blue-SHIFT]
[Blue-
[REF
LEVEL],
the screen as guides to the entry sequence of these selections.
5-5
Page 92

Instrument Check Out
Perform these steps before beginning this procedure:
1.
Connect the CAL OUT signal to the RF INPUT with the 50 Q cable and
BNC-to-N adapter.
2. Press
[Blue-SHIFT]
CENTER/MARKER
REFERENCE LEVEL
SPAN/DIV
VERTICAL
MIN
TIME/DIV
............................................
SCALE
RF
ATTEN
..............................................
FREQUENCY
......................................
dB
.................................. 0 (NORM)
[RESET];
.................................
then set the 495/P controls as follows:
......................
100MHZ
-20DBM
20KHZ
2DB/
AUTO
3. Press or change the following push buttons and controls and note their
effect on the operation.
INTENSITY — Rotate the control through its range and note the CRT beam
brightness change.
HELP — When this mode is activated, press or operate any push button
and most controls to produce a help message on the CRT that explains the
function of that push button or control. Help messages explain any error
message that may appear. Activate this mode, press various push buttons,
and observe the CRT message for each. Press the [HELP] push button
again to cancel. To get HELP messages for shifted functions, press the
desired [SHIFT] push button, press [HELP], then press the desired push
button.
GRAT
ILLUM
— When activated, the graticule is illuminated.
MARKER MENU — Press this push button to display a menu of available
marker commands that are not permanently assigned to a front-panel push
button.
TRIGGERING —To activate the TRIGGERING mode, press one of four
push buttons. The push button illuminates when in the active state. Press
any one of the push buttons to cancel or deactivate any other mode. Turn
VIEW A and VIEW B off to better observe the triggering effect.
• FREE RUN — In the active state, the trace free runs.
•
INT
— When active, the sweep is triggered when the signal or noise
level at the left edge is > 2.0 division.
1.
Use the CENTER/MARKER FREQUENCY control to tune one of the
100 MHz CAL OUT signals to the left edge of the display.
2. Adjust the REFERENCE LEVEL control so that the amplitude of the
signal is 2 or more divisions.
5-6 Instrument Check Out
Page 93

Instrument Check Out
3. Press
4. Press [FREE
5. Adjust the REFERENCE LEVEL control so that the amplitude of the
[INT]
to activate
RUN].
INT
TRIGGERING to trigger the sweep.
signal is less than 2 divisions.
6. Press [INT] to activate INT TRIGGERING. The sweep is no longer
triggered.
• LINE — When active, the trace is triggered at power line frequency.
Press [LINE] and the sweep will be triggered.
• EXT — When this function is active, the trace runs only when an external
signal > 1.0
Vp.p is applied to the rear-panel EXT IN connector. Since
external test equipment is required to check this function, a check
cannot be made with this procedure.
SINGLE SWEEP — When this function is active, single sweep aborts the
current sweep. Press [SINGLE SWEEP] once to enter SINGLE SWEEP
mode. Press [SINGLE SWEEP] again to arm the sweep generator and light
the READY indicator. When triggering conditions are met after the circuit is
armed, the 495/P makes only one sweep. The indicator remains lit until the
sweep has run. The single sweep mode is cancelled when any TRIGGER-
ING push button is pressed. The effect of SINGLE SWEEP mode is more
apparent with VIEW A and VIEW B off.
1.
Press [VIEW A] and [VIEW B] to turn these displays off.
2. Press [FREE RUN] and set the
3. Press [SINGLE SWEEP] to abort the sweep.
4. Press [SINGLE SWEEP] again. The READY indicator lights and the
TIME/DIV
to 0.5 s.
sweep runs.
5. Press [FREE RUN] to cancel single sweep.
6. Return the TIME/DIV to AUTO.
TIME/DIV — This control selects sweep rate, manual scan, and external
sweep operation. In the MNL position, the MANUAL SCAN control moves
the CRT beam across the horizontal axis of the CRT graticule. In the EXT
position, a voltage of 0 to +10 V, applied to the rear-panel
connector, deflects the CRT beam across the full
VERTICAL DISPLAY — Display modes are activated by three push but-
10-division
HORIZJTRIG
screen.
tons. Press any of these push buttons to cancel any other mode.
•
10
dB/DIV
— When this push button is activated, the display is a cali-
brated 10 dB/division with an 80 dB dynamic range.
1.
Press [VIEW A] and [VIEW B] to turn these displays on.
495 & 495P User Manual
2. Set the REFERENCE LEVEL to -20
dBm.
5-7
Page 94

Instrument Check Out
3. Press
4. Set the FREQUENCY
5. Use the CENTER/MARKER FREQUENCY control to tune the CAL
[10
dB/DIV].
SPAN/DIV
to 20 kHz.
OUT signal to center screen.
6. Use the REFERENCE LEVEL control to reduce the REFERENCE
LEVEL in 10 dB steps. The display steps in 1 division increments,
representing
7. Return the REFERENCE LEVEL readout to -20
• 2
dB/DIV
— When this push button is pressed, the display is a cali-
brated 2 dB/division with
1. Press [2
2. Use the REFERENCE LEVEL control to reduce the REFERENCE
LEVEL readout to -6 dBm. The display now steps
each two steps of the REFERENCE LEVEL control.
10
dB/DIV].
dB/division.
16
dB of dynamic range.
dBm.
1.0
division for
3. Return the REFERENCE LEVEL readout to -20 dBm.
•
LIN
— When this push button is pressed, the display is linear between
the reference level (top of the graticule) and zero volts (bottom of the
graticule), and the CRT VERTICAL DISPLAY reads out in volts/division.
1.
Press
PULSE STRETCHER — When this push button is
[LIN].
The Vertical Display readout changes to
pressed,
mV/division.
the fall-time of
video signals increases so narrow video pulses will show on the display.
1.
Select these front-panel control settings:
FREQUENCY
VERTICAL
TIME/DIV
VIEW
A and
2. Press [PULSE
SPAN/DIV
DISPLAY
...............................................
VIEW B ......................................
STRETCHER].
..............................
....................................
100MHZ
The signal peaks should increase in
10DB/
1 MS
OFF
brightness.
3. Press [PULSE STRETCHER] to turn off the PULSE STRETCHER mode.
4.
Set
the TIME/DIV to AUTO.
5. Press [VIEW A] and [VIEW B] to turn these displays on.
VIDEO FILTER
WIDE or NARROW (approximately
—Two
filters can be independently selected to provide
1/30th or
1/300lh of the resolution
bandwidth) filtering to reduce noise.
5-8
1.
Use the CENTER/MARKER FREQUENCY control to tune the 500 MHz
CAL OUT signal to center screen.
2. Change the FREQUENCY SPAN/DIV readout to 2 kHz.
Instrument Check Out
Page 95

Instrument Check Out
495 & 495P User Manual 5-9
Page 96

Instrument Check Out
3. Adjust the REFERENCE LEVEL as needed to view the noise floor.
4. Alternately press the [WIDE] and [NARROW] Video Filter push buttons.
The noise is reduced as the filter is turned on (see Figure 5-3). The
NARROW filter has a more pronounced effect on noise reduction. Note
the change in sweep rate when the
TIME/DIV
selector is in the AUTO
position.
5. Turn both Video Filters off.
DIGITAL STORAGE — Select either one or both of the A and B
waveforms from digital storage. The amplitude of a signal should remain
constant when digital storage is turned on (VIEW A or VIEW B activated).
The
PEAK/AVERAGE
control positions a cursor over the vertical window of
the screen. Noise and signal levels are averaged below the cursor and
peak-detected above the cursor.
• VIEW A — When this push button is pressed, the A waveform from
digital storage is displayed. With SAVE A mode off, the A waveform is
updated each sweep as the beam travels from left to right. With SAVE A
mode on, the waveform is not updated.
• VIEW B — When this push button is pressed, the B waveform is displayed. When both VIEW A and VIEW B modes are active, the A and B
waveforms are interlaced and displayed. Both waveforms are updated
each sweep. Update of the A waveform depends on the state of SAVE A
mode.
• SAVE A — When SAVE A mode is
readout is
dated each sweep. If either VIEW B mode or B-SAVE A mode is on, the
readout reflects the current 495/P setup. The readout for the saved
saved.
In this mode, the data for the A waveform is not up-
activated,
the A waveform with its
waveform will be displayed any time SAVE A mode is on, and the VIEW
B and B-SAVE A modes are off.
1.
Press [SAVE A] to store the waveform in the A register.
2. Press [VIEW B] to turn it off.
3. Change the setting of the REFERENCE LEVEL control. The A
display will not change.
4. Press [SAVE A] to turn this mode off.
• MAX HOLD — When this push button is pressed, the maximum signal
amplitude at each memory location is stored. The waveform is updated
only when signal data is greater than that previously stored. To verify
operation, perform the following procedure:
5-10
1.
Return the REFERENCE LEVEL readout to -20 dBm.
2. Press [MAX HOLD] to turn this mode on.
3. Change the setting of the CENTER/MARKER FREQUENCY control.
The maximum level at each screen location will be retained.
4. Press [MAX HOLD] to turn this mode off.
Instrument Check Out
Page 97

Instrument Check Out
• B-SAVE A — Press this push button to display the arithmetic difference
between an updated B waveform and a SAVE A waveform. The SAVE A
function is automatically activated when [B-SAVE A] is pressed.
The reference (zero difference) level is factory set at graticule center. The
position of this reference level can be changed by qualified service
personnel. Positive differences between the two displays appear above
this line and negative differences below the line.
1.
Press [VIEW A] and [VIEW B] to turn these displays on.
2. Press [SAVE A] to store the waveform in the A register.
3. Press [B-SAVE A] to view the difference between the B and SAVE A
waveforms.
4. Press [SAVE A] to turn this mode off.
•
PEAK/AVERAGE
— When digital storage is on, this control positions a
horizontal line, or cursor, anywhere within the graticule window. Signals
above the cursor are peak detected. Signals below the cursor are averaged by the digital storage. To verify operation, move the cursor within
the noise level. The noise amplitude will change as the cursor is positioned.
IDENT
— When the identify function is turned on, the waveform is vertically
displaced on alternate sweeps. The frequencies of the 1st and 2nd local
oscillators are moved so that true signals are not displaced horizontally on
alternate sweeps while spurious signals are shifted significantly, or off
screen. The FREQUENCY SPAN/DIV setting must be 50 kHz or less before
IDENTIFY mode can be turned on. Refer to Using the Signal Identifier in
Section 6, Operation, for more details.
1.
Select these front-panel control settings:
CENTER/MARKER
FREQUENCY SPAN/DIV
REFERENCE LEVEL
VERTICAL
2. Press [IDENT] to turn the IDENTIFY mode on.
DISPLAY
3. There will be no horizontal displacement of the
FREQUENCY
................................
..................................
....................................
......................
100
MHz signal on
1500MHZ
50KHZ
-40DBM
10DB/
alternate sweeps. To help determine if the signal is true or spurious (see
Figure
5-4),
decrease the sweep rate or push [SAVE A] with both VIEW
A and VIEW B on, so a comparison can be made.
4. Press [IDENT] to turn the IDENTIFY mode off.
495 & 495P User Manual
5-77
Page 98

Instrument Check Out
5-12
Instrument Check Out
Page 99

Instrument Check Out
AUTO RESOLN — When this push button is pressed and FREQUENCY
SPAN/DIV
and
TIME/DIV
settings are changed, resolution bandwidth is
automatically selected by the processor to maintain a calibrated display. The
UNCAL indicator should not light over the FREQUENCY SPAN/DIV range if
the TIME/DIV selector is in the AUTO position.
1.
To check operation, change FREQUENCY SPAN/DIV or TIME/DIV
settings. The RESOLUTION BANDWIDTH will change automatically.
2. Return the TIME/DIV control to AUTO.
MAX SPAN — When
activated,
the span switches to maximum and the
495/P sweeps the full band. When deactivated, the FREQUENCY SPAN/DIV
returns to its previous setting.
ZERO SPAN — When activated, the FREQUENCY SPAN/DIV shifts to zero
for a time-domain display. When deactivated, the FREQUENCY SPAN/DIV
returns to its previous setting.
FREQUENCY SPAN/DIV — As this control is
SPAN/DIV changes between 0 and MAX. The display indicates the change.
rotated,
the FREQUENCY
RESOLUTION BANDWIDTH — As this control is rotated, the resolution
bandwidth changes in decade steps from 10 Hz to 1 MHz, and then to
3 MHz. The AUTO RESOLN mode must be off to change resolution bandwidth with the RESOLUTION BANDWIDTH control.
REFERENCE LEVEL — With 10
FINE mode off, the REFERENCE LEVEL readout steps in 10 dB increments
as the control is rotated. When FINE mode is
In the 2 dB/DIV mode, the steps are 1 dB with FINE mode off and 0.25 dB
with FINE mode on.
dB/DIV
VERTICAL DISPLAY active and
activated,
the steps are 1 dB.
495 & 495P User Manual
When the Vertical Display factor is 4 dB/div or less with FINE mode on, the
495/P
switches
LEVEL readout goes to 0.00 dB, then steps in 0.25 dB increments as the
REFERENCE LEVEL control is rotated.
1.
Set the
10 dB/DIV.
2. Rotate the REFERENCE LEVEL control counterclockwise to 40 dBm,
then clockwise to
changes in 10 dB increments.
3. Press
4. Change the setting of the REFERENCE LEVEL control. The REFERENCE LEVEL readout now steps in 1 dB increments.
to the delta A mode. In the delta A mode, the REFERENCE
MIN
RF
ATTEN
[FINE].
dB control to 0 dB and VERTICAL DISPLAY to
-110
dBm. The REFERENCE LEVEL readout
5-13
Page 100

Instrument Check Out
5. Press
6. Rotate the REFERENCE LEVEL control. The REFERENCE LEVEL now
[Blue-SHIFT]
DATA ENTRY push buttons. The REFERENCE LEVEL readout goes to
0.00
dB.
[dB/DIV]
and enter 4 dB (press [4]
[dB])
with the
steps in 0.25 dB increments from the 0.00 dB reference.
MIN RF ATTEN dB
—This
control sets the minimum amount of RF attenuation in the signal path, regardless of the REFERENCE LEVEL control setting.
1.
To check
CENTER/MARKER
FREQUENCY
REFERENCE
VERTICAL
FINE....................................................
2. Set the MIN RF ATTEN dB selector to 20.
3. Change the REFERENCE LEVEL setting to -50
operation,
SPAN/DIV
LEVEL
DISPLAY
select these front-panel control settings:
FREQUENCY
...............................
..................................
....................................
.......................
dBm.
The RF ATTENU-
100MH2
500KHZ
-20DBM
10DB/
OFF
ATION readout will not go below 20 dB.
FINE
—When
Refer to the REFERENCE LEVEL check earlier in this section.
MIN
NOISE/MIN
activated, the REFERENCE LEVEL control steps decrease.
DISTORTION — This push button selects one of two
methods that select RF attenuator and IF gain. MIN NOISE mode (button
illuminated) reduces the noise level by reducing attenuation 10 dB and
decreasing IF gain 10 dB. MIN DISTORTION mode reduces
due to input mixer overload. To observe any
change,
the amount of RF
IM
distortion
ATTENUATION displayed by the CRT readout must be 10 dB higher than the
MIN RF ATTEN dB selector setting.
1.
To check operation, select these front-panel control settings:
CENTER/MARKER FREQUENCY
FREQUENCY
REFERENCE
VERTICAL
MIN RF
SPAN/DIV
LEVEL
DISPLAY
ATTEN
...............................
..................................
....................................
dB
.................................. 0 (NORM)
.......................
100MHZ
500KHZ
-20DBM
10DB/
2. The RF ATTENUATION readout will indicate 0 dB.
3. Press [MIN NOISE/MIN DISTORTION] to turn on MIN DISTORTION
mode. The noise floor will rise approximately
10
dB, and the RF AT-
TENUATION readout will change to 10 dB.
5-74
4. Press [MIN NOISE/MIN DISTORTION] to turn on MIN NOISE mode.
Instrument Check Out
 Loading...