


NAVAIR 17–20AW–232
TECHNICAL MANUAL
INSTRUMENT CALIBRATION PROCEDURE
SPECTRUM ANALYZERS
TEKTRONIX
494, 494P, 494POPT08,
494POPT30, 494AP
AND
INTERSTATE ELECTRONICS
7185400
THIS PUBLICATION SUPERSEDES NAVAIR 17–20AW–232
DATED 1 MARCH 1991
DISTRIBUTION STA TEMENT C. DISTRIBUTION AUTHORIZED TO U.S. GOVERNMENT AGENCIES AND THEIR
CONTRACTORS TO PROTECT PUBLICA TIONS REQUIRED FOR OFFICIAL USE OR FOR ADMINISTRA TIVE OR
OPERA TIONAL PURPOSES ONL Y . OTHER REQUESTS FOR THIS DOCUMENT SHALL BE REFERRED TO NA VY
MEASUREMENT SCIENCE DIRECTORATE, NAVAL WARFARE ASSESSMENT DIVISION, P.O. BOX 5000
CORONA, CA 91718–5000
DESTRUCTION NOTICE– FOR UNCLASSIFIED, LIMITED DOCUMENTS, DESTROY BY ANY METHOD
THAT WILL PREVENT DISCLOSURE OF CONTENTS OR “RECONSTRUCTION OF THE DOCUMENT.”
PUBLISHED BY DIRECTION OF COMMANDER NAVAL AIR SYSTEMS COMMAND
1 APRIL 1997

NAVAIR 17–20AW–232
LIST OF EFFECTIVE PAGES
The purpose of this list is to identify the pages in this document affected by any technical content changes made since
the previous release of the document.
NOTE: On a revised page, with the exception of the Title, the A, and the i pages, the technical changes are indicated by
a vertical line in the outer margin of the page.
Page
No.
Title R
AR
i0
1, 2 R
3, 4 0
5 to 9 R
10, 11 0
12 to 16 R
17 0
18 to 35 R
36 0
37 R
Revision*
Page
No.
Revision*
Page
No.
Revision*
38, 39 0
40 to 43 R
44 (blank) 0
45 to 53 R
54 (blank) 0
55 to 64 R
* Zero in this column indicates an original page.
“R” in this column indicates a revised page.
A

NAVAIR 17–20AW–232
TABLE OF CONTENTS
Section Page
1 Introduction and Description 1. . . . . . . . . . . . . . . . . . . . . . . . . . . . . . . . . . . . . . . . . . . . . . . . . . . . . .
2 Equipment Requirements 6. . . . . . . . . . . . . . . . . . . . . . . . . . . . . . . . . . . . . . . . . . . . . . . . . . . . . . . . .
3 Preliminary Operations 9. . . . . . . . . . . . . . . . . . . . . . . . . . . . . . . . . . . . . . . . . . . . . . . . . . . . . . . . . .
4 Calibration Process 11. . . . . . . . . . . . . . . . . . . . . . . . . . . . . . . . . . . . . . . . . . . . . . . . . . . . . . . . . . . . . .
4.1 Calibrator Tests 11. . . . . . . . . . . . . . . . . . . . . . . . . . . . . . . . . . . . . . . . . . . . . . . . . . . . . . . . . . . . . . .
4.2 Counter Readout Tests 12. . . . . . . . . . . . . . . . . . . . . . . . . . . . . . . . . . . . . . . . . . . . . . . . . . . . . . . . . .
4.3 Center Frequency Tests 15. . . . . . . . . . . . . . . . . . . . . . . . . . . . . . . . . . . . . . . . . . . . . . . . . . . . . . . . .
4.4 CRT Display Tests 16. . . . . . . . . . . . . . . . . . . . . . . . . . . . . . . . . . . . . . . . . . . . . . . . . . . . . . . . . . . . .
4.5 Frequency Span Tests 18. . . . . . . . . . . . . . . . . . . . . . . . . . . . . . . . . . . . . . . . . . . . . . . . . . . . . . . . . .
4.6 RF Attenuator Tests 22. . . . . . . . . . . . . . . . . . . . . . . . . . . . . . . . . . . . . . . . . . . . . . . . . . . . . . . . . . . .
4.7 IF Gain Tests 24. . . . . . . . . . . . . . . . . . . . . . . . . . . . . . . . . . . . . . . . . . . . . . . . . . . . . . . . . . . . . . . . .
4.8 Frequency Response Tests 26. . . . . . . . . . . . . . . . . . . . . . . . . . . . . . . . . . . . . . . . . . . . . . . . . . . . . . .
4.9 Equivalent Input Noise Sensitivity Tests 29. . . . . . . . . . . . . . . . . . . . . . . . . . . . . . . . . . . . . . . . . . . .
4.10 Intermodulation Distortion T ests 33. . . . . . . . . . . . . . . . . . . . . . . . . . . . . . . . . . . . . . . . . . . . . . . . . .
4.11 Harmonic Distortion T est 34. . . . . . . . . . . . . . . . . . . . . . . . . . . . . . . . . . . . . . . . . . . . . . . . . . . . . . .
4.12 Noise Sidebands T est 35. . . . . . . . . . . . . . . . . . . . . . . . . . . . . . . . . . . . . . . . . . . . . . . . . . . . . . . . . . .
4.13 Residual Response T ests 36. . . . . . . . . . . . . . . . . . . . . . . . . . . . . . . . . . . . . . . . . . . . . . . . . . . . . . . .
4.14 Residual FM T ests 37. . . . . . . . . . . . . . . . . . . . . . . . . . . . . . . . . . . . . . . . . . . . . . . . . . . . . . . . . . . . .
4.15 Resolution Bandwidth T ests 40. . . . . . . . . . . . . . . . . . . . . . . . . . . . . . . . . . . . . . . . . . . . . . . . . . . . .
4.16 IEEE Bus Tests (494P and 494AP Models only) 42. . . . . . . . . . . . . . . . . . . . . . . . . . . . . . . . . . . . .
Navy Calibration Checklist 45. . . . . . . . . . . . . . . . . . . . . . . . . . . . . . . . . . . . . . . . . . . . . . . . . . . . . . .
ILLUSTRATIONS
Figure Page
1 Calibrator T est Configuration 12. . . . . . . . . . . . . . . . . . . . . . . . . . . . . . . . . . . . . . . . . . . . . . . . . . . . . .
2 Counter Readout T est Configuration 14. . . . . . . . . . . . . . . . . . . . . . . . . . . . . . . . . . . . . . . . . . . . . . . .
3 CR T Display Test Configuration 16. . . . . . . . . . . . . . . . . . . . . . . . . . . . . . . . . . . . . . . . . . . . . . . . . . .
4 Frequency Span T est Configuration 18. . . . . . . . . . . . . . . . . . . . . . . . . . . . . . . . . . . . . . . . . . . . . . . . .
5 RF Attenuator T est Configuration 22. . . . . . . . . . . . . . . . . . . . . . . . . . . . . . . . . . . . . . . . . . . . . . . . . .
6 Frequency Response T est Configuration 27. . . . . . . . . . . . . . . . . . . . . . . . . . . . . . . . . . . . . . . . . . . . .
7 Intermodulation Distortion T est Configuration 33. . . . . . . . . . . . . . . . . . . . . . . . . . . . . . . . . . . . . . . .
8 Third Order Intermodulation Display 34. . . . . . . . . . . . . . . . . . . . . . . . . . . . . . . . . . . . . . . . . . . . . . .
9 Sideband Noise Level Measurement Display 36. . . . . . . . . . . . . . . . . . . . . . . . . . . . . . . . . . . . . . . . .
10 Calculating Slope for Residual FM Measurement 38. . . . . . . . . . . . . . . . . . . . . . . . . . . . . . . . . . . . . .
11 Residual FM Measurement Display 39. . . . . . . . . . . . . . . . . . . . . . . . . . . . . . . . . . . . . . . . . . . . . . . . .
12 Resolution Bandwidth and Shape Factor Measurement Displays 41. . . . . . . . . . . . . . . . . . . . . . . . . .
TABLES
T able Page
1 Calibration Description 1. . . . . . . . . . . . . . . . . . . . . . . . . . . . . . . . . . . . . . . . . . . . . . . . . . . . . . . . . .
i

NAVAIR 17–20AW–232
SECTION 1
INTRODUCTION AND DESCRIPTION
1.1 This procedure describes the calibration of the T ektronix 494, 494P, 494POPT08, 494POPT30, 494AP and
Interstate Electronics 7185400 Spectrum Analyzers. The instrument being calibrated is referred to herein as the
TI (Test Instrument).
1.2 All comments concerning this procedure should be directed to Navy Measurement Science Directorate,
Naval Warfare Assessment Division, P .O. Box 5000, Corona, CA 91718–5000.
1.3 This procedure includes tests of essential performance parameters only. Any malfunction noticed during
calibration, whether specifically tested for or not, should be corrected.
1.4 If the TI is the Interstate Elecectronics 7185400, the T ektronix 494P test tolerances apply.
T able 1. Calibration Description
TI
Characteristics
Calibrator
Counter read–out
Performance
Specifications
Frequency: 100 MHz
T olerance: +
10 Hz
Output level: –20 dBm
T olerance: +
0.3 dB
Range: 10 kHz to 21 GHz
T olerance: +
x 1 x 10
[(counter frequency
7
–
) + [(10 + 2N) Hz] +
1 LSD], all 494 series and for
delta frequency mode if TI is a
494A series; +
x 1 x 10
[(counter frequency
7
–
) + [(5 + N) Hz] +
1 LSD], frequency accuracy mode
if TI is a 494A series
Where N=1 for Bands 1
through 3, and N=3 for Bands 4
and 5; and where:
BAND 1 = 0 to 1.8 GHz
BAND 2 = 1.7 to 5.5 GHz
BAND 3 = 3.0 to 7.1 GHz
BAND 4 = 5.4 to 18 GHz
BAND 5 = 15 to 21 GHz
T est
Method
Measured with an electronic
counter.
T ested using the TI display
by measuring, with a power
meter, the output level of a
signal generator that had
been set to the same power
level as the TI calibrator
signal.
T ested with the TI CAL
OUT markers and a signal
source.
1

NAVAIR 17–20AW–232
TI
Characteristics
Center frequency
accuracy
CR T display
Performance
Specifications
Range: 10 kHz to 21 GHz
T olerance: +
Res. BW, whichever is greater) +
(center frequency x 1 x 10
[(20% of span/div or
7
–
) +
{(N x 15) kHz}] for Bands 1 and 5
with span/div >200 kHz, and
Bands 2 through 4 with span/div
>100 kHz; +[(20% of span/div or
Res. BW, whichever is greater) +
(center frequency x 1 x 10
7
–
) +
{(2N + 25) Hz}] for Bands 1 and 5
with span/div <200 kHz, and
Bands 2 through 4 with span/div
<100 kHz
Range: 80 dB (log) or 8 divisions
(linear)
T olerance: +
maximum of +
range; +
maximum of +
range; +
1.0 dB/10 dB to a
2 dB over 80 dB
0.4 dB/2 dB to a
1.0 dB over 16 dB
5% fullscale over linear
range
Test
Method
T ested with a signal source.
T ested using a signal
generator and step
attenuators.
Frequency span/div
RF attenuator
494 Models
Range (in a 1, 2, 5 sequence):
50 Hz/div to 200 MHz/div for
Bands 1 to 3; 50 Hz/div to
500 MHz/div for Bands 4 and 5
494A Models
Range (in a 1, 2, 5 sequence):
10 Hz/div to 100 MHz/div for
Band 1; 10 Hz/div to
200 MHz/div for Bands 2 and
3; 10 Hz/div to 1 GHz/div for
Band 4; 10 Hz/div to
500 MHz/div for Band 5
T olerance: +
5% of frequency
span/div setting over center
8 div of CRT display,
50 Hz/div bandwidth settings
>
494 Models
Range: 0 to 60 dB in 10 dB steps
T olerance: +
maximum of +
0.3 dB/10 dB to a
0.7 dB, over the
60 dB range from DC to 4 GHz;
+0.5 dB/10 dB to a maximum
of 1.4 dB, over the 60 dB range
from 4 to 18 GHz
T ested using a comb
generator for spans of
500 MHz/div down to
500 kHz/div, and then
using a function generator
to modulate the comb
generator to test the span
from 200 kHz/div down to
2 kHz/div; or tested using
an accurate (frequency)
signal generator, or signal
source.
T ested at 1, 10, and 15 GHz
by noting the change in the
signal generator level (as
measured by a calibrator)
that is required to regain a
reference as the TI
attenuators are switched in.
2

NAVAIR 17–20AW–232
Characteristics
RF attenuator
(cont.)
IF gain
TI
Performance
Specifications
494A Models
Range: 0 to 60 dB in 10 dB steps
T olerance: +
maximum of +
60 dB range to 1.8 GHz;
+1.5 dB/10 dB to a maximum
3.0 dB, over the 60 dB
of +
range from 1.8 to 18 GHz;
+
3 dB/10 dB to a maximum
6 dB, over the 60 dB
of +
range from 18 to 21 GHz
Range: 97 dB
(107 dB, 494A models)
T olerance: +
maximum of +
except at the decade transitions
from –19 to –20 dBm, –29 to
–30 dBm, –39 to –40 dBm,
–49 to –50 dBm, and –59
to –60 dBm, where an
additional +
a total of +
(with add maximum error of
+2 dB over the full range)
0.5 dB/10 dB to a
1.0 dB, over the
0.2 dB/dB to a
0.5 dB/9 dB,
0.5 dB can occur for
1.0 dB per decade;
Test
Method
T ested at 100 MHz by
noting the change in signal
generator level (as
measured by a calibrator)
that is required to regain a
reference as the TI IF gain
is varied.
Frequency response
Frequency response (about the
mid–point between two
extremes):
Band 1: +
1.8 GHz; +
1.8 GHz; (494 models only)
Band 1: +
1.8 GHz, (494A models only)
Band 2: +2.5 dB
Band 3: +
Band 4: +
Band 5: +
Frequency response (referenced
to 100 MHz):
Band 1: +
1.8 GHz; +
1.8 GHz, (494 models only)
Band 1: +2.5 dB, 10 kHz to
1.8 GHz, (494A models only)
Band 2: +
Band 3: +
Band 4: +
Band 5: +
1.5 dB, 50 kHz to
2.0 dB, 10 kHz to
1.5 dB, 10 kHz to
2.5 dB
3.5 dB
5.0 dB
2.5 dB, 50 kHz to
3.0 dB, 10 kHz to
3.5 dB
3.5 dB
4.5 dB
6.5 dB
T ested by noting the TI
indication of test signal that
are held constant in level
and verifying that the TI
indications, when
compared to each other,
are acceptable.
3

NAVAIR 17–20AW–232
TI
Characteristics
Equivalent input noise 494 Models:
Sensitivity:
Bands 1–3 (50 kHz to 7.1 GHz):
–80 dBm at 1 MHz res. BW;
–90 dBm at 100 kHz res. BW;
–100 dBm at 10 kHz res. BW;
–110 dBm at 1 kHz res. BW ;
–118 dBm at 100 Hz res. BW;
–121 dBm at 30 Hz res. BW
Bands 4 (5.4 kHz to 12.0 GHz):
–65 dBm at 1 MHz res. BW;
–75 dBm at 100 kHz res. BW;
–85 dBm at 10 kHz res. BW;
–95 dBm at 1 kHz res. BW;
–103 dBm at 100 Hz res. BW;
–106 dBm at 30 Hz res. BW
Band 4 (12.0 to 18.0 GHz):
–60 dBm at 1 MHz res. BW;
–70 dBm at 100 kHz res. BW;
–80 dBm at 10 kHz res. BW;
–90 dBm at 1 kHz res. BW;
–98 dBm at 100 Hz res. BW;
–101 dBm at 30 Hz res. BW
Band 5 (15.0 to 21.0 GHz):
–55 dBm at 1 MHz res. BW;
–65 dBm at 100 kHz res. BW;
–75 dBm at 10 kHz res. BW;
–85 dBm at 1 kHz res. BW;
–93 dBm at 100 Hz res. BW;
–96 dBm at 30 Hz res. BW
Performance
Specifications
Test
Method
Tested by verifying that the
TI average noise level does
not exceed the rated
sensitivity of the TI at the
test frequency.
494A Models
Sensitivity:
Band 1:
–80 dBm at 3 MHz res. BW;
–85 dBm at 1 MHz res. BW;
–95 dBm at 100 kHz res. BW;
–105 dBm at 10 kHz res. BW;
–115 dBm at 1 kHz res. BW ;
–125 dBm at 100 Hz res. BW;
–134 dBm at 10 Hz res. BW
Bands 2 & 3:
–74 dBm at 3 MHz res. BW;
–79 dBm at 1 MHz res. BW;
–89 dBm at 100 kHz res. BW;
–99 dBm at 10 kHz res. BW;
–109 dBm at 1 kHz res. BW;
–119 dBm at 100 Hz res. BW;
–125 dBm at 10 Hz res. BW
Band 4 (5.4 to 12 GHz):
–60 dBm at 3 MHz res. BW;
–65 dBm at 1 MHz res. BW;
–75 dBm at 100 kHz res. BW;
–85 dBm at 10 kHz res. BW;
–95 dBm at 1 kHz res. BW;
–105 dBm at 100 Hz res. BW;
–111 dBm at 10 Hz res. BW
4

NAVAIR 17–20AW–232
TI
Characteristics
Equivalent input noise
(Cont.)
Intermodulation
distortion
Harmonic distortion
Performance
Specifications
Band 4 (12 to 18 GHz) and 5:
–55 dBm at 3 MHz res. BW;
–60 dBm at 1 MHz res. BW;
–70 dBm at 100 Hz res. BW;
–80 dBm at 10 kHz res. BW;
–90 dBm at 1 kHz res. BW;
–100 dBm at 100 Hz res. BW;
–107 dBm at 10 Hz res. BW
Third order products: at least
–70 dB below any two on–screen
signals within any frequency span
Harmonic distortion:
at least –60 dBc for full screen
signal (to 1.8 GHz): at least
–100 dBc (1.7 to 21 GHz)
(494 models only);
not discernible, (494A models
only)
T est
Method
T ested using two signals
which are 1 MHz apart at
approximately 1 GHz, and
verifying with the TI display
that the 3rd order products
are within specifications.
The TI is set for a fullscale
display of –30 dBm
(–40 dBm, 494A models). A
precise 100 MHz signal from a
signal generator is adjusted for
a fullscale display on the TI.
Next, the TI is adjusted to
center the harmonic of
200 MHz on the display. A
filter is inserted to reject the
external 200 MHz harmonic
signal and the TI display is
verified to be at least 60 dB
below fullscale.
Noise sidebands
Residual response
LO emission out
Residual FM (short
term) after 1 hour
warm–up
At least –75 dBc at 30 times the
resolution bandwidth offset
(–70 dBc at 30 times the
resolution bandwidth offset for
100 Hz resolution bandwidth or
less)
Responses: –100 dBm or less
(no input signal, referenced to
mixer input)
Maximum output: –70 dBm
(referenced to input mixer)
(7 x N) kHz total excursion in
<
20 ms; Band 1 and 5 with
span/div >200 kHz and Bands
2 through 4 with span/div
>100 kHz (phaselocked off)
(10 + 2N) Hz total excursion in
<
20 ms; Bands 1 and 5 with
span/div <200 kHz and Bands 2
through 4 with span/div <
(phaselocked on)
100 kHz
T ested with the TI CAL OUT
signal.
T ested in 100 MHz increments
using the TI display by
verifying that all observed
residual responses are below
–100 dBm.
T ested by inference during
residual response tests.
T ested using the TI display
and the TI CAL OUT signal.
5

NAVAIR 17–20AW–232
TI
Characteristics
Resolution bandwidth
IEEE data bus (494P
and 494AP models
only)
1.4 This procedure does not perform tests for vertical output, horizontal output, trigger sensitivity, external
sweep, time/div , and preselector rejection.
494 Models
Range: 30 Hz, and then 100 Hz to
1 MHz in decade steps
T olerance: Within +20% of
bandwidth at 6 dB down
Shape factor: <7.5:1; <15:1 at 30 Hz
Res. BW
494A Models
Range: 10 Hz to 1 MHz in decade
steps, and then 3 MHz
T olerance: Within +20% of
bandwidth at 6 dB down
Shape factor: <7.5:1; <12:1 at 10 Hz
Res. BW
Conforms to IEEE std. 488–1978
for Talker and Listener
Performance
Specifications
Test
Method
T ested using the TI CAL
OUT signal and the CRT
display.
Checked using an IEEE bus
tester program.
NOTE
If the TI is used for applications only up to 18 GHz, calibrate the TI only up to 18 GHz;
otherwise, if the TI is used for applications up to 21 GHz, calibrate the TI fully up to
21 GHz as directed in the procedure.
SECTION 2
EQUIPMENT REQUIREMENTS
NOTE
Minimum use specifications are the principal parameters required for performance of the
calibration, and are included to assist in the selection of alternate equipment, which may be used
at the discretion of the using laboratory. Satisfactory performance of alternate items shall be
verified prior to use. All applicable equipment must bear evidence of current calibration.
The instruments utilized in this procedure were selected from those known to be available at
Navy calibration facilities, and the listing by make or model number carries no implication of
preference, recommendation, or approval for use by other agencies. It is recognized that
equivalent equipment produced by other manufacturers may be capable of equally satisfactory
performance in this procedure.
6

NAVAIR 17–20AW–232
Item
2.1 Microwave
counter*
2.2 Low pass filter
2.3 Signal generator
(2 required)
2.4 Power meter
2.5 Power sensor*
Minimum Use
Specifications
Frequency: 100 MHz to 21 GHz
Uncertainty: +
2.5 x 10
8
–
Sensitivity: –20 dBm
Resolution: 1 Hz
Cutoff frequency: 135 MHz
Insertion loss: 1 dB max. at 100 MHz
Rejection: at least 40 dB at 200 MHz
Impedance: 50
Frequency: 20 MHz to 1 GHz
(and 200 MHz to 1.8 GHz is used
for frequency span/div tests)
Uncertainty: NA**
Stability: +
0.001%/hr max.
Output: +12 to –85 dBm
Power display range: 0 to –20 dBm
Uncertainty: +
1% fullscale
Frequency: 100 MHz to 21 GHz
Power range: 0 to –20 dBm
Cal. factor uncertainty: +
2.5% max.
SWR: 1.40 max.
Must be compatible with power meter
(item 2.4)
Calibration
Equipment
Hewlett–Packard
5351BOPT001 or
5343AOPT001, 011
T elonic TLC135–7EE2;
or Sierra 184–135
Hewlett–Packard
8642BOPT001, 710,
907, 8642BOPT001,
907, or 8640BOPT001,
002, 003***; or
Fluke 6062AOPT130 or
6071AOPT130***
Hewlett–Packard
436AOPT022, 436A, or
435A
100 MHz to 18 GHz
Hewlett–Packard 8481A
18 to 21 GHz
Hewlett–Packard 8485A
2.6 Signal source
CW frequency: 100 MHz to 21 GHz
Uncertainty: NA**
Resolution: 10 Hz
Hewlett–Packard
83630AOPT001, 008, H53,
8340B or 8340A
Output: +10 to –85 dBm
Sweep frequency range: 10 MHz to
21 GHz
Output: +6 dBm to –10 dBm
Capable of being externally leveled to
0.375 dB
+
2.7 Step attenuators
(one of each
value required)
Overall attenuation: 0 to 80 dB in 1 dB
steps
Consisting of attenuation: 0 to 12 dB in
1 dB steps;
and
Attenuation: 0 to 80 dB in 1 0dB
steps
Hewlett–Packard
355COPT001,
355COPTC08, or 355C
Hewlett–Packard
355DOPT001,
355DOPTC08, or 355D
* If the TI is to be calibrated up to 18 GHz, the top frequency requirement of these items is
only 18 GHz.
** If the signal generator or signal source is to be used for the TI frequency span/div tests instead of
the comb generator, then the frequency uncertainty of the signal generator or signal source should
8
1 x 10
–
.
be +
*** Not applicable, if the signal generator is to be used for the TI frequency span/div tests.
7

NAVAIR 17–20AW–232
Item
2.8 Comb
generator***
2.9 Function
generator
2.10 T ee
2.11 10 dB
attenuator
(2 required)
2.12 Power splitter*
2.13 Calibrator*
Minimum Use
Specifications
Frequency comb: 1, 10, and 100 Mhz
increments
Uncertainty: +
Capable of being externally modulated
Frequency range: 2 kHz to 200 kHz
Uncertainty: +
BNC T ee, Coaxial
Attenuation: 10 dB
Frequency: 30 MHz to 1 GHz
SWR: 1.20 max.
Frequency range: 0 to 21 GHz
Input SWR: 1.20 max.
Output SWR: 1.10 max.
Output tracking between arms:
0.15 dB max.
Insertion loss: 6 dB nom.
Frequency range: 30 to 1000 MHz
Power range: +20 to –80 dBm
Uncertainty: +
0.01%
0.01%
0.35 dBm absolute
Calibration
Equipment
Hewlett–Packard 8406A
Hewlett–Packard
33120AOPT001 or 3314A
Amphenol UG274AU
Weinschel 2–10; or
Hewlett–Packard
8491BOPT010
0 to 18 GHz
Weinschel 1870A; or
Hewlett–Packard 11667A
18 to 21 GHz
Weinschel 1579; or
Hewlett–Packard 11667B
Hewlett–Packard
8902AOPTE04 (consists
of : HP 8902A;
8672AOPT001, 008;
11792AOPT001, H04;
and 11793AOPTH04)
2.14 Oscillator
2.15 3 dB attenuator*
2.16 Instrument
controller**
* If the TI is to be calibrated up to 18 GHz, the top frequency requirement of these items is
only 18 GHz.
** These items are required only if the TI is a 494P or 494AP series.
*** Not required if the signal generator or the signal source is to be used for the TI
frequency span/div tests.
Frequency range: 10 kHz to 10 MHz
Output: 0.141 V rms (–4 dBm)
Output meter frequency response: +
Attenuation: 3 dB
Frequency range: 0 to 21 GHz
SWR: 1.20 max.
Programmable using diskette NAVAIR
17–20MSYS–036D, version 2 or 3,
IEEE–488 GPIB test for use with
Fluke 1720A/AP or 1722A/AP
4%
Hewlett–Packard
33120AOPT001 or
Fluke 6011AOPT01, 03, 05
or 6011AOPT01, 02, 05
0 to 18 GHz
Weinschel 2–3; or
Hewlett–Packard
8491BOPT003
18 to 21 GHz
Hewlett–Packard
8493COPT003
Fluke 1722A/AP or
1720A/AP
8

NAVAIR 17–20AW–232
Item
2.17 Interface bus
cable*
2.18 Coaxial
termination
* These items are required only if the TI is a 494P or 494AP series.
3.1 Ensure that all power switches are set to off, and set all auxiliary equipment controls as necessary to avoid
damage to the equipment and so that dangerous voltages will not be present on output terminals when the power
switches are turned on.
Meets IEEE Std. 488–1978 and FCC
regulation 79–555–14686
50 ohms, 1 watt
SWR: <
Frequency range: DC to 18 GHz
Minimum Use
Specifications
Local supply
W einschel M1404N
1.02 + 0.0023f (GHz)
SECTION 3
PRELIMINAR Y OPERATIONS
Calibration
Equipment
3.2 Connect the auxiliary equipment, and the TI, to the appropriate power source.
3.3 Turn all auxiliary power switches to on and allow a sufficient warm–up time for the equipment.
NOTES
The 1st and 2nd LO OUTPUTS must be terminated into 50 at all times.
At times throughout this procedure, it may be necessary to activate the TI BASELINE CLIP
function in order to see the TI read–out on the bottom of the TI CRT.
3.4 Initial TI Turn–on.
3.4.1 Set the TI POWER switch to ON.
NOTE
When the TI POWER is switched on, the internal TI processor will run a memory and I/O test.
If a problem exists, a failure message will appear on the TI CRT screen. The program will be
ready to operate if there is no problem.
3.4.2 Verify that the TI passed the memory and I/O test (no failure messages).
3.4.3 Ensure that the TI CRT read–out is functioning. If necessary, activate the TI READOUT function and
adjust the INTENSITY control for the desired brightness.
9

NAVAIR 17–20AW–232
TI functions can be toggled active/inactive by pressing the function pushbutton. A TI function is
considered active when its pushbutton is illuminated and inactive when its pushbutton is not
illuminated, Throughout this procedure, when instructed to activate a TI function that is
currently active, first deactivate that function then activate it.
3.4.4 Ensure that the TI BASELINE CLIP function is deactivated.
3.4.5 Allow a 1 hour TI warm–up time before proceeding.
3.5 Internal Calibration
3.5.1 Activate the TI CAL function (SHIFT, FINE pushbuttons) to start the TI internal calibration routine.
During the TI processor generated calibration procedure, the technician should observe the TI
CR T for instructional messages and take action accordingly. The first message should instruct
the technician to connect the TI CAL OUT to the TI RF INPUT and to ensure that the TI
PEAK/AVERAGE knob is fully counterclockwise. Subsequent messages on the TI CRT will
direct the technician on how to adjust the vertical and horizontal POSITION, CAL AMPL, and
LOG controls. This sets the absolute Reference Level for the 1 MHz resolution bandwidth filter.
An automatic calibration is then run by the TI processor, which measures and corrects frequency
and amplitude errors of the other filters with respect to the 1 MHz filter and the reference
frequency .
NOTE
NOTE
3.5.2 Press the TI FINE pushbutton to continue with the calibration routine.
3.5.3 Verify that the TI passed the calibration routine.
NOTE
If the TI processor completes the routine, the TI control settings will return to normal operation
(no CALIBRATION FAILED message).
3.6 Set the TI controls as follows:
CENTER FREQUENCY control to 100 MHz
FREQUENCY SPAN/DIV control to 200 kHz
VER TICAL DISPLAY to 10 dB/div
MIN RF ATTEN switch to 0 dB
REF LEVEL to 0 dBm
AUTO RESOLN function to ON (activated)
VIDEO FILTER to NARROW
10

NAVAIR 17–20AW–232
TIME/DIV switch AUTO
DIGITAL STORAGE VIEW A function to ON (activated)
DIGITAL STORAGE VIEW B function to ON (activated)
TRIGGERING to FREE RUN
MIN NOISE function to OFF (deactivated)
3.7 H–P 8902A Calibrator Sensor Module Zeroing and Reference Calibration
3.7.1 Ensure that the calibrator system is interconnected as appropriate.
3.7.2 Press the calibrator INSTR PRESET (Blue key, Green AUTOMATIC OPERATION key), set the calibrator
to measure RF POWER.
3.7.3 Connect the calibrator sensor module input to the calibrator RF POWER output.
3.7.4 Press the calibrator ZERO key, and after the calibrator momentarily displays 0.000 W followed by a small
measurement value, press the CALIBRATE key.
3.7.5 Select the calibrator SAVE CAL function (Blue key, CALIBRATE key) and then press the CALIBRA TE
key. The calibrator sensor module is now zeroed and reference calibrated. Disconnect the calibrator sensor
module input from the calibrator RF POWER output.
SECTION 4
CALIBRATION PROCESS
NOTES
Unless otherwise specified, verify the results of each test and take corrective action whenever
the test requirement is not met, before proceeding.
Unless otherwise specified, make all measurements with the TI PEAK/AVERAGE knob fully
counterclockwise.
4.1 CALIBRATOR TESTS
4.1.1 Connect the TI CAL OUT through the low pass filter to the appropriate microwave counter input for a 100
MHz frequency.
4.1.2 Set the microwave counter for automatic frequency measurement with 1 Hz resolution, maximum sample
rate, and 50 input impedance. Verify that the microwave counter indication is between 99.999990 and
100.000010 MHz (100 MHz +
4.1.3 Disconnect the TI CAL OUT from the low pass filter, and disconnect the low pass filter from the
microwave counter.
10 Hz).
4.1.4 Connect the TI CAL OUT to the TI RF INPUT.
11

NAVAIR 17–20AW–232
4.1.5 Set the TI VERTICAL DISPLAY to 2 dB/div and set the TI REF LEVEL to –15 dBm.
4.1.6 Set the TI RESOLUTION BANDWIDTH to 1 MHz, and adjust the TI CENTER FREQUENCY control to
center the calibrator signal.
4.1.7 Depress the TI DIGITAL STORAGE SAVE A pushbutton.
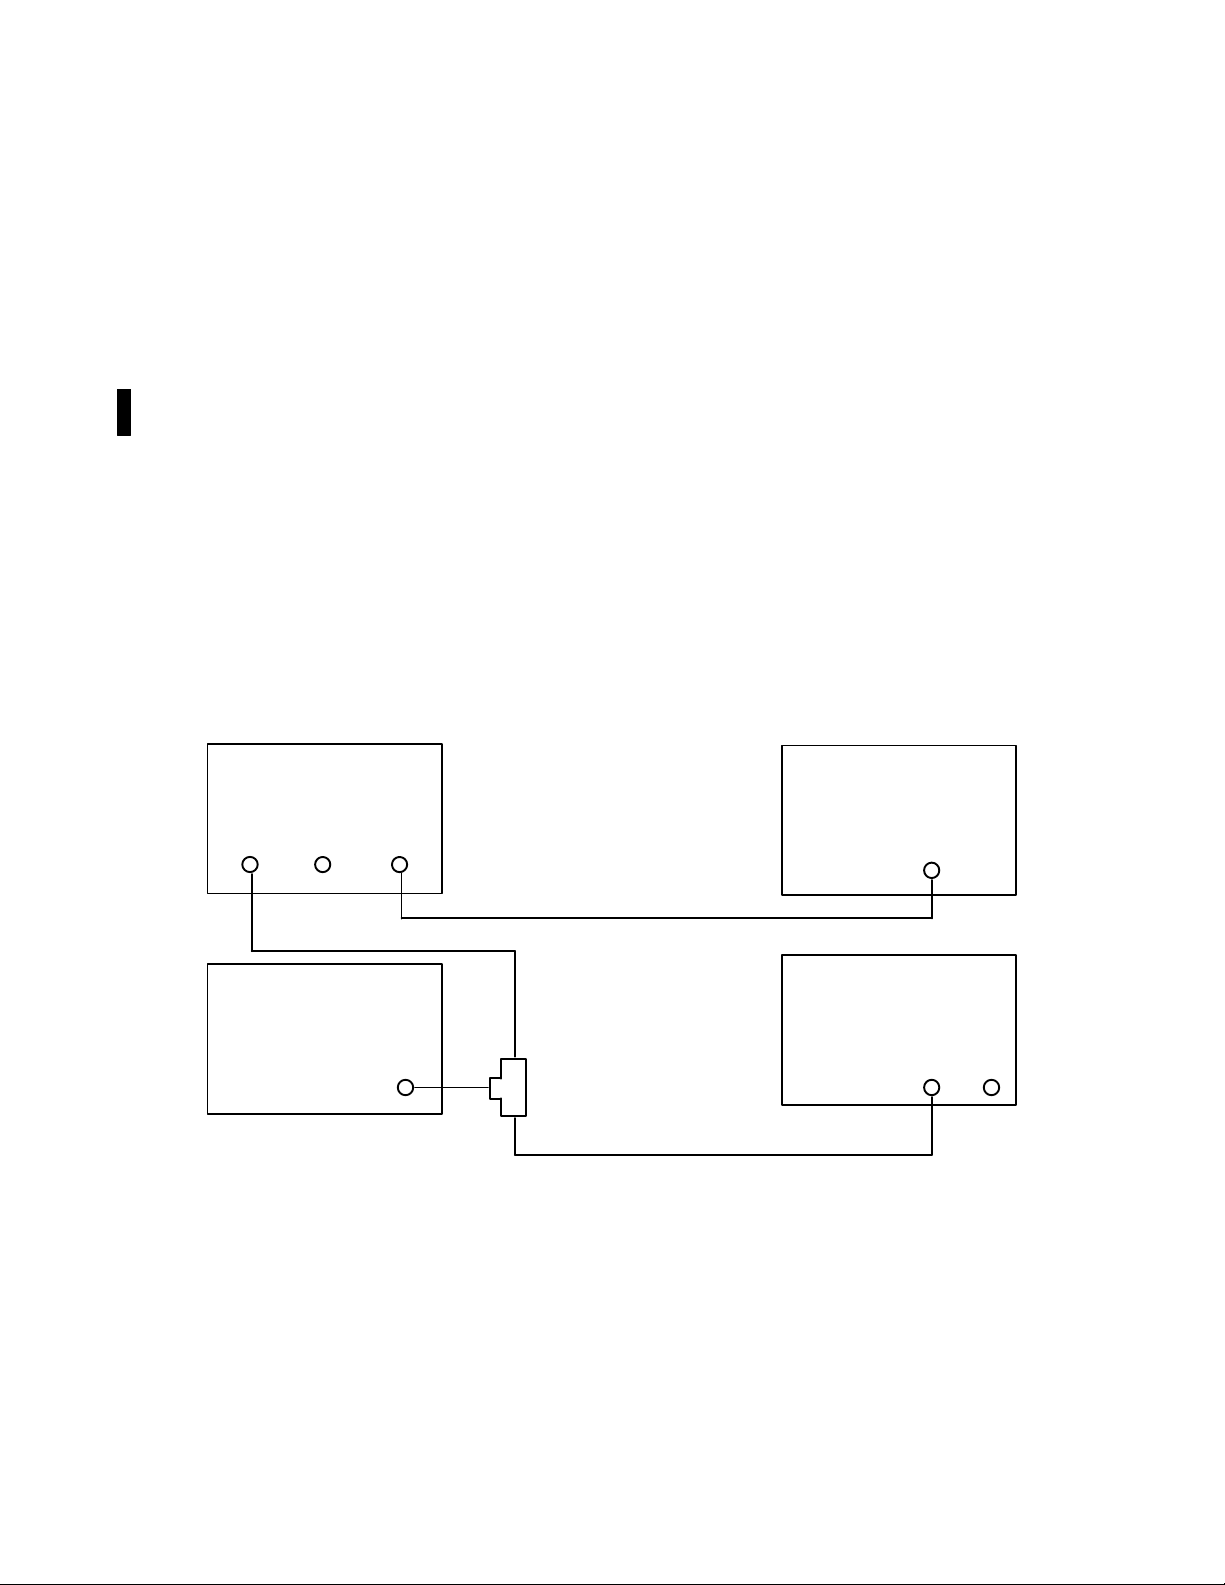
4.1.8 Disconnect the TI CAL OUT from the TI RF INPUT. Connect the equipment as shown in Figure 1.
2.3
SIGNAL
GENERATOR
RF
OUTPUT
2.2
LOW P ASS FILTER
IN OUT
TI
RF
INPUT
Figure 1. Calibrator T est Configuration
4.1.9 Adjust the signal generator controls for a 100 MHz output at –20 dBm.
4.1.10 Adjust the signal generator frequency controls to center the signal on the TI CRT.
4.1.11 Adjust the signal generator output level to align the amplitude of the signal generator signal with that of
the stored TI calibrator signal.
4.1.12 Disconnect the TI RF INPUT from the low pass filter.
4.1.13 Zero and reference calibrator, the power meter, the power sensor (capable of 0 to 18 GHz operation), and
then set the power meter CAL FACTOR switch to the power sensor calibration factor corresponding to 100 MHz
(or as close as possible).
4.1.14 Connect the power meter and power sensor to the low pass filter output.
4.1.15 Verify that the power meter indicates between –19.7 and –20.3 dBm.
4.1.16 Adjust the signal generator amplitude controls for minimum output and disconnect the test setup.
4.2 COUNTER READOUT TESTS
4.2.1 Set the TI controls as follows:
CENTER FREQUENCY control to 100 MHz
FREQUENCY SPAN/DIV control to 20 kHz
VER TICAL DISPLAY to 10 dB/div
MIN RF ATTEN switch to 0 dB
12

NAVAIR 17–20AW–232
REF LEVEL to 0 dBm
AUTO RESOLN function to ON (activated)
VIDEO FILTER to WIDE
DIGITAL STORAGE SAVE A function to OFF (deactivated)
DIGITAL STORAGE VIEW B function to OFF (deactivated)
MIN NOISE function to ON (activated)
4.2.2 Activate the TI COUNT RESOLN function (SHIFT, COUNTER pushbuttons) and enter 1 Hz via the TI
Data Entry keypad.
4.2.3 Connect the TI CAL OUT to the TI RF INPUT.
4.2.4 Center the 100 MHz marker under the dot marker using the TI CENTER FREQUENCY control.
4.2.5 Activate the TI COUNTER function. Note the indication over several counts, and verify that the TI
COUNTER indications are between 99,999,987 and 100,000,013 Hz (99,999,993 and 100,000,007 Hz, 494AP
Models). Deactivate the TI COUNTER function.
4.2.6 Set the TI FREQUENCY SPAN/DIV control to 500 kHz and repeat steps 4.2.4 and 4.2.5.
4.2.7 Activate the TI COUNT RESOLN function (SHIFT, COUNTER pushbuttons) and enter
1 kHz for a TI counter resolution of 1 kHz.
4.2.8 Activate the TI COUNTER function. Note the indication over several counts, and verify that the TI
COUNTER indications are between 99,999 and 100,001 kHz. Deactivate the TI COUNTER function.
4.2.9 Set the TI FREQUENCY SPAN/DIV control to 200 kHz and repeat steps 4.2.4 and 4.2.8.
4.2.10 Set the TI FREQUENCY SPAN/DIV control to 500 kHz. Activate the TI COUNT RESOLN function
(SHIFT, COUNTER pushbuttons) and enter 1 Hz via the TI Data Entry keypad.
4.2.11 Repeat steps 4.2.4 and 4.2.5 for the following TI CAL OUT marker frequencies and verify that the TI
COUNTER indications are within the tolerance limits listed (adjust the TI REF LEVEL as necessary).
TI CAL OUT
Marker Frequency
(MHz)
500 499,999,987 to 500,000,013 499,999,993 to 500,000,007
1000 999,999,987 to 1,000,000,013 999,999,993 to 1,000,000,007
4.2.12 Disconnect the TI CAL OUT from the TI RF INPUT and connect the equipment as shown in Figure 2.
494 Models
T olerance Limits
(Hz)
494AP Models
13

NAVAIR 17–20AW–232
2.6
SIGNAL SOURCE
RF
OUTPUT
2.1
MICROWAVE
COUNTER
RF
INPUT
* USE POWER SPLITTER CAPABLE
OF 0 TO 18 GHz OPERATION,
AS APPLICABLE.
2.12*
POWER
SPLITTER
TI
RF
INPUT
Figure 2. Counter Readout T est Configuration
4.2.13 Set the signal source controls for a 1.7 GHz CW output at –10 dBm, and set the microwave counter for
automatic frequency measurement with maximum resolution and maximum sample rate. Set the TI REF LEVEL
+10 dBm.
4.2.14 Set the signal source for the following microwave counter indications. At each setting, use the methods
from steps 4.2.4 and 4.2.5 and verify that the TI COUNTER indications are within the tolerance limits listed
(adjust the TI REF LEVEL as necessary).
Microwave
Counter Indication
(GHz)
494 Models 494A Models
T olerance Limit
(Hz)
1.7 1,699,999,817 to 1,700,000,183 1,699,999,823 to 1,700,000,177
3.0 2,999,999,687 to 3,000,000,313 2,999,999,693 to 3,000,000,307
5.0 4,999,999,487 to 5,000,000,513 4,999,999,493 to 5,000,000,507
8.0 7,999,999,183 to 8,000,000,817 7,999,999,191 to 8,000,000,809
12.0 11,999,998,783 to 12,000,001,217 11,999,998,791 to 2,000,001,209
15.0 14,999,998,483 to 15,000,001,517 14,999,998,491 to 15,000,001,509
18.0 17,999,998,183 to 18,000,001,817 17,999,998,191 to 18,000,001,809
21.0* 20,999,997,883 to 21,000,002,117 20,999,997,891 to 21,000,002,109
* Skip this test if TI is only to be calibrated to 18 GHz.
14

NAVAIR 17–20AW–232
4.3 CENTER FREQUENCY TESTS
4.3.1 Set the signal source output level to 0 dBm, and the frequency for a 500 MHz microwave counter
indication.
4.3.2 Set the TI controls as follows:
CENTER FREQUENCY control to 500 MHz
FREQUENCY SPAN/DIV control to 500 kHz
MIN RF ATTEN switch to 0 dB
REF LEVEL to +15 dBm
VIDEO FILTER to NARROW
RESOLUTION BW to 1 MHz
4.3.3 Press the TI COUNT –> CF pushbutton and wait until the TI COUNT –> CF light extinguishes. Change
the TI RESOLUTION BANDWIDTH to 10 kHz.
4.3.4 Verify that the signal is within +115.05 kHz (+0.23 divisions) from the TI CRT center vertical graticule
line.
4.3.5 Set the TI FREQUENCY RANGE and the signal source for the following settings. At each setting, use
the methods described in steps 4.3.3 and 4.3.4 and verify that the difference between the TI CRT center vertical
graticule line and the signal is within the tolerance limits listed.
TI
FREQUENCY RANGE
Setting
(GHz)
0 to 1.8 1.0 1.0 +
0 to 1.8 1.5 1.5 ”
1.7 to 5.5 3.5 3.5 ”
3.0 to 7.1 5.0 5.0 ”
5.4 to 18 10.0 10.0 +
5.4 to 18 15.0 15.0 ”
15 to 21 18.0 18.0 ”
15 to 21* 21.0 21.0 ”
* Skip this test if the TI is only to be calibrated to 18 GHz.
4.3.6 Set the TI RESOLUTION BANDWIDTH to 10 kHz and the FREQUENCY SPAN/DIV switch to 100
kHz.
CENTER
FREQUENCY
(GHz)
Signal Source
Frequency
(GHz)
T olerance Limits
(GHz)
0.23
0.29
4.3.7 Set the TI FREQUENCY RANGE, to the following settings. Adjust the signal source for a frequency
counter indication of the following value. At each setting press the TI COUNT –> CF pushbutton and wait until
the TI COUNT –> CF light extinguishes, and verify that the difference between the TI CRT center vertical
graticule and the signal is within the following tolerance limits.
15

NAVAIR 17–20AW–232
FREQUENCY RANGE
0 to 1.8 0.5 0.5 +0.20
0 to 1.8 1.0 1.0 +
0 to 1.8 1.5 1.5 +0.21
1.7 to 5.5 3.5 3.5 +
3.0 to 7.1 5.0 5.0 +
5.4 to 18 10.0 10.0 +
5.4 to 18 15.0 15.0 +0.35
15 to 21 18.0 18.0 +
15 to 21 * 21.0 21.0 +
* Skip this test if the TI is only to be calibrated to 18 GHz.
4.3.8 Set the signal source output amplitude control for minimum output and disconnect the test setup.
Setting
(GHz)
TI
CENTER
FREQUENCY
(GHz)
Signal Source
Frequency
(GHz)
T olerance Limits
(Div)
0.21
0.24
0.25
0.30
0.38
0.41
4.4 CRT DISPLAY TESTS
4.4.1 Set the TI controls as follow:
CENTER FREQUENCY control to 100 MHz
FREQUENCY SPAN/DIV control to 20 kHz
REF LEVEL to +10 dBm
MIN RF ATTEN to 0 dB
MIN NOISE to Activated
PEAK/AVERAGE control to Full clockwise position
RESOLUTION BW to 10 kHz
VIDEO FILTER to NARROW
4.4.2 Connect the equipment as shown in Figure 3.
2.3
SIGNAL
GENERATOR
RF
OUTPUT
TI
RF
INPUT
16
STEP ATTENUATOR
2.7
Figure 3. CRT Display Test Configuration

NAVAIR 17–20AW–232
4.4.3 Set the signal generator controls for a 100 MHz output at +10 dBm, and set both of the step attenuators to
0 dB.
4.4.4 Carefully adjust the signal generator output so that the signal peak is aligned with the top TI CRT
graticule line.
4.4.5 Increase the external attenuation with the step attenuators to 80 dB in 10 dB steps. Verify that the
displayed signal steps down in 10 dB steps (+
4.4.6 Verify the the maximum cumulative error over the TI CRT display from top to bottom does not exceed
2.0 dB.
+
4.4.7 Return the external attenuation to 0 dB. Set the TI VERTICAL DISPLAY to 2 dB/div, and deactivate the
TI MIN NOISE function.
4.4.8 Set the TI RESOLUTION BANDWIDTH to 100 kHz, and carefully adjust the signal generator output so
that the signal peak is aligned with the top TI CRT graticule line.
4.4.9 Increase the external attenuation with the step attenuators to 16 dB in 2 dB steps. Verify that the
displayed signal steps down in 2 dB steps (+
4.4.10 Verify that the maximum cumulative error over the TI CRT display from top to bottom does not exceed
1.0 dB.
+
1 dB/10 dB).
0.4 dB/2 dB).
4.4.11 Return the external attenuation to 0 dB, and set the TI VERTICAL DISPLAY to LIN.
4.4.12 Carefully adjust the signal generator output so that the signal peak is aligned with the top TI CRT
graticule line.
4.4.13 Increase the external attenuation with the step attenuators to 6 dB. Verify that the displayed signal steps
down to within +
4.4.14 Increase the external attenuation with the step attenuators to 12 dB. Verify that the displayed signal steps
down to within +
4.4.15 Increase the external attenuation with the step attenuators to 18 dB. Verify that the displayed signal steps
down to within +
4.4.16 Set the TI VERTICAL DISPLAY to 10 dB/div, and disconnect the equipment from the TI.
0.4 div of the center TI CRT horizontal graticule.
0.4 div of the TI CRT quarter screen (2 division above the TI CRT bottom).
0.4 div of the TI CRT eighth screen (1 division above the TI CRT bottom).
17
NAVAIR 17–20AW–232
4.5 FREQUENCY SPAN TESTS
If the comb generator is to be used, proceed with step 4.5.1. If the signal generator or signal
source is to be used, skip to step 4.5.2.
4.5.1 Frequency Span T ests Using a Comb Generator
4.5.1.1 Set the TI controls as follows:
CENTER FREQUENCY control to 1.0 GHz (2.0 GHz if the
FREQUENCY SPAN/DIV control to 200 MHz
REF LEVEL to –20 dBm
AUTO RESOLN function to ON (activated)
MIN NOISE function to ON (activated)
NOTE
TI is a 494A series)
PEAK/AVERAGE control to Fully ccw
4.5.1.2 Connect the equipment as shown in Figure 4.
2.8
COMB
GENERATOR
MODULATION OUTPUT
2.9
FUNCTION
GENERATOR
2.10
TEE
TI
RF
INPUT
2.1
MICROWAVE
COUNTER
INPUTOUTPUT
18
Figure 4. Frequency Span T est Configuration
4.5.1.3 Set the comb generator frequency controls to 100 MC, adjust the interpolation amplitude–1 MC control
to off and the output amplitude control for a TI signal display of approximately 3 div amplitude.
4.5.1.4 Adjust the TI CENTER FREQUENCY control to position the second comb signal (at 200 MHz) at the
second from the left TI vertical graticule line.

NAVAIR 17–20AW–232
NOTE
The first comb signal (at 100 MHz) should be positioned halfway between the TI CRT leftmost
vertical graticule and second from the left vertical graticule.
4.5.1.5 Verify that the TI indicates that the 18th comb signal is between 7.6 and 8.4 divisions from the second
comb signal.
4.5.1.5.1 If the TI is a 494A series, set the CENTER FREQUENCY to 1.0 GHz.
4.5.1.6 Set the TI FREQUENCY SPAN/DIV switch and the comb generator frequency controls to the following
settings. At each setting, adjust the TI CENTER FREQUENCY control to position the indicated comb signal at
the given TI vertical graticule line, and verify that the TI indicates that the difference between the listed comb
signals is within the tolerance limits listed.
NOTE
Adjust the comb generator output amplitude, the TI REF LEVEL, and the RESOLUTION
BANDWIDTH as necessary to maintain a clear comb display.
TI
FREQUENCY
SPAN/DIV
Switch Setting
Comb Generator
Frequency Setting
(MC)
Difference Between
Comb Signals
(numbers)
T olerance Limits
(divisions)
100 MHz 100 2 – 10 ** 7.6 to 8.4
50 ” 100 1 – 5* ”
20 ” 10 3 – 19 *** ”
10 ” 10 2 – 10 ** ”
5 ” 10 1 – 5* ”
2” 1 3–19 *** ”
1” 1 2–10 ** ”
500 kHz 1 1 – 5* ”
* Align the first comb signal with the second from the left TI CRT vertical graticule line.
** Align the second comb signal with the second from the left TI CRT vertical graticule line.
*** Align the third comb signal with the second from the left TI CRT vertical graticule line.
4.5.1.7 Set the comb generator frequency controls to 10 MC, and adjust the interpolation amplitude
– 1 MC control to mid position.
4.5.1.8 Adjust the function generator frequency controls for a 200.0 kHz electronic counter indication.
4.5.1.9 Set the TI FREQUENCY SPAN/DIV switch to 200 kHz, adjust the function generator amplitude, and
the comb generator interpolation amplitude–1 MC, controls to obtain the best possible TI comb signal display.
4.5.1.10 Adjust the TI CENTER FREQUENCY control to position the second comb signal at the second from
the left TI vertical graticule line. Verify that the TI indicates that the tenth comb signal is between 7.6 and 8.4
divisions from the second comb signal.
19

NAVAIR 17–20AW–232
4.5.1.11 Set the TI FREQUENCY SPAN/DIV switch to the following settings and adjust the function generator
frequency control for the electronic counter indications listed. At each setting, adjust the TI CENTER
FREQUENCY control to position the indicated comb signal at the given TI vertical graticule line, and verify that
the TI indicates that the difference between the listed comb signals is within the tolerance limits listed.
Adjust the comb generator interpolation amplitude and the function generator output amplitude
controls as necessary to maintain a good comb display.
FREQUENCY
SPAN/DIV
Switch Setting
100 MHz 200 1 – 5 ** 7.6 to 8.4
50 ” 50 2 – 10 * ”
20 ” 20 2 – 10 *** ”
10 ” 20 1 – 5** ”
5” 5.0 2–10 * ”
NOTE
TI
Comb Generator
Frequency Setting
(MC)
2” 2.0 2–10 *** ”
Difference Between
Comb Signals
(numbers)
T olerance Limits
(divisions)
* Align the first comb signal with the second from the left TI CRT vertical graticule line.
** Align the second comb signal with the second from the left TI CRT vertical graticule line.
4.5.1.12 Adjust the function generator and comb generator amplitude controls for minimum output and
disconnect the equipment from the TI.
4.5.1.13 Skip to subsection 4.6.
4.5.2. Frequency Span T ests Using a Signal Generator or Signal Source
4.5.2.1 Set the TI controls as follows:
CENTER FREQUENCY control to 1.0 GHz (2.0 GHz if the
TI is a 494A series)
FREQUENCY SPAN/DIV control to 200 MHz
REF LEVEL to –20 dBm
AUTO RESOLN function to ON (activated)
MIN NOISE function to ON (activated)
PEAK/AVERAGE control to Fully ccw
20
NOTE
Select the signal generator (item 2.3) or signal source (item 2.6) as applicable to the test
frequency .

NAVAIR 17–20AW–232
4.5.2.2 Connect the signal generator/source output to the TI RF INPUT.
4.5.2.3 Set the signal generator/source for a –25 dBm signal at 200 MHz (1.2 GHz if the TI is a 494A series).
4.5.2.4 Adjust the TI CENTER FREQUENCY control to position the signal generator/source signal at the
second from the left TI vertical graticule line.
NOTE
All TI CRT vertical graticule references count the far left graticule as the first (1st) graticule,
which would imply that the far right graticule is the eleventh (11th) graticule.
4.5.2.5 Set the signal generator/source frequency to 1.8 GHz (2.8 GHz if the TI is a 494A series).
4.5.2.6 Verify that the TI indicates that the signal generator/source signal (at the 10th vertical graticule line
from the left) is within +0.4 divisions of the 10th vertical graticule line.
4.5.2.6.1 If the TI is a 494A series, set the CENTER FREQUENCY to 1.0 GHz.
4.5.2.7 Set the TI FREQUENCY SPAN/DIV switch to the following settings. At each setting, first set the
signal generator/source for the “Left” frequency, adjust the TI CENTER FREQUENCY control to position the
indicated “Left” signal at the second TI vertical graticule line, then set the signal generator/source frequency to
the “Right” frequency settings and verify that the signal is within +0.4 divisions of the 10th vertical graticule.
NOTE
Adjust the TI REF LEVEL and RESOLUTION BANDWIDTH as necessary to maintain a clear
signal display.
TI
FREQUENCY
SPAN/DIV
Switch Setting
100 MHz 600.000 1400.000
50 ” 800.000 1200.000
20 ” 920.000 1080.000
10 ” 960.000 1040.000
5 ” 980.000 1020.000
2 ” 992.000 1008.000
1 ” 996.000 1004.000
500 kHz 998.000 1002.000
200 ” 999.200 1000.800
100 ” 999.600 1000.400
50 ” 999.800 1000.200
20 ” 999.920 1000.080
10 ” 999.960 1000.040
5 ” 999.980 1000.020
2 ” 999.992 1000.008
“Left”
Frequency Setting
(MHz)
Signal Generator/Source
“Right”
Frequency Setting
(MHz)
4.5.2.8 Adjust the signal generator/source amplitude controls for minimum output and disconnect the equipment
from the TI.
21

NAVAIR 17–20AW–232
4.6 RF ATTENUATOR TESTS
4.6.1 Connect the equipment as shown in Figure 5.
Use the shortest cable possible in the connection between the power splitter and the TI RF
INPUT connector. Do not use adapters.
NOTE
TI
RF
INPUT
* USE POWER SPLITTER CAPABLE
OF 0 TO 18 GHZ OPERATION, AS APPLICABLE.
4.6.2 Set the TI controls as follows:
CENTER FREQUENCY control to 1 GHz
2.3
SIGNAL
GENERATOR
RF
OUTPUT
IN
2.12*
POWER
SPLITTER
Figure 5. RF Attenuator T est Configuration
2.13
CALIBRATOR
2.11
10 DB ATTEN.
SENSOR
MODULE
P/O
2.13
FREQUENCY SPAN/DIV control to 500 kHz
RESOLUTION BANDWIDTH to 100 kHz
REF LEVEL to +21 dBm
MIN RF ATTEN switch to 0 dB (60 dB on TI CRT display)
VER TICAL DISPLAY to 10 dB/div
WIDE VIDEO FILTER to ON (activated)
MIN NOISE to OFF (deactivated)
4.6.3 Set the signal generator for a +12 dBm signal at 1 GHz.
4.6.4 Program the calibrator INSTR PRESET function (BLUE Shift and GREEN Automatic Operation buttons).
Enter on the calibrator: 27.3 SPCL 0 MHz, and ensure that the calibrator indication is approximately 1000 MHz.
Set the calibrator for TUNED RF LEVEL measurements with log (dBm) display, enter 39.9 SPCL, and press the
CALIBRATE button.
4.6.5 Decrease the signal generator output level until the calibrator displays RECAL. Press the calibrator
CALIBRATE button.
22

NAVAIR 17–20AW–232
4.6.6 Decrease the signal generator output level again until the calibrator displays RECAL. Again, press the
calibrator CALIBRATE button.
4.6.7 Adjust the signal generator output level for a –9 dBm calibrator indication.
4.6.8 Adjust the TI CENTER FREQUENCY control to center the displayed signal. Decrease the TI
FREQUENCY SPAN/DIV setting to 20 kHz, while keeping the signal centered on the display with the TI
CENTER FREQUENCY control.
4.6.9 Adjust the signal generator output level to align the signal displayed on the TI CRT with the nearest TI
CR T horizontal graticule line. Note this line as the reference.
4.6.10 Program the calibrator SET REF function (BLUE Shift and ZERO keys). Ensure that the calibrator
indicates 0.00 dB (+
4.6.11 Set the TI REF LEVEL control for a +11 dBm CRT readout. Decrease the signal generator output level
to align the signal to the same TI CRT graticule line noted in step 4.6.9.
4.6.12 Verify that the calibrator indication is between –9.7 and –10.3 dB (–9.5 and –10.5 dB if the TI is a 494A
series). Note the calibrator indication.
4.6.13 Set the TI REF LEVEL control for a +1 dBm CRT readout. Decrease the signal generator output level to
align the signal to the same TI CRT graticule line noted in step 4.6.9.
0.01 dB).
4.6.14 Verify that the calibrator indication is between –19.4 and –20.6 dB (–19.0 and –21.0 dB if the TI is a
494A series). Note the calibrator indication.
4.6.15 Repeat steps 4.6.13 and 4.6.14 for the following TI REF LEVEL control settings. At each setting, verify
that the calibrator indication is within the tolerance limits listed. Note the calibrator indication.
TI
REF LEVEL
Control Setting
(dBm)
–9 –29.3 to –30.7 –29.0 to –31.0
–19 –39.3 to –40.7 –39.0 to –41.0
–29 –49.3 to –50.7 –49.0 to –51.0
–39 –59.3 to –60.7 –59.0 to –61.0
4.6.16 Verify that the difference between any two adjacent calibrator indications noted in steps 4.6.12, 4.6.14,
and 4.6.15 is 9.7 to 10.3 dB (–9.5 and –10.5 dB if the TI is a 494A series).
4.6.17 Repeat step 4.6.2, except set the TI CENTER FREQUENCY to 10 GHz.
4.6.18 Set the signal generator output to minimum, and replace the signal generator in the test setup with the
signal source.
Model 494
Calibrator
T olerance Limits
(dB)
Model 494A
Calibrator
T olerance Limits
(dB)
4.6.19 Set the signal source for a +8 dBm signal at 10 GHz.
4.6.20 Program the calibrator INSTR PRESET function (BLUE Shift and GREEN Automatic Operation
buttons). Set the external LO of the calibrator to 10120.53 MHz. Enter on the calibrator: 27.3 SPCL 10120.53
MHz, and ensure that the calibrator indication is approximately 10000 MHz. Set the calibrator for TUNED RF
LEVEL measurements with log (dBm) display, enter 39.9 SPCL, and press the CALIBRATE button.
23

NAVAIR 17–20AW–232
4.6.21 Repeat steps 4.6.5 through 4.6.15, except use the signal source and verify that the calibrator indication is
within the following tolerance limits for the TI REF LEVEL control settings listed.
TI
REF LEVEL
Control Setting
(dBm)
+11 –9.5 to –10.5 –8.5 to –11.5
+1 –19.0 to –21.0 –17.0 to –23.0
–9 –28.6 to –31.4 –27.0 to –33.0
–19 –38.6 to –41.4 –37.0 to –43.0
–29 –48.6 to –51.4 –47.0 to –53.0
–39 –58.6 to –61.4 –57.0 to –63.0
4.6.22 Verify that the difference between any two adjacent calibrator indications noted in step 4.6.21 is 9.5 to
10.5 dB.
4.6.23 Repeat step 4.6.2, except set the TI CENTER FREQUENCY to 15 GHz.
4.6.24 Set the signal source for a +8 dBm signal at 15 GHz.
4.6.25 Program the calibrator INSTR PRESET function (BLUE Shift and GREEN Automatic Operation
buttons). Set the external LO of the calibrator to 15120.53 MHz. Enter on the calibrator: 27.3 SPCL 15120.53
MHz, and ensure that the calibrator indication is approximately 10000 MHz. Set the calibrator for TUNED RF
LEVEL measurements with log (dBm) display, enter 39.9 SPCL, and press the CALIBRATE button.
Model 494
Calibrator
T olerance Limits
(dB)
Model 494A
Calibrator
T olerance Limits
(dB)
4.6.26 Repeat steps 4.6.21 and 4.6.22.
4.6.27 Adjust the signal source output level for minimum output but do not disconnect the test setup. Replace
the signal source in the test setup with the signal generator.
4.7 IF GAIN TESTS
4.7.1 Set the TI controls as follows:
CENTER FREQUENCY control to 100 MHz
FREQUENCY SPAN/DIV control to 10 kHz
REF LEVEL to –10 dBm
VER TICAL DISPLAY to 1 dB/div
VIDEO FILTER to WIDE
RESOLUTION BANDWIDTH switch to 10 kHz
MIN NOISE to OFF (deactivated)
4.7.2 Set the signal generator for a +5 dBm signal at 100 MHz.
24

NAVAIR 17–20AW–232
4.7.3 Program the calibrator INSTR PRESET function (BLUE Shift and GREEN Automatic Operation buttons).
Enter on the calibrator: 27.3 SPCL 0 MHz, and ensure that the calibrator indication is approximately 100 MHz.
Set the calibrator for TUNED RF LEVEL measurements with log (dBm) displays, enter 39.9 SPCL, and press the
CALIBRATE button.
4.7.4 Decrease the signal generator output level until the calibrator displays RECAL. Press the calibrator
CALIBRATE button.
4.7.5 Decrease the signal generator output level again until the calibrator displays RECAL. Press the calibrator
CALIBRATE button.
4.7.6 Adjust the signal generator output level for a –12 dBm TI CRT display (signal is two graticules below top
TI CRT graticule). Note this graticule as the reference.
4.7.7 Activate the TI MIN NOISE function and verify that the signal amplitude change is <+
(<0.4 minor divisions) on the TI CRT.
4.7.8 Adjust the signal generator output level to reposition the signal level to the TI CRT reference line, if
necessary.
4.7.9 Program the calibrator SET REF function (BLUE Shift and ZERO buttons). Ensure that the calibrator
indicates 0.00 dB (+
4.7.10 Set the TI REF LEVEL control to following settings. At each setting, decrease the signal generator
output level to align the signal to the same TI CRT graticule line noted in step 4.7.6, and verify that the calibrator
indication is within the tolerance limits listed, Note the exact calibrator relative indication at each TI REF
LEVEL setting.
0.01 dB).
TI CRT REF LEVEL
Readout Indication
(dBm)
–11 –0.8 to –1.2
–12 –1.6 to –2.4
–13 –2.5 to –3.5
–14 –3.5 to –4.5
–15 –4.5 to –5.5
–16 –5.5 to –6.5
–17 –6.5 to –7.5
–18 –7.5 to –8.5
–19 –8.5 to –9.5
–20 –9.0 to –11.0
T olerance Limits
(dB)
0.8 dB
4.7.11 Verify that the difference between any two calibrator relative indications recorded in step 4.7.10 for
adjacent steps of the TI REF LEVEL from –11 to –19 dBm is between 0.8 and 1.2 dB.
4.7.12 Verify that difference between any two calibrator relative indications recorded in step 4.7.10 for the TI
REF LEVEL settings of –19 and –20 dBm is between 0.5 and 1.5 dB.
4.7.13 Adjust the signal generator output level to reposition the signal level to the TI CRT reference line, if
necessary.
4.7.14 Program the calibrator SET REF function (BLUE Shift and ZERO buttons). Ensure that the calibrator
indicates 0.00 dB (+
0.01 dB).
25

NAVAIR 17–20AW–232
4.7.15 Set the TI REF LEVEL control to following settings. At each setting, decrease the signal generator
output level to align the signal to the same TI CRT graticule line noted in step 4.7.13, and verify that the calibrator
indication is within the tolerance limits listed. Note the exact calibrator relative indication at each TI REF
LEVEL setting.
* Activate the TI NARROW VIDEO FIL TER function.
** Decrease the TI RESOLUTION BANDWIDTH to 1 kHz and the FREQUENCY SP AN/DIV
to 200 Hz, while keeping the displayed signal centered on the TI display using the TI
CENTER FREQUENCY control. Adjust the signal generator output level to reposition the
signal level to the TI CRT reference line, if necessary.
4.7.16 Verify that the difference between any two calibrator relative indications in step 4.7.15 for adjacent steps
of the TI REF LEVEL from –30 to –80 dBm is between 9.0 and 11.0 dB.
TI CRT REF LEVEL
Readout Indication
(dBm)
–30 –9.0 to –11.0
–40 –18.0 to –22.0
–50 –28.0 to –32.0
–60 –38.0 to –42.0
–70 * –48.0 to –52.0
–80 ** –58.0 to –62.0
T olerance Limits
(dB)
4.7.17 Adjust the signal generator output level controls for minimum and disconnect the test setup.
4.8 FREQUENCY RESPONSE TESTS
4.8.1 Set the TI controls as follows:
CENTER FREQUENCY control to 250 kHz
FREQUENCY SPAN/DIV control to 50 kHz
MIN RF ATTEN switch to 30 dB
REF LEVEL to 0 dBm
TIME/DIV switch to AUTO
VER TICAL DISPLAY to 1 dB/div
RESOLUTION BANDWIDTH to 10 kHz
MIN NOISE function to OFF (deactivated)
4.8.2 Ensure that the oscillator amplitude controls are set to minimum and connect the oscillator 50 output to
the TI RF INPUT.
4.8.3 Set the oscillator output frequency to 100 kHz. Adjust the oscillator output level controls to set the 100
kHz signal for a TI CRT 4.0 division signal display. Note the TI CR T horizontal graticule associated with the
signal level as the reference graticule, and the oscillator output level indication.
26
4.8.4 Activate the TI VIEW A, and MAX HOLD functions.
4.8.5 Adjust the oscillator frequency slowly from 10 kHz to 500 kHz, while maintaining the oscillator output
level noted in step 4.8.3.

NAVAIR 17–20AW–232
4.8.6 Note the TI frequency response (amplitude deviation above and below the reference graticule established
in step 4.8.3). Verify that the frequency response is within +
1.5 dB of the reference graticule from 50 kHz to 500
kHz, and +2.0 dB from 10 kHz to 500 kHz (+1.5 dB from 10 kHz to 500 kHz, for TI 494A Models). Deactivate
the TI MAX HOLD function.
4.8.7 Set the TI CENTER FREQUENCY control to 5 MHz, the FREQUENCY SPAN/DIV control to
1 MHz, and the AUTO RESOLN function to ON (activated).
4.8.8 Set the oscillator output frequency to 2 MHz. Adjust the oscillator output level controls to set the
2 MHz signal for a TI CRT 4.0 division signal display. Note the TI CR T horizontal graticule associated with the
signal level as the reference graticule, and the oscillator output level indication.
4.8.9 Activate the TI VIEW A, and MAX HOLD functions.
4.8.10 Adjust the oscillator frequency slowly from 500 kHz to 10 MHz, while maintaining the oscillator output
level noted in step 4.8.8.
4.8.11 Note the TI frequency response (amplitude deviation above and below the reference graticule established
in step 4.8.8). Verify that the frequency response is within +
1.5 dB of the reference graticule from 500 kHz to 10
MHz. Deactivate the TI MAX HOLD function.
4.8.12 Adjust the oscillator output level controls for minimum and disconnect the test setup.
4.8.13 Connect the equipment as shown in Figure 6.
Use cables of minimum length in the test setup.
2.6
SIGNAL
SOURCE
EXTERNAL
LEVELING
(EXT ALC)
RECORDER
OUT
RF
OUTPUT
2.4
POWER METER
NOTE
2.15*
3 DB ATTEN.
2.5*
POWER
SENSOR
IN
2.12*
POWER
SPLITTER
TI
RF
INPUT
* USE THE ITEMS CAPABLE
OF 0 TO 18 GHZ OPERATION,
UNLESS OTHERWISE INSTRUCTED.
Figure 6. Frequency Response T est Configuration
27

NAVAIR 17–20AW–232
4.8.14 Set the TI controls as follows:
CENTER FREQUENCY control to 1 GHz
FREQUENCY SPAN/DIV control to 200 MHz
4.8.15 Set the signal source controls for external (meter) leveling.
4.8.16 Adjust the signal source controls for a 1 GHz, 4 division TI CRT signal display. Note the TI CR T
horizontal graticule associated with the signal level as the reference graticule. Set the power meter RANGE
HOLD button to ON (depressed), if applicable.
4.8.17 Set the signal source controls for a 10 MHz to 1.8 GHz, 100 second sweep (or slowest time possible),
and activate the TI VIEW A, and MAX HOLD functions.
4.8.18 Note the TI frequency response (amplitude deviation above and below the reference graticule established
in step 4.8.16). Verify that the frequency response is within +
1.8 GHz. Deactivate the TI MAX HOLD function.
NOTE
T o view the signal, it may be necessary to increase the TI INTENSITY momentarily.
1.5 dB of the reference graticule from 10 MHz to
4.8.19 Set the TI VERTICAL DISPLAY to 2 dB/div.
4.8.20 Use the methods described in steps 4.8.16 through 4.8.18 for the following TI FREQUENCY RANGE,
CENTER FREQUENCY, and signal source sweep range. Verify that the TI frequency response is within the
tolerance limits listed.
NOTE
Prior to testing the frequency response on each TI FREQUENCY RANGE, set the signal source
for CW output at the TI CENTER FREQUENCY setting and set the signal source output level
for a 4 division TI CRT signal display (it may be necessary to increase the TI INTENSITY
momentarily, to view the signal) and then activate the TI AUTO PEAK function. Note the TI
CR T horizontal graticule associated with the signal level as the reference graticule. Set the
power meter RANGE HOLD button to OFF (released) and then back to ON (depressed), if
applicable.
TI
FREQUENCY
RANGE Setting
(GHz)
1.7 to 5.5 2.7 1.7 to 3.7 +2.5
” 4.5 3.5 to 5.5 +
3.0 to 7.1 4.0 3.0 to 5.0 +
” 6.0 5.0 to 7.0 +
5.4 to 18 7.9* 5.4 to 10.4 +
” 12.9 10.4 to 15.4 +
” 15.5 13.0 to 18.0 +
5 to 21 16.5 15.0 to 18.0 +
” ** 19.5 18.0 to 21.0 +
CENTER
FREQUENCY
(GHz)
Signal Source
Sweep Range
(GHz)
T olerance Limits
(dB)
2.5
2.5
2.5
3.5
3.5
3.5
5.0
5.0
28
* Set the TI FREQUENCY SPAN/DIV control to 500 MHz.
** Prior to this test, reconnect the equipment shown in Figure 6, except use the items capable of
18 to 21 GHz operation, only if the TI is to be calibrated to 21 GHz; otherwise skip this test.

4.8.21 Adjust the signal source amplitude controls for minimum output and disconnect the test setup.
4.9 EQUIVALENT INPUT NOISE SENSITIVITY TESTS
NOTE
If the TI is a Model 494, then proceed with step 4.9.1. If the the TI is a Model 494A, then skip
to step 4.9.2.
4.9.1 Equivalent Input Noise Sensitivity T est For TI 494 and 494P Models
4.9.1.1 Set the TI controls as follows:
CENTER FREQUENCY control to 1000 MHz
FREQUENCY SPAN/DIV control to 5 MHz
VER TICAL DISPLAY to 10 dB/div
MIN RF ATTEN switch to 0 dB
REF LEVEL to –60 dBm
NAVAIR 17–20AW–232
RESOLUTION BANDWIDTH to 1 MHz
VIDEO FILTER to WIDE
TIME/DIV switch to 1 s
MAX HOLD function to OFF (deactivated)
PEAK/AVERAGE control to full clockwise position
4.9.1.2 Verify that the TI CRT display average noise level is –80 dBm maximum.
4.9.1.3 Set the TI FREQUENCY SPAN/DIV control to 1 MHz, and the RESOLUTION BANDWIDTH control
to 100 kHz.
4.9.1.4 Verify that the TI CRT display average noise level is –90 dBm maximum.
4.9.1.5 Set the TI RESOLUTION BANDWIDTH to 10 kHz. Verify that the TI CRT display average noise level
is –100 dBm maximum.
4.9.1.6 Set the TI controls as follows:
FREQUENCY SPAN/DIV control to 10 kHz
TIME/DIV switch to AUTO
RESOLUTION BANDWIDTH to 1 kHz
VIDEO FILTER to NARROW
4.9.1.7 Verify that the TI CRT display average noise level is –110 dBm maximum.
4.9.1.8 Set the TI controls as follows:
REF LEVEL to –70 dBm
FREQUENCY SPAN/DIV control to 100 Hz
RESOLUTION BANDWIDTH to 100 Hz
29

NAVAIR 17–20AW–232
4.9.1.9 Verify that the TI CRT display average noise level is –118 dBm maximum.
4.9.1.10 Set the TI FREQUENCY SPAN/DIV control to 50 Hz, and the RESOLUTION BANDWIDTH control
to 30 Hz.
4.9.1.11 Verify that the TI CRT display average noise level is –121 dBm maximum.
4.9.1.12 Repeat steps 4.9.1.1 through 4.9.1.11 for the following TI FREQUENCY RANGE and CENTER
FREQUENCY settings. Verify that the TI CRT display average noise level is within the tolerance limits listed.
TI
FREQUENCY
RANGE Setting
(GHz)
1.7 to 5.5 3.6 1 MHz <
” ” 100 kHz <
” ” 10 ” <
””1 ”<
” ” 100 Hz <
” ” 30 ” <
3.0 to 7.1 5.0 1 MHz <
” ” 100 kHz <
” ” 10 ” <
””1 ”<
” ” 100 Hz <
” ” 30 ” <
5.4 to 18.0 8.7* 1 MHz <
” ” 100 kHz <
” ” 10 ” <
””1 ”<
” ” 100 Hz <
” ” 30 ” <
5.4 to 18.0 15.0* 1 MHz <
” ” 100 kHz <
” ” 10 ” <
””1 ”<
” ” 100 Hz <
” ” 30 ” <
15.0 to 21.0 18.0* 1 MHz <
” ” 100 kHz <
” ” 10 ” <
””1 ”<
” ” 100 Hz <
” ” 30 ” <
CENTER
FREQUENCY
(GHz)
RESOLUTION
BANDWIDTH
T olerance Limits
(dB)
–80
–90
–100
–110
–118
–121
–80
–90
–100
–110
–118
–121
–65
–75
–85
–95
–103
–106
–60
–70
–80
–90
–98
–101
–55
–65
–75
–85
–93
–96
30
* Set the TI REF LEVEL to –50 dBm before performing the noise level test in this frequency band.
4.9.1.13 Skip to subsection 4.10.

4.9.2 Equivalent Input Noise Sensitivity T est For TI 494A Models
4.9.2.1 Set the TI controls as follows:
CENTER FREQUENCY control to 100 MHz
FREQUENCY SPAN/DIV control to 5 MHz
VER TICAL DISPLAY to 10 dB/div
MIN RF ATTEN switch to 0 dB
REF LEVEL to –60 dBm
RESOLUTION BANDWIDTH to 3 MHz
VIDEO FILTER to WIDE
TIME/DIV switch to 1 s
MAX HOLD function to OFF (deactivated)
PEAK/AVERAGE control to full clockwise position
4.9.2.2 Verify that the TI CRT display average noise level is –80 dBm maximum.
NAVAIR 17–20AW–232
4.9.2.3 Set the TI FREQUENCY SPAN/DIV control to 1 MHz, the RESOLUTION BANDWIDTH control to 1
MHz, and verify that the TI CRT display average noise level is –85 dBm maximum.
4.9.2.4 Set the TI RESOLUTION BANDWIDTH to 100 kHz. Verify that the TI CRT display average noise
level is –95 dBm maximum.
4.9.2.5 Set the TI RESOLUTION BANDWIDTH to 10 kHz. Verify that the TI CRT display average noise level
is –105 dBm maximum.
4.9.2.6 Set the TI controls as follows:
FREQUENCY SPAN/DIV control to 10 kHz
TIME/DIV switch to AUTO
RESOLUTION BANDWIDTH to 1 kHz
VIDEO FILTER to NARROW
4.9.2.7 Verify that the TI CRT display average noise level is –115 dBm maximum.
4.9.2.8 Set the TI controls as follows:
REF LEVEL to –70 dBm
FREQUENCY SPAN/DIV control to 100 Hz
RESOLUTION BANDWIDTH to 100 Hz
4.9.2.9 Verify that the TI CRT display average noise level is –125 dBm maximum.
4.9.2.10 Set the TI FREQUENCY SPAN/DIV control to 10 Hz, the RESOLUTION BANDWIDTH control to
10 Hz, and verify that the TI CRT display average noise level is –134 dBm maximum.
31

NAVAIR 17–20AW–232
4.9.2.11 Repeat steps 4.9.2.1 through 4.9.2.10 for the following TI FREQUENCY RANGE and CENTER
FREQUENCY settings. Verify that the TI CRT display average noise level is within the tolerance limits listed.
TI
FREQUENCY
RANGE Setting
(GHz)
1.7 to 5.5 3.6 3 MHz <
””1 ”<
” ” 100 kHz <
” ” 10 ” <
””1 ”<
” ” 100 Hz <
” ” 10 ” <
3.0 to 7.1 5.0 3 MHz <
” ” 1 ” <
” ” 100 kHz <
” ” 10 ” <
””1 ”<
” ” 100 Hz <
” ” 10 ” <
5.4 to 18.0 8.7* 3 MHz <
””1 ”<
” ” 100 kHz <
” ” 10 ” <
””1 ”<
” ” 100 Hz <
” ” 10 ” <
5.4 to 18.0 15.0* 3 MHz <
” ” 1 ” <
” ” 100 kHz <
” ” 10 ” <
””1 ”<
” ” 100 Hz <
” ” 10 ” <
15.0 to 21.0 18.0* 3 MHz <
””1 ”<
” ” 100 kHz <
” ” 10 ” <
””1 ”<
” ” 100 Hz <
” ” 10 ” <
CENTER
FREQUENCY
(GHz)
RESOLUTION
BANDWIDTH
T olerance Limits
(dB)
–74
–79
–89
–99
–109
–119
–125
–74
–79
–89
–99
–109
–119
–125
–60
–65
–75
–85
–95
–105
–111
–55
–60
–70
–80
–90
–100
–107
–55
–60
–70
–80
–90
–100
–107
32
* Set the TI REF LEVEL to –50 dBm before performing the noise level test in this frequency band.

4.10 INTERMODULATION DISTOR TION TESTS
4.10.1 Set the TI controls as follows:
CENTER FREQUENCY control to 1 GHz
FREQUENCY SPAN/DIV control to 50 MHz
REF LEVEL to –30 dBm
RESOLUTION BANDWIDTH to 100 kHz
VIDEO FILTER to off (no filter activated)
PEAK/AVERAGE control to Fully ccw
4.10.2 Connect the equipment as shown in Figure 7.
NAVAIR 17–20AW–232
2.3
SIGNAL
GENERATOR
RF
OUTPUT
2.11
10 DB
ATTEN.
* USE POWER SPLITTER CAPABLE
OF 0 TO 18 GHZ OPERATION, AS APPLICABLE.
RF
INPUT
SPLITTER
TI
IN
2.12*
POWER
2.11
10 DB
ATTEN.
2.3
SIGNAL
GENERATOR
RF
OUTPUT
Figure 7. Intermodulation Distortion T est Configuration
4.10.3 Adjust the frequency controls of the two signal generators so one is set at 999.5 MHz and the other is set
to 1000.5 MHz. Set the output levels of both of the signal generators to –20 dBm.
4.10.4 Set the TI FREQUENCY SPAN/DIV switch to 500 kHz, and the RESOLUTION BANDWIDTH control
for a 10 kHz CRT read–out, while keeping both signals on the TI CRT using CENTER FREQUENCY control.
4.10.5 Adjust the output level controls of both signal generators to align the signal with the TI CRT top
graticule line.
4.10.6 Set the TI VIDEO FILTER to WIDE.
NOTE
Intermodulation products may not appear unless the input signal level is off the screen. Use the
TI VIDEO FILTER and very slow sweep speed rates to help resolve these sidebands.
33

NAVAIR 17–20AW–232
This test cannot be performed using signal generators with excessive FM.
By momentarily increasing each signal generator output by 10 dB (or 20 dB), a false
intermodulation product can be observed on the TI CRT display at either 2f
Figure 8). After noting where to look for intermodulation products, return the signal generator
output levels to the settings established in step 4.10.5.
4.10.7 Verify that the third order intermodulation products are more than 70 dB down from the input signals
(refer to Figure 8).
NOTES
or 2f2–f1 (see
1–f2
f
1
> 70 dB > 70 dB
–
2f
f
1
2
f
2
–
2f
2
REF.LEVEL
f
1
3RD ORDER
PRODUCTS
Figure 8. Third Order Intermodulation Display
4.10.8 Adjust the output levels of both signal generators for minimum output and disconnect the test setup.
4.11 HARMONIC DISTORTION TEST
4.11.1 Set the TI controls as follows:
34
CENTER FREQUENCY control to 100 MHz
FREQUENCY SPAN/DIV control to 5 MHz
REF LEVEL to –30 dBm (–40 dBm,
494A models)
RF ATTEN to 0 dB
RESOLUTION BANDWIDTH to 1 MHz
VER TICAL DISPLAY to 10 dB/div
MIN DISTORTION to ON (activated)
VIDEO FILTER to off (no filter activated)
MIN DISTORTION to ON (activated)

NAVAIR 17–20AW–232
4.11.2 Connect the signal generator output through the low pass filter to the TI RF INPUT.
4.11.3 Set the signal generator frequency controls to 100 MHz and adjust the output level to align the signal
with the TI top horizontal graticule line.
4.11.4 Decrease the TI FREQUENCY SPAN/DIV control to 10 kHz, and the RESOLUTION BANDWIDTH to
1 kHz, while keeping the signal centered on the TI CRT display using the TI CENTER FREQUENCY control.
4.11.5 Set the TI CENTER FREQUENCY control to 200 MHz.
4.11.6 Set the TI VIDEO FILTER to WIDE and verify that any harmonic distortion is more than 60 dB down
from the TI CRT top horizontal graticule line.
NOTE
If necessary , momentarily increase the signal generator output level by 10 dB (or 20 dB) to
identify on the TI CRT display where a harmonic distortion product might occur. Then return
the signal generator output level to its original setting.
4.11.7 Adjust the signal generator output level for minimum output and disconnect the test setup.
4.12 NOISE SIDEBANDS TEST
4.12.1 Set the TI controls as follows:
CENTER FREQUENCY control to 100 MHz
FREQUENCY SPAN/DIV control to 10 MHz
REF LEVEL to –20 dBm
AUTO RESOLN switch to ON (activated)
VIDEO FILTER to NARROW
MIN DISTORTION to OFF (deactivated)
4.12.2 Connect TI CAL OUT connector to the TI RF INPUT connector.
4.12.3 Decrease the TI FREQUENCY SPAN/DIV switch to 10 kHz and the RESOLUTION BANDWIDTH
control for a 1 kHz TI CRT read–out. Keep the 100 MHz signal centered on the TI CRT display using the TI
CENTER FREQUENCY control.
4.12.4 Set the TI REFERENCE LEVEL control for –40 dBm TI CRT read–out. This places the signal peak 20
dB above the TI CRT top graticule line.
4.12.5 Measure the noise level 30 kHz (+3 div to the left and –3 div to the right of the center frequency) away
from the 100 MHz signal. Verify that the noise sidebands are 75 dB (approximately 5 1/2 div below the TI CRT
top graticule line) or more below the peak signal level (or approximately 55 dB or more below the TI CRT top
graticule line). (See Figure 9).
35

NAVAIR 17–20AW–232
–20 dBm REF. LEVEL
NOISE
> 75 dB
DOWN
100
75
50
25
L
I
N
–30 KHZ +30 KHZ
( –3 DIV ) ( +3 DIV )
Figure 9. Sideband Noise Level Measurement Display
REF
–10
–20
–30
–40
–50
–60
–70
NOISE
>75 dB
DOWN
L
I
N
4.12.6 Disconnect the TI CAL OUT connector from the TI RF INPUT connector.
4.13 RESIDUAL RESPONSE TESTS
4.13.1 Set the TI controls as follows:
CENTER FREQUENCY control to 100 MHz
FREQUENCY SPAN/DIV control to 10 MHz
REF LEVEL to –50 dBm
RESOLUTION BANDWIDTH to 10 kHz
VIDEO FILTER to off (no filter activated)
PEAK/AVERAGE control to fully clockwise
4.13.2 Adjust the TI CENTER FREQUENCY control from a 100 MHz TI CRT read–out to a
1.8 GHz TI CRT read–out in 100 MHz increments. Verify that the residual responses do not exceed
–100 dBm.
NOTE
Use the TI FREQUENCY ENTRY function (SHIFT, IDENT pushbuttons) to change the
CENTER FREQUENCY in 100 MHz increments.
36

NOTE
The time to complete one sweep on the TI is approximately 20 seconds. Therefore, it will take
approximately 20 seconds to test each 100 MHz span of the TI. T o assist the observer in
knowing when the sweep has completed its 100 MHz sweep, it may be desirable to adjust the TI
PEAK AVERAGE control slightly ccw to place the PEAK AVERAGE line near the top of the TI
CR T display. The moving intensified dot indicates the position of the sweep. Another method
of keeping track of the sweep is to use the TI SINGLE SWEEP function. Press the TI SINGLE
SWEEP pushbutton once to activate the function and then press it again to start a sweep. The TI
SINGLE SWEEP READY LED will illuminate when the TI is sweeping and will extinguish
when the sweeping is finished.
4.14 RESIDUAL FM TESTS
4.14.1 Set the TI controls as follows:
CENTER FREQUENCY control to 100 MHz
FREQUENCY SPAN/DIV control to 1 MHz
VER TICAL DISPLAY to 2 dB/div
NAVAIR 17–20AW–232
REF LEVEL to –20 dBm
RESOLUTION BANDWIDTH to 100 kHz
VIDEO FILTER to WIDE
TIME/DIV switch to AUTO
TRIGGERING to FREE RUN
PEAK/AVERAGE control to fully clockwise
4.14.2 Connect the TI CAL OUT to the TI RF INPUT.
4.14.3 Press the TI SHIFT, then FREE RUN pushbuttons. (If the TI is a 494A series, press the TI SHIFT and
the 10 dB/div pushbuttons.)
NOTE
A message “FREQUENCY CORRECTION DISABLED” will appear in the TI CRT display,
which indicates that the 1st LO synthesis and phase lock are disabled; this is normal. It is now
possible to switch the FREQUENCY SPAN/DIV control to narrower spans with the phase lock
disabled.
4.14.4 Progressively adjust the TI FREQUENCY SPAN/DIV and RESOLUTION BANDWIDTH controls both
down to 10 kHz, while keeping the 100 MHz signal centered on the TI CRT with the CENTER FREQUENCY
control.
4.14.5 Set the TI VERTICAL DISPLAY LIN switch to on.
37
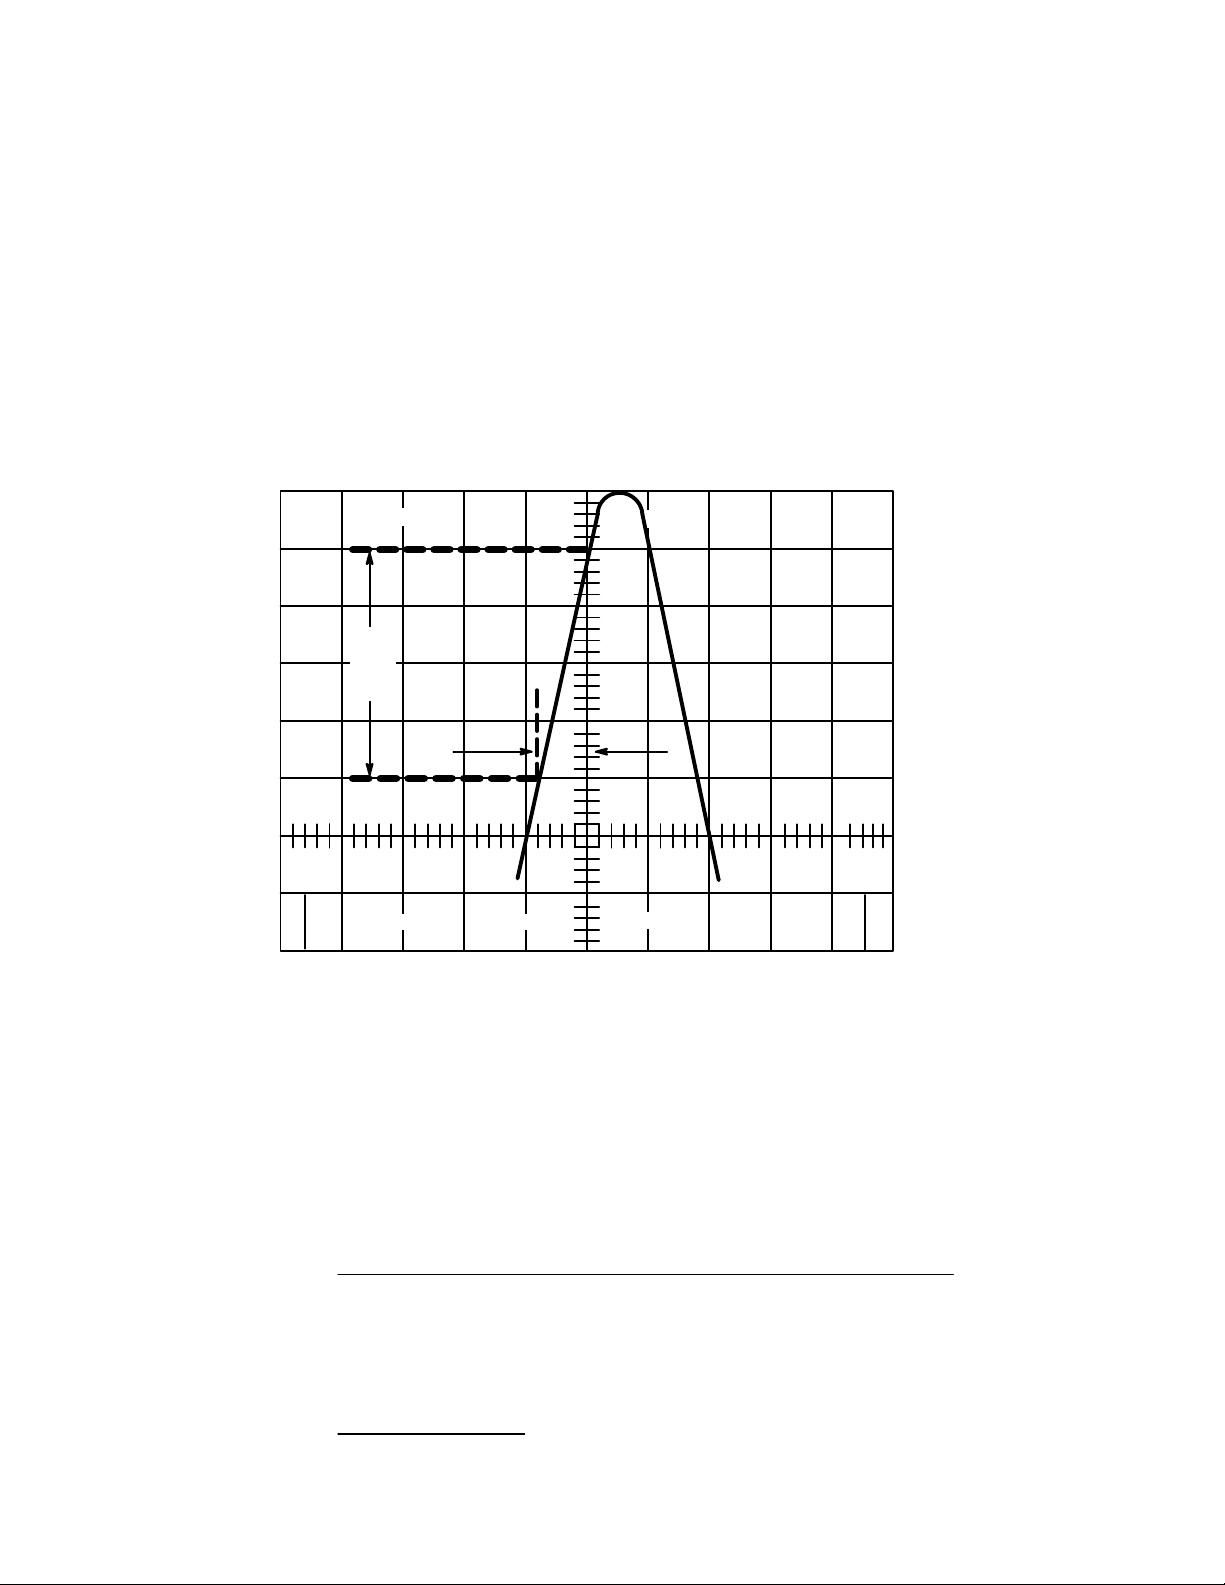
NAVAIR 17–20AW–232
It may be necessary at times throughout this test to activate the TI BASELINE CLIP function in
order to see the TI CRT RESOLUTION BANDWIDTH read–out.
4.14.6 Position the 100 MHz signal, using the TI CENTER FREQUENCY control, so that the left hand sloping
edge of the signal is positioned to cross the TI CRT center vertical graticule at the –20 REF horizontal graticule (2
divisions below the TI CRT top horizontal graticule line). (See Figure 10).
It may help to position the signal by using the TI SAVE A function to freeze and unfreeze the
signal display until it is at the desired point on TI CRT display.
NOTE
NOTE
100
75
50
25
L
I
N
%
–20 dBm
4
DIV.
2.00 mV/
0.8
DIV.
10 DB
100 MHZ
10 KHZ/
10 KHZ0–1.8
REF
–10
–20
–30
–40
–50
–60
–70
DB
L
O
G
Figure 10. Calculating Slope for Residual FM Measurement
4.14.7 Continue down the left hand slope of the 100 MHz signal and note where the slope crosses the TI CRT
–60 REF horizontal graticule line (2 division above the TI CRT bottom horizontal
graticule line). Measure and record the number of vertical divisions (horizontal deflection) from the TI CRT
center vertical graticule to the point where the signal slope crosses the TI CRT –60 REF horizontal graticule line.
(See Figure 10).
38
4.14.8 Calculate the slope of the signal using the following formula. Record this calculated slope.
SlopeĂ Ă
divĂ measuredĂ inĂ stepĂ 4.14.7Ă xĂ TIĂ FREQUENCYĂ SPANDIVĂ setting
4Ă divisions
Example:
Using values from Figure 10
SlopeĂ Ă
0.8Ă divĂ xĂ 10Ă kHzdiv
4Ă divisions
Ă Ă2ĂkHzdiv

NAVAIR 17–20AW–232
4.14.9 Depress the TI ZERO SPAN pushbutton, set the TIME/DIV switch to 20 ms, and deactivate the TI SAVE
A function, if applicable.
4.14.10 Adjust the TI CENTER FREQUENCY control to position the display near center screen, and activate
the TI SAVE A function.
4.14.11 Observe the complete sweep and choose the 20 ms portion (one division) of the sweep that has the
greatest amount of peak–to–peak vertical deflection present. Record the peak–to–peak amplitude (in divisions)
in this 20 ms of sweep. (See Figure 11).
100
75
50
25
L
I
N
%
–20 dBm
2.00 mV/
10 DB
100 MHZ
20 ms/
10 KHZ0–1.8
REF
–10
–20
–30
–40
–50
–60
–70
DB
L
O
G
Figure 11. Residual FM Measurement Display
4.14.12 Multiply the amount (in divisions) of the peak–to–peak signal amplitude recorded in step 4.14.11, by
the slope calculated in step 4.14.8. Verify that the product does not exceed 7 kHz.
Example:
Peak–to–peak signal noted was 1.1 divisions (example).
Slope calculated in step 4.14.8 was 2 kHz/div.
Therefore,
1.1Ă divĂ xĂ 2Ă kHzdivĂ Ă2.2ĂkHz
4.14.13 Press the TI SHIFT, then FREE RUN pushbuttons to re–enable the phase lock, and deactivate the TI
SAVE A and ZERO SPAN functions. Set the TI CENTER FREQUENCY to 100 MHz, if necessary.
4.14.14 Set the TI TIME/DIV switch to AUTO, and set the RESOLUTION BANDWIDTH control for a 100 Hz
TI CRT read–out.
4.14.15 Progressively set the TI FREQUENCY SPAN/DIV switch down to 100 Hz, while keeping the
100 MHz signal centered on the TI CRT with the CENTER FREQUENCY control.
39

NAVAIR 17–20AW–232
4.14.16 Position the 100 MHz signal, using the TI CENTER FREQUENCY control, so that the left hand
sloping edge of the signal is positioned to cross the TI CRT center vertical graticule at the –20 REF horizontal
graticule.
4.14.17 Continue down the left hand slope of the 100 MHz signal and note where the slope crosses the TI CRT
–60 REF horizontal graticule line. Measure and record the number of vertical divisions (horizontal deflection)
from the TI CRT center vertical graticule to the point where the signal slope crosses the TI CRT –60 REF
horizontal graticule line.
4.14.18 Calculate the slope of the signal using the following formula. Record this calculated slope.
SlopeĂ Ă
4.14.19 Depress the TI ZERO SPAN pushbutton and set the TIME/DIV switch to 20 ms.
4.14.20 Adjust the TI CENTER FREQUENCY control to position the display near center screen, and activate
the TI SAVE A function.
4.14.21 Observe the complete sweep and choose the 20 ms portion (one division) of the sweep that has the
greatest amount of peak–to–peak vertical deflection present. Record the peak–to–peak amplitude (in divisions)
in this 20 ms of sweep.
4.14.22 Multiply the amount (in divisions) of the peak–to–peak signal amplitude recorded in step 4.14.21, by
the slope calculated in step 4.14.18. Verify that the product does not exceed 12 Hz.
4.15 RESOLUTION BANDWIDTH TESTS
4.15.1 Set the TI controls as follows:
CENTER FREQUENCY control to 100 MHz
FREQUENCY SPAN/DIV control to 500 kHz
RESOLUTION BANDWIDTH to 1 MHz
divĂ measuredĂ inĂ stepĂ 4.14.17Ă xĂ 100Ă Hzdiv
4Ă divisions
REF LEVEL to –20 dBm
MIN RF ATTEN switch to 0 dB
VER TICAL DISPLAY to 2 dB/div
TIME/DIV switch to AUTO
NARROW VIDEO FILTER to ON (activated)
MIN NOISE function to ON (activated)
4.15.2 Measure and note the 6 dB down bandwidth (see Figure 12A). Verify that the measured 6 dB bandwidth
is between 0.8 and 1.2 MHz.
40
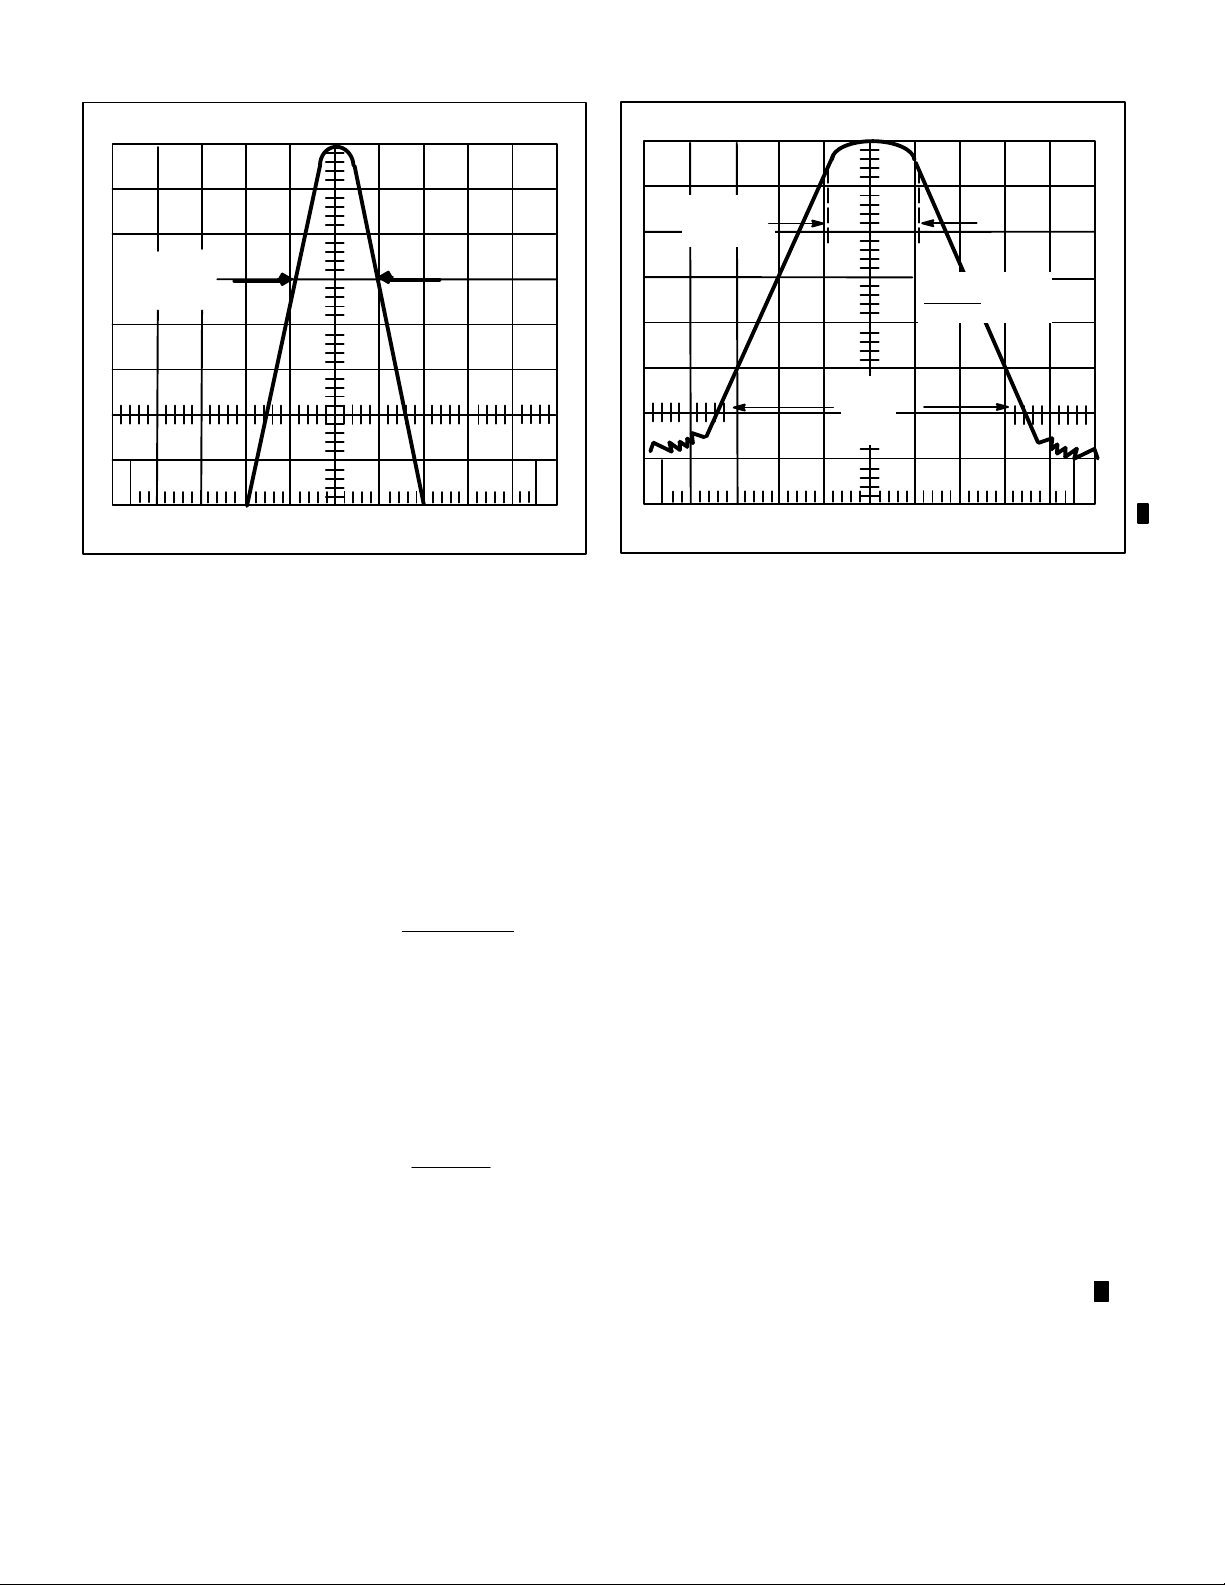
NAVAIR 17–20AW–232
REF LEVEL
–20 DBM
100
75
–6 dB down
1.0 MHz
Bandwidth
50
25
L
I
N
%
2 DB/
VERTICAL
DISPLAY
0 DB
T
RF
ATTENUATION
FREQUENCY
100.00 MHz
FREQ. SPAN/DIV
500 KHZ/
REF
100
REF LEVEL
–20 DBM
FREQUENCY
100.00 MHz
–10
–6 dB
1.0 MHz
–20
75
Bandwidth
–30
–40
50
–50
–60
–60
25
dB
3.4
MHz
0–1.8
FREQ
RANGE
B
0–1.8
FREQ
RANGE
A
INT
REFERENCE
OSCILLATOR
–70
L
O
G
DB
1 MHZ
RESOLUTION
BANDWIDTH
L
I
N
%
10 DB/
VERTICAL
DISPLAY
0 DB
T
RF
ATTENUATION
Figure 12. Resolution Bandwidth and Shape Factor Measurement Displays
FREQ. SPAN/DIV
500 KHZ/
Shape Factor
3.4 MHz
1.0 MHz
INT
REFERENCE
OSCILLATOR
= 3.4
1 MHZ
RESOLUTION
BANDWIDTH
REF
–10
–20
–30
–40
–50
–60
–70
DB
L
O
G
4.15.3 Set the TI VER TICAL DISPLAY to 10 dB/div.
4.15.4 Measure and note the 60 dB down bandwidth (see Figure 12B).
4.15.5 Calculate the shape factor (60 dB/6 dB) using the 6 and 60 dB down bandwidths noted in steps 4.15.2
and 4.15.4 as follows:
ShapeĂ factorĂ Ă
(60Ă dBĂ BW)
(6Ă dBĂ BW)
Example:
6 dB down BW = 1.0 MHz,
60 dB down bandwidth = 3.4 MHz
Then
ShapeĂ factorĂ Ă
3.4Ă MHz
1.0Ă MHz
Ă Ă3.4
4.15.6 Verify that the shape factor calculated in step 4.15.5 is 7.5:1 or less.
4.15.7 If the TI is a 494AP Model, proceed with step 4.15.7.1; otherwise, skip to step 4.15.8.
4.15.7.1 Set the TI RESOLUTION BANDWIDTH to 3 MHz, and the FREQUENCY SPAN/DIV control to 1
MHz.
4.15.7.2 Repeat steps 4.15.2 through 4.15.6, except verify that the measured 6 dB down bandwidth is between
2.4 and 3.6 MHz.
41

NAVAIR 17–20AW–232
4.15.8 Repeat steps 4.15.2 through 4.15.6 for TI RESOLUTION BANDWIDTH settings of 100 kHz down to
100 Hz in decade steps, verify that the measured 6 dB down bandwidth is within +20% of the TI RESOLUTION
BANDWIDTH setting.
Decrease the TI FREQUENCY SPAN/DIV setting to facilitate the 6 dB and 60 dB bandwidth
measurements in step 4.15.7.
4.15.9 Set the TI RESOLUTION BANDWIDTH to 30 Hz (10 Hz, for TI 494A Models), and set the FREQ
SPAN/DIV for a convenient display of the TI calibrator signal.
4.15.10 Repeat steps 4.15.2 through 4.15.6, except verify that the measured 6 dB down bandwidth is between
12 to 48 Hz (not applicable for TI 494A Models) and the calculated shape factor is 15:1 or less (12:1 or less for TI
494A Models).
For TI 494 Models, because of residual FM [(10 + 2N) Hz in 20 ms], the bandwidth of the 30 Hz
filter cannot be measured to a +
included with the specification.
NOTE
NOTE
20% tolerance in step 4.15.10; an additional 12 Hz error must be
4.15.11 Disconnect the TI CAL OUTPUT from the RF INPUT connector.
4.16 IEEE BUS TESTS (494P AND 494AP MODELS ONLY)
4.16.1 Connect the TI rear panel IEEE–488 connector to the instrument controller using the appropriate cable.
4.16.2 Insert the diskette into the instrument controller, press the controller restart button and sequence as per
the controller CRT instruction.
NOTES
The 1722A/AP and 1720A/AP Controller CRT is touch sensitive. Program accordingly.
There are some minor differences between the programming steps required for using version 2 or
version 3 of the IEEE Bus tester program (NAVAIR 17–20MSYS–036D). The following
procedure steps contain instructions written towards using version 2 or version 3. Use the
appropriate series of steps starting at 4.16.3 and 4.16.4 corresponding to the version available of
the IEEE Bus tester program.
4.16.3 IEEE Bus T ester Instructions, Version 2
4.16.3.1 On the controller, when the model number display appears, enter the TI Model Number.
42
4.16.3.2 On the controller, when the Instrument Type display appears, enter Talker and Listener.
4.16.3.3 Skip to step 4.16.5.

NAVAIR 17–20AW–232
4.16.4 IEEE Bus T ester Instructions, Version 3
4.16.4.1 On the controller, when the model number display appears, select the TI model number, if it is
provided, and then select the End Selections function.
4.16.4.2 Following the controller CRT instructions, sequence through the bus address search function, and enter
the TI Model Number.
4.16.5 On the controller, when the command display appears, enter FREQ 30.00 MHz (30.0 MHz).
4.16.6 On the controller, when Type of Command appears, enter Listen.
4.16.7 Verify that the TI is programmed for a center frequency of 30.0 MHz, and that the controller CRT
display of Command indicates the program command entered in step 4.16.5.
4.16.8 On the controller, go to the command display, and enter MINATT?.
4.16.9 On the controller, when Type of Command appears, enter Talk.
4.16.10 Verify that the value indicated by the next controller CRT display of Data Received corresponds to the
TI MIN RF ATTEN control setting (check TI front panel).
4.16.11 Press the controller abort switch, retrieve the diskette, and disconnect the equipment from the TI.
4.16.12 Unless other measurements are to be performed, turn all power switched to off or standby, and
disconnect the equipment from the TI.
4.16.13 If the TI was only calibrated to 18 GHz, affix a Special Calibration label on the TI stating “TI tested
only to 18 GHz”
( 44 blank) 43

CALIBRATION CHECKLIST
TEST INST (S)
T ektronix 494, 494P, 494POPT08, 494POPT30, and Interstate Electronics 7185400 Spectrum Analyzers
NAVAIR 17–20AW–232
OF
(6)
SER. NO.
CALIBRATION TOLERANCES
(7)
PROC. NO.
PROCEDURE
STEP
NO.
(1)
NA 17–20AW–232
FUNCTION TESTED
(2)
MFG. MODEL
MEASURED VALUES
NOMINAL
(3)
FIRST RUN
(4)
OUT
SECOND RUN
TOL
(5)
3.4 Initial TI Turn–on
3.4.2 Memory – I/O tests – – ck ( ) NA No failure messages
3.5 Internal Calibration
3.5.3 Internal Cal routine – – ck ( ) NA No failure messages
4.1 Calibrator Tests (MHz) (MHz)
4.1.2 CAL OUT – 100 MHz 100 99.999990 to 100.000010
(dBm) (dBm)
4.1.15 ” ––20 dBm –20 –19.7 to –20.3
4.2 Counter Readout Tests (MHz) (Hz)
4.2.5 Counter – 100 MHz 100 99,999,987 to 100,000,013
4.2.6 ” – 100 ” 100 ”
(MHz) (kHz)
4.2.8 ” – 100 ” 100 99,999 to 100,001
4.2.9 ” – 100 ” 100 ”
(GHz) (Hz)
4.2.11 ” – 500 ” 500 499,999,987 to 500,000,013
” ” – 1000 ” 1000 999,999,987 to 1,000,000,013
4.2.14 ” – 1.7 GHz 1.7 1,699,999,817 to 1,700,000,183
” ” – 3.0 ” 3.0 2,999,999,687 to 3,000,000,313
” ” – 5.0 ” 5.0 4,999,999,487 to 5,000,000,513
” ” – 8.0 ” 8.0 7,999,999,183 to 8,000,000,817
” ” – 12.0 ” 12.0 11,999,998,783 to12,000,001,217
” ” – 15.0 ” 15.0 14,999,998,483 to15,000,001,517
” ” – 18.0 ” 18.0 17,999,998,183 to18,000,001,817
”* ” – 21.0 ” 21.0 20,999,997,883 to 21,000,002,117
*If applicable.
Page 1 of 9
45

NAVAIR 17–20AW–232
CALIBRATION CHECKLIST
TEST INST (S)
T ektronix 494, 494P, 494POPT08, 494POPT30, and Interstate Electronics 7185400 Spectrum Analyzers
PROC. NO.
PROCEDURE
STEP
NO.
(1)
NA 17–20AW–232
FUNCTION TESTED
(2)
MFG. MODEL
MEASURED VALUES
NOMINAL
(3)
FIRST RUN
(4)
OUT
SECOND RUN
TOL
(5)
SER. NO.
CALIBRATION TOLERANCES
OF
(6)
4.3 Center Frequency Tests
4.3.4 C.F. – 500 MHz – – ck ( ) +
0.23 div from center
4.3.5 ” – 1.0 GHz – – ck ( ) ” ”
” ” – 1.5 ” – – ck ( ) ” ”
” ” – 3.5 ” – – ck ( ) ” ”
” ” – 5.0 ” – – ck ( ) ” ”
” ” – 10.0 ” – – ck ( ) +
0.29 ”
” ” – 15.0 ” – – ck ( ) ” ”
” ” – 18.0 ” – – ck ( ) ” ”
”* ” – 21.0 ” – – ck ( ) ” ”
4.3.7 C.F. – 0.5 ” – – ck ( ) +
” ” – 1.0 ” – – ck ( ) +
” ” – 1.5 ” – – ck ( ) +
0.20 ”
0.21 ”
0.21 ”
(7)
” ” – 3.5 ” – – ck ( ) +
” ” – 5.0 ” – – ck ( ) +
” ” – 10.0 ” – – ck ( ) +
” ” – 15.0 ” – – ck ( ) +
” ” – 18.0 ” – – ck ( ) +
”* ” – 21.0 ” – – ck ( ) +
0.24 ”
0.25 ”
0.30 ”
0.35 ”
0.38 ”
0.41 ”
4.4 CRT Display Tests
4.4.5 Attenuation: 10 dB – – ck ( ) Sig. decreases 9 to 11 dB
” ” 20 ” – – ck ( ) ”
” ” 30 ” – – ck ( ) ”
” ” 40 ” – – ck ( ) ”
” ” 50 ” – – ck ( ) ”
” ” 60 ” – – ck ( ) ”
” ” 70 ” – – ck ( ) ”
” ” 80 ” – – ck ( ) ”
4.4.6 80 dB cum. error – – ck ( ) Max. cum. error <
+2.0 dB
*If applicable.
46
Page 2 of 9

CALIBRATION CHECKLIST
TEST INST (S)
T ektronix 494, 494P, 494POPT08, 494POPT30, and Interstate Electronics 7185400 Spectrum Analyzers
NAVAIR 17–20AW–232
PROC. NO.
PROCEDURE
STEP
NO.
(1)
NA 17–20AW–232
FUNCTION TESTED
(2)
MFG. MODEL
MEASURED VALUES
NOMINAL
(3)
FIRST RUN
(4)
OUT
SECOND RUN
TOL
(5)
SER. NO.
CALIBRATION TOLERANCES
OF
(6)
(7)
4.4.9 Attenuation: 2 dB – – ck ( ) Sig. dec. 1.6 to 2.4 dB
” ” 4 ” – – ck ( ) ”
” ” 6 ” – – ck ( ) ”
” ” 8 ” – – ck ( ) ”
” ” 10 ” – – ck ( ) ”
” ” 12 ” – – ck ( ) ”
” ” 14 ” – – ck ( ) ”
” ” 16 ” – – ck ( ) ”
4.4.10 16 dB cum. error – – ck ( ) Max. cum. error <
4.4.13 Lin: 1/2Voltage – – ck ( ) w/in +
0.4 div 1/2 screen
4.4.14 ” 1/4 ” – – ck ( ) ” 1/4 ”
4.4.15 ” 1/8 ” – – ck ( ) ” 1/8 ”
+1.0 dB
4.5 Frequency Span Tests
4.5.1 Frequency Span T ests Using a Comb Generator
Span/Div Combs (div) (div)
4.5.1.5 200 MHz 2 – 18 8.0 difference 7.6 to 8.4
4.5.1.6 100 ” 2 – 10 ” ”
” 50 ” 1 – 5” ”
” 20 ” 3 – 19 ” ”
” 10 ” 2 – 10 ” ”
” 5 ” 1 – 5” ”
” 2 ” 3 – 19 ” ”
” 1 ” 2 – 10 ” ”
” 500 kHz 1 – 5” ”
4.5.1.10 200 ” 2 – 10 ” ”
4.5.1.11 100 ” 1 – 5” ”
” 50 ” 2 – 10 ” ”
” 20 ” 2 – 10 ” ”
” 10 ” 1 – 5” ”
” 5 ” 2 – 10 ” ”
” 2 ” 2 – 10 ” ”
Page 3 of 9
47

NAVAIR 17–20AW–232
CALIBRATION CHECKLIST
TEST INST (S)
T ektronix 494, 494P, 494POPT08, 494POPT30, and Interstate Electronics 7185400 Spectrum Analyzers
PROC. NO.
PROCEDURE
STEP
NO.
(1)
NA 17–20AW–232
FUNCTION TESTED
(2)
MFG. MODEL
MEASURED VALUES
NOMINAL
(3)
FIRST RUN
(4)
OUT
SECOND RUN
TOL
(5)
SER. NO.
CALIBRATION TOLERANCES
OF
(6)
4.5.2 Frequency Span T ests Using a Signal Generator or Signal Source
4.5.2.6 200 MHz Span/Div – – ck ( ) w/in +
0.4 div of 10th grat
4.5.2.7 100 ” ” – – ck ( ) ”
” 50 ” ” – – ck ( ) ”
” 20 ” ” – – ck ( ) ”
” 10 ” ” – – ck ( ) ”
” 5 ” ” – – ck ( ) ”
” 2 ” ” – – ck ( ) ”
” 1 ” ” – – ck ( ) ”
” 500 kHz ” – – ck ( ) ”
” 200 ” ” – – ck ( ) ”
” 100 ” ” – – ck ( ) ”
” 50 ” ” – – ck ( ) ”
(7)
” 20 ” ” – – ck ( ) ”
” 10 ” ” – – ck ( ) ”
” 5 ” ” – – ck ( ) ”
” 2 ” ” – – ck ( ) ”
4.6 RF Attenuator Tests (dB) (dB)
4.6.12 10 dB ATTEN – 1 GHz –10 –9.7 to –10.3
4.6.14 20 ” ” ” –20 –19.4 to –20.6
4.6.15 30 ” ” ” –30 –29.3 to –30.7
” 40 ” ” ” –40 –39.3 to –40.7
” 50 ” ” ” –50 –49.3 to –50.7
” 60 ” ” ” –60 –59.3 to –60.7
4.6.16 Diff. 10 dB steps ” 10 9.7 to 10.3
4.6.21 10 dB ATTEN – 10 GHz –10 –9.5 to –10.5
” 20 ” ” ” –20 –19.0 to –21.0
” 30 ” ” ” –30 –28.6 to –31.4
” 40 ” ” ” –40 –38.6 to –41.4
” 50 ” ” ” –50 –48.6 to –51.4
” 60 ” ” ” –60 –58.6 to –61.4
Page 4 of 9
48

CALIBRATION CHECKLIST
TEST INST (S)
T ektronix 494, 494P, 494POPT08, 494POPT30, and Interstate Electronics 7185400 Spectrum Analyzers
NAVAIR 17–20AW–232
PROC. NO.
PROCEDURE
STEP
NO.
(1)
NA 17–20AW–232
FUNCTION TESTED
(2)
MFG. MODEL
MEASURED VALUES
NOMINAL
(3)
FIRST RUN
(4)
OUT
SECOND RUN
TOL
(5)
SER. NO.
CALIBRATION TOLERANCES
OF
(6)
(7)
(dB) (dB)
4.6.22 Diff. 10 dB steps 10 9.5 to 10.5
4.6.26 10 dB ATTEN – 15 GHz –10 –9.5 to –10.5
” 20 ” ” ” –20 –19.0 to –21.0
” 30 ” ” ” –30 –28.6 to –31.4
” 40 ” ” ” –40 –38.6 to –41.4
” 50 ” ” ” –50 –48.6 to –51.4
” 60 ” ” ” –60 –58.6 to –61.4
” Diff. 10 dB steps ” 10 9.5 to 10.5
4.7 IF Gain Tests
4.7.7 Min noise – ON – – ck ( ) <+
0.8 (<+0.4 div)
4.7.10 REF LEVEL: –11 dBm – – ck ( ) –0.8 to –1.2 dB
” ” ” –12 ” – – ck ( ) –1.6 to –2.4 ”
” ” ” –13 ” – – ck ( ) –2.5 to –3.5 ”
” ” ” –14 ” – – ck ( ) –3.5 to –4.5 ”
” ” ” –15 ” – – ck ( ) –4.5 to –5.5 ”
” ” ” –16 ” – – ck ( ) –5.5 to –6.5 ”
” ” ” –17 ” – – ck ( ) –6.5 to –7.5 ”
” ” ” –18 ” – – ck ( ) –7.5 to –8.5 ”
” ” ” –19 ” – – ck ( ) –8.5 to –9.5 ”
” ” ” –20 ” – – ck ( ) –9.0 to 11.0 ”
4.7.11 Diff bet. 1 dB steps – – ck ( ) 0.8 to 1.2 ”
4.7.12 Diff –19 to –20 dBm step – – ck ( ) 0.5 to 1.5 ”
4.7.15 REF LEVEL: –30 dBm – – ck ( ) –9.0 to –11.0 ”
” ” ” –40 ” – – ck ( ) –18.0 to –22.0 ”
” ” ” –50 ” – – ck ( ) –28.0 to –32.0 ”
” ” ” –60 ” – – ck ( ) –38.0 to –42.0 ”
” ” ” –70 ” – – ck ( ) –48.0 to –52.0 ”
” ” ” –80 ” – – ck ( ) –58.0 to –62.0 ”
4.7.16 REF LEVEL: –30 ” – – ck ( ) 9.0 to 11.0 ”
Page 5 of 9
49

NAVAIR 17–20AW–232
CALIBRATION CHECKLIST
TEST INST (S)
T ektronix 494, 494P, 494POPT08, 494POPT30, and Interstate Electronics 7185400 Spectrum Analyzers
OF
(6)
SER. NO.
CALIBRATION TOLERANCES
(7)
PROC. NO.
PROCEDURE
STEP
NO.
(1)
NA 17–20AW–232
FUNCTION TESTED
(2)
MFG. MODEL
MEASURED VALUES
NOMINAL
(3)
FIRST RUN
(4)
OUT
SECOND RUN
TOL
(5)
4.8 Frequency Response Tests
4.8.6 50 kHz to 500 kHz – – ck ( ) response within +
” 10 ” to 500 ” – – ck ( ) ” +
4.8.11 500 kHz to 10 MHz – – ck ( ) ” +
4.8.18 10 MHz to 1.8 GHz – – ck ( ) ” ” ”
4.8.20 1.7 ” to 3.7 ” – – ck ( ) ” +
” 3.5 ” to 5.5 ” – – ck ( ) ” ” ”
” 3.0 ” to 5.0 ” – – ck ( ) ” ” ”
” 5.0 ” to 7.0 ” – – ck ( ) ” ” ”
” 5.4 ” to 10.4 ” – – ck ( ) ” +
” 10.4 ” to 15.4 ” – – ck ( ) ” ” ”
” 13.0 ” to 18.0 ” – – ck ( ) ” ” ”
” 15.0 ” to 18.0 ” – – ck ( ) ” +
1.5 dB
2.0 ”
1.5 ”
2.5 ”
3.5 ”
5.0 ”
”* 18.0 ” to 21.0 ” – – ck ( ) ” ” ”
4.9 Equivalent Input Noise Sensitivity Tests
4.9.1 Equivalent Input Noise Sensitivity T est For TI 494 and 494P Models
(GHz) (BW) (dBm max)
4.9.1.2 0 to 1.8 – 1 MHz – – ck ( ) noise level –80
4.9.1.4 ” – 100 kHz – – ck ( ) ” ” –90
4.9.1.5 ” – 10 ” – – ck ( ) ” ” –100
4.9.1.7 ” – 1 ” – – ck ( ) ” ” –110
4.9.1.9 ” – 100 Hz – – ck ( ) ” ” –118
4.9.1.11 ” – 30 ” – – ck ( ) ” ” –121
4.9.1.12 1.7 to 5.5 – 1 MHz – – ck ( ) ” ” –80
” ” – 100 kHz – – ck ( ) ” ” –90
” ” – 10 ” – – ck ( ) ” ” –100
” ” – 1 ” – – ck ( ) ” ” –110
” ” – 100 Hz – – ck ( ) ” ” –118
” ” – 30 ” – – ck ( ) ” ” –121
*If applicable.
50
Page 6 of 9

CALIBRATION CHECKLIST
TEST INST (S)
T ektronix 494, 494P, 494POPT08, 494POPT30, and Interstate Electronics 7185400 Spectrum Analyzers
NAVAIR 17–20AW–232
PROC. NO.
PROCEDURE
STEP
NO.
(1)
NA 17–20AW–232
FUNCTION TESTED
(2)
MFG. MODEL
MEASURED VALUES
NOMINAL
(3)
FIRST RUN
(4)
OUT
SECOND RUN
TOL
(5)
SER. NO.
CALIBRATION TOLERANCES
OF
(6)
(7)
(GHz) (BW) (dBm max)
4.9.1.12 3.0 to 7.1 – 1 MHz – – ck ( ) noise level –80
” ” – 100 kHz – – ck ( ) ” ” –90
” ” – 10 ” – – ck ( ) ” ” –100
” ” – 1 ” – – ck ( ) ” ” –110
” ” – 100 Hz – – ck ( ) ” ” –118
” ” – 30 ” – – ck ( ) ” ” –121
” 5.4 to 18.0 – 1 MHz – – ck ( ) ” ” –65
” ” – 100 kHz – – ck ( ) ” ” –75
” ” – 10 ” – – ck ( ) ” ” –85
” ” – 1 ” – – ck ( ) ” ” –95
” ” – 100 Hz – – ck ( ) ” ” –103
” ” – 30 ” – – ck ( ) ” ” –106
” 5.4 to 18.0 – 1 MHz – – ck ( ) ” ” –60
” ” – 100 kHz – – ck ( ) ” ” –70
” ” – 10 ” – – ck ( ) ” ” –80
” ” – 1 ” – – ck ( ) ” ” –90
” ” – 100 Hz – – ck ( ) ” ” –98
” ” – 30 ” – – ck ( ) ” ” –101
” 15.0 to 21.0 – 1 MHz – – ck ( ) ” ” –55
” ” – 100 kHz – – ck ( ) ” ” –65
” ” – 10 ” – – ck ( ) ” ” –75
” ” – 1 ” – – ck ( ) ” ” –85
” ” – 100 Hz – – ck ( ) ” ” –93
” ” – 30 ” – – ck ( ) ” ” –96
4.10 Intermodulation Distortion T ests
4.10.7 3rd order products – – ck ( ) 3rd order prod >70 dB down
4.11 Harmonic Distortion T est
4.11.6 Harmonics – – ck ( ) Harmonics >60 dB down
Page 7 of 9
51

NAVAIR 17–20AW–232
CALIBRATION CHECKLIST
TEST INST (S)
T ektronix 494, 494P, 494POPT08, 494POPT30, and Interstate Electronics 7185400 Spectrum Analyzers
PROC. NO.
PROCEDURE
STEP
NO.
(1)
NA 17–20AW–232
FUNCTION TESTED
(2)
MFG. MODEL
MEASURED VALUES
NOMINAL
(3)
FIRST RUN
(4)
OUT
SECOND RUN
TOL
(5)
SER. NO.
CALIBRATION TOLERANCES
OF
(6)
(7)
4.12 Noise Sidebands T est
4.12.5 +
30 kHz sidebands – – ck ( ) noise sidebands
>75 dB down
4.13 Residual Response T ests (dBm)
4.13.2 100 MHz – – ck ( ) residual responses <–100
” 200 ” – – ck ( ) ”
” 300 ” – – ck ( ) ”
” 400 ” – – ck ( ) ”
” 500 ” – – ck ( ) ”
” 600 ” – – ck ( ) ”
” 700 ” – – ck ( ) ”
” 800 ” – – ck ( ) ”
” 900 ” – – ck ( ) ”
” 1000 ” – – ck ( ) ”
” 1100 ” – – ck ( ) ”
” 1200 ” – – ck ( ) ”
” 1300 ” – – ck ( ) ”
” 1400 ” – – ck ( ) ”
” 1500 ” – – ck ( ) ”
” 1600 ” – – ck ( ) ”
” 1700 ” – – ck ( ) ”
” 1800 ” – – ck ( ) ”
4.14 Residual FM T ests
4.14.7 Horizontal deflections – – NA record horizontal deflection
4.14.8 Slope = (value from 4.14.7)
times (10 kHz/div)/4 div – – ck ( ) NA calculate slope of signal
4.14.11 Max vertical deflection – – NA record max vert deflection
4.14.12 Residual FM – (value from
4.14.11) times (slope) – – ck ( ) residual FM <
4.14.17 Horizontal deflections – – NA record horizontal deflection
Page 8 of 9
52
7 kHz

CALIBRATION CHECKLIST
TEST INST (S)
T ektronix 494, 494P, 494POPT08, 494POPT30, and Interstate Electronics 7185400 Spectrum Analyzers
NAVAIR 17–20AW–232
PROC. NO.
PROCEDURE
STEP
NO.
(1)
NA 17–20AW–232
FUNCTION TESTED
(2)
MFG. MODEL
MEASURED VALUES
NOMINAL
(3)
FIRST RUN
(4)
OUT
SECOND RUN
TOL
(5)
SER. NO.
CALIBRATION TOLERANCES
OF
(6)
(7)
4.14.18 Slope = (value from 4.14.17)
times (100 Hz/div)/4 div –– ck ( ) NA calculate slope of signal
4.14.21 Max vertical deflection –– NA record max vert deflection
4.14.22 Residual FM–(value from
4.14.21) times (slope) –– ck ( ) residual FM <
12 Hz
4.15 Resolution Bandwidth Tests
4.15.2 1 MHz – Res. BW 1 MHz 0.8 to 1.2 MHz
4.15.6 ” ” – Shape Factor –– ck ( ) 7.5:1 or less
4.15.8 100 kHz – Res. BW 100 kHz 80 to 120 kHz
” ” ” – Shape Factor –– ck ( ) 7.5:1 or less
” 10 ” – Res. BW 10 kHz 8 to 12 kHz
” ” ” – Shape Factor –– ck ( ) 7.5:1 or less
” 1 ” – Res. BW 1 kHz 0.8 to 1.2 kHz
” ” ” – Shape Factor –– ck ( ) 7.5:1 or less
” 100 Hz – Res. BW 100 Hz 80 to 120 Hz
” ” ” – Shape Factor –– ck ( ) 7.5:1 or less
4.15.10 30 ” – Res. BW 30 Hz 12 to 48 Hz
” ” ” – Shape Factor –– ck ( ) 15:1 or less
4.16 IEEE Bus Tests (494P and 494AP Models Only)
4.16.7 C.F. set to 30 MHz –– ck ( ) Correct response
4.16.10 TI sends MIN RF ATTEN –– ck ( ) ” ”
Page 9 of 9
( 54 blank) 53

CALIBRATION CHECKLIST
TEST INST (S)
T ektronix 494AP Spectrum Analyzer
NAVAIR 17–20AW–232
OF
(6)
SER. NO.
CALIBRATION TOLERANCES
(7)
PROC. NO.
PROCEDURE
STEP
NO.
(1)
NA 17–20AW–232
FUNCTION TESTED
(2)
MFG. MODEL
MEASURED VALUES
NOMINAL
(3)
FIRST RUN
(4)
OUT
SECOND RUN
TOL
(5)
3.4 Initial TI Turn–on
3.4.2 Memory – I/O tests – – ck ( ) NA No failure messages
3.5 Internal Calibration
3.5.3 Internal Cal routine – – ck ( ) NA No failure messages
4.1 Calibrator Tests (MHz) (MHz)
4.1.2 CAL OUT – 100 MHz 100 99.999990 to 100.000010
(dBm) (dBm)
4.1.15 ” ––20 dBm –20 –19.7 to –20.3
4.2 Counter Readout Tests (MHz) (Hz)
4.2.5 Counter – 100 MHz 100 99,999,993 to 100,000,007
4.2.6 ” – 100 ” 100 ”
(MHz) (kHz)
4.2.8 ” – 100 ” 100 99,999 to 100,001
4.2.9 ” – 100 ” 100 ”
(MHz) (Hz)
4.2.11 ” – 500 ” 500 499,999,993 to 500,000,007
” ” – 1000 ” 1000 999,999,993 to 1,000,000,007
(GHz) (Hz)
4.2.14 ” – 1.7 GHz 1.7 1,699,999,823 to 1,700,000,177
” ” – 3.0 ” 3.0 2,999,999,693 to 3,000,000,307
” ” – 5.0 ” 5.0 4,999,999,493 to 5,000,000,507
” ” – 8.0 ” 8.0 7,999,999,191 to 8,000,000,809
” ” – 12.0 ” 12.0 11,999,998,791 to 12,000,001,209
” ” – 15.0 ” 15.0 14,999,998,491 to 15,000,001,509
” ” – 18.0 ” 18.0 17,999,998,191 to 18,000,001,809
”* ” – 21.0 ” 21.0 20,999,997,891 to 21,000,002,109
*If applicable.
Page 1 of 10
55

NAVAIR 17–20AW–232
CALIBRATION CHECKLIST
TEST INST (S)
T ektronix 494AP Spectrum Analyzer
PROC. NO.
PROCEDURE
STEP
NO.
(1)
NA 17–20AW–232
FUNCTION TESTED
(2)
MFG. MODEL
MEASURED VALUES
NOMINAL
(3)
FIRST RUN
(4)
OUT
SECOND RUN
TOL
(5)
SER. NO.
CALIBRATION TOLERANCES
OF
(6)
4.3 Center Frequency Tests
4.3.4 C.F. – 500 MHz – – ck ( ) +
0.23 div from center
4.3.5 ” – 1.0 GHz – – ck ( ) ” ”
” ” – 1.5 ” – – ck ( ) ” ”
” ” – 3.5 ” – – ck ( ) ” ”
” ” – 5.0 ” – – ck ( ) ” ”
” ” – 10.0 ” – – ck ( ) +
0.29 ”
” ” – 15.0 ” – – ck ( ) ” ”
” ” – 18.0 ” – – ck ( ) ” ”
”* ” – 21.0 ” – – ck ( ) ” ”
4.3.7 C.F. – 0.5 ” – – ck ( ) +
” ” – 1.0 ” – – ck ( ) +
” ” – 1.5 ” – – ck ( ) +
0.20 ”
0.21 ”
0.21 ”
(7)
” ” – 3.5 ” – – ck ( ) +
” ” – 5.0 ” – – ck ( ) +
” ” – 10.0 ” – – ck ( ) +
” ” – 15.0 ” – – ck ( ) +
” ” – 18.0 ” – – ck ( ) +
”* ” – 21.0 ” – – ck ( ) +
0.24 ”
0.25 ”
0.30 ”
0.35 ”
0.38 ”
0.41 ”
4.4 CRT Display Tests
4.4.5 Attenuation: 10 dB – – ck ( ) Sig. decreases 9 to 11 dB
” ” 20 ” – – ck ( ) ”
” ” 30 ” – – ck ( ) ”
” ” 40 ” – – ck ( ) ”
” ” 50 ” – – ck ( ) ”
” ” 60 ” – – ck ( ) ”
” ” 70 ” – – ck ( ) ”
” ” 80 ” – – ck ( ) ”
4.4.6 80 dB cum. error – – ck ( ) Max. cum. error <
+2.0 dB
*If applicable.
56
Page 2 of 10

CALIBRATION CHECKLIST
TEST INST (S)
T ektronix 494AP Spectrum Analyzer
NAVAIR 17–20AW–232
PROC. NO.
PROCEDURE
STEP
NO.
(1)
NA 17–20AW–232
FUNCTION TESTED
(2)
MFG. MODEL
MEASURED VALUES
NOMINAL
(3)
FIRST RUN
(4)
OUT
SECOND RUN
TOL
(5)
SER. NO.
CALIBRATION TOLERANCES
OF
(6)
(7)
4.4.9 Attenuation: 2 dB – – ck ( ) Sig. dec. 1.6 to 2.4 dB
” ” 4 ” – – ck ( ) ”
” ” 6 ” – – ck ( ) ”
” ” 8 ” – – ck ( ) ”
” ” 10 ” – – ck ( ) ”
” ” 12 ” – – ck ( ) ”
” ” 14 ” – – ck ( ) ”
” ” 16 ” – – ck ( ) ”
4.4.10 16 dB cum. error – – ck ( ) Max. cum. error <
4.4.13 Lin: 1/2Voltage – – ck ( ) w/in +
0.4 div 1/2 screen
4.4.14 ” 1/4 ” – – ck ( ) ” 1/4 ”
4.4.15 ” 1/8 ” – – ck ( ) ” 1/8 ”
+1.0 dB
4.5 Frequency Span Tests
4.5.1 Frequency Span T ests Using a Comb Generator
Span/Div Combs (div) (div)
4.5.1.5 200 MHz 2 – 18 8.0 difference 7.6 to 8.4
4.5.1.6 100 ” 2 – 10 ” ”
” 50 ” 1 – 5” ”
” 20 ” 3 – 19 ” ”
” 10 ” 2 – 10 ” ”
” 5 ” 1 – 5” ”
” 2 ” 3 – 19 ” ”
” 1 ” 2 – 10 ” ”
” 500 kHz 1 – 5” ”
4.5.1.10 200 ” 2 – 10 ” ”
4.5.1.11 100 ” 1 – 5” ”
” 50 ” 2 – 10 ” ”
” 20 ” 2 – 10 ” ”
” 10 ” 1 – 5” ”
” 5 ” 2 – 10 ” ”
” 2 ” 2 – 10 ” ”
Page 3 of 10
57

NAVAIR 17–20AW–232
CALIBRATION CHECKLIST
TEST INST (S)
T ektronix 494AP Spectrum Analyzer
PROC. NO.
PROCEDURE
STEP
NO.
(1)
NA 17–20AW–232
FUNCTION TESTED
(2)
MFG. MODEL
MEASURED VALUES
NOMINAL
(3)
FIRST RUN
(4)
OUT
SECOND RUN
TOL
(5)
SER. NO.
CALIBRATION TOLERANCES
OF
(6)
4.5.2 Frequency Span T ests Using a Signal Generator or Signal Source
4.5.2.6 200 MHz Span/Div – – ck ( ) w/in +
0.4 div of 10th grat
4.5.2.7 100 ” ” – – ck ( ) ”
” 50 ” ” – – ck ( ) ”
” 20 ” ” – – ck ( ) ”
” 10 ” ” – – ck ( ) ”
” 5 ” ” – – ck ( ) ”
” 2 ” ” – – ck ( ) ”
” 1 ” ” – – ck ( ) ”
” 500 kHz ” – – ck ( ) ”
” 200 ” ” – – ck ( ) ”
” 100 ” ” – – ck ( ) ”
” 50 ” ” – – ck ( ) ”
(7)
” 20 ” ” – – ck ( ) ”
” 10 ” ” – – ck ( ) ”
” 5 ” ” – – ck ( ) ”
” 2 ” ” – – ck ( ) ”
4.6 RF Attenuator Tests (dB) (dB)
4.6.12 10 dB ATTEN – 1 GHz –10 –9.5 to –10.5
4.6.14 20 ” ” ” –20 –19.0 to –21.0
4.6.15 30 ” ” ” –30 –29.0 to –31.0
” 40 ” ” ” –40 –39.0 to –41.0
” 50 ” ” ” –50 –49.0 to –51.0
” 60 ” ” ” –60 –59.0 to –61.0
4.6.16 Diff. 10 dB steps ” 10 9.5 to 10.5
4.6.21 10 dB ATTEN – 10 GHz –10 –8.5 to –11.5
” 20 ” ” ” –20 –17.0 to –23.0
” 30 ” ” ” –30 –27.0 to –33.0
” 40 ” ” ” –40 –37.0 to –43.0
” 50 ” ” ” –50 –47.0 to –53.0
” 60 ” ” ” –60 –57.0 to –63.0
Page 4 of 10
58

CALIBRATION CHECKLIST
TEST INST (S)
T ektronix 494AP Spectrum Analyzer
NAVAIR 17–20AW–232
PROC. NO.
PROCEDURE
STEP
NO.
(1)
NA 17–20AW–232
FUNCTION TESTED
(2)
MFG. MODEL
MEASURED VALUES
NOMINAL
(3)
FIRST RUN
(4)
OUT
SECOND RUN
TOL
(5)
SER. NO.
CALIBRATION TOLERANCES
OF
(6)
(7)
(dB) (dB)
4.6.22 Diff. 10 dB steps 10 8.5 to 11.5
4.6.26 10 dB ATTEN – 15 GHz –10 –8.5 to –11.5
” 20 ” ” ” –20 –17.0 to –23.0
” 30 ” ” ” –30 –27.0 to –33.0
” 40 ” ” ” –40 –37.0 to –43.0
” 50 ” ” ” –50 –47.0 to –53.0
” 60 ” ” ” –60 –57.0 to –63.0
” Diff. 10 dB steps ” 10 9.5 to 10.5
4.7 IF Gain Tests
4.7.7 Min noise – ON – – ck ( ) Signal change <+
0.8 dB
4.7.10 REF LEVEL: –11 dBm – – ck ( ) –0.8 to –1.2 dB
” ” ” –12 ” – – ck ( ) –1.6 to –2.4 ”
” ” ” –13 ” – – ck ( ) –2.5 to –3.5 ”
” ” ” –14 ” – – ck ( ) –3.5 to –4.5 ”
” ” ” –15 ” – – ck ( ) –4.5 to –5.5 ”
” ” ” –16 ” – – ck ( ) –5.5 to –6.5 ”
” ” ” –17 ” – – ck ( ) –6.5 to –7.5 ”
” ” ” –18 ” – – ck ( ) –7.5 to –8.5 ”
” ” ” –19 ” – – ck ( ) –8.5 to –9.5 ”
” ” ” –20 ” – – ck ( ) –9.0 to 11.0 ”
4.7.11 Diff bet. 1 dB steps – – ck ( ) 0.8 to 1.2 ”
4.7.12 Diff –19 to –20 dBm step – – ck ( ) 0.5 to 1.5 ”
4.7.15 REF LEVEL: –30 dBm – – ck ( ) –9.0 to –11.0 ”
” ” ” –40 ” – – ck ( ) –18.0 to –22.0 ”
” ” ” –50 ” – – ck ( ) –28.0 to –32.0 ”
” ” ” –60 ” – – ck ( ) –38.0 to –42.0 ”
” ” ” –70 ” – – ck ( ) –48.0 to –52.0 ”
” ” ” –80 ” – – ck ( ) –58.0 to –62.0 ”
4.7.16 REF LEVEL: –30 ” – – ck ( ) 9.0 to 11.0 ”
Page 5 of 10
59

NAVAIR 17–20AW–232
CALIBRATION CHECKLIST
TEST INST (S)
T ektronix 494AP Spectrum Analyzer
OF
(6)
SER. NO.
CALIBRATION TOLERANCES
(7)
PROC. NO.
PROCEDURE
STEP
NO.
(1)
NA 17–20AW–232
FUNCTION TESTED
(2)
MFG. MODEL
MEASURED VALUES
NOMINAL
(3)
FIRST RUN
(4)
OUT
SECOND RUN
TOL
(5)
4.8 Frequency Response Tests
4.8.6 50 kHz to 500 kHz – – ck ( ) response within +
” 10 ” to 500 ” – – ck ( ) ” ” ”
4.8.11 500 kHz to 10 MHz – – ck ( ) ” +
4.8.18 10 MHz to 1.8 GHz – – ck ( ) ” ” ”
4.8.20 1.7 ” to 3.7 ” – – ck ( ) ” +
” 3.5 ” to 5.5 ” – – ck ( ) ” ” ”
” 3.0 ” to 5.0 ” – – ck ( ) ” ” ”
” 5.0 ” to 7.0 ” – – ck ( ) ” ” ”
” 5.4 ” to 10.4 ” – – ck ( ) ” +
” 10.4 ” to 15.4 ” – – ck ( ) ” ” ”
” 13.0 ” to 18.0 ” – – ck ( ) ” ” ”
” 15.0 ” to 18.0 ” – – ck ( ) ” +
1.5 dB
1.5 ”
2.5 ”
3.5 ”
5.0 ”
”* 18.0 ” to 21.0 ” – – ck ( ) ” ” ”
4.9 Equivalent Input Noise Sensitivity Tests
4.9.1 Equivalent Input Noise Sensitivity T est For TI 494A Models
(GHz) (BW) (dBm max)
4.9.2.2 0 to 1.8 – 3 MHz – – ck ( ) noise level –80
4.9.2.3 ” – 1 ” – – ck ( ) ” ” –85
4.9.2.4 ” – 100 kHz – – ck ( ) ” ” –95
4.9.2.5 ” – 10 ” – – ck ( ) ” ” –105
4.9.2.7 ” – 1 ” – – ck ( ) ” ” –115
4.9.2.9 ” – 100 Hz – – ck ( ) ” ” –125
4.9.2.11 ” – 10 ” – – ck ( ) ” ” –134
” 1.7 to 5.5 – 3 MHz – – ck ( ) ” ” –74
” ” – 1 ” – – ck ( ) ” ” –79
” ” – 100 kHz – – ck ( ) ” ” –89
” ” – 10 ” – – ck ( ) ” ” –99
” ” – 1 ” – – ck ( ) ” ” –109
” ” – 100 Hz – – ck ( ) ” ” –119
” ” – 10 ” – – ck ( ) ” ” –125
*If applicable.
60
Page 6 of 10
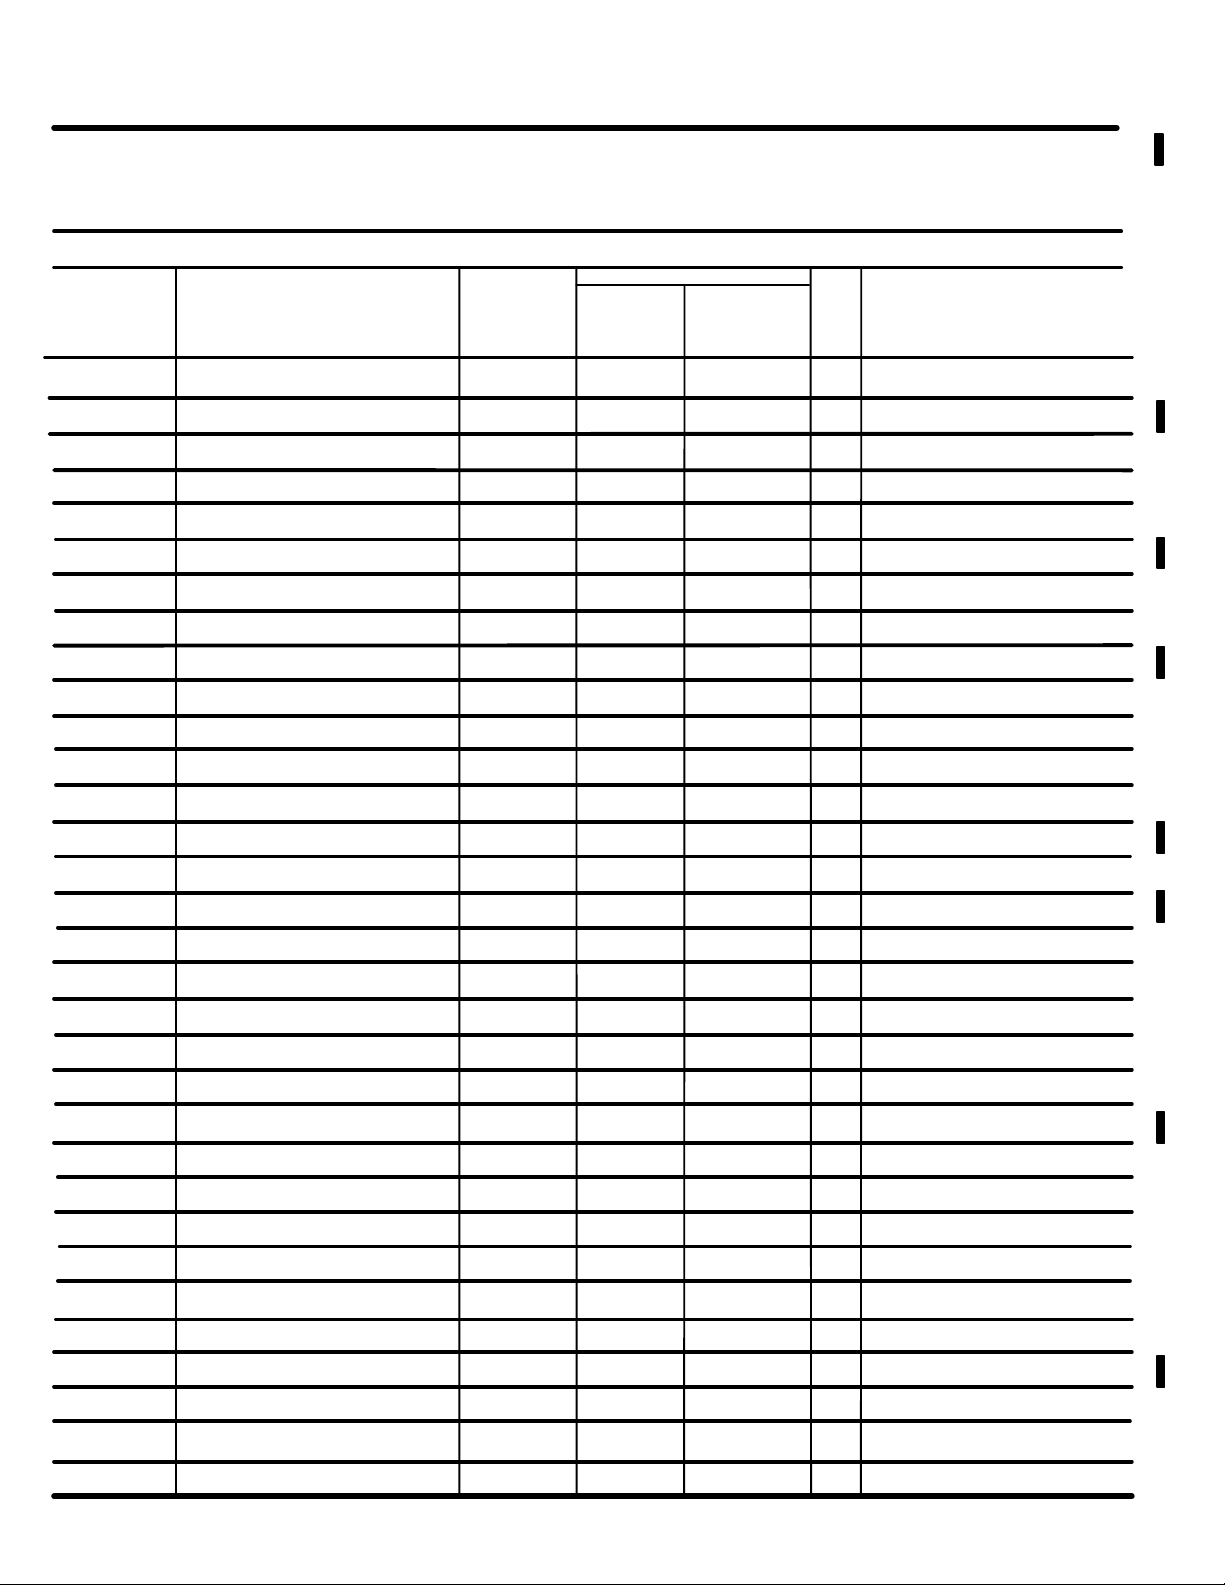
CALIBRATION CHECKLIST
TEST INST (S)
T ektronix 494AP Spectrum Analyzer
NAVAIR 17–20AW–232
PROC. NO.
PROCEDURE
STEP
NO.
(1)
NA 17–20AW–232
FUNCTION TESTED
(2)
MFG. MODEL
MEASURED VALUES
NOMINAL
(3)
FIRST RUN
(4)
OUT
SECOND RUN
TOL
(5)
SER. NO.
CALIBRATION TOLERANCES
OF
(6)
(7)
(GHz) (BW) (dBm max)
4.9.2.11 3.0 to 7.1 – 3 MHz – – ck ( ) noise level –74
” ” – 1 ” – – ck ( ) ” ” –79
” ” – 100 kHz – – ck ( ) ” ” –89
” ” – 10 ” – – ck ( ) ” ” –99
” ” – 1 ” – – ck ( ) ” ” –109
” ” – 100 Hz – – ck ( ) ” ” –119
” ” – 10 ” – – ck ( ) ” ” –125
” 5.4 to 18.0 – 3 MHz – – ck ( ) ” ” –60
” ” – 1 ” – – ck ( ) ” ” –65
” ” – 100 kHz – – ck ( ) ” ” –75
” ” – 10 ” – – ck ( ) ” ” –85
” ” – 1 ” – – ck ( ) ” ” –95
” ” – 100 Hz – – ck ( ) ” ” –105
” ” – 10 ” – – ck ( ) ” ” –111
” 5.4 to 18.0 – 3 MHz – – ck ( ) ” ” –55
” ” – 1 ” – – ck ( ) ” ” –60
” ” – 100 kHz – – ck ( ) ” ” –70
” ” – 10 ” – – ck ( ) ” ” –80
” ” – 1 ” – – ck ( ) ” ” –90
” ” – 100 Hz – – ck ( ) ” ” –100
” ” – 10 ” – – ck ( ) ” ” –107
” 15.0 to 21.0 – 3 MHz – – ck ( ) ” ” –55
” ” – 1 ” – – ck ( ) ” ” –60
” ” – 100 kHz – – ck ( ) ” ” –70
” ” – 10 ” – – ck ( ) ” ” –80
” ” – 1 ” – – ck ( ) ” ” –90
” ” – 100 Hz – – ck ( ) ” ” –100
” ” – 10 ” – – ck ( ) ” ” –107
Page 7 of 10
61

NAVAIR 17–20AW–232
CALIBRATION CHECKLIST
TEST INST (S)
T ektronix 494AP Spectrum Analyzer
PROC. NO.
PROCEDURE
STEP
NO.
(1)
NA 17–20AW–232
FUNCTION TESTED
(2)
MFG. MODEL
MEASURED VALUES
NOMINAL
(3)
FIRST RUN
(4)
OUT
SECOND RUN
TOL
(5)
SER. NO.
CALIBRATION TOLERANCES
OF
(6)
(7)
4.10 Intermodulation Distortion T ests
4.10.7 3rd order products – – ck ( ) 3rd order prod >70 dB down
4.11 Harmonic Distortion T est
4.11.6 Harmonics – – ck ( ) Harmonics >60 dB down
4.12 Noise Sidebands T est
4.12.5 +
30 kHz sidebands – – ck ( ) noise sidebands
>75 dB down
4.13 Residual Response T ests (dBm)
4.13.2 100 MHz – – ck ( ) residual responses <–100
” 200 ” – – ck ( ) ”
” 300 ” – – ck ( ) ”
” 400 ” – – ck ( ) ”
” 500 ” – – ck ( ) ”
” 600 ” – – ck ( ) ”
” 700 ” – – ck ( ) ”
” 800 ” – – ck ( ) ”
” 900 ” – – ck ( ) ”
” 1000 ” – – ck ( ) ”
” 1100 ” – – ck ( ) ”
” 1200 ” – – ck ( ) ”
” 1300 ” – – ck ( ) ”
” 1400 ” – – ck ( ) ”
” 1500 ” – – ck ( ) ”
” 1600 ” – – ck ( ) ”
” 1700 ” – – ck ( ) ”
” 1800 ” – – ck ( ) ”
62
Page 8 of 10

CALIBRATION CHECKLIST
TEST INST (S)
T ektronix 494AP Spectrum Analyzer
NAVAIR 17–20AW–232
PROC. NO.
PROCEDURE
STEP
NO.
(1)
NA 17–20AW–232
FUNCTION TESTED
(2)
MFG. MODEL
MEASURED VALUES
NOMINAL
(3)
FIRST RUN
(4)
OUT
SECOND RUN
TOL
(5)
SER. NO.
CALIBRATION TOLERANCES
OF
(6)
(7)
4.14 Residual FM T ests
4.14.7 Horizontal deflections – – NA record horizontal deflection
4.14.8 Slope = (value from 4.14.7)
times (10 kHz/div)/4 div – – ck ( ) NA calculate slope of signal
4.14.11 Max vertical deflection – – NA record max vert deflection
4.14.12 Residual FM – (value from
4.14.11) times (slope) – – ck ( ) residual FM <
7 kHz
4.14.17 Horizontal deflections – – NA record horizontal deflection
4.14.18 Slope = (value from 4.14.17)
times (100 Hz/div)/4 div –– ck ( ) NA calculate slope of signal
4.14.21 Max vertical deflection –– NA record max vert deflection
4.14.22 Residual FM–(value from
4.14.21) times (slope) –– ck ( ) residual FM <
12 Hz
4.15 Resolution Bandwidth Tests
4.15.2 1 MHz – Res. BW 1 MHz 0.8 to 1.2 MHz
4.15.6 ” ” – Shape Factor –– ck ( ) 7.5:1 or less
4.15.7.2 3 MHz – Res. BW 3 MHz 2.4 to 3.6 MHz
” ” ” – Shape Factor –– ck ( ) 7.5:1 or less
4.15.8 100 kHz – Res. BW 100 kHz 80 to 120 kHz
” ” ” – Shape Factor –– ck ( ) 7.5:1 or less
” 10 ” – Res. BW 10 kHz 8 to 12 kHz
” ” ” – Shape Factor –– ck ( ) 7.5:1 or less
” 1 ” – Res. BW 1 kHz 0.8 to 1.2 kHz
” ” ” – Shape Factor –– ck ( ) 7.5:1 or less
” 100 Hz – Res. BW 100 Hz 80 to 120 Hz
” ” ” – Shape Factor –– ck ( ) 7.5:1 or less
4.15.10 10 ” – Res. BW 10 Hz NA
” ” ” – Shape Factor –– ck ( ) 12:1 or less
Page 9 of 10
63

NAVAIR 17–20AW–232
CALIBRATION CHECKLIST
TEST INST (S)
T ektronix 494AP Spectrum Analyzer
PROC. NO.
PROCEDURE
STEP
NO.
(1)
NA 17–20AW–232
FUNCTION TESTED
(2)
MFG. MODEL
MEASURED VALUES
NOMINAL
(3)
FIRST RUN
(4)
OUT
SECOND RUN
TOL
(5)
SER. NO.
CALIBRATION TOLERANCES
OF
(6)
4.16 IEEE Bus Tests (494P and 494AP Models Only)
4.16.7 C.F. set to 30 MHz –– ck ( ) Correct response
4.16.10 TI sends MIN RF ATTEN –– ck ( ) ” ”
(7)
64
Page 10 of 10
 Loading...