

Page 1
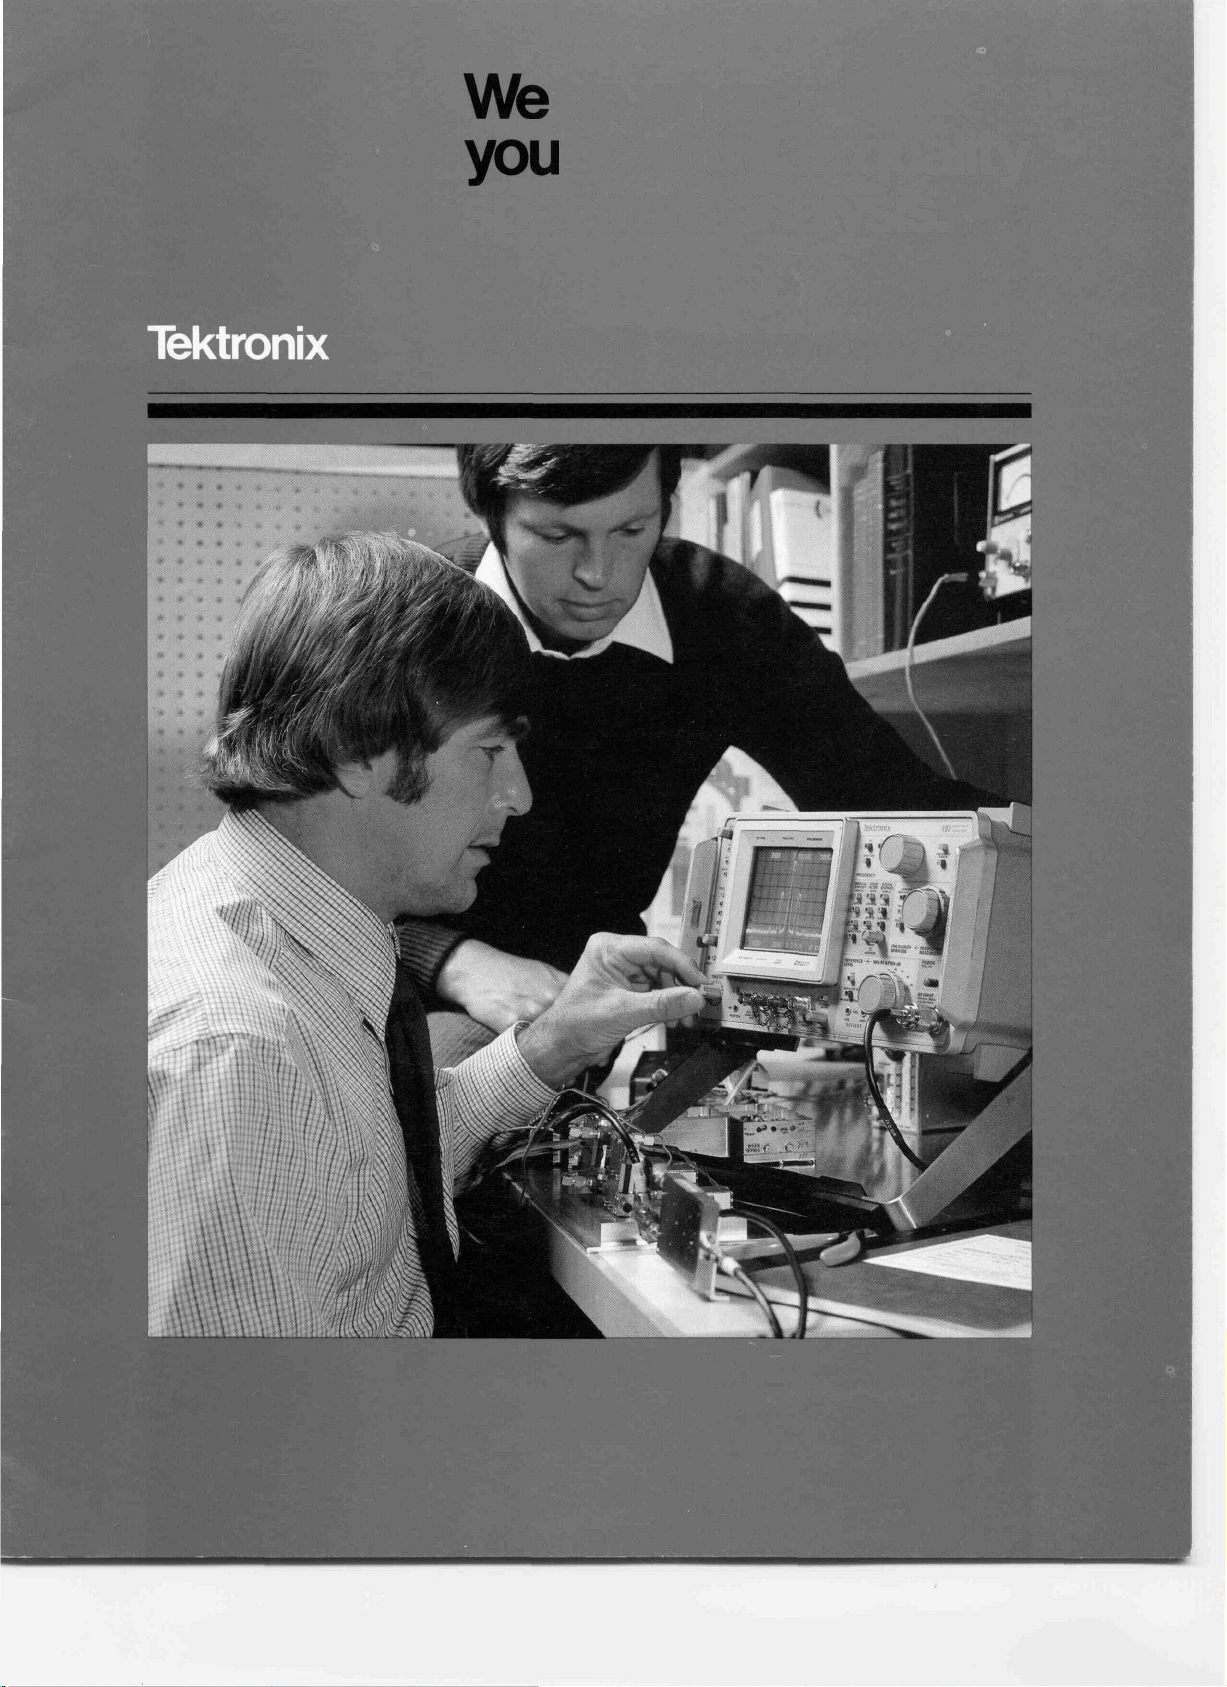
We
go where
you
go with lab quality
spectrum analysis.
492/492P Spectrum Analyzers
Page 2
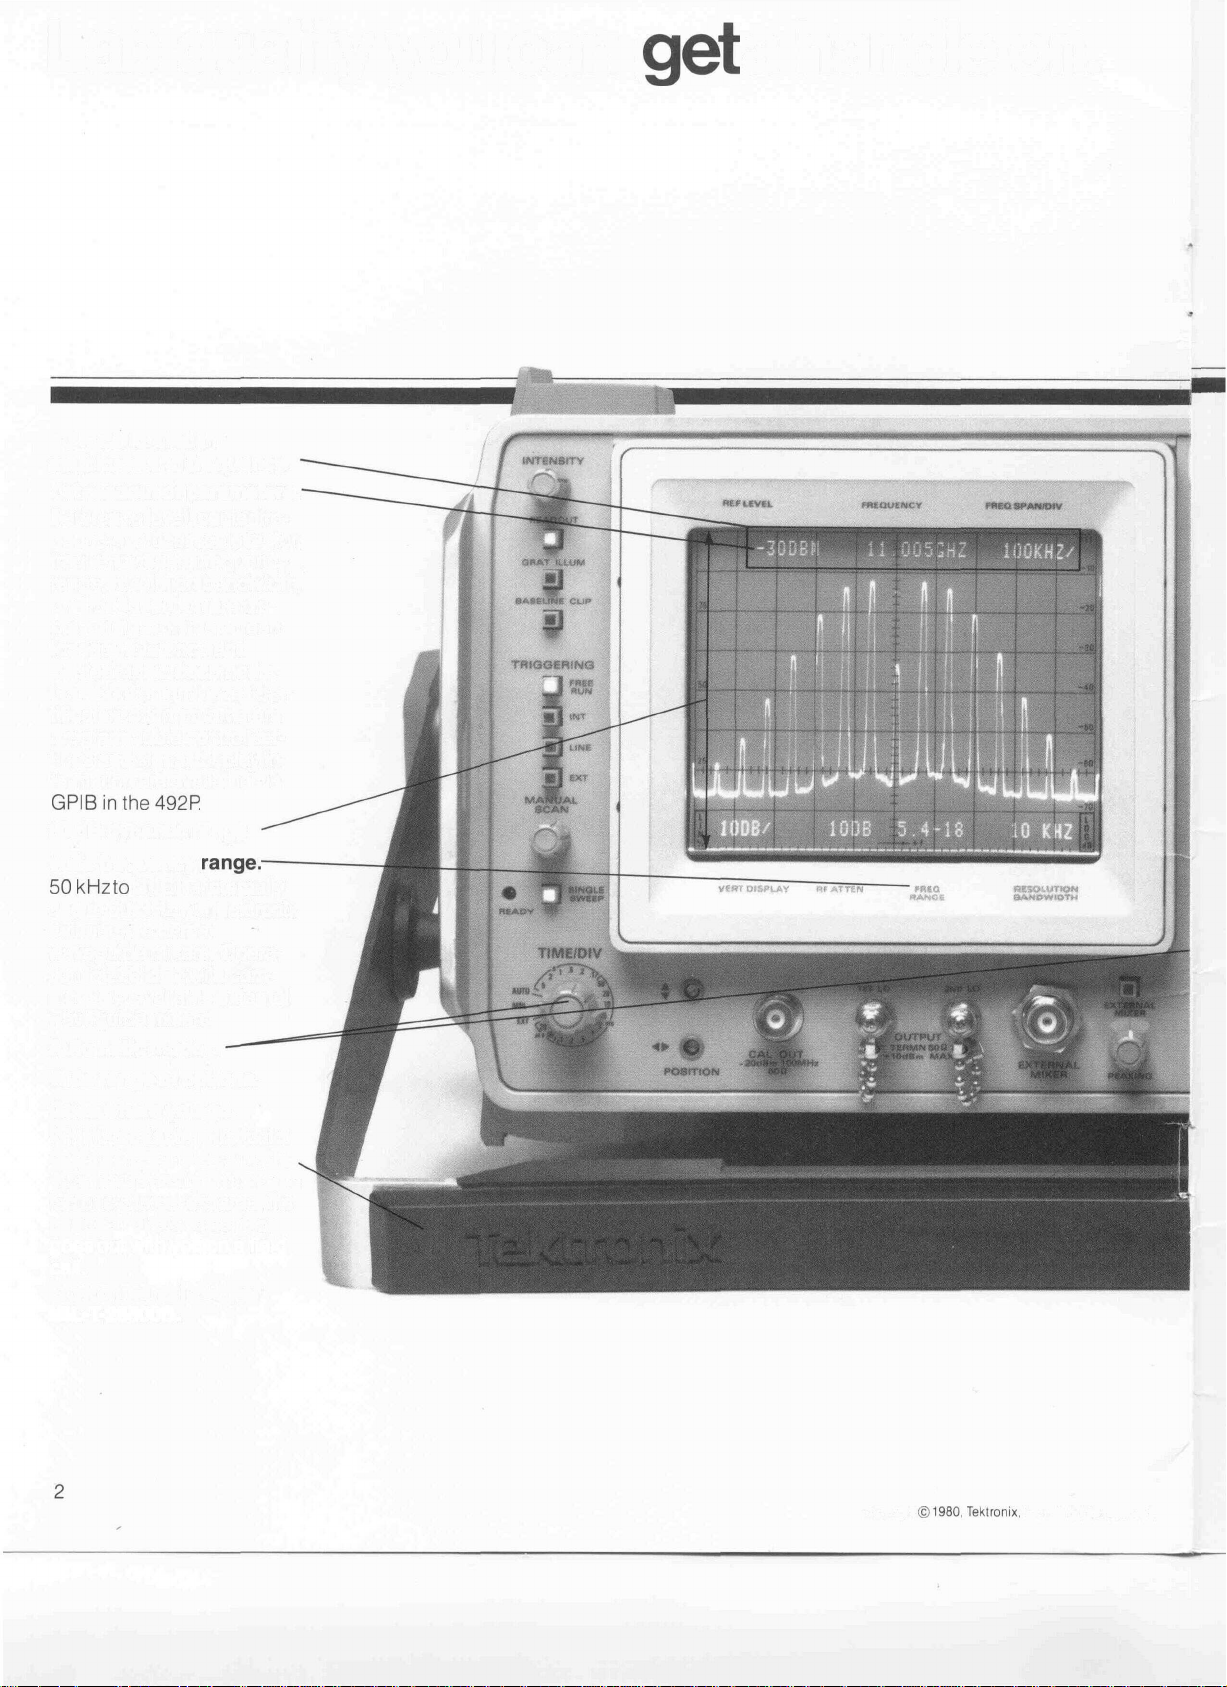
Lab quality you can
Fully calibrated in
amplitude and frequency.
Crt readout of parameters.
Reference level, center frequency, vertical scale factor,
frequency span, frequency
range, resolution bandwidth,
and rf attenuation are dis-
played right on the screen
for easy reference and
photographic documentation. Convenient bezel identification of crt parameters.
Programmable control settings and signal display information are available via
GPIBinthe492R
80 dB dynamic range.
Wide frequency
50
kHz
to
21 GHz internally
and to 60 GHz with Tektronix
calibrated external
waveguide mixers. Operation to 220 GHz with com-
mercially available external
waveguide mixers.
Automatic modes.
Wide range of options.
Goes where you go.
With its portable form factor
and single-handle carry, the
492 moves easily around the
lab or systems test area, fits
under an airplane seat, or
goes out with you on a field
call.
Environmentalized per
MIL-T-28800B.
range.
get
a handle on.
Copyright
©1980,
Tektronix,
Inc. All rights reserved.
Page 3
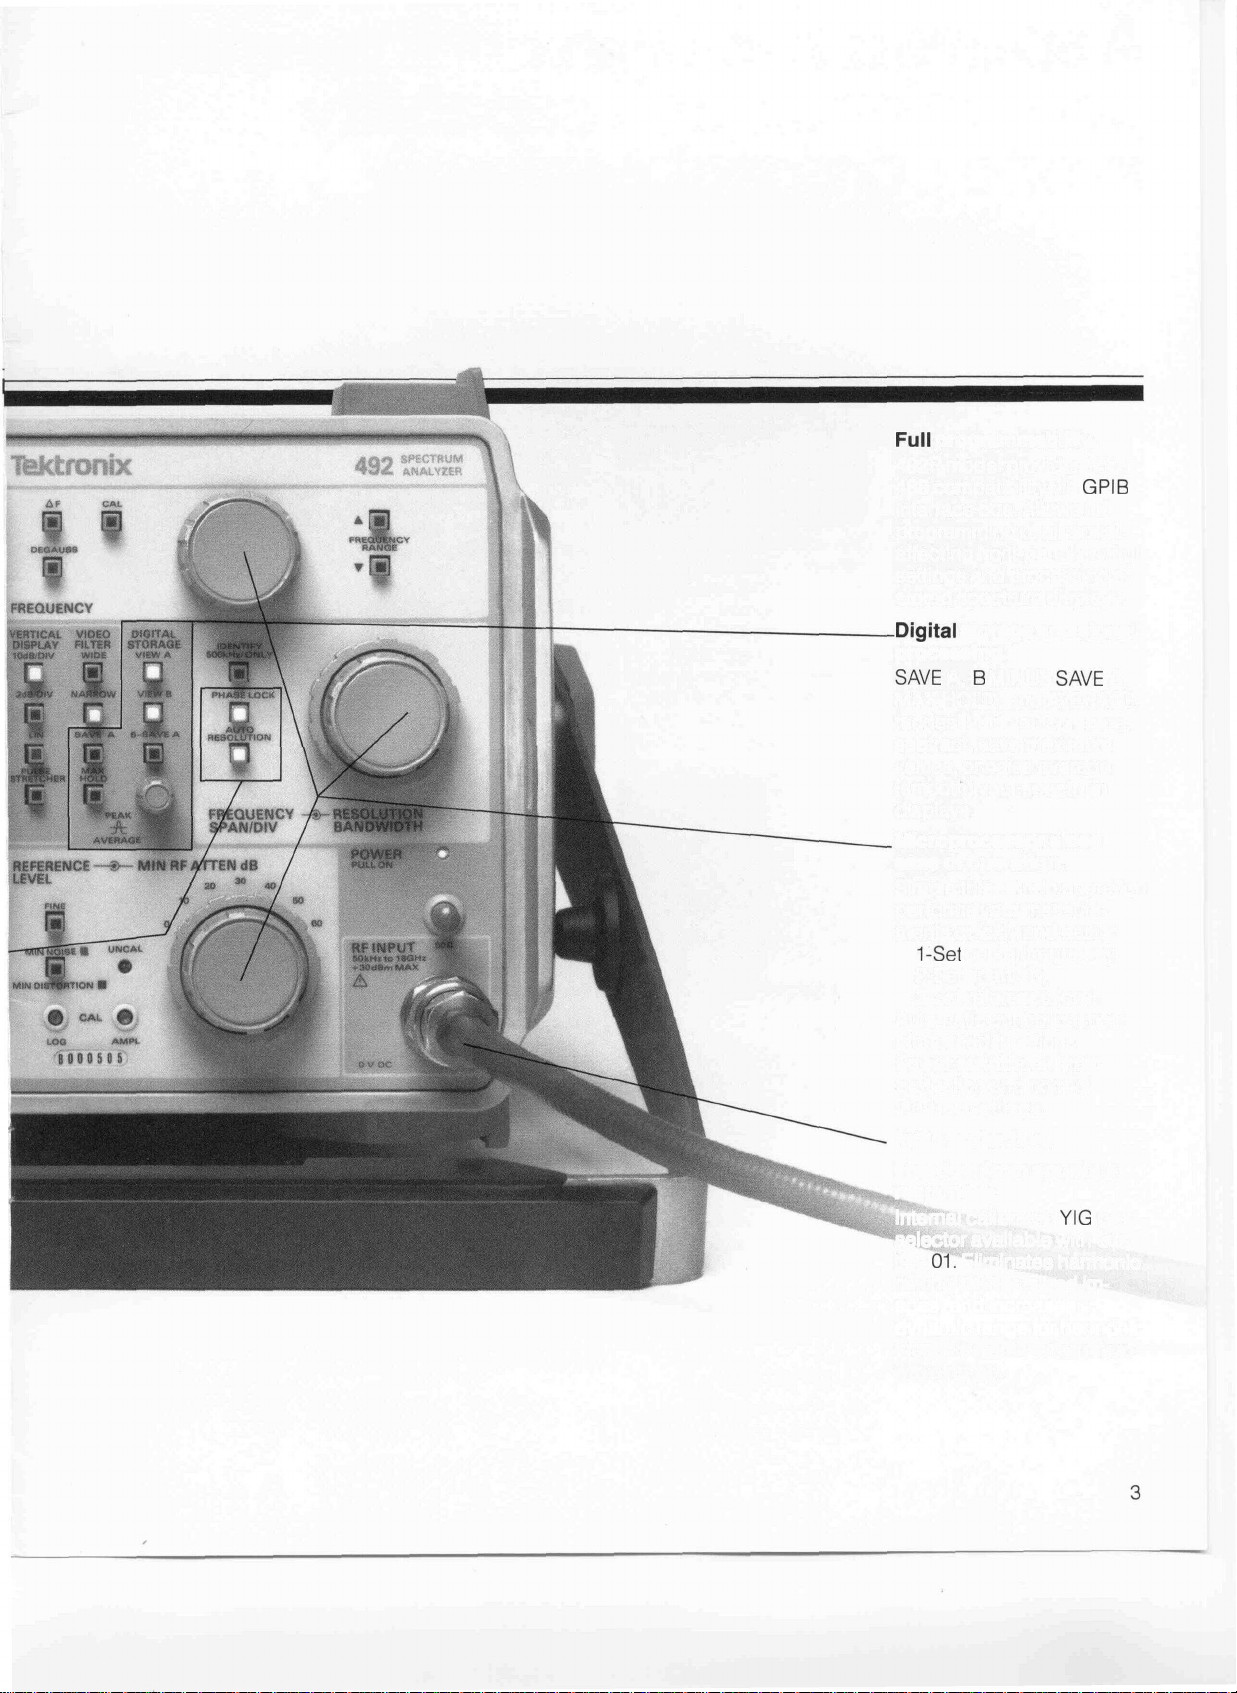
Full
programmability.
492P model provides IEEE
488 compatibility via
GPIB
interface bus. Allows full
programming of all signal-
affecting front-panel control
settings and processing of
stored spectrum displays.
Digital
storage and signal
processing.
SAVE
A, B MINUS
MAX HOLD, and AVERAGE
modes. Lets you compare,
subtract, save maximum
values, or noise average
(smooth) your spectrum
SAVE
A,
displays.
Microprocessor aided
ease of operation.
Simple three-knob operation
performs your measurements quickly and easily:
1-Set
center frequency,
2-Set span/div,
3-Set reference level.
Automatic control on most
often used functions.
Power-on initiates input
protection and normal
start-up settings.
Input protection.
Freedom from spurious
responses.
Internal calibrated
selector available with Op-
tion
01.
Eliminates harmonic
mixing products and im-
ages, and increases
dynamic range for harmonic
YIG
pre-
measurements in the micro-
wave range.
Page 4
A spectrum analyzer with unmatched
convenience and capability.
In one compact package.
Simple to use.
Operation of the 492 is as
easy as 1 (set the input reference level), 2
center frequency), and 3
(set the frequency span).
Most-used functions are
automatically controlled.
Setting the reference level
automatically selects the
proper
//
gain and rf attenu-
ation. Setting the span/div
automatically selects the
proper resolution and scan
time. These preprogrammed
controls of interrelated functions save you time and
simplify your measurement
task.
(set
the
The center frequency con-
trol with constant tuning rate
(CTR) provides smooth fre-
quency adjustment with just
one knob regardless of the
span being used. CTR
allows the operator to position a signal more quickly
and more precisely than a
conventional tuning system.
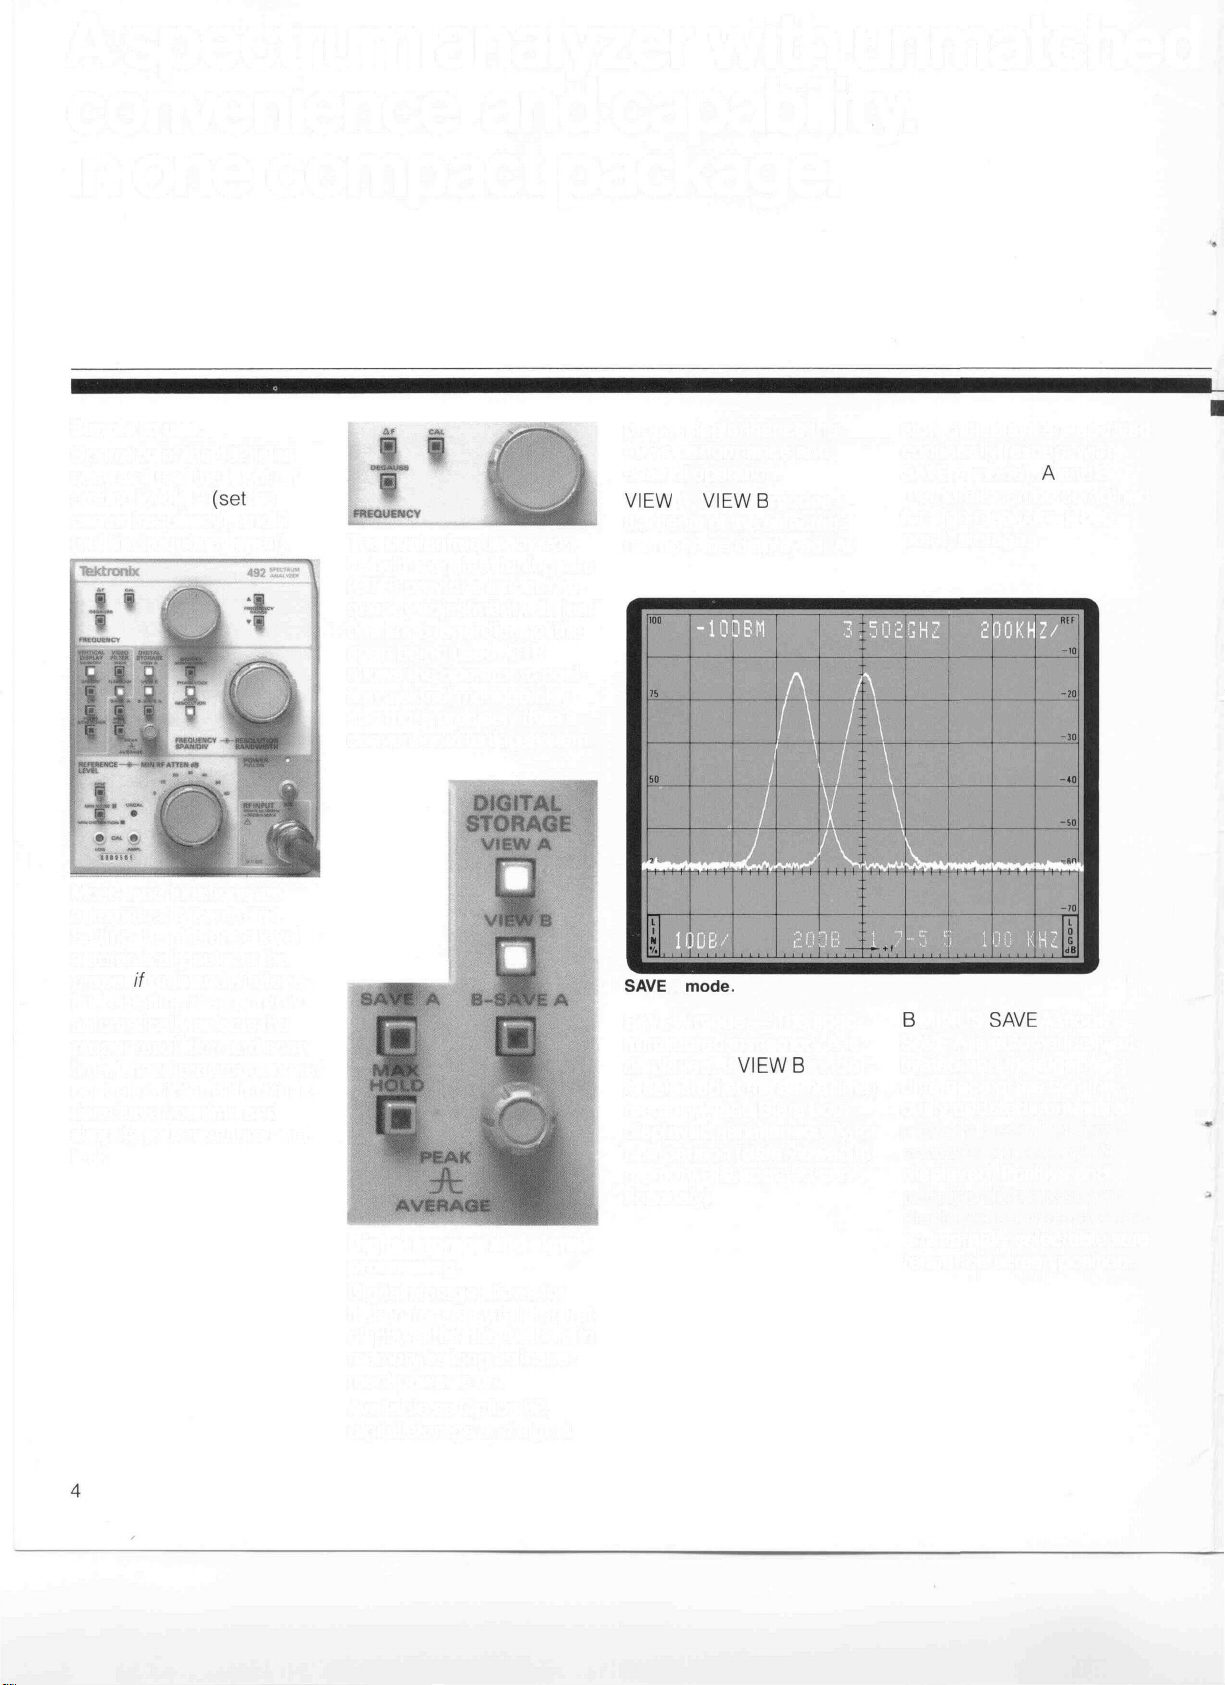
Digital storage and signal
processing.
Digital storage allows for
flicker-free, easy to interpret
displays that may be held in
memory as long as instru-
ment power is on.
Available as Option 02,
digital storage and signal
processing enhance the
492's performance and
ease of operation.
VIEW
A,
VIEWS
Contents of the selected
memory are displayed. All
SAVE A mode.
SAVE A mode — The spectrum stored in memory A is
displayed. If
is selected at the same time,
memory A and B are both
displayed simultaneously for
comparison (data viewed in
memory B is updated con-
tinuously).
modes —
VIEWS
mode
stored displays are updated
continually (except with
SAVE A mode). A and B
memories can be combined
for high resolution (1000
point) storage.
B
MINUS
SAVE A is automatically ac-
tivated and the algebraic
difference of the continu-
ously updated contents of
memory B and the stored
contents of memory A is
displayed. Positive and
negative differences are
displayed above and below
an internally selectable zero
reference screen position.
SAVE
A mode —
Page 5
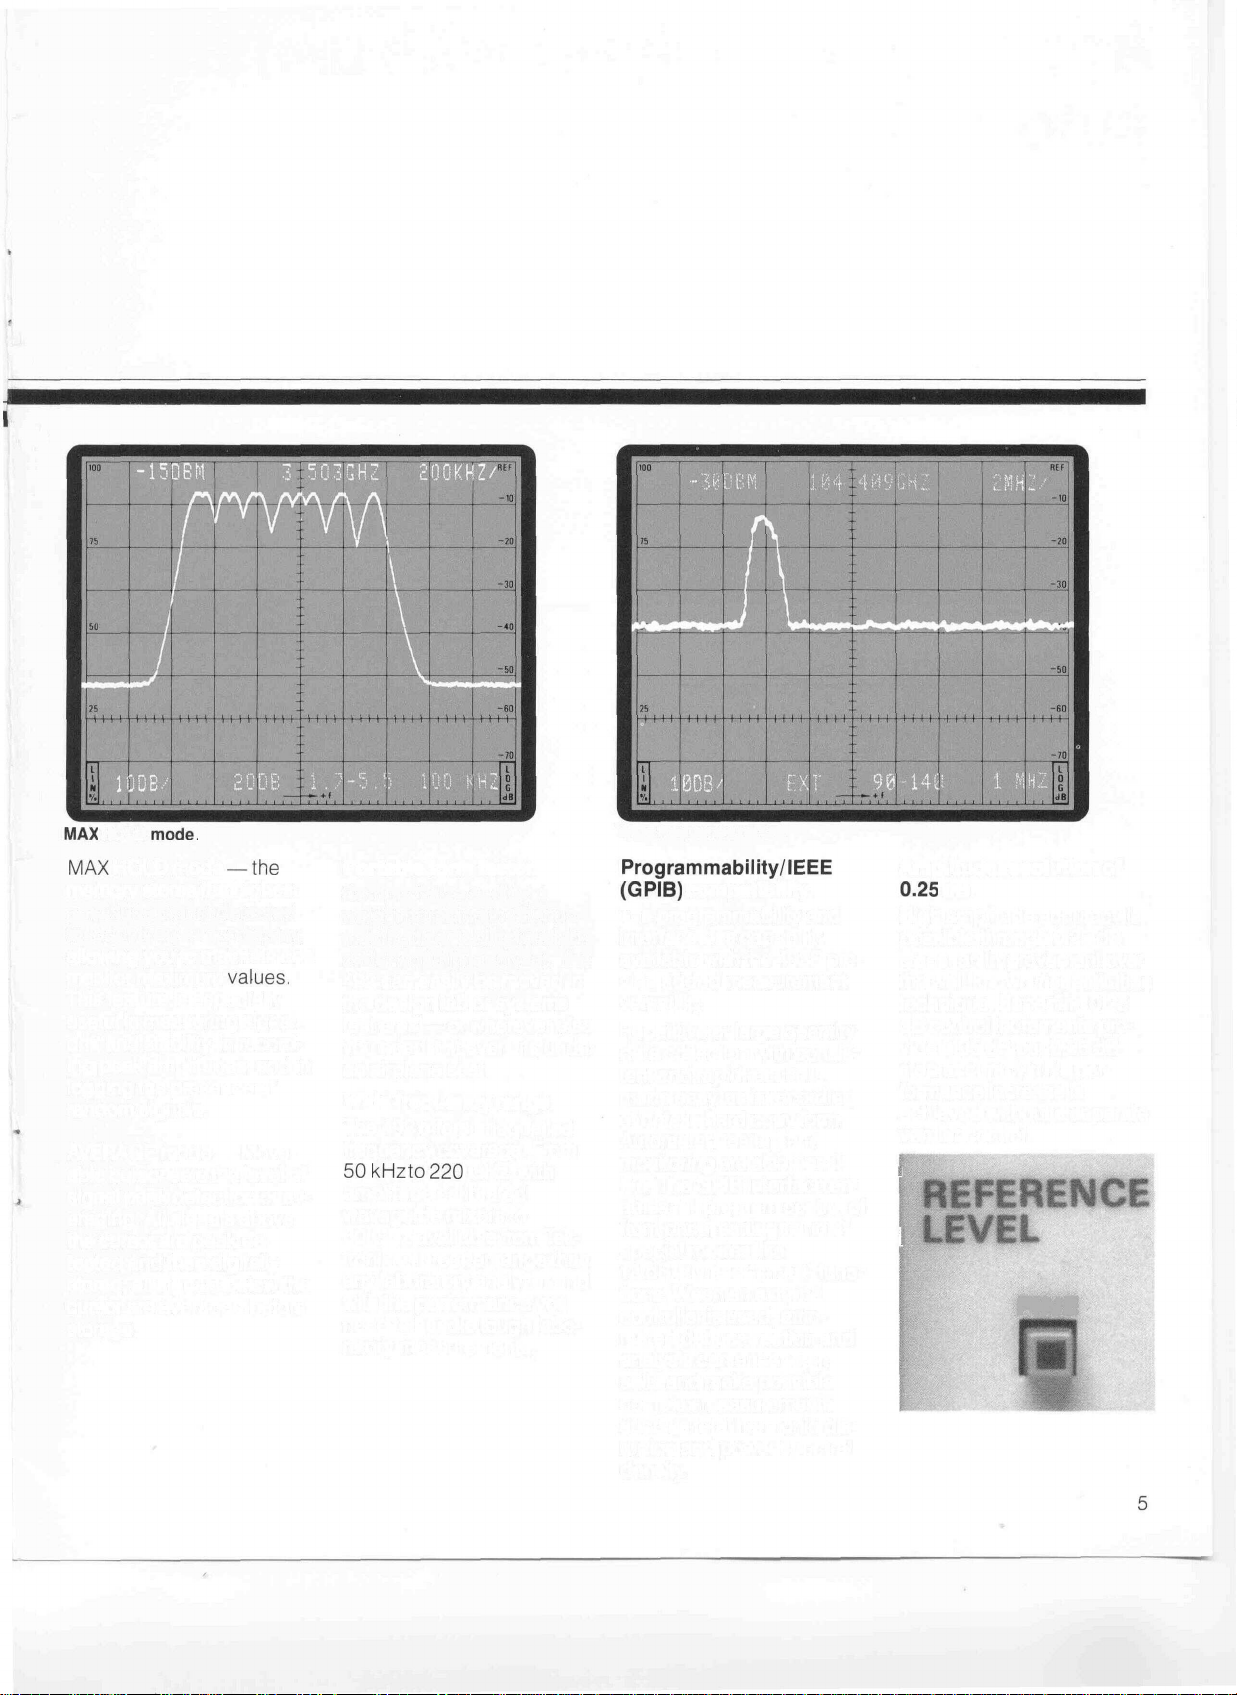
MAX
HOLD
mode.
MAX
HOLD mode
—the
memory stores the highest
amplitude signal detected
for each frequency display,
allowing you to maintain and
monitor maximum
values.
This feature is especially
useful in measuring signal
drift and stability, in record-
ing peak amplitudes, and in
logging the presence of
random signals.
AVERAGE mode — Move-
able cursor sets the level of
signal peak detection or averaging. All signals above
the cursor are peak de-
tected and then digitally
stored; all signals below the
cursor are averaged before
storage.
Portable form factor.
Compact size and light
weight combine to offer un-
matched portability in a lab-
oratory quality analyzer. The
492 can easily be moved in
the design lab or systems
test area — or wherever else
you need it. It even fits under
an airplane seat.
Wide frequency range.
The 492 offers unequalled
frequency coverage. From
50
kHz
to
220
GHz, with
amplitude calibrated
waveguide mixers to
60 GHz available from Tek-
tronix. A broader range than
any laboratory analyzer and
with the performance you
need to handle tough labo-
ratory measurements.
Wide frequency range.
Programmability/IEEE
(GPIB)
compatibility.
The programmability and
interface bus capability
available with the 492P provide added measurement
versatility.
Repetitive or large quantity
data collection with consistent and rapid results is
made easy, as is recording
of data in hard copy form.
Automated testing and
monitoring are also possi-
ble. The GPIB interface en-
ables full program control of
front panel settings and of
special modes like
12 dB/div and "smart" func-
tions. When an external
controller is used, auto-
mated data correction and
analysis can enhance re-
sults and make possible
complex measurements
such as total harmonic dis-
tortion and power spectral
density.
Amplitude resolution of
0.25
dB.
High amplitude accuracy is
possible through 0.25 dB
steps, an improvement over
the well-known if substitution
technique. Superfine 0.25
dB control increments pro-
vide 0.05 dB per 0.25 dB
step accuracy. This per-
formance increase is
achieved without a separate
vernier control.
?
!
FINE
Page 6
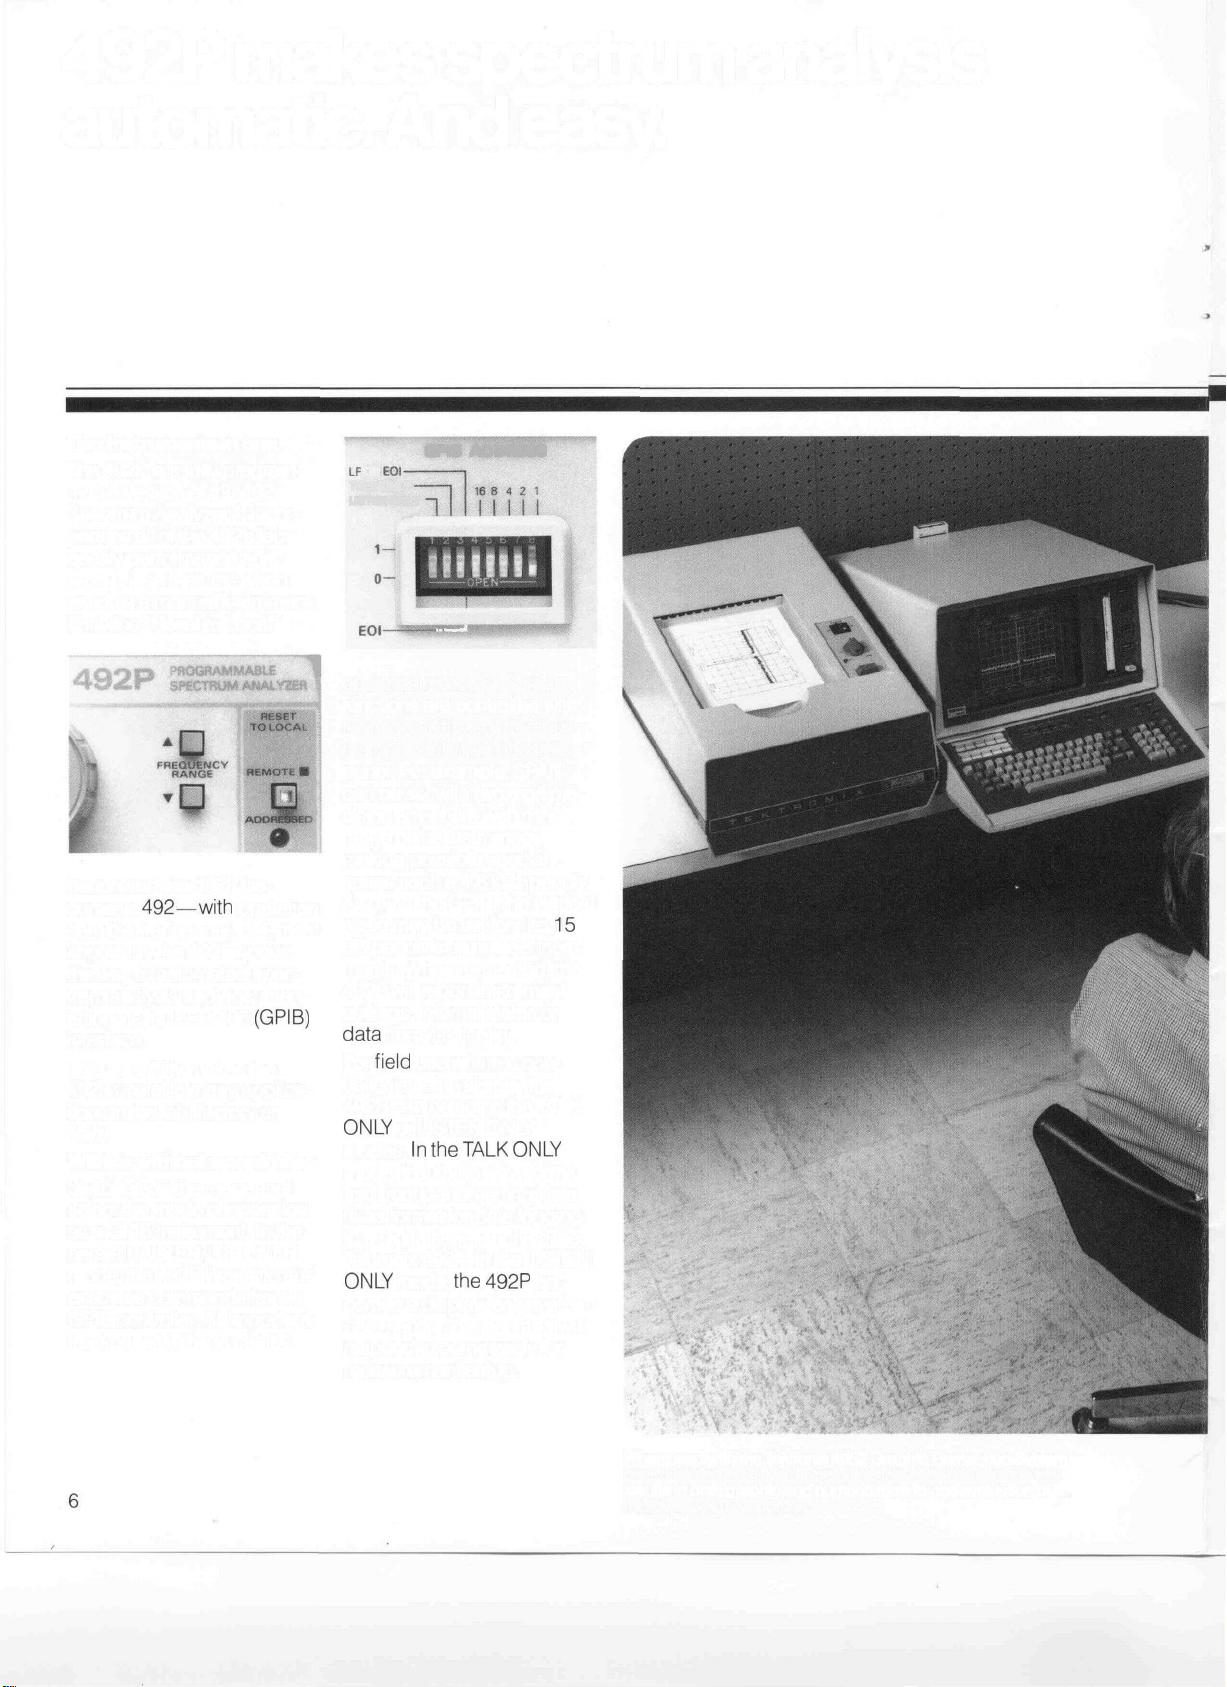
492P makes spectrum analysis
automatic. And easy.
Two instruments in one.
The 492P is a fully program-
mable version of the 492
Spectrum Analyzer. It incor-
porates all of the 492's lab
quality performance and
ease of use features when
used as a manual instrument.
Push the "Reset to Local"
button and the 492P be-
comes a
from the front panel. But, most
important, the 492P opens
the way to automated spec-
trum analysis and documen-
tation via its IEEE-488
interface.
This versatility makes the
492P useful in many applica-
tions in the lab, factory or
field.
492—with
operation
(GPIB)
With or without a controller.
Switches on the rear panel
select the mode of operation
as a GPIB instrument. In the
normal TALKER/LISTENER
mode, the 492P listens to and
executes commands from a
GPIB controller. All important
front panel settings can be
LF
OR
TALK ONLY
LISTEN ONLY
EOI————- • '
1
operated remotely. Some
functions are controlled with
more detail through the bus
than possible from the front
panel. For example, SPAN
can be set with two digit pre-
cision anywhere within the
range of the instrument,
making possible special
spans such a 4.8 kHz per div.
Also, via the GPIB, the vertical
scale may be set for 1 to
dB per division in 1 dB incre-
ments. When requested, the
492P will report instrument
settings, internal status or
data
For
troller is not available, the
492P can be set to the TALK
ONLY
modes.
GPIB ADDRESS
EOI
from its display.
field
use where a con-
or LISTEN ONLY
In
the
TALK
ONLY
mode, it outputs waveforms
and front panel settings in a
fixed format for data logging
to a digital tape, such as the
Tektronix 4924. In the LISTEN
ONLY
mode,
the
492P
comes a display for waveform
data sent on the bus and will
respond to commands for
measurement setup.
15
be-
When used with the Tektronix 4052 Graphic Computing System
controller and 4631 Hard Copy Unit, the 492P can provide test
results in both graphic and numeric form for the evaluation of
microwave signal sources.
Page 7

Easy to use.
The 492P is designed for
ease of operation via the
GPIB,
just
as
the
492
is
designed for front panel
operational ease. Most commands for program control
are simply abbreviations of
the front panel nomenclature.
For example, to set center
frequency, send the ASCII
characters
To query the center fre-
quency, send "FREQ?" The
response is "FREQ 5.2 E
+
09!'
The 492P's high level
command language and the
similarity of commands and
responses simplify pro-
gramming and make pro-
gram listings easily readable
for editing.
"FREQ
5.2 GHz."
Automated setup.
The 492P is not only an
obedient servant under program control, but smart
enough to do many things on
its own. For example, it will
provide all of its settings with
one command. Just send
"SET?" You'll get back a block
of characters listing all of the
front panel and internal settings. Store this response in
the controller or on a tape
To return
original measurement condi-
the
492P
to
file.
the
tion, send the same charac-
ters back to the analyzer. To
initialize
"power on" settings, send
"INir
the
492P
to
its
Internal processing
simplifies programming.
The 492P's power reduces
processing time and eases
the software development
task. For example, the 492P
can identify all signal peaks
above a specified amplitude
threshold and the maximum
and minimum points on the
display waveform.
Having identified a point of
interest in its digital storage
memory, the 492P can then
perform certain operations
automatically. It can tune to
center a signal on the dis-
play before narrowing the
span. Send the command,
"CENSIG"
automatically. Another com-
mand,
cally changes the sensitivity
so the signal peaks at the top
of the screen reference level.
The display now reads di-
rectly in dB below the signal
peak
screen display for precision
and it's done
"TOPSIG"
and assures an on
automati-
amplitude measurements.
Page 8

Programmable 492P saves
time
and
simplifies
A UHF TV signal with
492P Programmable Spectrum Analyzer, sent
digital form and then
VERT DISPLAY RF ATTEN
I0DB/
The same spectrum displayed above is drawn by the 4052
using the Tektronix 4662 Interactive Digital Plotter for high
resolution documentation.
multiburst
displayed
20DB
0-1.8
your
test pattern is acquired by the
on the 4052 Graphic System.
FREQ
RANGE RES BANDWIDTH
100
via
FREO
the
SPAN/DIV
S3BKHZ/
KHZ
job
GPIB
in
Automated signal tracking.
Keeping a drifting signal on
screen in a narrow frequency
span per division is no longer
troublesome. With the internal
processing functions and the
ability to repetitively execute
instructions in its input buffer,
the 492P can track drifting
signals with virtually no help
from the controller.
Auto peaking.
Automatic peaking provides
greatest accuracy when
measuring at widely differing
frequencies using the optional internal preselector filter
(1.8-21 GHz). Send "PEAK
AUTO" from the controller to
the 492P and an internal
routine automatically adjusts
the preselector tracking for
maximum signal response.
Enhanced data
presentation via GPIB.
Displayed waveforms can be
outputted from digital storage
to a calculator, computer, or
data storage device such as
a tape or disc file. The data
may be graphed on a digital
plotter, lower left, or displayed
on the screen of a controller
such as the
programmable Tektronix 4052
Graphic System, top left.
Mathematical operations
such as calibration and correction of the original data
can be performed in the controller. Data can be combined
from several different frequency spans to make a
BASIC-language
composite plot. Raw data can
be converted into different
units such as micro-volts or
dBc. The two-way communication ability of the 492P
permits a real time comparison of a controller-generated
spectrum, or set of limits, and
an incoming signal on the
492R The computational
power of the controller can
be used to solve complex
analytical measurements
such as total harmonic distortion, photos at top of page 9
(facing)
density.
Full programmability
completes the task.
Complete automation of the
entire measurement saves
time and eliminates many
operator errors or inconsistencies. Also, some programmed measurements
may be made more precisely
and thoroughly than by
manual methods.
harmonic distortion measurement, for example, the
analyzer can be controlled to
tune each harmonic frequency separately, permitting
an enlarged high resolution
display of the signal peaks,
lower left, page 9. After the
peak amplitude is measured,
the span can be widened and
the analyzer tuned to find the
next harmonic. Internal processing greatly simplifies the
controlling program and
speeds the measurement.
or power spectral
For
a total
Page 9

FREQUENCY
AMPLITUDE
DBM
RELATIVE
DB
A 100 MHz signal and its harmonics displayed on the 492P with
a full screen span of 500 MHz.
1.0E+8
2.0E+3
3.0E+8
4.0E+8
5.8E+8
6.8E+8
7.0E+8
8.0E+8
TOTAL
HARMONIC
DO YOU
MAHT
TO DO ANOTHER ANALYSIS
Automated total harmonic distortion test results computed by
the Tektronix 4052 and outputted on the Tektronix 4631 Hard
Copy Unit.
Put it to work.
With the programmable 492P
on your measurement team,
repetitive measurements can
be done the same way every
time. Your throughput will
increase—and
dence in results. And, the
internal processing and high
level programming language
-2B.8
-25.64
-34.96
-33.16
-28.32
-37.64
-39.B8
-33
-43.56
DISTORTION EQUALS 80 PERCENT
(YES
-4.84
-14.16
-17.36
-7.52
-16.84
-18.28
-14.2
-22.76
OR
When you look at the total
performance capability of the
492R you'll recognize its
value: Ease of operation both
as a programmable and
manual instrument. Wide fre-
your confi-
quency range. The versatility
to go where you go. Into the
lab for automated testing; into
the field for data collection.
H0>?
make software development
faster. You get high power results with easy programming.
Full
programmability
and measuring the signal peak with high amplitude resolution.
Internal processing commands
allows tuning to each harmonic frequency
in
the
492P
greatly simplify this
measurement.
Page 10

Check the specs and see.
Frequency Related
Frequency Range — 50 kHz to
21 GHz with internal mixer, to
220 GHz with external mixers. Op-
tion 08 deletes coverage above
21 GHz (calibrated mixers to
60 GHz available from Tektronix).
Frequency Accuracy — ±0.2% or
5 MHz, whichever is greater, +20%
of span/div.
Frequency Readout Resolution
— Within 1 MHz.
Frequency Span per Division —
10 kHz to 200 MHz plus zero and
full band max span, down to 500 Hz
with Option 03 in 1-2-5
sequence.
Frequency Span Accuracy —
±5% of span/div, measured over
center eight divisions.
Resolution Bandwidth @ 6 dB
Points — 1 MHz to 1 kHz (100 Hz
for Option 03) in decade steps
within ±20%, manually or auto-
matically selected.
Resolution Shape Factor
(60/6 dB) — 7.5; maximum.
10
Spurious Responses
Residual (no input signal) —
-100 dBm or less referenced to
input mixer for fundamental
conversion.
Harmonics — At least -60 dBc for
full screen signal in the Min Distor-
tion mode to 21 GHz. At least -100
dBc for preselected Option
to
21
GHz.
01.1.7
Intel-modulation — 3rd order
products at least -70 dB down
from two full screen signals within
any
frequency span in the Min Dis-
tortion mode. At least -100 dB
down for two signals spaced more
than
100
MHz apart from
GHz for preselected Option
L.O. Emissions (referenced to
input
mixer)—
maximum; -70 dBm maximum for
Option
01.
10
dBm
1.7
to 21
01.
Stability
(after 2 hour warm-up)
Residual
for 2 ms
(50 Hz) for 20 ms with phaselock
Option 03.
Long Term Drift: 200 kHz/hour un-
phaselocked, 25 kHz/hour phaselocked for fundamental mixing.
Noise Sidebands — At least
75 dBc @ 30X resolution offset
(70 dBc for 100 Hz resolution) for
fundamental mixing.
FM—1
time
kHz peak-to-peak
duration, improves to
Amplitude Related
Reference Level
-123
dBm
maximum safe input) for 10 dB/div
and 2 dB/div log modes. 20 nV/div
to 2 V/div (1 W maximum safe input)
in the linear mode.
Reference Level
dB, and 0.25 dB for relative level (A)
measurements in log mode. 1-2-5
sequence and 1 dB equivalent increments in
Reference Level Accuracy —
Amplitude change of 0.25 dB
±0.05
dB, 1 dB
Range
to +40 dBm
Steps
LIN
mode.
±0.2dB,10dB
—
(+30
—10
dBm
dB, 1
±0.5 dB; to a maximum of
for 60 dB and ±2 dB for 90 dB
erence level change when gain
change and attenuation do not
offset each other.
Display Dynamic Range — 80 dB
@ 10 dB/div, 16 dB @ 2 dB/div and
±1.4
dB
ref-
8 divisions linear.
Display Amplitude Accuracy —
±1
dB/10
±2 dB/80 dB; ±0.4 dB/2 dB to
maximum of ±1
full screen in LIN
Resolution Bandwidth Gain
Variation— ±0
dB to maximum of
dB/16
5dB
SENSITIVITY AND FREQUENCY RESPONSE
Average Noise Level
to
18
01,
10%/div,
Preselection
-115dBm
-115dBm
-115
-115dBm
-100
-95
-100dBm
GHz,
01,
dB,
for 1 kHz Resolution
No
Preselected
Option 01
-110dBm
-110dBm
-110dBm
dBm
-110dBm
dBm
-95 dBm
(12GHz)
-90 dBm
per
(18
-85 dBm
1
formance
dBm
-95 dBm
-95 dBm
Pen Lift
IF
Out—
screen, -30 dBm display; 10
50ft.
GPIB
output control for 492 P
Miscellaneous
Sweep Time — 20
(10 s/div in auto) in 1-2-5 sequence.
Crt
center frequency, frequency range,
vertical display mode, frequency
span/div, resolution bandwidth, and
rf
attenuation.
Crt
Power — 90 to
250
with all options.
Environmental Characteristics —
Per MIL-T-28800B type III, class 3,
style C.
Configuration—Portable, 20 kg
(44
49.9 cm (6.9 x 12.9 x 19.7 in) without
handle or cover.
"Flatness
not apply to the
attenuator positions between 19 and
20
GHz.
1
GHz)
Readout — Reference level,
—8x10
VAC,
Ib)
Mixing
Frequency Range
50kHz-1.8GHz'
50kHz-4.2GHz'
1.7-5. 5 GHz
3.0-7.1 GHz
5.4-18GHZ
15-21
GHz
100MHz-18GHz"'
18-26
GHz
26-40 GHz
40-60 GHz
"Low
frequency end performance does not include effects due to zero Hz feedthrough.
"Flatness
attenuator positions between 19 and 20 GHz.
**
Includes frequency band switching error of 1 dB maximum.
Number (n)
1
1
1
1
3
3
With Tektronix optional high
6
10
10
and accuracy specifications do not apply to the
Input Characteristics
Internal
Mixer — Type N female
connector, VSWR
and 3.5 to 21 GHz, with 10 dB or
1.45
more attenuation.
Optimum Level for
Linear Operation —
-30 dBm referenced to mixer.
1 dB Compression Point —
-28 dBm from 1.7 to 2 GHz for Op-
tion 01; otherwise -10 dBm.
Maximum Safe Input Level —
+13 dBm without Option
+30 dBm (1 W) with Option
zero
rf attenuation.
Attenuator Power Limit —
+30 dBm (1 W) continuous, 75 W
peak for 1
/us
or less pulse width
and 0.001 maximum duty factor.
Output Characteristics
Calibrator——20 dBm ±0.3
100
MHz ±0.01%.
1st
L.O.—+7.5
nominal.
2nd
L.O.——16
nominal.
Vertical
nominal.
Horizontal
kft
nominal.
dBm @ 50ft
dBm @ 50ft
Out—0.5 V ±5%/div, 1 kft
Out—0.5
V ±
Frequency Response
With
No
Preselection
±2,5dB
±1.5dB
±1.5dB
±2.5dB
±3.5dB
±3.5dB
wavei
guide
mixers
±3dB
±3dB
±3dB
30,
40,
50, and
—TTL,
5V
-15 dBm nominal
Control — IEEE 488
cm, P31 Phosphor.
132
48 to 440 Hz, 210 W max
(all options), 17.5 x 32.7 x
and accuracy specifications do
30,
40,
dB; ±5% of
mode.*
10dB
60dBr/
nominal.
/xs
to 5 s/div
VAC,
50, and 60
Attenuation
Preselected
Option 01
±1.5dB
±2.5dB
±2.5dB
±3.5dB
±5.0dB*"
±4 5dB
for
MHz,
input/
180
to
dBrf
full
Page 11

Interpreting
the specifications
Low-End Frequency Performance.
Frequency Drift.
Low-End Frequency
Performance.
Typical low-end frequency
performance for the 492 is
shown opposite in figure
Unlike many spectrum
analyzers with microwave
measurement capability, the
492 is specified for mea-
surements down to 50 kHz.
Resolution filter shape,
phase noise sideband per-
formance, input mixer cou-
pling, and zero hertz local
oscillator feedthrough can
all contribute to limiting
low-end frequency per-
formance.
The 492 low-end frequency
specification is 50 kHz. This
is based on the fact that, for
a basic 492, 50 kHz corre-
sponds to center screen at
the narrowest available fre-
quency span of 10 kHz/div.
By comparison, a
phaselocked 492 (with Op-
tion 03), set at 100 Hz reso-
lution; has a center fre-
quency capability of 2.5 kHz
(500 Hz/div).
Performance below 50 kHz is
affected by local oscillator
phase noise, input coupling
and the zero hertz feed-
through. Practical per-
formance is limited to
approximately 5 kHz.
1.
Note that,
at
50
kHz, the
noise level is degraded to
approximately
a 1 kHz resolution bandwidth
due to noise sidebands
around the zero Hz feed-
through.
The zero Hz signal also lim-
its the ability to set a small
signal (e.g., -80 dBm)
screen in 2 dB/div. These
effects are not significant at
frequencies above 1 MHz,
and they can be circumvented by using the A
amplitude mode.
Frequency Drift.
The relationship between
long-term, medium-term,
and short-term frequency
drift for the 492 is illustrated
in figure 2.
Spectrum analyzer fre-
quency drift is primarily
caused by changes in tem-
perature and manifests itself
as a shift in signal display
frequency even though input
signal frequency remains
constant. The apparent
change in frequency de-
pends on several factors,
including instrument tem-
perature at turn-on, en-
vironmental temperature,
time since turn-on, whether
or
not
the 492 is phase-
locked, the mixing harmonic
number, and the period of
time over which the meas-
urement is made.
-90dBmfor
to
full
-40
-60
o
•o
-80
-100
-120
1 10
Typicaf low end frequency performance for the 492 with Option 01
(see text for explanation.)
Figure 1
/
turr
warr
Representative drift characteristics of modern spectrum analyzers.
Figure 2
/
-on
-i-up
——
rift
) drift^vline
*•—
1000
.
100
Frequency (kHz)
Dngt
3rm
••
ta-^-
;
V
JVW
>s
Time
V-
/v
^
+*
1
^
v
shc
resi
nedk
>rm
rtter
dual
^
s
m
c
rift
^
m
-M
c
zer<
S
\
11
Page 12

Interpreting the
specifications
Q
u
c
10,000
nul;
live
1,000
drift
100
Ion 3 teim d
10
11
40
20
Typical long term turn-on drift characteristics for an unphase-
locked 492 starting at room temperature (fundamental mixing.
Multiply by mixing N number for higher mixing products).
Figure 3
60 80
Time (Minutes)
100
specified two-hour warm-up
period.
Total cumulative drift after
the two-hour warm-up is
about 5 MHz. At this point,
the 492 has reached the
long-term drift specification
of 200 kHz/hr. The instru-
ment should be recalibrated
after warm-up to maintain
accuracy.
Frequency Drift During
Warm-Up
492 (Option 03).
Adding
r
rr
inut
03) to a 492 helps minimize
fora
Phaselocked
phaselock
(Option
drift. The first local oscillator
is stabilized (automatic at 50
kHz/div at fundamental
conversion unless manually
overridden), leaving only
120
140
1,000
drift caused by the second
local oscillator. The second
oscillator is not affected by
higher mixing product mul-
tiplication, and so drift is in-
dependent of input fre-
quency.
Furthermore, 492 phaselock
stabilization offers the
equivalent of infinite hold-in
range, so that the first local
oscillator will not break lock
as it drifts. When phase error
voltage reaches a predetermined maximum, the tune
voltage is reset to maintain
lock.
A phaselocked 492 (Option
03) starting at room temper-
ature changes frequency by
no more than 500 kHz in the
ulat
ve c
rift
Frequency Drift During
Specified Warm-Up Time.
Because of the thermal na-
ture of frequency drift, the
492's behavior depends to a
great extent on external
temperature conditions as
they affect the internal tem-
perature of the instrument. A
492 that has been out in the
cold before warm-up may
drift more than one that has
been in the laboratory.
Frequency Drift During
Warm-Up For An
Unphaselocked 492.
Turn-on drift as a function of
time is caused by environ-
12
mental changes. Because
the 492 is designed to oper-
ate in a wide variety of environments, drift is a more im-
portant consideration
for
the
492 than for a spectrum
analyzer designed for lab
use only.
For a typical unphaselocked
492 starting out at room
temperature, frequency drift
during the first half hour of
warm-up is about 4 MHz, as
shown in figure 3.
The cumulative drift specifications shown in figure 3
represent a slope of several
hundred kHz/min at turn-on,
down to a few kHz after the
:rrr
100
nutf:
drift
120
140
Icngt
40
Typical long term turn-on drift characteristics for a phaselocked
492 (with Option 03) starting at room temperature.
Figure 4
60 80
Time (Minutes)
Page 13

Resolution Bandwidth.
Harmonics and Intermodulation.
Figure 5
first two hours. After the
two-hour warm-up, the in-
strument drifts a maximum
of 25 kHz/hr — a specifica-
tion that is almost ten times
better than without phaselock. These specifications
represent an approximate
drift of 10 kHz/min at turn-on
and 400
Hz/min
after two
hours, as shown in figure 4.
Medium-Term Drift. A
phaselocked 492 (with Op-
tion 03) exhibits excellent
medium-term drift at 100
Hz/sec. An unphaselocked
492 will exhibit medium-term
drift of about 2 kHz/sec.
Medium-term drift is random
back and forth movement of
the displayed signal after
the instrument has warmed
up.
Incidental FM
(Short-Term
Drift), A phaselocked 492
exhibits 50 Hz incidental
fm,
and a basic 492 exhibits
1 kHz peak-to-peak. Inci-
-60
+-H-
dental fm (caused by
short-term drift) takes place
in a very short time — often
in milliseconds,
at
the most
in seconds — and it must be
measured in a very short
time as well.
Resolution Bandwidth.
492 resolution bandwidths
are specified at the 6 dB
down points. This specifica-
tion represents the spacing
of two equal amplitude sig-
nals that can be well re-
solved, as illustrated in
figure 5.
Depending on the applica-
tion, other bandwidths may
be of interest: for example,
3 dB, random noise, and
impulse bandwidths. For
most measurements, 492
random noise and impulse
bandwidths are approximately equal to the 6 dB
bandwidth, and the 3 dB
bandwidth is approximately
0.75
of
the 6 dB
bandwidth.
Typical approximations are
given in table
1.
I +n
Typical
Random
Noise
Bandwidth
100
Hz
1 kHz
9.5kHz
100kHz
1 MHz*
Specified 6 dB
Resolution
Bandwidth
±20%
100 Hz
1 kHz
10kHz
100kHz
1 MHz
*The
pulse stretcher must be activated to achieve full impulse bandwidth at 1 MHz resolution setting.
Table 1.
Typical
3dB
Bandwidth
75
Hz
750
Hz
7.5kHz
75kHz
750 kHz
Harmonics and
Intermodulation.
The 492 specifications for
harmonics and intermodulation are based on a
-30
dBm
rf
signal level at
the first mixer. The following
worst-case specifications
relate to the level referenced
to the rf signal (in dBc):
Harmonic
Products
—
-60dBc
Third-Order Intermodu-
lation —
-70dBc
The distortion-tree dynamic
Typical
Impulse
Bandwidth
100
Hz
1 kHz
9.5kHz
100kHz
800kHz"-
Optimal distortion-free
dynamic range occurs when
the distortion products
equal the sensitivity noise
level (n) in dBm.
For the 492 with preselector
at 100 Hz resolution, n =
-118
dBm for fundamental
conversion. Thus,
S0 =
(N-1)
N
=
(2)5
+(-118) = -36 dBm,
and
range for any input level can
be computed from the inter-
cept point equation:
I =
_A_
+ S, where
N-1
I = Intercept point in dBm.
A = Distortion level relative
to input carriers in dB.
N = Distortion order numbers.
S = Input signal level to the
mixer in dBm*
For second-harmonic distortion,
I =
60_ + (-30) = +30
dBm.
2-1
For third-order distortion,
I =
70_ + (-30) = +5
dBm.
=
(2)
Best distortion-free dynamic
range for closely spaced
signals is 82 dB. Inter-
modulation dynamic range
reaches 100 dB for signal
spacings greater than
100 MHz
21 GHz frequency range.
"Input level to the mixer is spectrum analyzer
input level
+10 dBm input with 30 dB of rf attenuation is
a mixer input level of +10-30 = -20 dBm.
N
(123)
=82
3
for
the
lessrf
attenuator level. Thus, a
dBc.
1.7
3-1
to
13
Page 14

Interpreting the
specifications
x
ir
1 M
10k
100
coa
HzE
Hzd
Hzb
W
W
W
-30
-40
-50
-60
-70
m
pn
•o
-90
-110
-120
1 10
Sensitivity showing average noise level
492 (Option 01).
Figure 6
Sensitivity.
Sensitivity for a preselected
492 (Option 01) is shown in
figure 6.
Note that, although a non-
preselected 492 has 5 dB
lower input loss, and therefore 5 dB better sensitivity,
the spurious-free dynamic
range of the preselected in-
strument is superior.
Sensitivity is specified in
terms of the smallest observable signal, and is
therefore determined by
spectrum analyzer internal
noise level. Noise level de-
pends on resolution bandwidth and local oscillator
mixing multiplication
number. (Refer to figure 6.)
pu
t
i^J-
r
J^k
r
_r
—
1~
^
Input Frequency (GHz)
fora
preselected
Dynamic Range.
On-screen dynamic range of
the 492 is 80 dB at a vertical
display scale factor of
10dB/div.
Intermodulation distortion
dynamic range for signals
spaced closer than 100 MHz
is consistent with on-screen
dynamic range at 80 dB.
For small signals or modula-
tion components next to a
large carrier, the dynamic
range can be considerably
greater. Limiting factors are
resolution bandwidth filter
shape, phase noise side-
band characteristics, and
input overload capability.
For resolution bandwidths
wider than 10 kHz, filter
shape is the limiting factor.
Figure 7 shows a 100 kHz
vavf
\
ipttt
uid
i
; -
-»-
resolution bandwidth filter
that exhibits 1.1 MHz
bandwidth at 80 dB down.
Phase noise sidebands are
the limiting factor closer in.
Figure 8 shows the same
signal with a 1 kHz resolution
bandwidth filter.
100
.
Note that the phase noise
sideband pedestal breaks
out at 70 dB down, dropping
to
75
dB
down
at
20
kHz
offset from the carrier. This
allows easy observation of
close-in sidebands 10 kHz
out and 70 dB down.
IEF
-10
;
100
76
50
75
50
25
I
I
1
__
Figure 7
ill.
:
MHz
t
,
,V,
, , , ,
..L..I._I •
-...<--! .1 1
80 d
Be
-20
-30
-40
-20
-30
-<0
i
^50
-60
-70
I
D
G
dB
i i
14
Page 15

Sensitivity.
Dynamic Range.
Amplitude Accuracy.
Reference Level.
-10
-20
-30
-40
-50
-60
-70
-80
-90
-100
-110
-120
-130
-140
Typical filter shape, phase noise sidebands, and sensitivity factors
for fundamental mixing on a preselected 492 (Option 01).
Figure 9
1
10 100
Offset Frequency (kHz)
1,000
10,000
Figure 8
Figure 9 shows typical filter
shape, phase noise side-
bands, and sensitivity fac-
tors for fundamental mixing
on a preselected 492 (Op-
tion 01).
Amplitude Accuracy.
The amplitude reference for
the
492
is
a -20dBm,
100 MHz calibrator. The
amplitude accuracy of this
signal is
±0.3dB.
Factors
affecting measurement ac-
curacy depend on input sig-
nal frequency and amplitude
as follows.
"Flatness and accuracy specifications
not apply to the
attenuator positions between 19 and
20
GHz.
30,
40, 50, and 60 dB
dc
rf
Frequency response per
band.
The frequency response for
the first band is referenced
to
the
100
MHz calibration
point.
A band-to-band reference
error of 1 dB must be added
to the per-band frequency
response specifications
when the instrument is operating outside the first band.
Amplitude measurement
error resulting from frequency response depends
on the frequency of the in-
coming
signal.*
Approxi-
mately ±1 dB is contributed
by the preselector (Option
01), and the remainder is
contributed by other input
circuits.
A nonpreselected 492 has
almost 1 dB better amplitude
accuracy.
Amplitude Display.
An amplitude display error
of0.4dB/2dB,
and 2 dB/80dB
1 dB/10dB,
occurs
when signal display amplitude is not at the full screen
reference level.
Reference Level.
Gain/attenuation errors are
introduced when the reference level is changed from
the
-20
dBm
calibrator
level.
Absolute reference level in
dBm can be changed in
1
dB
and
10
dB
steps.
Reference level change er-
rors are
±0.5
±0.2dB/1
dB/10
dB,
dB accumulat-
ing to ±1.4dB/60dB, and
±2
dB/90dB.
This error
analysis is worst case, pro-
viding gain and attenuation
are not switched in simul-
taneously. This is normally
prevented by the 492's au-
tomatic reference level
mode.
A -20 dBm calibration level
should preclude having to
switch gain and attenuation
together.
A10
dB
minimum
rf input
attenuation setting during
calibration allows for small
signals that require some
attenuation to provide good
impedance match. The user
also has the option of cali-
brating at -20 dB and zero
dB attenuation by activating
the
MIN
NOISE control.
15
Page 16

Interpreting
the specifications
Relative Reference Level Steps.
0
-2n
„
2
Q
ut
4
=1
to
•a
+l 6
-80
8
10
02
Cumulative maximum absolute amplitude measurement error as a
function of signal amplitude and frequency for a preselected 492
(Option 01) assuming calibration using the internal -20 dBm 100 MHz
reference.
Figure 10
Frequency Range
50kHz-1.8GHz
1.7GHz-5.5GHz
3.0GHz-7.1 GHz
5.4GHz-18.0GHz
15.0 GHz-21.0 GHz
18.0GHz-26.5
26.5GHz-40.0GHz
40.0 GHz-60.0 GHz
"10
dB steps over a 70 dB
"Using
optional
Achievable amplitude accuracy for a preselected 492 is shown above.
Table 2.
rlBm
ff
4
dBm
sign;
4 6 8 10 12 14 16 18 20 22 24 26
±dB
GHz**
accessory
ji
sinn
1-
-4i
Measurement Frequency (GHz)
Frequency
Response
range
high
performance
Max.
1.5
2.5
2.5
3.5
5.0
3
3
3
IF Gain*
Variation
±dB
mixers
Max.
0.5
0.5
0.5
0.5
0.5
0.5
0.5
0.5
Calibrator
Output
±dBMax.
0.3
0.3
0.3
0.3
0.3
0.3
0.3
0.3
±dB
Total
2.3
3.3
3.3
4.3
5.8
3.8
3.8
3.8
Max.
Relative Reference Level
Steps.
The 0.25 dB steps are ena-
bled in the 2 dB/div vertical
mode when "Fine" steps are
selected. These steps are
used for accurate relative
Typical accuracy limits in
each band for a preselected
492 are summarized in table
2. Worst case accuracy
limits including band-toband error of 1 dB are illus-
trated in figures 10 and
amplitude difference measurements. The total measurement range is 50 dB,
with an accuracy of
0.05 dB/0.25dB,
0.4dB/2dB,1
and
2 dB/50 dB.
dB/10dB,
OdB'ref
50 d 3 ref
level
evel
ciang
;han
je
10
24
6 8 10 12 14 16 18 20 22 24 26
Cumulative maximum error in measurement of relative amplitude of
two signals as a function of reference
separation,
Figure 11
fora
Frequency Difference (GHz)
pre-selected
level
492 (Option
change and frequency
01).
11.
16
Page 17

Option
Configurations
Two basic models of spectrum analyzer are available,
the 492 Spectrum Analyzer
and the 492P Programmable
Spectrum Analyzer. You can
order either model with any
combination of the available
performance options and
optional accessories to con-
figure the instrument for your
requirements.
The 492P is fully compatible
with the IEEE-488 interface
bus (GPIB) and can be operated through any control-
ler capable of interfacing
through the bus, especially
the Tektronix 4050 Series
systems. All important front
panel controls function
digitally and can be oper-
ated by the controller. Thus,
the 492P not only transmits
data to the controller, but
may be programmed by that
controller. A remote/local
switch
on
the
492P
front
panel provides for local,
manual control of the
analyzer, overriding program control.
The front panel may also be
locked out by the controller
for testing situations in
which the possibility of local
control might invalidate
measurement results.
For general use spectrum
analysis, optimum performance may be obtained with
the inclusion of Options
02, and 03.
01,
Option 01 — Internal
Preselection.
With this option, internally
generated image and har-
monic mixing spurious re-
sponses are effectively
eliminated. This results in a
display that is much easier
to interpret. In the frequency
range
of
50
kHz
to
1.7
GHz,
a low-pass filter is used to
limit spurious responses. In
the range of
21 GHz, a
selector is used. Internal
calibrated preselection re-
duces the requirement to
examine each signal to ver-
ify authenticity.
Measurement capability is
enhanced with Option 01 by
an increase in dynamic
range from 80 dB in the
basic analyzer to
signals separated by
MHz). This is because the
automatic tracking pre-
selector rejects signals out-
side its bandwidth by 70 dB
or more.
Option 01 also includes
a
limiterto
dBm
input protection to the
first mixer
Above
mixer is protected by the
preselector.
1.7
GHz
tracking
provide +30
up
to
1.7
1.7
GHz the input
YIG
100
GHz.
to
pre-
dB (for
100
Option 02
—Digital
Storage.
Spectra may be digitized with
500 point resolution and held
in one of two memories, A or
B—or
in a
1000
point memory created by combining A
and B. Once in memory
spectra may be displayed
with a bright flicker free trace,
making prolonged viewing or
photography
cially for single sweep or slow
sweep speeds. Digital storage also adds several internal
data processing features:
Digital averaging — Data at
each frequency point in
memory is summed and divided by the number of
samples at that frequency.
Peak Detection — Data at
each frequency point is
continuously updated with
peak-detected values.
Digital
able cursor allows the
operator to obtain a com-
bined peak/average display
— data above the cursor is
shown peak-detected, data
below the cursor is averaged.
With MAX HOLD mode, the
highest amplitude attained at
each of the
easy—espe-
cursor — An adjust-
1000
points dur-
ing successive sweeps
stored and displayed. This
mode is useful for measuring
peak-to-peak drift over a time
interval or in making swept
response measurements of
filters without a tracking
source.
With SAVE A mode, one sig-
nal is stored in the A memory
for later examination. This in-
formation is not updated and
is useful in instances of later
comparison with other signal
information.
SAVE A
In
mode,
the B MINUS
the A signal is
is
stored and not updated, then
arithmetically subtracted from
the B signal, which may be
continually updated. This
mode is most useful for comparing signals such as in production test comparison of a
signal with a standard, or for
calibrating frequency re-
sponse uncertainty out of a
measurement.
17
Page 18

Ordering Information
With
the AVERAGE mode,
the display is divided by a
horizontal cursor. Above the
moveable cursor, signals
are peak detected and dis-
played. Below the cursor,
signals are averaged. Av-
eraging is useful for applications in which signals
must be
presence of high noise
levels. The trace smoothing
that occurs through av-
eraging simplifies the
process.
Digital averaging and video
filtering may be used jointly
or independently depending
on the nature of the signal.
In
age, slowly swept signals are
easy to observe and photo-
graph, and do not require
intensity or other display readjustments.
Option 03 — Frequency
Stabilization/100 Hz
analyzed
addition,
in the
with digital stor-
Resolution.
With this option, phase-
locked local oscillator
stabilization provides ex-
ceptional display stability
and low noise sidebands,
18
and results in less frequency
drift and less residual
Thus, the 492 user can ob-
serve and measure characteristics of lower modulation
frequencies. As part of Op-
tion 03, improved resolution
(100 Hz) and narrow span of
500 Hz/Div. provide increased measurement
fm.
capability for close in
sideband analysis. The
special purity of clean
oscillators may thus be
measured directly at micro-
wave frequencies. The 492
retains its one knob center
frequency control with Constant Tuning
even with
Option 03 is recommended
when the 492 will be used at
spans less than 50 kHz per
division, and is required for
spans of less than 10 kHz
per division. Phaselock occurs automatically and is a
function of the setting of the
span/div control. For con-
venience in operating the
analyzer in fixed tuned receiver (zero span) mode,
phaselock may be deacti-
vated by a front panel
control.
Option 08 — Delete
Rate(CTR)
phaselock.
External Mixer Capability.
Option 08 deletes external
mixer capability for extending frequency range above
21
GHz.
Option 20 — General Pur-
pose 12.5 GHz to 40 GHz
Waveguide Mixer Set.
This option extends the op-
erational upper frequency of
the
492
or
492P
to
40
GHz.
The actual waveguide range
is
12.5
to
40
GHz. This op-
tion package, designed to
provide economical use of
the analyzer at frequencies
above 21 GHz, consists of
three waveguide mixers and
a connecting coaxial cable.
Option 21 — High Per-
formance 18 GHz to
40 GHz Waveguide
Mixer Set.
This option consists of two
waveguide mixers and a
coaxial cable, and extends
the operational upper fre-
quency of the 492 or 492P to
40 GHz. The actual wave-
guide range is 18 to 40 GHz,
and the mixers are designed
so that, in operation with the
analyzer, the system is calibrated in amplitude, flat-
ness, and sensitivity.
Option 22 — High Per-
formance 18 GHz to
60 GHz Waveguide
Mixer Set.
This option consists of three
waveguide mixers and a
connecting coaxial cable,
and extends the operational
upper frequency of the 492
or 492P to 60 GHz. The ac-
tual waveguide range is 18
to 60 GHz, and the mixers
are designed so that, in op-
eration with the analyzer, the
system is calibrated in
amplitude, flatness, and
sensitivity.
Page 19

Combined
options.
The basic 492 Spectrum
Analyzer or the basic 492P
Programmable Spectrum
Analyzer may be ordered with
many combinations of op-
tions and optional acces-
sories. The prices are additive
(except for one delete option,
Option 08, which deletes ex-
ternal mixer capability). Note
that the standard accessories
are listed only once (with the
basic 492), but that one set is
included with either spectrum
analyzer.
Also listed with the 492P are
the companion 4052 Graphic
Computing System Controller,
4631 Hard Copy Unit, 4662
Interactive Digital Plotter and
4924 Digital Cartridge Tape
Drive.
492 Spectrum
Including the following listed standard accessories: Diplexer Assem-
bly
(015-0385-00);
Cable, N to N Connectors, 6 foot
(012-0114-00);
BNC to BNC
(1)
(012-0076-00);
to BNC Female (1) (103-0045-00);
CRT
Mesh Filter
Fuse 2 A, Fast Blow (1)
0021-00);
(159-0017-00); Power Cord,
(1)
(161-0118-00);
(343-0170-00);
Blue
(1)
Filter, Amber
CRT Light Filter,
0115-02);
0653-00); Operator's Manual
Operator's Handbook
Service Manual, Volume 1
Service
492P Programmable Spectrum
Analyzer
Including Programmers Manual
and the listed standard 492
accessories.
Analyzer
50
50 n Coaxial Cable,
Connectors',
Adapter, N Male
(1)
(378-0726-01);
Fuse 4 A
(378-0115-00);
CRT
Manual,
.............
Fast
Cord
CRT Light Filter,
(1)
(378-0115-00);
Gray
Visor
(1)
Volume 2 (2).
$18,500.00
fi
Coaxial
18
inch
(159-
Blow
115-V
Clamp
CRT Light
(1)
(378-
(016-
(1);
(1);
(1);
$22,500.00
(1)
(2)
(1)
and
4052 Graphic Computing System
Controller
4631 Hard Copy Unit
4662 Interactive Digital
Plotter
4924 Digital Cartridge Tape
Drive
............
..
...............$
................$
$10,950.00
$ 4,850.00
4,495.00
2,695.00
Option Ordering
Information.
Option
01—Internal
Preselection
Provides calibrated preselected
filtering of input to first mixer for
each frequency band.
Option
Storage Add
Provides multiple memory display
storage with SAVE A, MAX HOLD, B
MINUS SAVE A, display average,
and storage bypass.
Option
Stabilization/100 Hz
Resolution
Provides first local oscillator stabili-
zation by phaselocking the oscil-
lator to an internal reference. Also
provides 100 Hz resolution.
Option
Capability
Deletes internal switching front
panel connector and external di-
plexer to connect and use external
waveguide mixers.
Option
to 40 GHz Waveguide Mixer
Set Add $520.00
Includes three mixers (12.4 to 18
GHz,
18
40 GHz) and attaching hardware to
extend the 492 upper frequency.
Option
to 40 GHz Waveguide Mixer
Set Add 1,970.00
Includes two mixers (18 to 26.5 GHz
and 26.5 to 40 GHz) and attaching
hardware to extend the 492 upper
frequency.
Option
to 60 GHz Waveguide Mixer
Set
Add $3,220.00
Includes three mixers
GHz, 26.5
GHz) and attaching hardware to
extend the 492 upper frequency.
.......
Add
$3,800.00
02—Digital
$1,700.00
03—Frequency
........
08—Delete
....
20—General-Purpose
to
26.5
21—High
22—High
to
GHz,
Add
$3,250.00
External Mixer
Subtract
GHz,
and 40 to 60
$1,250.00
and
26.5
Performance
Performance
(18
to 26.5
12.5
to
18
18
Optional Accessories
The following listed accessories are
optional with all models and config-
urations of the 492 system, and may
be ordered in any combination.
General Purpose
Waveguide Set
(016-0656-00)
12.4
to
18
(119-0097-00)
18.0
to
26.5
(119-0098-00)
26.5
to
40
(119-0099-00)
Cable
(012-0748-00)
Case
(004-1651-00)
High Performance
Waveguide Mixer Set
(016-0662-00)
18
to
26.5
(016-0631-01)
26.5
to
40
(016-0632-01)
Cable
(012-0649-00)
Case
(004-1651-00)
High Performance
Waveguide Mixer Set
(016-0657-00)
18
to
26.5
(016-0631-00)
26.5
to
40
(016-0632-00)
40
to 60 GHz Mixer
(016-0634-01)
Cable
(012-0649-00)
Case
(004-1651-00)
Microwave Comb Generator
(067-0885-00)
C-5C
Camera
TV Trigger Synchronizer
(015-0261-00)
Hard Case (transit)
(016-0658-00)
Soft
Case
12.5
to
.........$
GHz Mixer
.........
GHz Mixer
.........
GHz Mixer
.........
... 20.00
....
18
to
.........
GHz Mixer
.........
GHz Mixer
.........
... 25.00
....
18
to 60 GHz
.........
GHz Mixer
.........
GHz Mixer
.........
.........
... 25.00
....
.........
.........
.........
.........
(016-0659-00)
40
GHz
550.00
150.00
190.00
220.00
35.00
40 GHz
$2,005.00
975.00
975.00
35.00
$3,255.00
925.00
925.00
1,250.00
35.00
$1,800.00
425.00
360.00
495.00
125.00
Note: The 492 Spectrum Analyzer
system is compatible with all
Tektronix C50 Series
cameras.
19
Page 20

For the address of your nearest
Tektronix Field Office, contact:
U.S.A., Asia, Australia, Central & South
America, Japan
Tektronix,
Inc
P.O.
Box
1700
Beaverton, OR
Phone: 800/547-1512
Oregon only
503/644-0161
Telex: 910-467-8708
Cable: TEKTRONIX
Europe,
Middle East
Tektronix International, Inc.
European Marketing Centre
Postbox827
1180 AV Amstelveen
The Netherlands
Telex: 18312
Canada
Tektronix Canada Inc.
P.O.
Barrie, Ontario
Phone: 705/737-2700
Tektronix Distributors to serve you
around the world:
Argentina, Australia, Austria, Belgium,
Bolivia,
Costa Rica, Denmark, East Africa,
Egypt, El Salvador, Federal Republic of
Germany, Finland, France, Greece, Hong
Kong, Iceland, India, Indonesia, Iraq, Israel,
Italy, Ivory Coast, Japan, Jordan, Korea,
Kuwait, Lebanon, Malaysia, Mexico,
Morocco, The Netherlands, New Zealand,
Norway, Pakistan, Panama, Peru,
Philippines, Portugal, Republic of South
Africa, Saudi Arabia, Singapore, Spain,
Sri Lanka, Sudan, Surinam, Sweden,
Switzerland,
Turkey, Tunisia, United Kingdom, Uruguay,
Venezuela, Zambia.
97075
800/644-9051
Africa,
Box
6500
L4M
4V3
Brazil, Canada, Chile, Colombia,
Syria, Taiwan, Thailand,
Ecuador,
Copyright © 1980, Tektronix, Inc. All rights
reserved. Printed in U.S.A. Tektronix products are covered by U.S. and foreign pa-
tents,
issued and pending. Information in
this publication supersedes that in all previously published material. Specification
and price change privileges reserved.
TEKTRONIX, TEK, SCOPE-MOBILE, and
&jl
are registered trademarks of Tektronix,
Inc.
TELEQUIPMENT is a registered
trademark of Tektronix U.K. Limited. For
further information, contact: Tektronix, Inc.,
P.O. Box 500, Beaverton, OR 97077.
Phone:
503-644-0161;
Cable:
Tektronix. Subsidiaries and distrib-
utors worldwide.
TWX 910-467-8708;
Performance
worth the
___name
Tektronix
COMMITTED TO EXCELLENCE
5/80
 Loading...