

Page 1
I
I
I
I
I
I
I
I
. Tektronix, Inc.
P.O.
Box
500
Beaverton, Oregon
97077
070·2163
·00
TEKTRONIX®
47E5A
DSCILLDSCDPE
AND
DM44
DIGITAL
MULTIMETEA
PEA
INSTRUCTION
MANUAL
Serial Number
___
Fi
rst Printing AUG. 1976
Page 2
WARRANTY
All
TEKTRONIX
instruments
are
warranted
against
defective
materials
and
workmanship
for
one
year.
Any
questions
with
respect
to
the
warranty
should
be
taken
up
with
your
TEKTRONIX
Field
Engineer
or
representative.
All
requests
for
repairs
and
replacement
parts
should
be
directed
to
the
TEKTRONIX
Field
Office
or
representative
in
your
area.
This
will
assure
you
the
fastest
possible
service. Please
include
the
instrument
Type
Number
or
Part
Number
and
Serial
Number
with
all
requests
for
parts
or
service.
Specifications
and
price
change
privileges
reserved.
Copyright
© 1976
by
Tektronix,
Inc.,
Beaverton,
Oregon.
Printed
in
the
United
States
of
America.
All
rights
reserved.
Contents
of
this
publication
may
not
be
reproduced
in
any
form
without
permission
of
Tektronix,
Inc.
U.S.A.
and
foreign
Tektronix
products
covered
by
U.S.
and
foreign
patents
and/or
patents
pending.
TEKTRONIX
is a
registered
trademark
of
Tektronix,
Inc.
I
I
I
I
I
I
I
I
I
Page 3
I
I
I
I
I
I
I
I
I
TABLE OF
CONTENTS
Page
LIST
OF
ILLUSTRATIONS
iv
BASIC
OSCILLOSCOPE
DISPLAYS
LIST
OF
TABLES
v
NORMAL
SWEEP
DISPLAY
MAGNIFIED
SWEEP
DISPLAY
BEFORE
OPERATING
1
DELAYED
SWEEP
DISPLAY
INTRODUCTION
MIXED
SWEEP
DISPLAY
SAFETY
INFORMATION
1
X-Y
DISPLAY
OPERATING
VOLTAGE
1
SINGLE
SWEEP
DISPLAY
Line
Voltage
Selection
2
Regulating
Range
Selection
2
DM44
DISPLAYS
AND
MEASUREMENTS
OPTIONS
3
RESISTANCE
CONTROLS,CONNECTORS,AND
VOLTS
INDICATORS
4
TEMPERATURE
VERTICAL
4
Accuracy
Check
DISPLAY
7
TIME
AND
1/TIME
DM44
7
TRIGGER
8
HORIZONTAL,
CALIBRATOR,
AND
POWER
12
APPLICATIONS
AND
MEASUREMENTS
REAR
PANEL
14
PRELIMINARY
LEFT SIDE
PANEL
14
Signal
Ground
RIGHT
SIDE
PANEL
14
Input
Coupling
Capacitor
Precharging
@
475A/DM44
Operators
Page
16
16
17
17
18
18
19
20
20
22
24
24
27
28
28
28
28
Page 4
TABLE OF
CONTENTS
(cont)
APPLICATIONS
AND
MEASUREMENTS
(cont)
Page
APPLICATIONS
AND
MEASUREMENTS
(cont)
Page
OPERATOR'S ADJUSTMENTS
AND
CHECKS
29
PHASE DIFFERENCE MEASUREMENTS
42
Trace Rotation
29
HIGH
RESOLUTION PHASE DIFFERENCE
Probe Compensation
29
MEASUREMENTS
43
Vertical Gain Check
30
PULSE JITTER MEASUREMENTS
44
Basic 475A
Timing
Check
30
DELAYED OR MIXED SWEEP
DM44
Timing
Check
30
MAGNIFICATION
45
External Horizontal Gain Check
31
Magnified Sweep Starts
After
Delay
45
PEAK-TO-PEAK VOLTAGE
Triggered
Delay Sweep
Magnification
46
MEASUREMENTS-AC
31
INSTANTANEOUS
VOLTAGE
BASIC
475A DELAYED OR
MIXED
SWEEP
TIME
MEASUREMENTS-DC
32
ALGEBRAIC
ADDITION
34
MEASUREMENTS
48
COMMON MODE REJECTION
35
TIME
DIFFERENCE BETWEEN REPETITIVE
AMPLITUDE
COMPARISON
PULSES (BASIC
475A) 48
MEASUREMENTS
36
TIME DURATION MEASUREMENTS
TIME-DURATION
MEASUREMENTS
37
(BASIC 475A) 49
FREQUENCY
MEASUREMENTS
38
FREQUENCY MEASUREMENTS (BASIC 475A)
50
RISETIME MEASUREMENTS
39
TIME
DIFFERENCE BETWEEN TWO PULSES
TIME DIFFERENCE
BETWEEN TWO
. FROM DIFFERENT SOURCES (BASIC
475A)
51
PULSES FROM DIFFERENT SOURCES
40
RISETIME (BASIC
475A)
52
TIME COMPARISON MEASUREMENTS
41
MIX (BASIC 475A)
53
Ii
475A1DM44 Operators
@
I
I
I
I
I
I
I
I
I
Page 5
I
TABLE OF
CONTENTS
(cont)
I
DM44
DELAYED
OR
MIXED
SWEEP
TIME
Page
OPERATOR
'S
SPECIFICATIONS
(cont)
Page
MEASUREMENTS
54
I
TIME
DIFFERENCE
BETWEEN REPETITIVE Z
AXIS
INPUT
65
PULSES
(DM44)
56
OUTPUTS
65
TIME
DURATION
MEASUREMENTS
(DM44)
57
AC
POWER
SOURCE
65
I
FREQUENCY
MEASUREMENTS
(DM44) 58
ENVIRONMENTAL
65
TIME
DIFFERENCE
BETWEEN
TWO
PULSES
DM44
DIGITAL
MULTIMETER
66
FROM
DIFFERENT
SOURCES
(DM44)
58
RESISTANCE
66
I
RISETIME
(DM44)
60
TIME
66
MIX
(DM44)
61
1/TIME
66
TEMPERATURE
66
OPERATOR'S
SPECIFICATIONS
62
DC
VOLTAGE
66
I
475A
OSCILLOSCOPE
62
VERTICAL
62
TRIGGERING
63
ACCESSORIES
68
I
DIFFERENTIAL
TIME
MEASUREMENT
STANDARD
ACCESSORIES
68
(BASIC
475A)
63
OPTIONAL
ACCESSORIES
68
DIFFERENTIAL
TIME
MEASUREMENT
I
(DM44)
64
HORIZONTAL
64
OPTIONS
69
X-Y
64
OPTION
4
69
I
CALIBRATOR
64
OPTION
7
69
@
475A/DM44
Operators
ill
Page 6

LIST OF
ILLUSTRATIONS
I
Page
Page
I
Fig.
1.
Regulating
range
selector
and
line
Fig. 17.
Common-mode
rejection.
36
fuse.
3
Fig. 18.
Time
duration.
38
I
Fig. 2.
Vertical
controls,
connectors,
and
Fig. 19. Risetime.
39
indicators.
4
Fig.
20.
Time
difference
between
two
pulses
Fig.
3.
Display
and DM44
controls,
from
different
sources. 40
connectors,
and
indicators.
6
Fig. 21.
Phase
difference.
43
I
Fig.
4.
Trigger
controls,
connectors,
and
Fig. 22.
High-resolution
phase
difference.
43
indicators
.
8
Fig. 23.
Pulse jitter.
44
Fig . 5.
Trigger
controls, connectors,
and
Fig.
24.
Delayed sweep
magnification.
46
I
indicators.
10
Fig. 25.
Time
difference
between repetitive
Fig.
6.
Horizontal,
calibrator,
and
power
pulses. 49
controls,
connectors
, and
indicators.
12
Fig. 26.
Time
duration.
50
Fig.
7.
Rear panel and left side panel
controls,
Fig. 27.
Time
difference
between
two
pulses
I
connectors,
and
indicators.
15
from
different
sources.
51
Fig.
8.
Resistance.
21
Fig. 28. Risetime .
53
Fig.9.
Volts.
23
Fig. 29.
Time
difference
between repetitive
I
Fig. 10.
Temperature.
25
pulses.
56
Fig. 11.
Probe
compensation
.
29
Fig. 30.
Time
duration
and
frequency
Fig. 12.
Basic
475A
timing
check
.
30
measurements
.
57
Fig. 13.
DM44
timing
check
.
31
Fig. 31.
Time
difference
between
two
pulses
I
Fig.
14.
Peak-to-peak voltage
of
a waveform.
32
from
different
sources.
59
Fig. 15.
Instantaneous
voltage
measurements.
33
Fig. 32. Risetime.
60
Fig.
16.
Algebraic
addition.
35
I
@
iv
475A/DM44
Operators
Page 7
I
LIST OF TABLES
I
Page
Page
TABLE 1 Regulating
Ranges
2
TABLE 4 Centigrade
to Fahrenheit
Conversion
26
I
TABLE
2 Resistance Ranges
20
TABLE
5 DM44 Delayed Sweep
Displays
54
TABLE
3 Volts Ranges
22
I
I
I
I
I
I
@
475A/DM44
Operators
v
Page 8
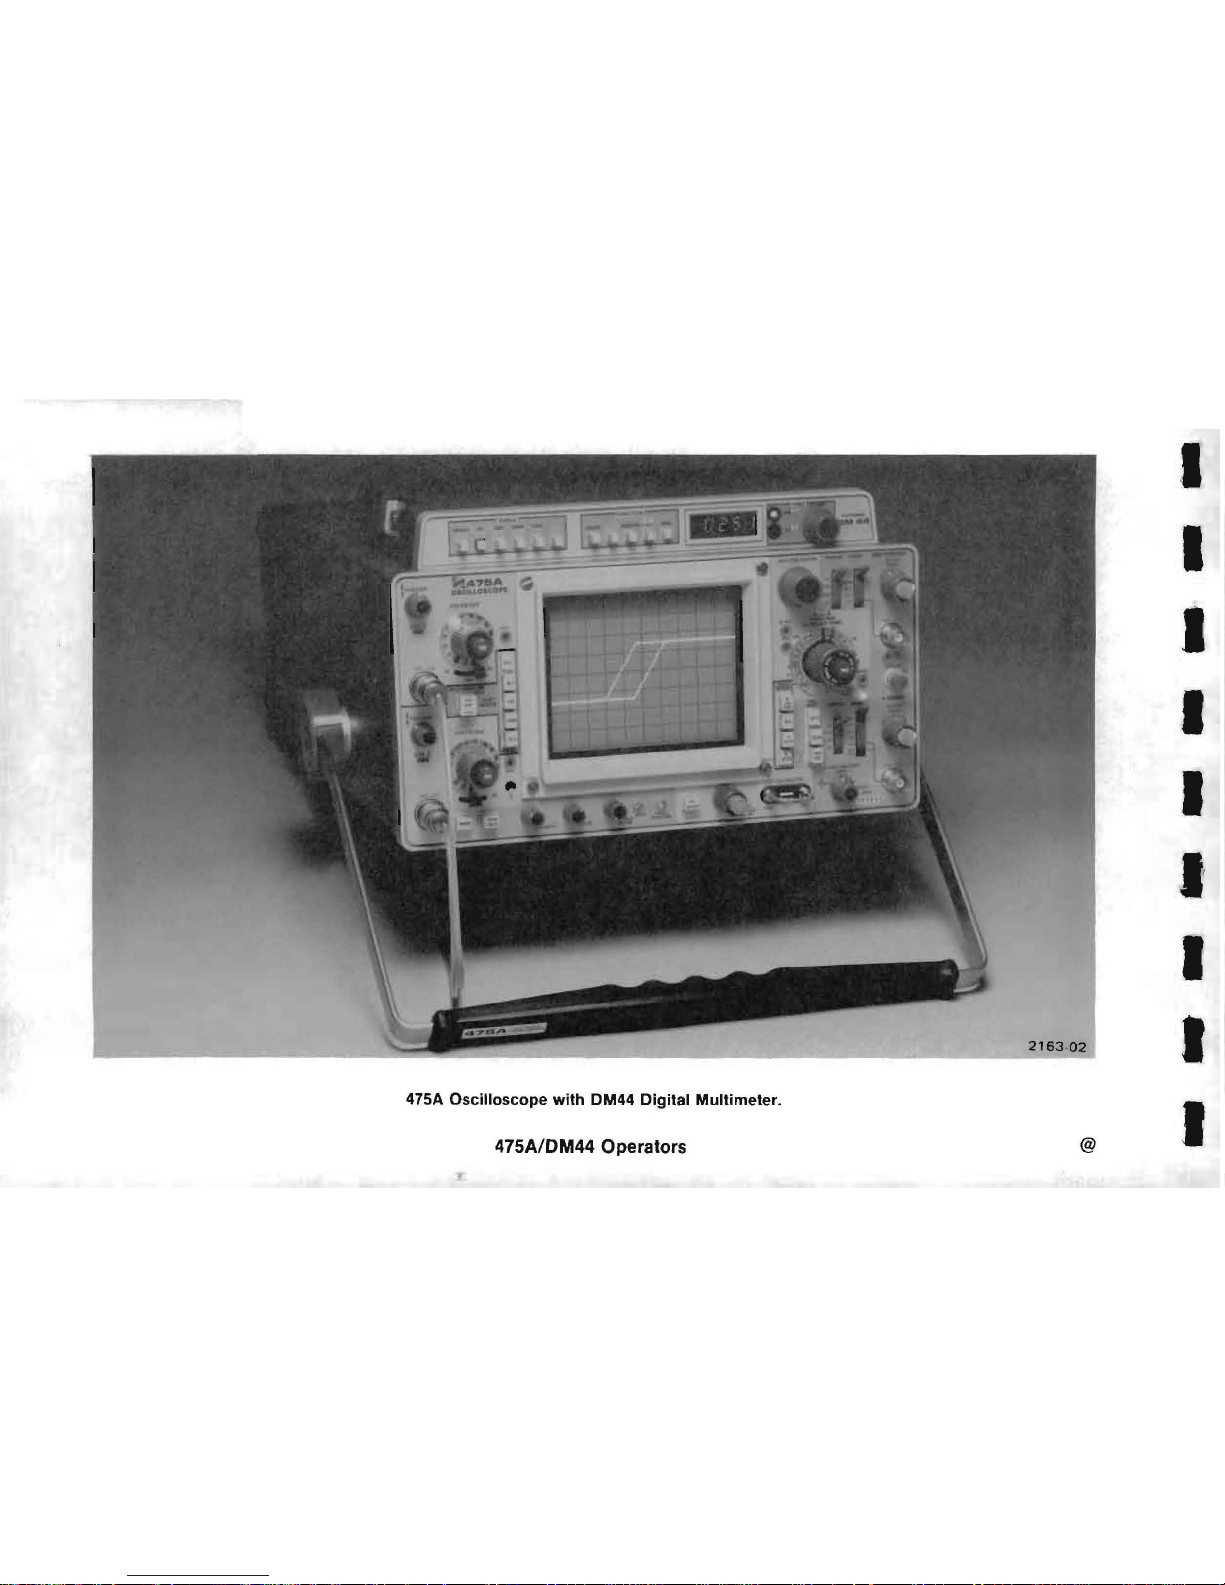
475A
Oscilloscope
with
DM44
Digital
Multimeter.
475A1DM44 Operators
@
I
I
I
I
I
I·
I'
I
I
Page 9
I
I
I
I
I
I
I
I
I
BEFORE
OPERATING
INTRODUCTION
The
Tektronix
475A
Oscilloscope
is a dual-channel
portable
instrument.
The
dual-channel
dc-to-250
MHz
vertical
system
provides
calibrated
deflection
factors
from
5
millivolts
to
10
volts/division. The
sweep
trigger
circuits
are
capable
of
stable
triggering
over the full
bandwidth
capabilities
of
the
vertical
deflection
system .
The
horizon-
tal
deflection
system
provides
calibrated
sweep rates
from
0.5
second
to 0.
01
microsecond/division
along
with
delayed sweep features
for
accurate
relative-time
measurements. A
X10
magnifier
extends
the
calibrated
sweep
rate
to 1 nanosecond/division. The
instrument
operates
over a wide
variation
of
line
voltages and
frequencies. Maximum
power
consumption
is
about
100
watts
.
The
Tektronix
DM44
Digital
Multimeter
measures 0
ohm
to
20
megohms, 0 dc
volt
to 1200
dc
volts
(+
or
-),
or
(using
the
temperature
probe)
- 55°C to
+150°C. The
measurement
is
displayed
on
a 3-1/2
digital
display
while
the
oscilloscope
operates
normally
.
The
digital
multimeter
and
oscilloscope
combine
to
provide a digital
readout
of
the
time
between
any
two
points
on the
oscilloscope
display.
Both
time
measure-
ment
points
are
displayed
on the
crt
at the same
time. The
1/
TIME
function
can
provide
direct
measurement
of
frequency.
SAFETY
INFORMATION
The
instrument
is
designed
to operate from a
single-
phase
power
source
with
one
of
the
current-carrying
conductors
(the
Neutral
Conductor)
at
ground
(earth)
potential.
Operation
from
power
sources
where
both
current-carrying
conductors
are live
with
respect to
ground
(such as phase-to-phase on a three-wi
re
system)
is
not
recommended, since
only
the Line
Conductor
has
over-current
(fuse)
protection
within
the
instrument.
The
instrument
has a
three-wire
power
cord
with
a
three-terminal
polarized
plug
for
connection
to
the
power
source
and safety-earth.
The
ground
(earth) terminal
of
the
plug
is
directly
connected
to
the
instrument
frame.
For
electric-shock
protection,
insert
this
plug
only
in a mating
outlet
with
a safety-earth
contact.
@
475A/OM44
Operators 1
Page 10
OPERATING VOLTAGE
~
This
instrument
may
be
damaged
if
operated
with
the line voltage
selector
switch
or the
regulating
range
selector
set
for
the
wrong
applied
line voltage
or
if
the
wrong
line fuse is
used
.
Line Voltage Selection
This
instrument
operates from
either
a 115-volt
or
a
230-
volt
nominal
line
voltage
source, 48 to 440 hertz.
To
convert
from
one
nominal
line
voltage
range to the other,
move the Line
Voltage
Selector
switch
(located
on
side
panel) to
indicate
the
correct
nominal
voltage. A 115-to-
230
volt
adapter
may be required
for
the
line-cord
plug
. Be
sure to use the
correct
line fuse for the line
voltage
selected (see
Table 1).
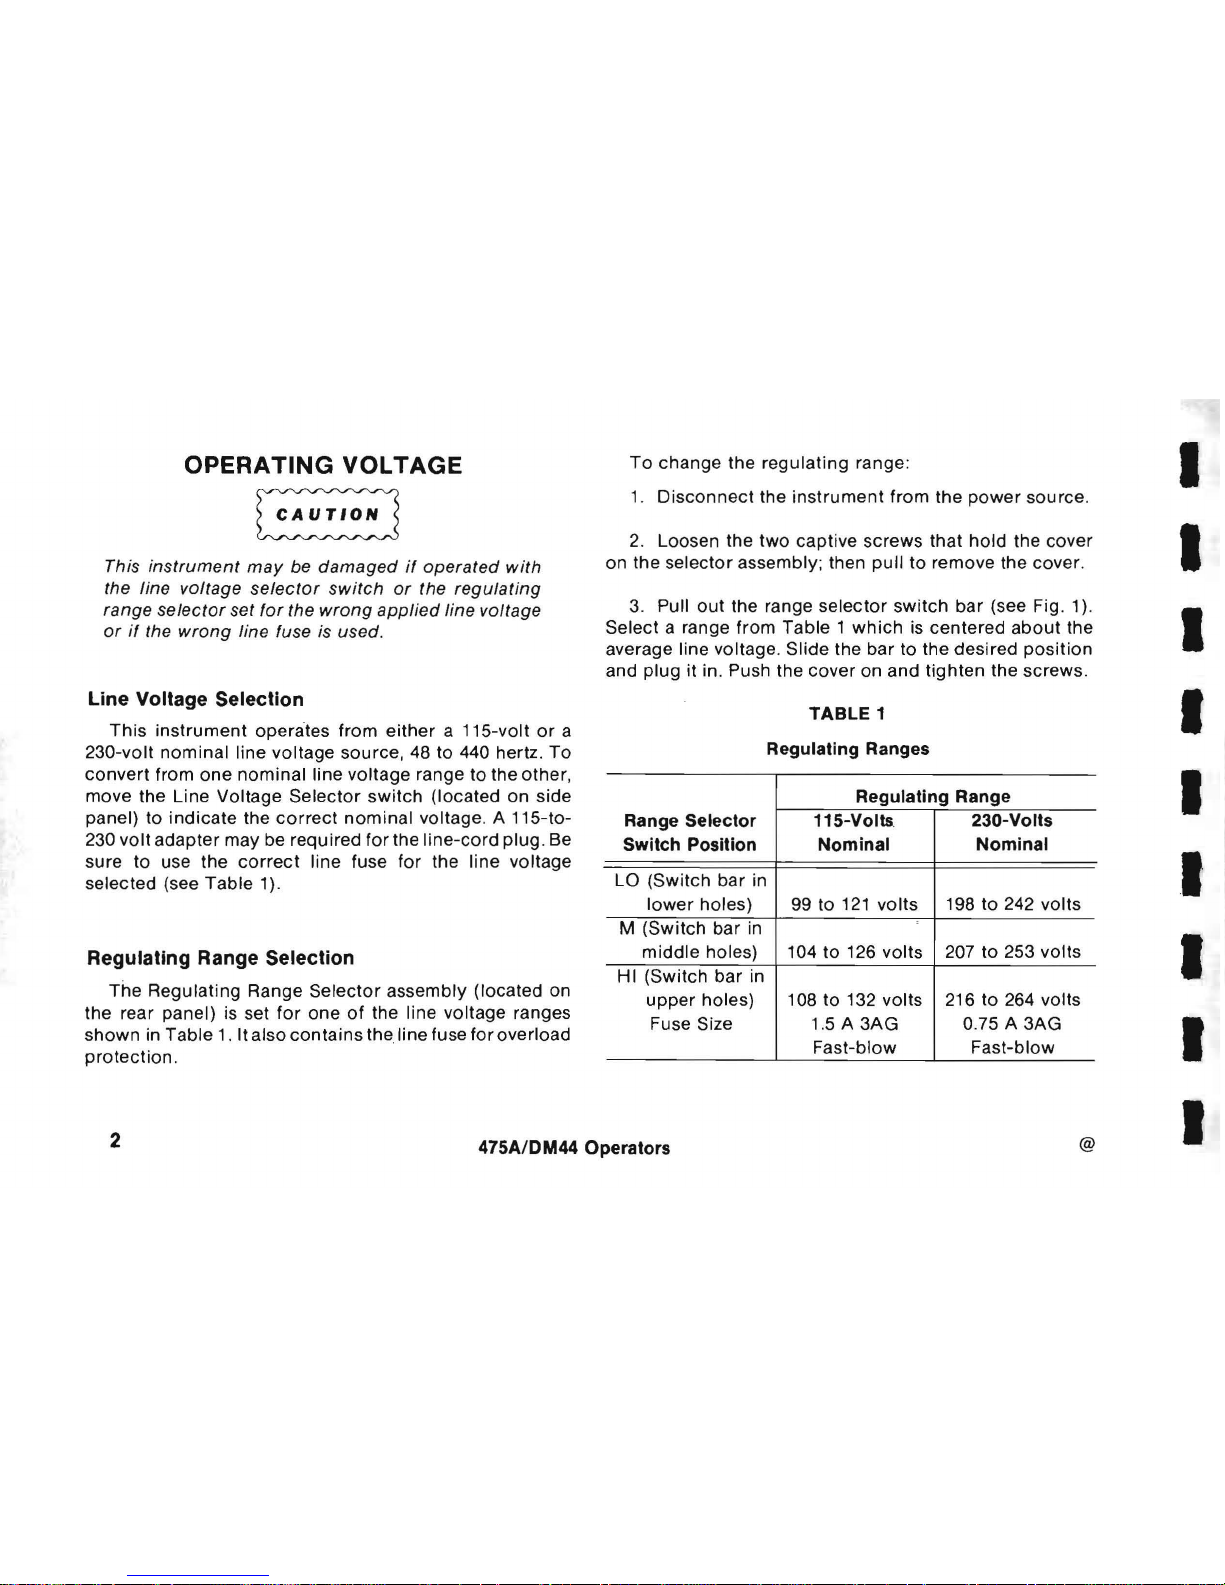
Regulating Range Selection
The
Regulating Range
Selector
assembly (located on
the rear
panel) is set
for
one
of
the line voltage ranges
shown
in Table 1. It also
contains
the
line fuse
for
overload
protection.
To
change
the
regulating
range:
1.
Disconnect
the
instrument
from the
power
source
.
2. Loosen the
two
captive screws
that
hold
the cover
on the
selector assembly; then
pull
to
remove the
cover
.
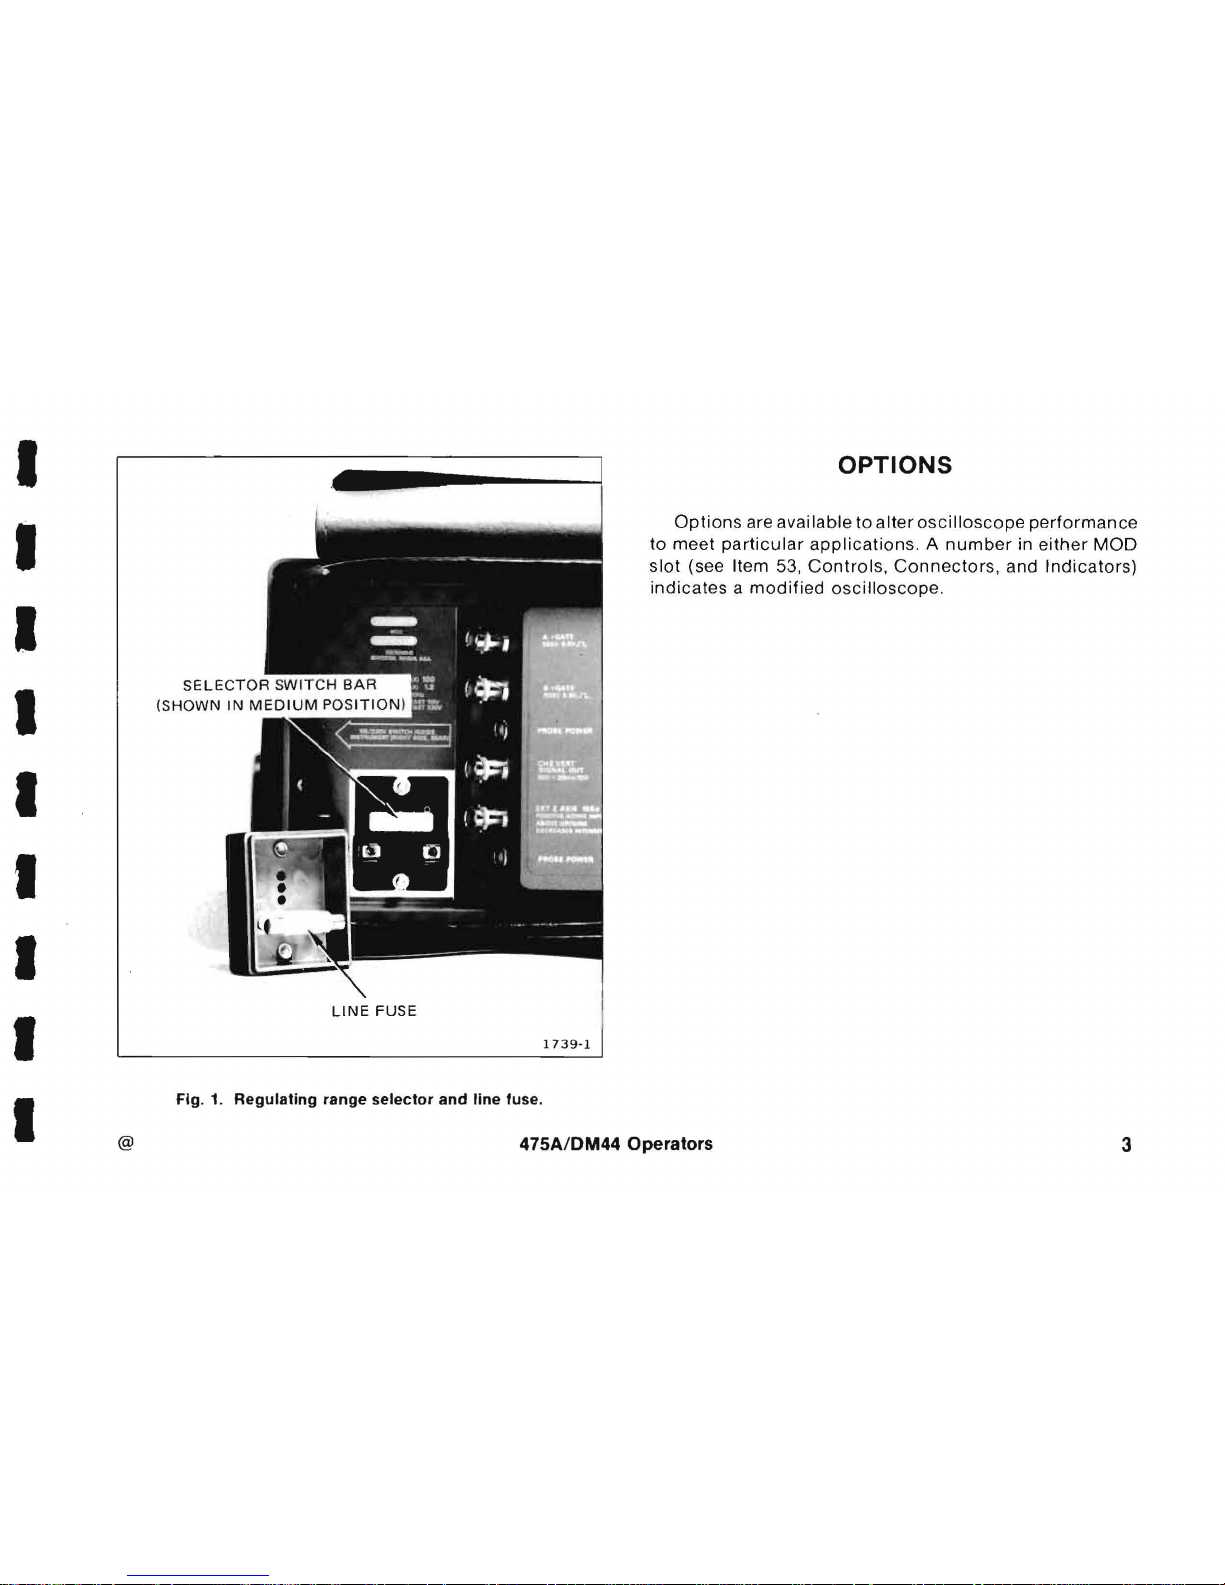
3.
Pullout
the range
selector
switch
bar (see Fig. 1).
Select a range from Table 1
which
is
centered
about
the
average
line voltage . Slide the bar to the desired
position
and
plug
it in. Push the
cover
on and
tighten
the
screws
.
TABLE
1
Regulating Ranges
Regulating Range
Range
Selector
115-Volts. 230-Volts
Switch Position
Nominal Nominal
LO
(Switch bar
in
lower
holes)
99 to
121
volts
198
to
242 volts
M (Switch bar
in
middle
holes) 104
to
126
volts
207
to
253
volts
HI (Switch
bar
in
upper
holes)
108
to
132 volts 216
to
264 volts
Fuse Size
1.5 A
3AG
0.75 A
3AG
Fast-blow Fast-blow
2
475A/DM44 Operators
@
I
I
I
I
I
I
I
I
I
Page 11
I
I
I
I
I
I
I
I
I
@
LINE
FUSE
1739·1
Fig. 1. Regulating range selector and line fuse.
OPTIONS
Options
are available to
alter
oscilloscope
performance
to
meet
particular
applications. A number
in
either
MOD
slot
(see Item 53,
Controls,
Connectors,
and
Indicators)
indicates a modified
oscilloscope.
475A/OM44
Operators
3
Page 12
4
CONTROLS,
CONNECTORS
AND
INDICATORS
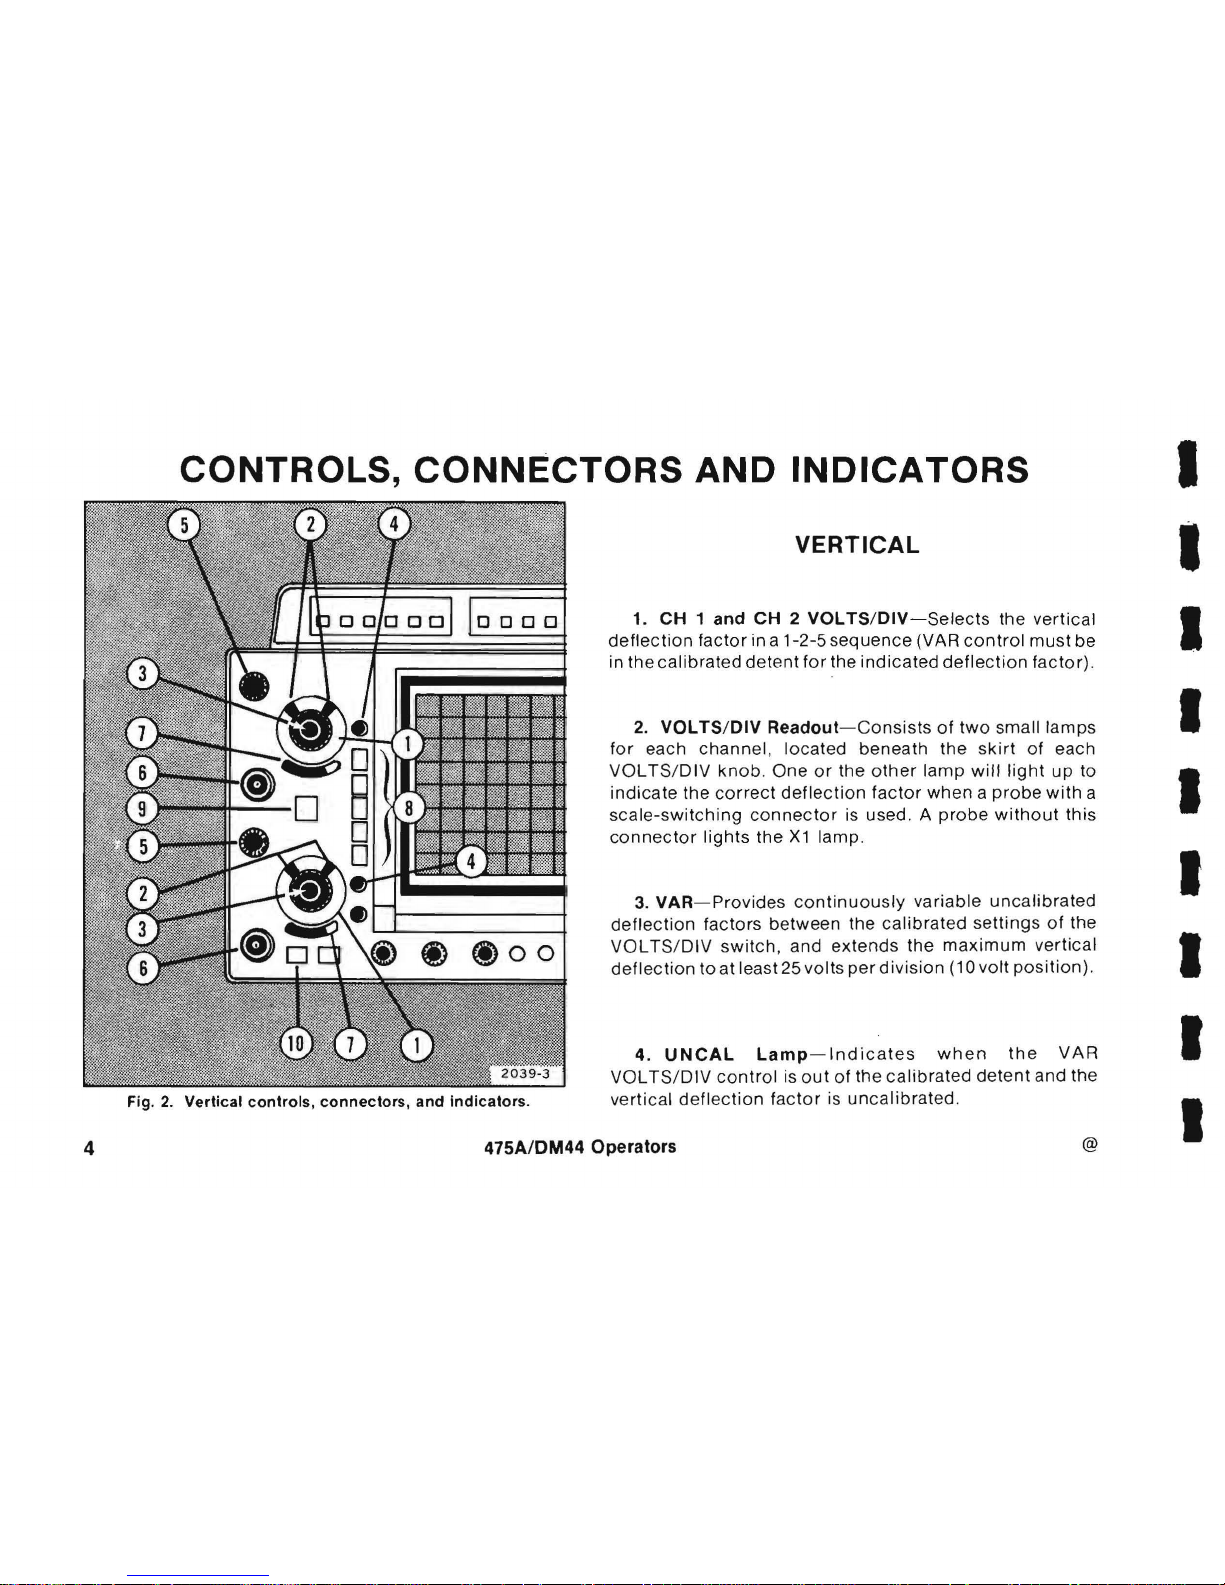
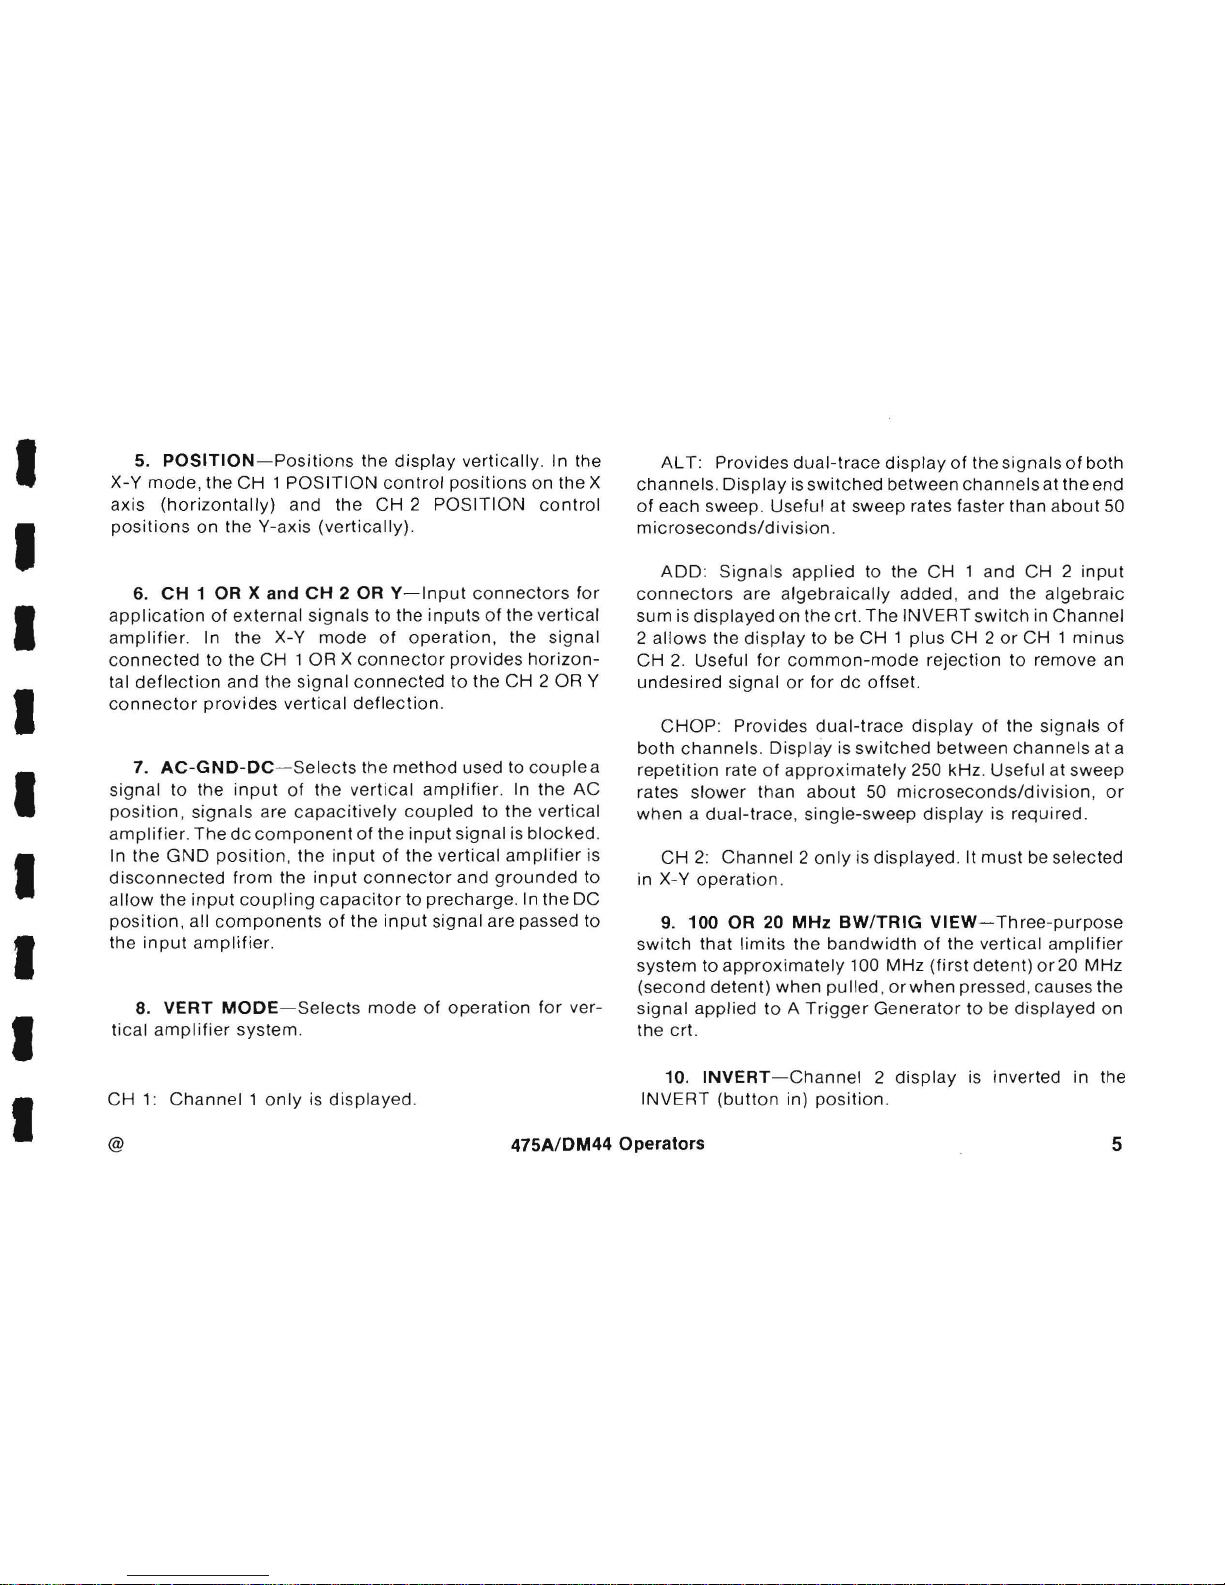
Fig.
2.
Vertical
controls,
connectors,
and
indicators.
VERTICAL
1.
CH 1 and
CH 2 VOL
TS/DIV-Selects
the
vertical
deflection
factor
in a 1-2-5
sequence
(VAR
control
must
be
in the
calibrated
detent
for
the
indicated
deflection
factor).
2.
VOL
TS/DIV
Readout-Consists
of
two
small
lamps
for
each
channel, located
beneath
the
skirt
of
each
VOL TS/OIV
knob. One
or
the
other
lamp
will
light
up
to
indicate
the
correct
deflection
factor
when a probe
with
a
scale -
switching
connector
is used. A
probe
without
this
connector
lights
the
X1
lamp.
3.
VAR-Provides
continuously
variable
uncalibrated
deflection
factors between the
calibrated
settings
of
the
VOL
TS/ OIV
switch,
and
extends
the
maximum
vertical
deflection
to at least 25 volts
per
division
(10 volt
position).
4.
UNCAL
Lamp-Indicates
when
the
VAR
VOL TS/ OIV
control
is
out
of
the
calibrated
detent
and the
vertical
deflection
factor
is
uncalibrated
.
475A/DM44
Operators
@
I
I
I
I
I
I
I
I
I
Page 13
I
I
I
I
I
I
I
I
I
5.
POSITION-Positions
the
display
vertically
. In the
X-V
mode,
the
CH 1 POSITION
control
positions
on
the X
axis
(horizontally)
and
the
CH 2 POSITION
control
positions
on
the Y-axis
(vertically).
6.
CH
1 OR X
and
CH
2 OR
V-Input
connectors
for
application
of
external
signals
to
the
inputs
of
the
vertical
amplifier.
In the X-V
mode
of
operation,
the
signal
connected
to
the
CH 1 OR X
connector
provides
horizon-
tal
deflection
and
the
signal
connected
to
the
CH
2 OR Y
connector
provides
vertical
deflection.
7.
AC-GND-DC-Selects
the
method
used to
couplea
signal
to the
input
of
the
vertical
amplifier
. In
the
AC
position, signals
are
capacitively
coupled
to
the
vertical
amplifier. The
dc
component
of
the
input
signal
is
blocked
.
In
the
GND
position,
the
input
of
the
vertical
amplifier
is
disconnected
from
the
input
connector
and
grounded
to
allow
the
input
coupling
capacitor
to
precharge.
In
the
DC
position,
all
components
of
the
input
signal are passed to
the
input
amplifier.
8.
VERT
MODE-Selects
mode
of
operation
for
ver-
tical
amplifier
system
.
CH
1:
Channell
only
is di
splayed.
AL
T: Provides
dual-trace
display
of
the
signals
of
both
channels. Display
is
switched
between
channels
at
the
end
of
each sweep.
Useful
at sweep rates faster than
about
50
microseconds/division
.
ADD: Signals
applied
to the
CH 1 and
CH 2 input
connectors
are
algebraically
added, and
the
algebraic
sum
is
displayed
on
the crt.
The
INVERT
switch
in
Channel
2
allows
the
display
to be
CH 1 plus
CH 2 or
CH 1
minus
CH
2.
Useful
for
common-mode
rejection
to
remove
an
undesi
red
signal
or
for
dc
offset.
CHOP
: Provides
dual-trace
display
of
the
signals
of
both
channels. Display
is
switched
between
channe
ls at a
repetition
rate
of
approximately
250 kHz .
Useful
at
sweep
rates
slower
than
about
50
microseconds/division, or
when a dual-trace, single-sweep
display
is
required
.
CH
2:
Channel 2 only
is
displayed.
It
must
be selected
in X-
Y
operation
.
9.
100 OR 20
MHz
BW/TRIG
VIEW-
Three-purpose
switch
that
limits
the
bandwidth
of
the
vertical
amplifier
system
to
approximately
100
MHz
(first
detent)
or20
MHz
(second
detent)
when
pulled, or
when
pressed, causes the
signal
applied
to
A Tr
igger
Generator
to
be
displayed
on
the crt.
10.
INVERT-Channel
2
display
is inverted in the
INVERT
(button
in)
position.
@
475A/DM44
Operators
5
Page 14
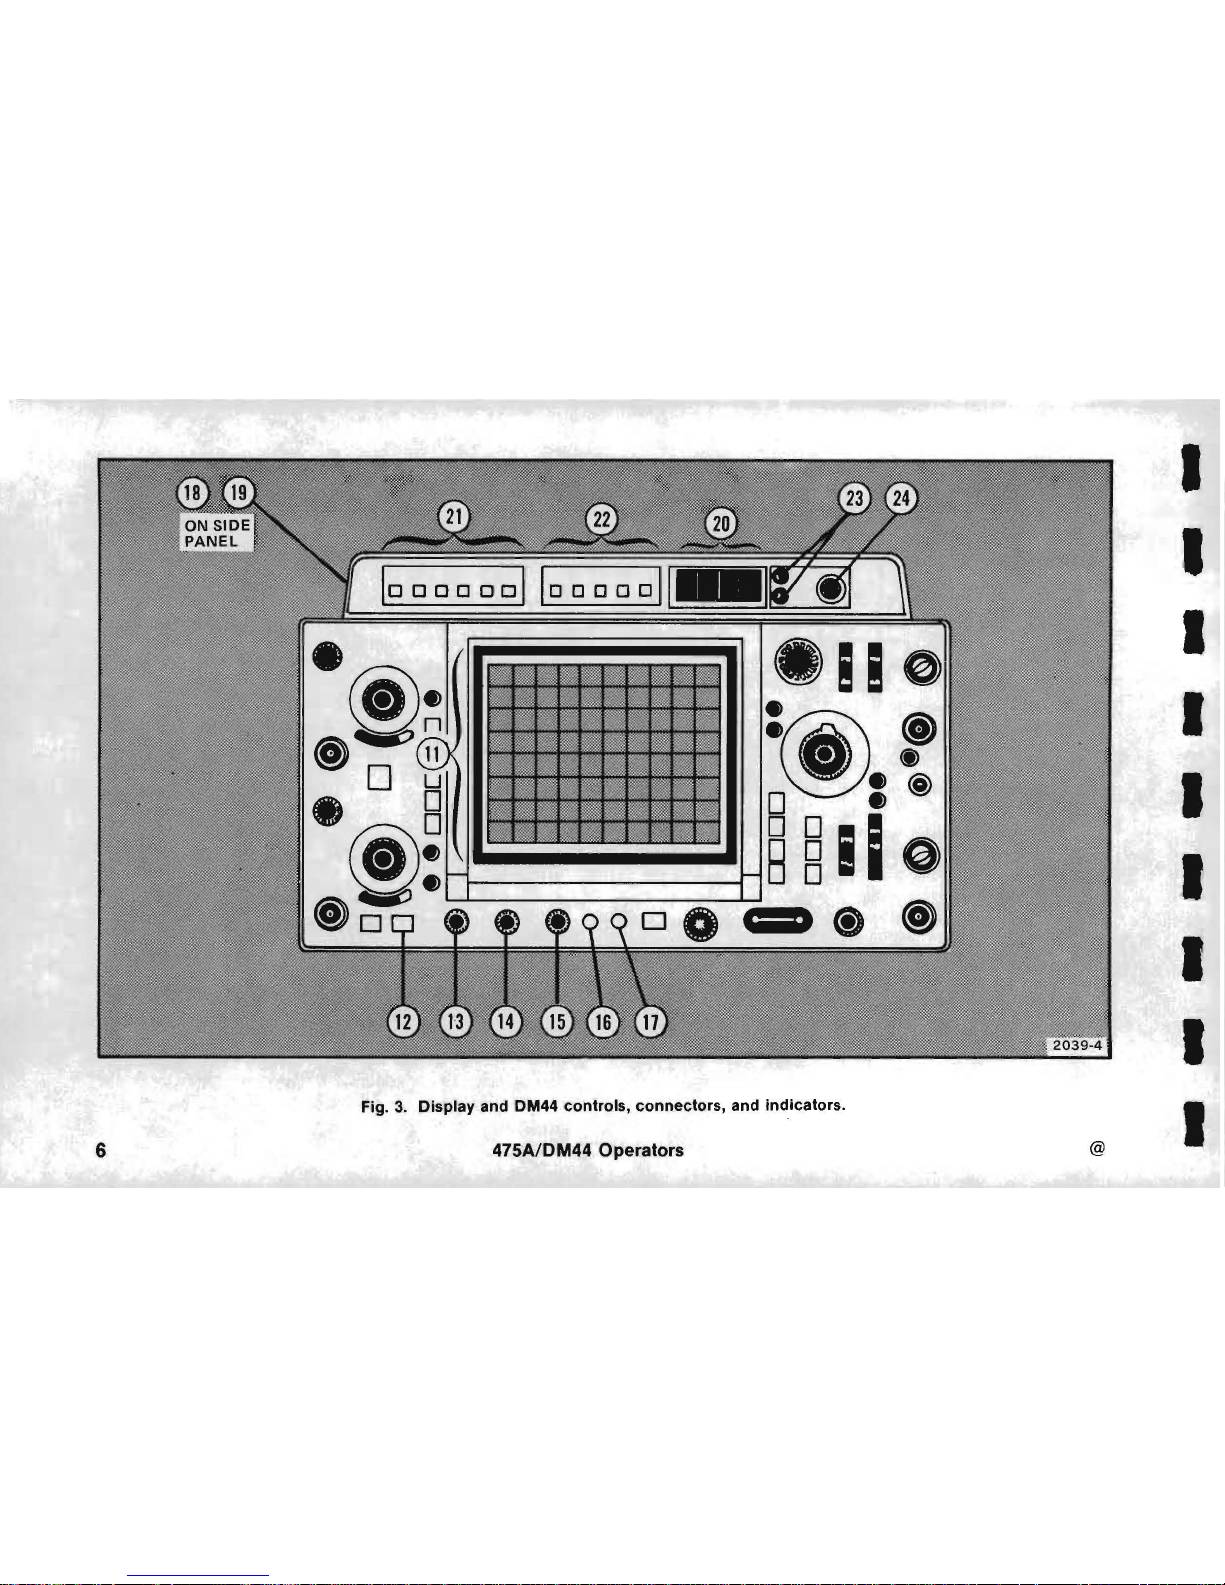
Fig.
3.
Display and DM44 controls, connectors, and
indicators.
6
475A/DM44 Operators
@
I
I
I
I
I
I
I
I
I
Page 15
I
I
I
I
I
I
I
I
I
DISPLAY
11.
Internal
Graticule-Eliminates
parallax. Risetime.
amplitude
and
measurement
pOints are
indicated
at the
left-hand
graticule
edge.
c,
12.
BEAM
FINDER-Compresses
the
display
to
within
the
graticule
area
independently
of
display
position
or
applied
signals
and
provides a visible
viewing
level.
13.
INTENSITY-Controls
brightness
of
the
crt
dis-
play.
14.
FOCUS-Adjusts
for
optimum
display
definition
.
15.
SCALE
ILLUM-Controls
graticule
illumination.
16.
ASTIG-Used
in
conjunction
with
the
FOCUS
control
to
obtain a well-defined
display
. It
does
not
require
readjustment
in
normal
use.
17.
TRACE
ROTATION-Adjusts
trace
to
align
with
the
horizontal
graticule
lines.
DM44
18.
Input
Connectors-Two
banana
jacks
provide
+
(red)
and
COM
(black)
inputs
for
voltage
and
resistance
only.
19.
Probe
Connector-Input
connector
for
the
temperature
probe
.
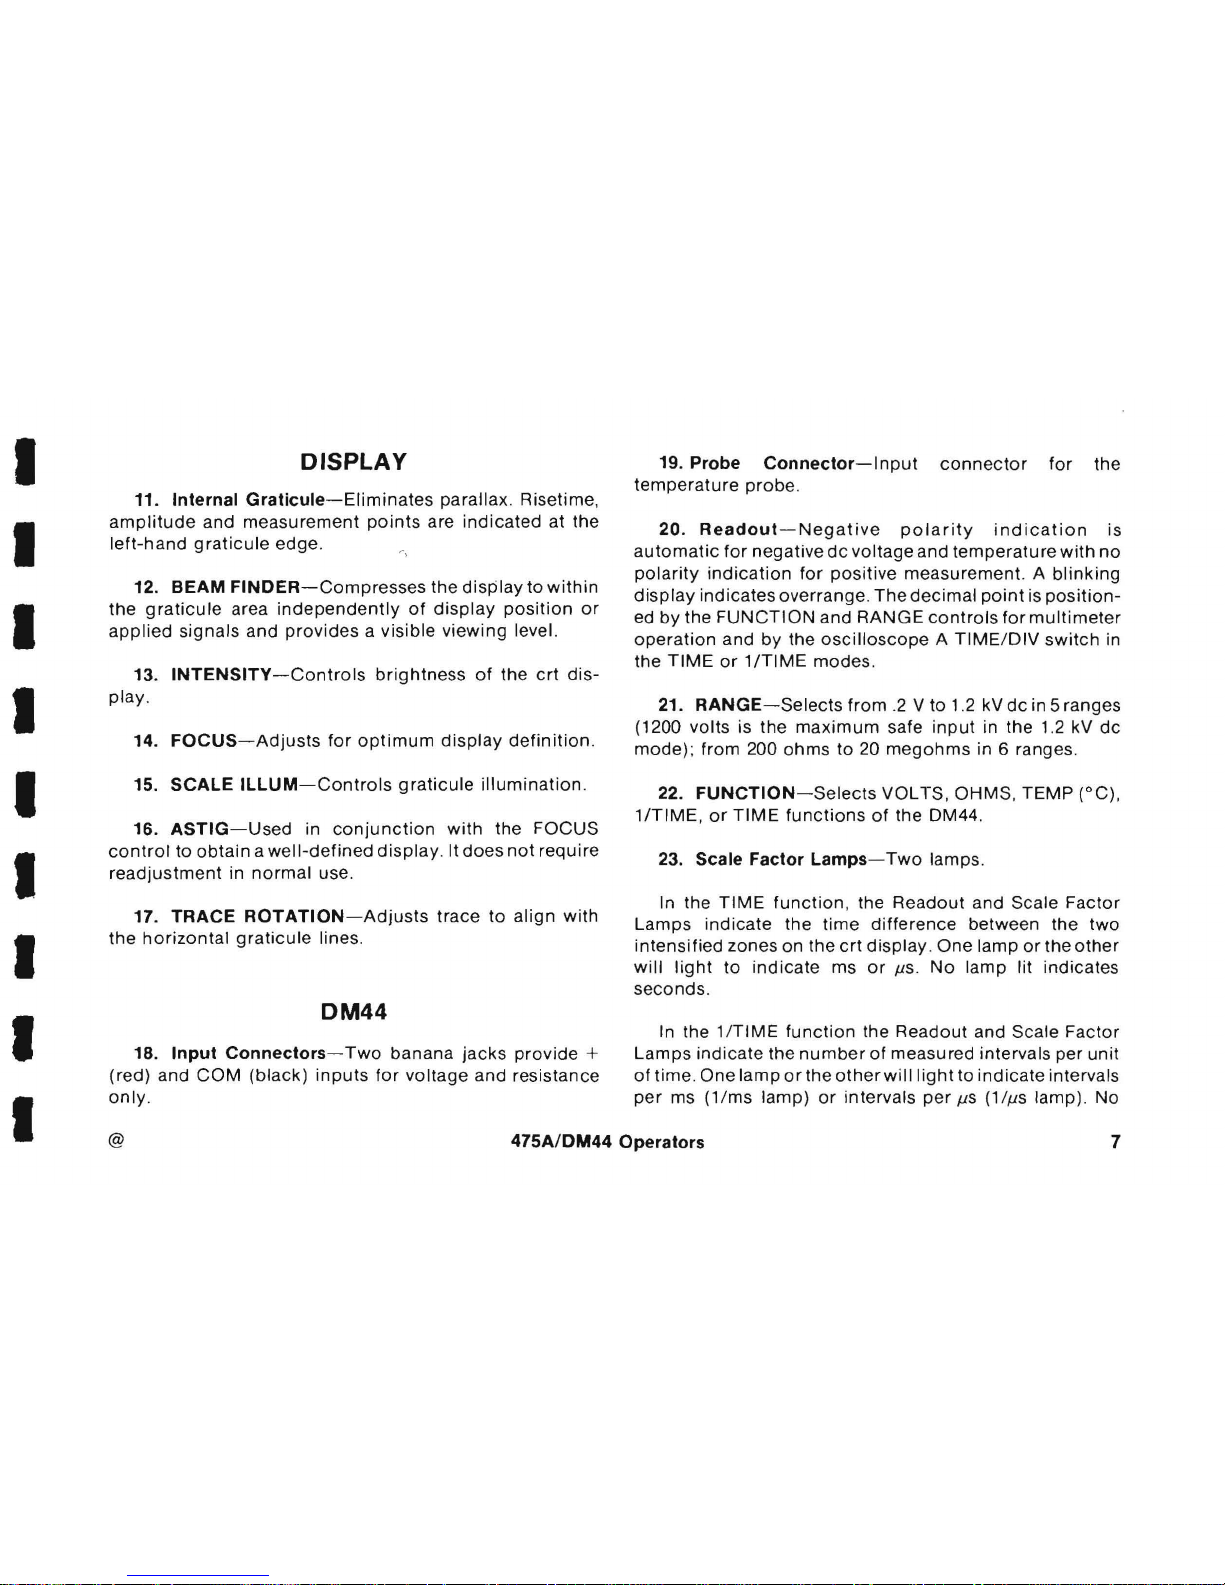
20.
Readout-Negative
polarity
indication
is
automatic
for
negative
dc
voltage
and
temperature
with
no
polarity
indication
for
positive
measurement. A blinking
display
indicates
overrange.
The
decimal
point
is
position-
ed
by
the
FUNCTION
and
RANGE
controls
for
multimeter
operation
and
by
the
oscilloscope A TIME/DIV
switch
in
the
TIME
or
1/TIME
modes.
21.
RANGE-Selects
from
.2 V to
1.2 kV
dc
in 5 ranges
(1200
volts
is the
maximum
safe
input
in the 1.2 kV
dc
mode);
from 200
ohms
to
20
megohms
in 6 ranges.
22.
FUNCTION-Selects
VOL
TS.
OHMS. TEMP
(QC).
1ITIME.
or
TIME
functions
of
the DM44.
23.
Scale
Factor
Lamps-Two
lamps.
In the
TIME
function
. the
Readout
and Scale
Factor
Lamps
indicate
the
time
difference
between the
two
intensified
zones on the
crt
display. One
lamp
or
the
other
will
light
to
indicate
ms
or
f..lS
.
No
lamp
lit indicates
seconds.
In the
1/TIME
function
the
Readout
and Scale
Factor
Lamps
indicate
the
number
of
measured
intervals per
unit
of
time.
One
lamp
or
the
other
will
light
to
indicate
intervals
per
ms
(1/ms
lamp)
or
intervals
per
f..lS
(1/f..ls
lamp).
No
@
475A/DM44
Operators
7
Page 16
8
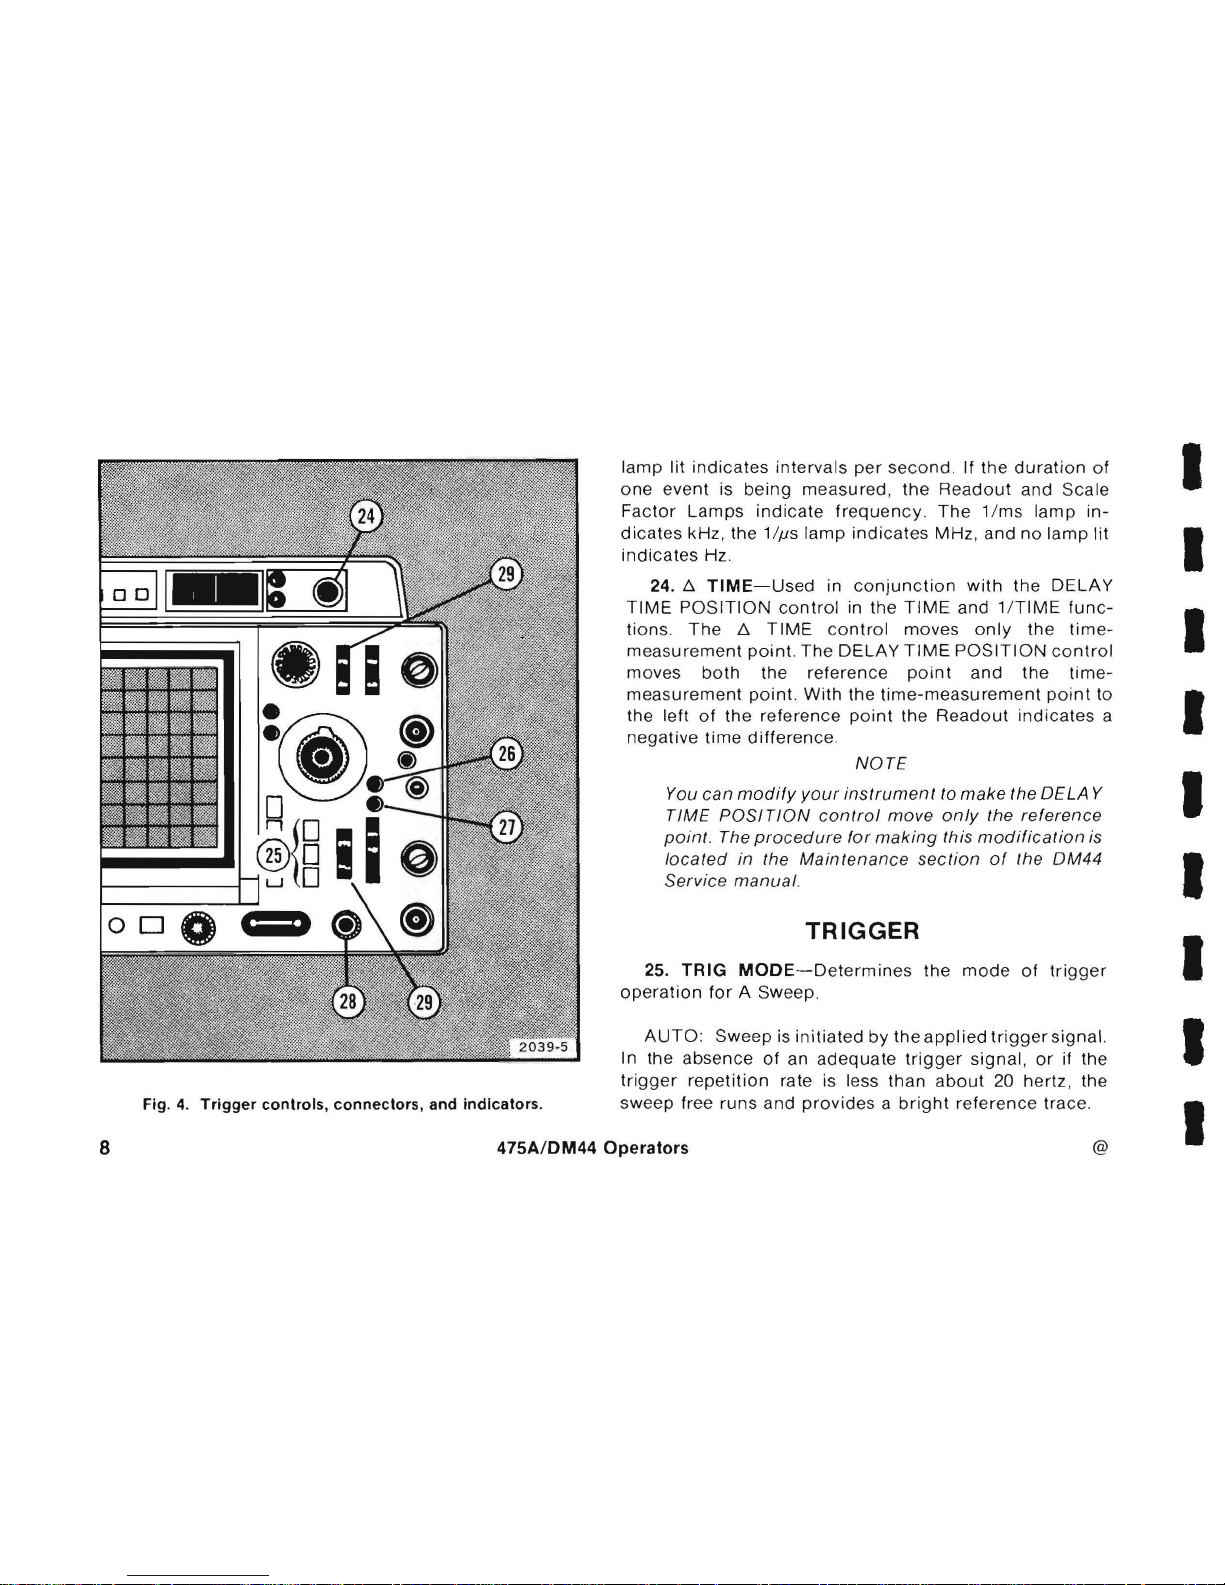
Fig.
4.
Trigger
controls,
connectors,
and
indicators.
lamp
lit
indicates
intervals
per
second
. If
the
duration
of
one
event
is
being
measured, the
Readout
and Scale
Factor
Lamps
indicate
frequen
cy.
The
1/
ms
lamp
in-
dicates
kHz, the
1//.1s
lamp
indicates
MHz, and
no
lamp
lit
indicates
Hz.
24.
/.:.;.
TIME-Used
in
conjunction
with
the
DELAY
TIME
POSITION
control
in the
TIME
and
1/TIME
func-
tions. The
/.:.;.
TIME
control
moves
only
the
time-
measurement
point.
The
DELAY
TIME
POSITION
control
moves
both
the
reference
point
and
the
time-
measurement
point.
With
the
time-measurement
point
to
the
left
of
the
reference
point
the
Readout
indicates
a
negative
time
difference
.
NOTE
You
can
modify
your
instrument
to
make
the OELA Y
TIME
POSITION
control
move
only
the
reference
pOint . The
procedure for
making
this
modification
is
located
in the
Maintenance
section
of
the OM44
Service
manual
.
TRIGGER
25.
TRIG
MODE-Determines
the
mode
of
trigger
operation
for
A Sweep
AUTO:
Sweep
is
initiated
by
the
applied
triggersignal.
In the
absence
of
an
adequate
trigger
signal, or
if the
trigger
repetition
rate is less than
about
20
hertz
, the
sweep
free
runs
and
provides a bright
reference
trace
.
475A/DM44
Operators
@
I
I
I
I
I
I
I
I
I
Page 17
I
I
I
I
I
I
I
I
I
NORM:
Sweep
is
initiated
by
the
applied
trigger
signal.
In
the
absence
of
an
adequate
trigger
signal
, there is
no
trace. When
the
trigger
rate is
too
low
for
AUTO
use
NORM
.
SINGL
SWP : When
this
pushbutton
is
pushed
, the A
Sweep
operates
in the
single
sweep mode.
After a single
sweep
is
displayed,
further
sweeps
cannot
be
presented
until
the
SINGLE
SWP
button
is
again
pushed. It is
useful
when
the
signal
to
be
displayed
is
not
repetitive
or
varies in
amplitude, shape
or
time
causing
an
unstable
conven-
tional
display
. It
can
also
be used
to
photograph
a
nonrepetitive
signal.
26. READY
Lamp-Indicates A Sweep
is
"armed"
and,
upon
receipt
of
an
adequate
trigger
signal,
will
present a
single-sweep
display
.
27.
TRIG
Lamp-Indicates
that A Sweep
is
triggered
and
will
produce a stable
display.
It is
useful
for
setting
up
the
trigger
circuits
when a trigger
signal
is available
without a display
on
the
crt
(for
example,
when
using
ex terna I
triggers).
28. A
TRIG
HOLDOFF-Provides
continuous
control
of
time
between
sweeps.
Allows
triggering
on
aperiodic
signals
(such as
complex
digital
words)
. In the
fully
clockwise
position
(8
ENDS A), A
sweep
is reset at the end
of 8 sweep
to
provide
the fastest
possible
sweep
repetition
rate
for
delayed-sweep
presentations
and
low-repetition
rate signals. Use the A
trigger
controls
for
the best
possible
display
before
using
the A
TRIG
HOLDOFF
control.
29.
COUPLING-Determines
method
used to
couple
signals
to
the
trigger
generator
circuit.
AC: Signals
are
capacitively
coupled
to
the
input
of
the
trigger
generator.
Dc
is
rejected and Signals
below
about
60
Hz
are
attenuated
.
LF REJ:
Signals
are
capacitively
coupled
to
the
input
of
the
trigger
circuit.
Dc
is rejected and
signals
below
about
50 kHz are
attenuated
. It is useful
for
providing
a
stable
display
of
the
high-frequency
components
of
a
complex
waveform
.
HF REJ:
Signals
are
capacitively
coupled
to
the
input
of
the
trigger
circuit. Dc
is rejected and
signals
below
about
60 Hz and above
about
50 kHz are attenuated. It is
useful
for
providing
a stable
display
of
the
low-frequency
components
of a complex
waveform.
DC
: All
components
of a trigger
signal are
coupled
to
the
input
of
the
trigger
circuit.
It is useful
for
providing
a
stable
display
of
low-frequency
or
low-repetition
rate
signals,
except
the
combination
of
the
AL
T (dual trace)
mode
with
the
trigger
SOURCE
switch
in
NORM
.
@
475A/DM44
Operators
9
Page 18
10
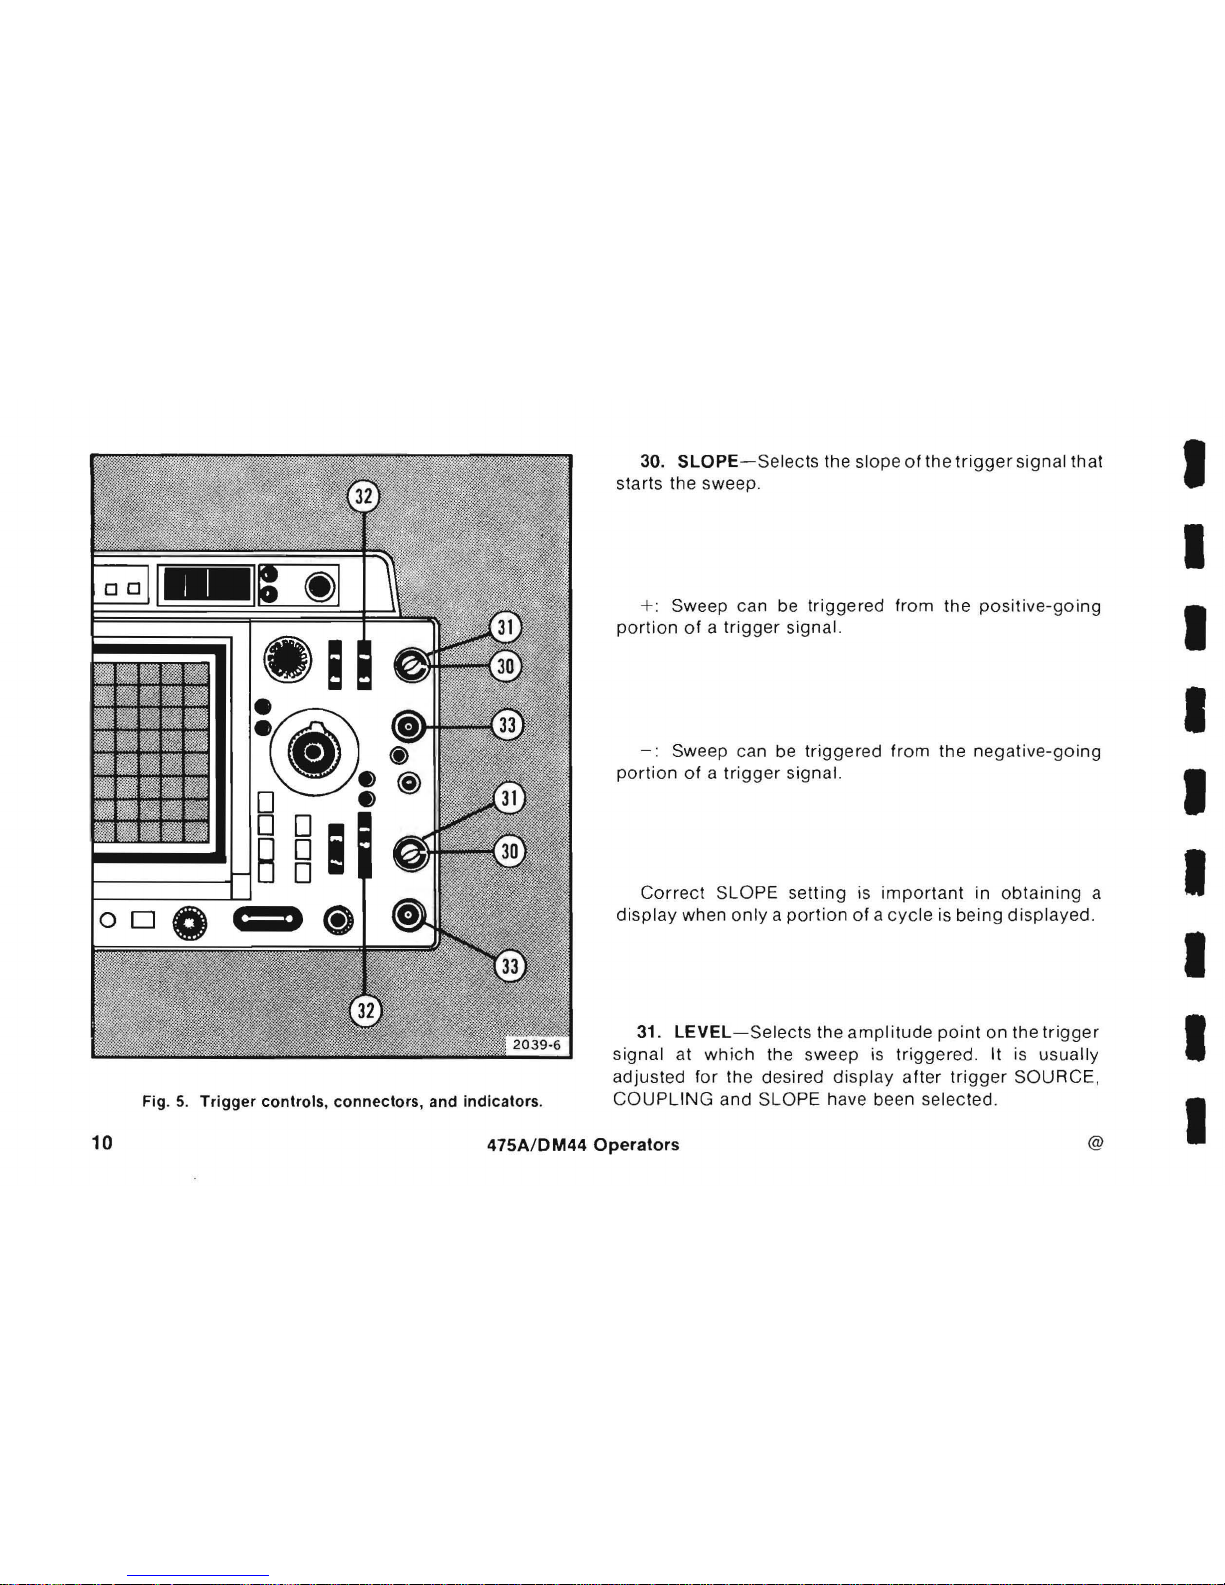
Fig. 5. Trigger controls, connectors, and indicators.
30.
SLOPE-Selects
the slope
of
the
trigger
signal
that
I
starts the sweep.
I
+: Sweep can be
triggered
from the
positive-going
I
portion
of a trigger
signal.
-:
Sweep can be
triggered
from the
negative-going
portion
of a trigger
signal.
Correct
SLOPE
setting
is
important
in
obtaining
a
display
when
only a portion
of a cycle
is being
displayed.
31. LEVEL - Selects the
amplitude
point
on the
trigger
signal at
which
the sweep
is
triggered.
It
is
usually
adjusted
for the desired
display
after
trigger
SOURCE,
COUPLING
and SLOPE have been selected.
I
I
I
I
I
475A/OM44
Operators
@
I
Page 19
I
I
I
I
I
I
I
I
I
32.
SOURCE-Determines
the
source
of
the
trigger
signal
coupled
to
the
input
of
the
trigger
circuit.
NORM:
Trigger
source
is
displayed
signal(s).
It does
not
indicate
time
relationship
between
CH
1 and
CH
2
signals.
However,
stable
triggering
of
non-time-related
signals
usually
can be
obtained
by
setting
VERT
MODE
to
AL
T,
SOURCE
to
NORM
and
COUPLING
to
LF REJ.
Carefully
adjust
LEVEL
for a stable
display.
CH
1: A sample
of
the
signal
available
in
Channel
1 is
used as a
trigger
signal.
CH 2 signal
is
unstable
if it is
not
time-related.
CH
2: A sample
of
the
signal
available
in
Channel 2 is
used as a
trigger
signal.
CH 1 signal
is
unstable
if it is
not
time-related.
LINE
(A
Trigger
circuit
only): A sample
of
the
power-
line
frequency
is used as a
trigger
signal.
It is useful
when
the
input
signal
is
time-related
(mu Itiple
or
submultiple)
to
the
line
frequency
or
when
it is
desirable
to
provide
a
stable
display
of a line-frequency
component
in a
complex
waveform.
EXT:
Signals
connected
to
the
External
Trigger
Input
connectors
are used
for
triggering.
External
signals
must
be
time-related
to
the
displayed
signal
for a stable
display.
It is usefu I
when
the
internal
signal
is
too
small
or
contains
undesired
signals
that
could
cause
unstable
triggering.
It
is
useful
when
operating
in
CHOP
mode.
EXT
-:-
10
(A
Trigger
circuit
only):
External
trigger
signal
is
attenuated
by a factor
of
10.
STARTS
AFTER
DELAY
(8
Trigger
circuit
only):
8
Sweep
runs
immediately
after
the
delay
time
selected
by
the
DELAY-TIME
POSITION
control.
When
making
differential
time
measurements
you
must
use
this
mode
to
obtain
valid
measurements.
On
instruments
equipped
with
a DM44
you
must
use
this
mode
to
obtain
valid
measurements
when
using
the
TIME
or 1 ITIME
functions.
33. External Trigger
Inputs-Input
connectors
for
ex-
ternal
trigger
signals.
@
475A/DM44 Operators
11
Page 20
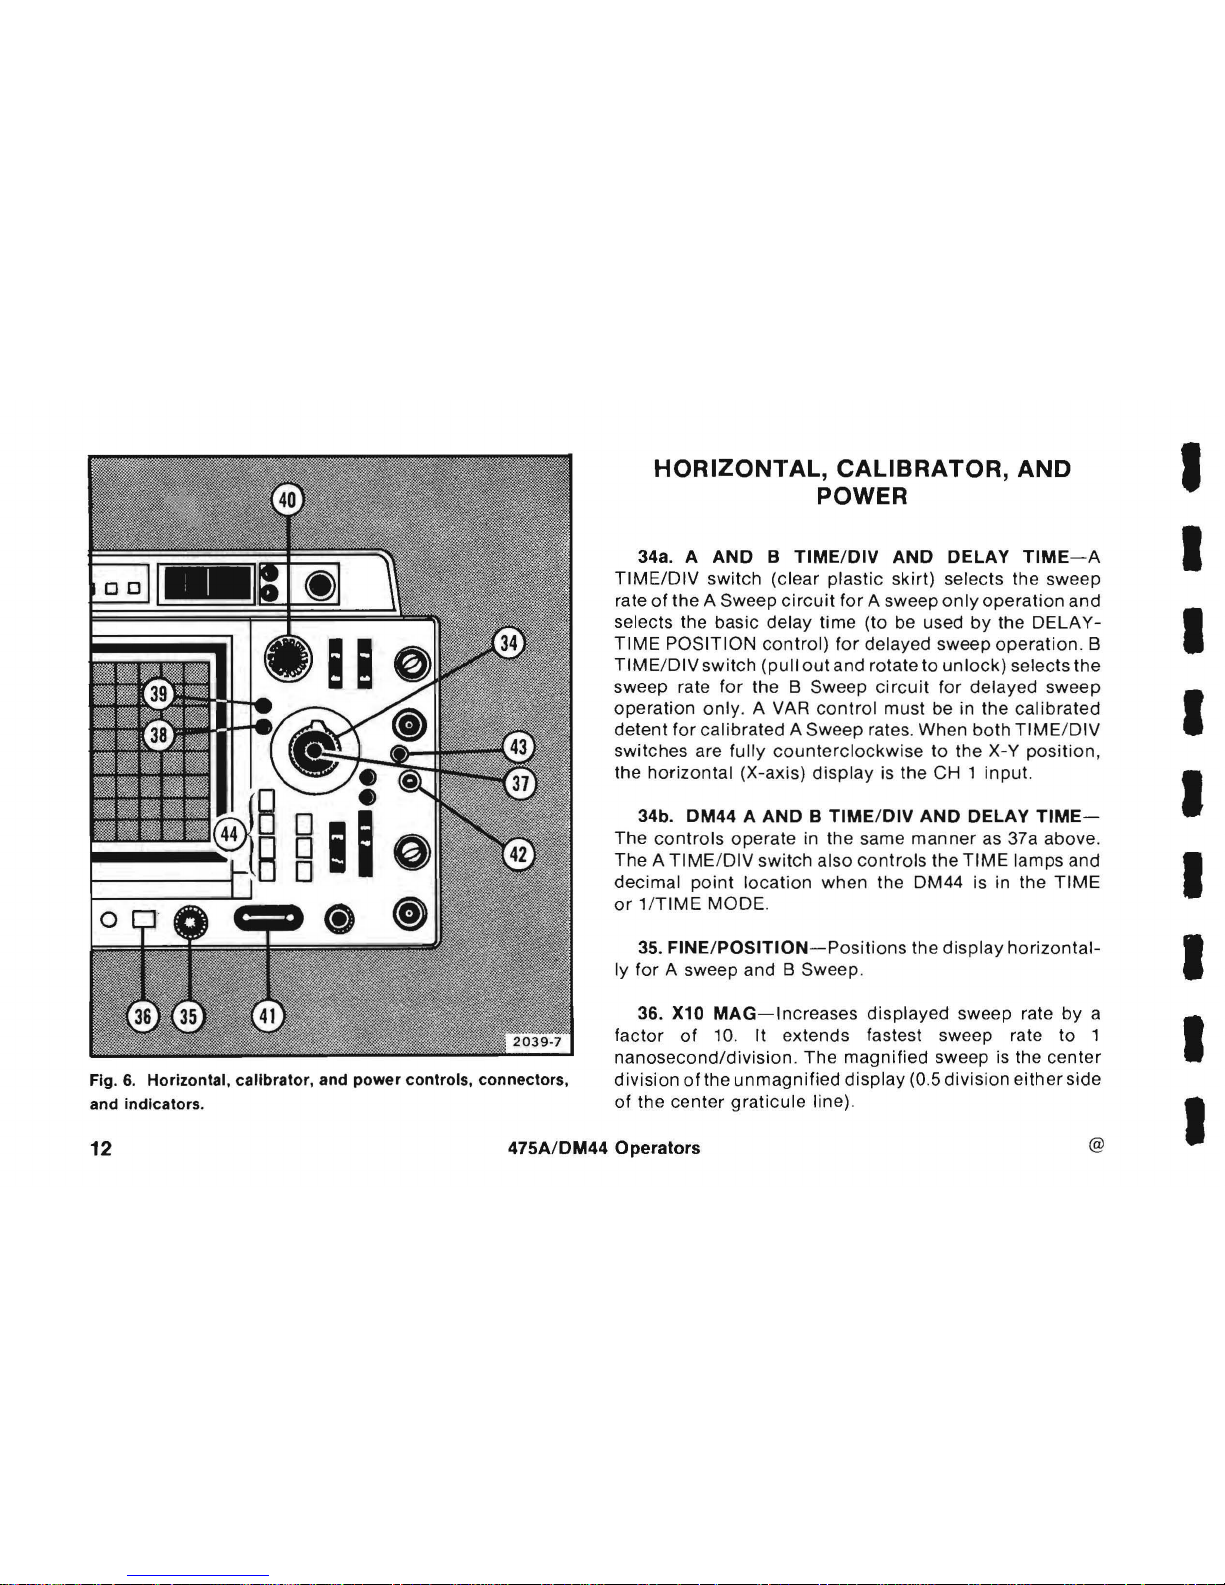
Fig.
6.
Horizontal,
calibrator,
and
power
controls,
connectors,
and
indicators.
HORIZONTAL,
CALIBRATOR,
AND
POWER
34a. A
AND B TIME/DIV
AND
DELAY
TIME-A
TIME/DIV
switch
(clear plastic skirt) selects the sweep
rate
of
the A Sweep
circuit
for
A sweep
only
operation
and
selects the basic delay time (to be used
by
the
DELAY-
TIME
POSITION
control)
for
delayed sweep
operation.
B
TIME/DIV
switch
(pullout
and rotate to
unlock)
selects the
sweep rate
for
the B Sweep
circuit
for delayed
sweep
operation
only
. A VAR
control
must be in the
calibrated
detent
for
calibrated
A Sweep rates. When
both
TIME
/DIV
switches are
fully
counterclockwise
to the X-V
position
,
the
horizontal
(X-axis)
display
is the
CH
1 input.
34b.
DM44 A AND B TIME/DIV
AND
DELAY
TIME-
The
controls
operate
in the same
manner
as 37a above.
The A TIME
/DIV
switch
also
controls
the
TIME
lamps and
decimal
point
location
when
the DM44 is in the
TIME
or 1/TIME
MODE
.
35.
FINE/POSITION-Positions
the
display
horizontal-
ly
for
A sweep and B Sweep .
36. X10
MAG-Increases
displayed
sweep rate
by
a
factor
of
10. It extends fastest sweep rate to 1
nanosecond/division.
The
magnified
sweep is the
center
division
of
the
unmagnified
display
(0.5
division
either
side
of
the
center
graticule
line).
12
47SA/DM44
Operators
@
I
I
I
I
I
I
I
I
I
Page 21
I
I
I
I
I
I
I
I
I
37.
VAR-Provides
continuously
variable sweep rates
between
the
calibrated
settings
of
the A
TIME/DIVswitch.
It
extends
the
slowest A Sweep
rate
to
at least 1.25
seconds/division.
The A Sweep
rate is
calibrated
when
the
control
is set
fully
clockwise
to
the
calibrated
detent.
Must
be in the
detent
position
to
make
accu rate
differential
time
measurements.
On
instruments
equipped
with
a DM44
the
VAR
control
must
be in
the
detent
position
to
make
accurate
measurements
in the
TIME
and 1/
TIME
func-
tions
.
38.
UNCAL
Lamp-Indicates
the A
Sweep
rate is
uncalibrated
(VAR
control
out
of
the
calibrated
detent)
.
39.
X10
MAG
Lamp-Indicates
that the X10
magnifier
is on.
40a.
DELAY
TIME
POSITION-Provides
variable
sweep
delay
to
more
than
10
times
the
delay
time
indicated
by
the A
TIME/DIV
switch.
40b.
DM44
DELAY
TIME
POSITION-Operates
in the
same
manner
as
41a. Also,
when
the DM44 is in the
TIME
or
1/TIME
function,
this
control
operates
in
conjunction
with
the!::.
TIME
control.
The
DELAY
TIME
POSITION
control
moves
both
the reference
point
and
the
time-
measurement
pOint. The!::.
TIME
control
moves
only
the
time-measurement
point.
With
the
time-measurement
point
to the
left
of
the
reference
point
the
Readout
indicates a negative time
difference
.
NOTE
You can
modify
your
instrument
to
make
the OELA Y
TIME
POSITION
control
move
only
the reference
point.
The
procedure
for
making
this
modification
is
located
in the
Operating
Information
section
of
the
OM44 Service
manual
.
41..
CALIBRATOR-A
combination
current
loop/square-wave
voltage
output
that
permits
the
operator
to
compensate
voltage
probes
and
check
vertical
gain,
current
probes
and
oscilloscope
operation.
It is
not
intended
to verify time-base
calibration
.
42.
POWER-Turns
instrument
power
on and
off
.
43.
LOW
LINE
Lamp-Indicates
that the
applied
line
voltage
is
below
the
lower
limit
of
the
regulating
range
selected
by
the
Regulating
Range Selector.
44.
HORIZ
DISPLAY-Determines
the
mode
of
opera-
tion
for
the
horizontal
deflection
system .
A:
Horizontal
deflection provided
by A Sweep
at a
sweep
rate
determined
by
the
setting
of
the A
TIME
/DIV
switch.
B sweep is
inoperative
.
@
475A1DM44
Operators
13
Page 22
MIX:
The
first
part
of
the
horizontal
sweep is displayed
at a rate set
by
the
A TIME/ DIV
switch
and
the
latter
part
of
the sweep at a rate set by the B
TIME/DIV
switch
. Relative
amounts
of
the
display
allocated
to
each
of
the
two
sweep
rates are
determined
by
the
setting
of
the
DELAY-TIME
POSITION
control.
A INTEN:
The
sweep rate
is
determined
by the A
TIME/DIV
switch.
An
intensified
portion
appears
on
the
display
during
the B Sweep time,
which
is
about
10 times
the B
TIMEIDIV
switch
setting. This
switch
position
provides a check
of
the
duration
and
position
of
the B
Sweep (delayed sweep)
with
respect
to
the A Sweep
(delaying
sweep).
B
DL
YO:
The
sweep rate is
determined
by
the B
TIME/DIV
switch
with
the delay
time
determined
by
the
selling
of
the
DELAY
TIME
(A
TIME/DIV)
switch
and the
DELAY-TIME
POSITION
control.
REAR PANEL
45. A
+GATE-Provides a positive-going
rectangular
pulse
coincident
with
the A Sweep time,
which
can be
used to
trigger
the
signal
source
(with
TRIG
MODE
switch
set
to
AUTO).
46. B
+GATE-Provides a positive-going
rectangular
pulse
coincident
with
the B Sweep time,
which
can be
used to
trigger
the signal
source
after
a selected
delay
time,
providing
that A Sweep
is
triggered
internally.
47.
CH
2 VERT
SIGNAL
OUT-Provides a sample
of
the
signal
applied
to
the
CH 2 input
connector
.
48. EXT
Z-AXIS-Permits
intenSity
modulation
of
the
crt
display.
Does
not
affect
display
waveshape. Signals
with
fast rise
and
fall
provide
the
most
abrupt
intensity
change. Signals
must
be
time-related
to
the
display
for
a
stable display. Useful
for
adding
time
markers
in
un-
calibrated
modes
of
operation.
49.
Line
Fuse
Holder-Contains
the
line
fuse and the
regulating
range selector. See
Table 1 for
change
informa-
tion.
50.
Regulating
Range
Selector-Shown
in
Medium
regulating
range. See
Table 1 for
change
information
.
51. PROBE
POWER-Power
source
for
active
probe
systems .
52.
Line
Cord-Makes
the
connection
between the
oscilloscope
and the
power
source. The
cord
may
be
conveniently
stored
by
wrapping
it
around
the
feet on the
rear
panel.
53.
MOD
SLOTS-A
number
in
either
slot
indicates
the
instrument
contains
an
option
or
other
modifications.
LEFT SIDE PANEL
Access
for
externally
available
adjustments
(see Fig. 7).
RIGHT
SIDE PANEL
LINE
VOLTAGE
SELECTOR
SWITCH
(located
on the
right
side)-Selects
either
115 V
or
230 V
nominal
line
voltage.
14
475A/DM44
Operators
@
I
I
I
I
I
I
I
Page 23
I
I
I
I
I
I
I
I
I
@
CH 1 GAIN
10mV
Fig.
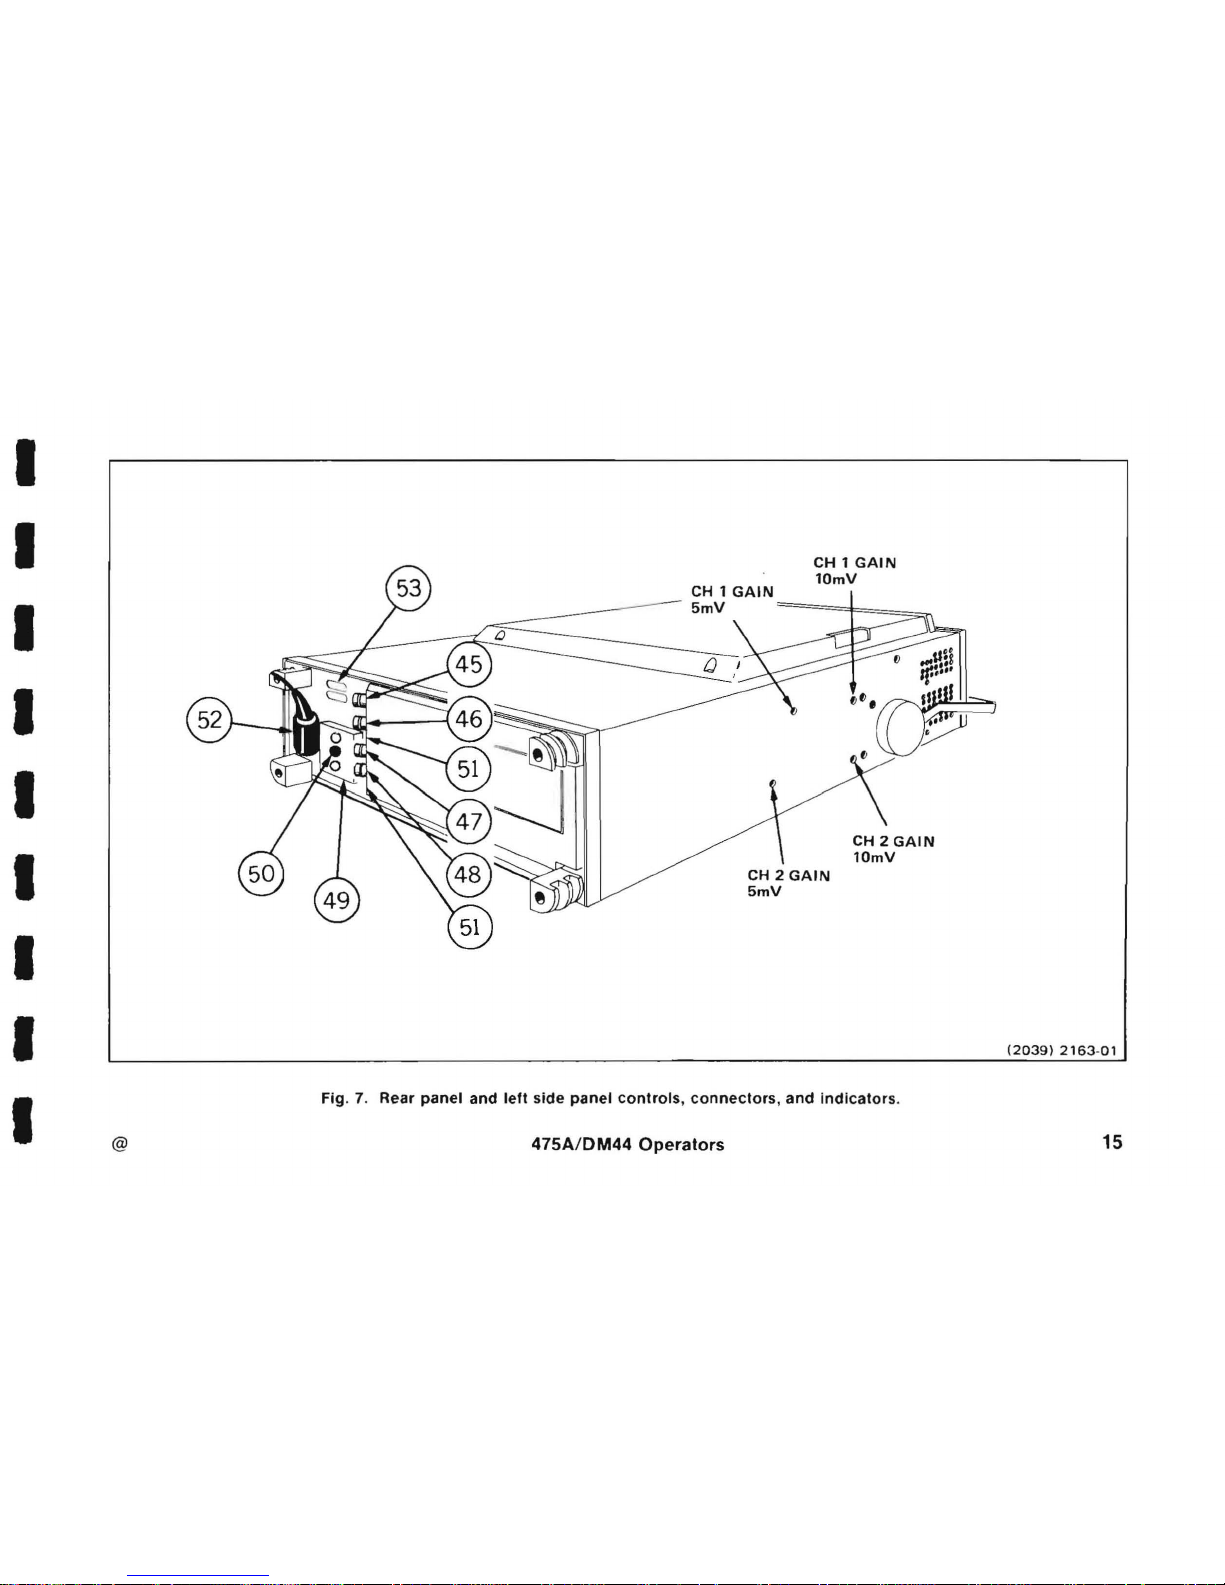
7.
Rear panel and
left
side
panel
controls,
connectors, and
indicators
.
475A/OM44
Operators
(2039)
2163-01
15
Page 24
BASIC OSCILLOSCOPE DISPLAYS
These
instructions
permit
the
operator
to
obtain
the
most
commonly
used basic
displays.
NORMAL
SWEEP DISPLAY
1.
Set the
controls
as
follows:
VERT
MODE
VOL
TS/DIV
VOLTS/DIV
VAR
AC-GND-DC
Vertical
POSITION
100
MHz-20
MHz
BW
INVERT
Vertical
CH 1
Position
determined
by
amplitude
of
signal to
be
applied
Calibrated
detent
AC
Midrange
Not
limited
(yellow
band
not
visible)
Button
out
Horizontal
TIME/DIV
Switches
Locked
together
at 1 ms
A
TIME/DIV
VAR
Calibrated
detent
HORIZ
DISPLAY
A
X10
MAG
POSITION
Off
(button
out)
Midrange
Display
INTENSITY
Fully
counterclockwise
Trigger
(Both A and B
If applicable)
SLOPE
LEVEL
SOURCE
COUPLING
TRIG
MODE
(A
only)
A TRIG
HOLDOFF
+
o
NORM
AC
AUTO
NORM
2.
Pull the POWER
switch
(on).
Connect
the
signal
to
the
CH 1 input
connector
.
3.
Adjust
the
INTENSITY
control
for
the
desired
display
brightness.
If the
display
is
not
visible
with
the
INTENSITY
control
at
midrange,
press the
BEAM
FINDER
pushbutton
and
adjust
the CH 1
VOL
TS/DIV
switch
to
reduce
the vertical
display
size.
Center
the
compressed
display
with
the
vertical
and
horizontal
POSITION
con-
trols; release
the
BEAM
FINDER
pushbutton.
16
475A/DM44 Operators
@
I
I
I
I
I
I
I
I
I
Page 25
I
I
I
I
I
I
I
I
I
4. Set the
CH 1 VOL
TS/DIV
switch
and
vertical
POSITION
control
to
locate
the
display
within
the
display
area.
5.
Adjust
the A
Trigger
LEVEL
control
for a stable
display
.
6. Set
the A TIME/DIV
switch
and
the
horizontal
POSITION
control
to
locate
the
display
within
the
display
area.
Then
adjust
the
FOCUS
control
as needed.
MAGNIFIED
SWEEP DISPLAY
1.
Obtain a Normal
Sweep
Display.
2.
Adjust
the
horizontal
POSITION
control
to move the
area to
be
magnified
to
with
in the
center
graticule
division
(0.5
division
on
each
side
of
the
center
vertical
graticule
line).
It
may
be
necessary
to
change
the
TIME/DIV
switch
setting
.
3.
Push the X 10
MAG
switch
(on) and
adjust
the
horizontal
POSITION
control
for
precise
positioning
of
the
magnified
display. Divide
the
TIME/DIV
setting
by
10
to
determine
the
magnified
sweep rate.
DELAYED SWEEP DISPLAY
NOTE
Differential
time
measurements
and
measurements
using
the TIME
or 1 ITIME
functions
of
the
DM44
are
invalid
when
the B
Trigger
SOURCE
switch
is
not
set
to
STARTS
AFTER
DELA Y.
1.
Obtain a Normal
Sweep
Display
.
2.
Set the
HORIZ
DISPLAY
switch
to A
INTEN
and the
B
Trigger
SOURCE
switch
to
STARTS
AFTER DELAY.
3.
Pullout
on
the B
TIME/DIV
knob
and
turn
cw
until
the
intensified
zone
is the desired
length. Adjust
the
INTENSITY
control
as needed
to
make
the
intensified
zone
distinguishable
from
the rest
of
the
display. If
your
instrument
is
equipped
with a DM44
, set the
FUNCTION
switch
to a function
other
than
TIME
or
1/TIME
for a single
delayed sweep . Dual delayed
displays
are discussed in
step 6.
@
475A/DM44
Operators 17
Page 26

4.
Adjust
the
DELAY
TIME
POSITION
control
to move
the intensified zone to
cover
the
portion
of
the
display
to
be displayed in delayed form.
5.
Set the HOR IZ
DISPLAY
switch
to
B DL Y'D.
The
intensified zone
noted
in steps 3 and 4 is
now
displayed in
delayed form.
The
delayed sweep rate
is
indicated
by the
dot
on
the B TIME/DIV
knob.
6.
If
your
instrument
is
equipped
with
a DM44 delayed
displays
of
two
signals can be
obtained
at the same
time
.
The
DM44
will
indicate
the
time
difference
between the
beginning
of
the delayed
displays. To
obtain
two
delayed
displays
set the
FUNCTION
switch
to
TIME
and
the
VERT
MODE
switch
to ALT.
The
DELAY
TIME
POSITION
control
positions
both
delayed displays.
The
AL
T DELAY
control
positions
only
the
CH
2 delayed display.
7.
For
a delayed
display
with
less jitter, set the B
Trigger
SOURCE
switch
to
the
same
position
as the A
Trigger
SOURCE
switch
and adjust
the
B LEVEL
control
for
a stable display.
MIXED SWEEP DISPLAY
1.
Obtain a
normal
sweep display.
2.
Pullout
on the B
TIME/DIV
knob
and
turn
cw
to the
desired sweep rate.
If
your
instrument
is
equipped
with
a
DM44 set the
FUNCTION
switch
to a
function
other
than
TIME
or
11TIME
for
a single mixed display. Dual
mixed
displays are discussed in step
4.
3.
Set the
HORIZ
DISPLAY
switch
to MIX.
The
display
now
contains
two
sweep rates.
The
first
portion
of
the
display
is
at the A sweep rate
while
the
latter
portion
of
the
display
is at the B sweep rate.
The
start
of
the B sweep rate
portion
can be changed
by
adjusting
the
DELAY
TIME
POSITION
control.
4.
If
your
instrument
is
equipped
with
a DM44, mixed
sweep displays
of
two
signals can be
obtained
at the same
time. The
DM44
will
indicate the time
difference
between
the
beginning
of
the
B sweep
portions
of
the
two
displays.
To
obtain
two
mixed
sweep
displays
set the
FUNCTION
switch
to
TIME
and the VERT
MODE
switch
to
ALT.
The
DELAY
TIME
POSITION
control
positions
both
mixed
displays.
The
6.
TIME
control
positions
only
the
CH 2
mixed
display
.
X-Y DISPLAY
1.
Preset the
instrument
controls
as given in step 1
of
Normal
Sweep Display, then
turn
the
instrument
power
on.
Allow
several minutes
for
instrument
warm-up.
18
475A/OM44 Operators
@
I
I
I
I
I
I
I
I
I
Page 27

I
I
I
I
I
I
I
I
I
2.
Set the
T/ME/D/V
switches
to
X-Y and the VERT
MODE
switch
to CH
2.
Apply
the vertical signal to the
CH 2
OR Y
input
connector
and the horizontal signal
to
the CH 1 OR X
input
connector
.
3.
Advance the INTENSITY
control
until
the display is
visible.
If the
display
is
not visible
with
the
INTENSITY
control
at midrange, press the BEAM FINDER
pushbutton
and
adjust
the
CH
1 and
CH
2 VOL
TS/D/V
switches
until
the
display
is
reduced in size, both
vertically
and
horizon-
tally.
Center
the
compressed
display
with
the POSITION
controls
(CH 2
POSITION
vertically, CH 1 POSITION
horizontally);
release the BEAM FINDER
pushbutton.
Adjust
the FOCUS
control
for a
well-defined
display.
SINGLE SWEEP DISPLAY
1. Obtain a Normal Sweep Display. For random
Signals, set the
trigger
circuit
to
trigger
on a signal that
is
approximately
the same
amplitude
and frequency
as
the
random
signal.
2.
Push the
SINGL
SWP
button
on the A
TRIG
MOOE
switch. The next
trigger
pulse starts the sweep and
displays a
single trace. If no
triggers
are present, the
READY
lamp lights,
indicating
the A Sweep
Generator
circuit
is set and
waiting
to be triggered.
3.
After
the sweep is complete, the
circuit
is
"locked
out"
and the READY lamp is out. Press the
SINGL
SWP
button
to prepare the
circuit
for
another
single-sweep
display.
@
475A/OM44
Operators
19
Page 28
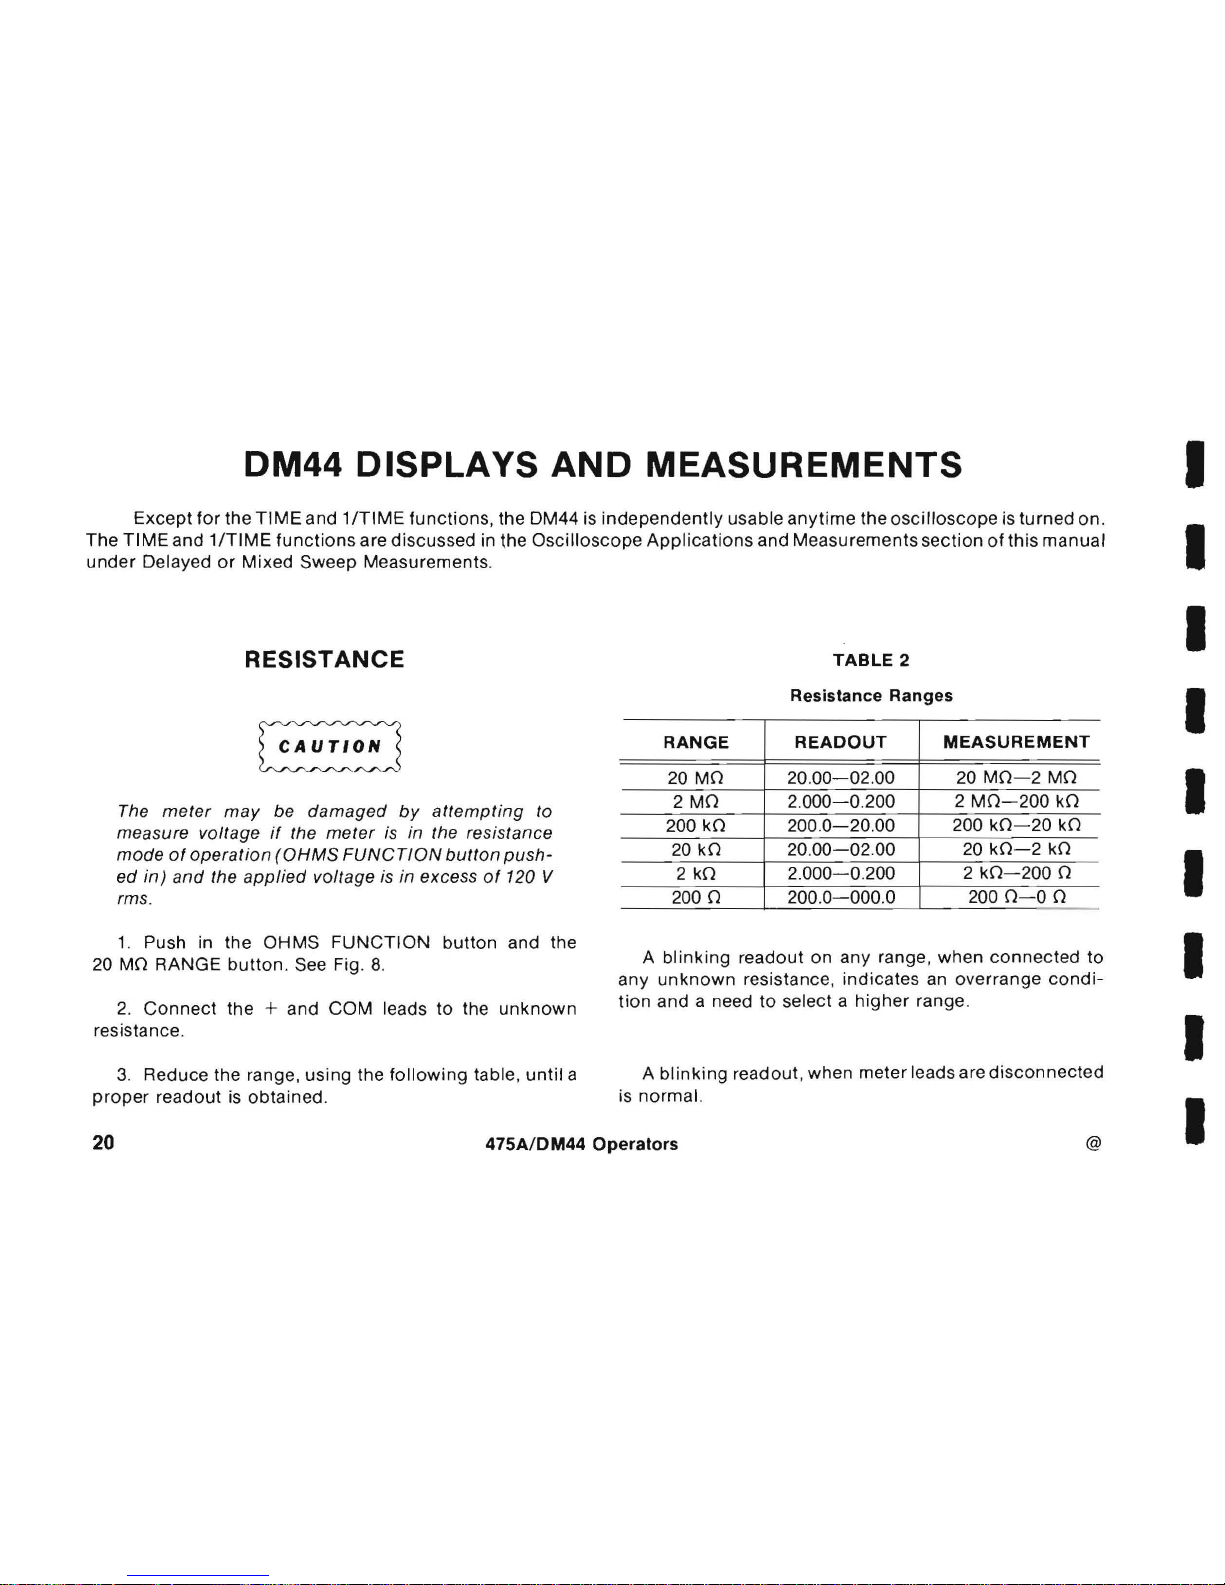
DM44 DISPLAYS
AND
MEASUREMENTS I
Except
for
the
TIME
and 11TIME
functions,
the DM44 is
independently
usable
anytime
the
oscilloscope
is
turned
on.
The
TIME
and
1/TIME
functions
are discussed in the
Oscilloscope
Applications
and Measurements
section
of
this
manual
I
under
Delayed
or
Mixed
Sweep Measurements.
RESISTANCE
The
meter
may
be
damaged
by
attempting
to
measure voltage
if
the
meter
is in the resistance
mode
of
operation
(OHMS
FUNCTION
button
push-
ed
in)
and
the
applied
voltage is in excess
of
120 V
rms.
1. Push
in
the
OHMS
FUNCTION
button
and the
20 MO RANGE
button.
See Fig.
8.
2.
Connect
the
+ and
COM
leads to the
unknown
resistance.
3.
Reduce the range, using the
following
table,
until
a
proper
readout
is
obtained
.
TABLE 2
Resistance Ranges
RANGE
READOUT
MEASUREMENT
20
MO
20 .
00-02
.00
20
MO-2
MO
2
MO
2.
000-0
.200
2
MO-200
kO
200 kO 200 .
0-20.00
200
kO-20
kO
20 kO
20 .
00-02.00
20
kO-2
kO
2
kO
2.000-0.200
2
kO-200
0
2000
200.
0-000.0
2000-00
A
blinking
readout on any range,
when
connected
to
any
unknown
resistance ,
indicates
an overrange
condi-
tion
and a need
to
select a
higher
range.
A
blinking
readout , when
meterleadsaredisconnected
is normal.
20
475A/DM44
Operators
@
I
I
I
I
I
I
I
Page 29

I
I
I
I
I
I
I
I
I
@
RANGE
SELECTION
Fig. 8. Resistance .
475A/DM44
Operators
(465/DM
-O-
2)2039
-9
21
Page 30

VOLTS
The
maximum
safe
input
voltage
is
±1200 V (dc
+
peak
ac)
between
the +
and
COM
inputs
or
between
the +
input ,and
chassis
.
The
maximum
COM
floating
voltage
is
±500 V (dc
+
peak
ac)
to
chassis
.
The
meter
may
be
damaged
by
attempting
to
measure
voltage
if
the
meter
is
in
the
resistance
mode
of
operation
and
the
applied
voltage is in
excess
of
120 V rms.
If
the
reading
exceeds
1200
Vor
the
readout
blinks
(indicating
overrange)
disconnect
the +
lead
at
once
to
prevent
possible
meter
damage.
1.
Push in the
VOLTS
FUNCTION
button
and the
1.2 kV RANGE
button.
See Fig.
9.
2.
Connect
the
COMMON
lead to the reference
point
(usually a ground
or
test
point)
and the
HIGH
lead to the
unknown
voltage
to be measured and observe the reading .
3.
Reduce the range,
using
Table
3,
until a proper
readout is
obtained
.
NOTE
When
no
voltage
is
applied
in
the
20
V
to
1.2
kV
ranges, the
readout
is
0000
and
individual
readout
elements
may
blink. Also,
noise
picked
up
by
the
meter
leads
may
increase
the
readout
in
the.2
Vand
2 V ranges .
A
blinking
readout
on
any
range
indicates
an
overrange
condition
and a need
to
select a higher
range .
TABLE 3
Volts Ranges
RANGE
READOUT
MEASUREMENT
1.2
kV
1 .
200-0.200
1.2
kV-200
V
200 V 200.
0-020.0
200
V-20
V
20 V
20.
000-02
.00 20
V-2
V
2V
2.000-0
.200 2
V-.2
V
200 mV 0.
200-0.000
.2
V-O
V
22
475A/DM44 Operators
@
I
I
I
I
I
I
I
I
I
Page 31

I
I
I
I
I
I
I
I
I
@
Fig. 9. Volts.
475A/DM44
Operators
(465/DM
-O-
3)2039-10
23
Page 32

TEMPERATURE
The
maximum
safe voltage
on
the
measurement
surface
is
±400 V (dc + peak
ac)
above chassis
ground
.
The
sensor
tip
is
fragile
and
may
break
if
dropped
or
subiected
to excessive stress. Force
exerted
on
the
sensor
tip
should
not
exceed
20
pounds
.
"the
reading
exceeds
- 55° C
or
+ 150°
C,
remove
the
probe
at
once
to
prevent
probe
damage .
1.
Push in the TEMP (0
C)
FUNCTION
button
. See
Fig. 10.
2.
Apply
the
temperature
probe
to
the device to be
measured so the flat surface
of
the
probe
tip
mates against
the device to be measured and observe the reading.
See
Table 4 to
convert
the reading from
centigrate
to
fahrenheit.
NOTE
Temperature
accuracy
is
affected
by
several
factors
such
as the
angle
of
contact
between
the
probe
and
the
device
to
be
measured, a
thermal
gradient,
heat
removed
from the
device
by
the
probe,
etc.
These items
and
other
probe
information
are in the
probe
manual,
which
should
be reviewed.
Accuracy Check
The
DM44
is
calibrated
to
its
original
probe,
giving
accurate readings
within
2°C
for
examples that
follow
.
The DM44
should
be recalibrated to any
replacement
probe
.
In the
following
checks
, use an accurate
thermometer
to
verify
water
temperature.
Anything
in
solution
affects
the
melting
temperature and the
boiling
point
is affected
by changes
in
altitude
and
barometric
pressure .
low
Temperature
Allow a container
(preferably
insulated)
of
crushed
ice
to melt
until
there are
only
a few pieces
of
ice
remaining.
24
475A/DM44 Operators
@
I
I
I
I
I
I
I
I
I
Page 33

I
I
I
I
I
I
I
I
I
@
PROBE
INPUT
GREASE
YSILICONE
OBE
APPiHE
SURFACE
TpOSSIBLEI.
TO
RED
(WHEN
MEASU
----
-
--------------:.;n
·0
Temperature.
Fig. 1 .
D
M44
Operators
475AI
PROBE
TEMPERATURE
SENSOR
TIP
(465
THIS
NOT
<J
IO
M·O·4)2039·11
25
Page 34

CENTIGRADE
FAHRENHEIT
CENTIGRADE
FAHRENHEIT
CENTIGRADE
FAHRENHEIT
CENTIGRADE
FAHRENHEIT
26
TABLE
4
CENTIGRADE
TO
FAHRENHEIT
CONVERSION
-
50
-
40
-
30
-
20
-10
0
II
I
I I I I
I'
,
I'
" " " "
I,
, , ,
I'
, , ,
I,
I , I
I'
I I I
II
, I I
1\
I'
I I
i I
iii
I'
lit
iii iii
iii
i i
III
iii
I i
11111
iii
i I
'I
iii
(
Iii
'I
i
II I 11
I ii' (
iii
i
111
iii
i ill i
-
50
-40
-30 -20
-10
0
10
20
30
o
10
20
30
40
50
II
' I ' , ' , , ,
I'
, , , I , , , ,
I,
, ,
~
I ' , I I I , , , , I I , I I I' , I , I I I ' , I
i
IIIII
iill·il.
lidt·r"I")""'I""
iiiliiiq'iiiliillili'llii
'fifilii!
i
1111
40
50
.
60
70
80
90
100
110
120
50
60
70
80
90
100
I I , , I I' I I I
I'
, , , I ' I I I
I,
I I I I , , , ,
I,
~
I , I I I , I
~
, I I I I I I I I I
"111111
ililftl
illfrlii
1'lii.fiiP"!
iliiliilr.
iii
ii.iii'lliff
liliql!
i
ilill'
130
140
150
160 170
180 190
200
210
100
110
120
130
140
150
I ' , I I
~
I , I I
I'
, , I I ' , , , I
I'
'I I I I , I , ' 1 I I I ' I I I
II
I I I , I \ ' , I
1IIIIni
flljiIJlfilljlfl
I""plllllllllll"lli
11111111111111111"11111 I 1 "II
220
230
240
250
260
270
280
290
300
475A/DM44
Operators
@
I
I
I
I
I
I
I
1
·1
Page 35

I
I
I
I
I
I
I
I
I
To
prevent
possible
probe
damage, be sure
only
the
sealed
portion
of
the
probe
is
immersed
(see Fig. 10).
Put the
probe
tip
into
the water,
avoiding
the
side
or
bottom
of
the
container
. Wait
for
the readout to stabilize,
indicating
the
probe
has reached the
water
temperature.
The
readout
should
be
-2°C
to
2°C.
There
should
be
ice
remaining
after
the test to
verify
that
inserting
the
probe
did
not
raise the
water
temperature
.
High Temperature
Bring
water
to a
slow
boil
(to prevent
splattering).
Put
the
probe
tip
into
the water,
avoiding
the
side
or
bottom
of
the container. Wait
for
the readout to stabilize,
indicating
the
probe
has reached the
water
temperature.
The
readout
should
be between 98°C and 102°C
for
clean
water
at sea level.
TIME
AND
1/TIME
See DM44
DELAYED
OR
MIXED
SWEEP
TIME
MEASUREMENTS
in this manual.
@
475A/OM44
Operators
27
Page 36

APPLICATIONS AND MEASUREMENTS
Refer to Basic
Oscilloscope
Displays as needed to
obtain
correct
displays.
PRELIMINARY
Signal Ground
~
Avoid
cross-grounding
because
instrument
damage
may
occur
.
The
most reliable measurements are made when the
oscilloscope
ground
is
connected
to
the
ground
of
the
unit
under
test by
the
ground
strap on
the
signal probe.
Also
a
ground
lead can be
connected
to the
ground
banana
jack
on
the
oscilloscope
chassis to establish a
common
ground
with
the
unit
under
test.
Input Coupling Capacitor Precharging
In the
GND
position, the
input
signal is
connected
to
ground
through a one-megohm
resistor to form a
precharging
network. This
network
allows the
Input
Coupling
capacitor
to
charge
to the average
dc
voltage
level
of
the
signal
applied
to the probe.
Thus, any
large
voltage transients
accidentally
generated
will
not
be
applied to the
amplifier
input.
The
precharge
network
also
provides a measure
of
protection
to
the
external ci rcu
itry
by
reducing
the
current
levels that can be
drawn
from the
external
circuitry
during
capacitor
charging.
The
following
procedure
should
be used whenever
the
probe
tip
is
connected
to a signal sou rce having a
different
dc
level than
that
previously
applied,
especially if the
dc
level
difference
is
more than 10 times the
VOL
TS/ DIV
setting.
1. Before
connecting
the
probe
tip to a signal source,
set the
Input
Coupling
switch to
GND.
2.
Touch
the
probe
tip
to
oscilloscope
chassis
ground
.
Wait several
seconds
for
the
Input
Coupling
capacitor
to
discharge.
3.
Connect
the
probe tip to the signal
source
.
4.
Wait several
seconds
for
the
Input
Coupling
capacitor
to charge.
5.
Set the
Input
Coupling
Switch
to AC. The
display
will
remain on the screen so
the
ac
component
of
the
signal can
be
measured in the
normal
manner.
28
475A/OM44
Operators
@
I
I
I
I
I
I
I
I
I
Page 37
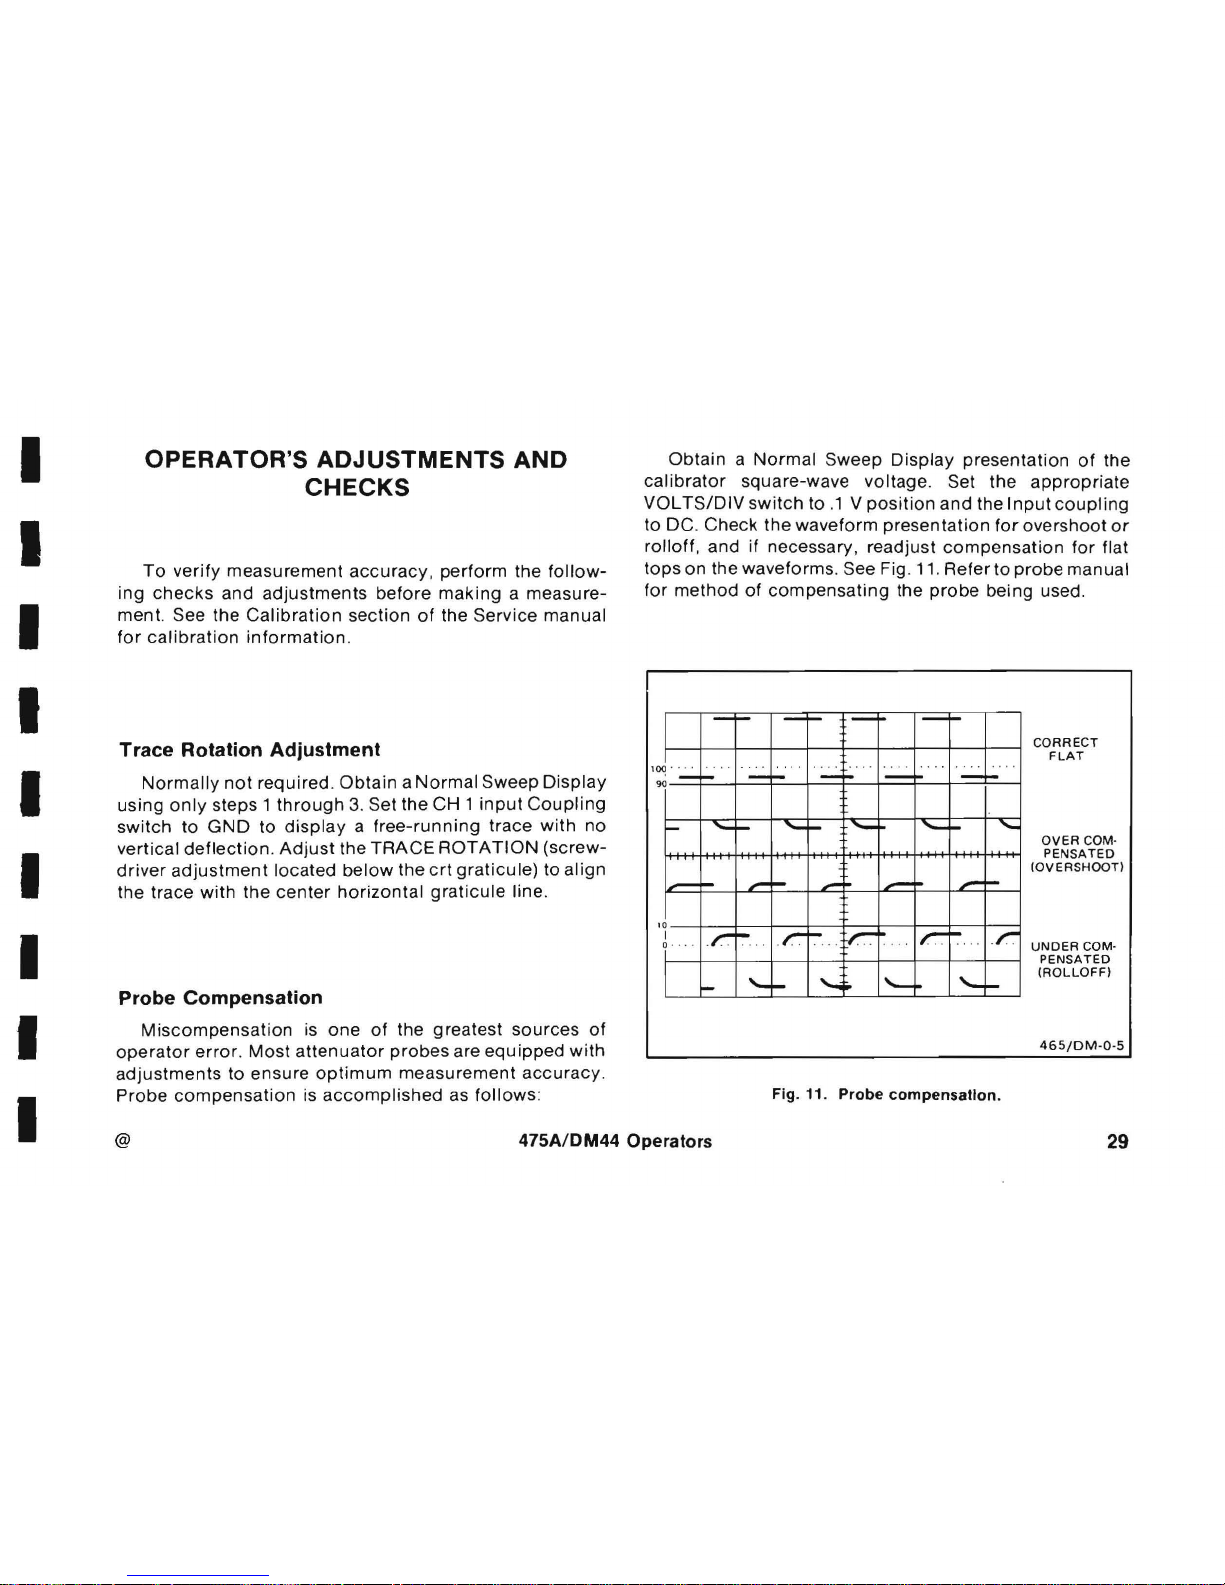
I
I
I
I
I
I
I
I
I
OPERATOR'S
ADJUSTMENTS
AND
CHECKS
To
verify
measurement
accuracy, perform
the
follow-
ing
checks
and
adjustments
before
making a measure-
ment
. See the
Calibration
section
of
the Service
manual
for
calibration
information
.
Trace Rotation Adjustment
Normally
not
required. Obtain a Normal
Sweep
Display
using
only
steps 1
through
3. Set the
CH 1 input
Coupling
switch
to
GND
to
display a free-running
trace
with
no
vertical
deflection. Adjust
the
TRACE
ROTATION
(screw-
driver
adjustment
located
below
the
crt
graticule)
to
align
the trace
with
the
center
horizontal
graticule
line
.
Probe Compensation
Miscompensation
is
one
of
the greatest
sources
of
operator
error.
Most
attenuator
probes
are
equipped
with
adjustments
to
ensure
optimum
measurement
accuracy
.
Probe
compensation
is
accomplished
as
follows
:
Obtain a Normal
Sweep
Display
presentation
of
the
calibrator
square-wave voltage. Set the
appropriate
VOL
TS/DIV
switch
to.1 V position
and
the
Input
coupling
to
DC.
Check
the
waveform
presen
tation
for
overshoot
or
rolloff,
and
if
necessary, readjust
compensation
for
flat
tops
on the
waveforms
. See Fig. 11.
Refer
to
probe
manual
for
method
of
compensating
the
probe
being used.
-
t-
J.
.,,;
-
I-
-
1
00
f-
"-
f-
I-
I-
-
lO
I
1
r
I-
I-
'-
-
+-
.-
r-=
~
.
...
I-
-r-
1-
-
l-
"-
I-
.~
'-
...
"-
f-
-
-~
,-
f-
r
I-
Er
~
Ir
~
..
r.
f-
~'"'
I'-~
'-
f-
Fig. 11.
Probe
compensation
.
CORRECT
FLAT
OVER
COM·
PENSATED
(OVERSHOOT)
UNDER
COM·
PENSATED
(ROLLOFF)
465/DM·Q
·5
@
475A/DM44
Operators
29
Page 38

Vertical Gain Check
Obtain a Normal
Sweep
Display
presentation
of
the
cal
ibrator
square-wave voltage. Set the
appropriate
VOL
TS/DIV
switch
to the 50 mV
position
and the
Input
Coupling
switch
to DC. Make sure the VAR
VOL
TS/DIV
control
is in the
calibrated
detent.
Check
that the vertical
deflection
is 5.8
to
6.2
divisions.
Basic 475A Timing Check (60 Hertz Line Only)
Obtain a Normal
Display. Set the A
TIME/DIV
switch
to
5 ms
position
. Set the A
Trigger
SOURCE
switch
to
LINE
.
Push the
TRIG
VIEW
switch
and
hold
it in.
This
displays
a
sample
of
the line voltage. Use the A
Trigger
LEVEL
control
to
vertically
position
the
top
of
the
display
to
with
in
the
display
area. Use the
horizontal
position
control
to
position
the
left
peak to the left g raticule
edge
(see Fig.
12).
Verify
the
horizontal
distance
between the first and
the
fourth
peaks is 9.8
to
10.2 divisions. If the
fourth
peak
is
not
visible,
verify
the
horizontal
distance
between the
first
and
the
third
peaks is 6.53
to
6.79 divisions.
DM44 Timing Check (60 Hertz Line Only)
Perform
the
Basic
475A
Timing
Check
to
verify
the
accuracy
of
the
horizontal
deflection
system.
Leave
controls
set as
for
the
Basic
475A
Timing
Check
except
as
follows:
B
TIME/DIV
HORIZ
DISPLAY
B
SOURCE
FUNCTION
t::"
TIME
I
I
51-1s
A
INTEN
STARTS
AFTER
DELAY
TIME
To
move
the
time-
measurement
pOint
to
the
right
of
the
reference
point.
9.8 TO
10.2
6.53
TO
6.79
100
.
. . . . . . .
..
. . . .
..
9[\
n.
\
1
\
10
I
I
...
. . . . .
..
.
. . . .
1738,14
Fig. 12.
Basic
475A
timing
check
.
30
475A/OM44 Operators
@
I
I
I
I
I
I
I
I
I
Page 39

I
I
I
I
I
I
I
I
I
Push the
TRIG
VIEW
button
and
hold
it in. Use the
DELAY
TIME
POSITION
control
to
move the reference
point
to
the
center
horizontal
graticule
line
(see Fig. 13,
Point
A). Use the
AL T DELAY
control
to
move the
time-
measurement
point
to the
center
horizontal
graticule
line
on
the
next
cycle
(see Fig. 13,
Point
B).
Verify
the
readout
is 16.49 to 16.84
and
the ms lamp is lit.
·
·CR·
;..
...
..
~
. .
r\
\
100
\
\
1
1\
,
1O
I
I"
. .
.. . , .
...
..
. . .
..
1738·15
Fig.
13.
DM44 timing check.
External Horizontal Gain Check
(If
X-Y
operation
is to be used .)
Use
steps 1
through 3 of
the Basic
Oscilloscope
Displays
procedure
for
obtaining
a
Normal
Sweep
Display
of
the
calibrator
square-wave
voltage
waveform ; then, set the
TIMEIDIV
switch
to
X-Yo
With the
calibrator
signal
connected
to
the
CH
1 OR X
input
connector
and the
CH 1 VOL
TS/DIV
switch
set to
50
mV , the
crt
display
should
be
two
dots
separated
horizontally
by 5.75
to 6.25
divisions
.
PEAK-TO-PEAK VOLTAGE
MEASUREMENTS-AC
Obtain a Normal
Display. Make sure the VAR
VOL
TS/DIV
control
is in the
calibrated
detent.
Vertically
position
the
display
so the
lower
portion
coincides
with
a
horizontal
graticule
line (see Fig. 14,
Point A).
Horizontally
position
the
display
so
one
of
the
upper
peaks
coincides
with
the
center
vertical
graticule
line
(see Fig. 14, Point B).
Measure the
vertical
deflection
from
peak-to-peak
(Point
A to
Point
B).
@
475A/DM44
Operators
31
Page 40

32
POSITION
TO
CENTERLINE
VERTICAL
DEFLECTION
~c...,lI-+-t------t--r--t--#-t----I-~
~
___
i
MEASURE
AMPLITUDE
FROM
ATO
B
(1738·16)2039·15
Fig. 14. Peak-to-peak voltage
of
a waveform.
NOTE
If
the
amplitude
measurement
is
critical
or
if
the
trace is
thick
as a
result
of
hum
and/or
noise
on
the
signal
, a
more
accurate
measurement
can be
ob-
tained
by
measuring
from
the top
of a peak
to the
top
of
a valley. This
will
subtract
the trace thickness from
the
measurement
.
Multiply
the vertical
deflection
just
measured
by
the
VOL
TS/DIV
switch
setting .
Also
include
the
attenuation
factor
of
the
probe
if the
probe
does
-not
have a scale-
factor
switching
connector.
Example:
The
peak-to-peak
vertical
deflection
measured
is
4.6
divisions
(see Fig . 14)
with
a VOL
TS/DIV
switch
setting
of
.5.
Using the
formula
:
Volts
Peak-to-peak
vertical
deflection
(divisions)
Substituting
the given values:
X VOL
TS/DIV
setting
Volts Peak-to-Peak = 4.6 X 0.5 V = 2.3 volts.
INSTANTANEOUS VOLTAGE
MEASUREMENTS-DC
Obtain a Normal
Display
. Make sure the VAR
VOL
TS/DIV
control
is
in the
calibrated
detent.
475A/DM44 Operators
@
I
I
I
I
I
I
I
·1
I
Page 41

I
I
I
I
I
I
I
I
I
To
determine
the
polarity
of
the voltage to be
measured, set the
input
coupling
switch
to
GND
and
vertically
position
the baseline to the
center
of
the crt. Set
the
input
coupling
switch
to
DC.
If
the
waveform
moves
to
above
the
center
of
the
crt,
the
voltage
is positive. If
the
waveform
moves
to
below
the
center
of
the
crt,
the
voltage
is'
negative.
Set
the
input
coupling
switch
to
GND
and
position
the
baseline
to a convenient
reference
line. For
example, if
the
voltage
to
be
measured
is positive, then
position
the
baseline to the
bottom
graticule
line
.
Switch
the
Input
Coupling
Switch
to
DC. Measure the
divisions
of
vertical
deflection
between the reference line
and
the desired
point
on
the
waveform
(see Fig. 15).
Multiply
the
veritcal
deflection
by
the
VOL
TS/DIV
switch
setting.
Include
the
attenuation
factor
of
the
probe
if
the
probe
does
not
have a
scale-factor
switching
connector
.
EXAMPLE:
The
vertical
distance
measured is
4.6
divisions
(see Fig. 15), the
waveform
is above the
reference
line, and the
VOL
TS/DIV
switch
is
set
to 2.
_ L
:EGATIVE
REFERENCE
LINE
~
I
,J
·
dx
90
u
""
--
--
-
T---
~
VERTICAL
DEFLECTION
MEASURE
L_
AMPLITUDE
1 "
ATO
B
____
t .
OR
NEGATIVE
AMPLITUDE
CTfB
W
465/DM·
O-7
Fig_
15.
Instantaneous
yoltage
measurement.
Using
the
formula
:
Instantaneous
Voltage
vertical VOL
TSI
distance
X
polarity
X DIV
(divisions)
setting
Substituting:
= 4.6 X
(+1)
X 2 V = 9.2 volts.
@
475A/DM44 Operators
33
Page 42

If a negative
voltage
is to be measured,
position
the
trace to the
top
graticule
line
and measure from C to 8 (see
Fig. 15).
The
ground
reference
line
can be
checked
at
any
time
by
switching
to the
GND
position.
This
method
can also be used to measure
one
voltage
with
respect to
another. Position
one
of
the
voltage
levels
to a
convenient
reference line. Measure the
divisions
of
vertical
deflection
between the reference line and the
other
voltage
level.
Substitute
this value in the
formula
just
given.
ALGEBRAIC
ADDITION
In the
ADD
position
of
the VERT
MODE
switch,
the
waveform
displayed
is the
algebraic
sum
of
the
signals
applied
to the
CH
1 and
CH 2 inputs
(CH 1 +
CH
2). If the
CH 21NVERT
switch
is pushed, the
waveform
displayed
is
the
difference
of
the
signals
applied
to the CH 1 and
CH
2
inputs(CH
1 -
CH
2).
The
total
deflection
factor
in the
ADD
mode
is
equal
to the
deflection
factor
indicated
by
either
VOL
TS/DIV
switch
(when
both
VOL
TSIDIV
switches
are set to the same
position).
The
following
general
precautions
should
be observed
when
using
the
ADD
mode.
1.
Do
not exceed the
input
voltage
rating
of
the
oscilloscope.
2.
Do
not
apply
signals
that
exceed
an
equivalent
of
about
eight
times the
VOL
TSIDIV
switch
settings. For
example,
with a VOL
TS/DIV
switch
setting
of
0.5, the
voltage
applied
to that
channel
should
not
exceed
about
four
volts
. Large voltages may
distort
the
display.
A
common
use
of
the
ADD
mode
is to
provide a dc
offset
for a signal
riding
on a dc
level.
EXAMPLE:
The
Channel 1 signal
is on a 3
division,
positive
dc
level (using the
center
line
as
zero volts). See
Fig. 16A.
Multiply 3 divisions
by
the
VOL
TS/DIV
switch
setting
to
determine
the
dc-level
value.
Apply
a negative
dc
level
(or
a positive level
using
the
CH
21NVERT
switch),
of
the value
determined,
to
Channel 2 input.
See Fig . 168.
The
ADD
mode
puts the
resultant
display
within
the
operating
range
of
the
POSITION
controls
.
34
475A/DM44 Operators
@
I
I
I
I
I
I
I
I
I
Page 43

I
I
I
I
I
I
I
I
I
ov
VI
V
II
II
V
~
'"
'0
I
0
I
POSITIVE
LEVEL
(A)
CHANNEL 1 SIGNAL
WITH 3 DIVISIONS
OF
POSITIVE
DC
LEVEL.
.J
~
ov
"
NEGATIVE
OFFSET
(8)
CHANNEL 2 DISPLAY
WITH 3 DIVISIONS
OF
NEGATIVE
OFFSET
.
Fig
. 16.
Algebraic
addition.
"'
V I V
V
/ /
..
(C)
RESULTANT
DISPLAY
465/0M·O·19
COMMON-MODE
REJECTION
EXAMPLE:
The
signal
applied
to the
CH 1 input
contains
unwanted
lin e
frequency
components
(see Fig.
17A).
To
remove
the
undesired
components
use the
following
procedure
.
The
ADD
mode
can
be used to
display
signals
that
contain
undesirable
components. These
undesirable
components
can be e
liminated
through
common
mode
rejection.
The
precautions
given
under
algebraic
addition
should
be
observed
.
1.
Connect
a line fr
eque
ncy
signal
to the
CH 2 input.
2. Set the VERT
MODE
switch
to
AL
T and the
CH
2
INVERT
switch
to
on
(button in).
Adjust
the CH 2
@
475A1DM44 Operators
35
Page 44
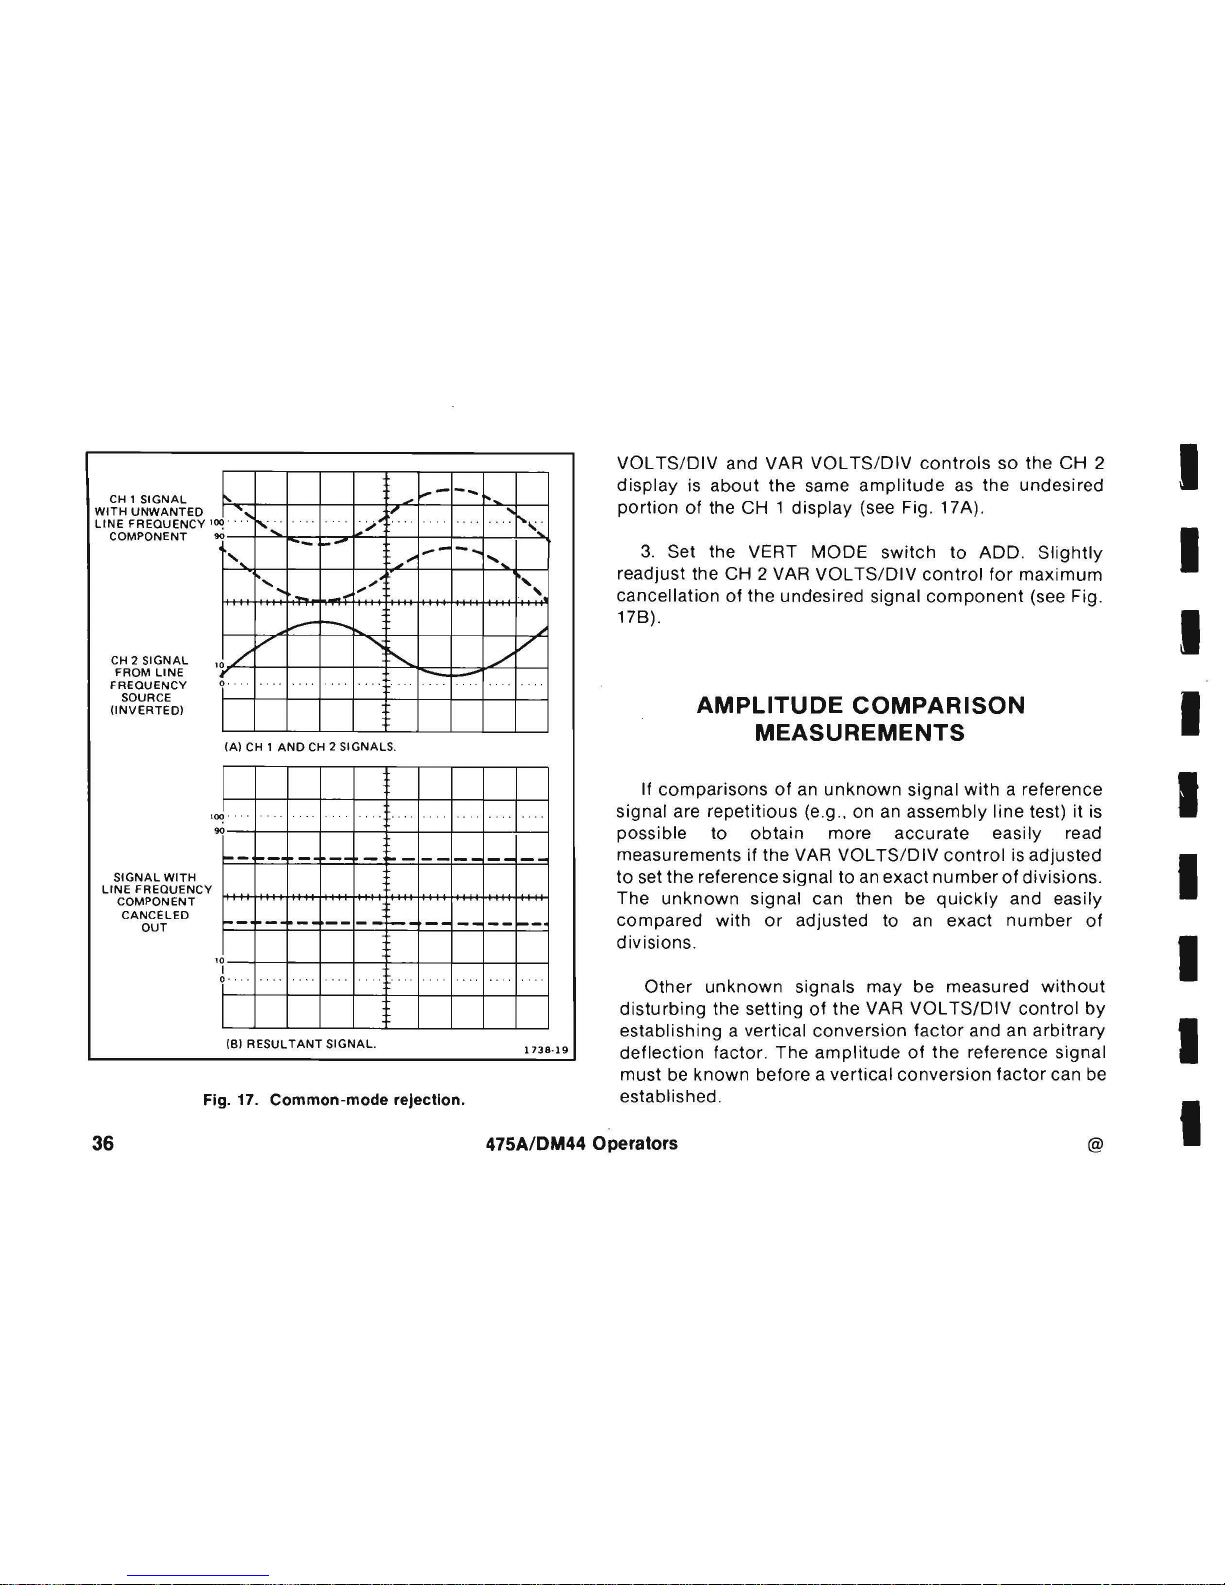
CH 1
SIGNAL
J
.:"
WITH
UNWANTED
LINE
FREQUENCY
100
COMPONENT
90
CH 2
SIGNAL
FROM
LINE
FREQUENCY
SOURCE
(INVERTED)
....
10/
r
j
1'
....
./
--
--
,"
.......
",,"
.......
......
"-
(A)
CH 1
AND
CH 2 SIGNALS.
.-
SIGNAL
WITH
~-
-...
..
..
"':'
"..-
-
..
'
...
,
,
./
V
-r-
- -
LI
~~~~6~~
~
~
C Y
~+t++++j-t+<*ft-+++t++>+t>+++-t++++tH+<>tH++t++++i
CANCELED
OUT
r-
- -
------
--
--
----
'~--+--+--~~--~~---r~r--r~
L
(6)
RESULTANT
SIGNAL.
1738·19
Fig. 17.
Common-mode
reJection.
VOL
TS/DIV
and VAR VOL
TS/DIV
controls
so
the
CH
2
display
is
about
the same
amplitude
as
the undesired
portion
of
the CH 1
display
(see Fig. 17A).
3. Set the VERT
MODE
switch
to
ADD.
Slightly
readjust the CH 2 VAR VOL
TS/DIV
control
for
maximum
cancellation
of
the undesired signal
component
(see Fig.
178).
AMPLITUDE
COMPARISON
MEASUREMENTS
If
comparisons
of
an
unknown
signal
with
a reference
signal are
repetitious
(e.g., on an assembly
line
test) it
is
possible to
obtain
more
accurate
easily read
measurements if the VAR
VOL
TS/DIV
control
is
adjusted
to
set the reference signal to an
exact
number
of
divisions.
The
unknown
signal can then be
quickly
and easily
compared
with
or
adjusted to an exact
number
of
divisions.
Other
unknown
signals
may
be measured
without
disturbing
the setting
of
the VAR VOL
TS/DIV
control
by
establishing a vertical
conversion
factor
and an
arbitrary
deflection
factor.
The
amplitude
of
the reference signal
must be
known
before a
vertical
conversion
factor
can be
established.
36
475A/DM44 Operators
@
I
I
I
I
I
I
I
I
I
Page 45

I
I
I
I
I
I
I
I
I
Determine
the
vertical
conversion
factor
using
this
formula
:
Vertical
reference
signal
amplitude
(volt)
Conversion
Factor
vertical
VOLTS/DIV
deflection
X
switch
(divisions)
setting
Determine
the
arbitrary
deflection
factor
using
the
formula
:
Arbitrary
Vertical
VOLTS/DIV
Deflection
Conversion
X
switch
Factor
Factor
setting
To
measure
the
amplitude
of
an
unknown
signal.
set the
VOL TS/
DIV
switch
to a setting
that
provides
sufficient
vertical
deflection
to
make an
accurate
measurement. Do
not
readjust
the VAR
VOL
TS/DIV
control.
Measure
the
vertical
deflection
in
divisions
and
calculate
the
amplitude
of
the
unknown
signal
using
the
following
formula:
Signal
Amplitude
Arbitrary
deflection
factor
or
Vertical
X
deflection
(divisions)
Signal
Vertical
VOL
TS/DIV
Vertical
=
Convers
ion X
Amplitude
Factor
switch
X
deflection
setting
(divisions)
EXAMPLE: The
reference signal
amplitude
measured is
30 volts
with a VOL
TS/DIV
switch
setting
of
5 and
the
VAR
VOL
TS/
DIV
control
adjusted
to
provide
a vertical
deflec-
tion
of 4 divisions
.
Substituting
these values in
the
vertical
conversion
factor
formula:
Vertical
Conversion
Factor
30
4X5
1.5
Then
with a VOL
TS/DIV
switch
setting
of
1, the
peak-
to-peak
amplitude
of
an
unknown
signal
, 5
divisions
high
can be
determined
by
using
the
signal
amplitude
formula
:
Signal
Amplitude:
= 1 V X 1.5 X 5 = 7.5
volts
.
TIME-DURATION
MEASUREMENTS
Obtain a Normal
Sweep
display
. Be sure the VAR
TIME
/OIV
control
is set to the
calibrated
detent. Set the
TIME/DIV
switch
for a single
event and
position
the
display
to
place
the
time
measurement
pOints
to
the
center
horizontal
graticule
line (see Fig. 18).
@
475A/OM44 Operators
37
Page 46

I~
..
·
·1/
~.
..
.. ... ..
..
...
.
00
\
I I
/
I.
/ \
10/
\
/
. .
....
...
"-
V ·
HORIZONTAL
DISTANCE
1738·20
Fig. 18.
Time
duration.
Measure the
horizontal
distance
between the
time
measurement
points. Multiply
the
distance
measured
by
the setting
of
the
TIME/DIV
switch. If
sweep
magnification
is
used, divide
this
answer
by
10.
EXAMPLE : The
distance
between the
time
measure-
ment
points
is 8.3
divisions
(see Fig . 18) and the
TIME/DIV
switch
is
set to 2 ms
with
the
magnifier
off.
Using the
formula
:
horizontal
Time
Duration
distance
X
Time/Div
setting
(divisions)
magnification
Substitute
the given values:
Time
Duration
= 8.3 X 2 ms = 16.6
miiliseconds
FREQUENCY
MEASUREMENTS
Time
Duration
measurements can be used to
determine
the
frequency
of
a recurrent signal as
follows
:
1.
Measure
one
cycle
of
the waveform
as
described
in
Time-Duration
Measurements.
2.
Take the
reciprocal
of
the
time
duration
to
deter-
mine
the
frequency
.
EXAMPLE:
The
frequency
of
the signal
shown
in
Fig.
18, which
has a time
duration
of
16.6
milliseconds
is:
1
Frequency = . .
time
duration
1
16.6 ms = 60 hertz
38
475A/DM44 Operators
@
I
I
I
I
I
I
I
I
I
Page 47

I
I
I
I
I
I
I
I
I
RISETIME MEASUREMENTS
Risetime
measurements
use
the
same
methods
as
time-
duration
measurements,
except
the
measurements
are
made
between
the
10% and 90%
points
of
the
waveform.
Falltime
is
measured
between
the
90% and 10%
points
on
the
trailing
edge
of
the
waveform.
Obtain a Normal
Sweep
Display.
Set A
SLOPE
to
+.
Use
a
sweep
speed
setting
that
displays
several
cycles
or
events (if
possible)
and be
sure
the
VAR
TIME/DIV
control
is in
the
calibrated
detent.
Set the
VOL
TS/DIV
switch
and
VAR
control
(or
signal
amplitude)
for
exactly a five/divi-
sion
display.
Set
vertical
positioning
so
the
display
bottom
touches
the
0%
graticule
line
and
the
display
top
touches
the
100%
graticule
line.
Set
the
TIME/DIV
switch
for a single-event
display
with
the
risetime
spread
horizontally
as
much
as
possible.
Horizontally
position
the
display
so
the
10% pOint
on
the
waveform
intersects
the
second
vertical
graticule
line (see
Fig. 19).
Measure
the
horizontal
distance
between
the
10% and
90%
points
and
multiply
the
distance
measured
by
the
setting
of
the
TIME/DIV
switch.
EXAMPLE:
The
horizontal
distance
between
the
10%
and
90%
points
is 5
divisions
(see Fig. 19)
and
the
TIME/DIV
switch
is set
to
1
J1.s.
SIGNAL
AMPLITUD
L,
I
-~
!
"-
~
-c:>
.,/
.,...,..
/
I
V
!
V
~
'I-
fJ
I
HORIZONTAL
---
DISTANCE
Fig. 19. Risetime.
----
-
-
-
ME
TIM
A
ASURE
E
FROM
TO
B
465/DM-O-13
Using
the
time
duration
formula
to
find
risetime:
Time
Duration
(risetime)
horizontal
distance
X
(divisions)
Substituting
the
given
values:
TIME/DIV
setting
Risetime
= 5 X 1
J1.S
= 5
microseconds.
@
475A/OM44
Operators 39
Page 48

TIME-DIFFERENCE BETWEEN
TWO
PULSES FROM
DIFFERENT SOURCES
Obtain a Normal
Sweep Display. Make sure the VAR
TIME/DIV
control
is
in the
calibrated
detent. Set the A
Trigger
SOURCE
switch
to CH 1.
Connect
the reference
signal to CH 1 and the
comparison
signal to CH 2.
Connect
the signals to the
input
connectors
using probes
or
cables
with
equal
time
delay.
Set the VERT
MODE
switch
to
either
CHOP
or
ALT
. In
general,
CHOP
is
more
suitable
for
low-frequency
signals
and the
AL T position
is
more
suitable
for
high-frequency
signals.
Center
each
of
the
displays
vertically
(see Fig. 20).
Measure the
horizontal
difference
between the
two
signals.
Multiply
the measured
difference
by the setting
of
the
TIME/DIV
switch; if sweep
magnification
is used,
divide
this
answer
by
10.
EXAMPLE:
The
TIME/DIV
switch
is
set to
SO
IlS, the
MAG
switch
to
X10
and the
horizontal
difference
between
waveforms is
4.S
divisions
(see Fig. 20).
CHANNEL 1 (REFERENCE)
CHANNEL
2
\
r
I
\
j
.!
\
L
..
'
50%
AMPLITU
LEVEL
~
~
'
@,
I
..!
I
[
®-
I ,
I
I
I
---l
HORIZONTAL
1
___
I
DIFFERENCE
I
M
EASURE
ME
FROM
A
TO
B
TI
465/DM-O-14
Fig.
20.
Time
difference between
two
pulses
from
different
sources.
USing the formula:
Time
/Div
setting
x
horizontal
difference
(divisions)
Time
Difference
magnification
Substituting
the given values:
Time
60lls X 4.S
Difference
10
22.S
microseconds
40
475A/DM44
Operators
@
I
I
I
I
I
I
I
I
I
Page 49

I
I
I
I
I
I
I
I
I
TIME
COMPARISON
MEASUREMENTS
If
comparisons
of
an
unknown
signal
with
a reference
signal
are
repetitious (e.g
.,
on
assembly
line
test) it
is
possible
to
obtain
more
accurate
, easily read
measurements
if the VAR
TIME
/DIV
control
is
adjusted
to
set the
reference
signal
to an
exact
number
of
divisions
.
The
unknown
signal
can
then
be
quickly
and
easily
compared
with,
or
adjusted
to, an
exact
number
of
divisions
.
Other
unknown
signals
may
be measured
without
disturbing
the
setting
of
the VAR
TIME/DIV
control
by
establishing a horizontal
conversion
factor
and an ar-
bitrary
deflection
factor.
The
time
duration
of
the
reference
signal
must
be
known
before a horizontal
conversion
factor
can be
established.
Determine
the
horizontal
conversion
factor
using
the
formula
:
Horizontal
Conversion
Factor
reference signal
time
duration
(seconds)
Horizontal
deflection
X
(divisions)
TIME/DIV
switch
setting
Determine
the
arbitrary
deflection
factor
using this
formula:
Arbitrary
Deflection
Factor
horizontal
conversion
X
factor
TIME/DIV
switch
setting
To
measure the
time
duration
of
an
unknown
signal , set
the
TIME
/DIV
switch
to a
setting
that
provides
sufficient
horizontal
deflection
to
make
an
accurate
measurement
.
Do
not
readjust
the VAR
TIME
/DIV
control.
Measure the
horizontal
deflection
in
divisions
and
calculate
the
time
duration
using the
formula:
Time
Duration
arbitrary
deflection
factor
or
horizontal
horizontal
X
deflection
(divisions)
Time
=
conversion
X
Duration
factor
TIME/DIV
switch
setting
horizontal
X
deflection
(diVisions)
EXAMPLE:
The
reference signal
frequency
measured is
455 hertz
(time
duration
: 2.19
milliseconds)
with
a
TIME/DIV
switch
setting
of
.2
ms, and the VAR
TIME/DIV
control
adjusted
to
provide a horizontal
deflection
of
eight
@
475A/ OM44 Operators
41
Page 50
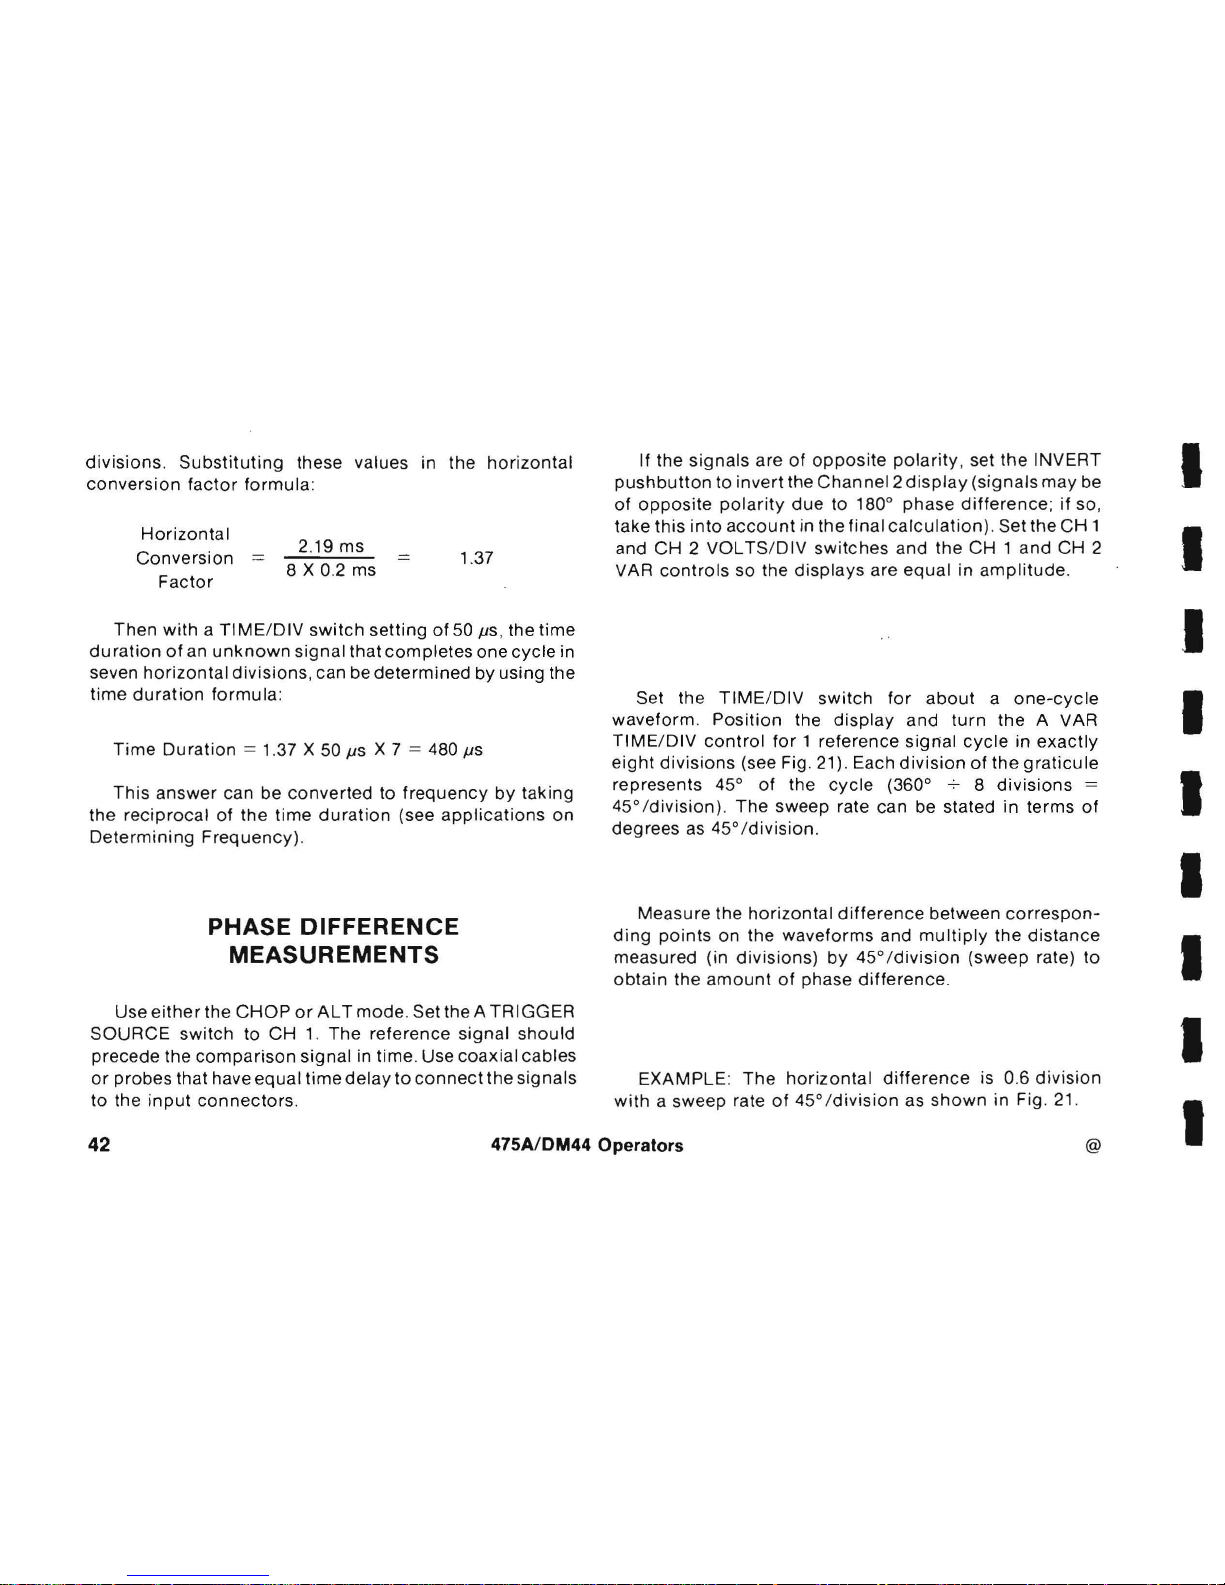
divisions. Substituting
these values in the
horizontal
conversion
factor
formula
:
Horizontal
Conversion
Factor
2.
19ms
8 X 0.2 ms
1.37
Then
with
a TI ME/DIV
switch
setting
of
50
jJS,
the
time
duration
of
an
unknown
signal
that
completes
one
cycle
in
seven
horizontal
divisions
, can be
determined
by using the
time
duration
formula:
Time
Duration
= 1.37 X 50
jJs
X 7 = 480
jJs
This
answer
can be
converted
to
frequency
by
taking
the r
eciprocal
of
the
time
duration
(see
applications
on
Determ
ining
Frequency)
.
PHASE
DIFFERENCE
MEASUREMENTS
Use
either
the
CHOP
or
AL T mode
. Set the A
TRIGGER
SOURCE
switch
to
CH
1. The reference
signal
should
precede the
comparison
signal in
time
. Use
coax
ial cables
or
probes
that have
equal
time
delay
to
connect
the signals
to the
input
connectors
.
If the
signals
are
of
opposite
polarity
, set
the
INVERT
pushbutton
to
invert
the
Channel2
display
(signals
may
be
of
opposite
polarity
due
to 1800 phase
difference; if
so ,
take this
into
account
in the final
calculation)
. Set the
CH
1
and
CH
2 VOL TS/DIV
switches
and the
CH 1 and
CH 2
VAR
controls
so the
displays
are
equal
in
amplitude
.
Set the
TIME
/DIV
switch
for
about a one-cycle
waveform.
Position
the
display
and
turn
the
A VAR
TIME
/DIV
control
for
1 reference
signal
cycle
in
exactly
eight
divisions
(see Fig. 21) . Each
division
of
the
graticule
represents 45°
of
the
cycle
(360°
-:--8 divisions
=
45
° Idivision). The sweep rate can be stated in terms
of
degrees
as
45° I
division
.
Measure the
horizontal
difference
between
correspon-
ding
pOints on the
waveforms
and
multiply
the
distance
measured (in
divisions)
by
45° I
division
(sweep rate) to
obta
in the
amount
of
phase
difference.
EXAMPLE:
The
horizontal
difference
is 0.6 divi
sion
with
a sweep rate
of
45° I
division
as
shown
in Fig. 21.
42
475A/OM44 Operators
@
I
I
.1
I
I
I
I
I
I
Page 51

I
I
I
I
I
I
I
I
I
I
1-1
...
___
8
DIVISIONS
-----11-1
(360
0
)
Fig. 21. Phase
difference
.
Using
the
formula
:
MEASURE
TIME
FROM
A
TO
B
HORIZONTAL
DIFFERENCE
465/DM-O-15
Phase
Difference
horizontal
difference
divisions
X
sweep
rate
(degrees/div)
Substituting
the
given
values:
Phase
Difference
= 0.6 X 45° =
2YO
.
HIGH
RESOLUTION PHASE
DIFFERENCE MEASUREMENTS
Make
more
accurate
phase
measurements
by
in-
creasing
the
sweep
rate
(without
changing
the
A VAR
TIME/DIV
control)
by
using
the
X10
MAG
mode
. Delayed
sweep
magnification
may
also
be used (see Fig. 22) .
CHANNEL
2
'; -
-l-
--I--I---I-
+-j--f--I--
f--
I
HORIZONTAL
I
r--
DIFFERENCE
--J
MEASURE
TIME
FROM
A
TO
B
465/DM-O·16
Fig. 22.
High-resolution
phase
difference
.
@ 475A/DM44 Operators
43
Page 52

EXAMPLE: If the sweep rate
were
increased 10 times
with
the
magnifier
, the
magnified
sweep
rate
would
be45
°
-:-
10 = 4.5
°/
division
. Fig .
22
shows
the same
signals
as
used in Fig.
21
but
with
the X10
MAG
switch
set
to
X10.
With a horizontal
difference
of 6 divisions
, the phase
difference
is:
Phase
horizontal
magnified
Difference
difference
X
sweep rate
(divisions)
(degrees/div)
Substituting
the
given values:
Phase
Difference
= 6 X 4.5° =
27
°.
PULSE
JITTER
MEASUREMENTS
Be sure the VAR
TIME/DIV
switch
is in the
calibrated
detent. Set the B
TIME/DIV
swi
tch
to
intensify
the full
rising
portion
of the
pulse
. Set the
HOR
IZ
DISPLAY
switch
to B DLY'D
.
,.
r
'i
MEASURE
TIME
FROM
A
TO
B
1
I I
I
I I
\-
-t-
--I-~
I !
I I
--l
~-
JITTER
Fig. 23. Pulse
jitter
.
1738-34
Pulse
jitter
is
shown
by
horizontal
movement
of
the
pulse
and
includes
the
inherent
jitter
of
the Delayed
Sweep
(see Fig. 23).
Multiple
the
distance
by
the B
TIME/DIV
switch
setting
to
obtain
pulse
jitter
time
.
44
475A/OM44 Operators
@
I
I
I
I
I
I
I
I
I
Page 53
I
I
I
I
I
I
I
I
I
DELAYED OR
MIXED
SWEEP
MAGNIFICATION
The
delayed
sweep
features
of the
475A
can be used to
provide
higher
apparent
magnification
than
is
provided
by
the
X1 0 MAG
switch.
The
sweep
rate
of
the
delayed
sweep
(B
sweep)
is
not
actually
increased;
the
apparent
magnification
is
the
result
of
delaying
the B sweep
in an
amount
of
time
selected
by
the A TIME/DIVswitch
and
the
DELAY-TIME
POSITION
control
before
the
display
is
presented
at
the
sweep
rate
selected
by
the B TIME/DIV
switch.
The
following
method
uses the
STARTS
AFTER
DELAY
position
of
the B Trigger
SOURCE
switch
to
allow
the
delayed
portion
to
be
positioned
with
the
DELAY-
TIME
POSITION
control.
If
there
is
too
much
jitter
in the
delayed
display,
use the
Triggered B Sweep
mode
of
operation.
Magnified Sweep Starts After Delay
1.
Connect
the
signal
to
either
input
connector.
Set
the
VERT
MODE
switch
to
display
the
channel
used.
2.
Set
the
VOL
TS/DIV
switch
to
produce a display
about
four
divisions
in
amplitude.
3.
Set
the A TIME/DIV
switch
to
a sweep rate
which
displays
the
complete
waveform.
4.
Set
the
HOR IZ
DISPLAY
switch
to A INT
and
the
B
Trigger
SOURCE
switch
to
STARTS
AFTER
DELAY.
Instrument
equipped
with
DM44.
Verify
that
the
FUNC-
TION
switch
is
not
set
to
TIME
or
1ITIME.
5.
Position
the
start
of
the
intensified
zone
with
the
DELAY-TIME
POSITION
control
to
the
part
of
the
display
to
be
magnified.
6.
Set the B
TIME/DIV
switch
to a setting
which
intensifies
the full
portion
to
be
magnified.
The
startofthe
intensified
zone
remains
as
positioned
above
(see Fig. 24).
7.
Set
the
HORIZ
DISPLAY
switch
to B DLY'D
to
magnify
the
portion
of A sweep
that
is
intensified
(see Fig.
24).
8.
Time
measurements
can be
made
from
the
display
in
the
conventional
manner.
The
sweep
rate is
determined
by
the
setting
of
the B TIME/DIV
switch.
9.
The
apparent
sweep
magnification
can be
calculated
by
dividing
the A TIME/DIV
switch
setting
by
the B TIME/DIV
switch
setting.
@
475A/DM44
Operators
45
Page 54

INTENSI FI
ED
ZONE
TO
BE
MI\,.GNIFIED
J .
...
~
..;
"-
\
\
,.
I
I
....
IA) A INTENSI
FI
ED
DISPLAY
L
'00
-,
,
..
V\.
~
.
17
,.
/
I
.
':--
.
I' .
~
.
~
....
/"
~
EXAMPLE:
The
apparent
magn
ifi
cation
of a display
I
with
an A
TIME/DIV
switch
setting
of
.1
ms and a 8
TIME
/DIV
switch
setting
of 1 jJs
is:
Apparent
Magnification
_
(Delayed -
Sweep)
A
TIME
/DIV
setting
8
TIME
/DIV setting
Substituting
the given values:
Apparent
Magnification
X 10--
X 10 '
The
apparent
magnification
is
100 times.
Triggered Delayed Sweep Magnification
The'delayed sweep
magnification
method
just
describ-
ed
may
produce
too
much
jitter
at
high
apparent
I
I
I
I
I
I
(BI B
DELAYED
DISPLAY
......
___________________
.....:..;.17.:..:38;..:.3..:.JI
magnification
ranges .
Operating
the 8 Sweep in a
I
Fig . 24. Delayed sweep
magnification.
46
triggered
mode
provides a
more
stable
display
since the
delayed
display
is
triggered at the same
point
each time.
475A/DM44 Operators
@
I
Page 55

I
I
I
I
I
I
I
I
I
1.
Set
up
the
display
as given in steps 1
through
6
under
"Magnified
Sweep Starts
After
Delay."
2. Set
the B Trigger
SOURCE
switch
to the same
position
as the A
Trigger
SOURCE
switch.
3.
Adjust
the B LEVEL
control
so
the
intensified
zone
on
the
trace
is stable.
(If
an
intensified
zone
cannot
be
obtained,
see step 4.)
4.
Inability
to
intensify
the
desired
portion
indicates
that
the
signal
does
not
meet
the
triggering
requirements.
If the
condition
cannot
be
remedied
with
the B
Triggering
controls
or
by
increasing
the
display
amplitude
(lower
VOL
TS/DIV
setting),
trigger B Sweep
externally
.
5. When the
correct
portion
is
intensified,
set the
HORIZ
DISPLAY
switch
to B DLY'D.
Slight
readjustment
of
the B LEVEL
control
may
be necessary
for
a stable
display.
6.
Measurements
are
made
and
magnification
factors
are
calculated
as in
the
STARTS
AFTER
DELAY
mode
previously
given.
@
475A/OM44 Operators
47
Page 56

BASIC 475A DELAYED OR
MIXED
SWEEP
TIME
MEASUREMENTS
The
delayed sweep
modes
can be used
to
make
more
accurate
time
measurements
.
TIME
DIFFERENCE
BETWEEN
REPETETIVE PULSES (BASIC 475A)
Obtain
a Delayed Sweep
Display
. For the
most
accurate
measurement,
set the B
TIME/DIV
switch
to
the fastest
sweep speed that gives
usable
(visable)
intensified
zones.
With the
HORIZ
DISPLAY
switch
set to A
INTEN
, use
the
DELAY
TIME
POSITION
dial
to
move the
intensified
zone
to the first pulse (see Fig. 25A) .
Set the
HORIZ
DISPLAY
switch
to 8 DL
y'D. Adjust
the
DELAY
TIME
POSITION
dial
to
move
the pulse
(or
rising
portion)
to
some
vertical reference
line
(see Fig.
258).
Note
the
setting
of
the
DELAY
TIME
POSITION
dial.
Turn
the
DELAY
TIME
POSITION
dial
clockwise
to
move the
second
pulse
to
the
same vertical reference
line
(if
several
pulses
are
displayed
, return to A
INTEN
to locate the
correct
pulse) .
Do
not
change
the settings
of
the
horizon-
tal
POSITION
and FINE
controls. Note
the
setting
of
the
DELAY
TIME
POSITION
dial.
Determine
the time
difference
using
the
following
formula:
Time
Difference
=
dial
~
econd
dial
setting
firstJ
setting
delay
time
X A
TIME/DIV
setting
EXAMPLE:
Assume
the
first
dial
setting
is 1.
31
and the
second
dial
setting
is 8.
81
with
the A
TIME/DIV
switch
set
to
0.2
{JS
(see Fig . 25).
Using
the
formula:
Time
Difference
=
[
Second.
dial
_ first
dial]
delay
time
X (A
TIME/DIV
setting
setting
setting)
48
475A/DM44 Operators
@
I
I
I
I
I
I
I
I
Page 57

I
I
I
I
I
I
I
I
I
,~
90
®--
---..
I
A) A DISPLAY
-
"
I
~
'
,
L
'00
..
,.
I
I
18
) 8 O LY' D
DISPLAY
~
'\
"
I
TI~E
DIFFEREN
CE
III"
1/
1\
/
~
1\
./
!"
,
~INT~~~~IED.?:'
,
i
VERTICAL
/REFEREN
CE
LINE
1""-
A OR 8
~
~
17)8 ·
23
Substituting
the given values:
Time
Difference
= (8.
81-1.31)
XO.2f../s
.
The
time
difference
is 1.5
microseconds
.
TIME
DURATION
MEASUREMENTS
(BASIC 475A)
Obtain
a Delayed
Sweep
Display. Set
the A TIME/DIV
switch
to
display a single
event. Be sure the VAR
TIME/DIV
control
is in
the
calibrated
detent
. For the
most
accurate
measurement,
set
the B TIME/DIV
switch
to
the
fastest sweep speed that gives a usable (visible)
inten-
sified
zone. Vertically
position
the
display
to place the
time
measu rement points to the
center
horizontal
g raticu
Ie
line
(see Fig. 26).
Use the DELAY
TIME
POSITION
dial
to
move
the start
(left-hand
edge)
of
the
intensified
zone
to
just
touch
the
intersection
of
the signal and the
center
horizontal
graticule
line
(see Fig. 26,
Point
A).
Note
the DELAY TIME
POSITION
dial
setting
.
Fig. 25.
Time
difference
between
repetitive
pulses.
Use the DELAY
TIME
POSITION
dial to move the start
of
the
intensified
zone
to
the
second
time
measurement
point
(see Fig. 26,
Point
B).
Note
the DELAY
TIME
POSITION
dial
setting
.
@
475A/DM44
Operators
49
Page 58

~~~~~~~~
-
~
I
HORIZONTAL
I
1..1
....
__
DISTANCE
--
.....
~I
Fig_
26_
Time
duration.
465/DM-O-9
Substitute
the
DELAY
TIME
POSITION
dial
settings
into
the
time
difference
formula
to
obtain
the
time
duration.
EXAMPLE:
The A TIME/DIV
switch
is set
to
2 ms and
the B TIME/DIV
switch
is set to .1 ms.
The
DELAY
TIME
POSITION
dial
setting
at
Point
A
(Fig . 26) is
1.20.
The
DELAY
TIME
POSITION
dial
at
Point
B (Fig. 26) is 9.53.
To
find
the
time
duration
use
the
formula:
Time
Time
Difference
Duration
[
,ecood
f;,,,
J
delay
time
dial
dial
X
(A
TIME/DIV
setting
setting
setting)
Substituting
the
given
values :
Time
Duration
= (9.53 - 1.20) X 2
ms
= 16.66 ms
FREQUENCY
MEASUREMENTS
(BASIC
475A)
The
frequency
of a recurrent
signal
can be
calculated
by
taking
the
reciprocal
of
the
time
duration
of
one
event.
EXAMPLE: The
time
duration
of
one
event
(Point A to
Point
B, Fig. 26) is 16.66
milliseconds
.
Using
the
formula
:
Frequency
=
--~--:--
time
duration
Substituting
the given values:
1
Frequency
= 16.66 ms
60
hertz
50
475A/OM44 Operators
@
I
I
I
I
I
I
I
I
I
Page 59

I
I
I
I
I
I
I
I
I
TIME
DIFFERENCE
BETWEEN
TWO
PULSES FROM
DIFFERENT
SOURCES
(BASIC 475A)
Make
sure
the
VAR
TIME/DIV control
is in
the
calibrated
detent.
Set
the A Trigger
SOURCE
switch
to
CH
1.
Connect
the reference
signal
to
CH 1 and
the
com-
parison
signal
to
CH
2.
Conne
ct
the
signals
to
th e
input
connectors
using
probes
or
cables
with
equal
time
delay
.
CHANNEL 1 (REFERENCE)
""
I
f\-.
.
~I
~
V
1
~:
"'-
j.L
""
50
%
PLiTUDE
~
EVEL
AM
L
t ')II.
"-
100-:
1
I
A
I
I
1---"': ..
~
INTENSIFIED
II
-
ZONE
Ii
I
I
-l
HORIZONTAL
L-,
I
DIFFERENCE
/
CHANNEL2
M
TI
EASURE
ME
F
ROM A TO
B
Set
the
VERT
MODE
switch
to
either
CHOP
or
ALT
. In
general, CHOP
is
more
suitable
for
low-frequen
cy
signals
and
the
AL T position
is
more
suitable
for high-frequen
cy
signals. Center
each
of
the
displays
verti c
ally
(see Fig.
27A).
Set
the
HORIZ
DISPLAY swi
tch
to A INT
and
the B
Trigg
er
SOURCE
to
STARTS
AFTER
DELAY
. Set
the
B
TIME/DIV
switch
20
times
faster
than
the A TIME/DIV
swit
ch
(when
possibl
e).
VERTICAL
REFERENCE
LINE
_____
I I -1
,.!
CH 2
SIGNAL
'1
\1
CH 1
SIGNAL
I
!
\
I
CHl
SIGNAL
1\
A
FO
~
CH 1
,
B
FOR
CH 2
i
,.
I I
L
I
ONLY
ONE
OF
THE
ABOVE
DISPLAYS
CAN
BE
POSITIONED
TO
CENTER
ON
INSTRUMENTS
WITHOUT
DM
40
SERIES. 1738-10
Fig
. 27.
Time
difference
between
two pulses
from
different
sources.
@
475A/OM44
Operators
51
Page 60

Use
the
DELAY
TIME
POSITION
dial
to
move
the
intensified
zone
to
the
CH
1 pulse. Set
the
HORIZ
DISPLAY
switch
to 8 DLY'D.
Readjust
the
DELAY
TIME
POSITION
dial
to
move
the
CH 1 pulse
or
rising
portion
to
some
vertical
reference
line
(see Fig.
278).
Note
the
DELAY
TIME
POSITION
dial
setting.
Use the
DELA
Y TI ME POS
ITION
dial
to
move
the
CH 2
pulse
or
rising
portion
to
the
same
reference
line.
Again
note
the
DELAY
TIME
POSITION
dial
setting
.
Substitute
the
DELAY
TIME
POSITION
dial
settings
in
the
time
difference
formula
to
find
the
time
difference
.
EXAMPLE:
The A TIME/DIV
switch
is set
to
50
ps
and
the 8 TIME
/DIV
switch
is set to 2 ps. Use
the
DELAY
TIME
POSITION
dial
to
move
the
CH 1 pulse
to
the
reference
line.
The
DELAY
TIME
POSITION
dial
setting
is 2.60.
Use the
DELAY
TIME
POSITION
dial
to
move
the
CH 2
pulse
to
the
reference
line
. The
DELAY
TIME
POSITION
dial
setting
is 7.10.
To
find
the
time
difference
use
the
formula
:
[
second
first]
delay
time
Time
=
dial
dial
X (A
TIME/DIV
difference
setting setting
setting)
Substituting
the
given
val ues:
Time
Difference
= (7.10 - '2.60) X 50
ps
= 225
ps
RISETIME
(BASIC
475A)
R isetime measu rements use the
same
methods
as
time-
duration
measurements,
except
the
measurements
are
made
between
the 10%
and
90%
points
of
the
waveform
.
Falltime
is
measured
between
the
90%
and
10%
points
on
the
trailing
edge
of
the
waveform.
Use
a sweep speed
setting
that
displays
several
cycles
or
events (if
possible)
and be sure
the
VAR
TIME
/DIV
control
is
in the
calibrated
detent.
Set the
VOL
TS /DIV
switch
and the VAR
control
(or
signal
amplitude)
for
exactly a five-division
display.
Set
vertical
positioning
so
the
display
bottom
touches
the
0%
graticule
line
and
the
display
top
touches
the
100%
graticule
line
(see Fig . 28).
Set the A
TIME
/DIV
switch
for a single-event display
with
the
risetime
spread
horizontally
as
much
as
possible
.
Horizontally
position
the
display
so the 10%
point
of
the
waveform
intersects
the
second
vertical
graticule
line (see
Fig. 28) . Set
the 8 TIME/DIV
switch
to
the
fastest sweep
speed
that
provides a usable
(visible)
intensified
zone
.
Use
the
DELAY
TIME
POSITION
dial
to
move
the
start
of
the
intensified
zone
(left-hand
edge) to
just
touch
the
intersection
of
the
signal
and
the
10%
graticule
line
(see
52
475A1DM44 Operators
@
I
I
I
I
I
I
I
I
I
Page 61

I
I
I
I
I
I
I
I
I
Fig. 28,
Point
A). Note
the
DELAY
TIME
POSITION
dial
setting
.
Use
the
DELAY
TIME
POSITION
dial
to
move
the
start
of
the
intensified
zone
to
just
touch
the
intersection
of
the
signal
and
the 90%
graticule
line
(see Fig. 28,
Point
B).
Note
the
DELAY
TIME
POSITION
dial
setting
.
Substitute
the
DELAY
TIME
POSITION
dial
settings
in
the
time
difference
formula
to
find
the
risetime.
SIGNAL
AMPLITUDE
-~
INTENSIFIED
ZONES
HORIZONTAL
I
DISTANCE
I-
MEASURE
TIME
FROM A TO
B
(4
6 5 /DM·0 -
ll )2039·29
Fig. 28. Risetime.
EXAMPLE:
The A TIME/DIV
switch
is set
to
1 /1S. The
DELAY
TIME
POSITION
dial
setting at
point
A (Fig . 28) is
2.50
The
DELAY
TIME
POSITION
dial
setting
at
point
B
(Fig. 28)
is
7.50.
To
find
the riseti
me
use
the
formula
:
Time
R"
D
'ff
= Isetlme =
I
erence
[
second
dial
setting
first
]
dial
setting
Substitut
ing
the
given values:
delay
time
X (A
TIME/DIV
setting)
Risetime = (7
.50 - 2.50) X 1 /1S = 5 ms.
MIX
(BASIC 475A)
For
the MIX
mode
of
operation,
the same general
procedures
can be used. With the first
part
of
the
display
at
a sweep rate set
by
the A
TIME
/DIV
switch
and the second
part
of
the
display
at a
sweep
rate set
by
the B
TIME
/DIV
switch
, it is not necessary to
switch
display
modes
to
ensure
location
of
the
correct
pulse .
However. inaccuracies
are
introduced
into
the
measurement
by
the
transition
from A
to
B sweeps.
The
B
DL
Y'D
mode
is the
most
accurate
and
therefore
recommended
mode
of
making
differential
time
measurements
.
@ 475A/OM44 Operators
53
Page 62

DM44 DELAYED OR MIXED SWEEP
TIME
MEASUREMENTS
I
Most
measurements
of
time,
time-duration, frequency,
time
difference
and
risetime are
more
easily
performed
using
the
TIME
function
of
the DM44 and the
delayed-sweep
mode
of
the
oscilloscope
. Table 5 lists the DM44
and
oscilloscope
I
operating
modes
and the
crt
display
obtained
in these modes.
TABLE
5
DM44
Delayed
Sweep
Displays
DM44
HORIZ
VERT
I
FUNCTION
DISPLAY
MODE
DISPLAY
OBTAINED
CH
1,
CH 2,
One
intensified
zone,
DELAY
TIME
POSITION
moves
intensified
zone
.
OR
ADD
I
A
INTEN'
ALT
or
Two
intensified
zones,
one
on each
channel
display. Intensified
zones
I
VOLTS
CHOP
are
coincide.,t
in
time. DELAY
TIME
POSITION
moves
both
intensified
OHMS,
zones .
OR
TEMP
CH
1,
CH
2,
OR
ADD
One
mixed
display
. Position
of
transition
point
determined
by
DELAY
I
TIME
POSITION
.
MIX
ALT
OR
Two
mixed
displays, one
on each
channel
display.
Transition
pOints are
I
CHOP
coincident
in time. Position
of
transition
points
determined
by
DELAY
TIME
POSITION
.
I
'In
the B DLY'D
mode,
the
intensified
zones
(that
are
displayed
In the A
INTEN
mode)
will
be
displayed
at
the B sweep
rate .
54
475A/DM44
Operators
@
I
Page 63
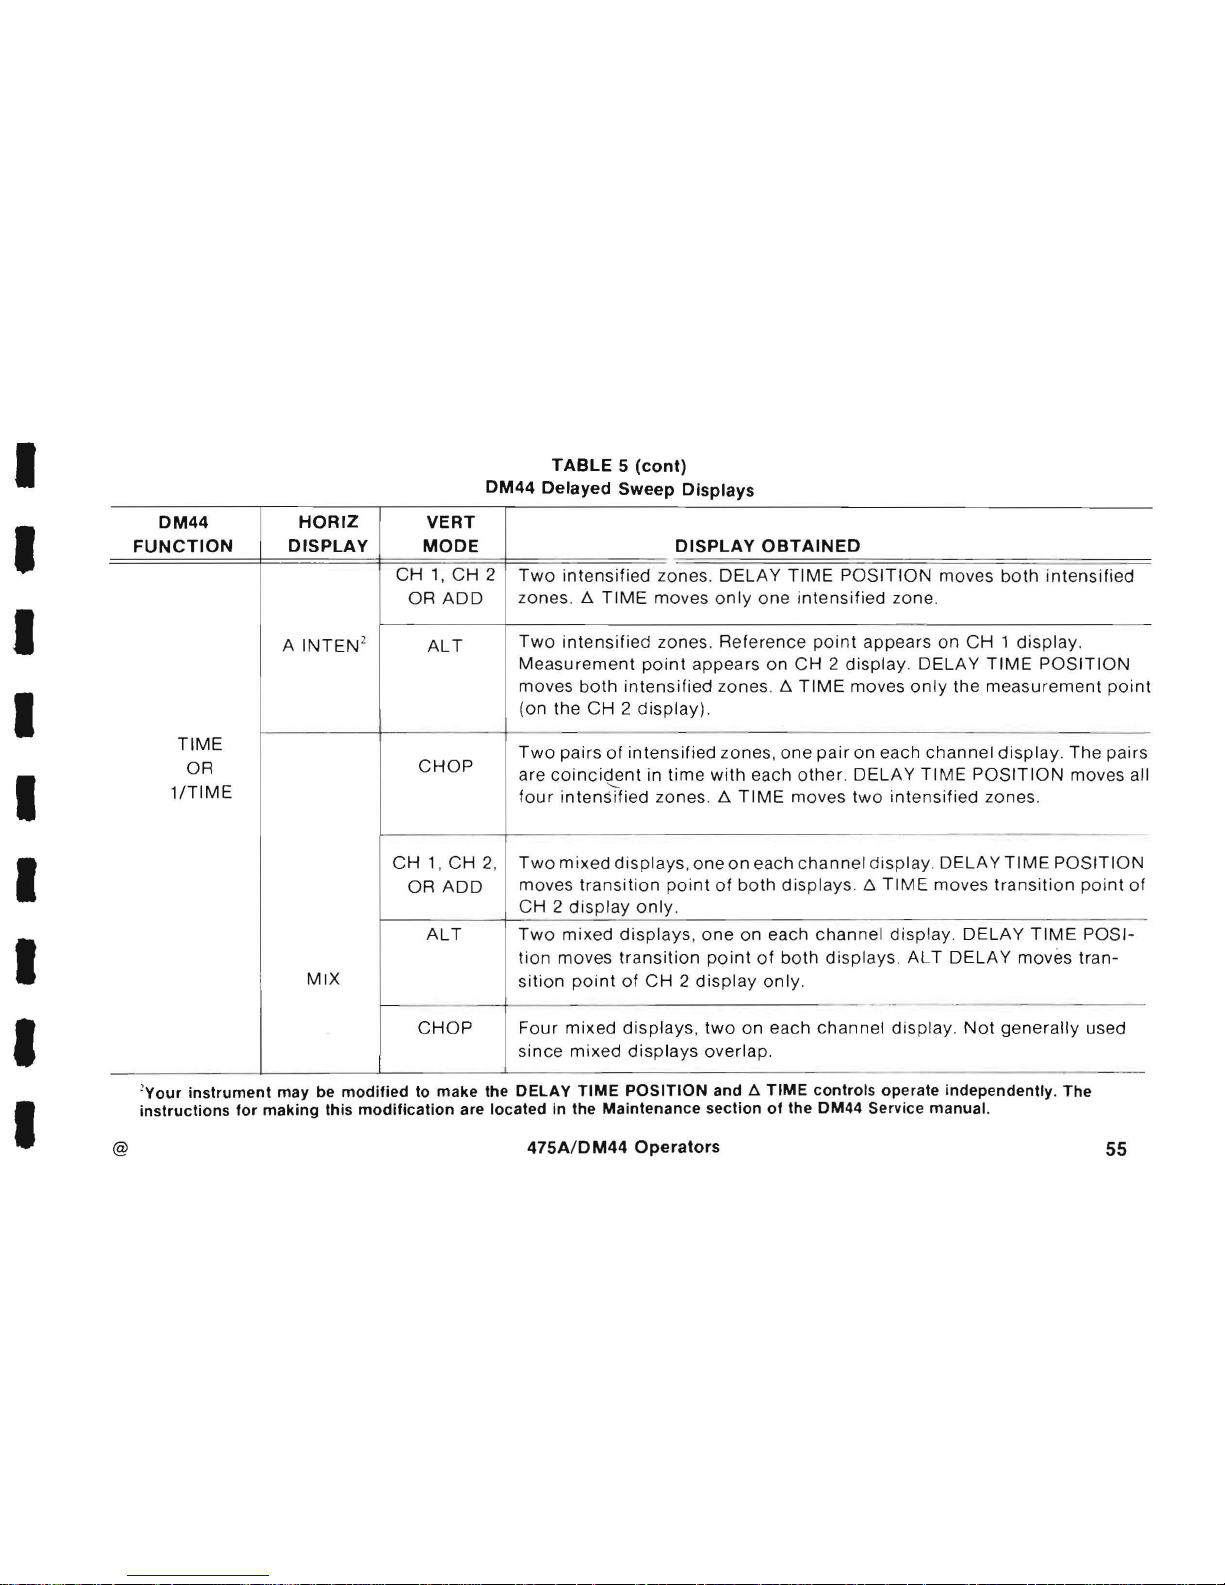
I
I
I
I
I
I
I
I
I
TABLE 5 (cont)
DM44
Delayed
Sweep
Displays
DM44
HORIZ
VERT
FUNCTION
DISPLAY
MODE
DISPLAY
OBTAINED
CH
1,
CH
2
Two
intensified
lone
s.
DELAY TIME
POS I
TION
mov
es
both intensified
OR
ADD
lones
. ~ TIME
moves
only one
intensified
zone
.
A
INTEN
2
All
Two
intensified lones. Reference
point
appears
on
CH 1 display.
Measurement
point
appea
rs
on
CH 2 display. DELAY
TIME
POSITION
moves
both
intensified
zones . ~ TIME
moves
only
the
measurement
point
(on the
CH 2 display)
.
TIME
Two
pairs
of
intensified
lones,
one
pair
on
each
channel
display. The
pairs
OR
CHOP
are
coincident
in
time
with
each
other
DELAY
TIME
POSITION
moves all
1fTIME
"-
four
intensified
lones
. ~ TIME
mov
es
two
intensified
lones
.
CH
1,
CH
2,
Two
mixed
dis pla ys,
one
on
each channel d
isplay. DELA Y TIME
POSITION
OR
ADD
moves
transition
point
of
both
displays. /:;
TIME
moves
transition poi
nt
of
CH 2 display
only
.
All
Two
mixed
displays, one
on
each
channel display. DELAY
TIME
POSI-
tion
moves
transition
point
of
both
displ
ays
AL T DELA
Y moves tran-
MIX
sition
point
of
CH 2 display
only.
..
.-
CHOP
Four
mixed
displays,
two
on
each
channel
display. Not
generally
used
since
mixed
displays
overlap.
'Your
instrument
may
be
modified
to
make
the
DELAY
TIME
POSITION
and
6.
TIME
controls
operate
independently. The
instructions
for
making
this
modification
are
located
In
the
Maintenance
section
of
the
DM44
Service
manual
.
@
475AfDM44
Operators
55
Page 64

TIME
DIFFERENCE BETWEEN
REPETITIVE PULSES (DM44)
Set the
controls
as
follows:
FUNCTION
HORIZ
DISPLAY
8
SOURCE
A
TIME/DIV
8
TIME/DIV
A
TIME
VAR
TIME/DIV
TIME
AINTEN
STARTS
AFTER
DELAY
To
display
2 pulses
3
or
4 positions
more
cw
than A TIME/DIV
To
move
the
time-
measurement
point
to
the
right
of
the
ref-
erence
pOint
Detent
position
Position
the
display
approximately
as
shown
in Fig.
29A. Use the
DELAY
TIME
POSITION
control
to move the
reference
pOint to the fi rst
pulse. 80th
intensified
zones
will
move when the
DELAY
TIME
POSITION
control
is
adjusted. Use the A
TIME
control
to move the
time-
measurement
pOint to the
second
pulse
.
Set
the
HORIZ
DISPLAY
switch
to 8
DLY'D. Slightly
readjust
the A
TIME
control
to
superimpose
the
waveforms
(see Fig.
298)
. The
DELAY
TIME
POSITION
control
may need to be
slight
ly readjusted to keep the
display
on
screen . The
Readout
and Scale
Factor
Lamps
now
indicate
the
time
difference
between the pulses.
--1-
TIME
r-
r--
,~
...
DIFFERENCE
90
®--
-
II!:
~
b
r\
lL
1&
1\
/
r-
"
~INTENSI
F I ED
".
,.
'-,
./
I
t
. .
(A) A DISPLAY
1
,.
I
1
(B) B
DL
Y'D
DISPLAY
ZONES
1
VERTICAL
/REFERENCE
LINE
1'-.
A
AND
B
SUPERIMPOSED
(1738-23)2039-30
Fig.
29.
Time
difference
between
repetitive pulses.
56
475A/OM44 Operators
@
I
I
I
I
I
I
I
I
I
Page 65

I
I
I
I
I
I
I
I
I
To
find
the
pulse
repetition
rate ,
superimpose
the
waveforms
as
above
and
set the
FUNCTION
switch
to
1/
TIME. The
Readout
and
Scale
Factor
Lamps
now
indicate
the
repetition
rate.
TIME
DURATION
MEASUREMENTS
(DM44)
Set
controls
as
follows
:
FUNCTION
HORIZ
DISPLAY
B
SOURCE
A
TIME/DIV
B
TIME/DIV
l:::"
TIME
VAR
TIME/DIV
TIME
A
INTEN
STARTS
AFTER
DELAY
To
display a single
event .
3
or 4 positions
more
cw
than A
TIME/DIV
To
move
the
time-
measurement
point
to
the
right
of
the ref-
erence
point.
Detent
position
Use
the
DELAY
TI ME
POSITION
control
to
move
the
reference
point
to a
horizontal
graticule
line
(see Fig . 30A,
Point
A). Use the
l:::"
TIME
control
to
move
the
time-
(A) A SWEEP
DISPLAY
(B) B
DLY'D
DISPLAY
2039-31
Fig. 30.
Time
duration
and
frequency
measurements.
@
475A/OM44
Operators
57
Page 66

measurement
point
to near the same
horizontal
graticule
line
on
the next
cycle
of
the
waveform
(see Fig . 30A,
Point
B).
Set the
HORIZ
DISPLAY
switch
to B DLY'D.
Slightly
readjust the
t::.
TIME
control
to
superimpose
the displayed
waveform
portions
(see Fig. 30B). The DELAY.
TIME
POSITION
control
may
need to be
slightly
readjusted to
keep the
display
on
screen. The Readout and Scale
Factor
Lamps indicate the time
duration
.
FREQUENCY
MEASUREMENTS
(DM44)
To
measure frequency, use the same
procedure
as for
Time
Duration
Measurements
except
set the
FUNCTION
switch
to
1/TIME.
With
the
display
superimposed
the
Readout and
Scale
Factor
Lamps indicate the
frequency
.
The
Scale
Factor
Lamps indicate the scale
factor
as
follows:
1/ms
Lamp
1/11s
Lamp
Multiplier
OFF OFF Hz
ON
OFF
kHz
OFF ON
MHz
A
blinking
display
indicates
an
over-range
condition
.
This
occurs
on measurements as
follows:
A Time/Dlv Set To Decade Spacing Between Intensified
Multiples
of Zones Less Than
0.25 DIV
2
0.5 DIV
5
1.0 DIV
TIME
DIFFERENCE BETWEEN
TWO
PULSES
FROM
DIFFERENT
SOURCES
(DM44)
Set
controls
as follows:
A
SOURCE
VERT
MODE
HORIZ
DISPLAY
B SOURCE
B
TIME/DIV
VAR
TIME/DIV
CH
1
ALT
A INT
STARTS
AFTER DELAY
3
or 4 positions
more
cw
than A
TIME/DIV
Detent
position
58
475A/DM44 Operators
@
I
I
I
I
I
I
I
I
I
Page 67

I
I
I
I
I
I
I
I
I
Connect
the
reference
signal
to
the
CH 1 i
nput
and
the
comparison
signal
to
the CH 2
input. Connect
the
signals
to
the
inputs
with
cables
or
probes
having
equal
time
delays
.
Adjust
the
DELAY
TIME
POSITION
control
to
move
the
reference pOi
nt
to
the
desired
spot
on
the
reference
(CH 1)
display
(see Fig. 31A,
Point
A). In
the
AL T vertical
mode
the
reference
point
appears
on
the
CH 1 display
while
the
time-measurement
pOint
appears
on
the
CH 2
display
.
CHANNEL 1 (REFERENCE)
CHANNEL
2
50
%
AMP
LI
TU
D E
-!-+---~
-+-Pl-r-
-+-
-t------,
LEVEL
i
MEASURE
r--
+-I--=::~
c---~..cL+-+--
----+
-
TI M E
INTENSIFIED
-t--_I--:-
---c
FROM
A
TO
B
~'-"""'d-
ZONES
I
-.l
HORIZONTAL
t--.
I
DIFFERENCE
Adjust
the
t::.
TIME
control
to
move
the
time
-
measurement
pOint to the
desired
spot
on
the CH 2
display
(see Fig.
31A, Point 8).
Set
the
HORIZ
DISPLAY
swi
tch
to 8 DLY
'D.
Slightly
readjust
the
DELAY
TIME
POSITION
and
t::.
TIME
controls
to
superimpose
the
waveforms
(see Fig.
318). The
Readout
and Scale
Factor
Lamps
indicate
the
time
difference
.
(465/DM
·0 ·
'0)2039·32
Fig . 31.
Time
difference
between
two
pulses
from
different
sources.
@
475A/OM44
Operators
59
Page 68

RISETIME
(OM4,4)
Set
controls
as
follows:
FUNCTION
HORIZ
DISPLAY
B
SOURCE
B
TIME/DIV
l:l.
TIME
TIME
A
INTEN
STARTS AFTER DELAY
3
or 4 positions
more
cw
than A
TIME
/DIV
To
move the
time-
measurement
pOint
to the
right
of
the
reference
pOint
Set
the A
TIME
/DIV
switch
to a setting that displays
several
events. Set the
VOL
TS/ DIV
and
VAR
VOL
TS/DIV
so the
amplitude
of
the
display
is
exactly 5 divisions
.
Vertically
position
the
display
so the
bottom
touches
the
0%
graticule
line and the
top
touches
the 100%
graticule
line.
Adjust
the
DELAY
TIME
POSITION
control
to
move
the
reference
pOint
to
the 10%
graticule
line
(see Fig. 32
Point
A).
Adjust
the
l:l.
TIME
control
to
move
the
time
measure-
ment
point
to the 90%
graticule
line
(see Fig. 32,
Point
B).
The
Readout and Scale
Factor
Lamps
indicate
the
risetime.
INTENSIFIED
ZONES
I
1
SIGNAL
AMPLITUDE
I
1
-~
'
t-
1I
I
--I
1""-
II
'\~
J
'\
.-
~
./
V
.~
V
®~
/
V
F'@
I . t
HORIZONTAL
I
DISTANCE
I--
-
M
-TI
EASURE
ME
F
ROM A TO
B
i
(465/DM-0-ll
'2039-29
Fig
. 32.
Risetime
.
60
475A/DM44 Operators
@
I
I
I
I
I
I
I
I
I
Page 69

I
I
I
I
I
I
I
I
I
MIX
(OM44)
For
the
MIX
mode
of
operation,
the
same
general
procedures
can
be
used.
With
the first
part
of
the
display
at
a
sweep
rate set
by
the A
TIME/OIV
switch,
and
the
second
part
of
the
display
at a
sweep
rate set
by
the B
TIMEIDIV
switch,
it is
not
necessary to
switch
display
modes
to
ensure
location
of
the
correct
pulse.
However,
inaccuracies
are
introduced
into
the
measurement
by
the
transition
from
A to B sweeps.
The
B
OL Y'O
mode
is
the
most
accurate
and
therefore
the
recommended
mode
of
making
differential
time
measurements.
@
475A/OM44
Operators
61
Page 70

OPERATOR'S
SPECIFICATIONS
Refer to the service manual
for
complete
specifications.
Specifications
given are
for
an
operating
range
of
O°C to
+40°
C unless
otherwise
stated.
475A
OSCILLOSCOPE
VERTICAL
Deflection Factor Accuracy:
Within
3%
in the
calibrated
position
.
Frequency Response: Dc to at least 250
MHz
for
CH
1
and
CH
2.
AC-coupled,
low-frequency
response is 10 Hz
or
less. Use
of
a 10X
probe
extends
frequency
response to
1 Hz.
Risetime: 1.4
nanoseconds
or
less
(calculated
from
0.35
-:-
bandwidth
in MHz).
Maximum Input Voltage:
Dc-coupled
250 V (dc + peak
ac)
or
500 V
p-p
ac at 1 kHz
or
less;
ac-coupled,
500 V
(dc
+ peak ac)
or
500 V p-p ac 1 kHz
or
less.
Positive-Going Step Aberrations: Less
than
+3%,
-3%,
not to exceed
3%
peak-to
-peak,
excluding
the
ADD
mode.
Common-Mode
Rejection Ratio
(ADD
Mode with
CH
2
Inverted): At least 10:1 at 20
MHz
for
common
mode
signals of 6
divisions
or
less with
GAIN
adjusted
for
best
CMRR at
50
kHz.
Input Gate Current: 0.5
nA
or
less (0 .1
div
at
5
mV/DIV),
from -
15°C
to
+30°C.
Channel Isolation: At least 100:1 at
25
MHz
.
CHOP
Mode Repetition Rate:
Approximately
250 kHz.
Cascaded Operation
(CH 2 OUT
into
CH
1)
sensitivity:
Approximately
2.5
mV/DIV. Bandwidth
is
dc
to at least
62
475A/DM44
Operators
@
I
I
I
I
I
I
I
I
I
Page 71

I
I
I
I
I
I
I
I
I
50
MHz, with
CH 2 OUT
connected
to
CH 1 input.
AC-
coupled, using a 500,
42-inch
BNC
cable, terminated
in
50 0 at
CH 2 Input.
TRIGGERING
Sensitivity
Ac Coupled Signal: 0.3
div
internal
or
50
mV
external,
from
60 Hz to
25
MHz; increasing
to 1.5 div,
internal
or
150 mV
external
at 100
MHz
.
LF REJ Coupled
Signal: 0.5
div
internal
or
100 mV
external,
from
50 kHz
to
25
MHz; increasing
to 1.5
div
internal
or
300
mV
external
at 100
MHz. Attenuates
signals
below
about
50
kHz
.
HF
REJ Coupled Signal: 0.5
div
internal
or
50 mV
external, from
60 Hz
to
50
kHz. Attenuates
signals
below
about
50 Hz
and
above
about
50
kHz
.
DC
Coupled Signal: 0.3
div
internal
or
50
mV
external,
from
dc
to 25
MHz;
increasing
to 1.5
div
internal
or
150 mV
external
at 100 MHz.
EXT
-:-
10 Signal:
Amplitude
requirements
are
mul-
tiplied
by
10.
External Trigger Input
Maximum Input Voltage: 250 V
(dc
+ peak ac)
or
250 V
p-p
ac
(1
kHz
or
less).
Level Control Range
in
Ext .
At
I~ast
+ and
-2
V,
4 V p-p;
EXT..:..
10 is at least + and
- 20
V,
40 V
p-p
.
Trigger View
Deflection Factor:
About
50
mV/div
in EXT and
about
500
mV/div
in
EXT..:...
10.
Rlsetime: 5 ns
or
less.
Trigger Centering Point:
Within
1.0
division
of
screen
center
.
DIFFERENTIAL
TIME
MEASUREMENT
(BASIC 475A)
Accuracy for Measurements Greater than One Major
Dial Division:
Within
±1%
from
+15
°C
to
+35°C.
Within
+1.5%
from
-15°C
to
+55°C.
@
475A/DM44
Operators
63
Page 72

Accuracy
for
Measurements
Less
than
One
Major
Dial
Division:
Within
±0.01
major
dial
divisions
from
+15
° C to
+35°C.
Within
± 0.
02
major
dial
divisions
from
-15°C
to
+55°C.
DIFFERENTIAL
TIME
MEASUREMENT
(DM44)
Refer to
TIME
AND
1/TIME
under
DM44
DIGITAL
MUL
TIMETER
.
HORIZONTAL
Sweep Rate
Accuracy:
Within 2%,
unmagnified
, and
3%
magnified,
from
+20
°C to
+30°C
for
A and 8 Sweeps .
Mixed
Sweep
Accuracy:
With in
2%
plus the measured A
Sweep
inaccuracy,
when
viewing
the A
portion
only.
8
Sweep
portion
remains the same
as
above.
Trigger
Holdoff
Variable: Increases A S'weep
holdoff
time
by
at least a
factor
of
10.
Delay
Time
Jitter:
1 part,
or
less, in 50,000 (0.002%)
of
10
times the A
TIME/DIV
switch
setting
.
Calibrated
Delay
Time
(VAR
control
to
CAL):
Continuous
from 0.2 ps to at least 5
seconds
after
the start
of A (delaying)
sweep.
x-v
X-Axis
Sensitivity
(X10
MAG
turned
off):
Same
as
the
vertical system.
X-Axis
Bandwidth: Dc
to at least 4
MHz, with
a
10
division
reference signal.
Phase
Difference
Between X-
and
V-Axis
Amplifiers:
Within
3° from
dc
to
50
kHz.
Deflection
Accuracy:
Within
4%.
CALIBRATOR
Output
Voltage: 0.3 V
within
1%
and
within
0.3%
from
+20°C
to
+30°C.
Output
Current:
30
mA
within
2%
from
+20
°C to
+30°C.
Repetition
Rate:
About
1 kHz.
64
475A/DM44
Operators
@
I
I
I
I
I
I
I
I
Page 73

I
I
I
I
I
I
I
I
I
Z AXIS
INPUT
Sensitivity:
Noticeable
intensity
modulation,
at
normal
intensity
settings,
by
a 5 V
p-p
signal. A positive-going
signal
decreases
intensity.
Frequency Range (Usable):
Dc
to
50 MHz.
Maximum
Input Voltage: 100 V
(dc
plus
peak ac)
or
100 V
p-p
ac
at 1 kHz
or
less.
OUTPUTS
CH
2 Out
Output
Voltage:
At
least50
mV/div
into
1 MO;
toat
least
25
mV/div
into
50
ohms.
Bandwidth:
Dc
to
at least 50
MHz
into
50
ohms.
DC
Level:
About
0 volts.
A+
and
B+
Gates
Output
Voltage:
About
5.5 V
of
positive-going
pulse.
Output
Resistance:
About
500
ohms.
AC POWER SOURCE
Regulating Ranges:
115
V
230 V
Low
99 V
to
121
V 198 V
to
242 V
Medium
104 V
to
126 V 207 V
to
253 V
High
108 V
to
132 V
216 V
to
264 V
Line Frequency:
From
48 Hz to 440 Hz.
Maximum Power Consumption:
100
watts
at 115
V,
60 Hz,
medium
range.
ENVIRONMENTAL
Operating Temperature:
-150 C
to
+550 C.
Operating
Altitude:
To
15,000 feet.
Maximum
operating
temperature
decreases
10 C/1 ,000 feet, above 5,000 feet.
Humidity (Operating and Storage): 5
cycles
(120
hours)
referenced
to
MIL-E-16400F.
@
475A/DM44
Operators
65
Page 74

DM44
DIGITAL
MUL
TIMETER
I
RESISTANCE
1/TIME
Maximum Safe Input Voltage: 120 V rms
between
+ and
COM
inputs
.
Resistance Accuracy: 200 0
range-within
0.25%
±1
count,
plus
probe
resistance; 2 kO, 20 kO , 200 kO, and 2
MO
ranges-within
0.25%
±1
count;
20 MO
range-within
0.3% 1
count.
Temperature Dependence: 20 kO , 200 kO ar,d 2 MO
ranges-250
ppm/
oC;
2000,
2 kO and 20
MO
ranges-
350
ppm/
oC.
Resolution: 0.1
O.
Recycle Time:
At
least 3
measurements/second.
Response Time:
All
ranges
within 1 second
except
2
MO and 20 MO
(within 5 seconds).
TIME
Accuracy: + 15
to +35°C;
within
1%
of
reading
±1
count.
-15
to
+ 55° C;
within
1.5%
of
reading
±1
count.
Accuracy:
+15
to +
35°C;
within
2%
of
reading
±1
count.
-15
to
+55°C;
within
3%
of
reading
±1
count.
TEMPERATURE
Range:
-55°C
to
+150
° C in 1
range
.
Accuracy:
Original
Probe-Within
2°C, -55
°C
to
+125°C.
Within
3°C,
+125
°C to
+150
°C.
Replacement Probe:
Accuracy
will
equal
original
probe
accuracy
after
DM44
is
compensated
.
Maximum Safe Voltage
on
Measurement Surfaces:
±100
V (dc + peak ac)
above
chassis
ground.
Temperature (Storage and Operating):
Probe
Body
and
Cable,
-55
°C
to +105°C.
Probe
Sensor
Tip, -55°C
to
+150°C
.
DC
VOLTAGE
Maximum Safe Input Voltage:
±1200 V (dc
+ peak ac)
between
+ and chassis .
Common Floating Voltage:
±500
V (dc + peak ac)
to
chassis.
66 475A/DM44 Operators
REV. A,
DEC. 1977
I
I
I
I
I
I
I
I
Page 75

I
I
I
I
I
I
I
I
I
DC
Voltage Accuracy:
Within 0.1%
of
reading.
±1
count
.
Temperature Dependence: 44 ppmfO C.
Resolution: 100
tN.
Recycle Time:
At
least 3
measurements/second.
Response Time:
Within
0.5
second
.
Normal/Common
Mode Rejection Ratio:
Normal
Mode-At
least
60
dB
at
50
Hz
and 60 Hz.
Common
Mode-At
least 100
dB
at dc; 80
dB
at
50
Hz
and
60 Hz.
Input Impedance: 10 MO.
@
475A/DM44
Operators
67
Page 76

ACCESSORIES
STANDARD ACCESSORIES
INCLUDED
2
10X
Probe
Packages 010-6106-03
Accessory
Pouch,
Snap
(w/o
OM)
016-0535-02
Accessory
Pouch
(OM) 016-0594-00
Accessory
Pouch,
Zipper
016-0537 -00
Operator's
Manual
070-2163-00
1 Service
Manual
(475A) 070-2162-00
2
Fuses, 1.5 A
3AG
fast-blow
159-0016-00
2
Fuses,
0.75 A
3AG
fast-blow
159-0042-00
Filter,
Blue
Plastic
(installed)
337 -167 4-00
CRT
Filter,
Clear
Plastic
337-1674-01
Adapter,
Ground
Wire
134-0016-01
Pair,
Test
Leads (OM)
003-0120-00
Service
Manual
(OM44)
070-2036-00
P6430
Temperature
Probe
(OM44)
010-6430-00
OPTIONAL ACCESSORIES
C-5A
Option 2 low
cost
fixed
focus
camera-Order
C-5A
Option
2.
Protective
Cover-Waterproof,
blue
vinyl-Order
016-
0554-00.
Folding
Polarized
Viewing
Hood-Order
016-0180-00.
Folding
Viewing
Hood,
light-shielding-Order
016-
0592-00.
Folding
Viewing
Hood,
light-occluding-Order
016-
0566-00.
Mesh
Filter-Improves
contrast
and
EMI
filter-Order
378-0726-01 .
SCOPE-MOBILE
Cart-Occupies
less
than
18
inches
aisle space, has
storage
area in
base-Order
200.
Test Lead
Set-1
black
lead
with
banana
plug
and
grounding
clip,
1 red lead
with
banana
plug
and
probe.
Includes
retractable
hook
tip
and CI tester
probe
cover.
May
be used with
other
miniature
probe
tip
accessories.
Order
012-0427-00.
68
475A/OM44 Operators
REV
A.
SEPT
1978
I
I
I
I
I
I
I
I
I
Page 77

I
I
I
I
I
I
I
I
I
OPTIONS
Your
instrument
may
contain
the
following
options
:
OPTION
1
Deletes the
temperature
probe
from
the DM 44.
OPTION
4
The
instrument
is
modified
to meet certain
specifications
on radiated
interference
requirements
.
There is
no
change
in
operating
instructions.
OPTION
7
At the time of this
writing,
instruments
having the DM44
do
not
have the
Option
7 available.
Option 7 permits
operation
on
12
or
24
Vdc
with
no
performance
deterioration. Circuitry
is
provided
to
protect
against
damage
due
to
connection
of
24 V when
in the
12 V mode
of
operation. The
24-volt external
input
permits
use
with
conventional
dc
power
(marine and aircraft).
@
475A/DM44 Operators
69
Page 78

•
•
•
•
•
Tektronix.
tnc
092380
This
Insert
Is
provided
as
a
supplement
to
the
Instruction
manual
furnished
with
this
modified
Instrument.
The
Information
given
In
this
Insert
supersedes
that
given
In
the
manual.
This
insert
material
Copyright
©
1980
by
Tektronix,
Inc.,
Beaverton,
Oregon.
Printed
in
the
United
States
01
America.
All
rights
reserved.
Contents
of
this
insert
may
not
be
reproduced
In
any
form
without
permission
01
the
copyright
owner.
• P. O.
Box
500
•
Beaverton,
Oregon
97077
MODIFICATION
INSERT
475A/DM44
MOD
PC
Phone
644-0161 • Cables:
Tektronix
061-2422-00
Page 79

•
•
•
•
•
•
•
•
475A/DM44
MOD
PG
This
manual
insert
describes
MOD
PG
as
it
applies
to
the
TEKTRONIX
475A/DM44
Oscilloscope.
The
Delay
time
and
Calibrator
frequency
tolerances
are
reduced,
a
front-panel
light
is
added
adjacent
to
the A TRIGGER
HOLDOFF
control
to
indi-
cate
when
the
control
is
out
of
the
(detent)
Norm
position,
and
the
electrical
length
of
the
vertical
amplifier
delay
line
is
increased.
A
special
probe
package
and
viewing
hood
are
added
to
the
standard
accessories
complement.
The
legend
"Property
of"
and
the
IBM
logotype
are
added
to
the
475A
front
panel,
and
an
IBM
"F
& F"
(serial)
number
is
added
to
the
rear
panel.
A
modi-
fied
DM44
Digital
Multimeter
with
added
INDEPENDENT/TRACKING
mode
selection
with
timing
compensation
is
added.
Differential
Delay
Accuracy.
ccuracy
of
differential
time
measurements
(TIME
or
l/TIME mode)
using
the
DELAY
TIME
POSITION
and
~Tn1E
controls
will
be
accu-
rate
within
0.75%
of
the
reading
±1
count
for
measurements
between
points
0.5
to
10
divisions
(except
at
0.2
through
0.5
~s/div,
1.0
to
10
divisions)
from
the
start
of
the
A Sweep
trace
for
sweeps
faster
than
0.5
s/div,
over
the
000
0 0 0
temperature
range
+15
to
+32 C
(60
to
90
F).
Over
the
+15 C
to
+55 C
temperature
range,
standard
475A
performance
limits
apply.
INDEPENDENT/TRACKING
Modes. The
two-position
toggle
switch
added
in
the
DM44
front
panel
functions
only
in
the
TIME
and I/TIME modes
to
permit
independent
intensified
zone
adjustment
with
fine
time
zero
compensation
between
vertical
channels
as
follows:
1
of
5
Page 80

47SA/DM44
MOD
PG
Tracking.
With
the
added
switch
in
the
TRACKING
position,
the
time
measurement
circuits
function
as
for
the
standard
DM44,
with
the
DELAY
TIME
POSITION
control
moving
both
intensified
zones.
Independent.
With
the
added
switch
in
the
INDEPENDENT
position,
the
DELAY
TIME
POSITION and
~TIME
controls
position
their
respective
intensified
zones
independently,
and
the
TIME
(or
l/TIME)
readout
is
adjustable
over
a
small
range
by
the
added
side-panel
ZERO
ADJ
screwdriver
control,
to
permit
compensation
for
small
Ch
l/Ch 2 probe
and
admplifier
transit-time
differences.
ZERO
ADJ
Procedure.
To
set
the
ZERO
ADJ
to
compensate
for
vertical
chan-
nel
transit
time
differences,
set
the
controls
as
follows:
47SA
A
SOURCE
CH
1
VERT
MODE
ALT
HORIZ
DISPLAY
A
INT
B
SOURCE
STARTS
AFTER
DELAY
VAR
TIME/DIV
Detent
position
DM44
FUNCTION
TIME
MODE
INDEPENDENT
2
of
5
L
.--
L
.-
•
•
...
.-
L
.-
L.
r
L
r
Page 81

•
•
475A/DM44
MOD
PG
Connect
Ch
1 and
Ch 2 vertical
input
probes
to
the
same
signal
source
--
such
as a fast
risetime
pulse
generator
with a repetition
rate
of
at
least
1
MHz.
Set
A TIME/DIV
to
display
several
pulses
on
the
crt
(see
Fig.
1).
INTENSIFIED
ZONE
Fig.
1
Set
B TIME/DIV
several
positions
more
clockwise
than
A TIME/DIV.
Adjust
the
DELAY
TIME
POSITION
control
so
that
an
intensified
zone
occurs
on
the
leading
edge
of a pulse
between
the
1st
and
the
9th
horizontal
graticule
position.
3
of
5
Page 82

475A/DM44
MOD
PG
Adjust
the
~TIME
control
so
that
the
second
intensified
zone
is
positioned
over
the
same
leading
edge
as
the
first
intensified
zone.
Set
the
HORIZ
DISPLAY
switch
to
B DLy'D.
Slightly
readjust
the
DELAY
TIME
POSI-
TION
and
ATIME
controls
to
superimpose
the
waveforms
(see
Fig.
2).
(B
TIME/DIV
may
be
reduced
for
better
time
difference
resolution.)
SUPERIMPOSE
LEADING
EDGES
Fig.
2
4
of
5
CH
1
\
'I
.....
~
CH
2
<j
L
.-
L
r
--
•
•
iI
L
..
•
•
•
iF
L
.-
Page 83

•
•
•
•
475A/DM44
MOD
PG
When
the
leading
edges
of
the
same
pulse
are
exactly
superimposed,
the
DM44
display
should
indicate
0000.
If
it
does
not,
adjust
the
ZERO
ADJ
control
with a small
screwdriver
so
that
the
display
reads
0000.
The
system
is
now
compensated
for
small
time
differences
between
the
two
input
channels.
Measurements
such
as
those
described
in
the
47sA/DM44
Operators
manual
may
be
taken
directly
from
the
DM44
display
without
hav-
ing
to
perform
the
algebraic
addition
of
the
transit-time
difference.
Transit
Time
Compensation.
Transit
time
correction
range
of
the
ZERO
ADJ
con-
trol
when
the
DM44
is
set
for
TIME
or
l/TIME
and
the
added
front-panel
switch
is
set
for
INDEPENDENT
corrects
for
internal
Ch
l/Ch 2 transit-time
difference,
plus
the
following
additional
range
to
accommodate
probe
transit-time
dif-
ferences:
A TIME/DIV
.05
~s
to
0.2
~s/div
.5
~s
to
2
~s/div
5
~s
to
20
~s
div
Effective
ZERO
ADJ
Range
±300
ps
±3
ns
±30
ns
The
ZERO
ADJ
adds a fixed
numerical
correction
to
the
digital
readout
for
each
decade
TIME/DIV
range.
The
absolute
time
correction
is
valid
only
for
one
TIME/DIV
decade.
Use
at
sweeps
slower
than
2
~s/div
is
not
recommended.
5
of
5
 Loading...