

Page 1
Model 251 I-V Test Software
Instruction Manual
Contains Operating Information
Page 2

WARRANTY
Keithley Instruments, Inc. warrants this product to be free from defects in material and workmanship for a
period of 1 year from date of shipment.
Keithley Instruments, Inc. warrants the following items for 90 days from the date of shipment: probes, cables,
rechargeable batteries, diskettes, and documentation.
During the warranty period, we will, at our option, either repair or replace any product that proves to be
defective.
To exercise this warranty, write or call your local Keithley representative, or contact Keithley headquarters in
Cleveland, Ohio. You will be given prompt assistance and return instructions. Send the product, transporta-
tion prepaid, to the indicated service facility. Repairs will be made and the product returned, transportation
prepaid. Repaired or replaced products are warranted for the balance of the original warranty period, or at
least 90 days.
LIMITATION OF WARRANTY
This warranty does not apply to defects resulting from product modification without Keithley’s express written consent, or misuse of any product or part. This warranty also does not apply to fuses, software, nonrechargeable batteries, damage from battery leakage, or problems arising from normal wear or failure to follow instructions.
THIS WARRANTY IS IN LIEU OF ALL OTHER WARRANTIES, EXPRESSED OR IMPLIED, INCLUDING
ANY IMPLIED WARRANTY OF MERCHANTABILITY OR FITNESS FOR A PARTICULAR USE. THE REMEDIES PROVIDED HEREIN ARE BUYERS SOLE AND EXCLUSIVE REMEDIES.
NEITHER KEITHLEY INSTRUMENTS, INC. NOR ANY OF ITS EMPLOYEES SHALL BE LIABLE FOR ANY
DIRECT, INDIRECT, SPECIAL, INCIDENTAL OR CONSEQUENTIAL DAMAGES ARISING OUT OF THE
USE OF ITS INSTRUMENTS AND SOFTWARE EVEN IF KEITHLEY INSTRUMENTS, INC., HAS BEEN
ADVISED IN ADVANCE OF THE POSSIBILITY OF SUCH DAMAGES. SUCH EXCLUDED DAMAGES
SHALL INCLUDE, BUT ARE NOT LIMITED TO: COSTS OF REMOVAL AND INSTALLATION, LOSSES
SUSTAINED AS THE RESULT OF INJURY TO ANY PERSON, OR DAMAGE TO PROPERTY.
Test Instrumentation Group, Keithley Instruments, Inc. l 28775 Aurora Road * Cleveland, Ohio 44139 l (216) 248-0400 l Fax: (216) 248-6168
AUSTRIA:
FRANCE:
GERMANY:
GREAT BRITAIN:
ITALY
JAPAN:
NETHERLANDS:
SWITZERLAND:
TAIWAN:
Keithley Instruments GesmbH l Rosenhiigelstrasse lKeithley Instruments SARL l 3 All& des Garays l B.l? 60 l 91121 Palaiseau C&+x l 0160-1151-55 l Fax: 01-60-11-77-26
Keithley Instruments GmbH l Landsberger Sh. 65 l D-8034 Gemwring l 089-849307-O l Fax: 089-84930759
Keithley Instruments, Ltd. l The Minster l 58 Portman Road l Reading, Berkshire RG3 IEA l 07X-575666 l Fax 0734-596-l69
Keithley Instruments SRL l Viale S. Gimignano 38 l 20146 Milano l 02-&8303008 l Fax: 0248302274
Keithley Instruments Far Fast KK l Sumiyoshi 24 Bldg., Room 201 l 2-X-2Sumiyoshi-cho l Naka-ku, Yokohama 231 l 81-45-201-2246 l Fax: 81-45-201-2247
Keithley Instruments BV l Avelingen West -19 l 4202 MS Gorinchem l Postbus 559 l 4200 AN Gcxinchrm l 01830-35333 l Fax: 01830-30821
Keithley Instruments SA l Kriesbachstrasse 4 l 8600 Dilbendorf l 01-821-9444 l Fax: 01-820-3081
Keithley Instruments Taiwan l 3rd Floor, Spring Plaza 6 l Section 3, Min Chuan East Road l Taipei, R.O.C. l 8R6-2-501-7065 l Fax: S866-2-509-5329
7 l A-1120 Wien .0222-804-6548 . Fax: 0222-804-3597
Page 3
hstructionManual
Model 251
I-V Test Software
61990, Keithley Instruments, Inc.
Test Instrumentation Group
All rights reserved.
Cleveland, Ohio, U.S.A.
Document Number: 251-901-01 Rev. B
Page 4

AI1 Keithley product names are trademarks or registered trademarks of Keithley Instruments, Inc.
Other btand and product names are trademarks or registered trademarks of their respective holders
Page 5

Model 251 I-V Test Software
OVERVIEW
INSTRUMENTS CONTROLLED: Model 236/237/238 Source Measure
Units (SMU),Model213QuadVoltageSource,Model707MahixSwitch.
Model 2361 Trigger Controller is required for 2 or more SMUs.
TESTS: Control instruments to source and measure current or voltage.
CurveFarnR~SWEEP,SYNCHSWEEP,STEP,andupto3BIASchannels,
Linear, log, linear pulsed and log pulsed sweeps.
DC Source-Meas& Up to 6 BIAS Channels.
GPIB CONTROL: Provides basic control of any GPIB instrument. Useful
for controlling sources, switch matrices, hot chucks, and probers.
707 MATRIX SUPPORT: Upload and download setups (up to 100
memories).
DATA DISPLAY: Graphic or list display.
XY or XYY Graph Axer Manual or auto scale, linear or log, labeled, X-
axis and Y-axis invert.
Overlay two sets of reference data on original.
GRAPHIC ANALYSIS: Dual data curve markers with data value readout.
Line Display Between markers. Readout slope, l/slope, X- and Y-
intercept. Zoom between markers. Filter data curve.
Gain/Ratio Calculation: DC or differential. Data array or point. Graphic
display or readout referenced to marker position. Used for Beta, g,,, or
resistsnce.
PRINT/FLOTr Hardcopy output of any screen to printer,or output graphic
display to plotter.
FILES: Data File: Contains Data, test, GPIB and display parameters.
Test Setup File: Contains Test, GPIB and display parameters.
l~dw.rnrn, P,%nGm.e+inn lxia. Prm+*;na r”rk...... ..I. ..*..7-
. ..“.a-.-... b”.Y.~w.mU”‘. a Y.G. b”AIba.AW uwucullell, ,mn,sa,
GPIB addresses, Trigger Controller channels.
Test Sequence Files: Contains the user’s pre-programmed test
sequence 64!XlI file).
787 Filer Contains 707 matrix setups.
Data Ex~ort/Irnportr Contains Da& array names and units. Lotus
(.WKl) and ASCII (.ASC).
AUTOMATICTESTSEQUENCES:Programanysequenceoftests,prints,
plots, 707 downloads, data save/acport, prompts and display, for attendedorunattendedoperation. Printingorplottingcanbedoneoff-line
(after acquisition).
MEASUREMENT CAPACITY LIMITS: A curve in the Curve Family Test
may contain up to 1000 points. Up to six source arrays and up to six
measurement arrays can be created by each test. Each array is limited to
4000 Points. The maximum number of arrays and tests is limited only by
the available disk storage space.
HELP: On-line, context sensitive, with index.
SYSTEM REQUIREMENTS
MINIMUM HOST COMFUTERr IBM compatible 80386,640kb Conven-
tional RAM (53Ok or 542720 bytes free) plus 1Mb of LIM expanded
memory, hard drive (2MB free), 720kb 3v2 inch or 1.2Mh 5v, inch floppy
drive, Intel 80387 math coprocessor, EGA color monitor and graphics
card, parallel Port.
OFERATING SYSTEM: M!3-DOS or PC-DOS 3.2 kninhum).
GRAPHICS ADAPTER EGA or VGA color, VGA monochrome.
COMPATIBLE PRINTERS: IBM Graphics Printers, Epson or compatible,
HP LaserJet, IBM Proprinter, and Okidata Microline 182.
COMPATIBLE PLOTTERS HP7440, HP7470, HP7475.
COMFATIBLE MOUSE: Microsoft or Logitech.
IEEE-488 (GPIB) INTERFACE CARDS SUPPORTED
Advantech PCL 748
B&C PC488A
BBS GPIB-1000
CaPital Equipment rcc>4u,4x488, P5-9488
Contec GPIB (PC)
Hewlett Packard HPIB
IBM GPIB board
ICS 488-PC1
IOtech GP488, GP488/2
Keithley PC488CEC, 4-488-CEC-OM, 4+488-CEC-lM, P%W-CEC
MetraByte IE-488
National Instruments GPIB-PC, GPIB-PC& GPIB-PCRA, GPIB-PClII,
MC-GPIB, AT-GPIB
Qua Tech MXI-100, I&XI-1000
Scientific Solutions IEEE 488 LM, MC-IEEE 488
Ziatech ZT 1444,ZT/2
.- an
SUPPLIED TEST LIBRARY
The Test Library provides default settings for the Test, 707 Matrix, GPIB
Control, Data Display and Graphic Analysis screens.
FET TESTS: Curve Family, Threshold Voltage, Transconductance, Break-
down, and Leakage.
BIPOLAR TESTS: Curve Family, Gummel Plot, Current Gain, Break-
down, and Leakage (linear and pulsed sweeps).
DIODE TESTS: I-V Curve, Reverse Breakdown, Zener Voltage.
COMPONENT TESTS: Capacitor Leakage, Resistor Voltage Coefficient.
EXAMPL.E GPIB CONTROL: 213 Quad Voltage Source, 707 Switching
Matrix and hot chuck.
TEST SEQUENCES: Bipolar tests, multiple diodes.
MATERIALS PROVIDED
Instruction Manual
Diskettes: 720kb 3tis inch and 1.2Mb 5v, inch containing installation,
program, test library, and sample data.
Specifications subject to change without notice.
Page 6
INTRODUCTION
This addendum to the Model 251 Instruction Manual is being provided to supply you with the
latest information in the least possible time. Please incorporate the following information into the
manual.
LOADING AND SAVING FILES
An enhancement to the Model 251 I-V Test Software is its ability to perform file operations from
the CURVE FAMILY TEST and DC SOURCE-MEASURE TEST forms. You no longer have to return to the main menu to load/save data, test setup, instrument configuration, and 707 files, or
import/export ASCII and Lotus formatted files. (Loading sequence files remains a main menu operation.)
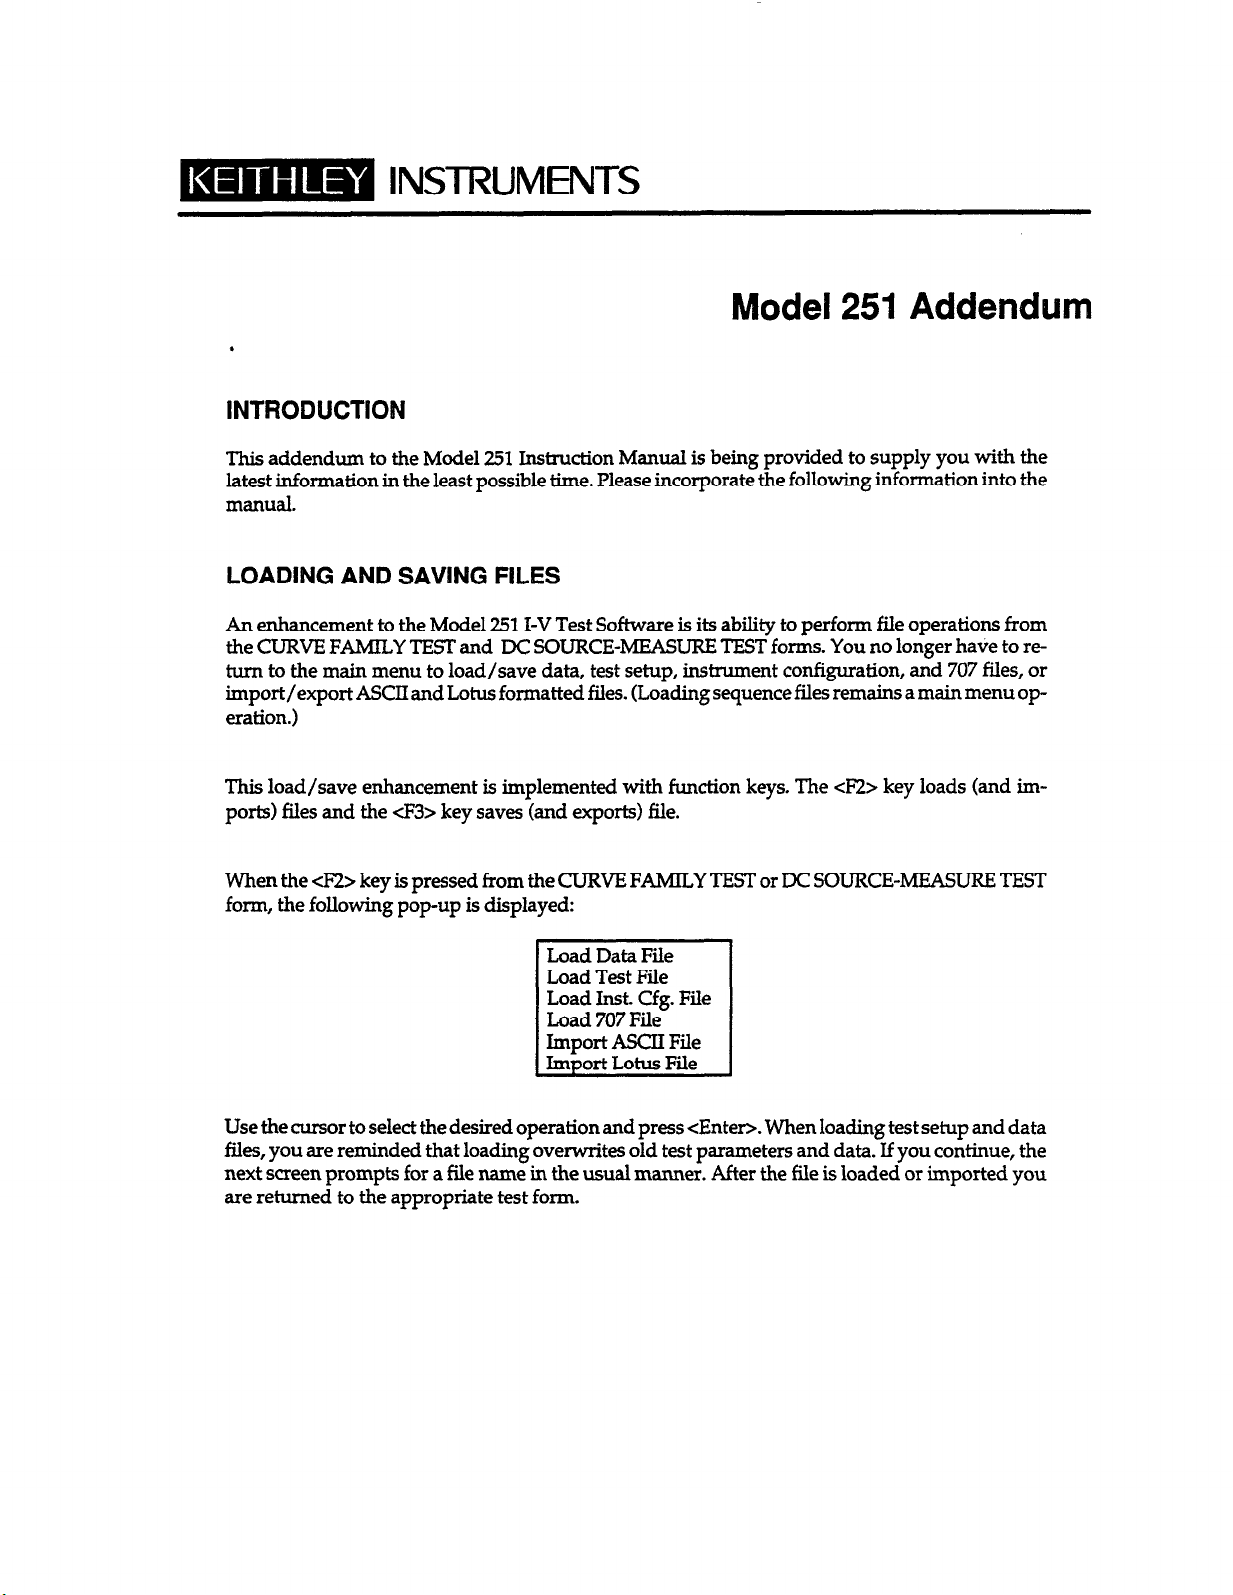
This load/save enhancement is implemented with function keys. The 4% key loads (and imports) files and the <F3> key saves (and exports) file.
When the cl% key is pressed from the CURVE FAMILY TEST or DC SOURCE-MEASURE TEST
form, the following pop-up is displayed:
Load Data File
I
Load Test File
Load Inst. Cf. File
Load 707 File
hn~ortm File
Imbort Lotus File 1
Use the cursor to select the desired operation and press <Enter>. When loading test setup and data
files, you are reminded that loading overwrites old test parameters and data. If you continue, the
next screen prompts for a file name in the usual manner. After the tile is loaded or imported you
are returned to the appropriate test form.
Page 7
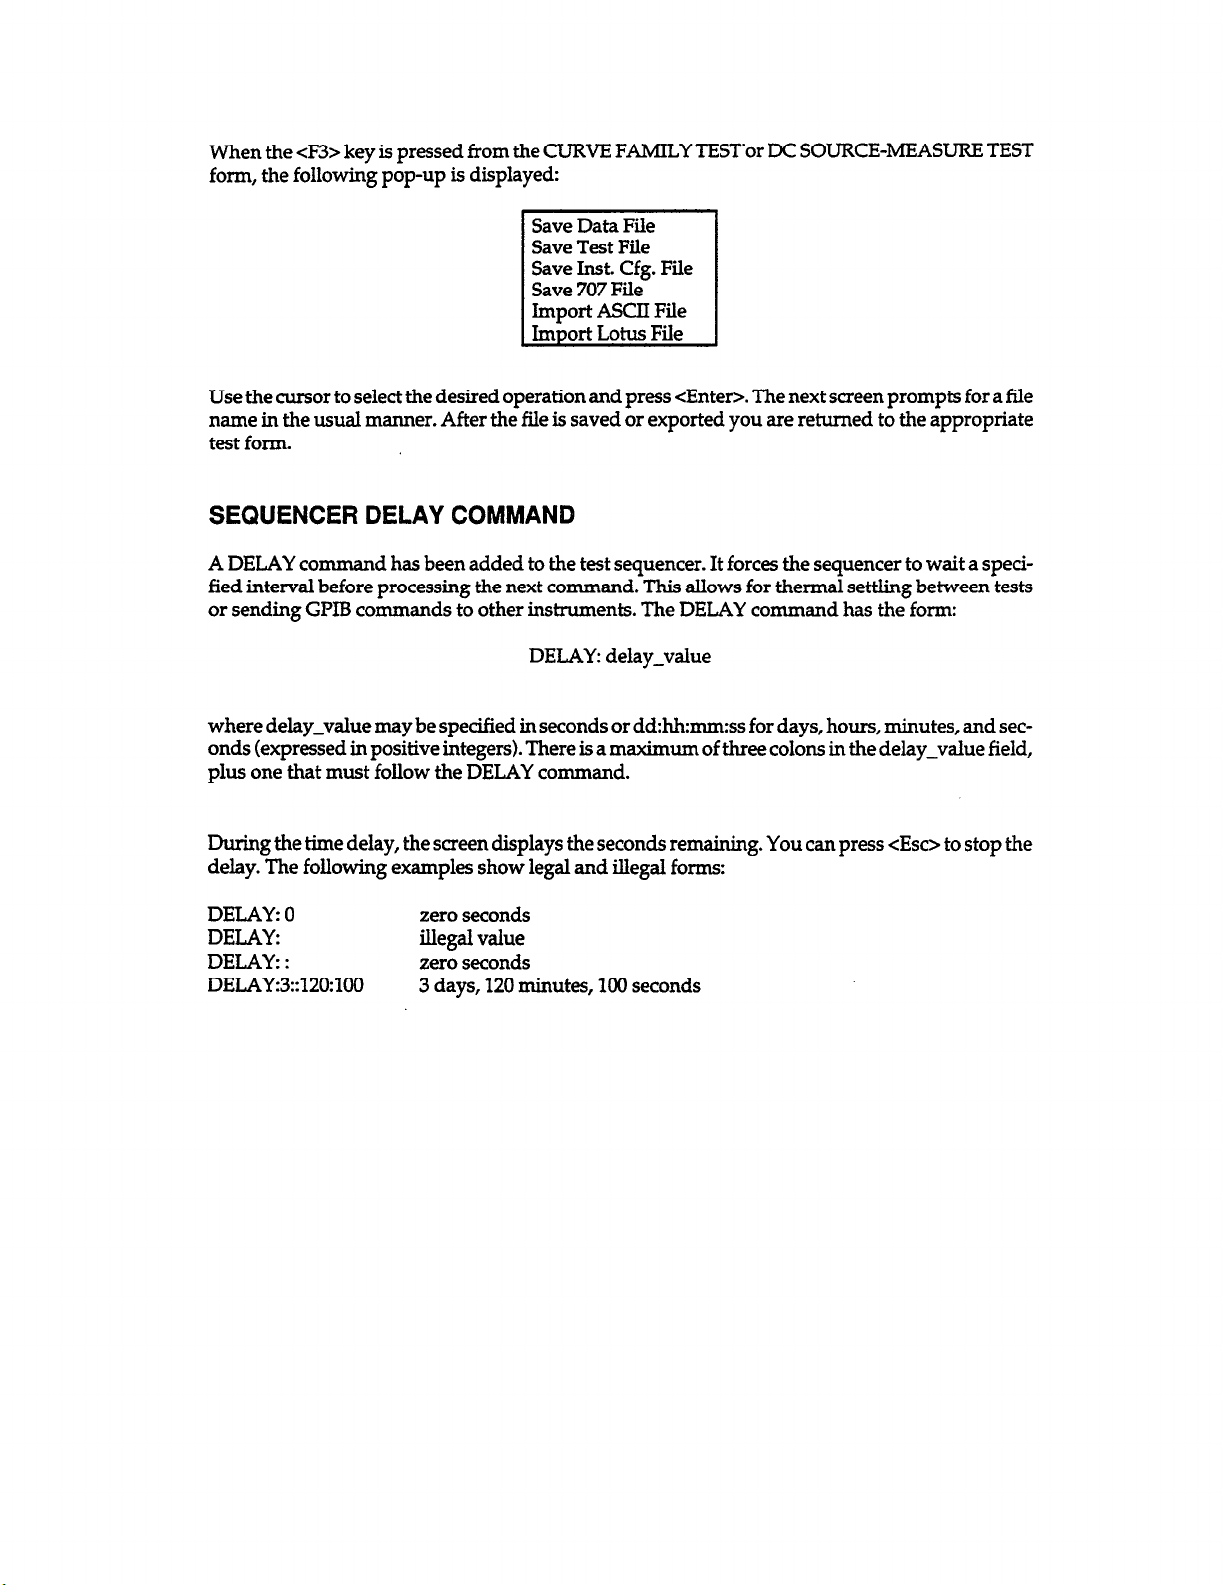
When the <F3> key is pressed from the CURVE FAMILY TESTor DC SOURCE-MEASURE TEST
form, the following pop-up is displayed:
Save Data File
Save Test File
Save Inst. Cfg. File
Save 707 File
Import ASCII File
Import Lotus File
Use the cursor to select the desired operation and press <Enter>. The next screen prompts for a file
name in the usual manner. After the file is saved or exported you are returned to the appropriate
test form.
SEQUENCER DELAY COMMAND
A DELAY co
mmand has been added to the test sequencer. It forces the sequencer to wait a specified interval before processing the next command. This allows for thermal settling between tests
or sending GPIB commands to other instruments. The DELAY command has the form:
DELAY: delay-value
where delay-value may be specified in seconds or dd:hh:mrn:ss for days, hours, minutes, and seconds (expressed in positive integers). There is a maximum of three colons in the delay-value field,
plus one that must follow the DELAY command.
During the time delay, the screen displays the seconds remaining. You can press <Eso to stop the
delay. The following examples show legal and illegal forms:
DELAY: 0 zero seconds
DELAY: illegal value
DELAY: : zero seconds
DELAY:3::120:100 3 days, 120 minutes, 100 seconds
Page 8
Table of Contents
SECTION 1
1.1
1.2
1.3
1.4
1.5
1.6
1.6.1
1.6.2
1.6.3
1.7 COMPUTERREQ
1.7.1 ComputerHardware
1.7.2 IEEE-488Interfaces..
1.7.3 Printers and Plotters
- General Information
INTRODU~ON
FEATURES
WARRANTYINFORMATION
MANUALADDENDA
sAFETysyMBoLsANDTERMs
UNFACKINGANDINSPECTION..
UnpackingProcedure..
Shipment Contents
InstructionManual
..............................................................
...................................................................
....................................................
..........................................................
..................................................
.......................................................
...........................................................
...........................................................
UIREMENTS ...................................................
..........................................................
.........................................................
..........................................................
...............................................
SECTION 2 - Getting Started
2.1
2.2
2.2.1
2.2.2
2.3
2.3.1
2.3.2
2.3.3
2.3.4
2.3.5
2.4 COMPUTERHARDWARE AND SOWARE INSTALLATION
2.4.1 IEEE-488 Interface Card Installation
2.4.2
2.4.3 Software Backup
2.4.4 Software Installation and Configuration
2.4.5 Software Reconfiguration
2.5
2.5.1 RunningtheSoftware..
2.5.2
2.5.3 ExpandedMemoryRequirement
2.5.4
2.5.5
2.5.6
2.5.7
2.5.8
2.5.9
~ODUCTION
HARDWARECONFIGURATION
SystemBlockDiagram
system coNlections
sYsTEMPowER-ulJ
Instrument Power Requirements
PowerConnections
EnvironmentalConditions
Warm-upperiod
Power-upprocedure
CopyProtedionBlock
OPERATIONOVERVIEW
DosMemoryRequirement
Setting Up Printers and Plotters
MainMenuOptions
UsingFunctionKeys
HowtoGetHelp
Configuring the IEEE-488 Card
ConfiguringtheInstruments
..............................................................
.................................................
........................................................
..........................................................
...........................................................
.................................................
...........................................................
.....................................................
.............................................................
..........................................................
..............................................
.........................................................
.............................................................
...........................................
......................................................
.......................................................
.......................................................
.....................................................
.................................................
................................................. 2-21
..........................................................
..........................................................
.............................................................
..................................................
....................................................
...........................
l-l
1-l
l-2
l-2
l-2
l-2
l-2
l-2
l-2
l-3
l-3
l-3
l-3
2-l
2-l
2-l
2-4
2-13
2-13
2-13
2-13
2-13
2-13
2-15
2-15
2-16
2-16
2-17
2-18
2-19
2-19
2-20
2-21
2-22
2-24
2-25
2-26
2-27
Page 9
2.6
2.6.1
2.6.2
SYSTEM CHECKOUT
Running Simple Tests
SystemTroubleshooting .......................................................
..........................................................
SECTION 3 - Measurements
.........................................................
2-28
2-28
231
3.1
3.2
3.3
3.4
3.4.1
3.4.2
3.5
3.5.1
3.5.2
3.5.3
3.6
3.6.1
3.6.2
3.6.3
3.7
3.7.1
3.7.2
3.7.3
3.7.4
3.7.5
3.7.6
3.7.7
INTRODUclTION
MEAS~OVFRVIEW ...................................................
DATAENTRY ................................................................
INSTRUMENTCONFIGURATION
DEFINE INSTRUMENTS Form
ParameterDescription ........................................................
CURVEFAMILYTESTS .........................................................
CURVEFAMILYTESTForm
ParameterDescription ........................................................
Curve Family Test Examples ....................................................
DcsOuRcEANDMEAsuRETESTs ...............................................
DcSOuRcE-MEAsuRETEsTFo~
ParameterDescription ........................................................
DC Source-Measure Test Examples ...............................................
GPlBINPUT/OTJTPUI .........................................................
GENERALGPIBOUTPUTForm .................................................
ParameterDescription ........................................................
GPIBCommands ............................................................
GPIB Display Fields ..........................................................
Model707Fields .............................................................
Uploading and Downloading
System Troubleshooting with the GPlB Form .......................................
..............................................................
................................................
..................................................
...................................................
..............................................
...................................................
3-l
3-l
3-2
3-5
3-5
3-7
3-9
3-9
3-11
3-16
3-23
3-23
3-25
3-28
3-30
3-30
3-32
3-32
3-33
3-33
3-35
3-36
SECTION 4 - Data Display
4.1
4.2
4.3
4.3.1
4.32
4.4
4.4.1
4.4.2
4.5
4.5.1
4.5.2
4.6
4.6.1
4.6.2
4.6.3
4.6.4
4.6.5
4.7
4.7.1
INTRODUcIloN ..............................................................
DISl?LAYOVERVIEW ..........................................................
DISPLAYPV.. ......................................................
DispIayParametersScreen .....................................................
Parameter Description
GRAPHICSDISPLAY ...........................................................
Graphics Screen Format .......................................................
AnalysisToolDescription ......................................................
LISTDATA ..................................................................
ListingCurveData ...........................................................
ListingDCData .............................................................
PRINTINGANDPLOITING .....................................................
Printer/PlotterConfiguration
Printing or Plotting from a Graphics Screen
Printing from a Display List Screen
Printing or Plotting from Other Screens
Using GRAPHICS.COM for Graphics Screen Dump to Printer
DISPLAYEXAMPLES ..........................................................
DisplayingaGraphfromaDataFiIe
........................................................
........................................... .
.........................................
...............................................
............................................
...........................
..............................................
.......
4-l
4-2
4-3
4-3
4-6
4-16
4-16
4-18
4-30
4-30
4-33
4-37
4-37
4-37
4-40
4-40
4-40
440
4-40
Page 10

4.7.2
4.7.3
4.7.4
4.7.5
4.7.6
Graphical Analysis Example
GraphOverlay
SecondYAxis(Y2)Graphing
ListingData
Printing/PlottingData
..............................................................
................................................................
SECTION 5 - File Operations
....................................................
...................................................
........................................................
4-42
446
4-48
4-48
5.1
5.2
5.2.1 TestSetupFiles
5.2.2
5.2.3
5.2.4 Import/ExportFormatFiles
5.2.5
5.3
5.4
5.5 RENAMINGnES
5.6 DELETINGFnES
5.7 EXPORT/IMPORTDATA
5.7.1
5.7.2
5.7.3
5.7.4
INTRODUCTION
FILETYPES
DataFiles
InstrumentConfigurationFiles
DefaultDirectories
LOADINGFILES
SAvINGFnES
ExportData
ImportFiles
Export/Import Data Format
ASCIIExport/ImportDataFormat
..............................................................
..................................................................
..............................................................
..................................................................
...........................................................
..............................................................
................................................................
.............................................................
..............................................................
................................................................
................................................................
SECTION 6 - Test Sequencer
6.1
6.2
6.3
6.3.1
6.3.2
6.3.3
6.3.4
6.3.5
6.3.6
63.7
6.3.8
6.4
6.5
6.6
~ODU~ON
TESTSEQUENCEROVERVIEW
TESTSEQUENCEFILE
TestSequenceGrammar
MessageS~eens
METACommands
TESTCommand.. ...........................................................
LOOP...ENDLOOPComman d
CONFIGCommand
PROMpTCommand
707FILECommand..
PARSER
ERRORFnES
SAMPLETESTSEQUENCE . . . . ..-...............................................
.....................................................................
..............................................................
.........................................................
.............................................................
...........................................................
..........................................................
..........................................................
.........................................................
.................................................................
..................................................
....................................................
.......................................................
....................................................
...............................................
...................................................
.......................................................
..................................................
5-l
5-l
5-2
5-2
5-2
5-3
5-3
5-3
54
5-5
5-5
5-5
5-6
5-6
5-7
S-10
6-l
6-l
6-2
6-2
65
6-5
6-6
6-8
6-10
6-10
6-12
6-13
6-14
6-14
A SoftwareStructure .............................................................
B
C
D
ErrorMessages
Model 2361 Trigger Controller
TestLibrary ..................................................................
................................................................
....................................................
A-l
B-l
C-l
D-l
Page 11
List of Illustrations
SECTION 2 - Getting Started
Figure 2-l
Figure 2-2
Figure 2-3
Figure 2-4
Figure 2-5
Figure 2-6
Figure 2-7
Figure 2-8
Figure 2-9
Figure 2-l 0
Figure 2-l 1
Figure 2-12
Figure 2-13
Figure 2-14
Figure 2-15
Figure 2-16
Figure 2-17
Figure 2-l 8
Figure 2-l 9
Figure 2-20
Figure 2-21
BlockDiagramofTestSystemwithModel251Software
Model 2361 Trigger Controller Front and Rear Panels
Single Unit Connections with Model 8006 Test Fixtures
Single Unit Connections with Model 8002A Test Fixture (Local Sense only)
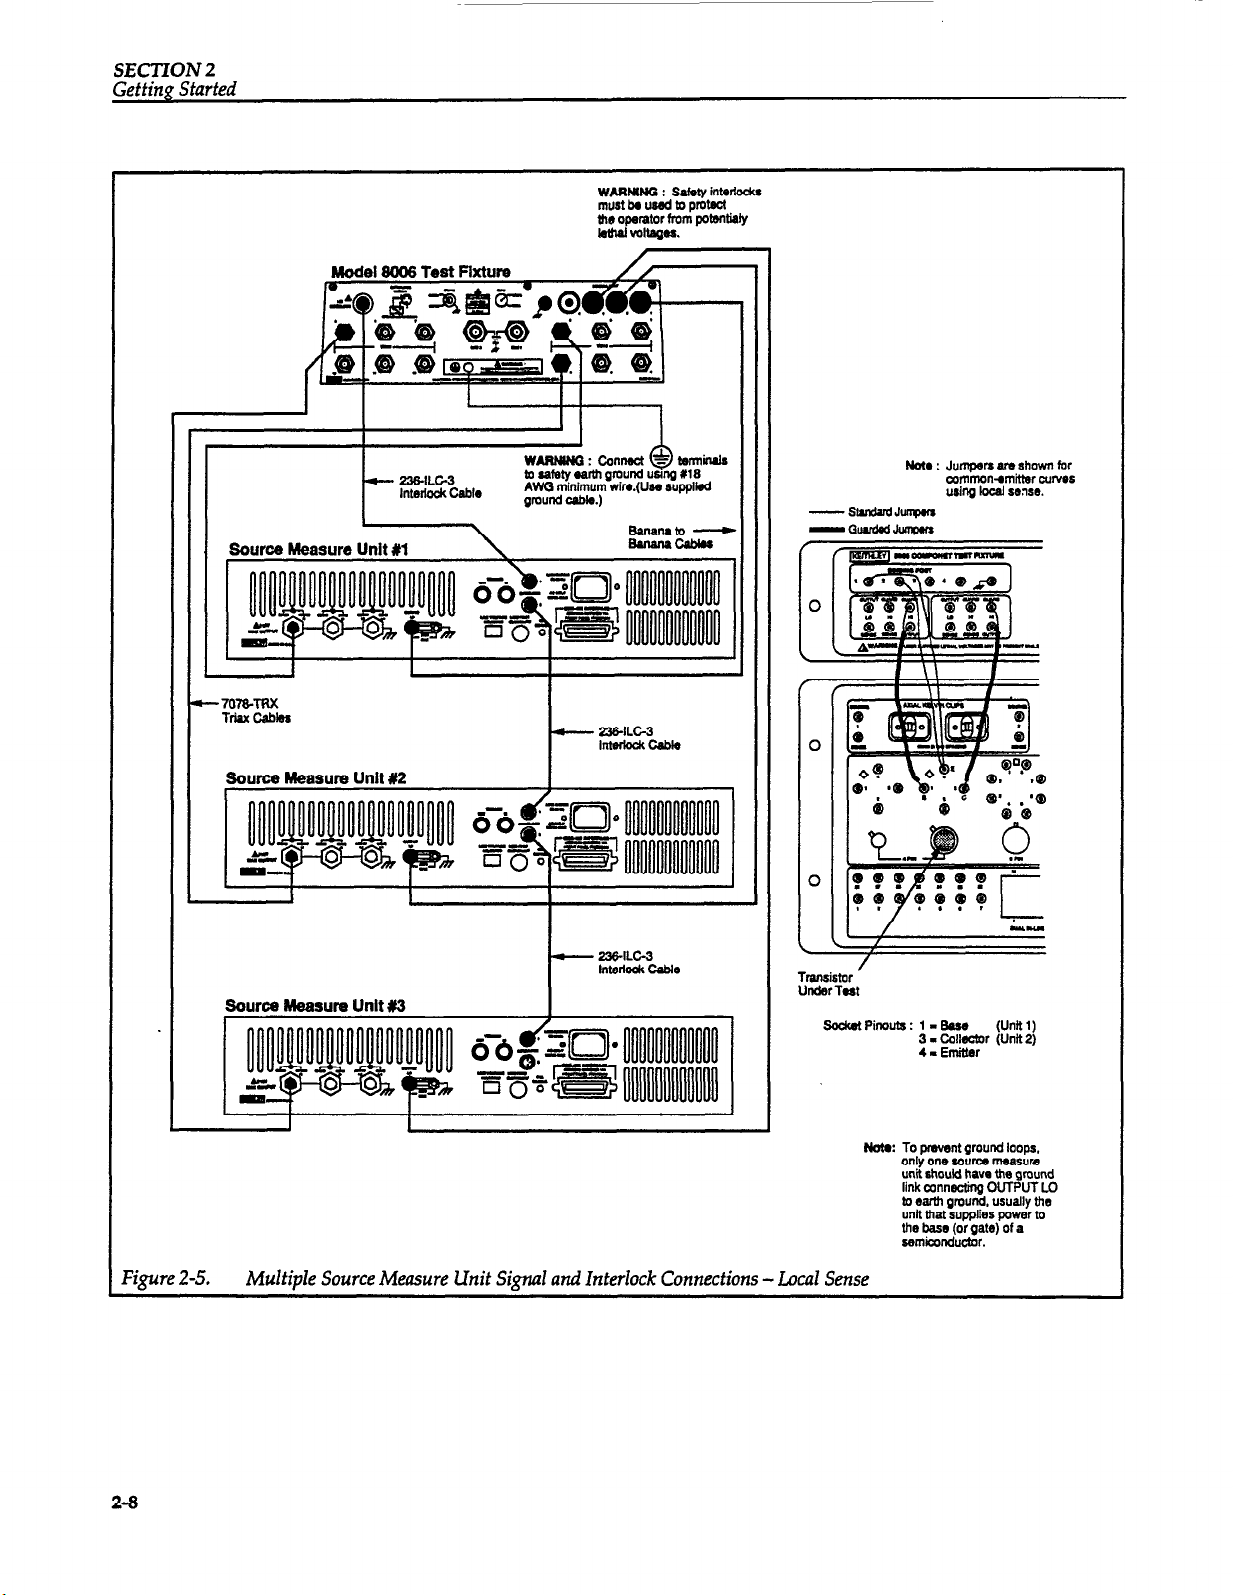
Multiple Unit Signal and Interlock Connections - Local Sense
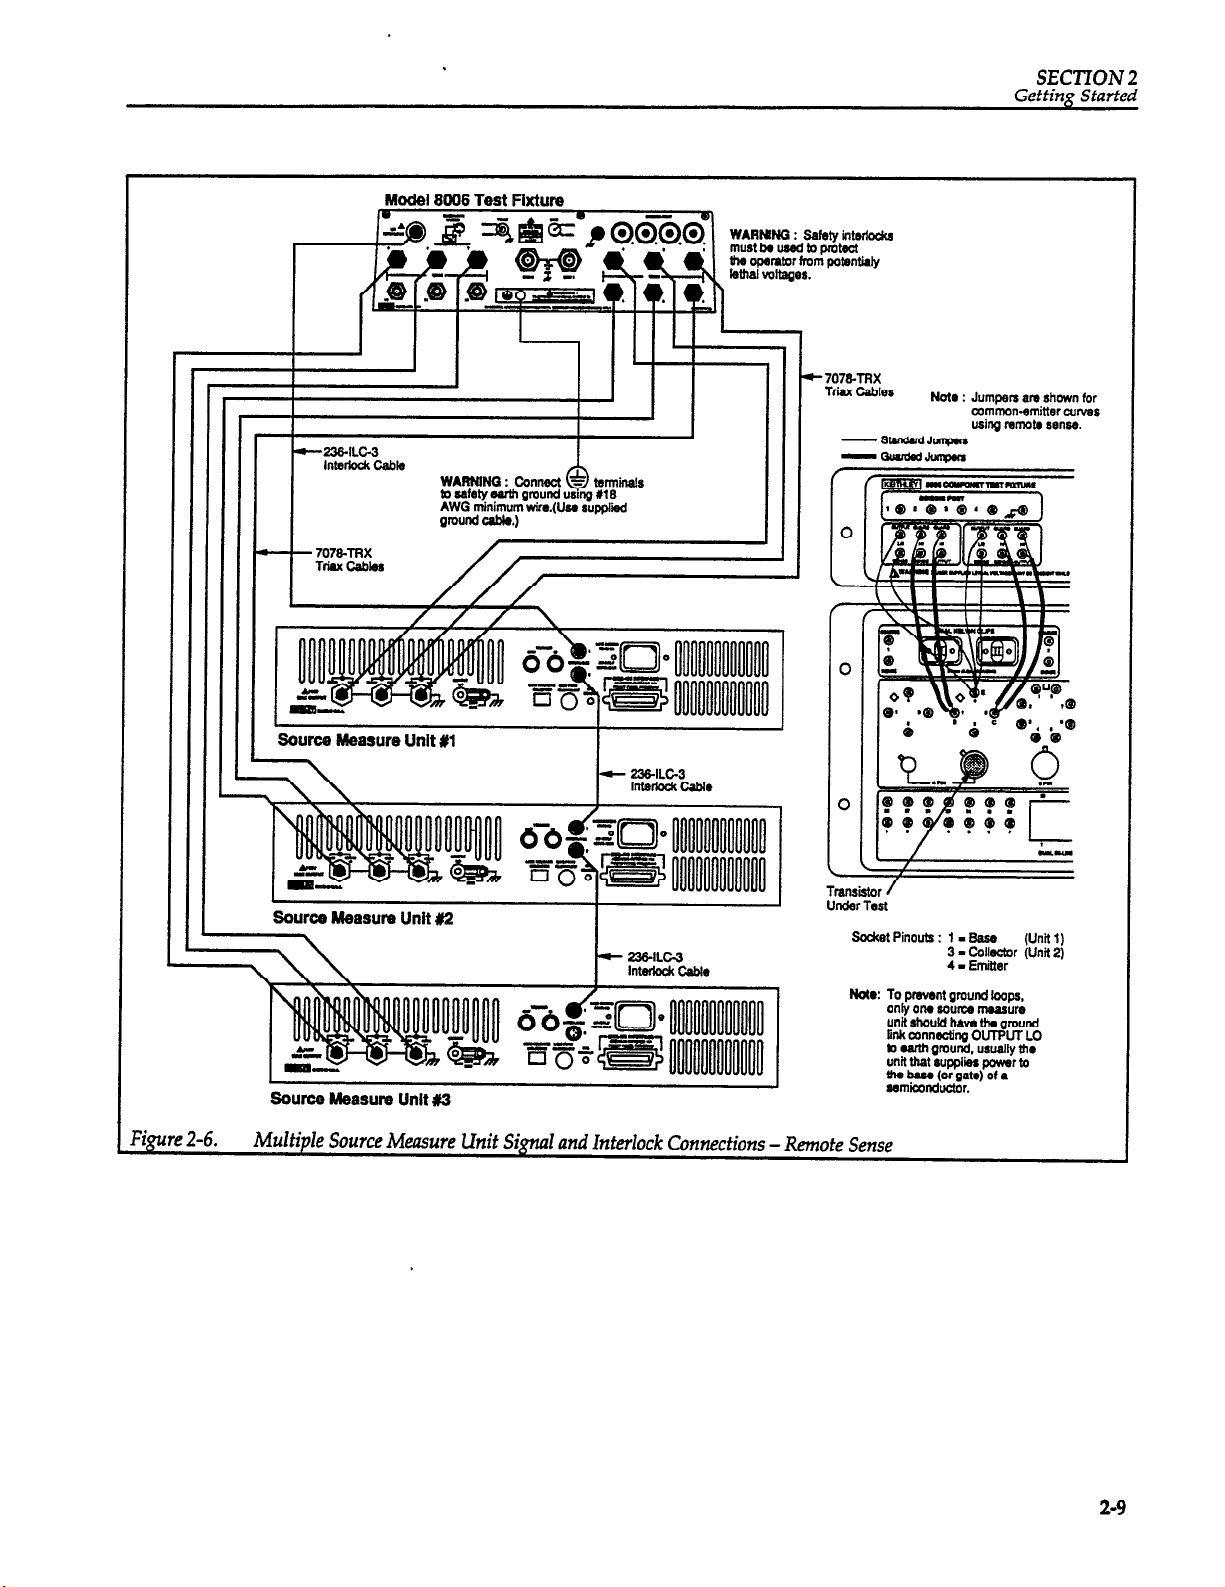
Multiple Unit Signal and Interlock Connections - Remote Sense
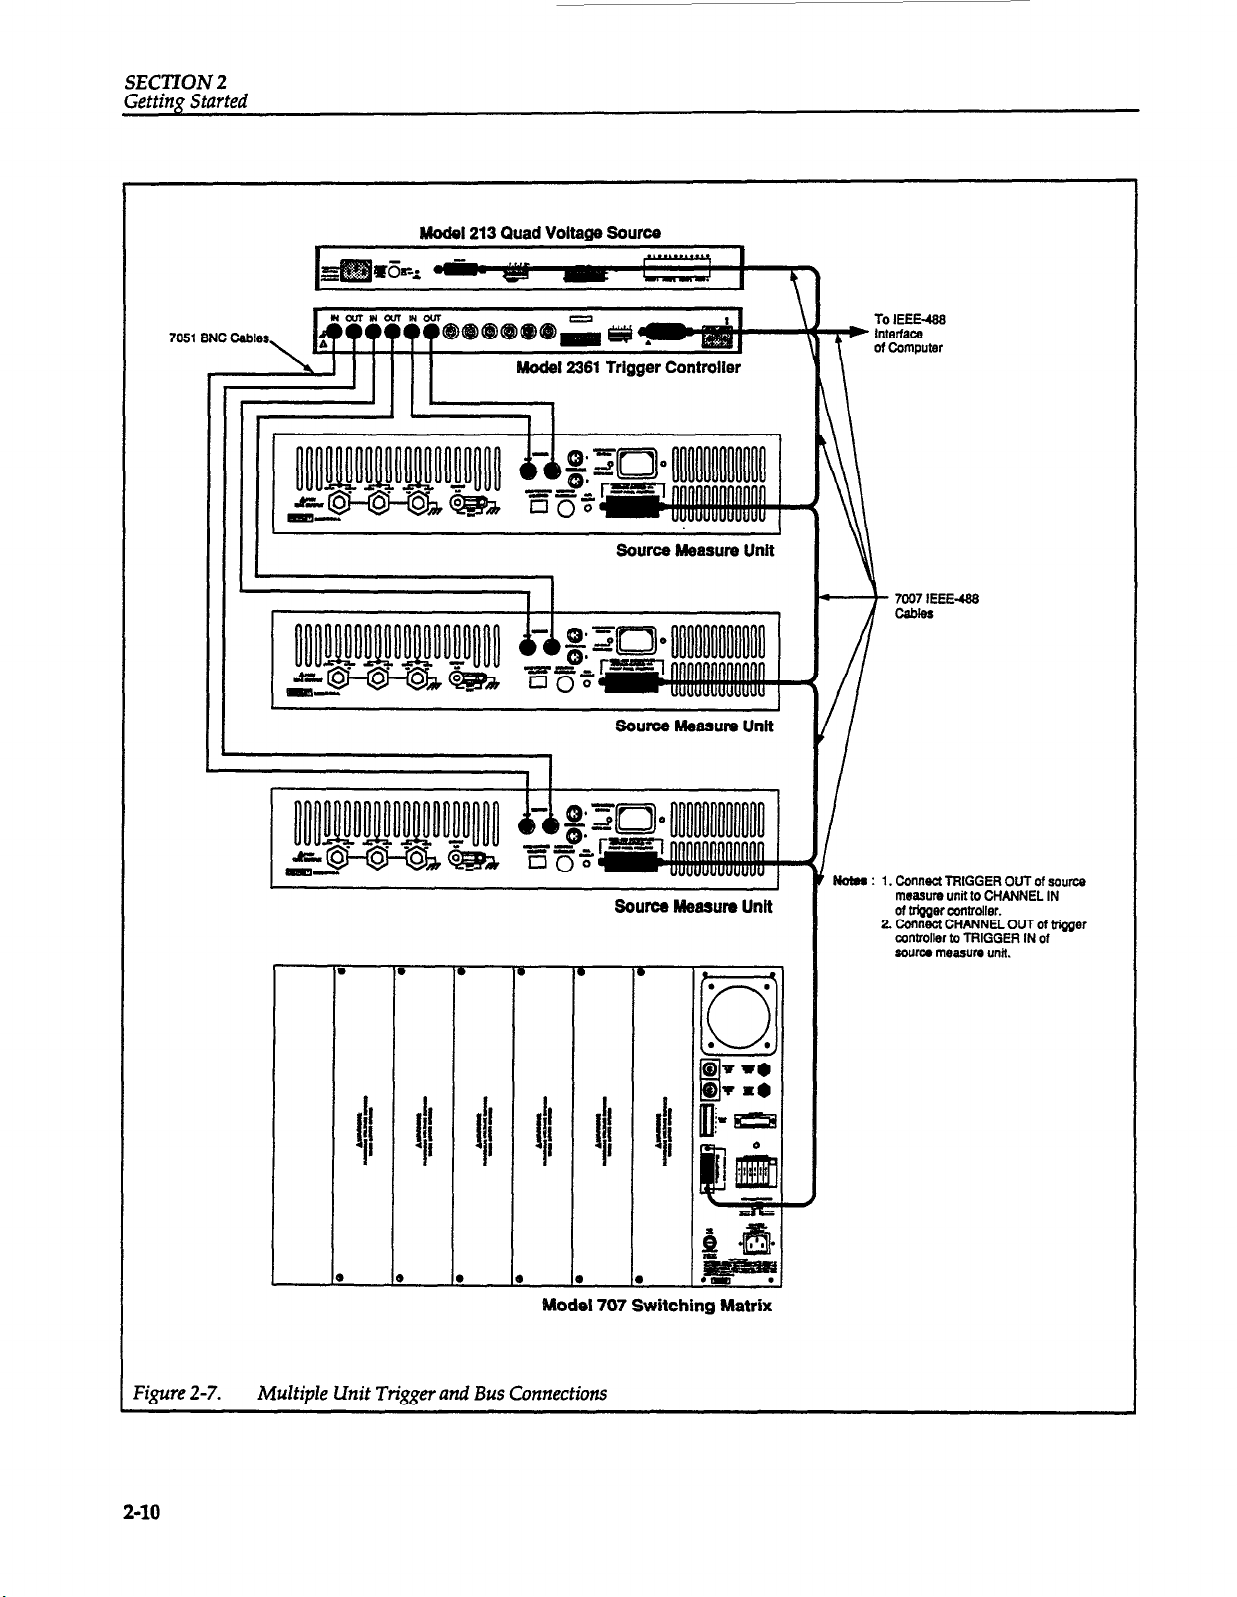
Multiple Unit Trigger and Bus Connections
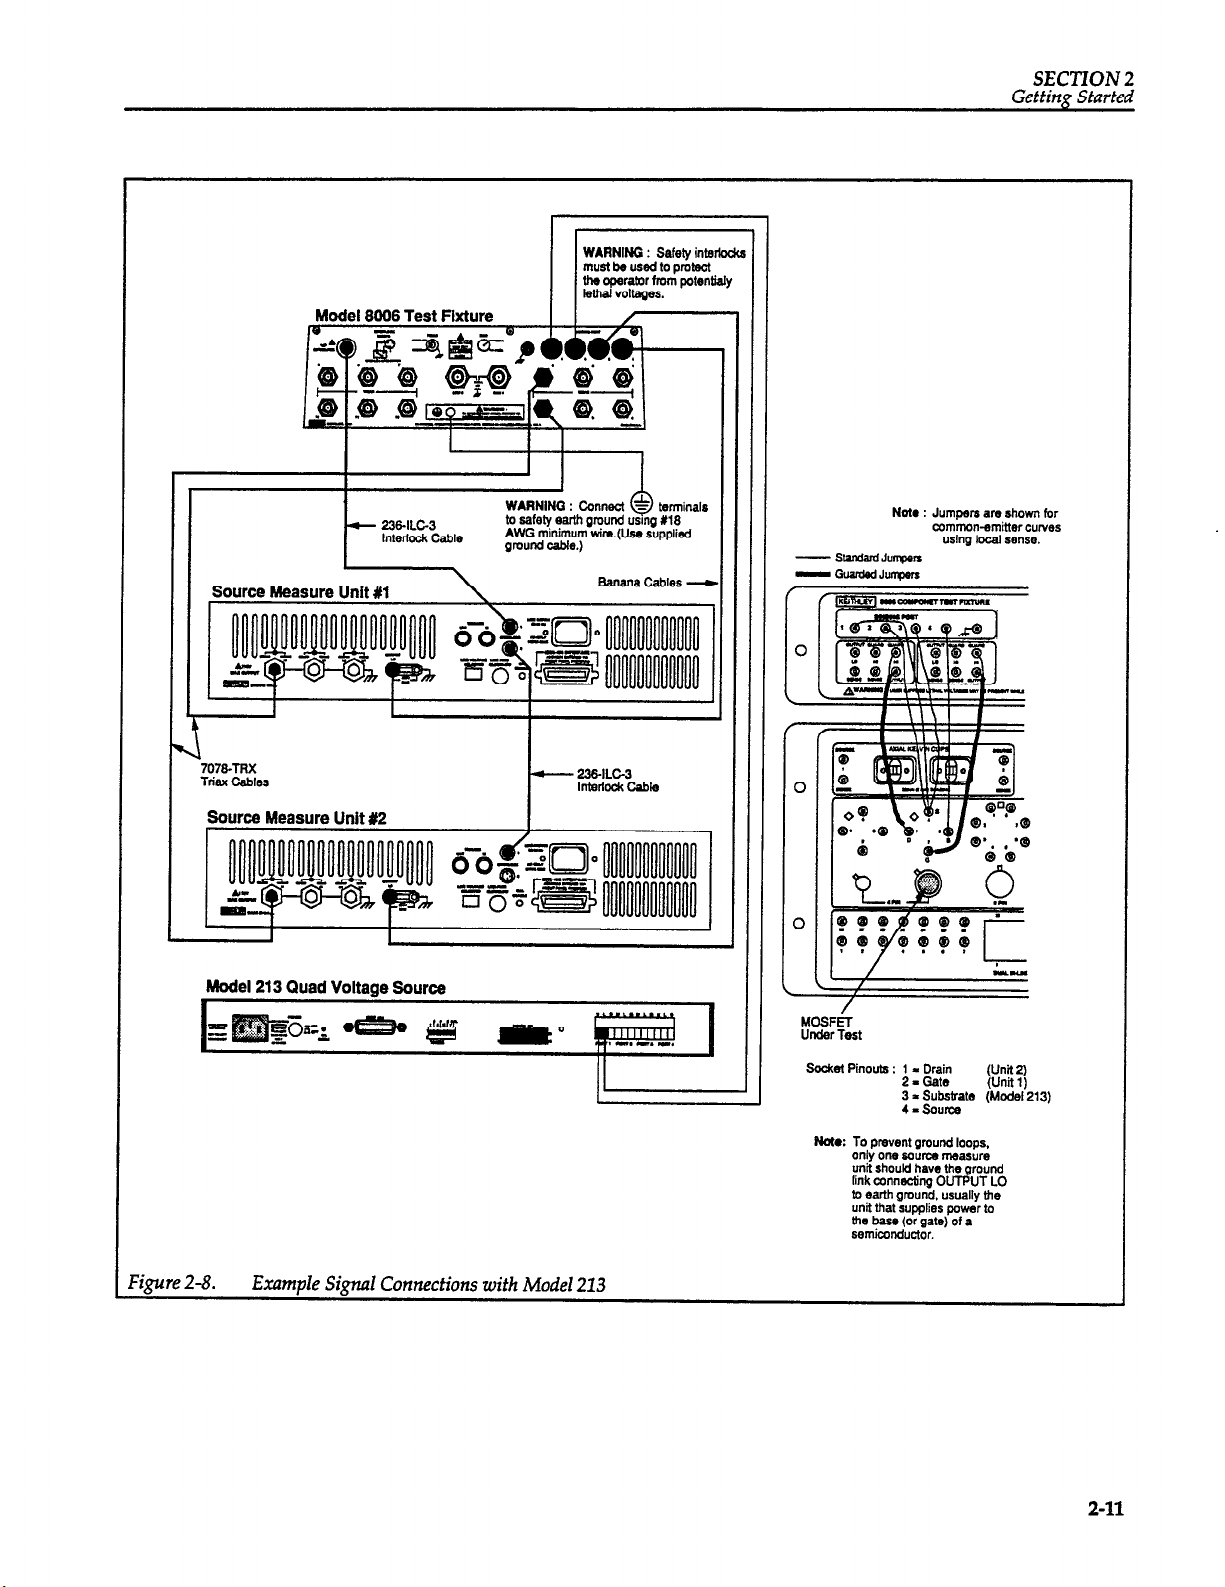
Example Signal Connections with Model 213
Example SignaI Connections with Model 7072
Model 213 DIP Switch Factory Defaults
Copy Protection Block
Example of MODEL25KFG File
MainMenuScreen ........................................................
MainMenuOptions .......................................................
HelpIndexScreen
GPIB Configuration Form Screen
Define Instruments Form Screen
Schematic for Diode Forward Biased I-V Characteristics
Diode Forward Biased I-V Characteristics
Schematic for NPN Transistor Common Emitter Curve Family
NPN Transistor Common Emitter Curve Family
......................................................
.............................................
.........................................................
.............................................
..............................................
......................................
.....................................
....................................
.........................................
.......................................
..................................
............................ 2-3
..............................
.............................
........................
......................
............................
.......................
..............
2-4
2-6
2-7
2-8
2-9
2-10
2-l 1
2-12
2-14
2-16
2-18
2-19
2-23
2-25
2-26
2-27
2-29
2-30
231
2-32
SECTION 3 - Measurements
Figure 3-l
Figure 3-2
Figure 3-3
Figure 3-4
Figure 3-5
Figure 3-6
Figure 3-7
Figure 3-8
Figure 3-9
Figure 3-10
Figure 3-l 1
Figure 3-12
Figure 3-13
DEFINE INSTR UMENTsForm
Model 2361 Rear Panel DIP Switch
CURVEFAMILYTESTForm ................................................
Curves per Family versus Points per Curve
Sample Single Channel Test Parameters
Sample MuItichannel Test Parameters
DC SOURCE-MEASURE Test Form
Sample DC Source-Measure Test Parameters
GENERAL GPIB OUTPUT Form
Model 236/237/238 Serial PoII Byte Format
Uploading and Storing Setups
Leading and Downloading Setups
CheckingStatusofModel213
...............................................
............................................
......................................
........................................
..........................................
...........................................
.....................................
..............................................
...................................... 3-33
................................................
............................................
................................................
3-6
3-7
3-10
3-15
3-18
3-20
3-24
3-29
331
3-34
3-34
3-38
Page 12
SECTION 4 - Data Display
Figure 41 DISPLAY PARAME
Figure 42 Colors/Curve Labels Window
Figure 43
Figure 44
Figure 4-5
Figure 46
Figure 47 Example Plot with Markers Activated
Figure 48
Figure 49
Figure 410
Figure 411 A.
Figure 411
Figure 412
Figure 413
Figure 414
Figure 415
Figure 416
Figure 417
Figure 418
Figure 419
Figure 420
Figure 421
DCGainWindow
Differential Gain Menu .....................................................
OverlayFormMenu
Graphics Display Screen ....................................................
Example Plot with Line Feature Activated
Horiz. zo,om Example ......................................................
OverlayExample
Non-inverted and Inverted Curves .........................................
Non-inverted and Inverted Curves (Cont.) ...................................
B.
List Mode Display Parameters Screen (Curve Test)
Curve Data List Display ....................................................
L&t Mode Display DC Parameters Screen
ListDisplayScreenFormatforDCTest
Plot Graph Example .......................................................
PrintGraphExample
Typical Plotting Example Using NPNCRV.DAT
Example Plot Showing Lines and Markers
Graph Overlay Example ....................................................
Gummel Plot Example .....................................................
TEES Screen (Graphics Mode)
...............................................
.........................................................
.......................................................
.........................................................
......................................................
................................
..........................................
.......................................
................................
.......................................
.........................................
..................................
.......................................
44
49
4-11
4-13
4-15
4-16
4-19
4-22
4-24
426
428
4-29
431
4-32
4-33
435
4-38
4-39
442
4-44
4-46
4-47
SECTION 5 - Data Display
Figure 5-l
Figure 5-2
Figure 53
FileExportFormat . . . . . . . . . . . . . . . . . . . . . . . . . . . . . . . . . . . . . . . . . . . . . . . . . . . . . . . .
Actual Example of File Export . . . . . . . . . . . . . . . . . . . . . . . . . . . . . . . . . . . . . . . . . . . . . . . .
Model 251 V2.00 ASCII Import/Export File . . . . . . . . . . . . . , . . . . . . . . . . . . . . . . . . . . . . . .
SECTION 6 - Test Sequencer
Figure 6-l
Test Execute Flow Pattern . . . . . . . . . . . . . . . . . . . . . . . . . . . . . . . . . . . . . . . . . . . . . . . . . . .
5-8
5-9
5-11
6-7
Page 13
List of Tables
SECTION 1
Table 1-l
- General Information
Computer Hardware Requirements
. . . . . . . . . . . . . . . . . . . . . . . . . . . . . . . . . . . . . . . . . . .
SECTION 2 - Getting Started
Table 2-l
Table 2-2
Table 2-3
Table 2-4
Table 2-5
Table 2-6 AvailableFunctionKeys..
Table 2-7 Typical Interrupt Line Assignments
Table 2-8 System Troubleshooting Summary
Signal and Interlock Cables
IEEE-488 Boards and Default Configurations
Model 251 Errors Messages on Start-up
Supported Configurations for Peripheral Devices
LoadandSaveFileTypes
..................................................
.....................................
.........................................
.................................
...................................................
..................................................
...........................................
............................................
SECTION 3 - Measurements
Table 3-l
Table 3-2
Table 3-3 Uploading and Downloading Support for Instruments
EditingKeyFunctions
Order of User Actions
......................................................
......................................................
SECTION 5- File Operations
.............................
l-3
24
2-15
2-20
2-21
2-24
2-25
2-27
2-31
3-4
3-35
3-35
Table 5-l
Table 5-2
FileType . . . . . . . . . . . . . . . .
Typical Default Directories . . . . . . . . . . . . . . . . . . . . . . f. . . . . . . . . . . . . . . . . . . . . . . . . . . .
. . . . . . . . . . . . . . . . . . . . . . . . . . . . . . . . . . . . . . . . . . . . . . .
5-2
53
Page 14

SECTION 1
General Information
1 .i INTRODUCTION
This section contains overview information for the
Model 251 I-V Test Software system and is arranged as
follows:
1.2 Features
1.3 Warranty Information
1.4 Manual Addenda
1.5 Safeiy!i$nbols and Terms
--- --r
1.7 Computer Requirements
‘0 ..a... a...y~~.a.“‘S
1.2 FEATURES
Model 251 I-V Test Software is a program that controls a
system of instruments designed to measure I-V characteristics of semiconductors. Model
to support the following instruments:
l
Model 236/237/238 Source Measure Units
e Model 2361 Trigger Controller
l
Model 213 Quad Voltage Source
l
Model 707 Switching Matrix
251 can
be configured
Other Keithley and non-Keithley instruments are supported with user-programmed device-dependent commands.
Key Model 231 features include:
l
The menu-driven software allows easy data collection
of parameters from semiconductors and other components. No computer programming knowledge is necessary to operate the system
l
The data is displayed on the computer monitor and
can be printed or plotted on a hardcopy peripheral.
l
craphi& analysis caiabilit& i&cl&e m&kers, line
slope, zooming, and smoothing.
l
A library of tests is included for resistors, capacitors,
diodes, bipolar transistors, and FEIS. Test setup and
sample data files are included on disk.
l
A test sequencing procedure lets you chain multiple
tests without operator interventions.
l
Full Model 213 support provides an easy method of interfacing a four-channel voltage bias source.
l
Model 707 support for uploading and downloading of
up to 100 setups expands the capability to run multiple
tests on multiple devices.
l
The Model 2361 Trigger Controller that is available
simplifies trigger connections and optimizes trigger
response times among the source measure units.
l-l
Page 15
SECTION 1
General Information
1.3 WARRANTY INFORMATION
Warranty information is located on the inside front cover
of this instruction manual. Should you require warranty
service, contact your Keithley representative or the fac-
tory for further information.
1.4 MANUAL ADDENDA
Any improvements or changes concerning Model 251 I-V
Test Software or this instruction manual will be explained on a separate addendum supplied with the documentation. Please be sure to note these changes and incorporate them into the manual before operating the system.
1.5 SAFETY SYMBOLS AND TERMS
The following safety symbols and terms may be found on
the instruments or used in this manual:
A
The ’
should consult the operating instructions in the associated manual.
symbol on an instrument indicates that you
A CAUTION heading outlines dangers that could damage an instrument. Such damage may invalidate the warranty.
1.6 UNPACKING AND INSPECTION
1.6.1
Upon receiving the Model 251, carefully unpack it from
the shipping carton and inspect all items for any obvious
physical damage. Report any such damage to the shipping agent at once. Save the original packing carton for
possible future reshipment.
1.6.2
The following items are included with every Model 251
order:
Model 251 distribution disks (XM-byte, 5-l/4” and
72OK-byte, 3-l /2”)
Copy protection block
Model 251 Instruction Manual
Unpacking Procedure
Shipment Contents
The t symbol on an instrument shows that high voltage
may be present on the terminal(s). Use standard safety
precautions to avoid personal contact with these volt-
ages.
A WARNING heading in this and other manuals cautions against possible hazards that could lead to personal
injury or death. Always read the associated information
very carefully before performing the indicated procedure.
NOTE
Model 251 distribution disks are available
upon request in the 36OK-byte, 5-l/4” format.
Contact Keithley’s Applications department.
1.6.3 Instruction Manual
If an additional instruction manual is required, order the
manual package, 251-901-00. The manual package includes an instruction manual and any applicable addenda.
l-2
Page 16
General Informafion
SECTION 2
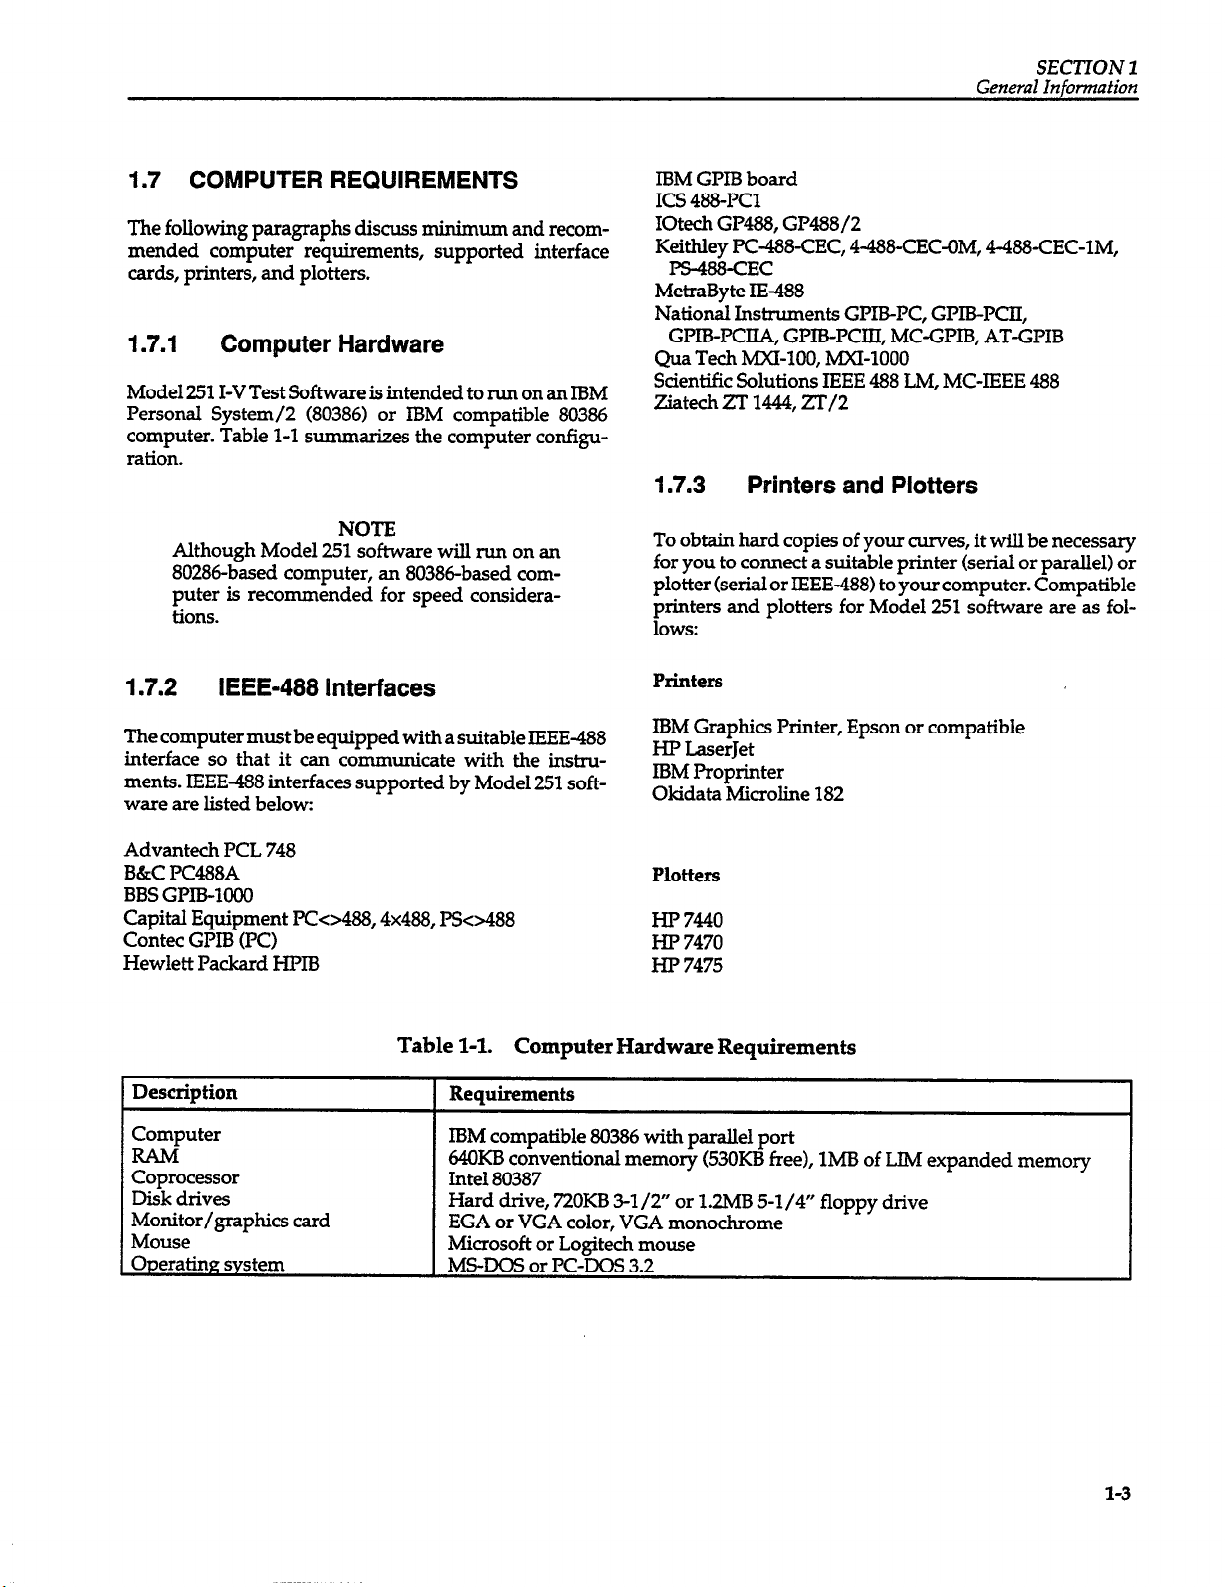
1.7 COMPUTER REQUIREMENTS
The following paragraphs discuss minimum and recommended computer requirements, supported interface
cards, printers, and plotters.
1.7.1 Computer Hardware
Model 251 I-V Test Software is intended to run on an IBM
Personal System/2 (80386) or IBM compatible 80386
computer. Table l-l summarizes the computer configuration.
NOTE
Although Model 251 software will run on an
80286-based computer, an 80386based computer is recommended for speed considerations.
1.7.2
The computer must be equipped with a suitable IEEE-488
interface so that it can communicate with the instruments. IEEE-488 interfaces supported by Model 251 software are listed below:
IEEE-488 Interfaces
IBM GPIB board
ICS 488-PC1
IOtech GP488, Gl’488/2
Keithley PC-488-CEC, 4-488-CEC-OM, 4-488-CEC-lM,
PS-488-CEC
MetraByte IE-488
National Instruments GPIB-PC, GPIB-PCII,
GPIB-PCJIA, GPIB-PCm, MC-GPIB, AT-GPIB
Qua Tech MXI-100, MXI-1000
Scientific Solutions IEEE 488 LM, MC-IEEE 488
ziatech ZT 1444, zT/2
1.7.3
To obtain hard copies of your curves, it will be necessary
for you to connect a suitable printer (serial or parallel) or
plotter (serial or IEEE-4881 to your computer. Compatible
printers and plotters for Model 251 software are as follows:
Printers
IBM Graphics Printer, Epson or compatible
HP LaserJet
IBM Proprinter
Okidata Microline 182
Printers and Plotters
Advantech PCL 748
B&C PC488A
BBS GPIB-1000
Capital Equipment PCc488,4x488, PSo488
Contec GPIB (PC)
Hewlett Packard HPlB
Table l-l.
Description
Computer
Coprocessor
Disk drives
Monitor/graphics card
Mouse
Operating system
Requirements
IBM compatible 80386 with parallel port
64OKB conventional memory (53OKB free), 1MB of LlM expanded memory
Intel 80387
Hard drive, 72OKB 3-l /2” or 1.2MB 5-l /4” floppy drive
EGA or VGA color, VGA monochrome
Microsoft or Lotitech mouse
MS-DOS or PC-“m 3.2
Plotters
HP 7440
HP 7470
HP 7475
Computer Hardware Requirements
l-3
Page 17

SECTION 2
Getting Stc[&cJ
2.1 INTRODUCTION
5eciion 2 contains introductory information to help you
get your system up and
Section 3 contains more detailed information on using
the Model 251 I-V Test Software.
5ection 2 is organized as follows:
22 Hardware Configuration: Details the system hardware contiguration, cable connections, and trigger controller.
2.3 System Power-up: Covers the power-up procedure
for a typical system, environmental conditions, and
warm-up periods.
2.4 Computer Hardware and Software Installation:
Outlines installing the IEEE-488 interface and Model 251
software, including configuring the software for a graphics adapter, printer, and plotter.
2.5 Operation Overview: Describes the overall structure
of the Model 251 I-V Test Software and details configuring the software for the IEEE-488 interface and instruments.
2.6 System Checkout: Gives the procedure for checking
out the system to ensure that everything is working properly, including
running sample tests.
running as quickly as possible.
2.2 HARDWARE CONFIGURATION
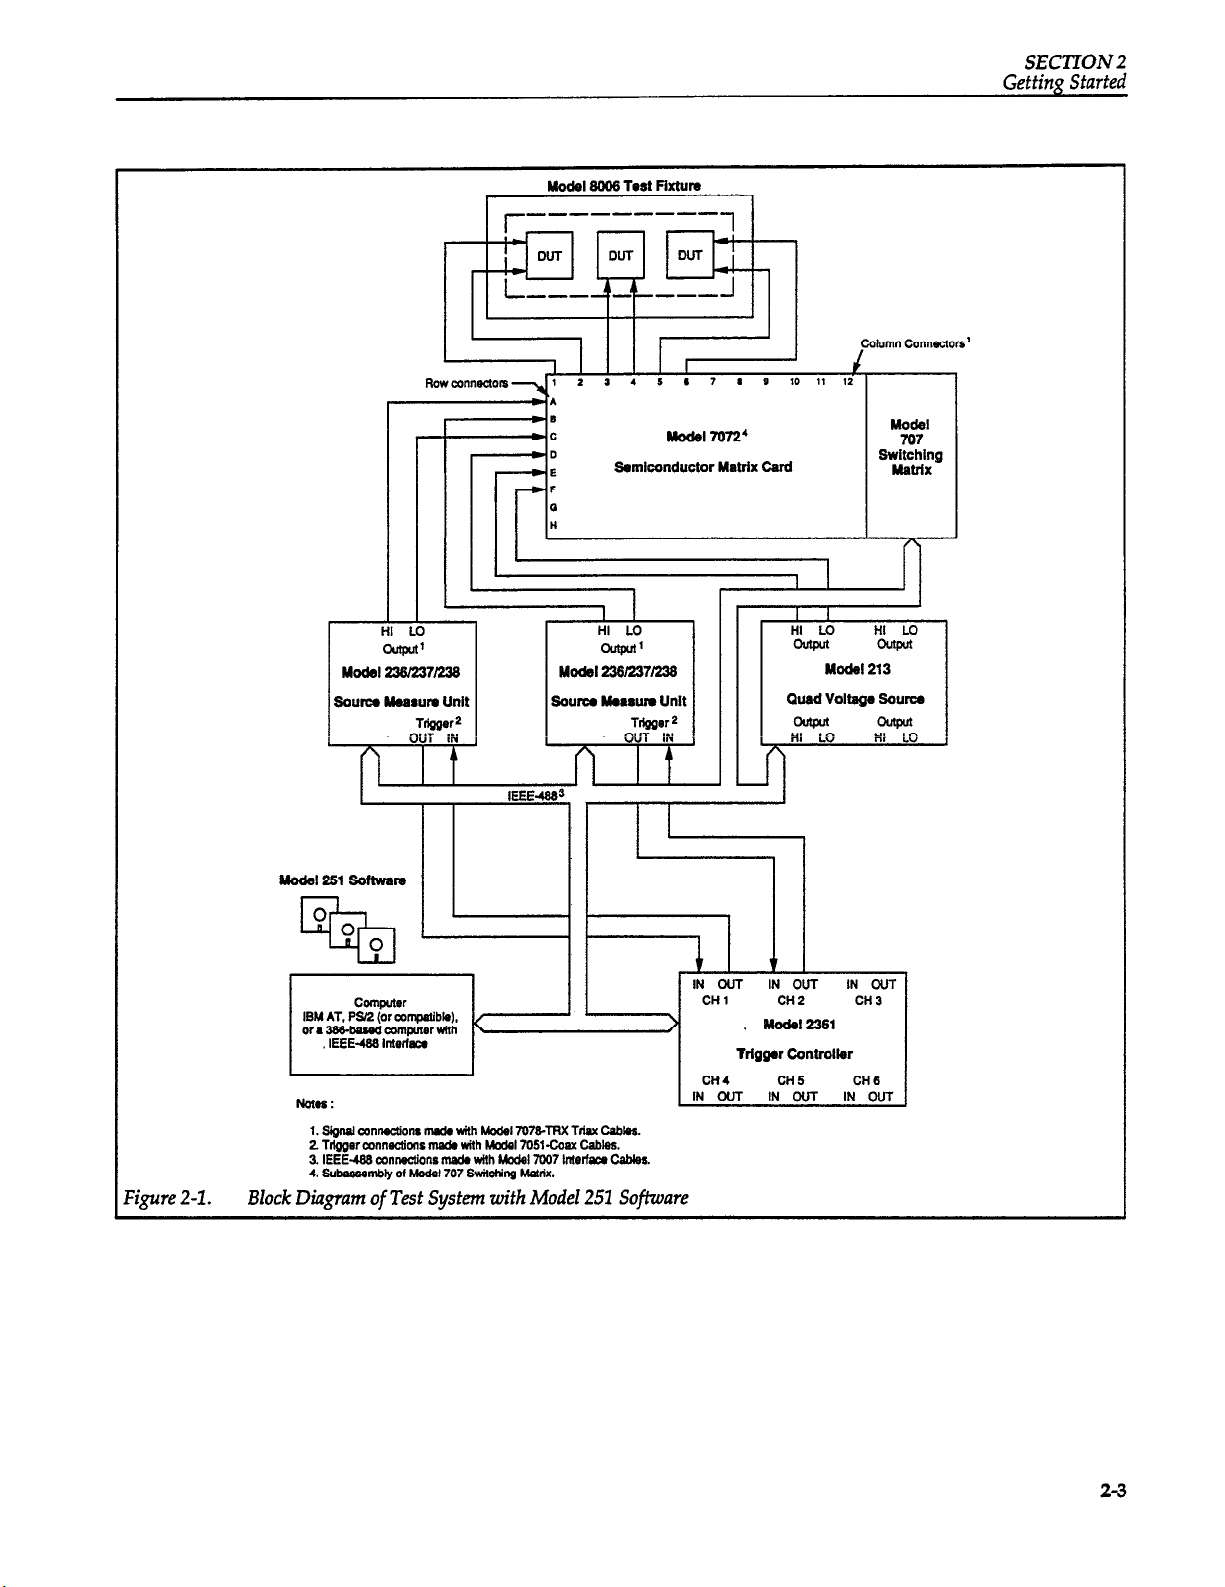
2.2.1
An overall block diagram of a system for running Model
251 software is shown in Figure 2-l. This configuration
with two source measure units, a quad voltage source,
and a switching card and mainframe, is a typical system
with switching, yours may differ. The various system
components perform the following functions:
Model 236/237/238 Source Measure Units - Each
source measure unit can source voltage and simultaneously measure current, or source current and simultane
ously measure voltage. One unit is necessary to run twoterminal device tests, while two units are required to run
bipolar transistor and FET tests. If a substrate bias is required, a third source measure unit, a quad voltage
source, or a current or voltage source will be necessary.
Model 2361 Trigger Controller - A Model 2361 Trigger
Controller is a bus-programmable instrument that is required for all tests where more than one source measure
unit is configured to measure (including synchronized
sweeps). The unit can handle the triggering needs of up
to six source measure units. It not only simplifies system
trigger connections, but it also coordinates the trigger
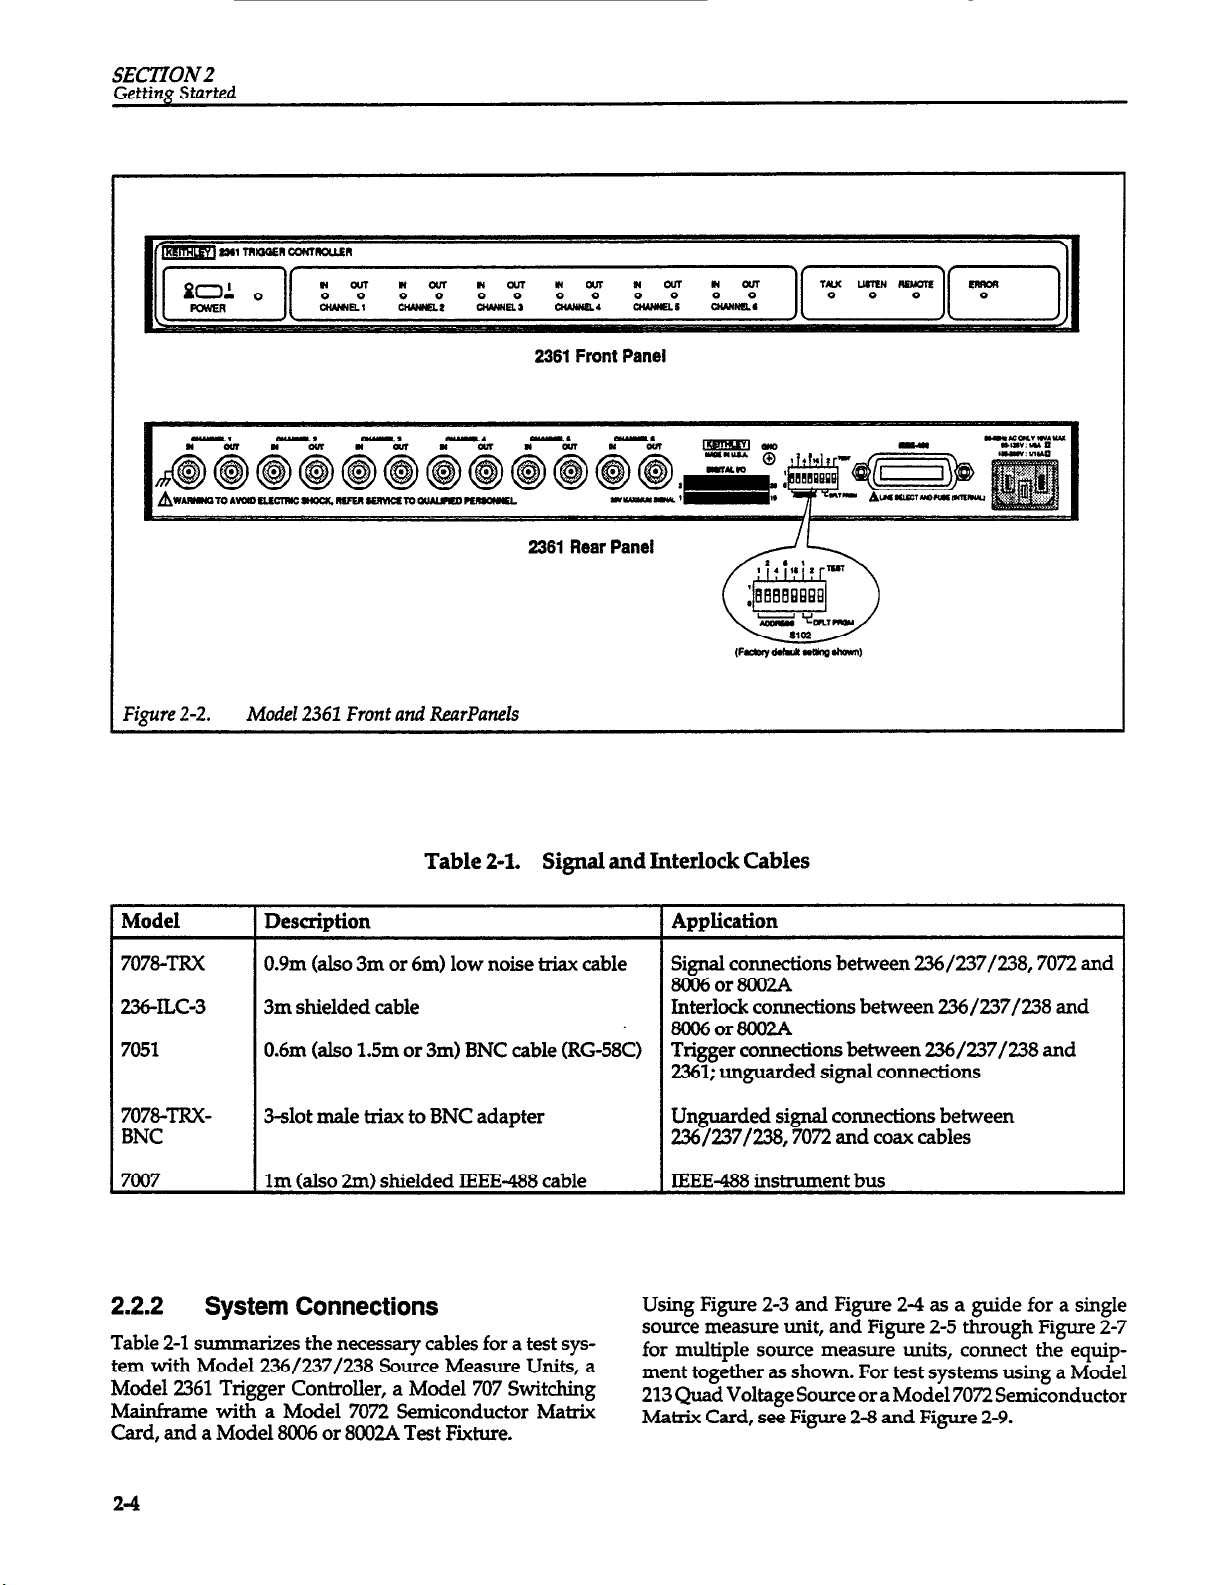
schemes needed for ah tests. The front and rear panels of
the Model 2361 are shown in Figure 2-2. Refer to Appendix C for more information on the Model 2361.
System Block Diagram
2-l
Page 18
SECTION 2
Getting Started
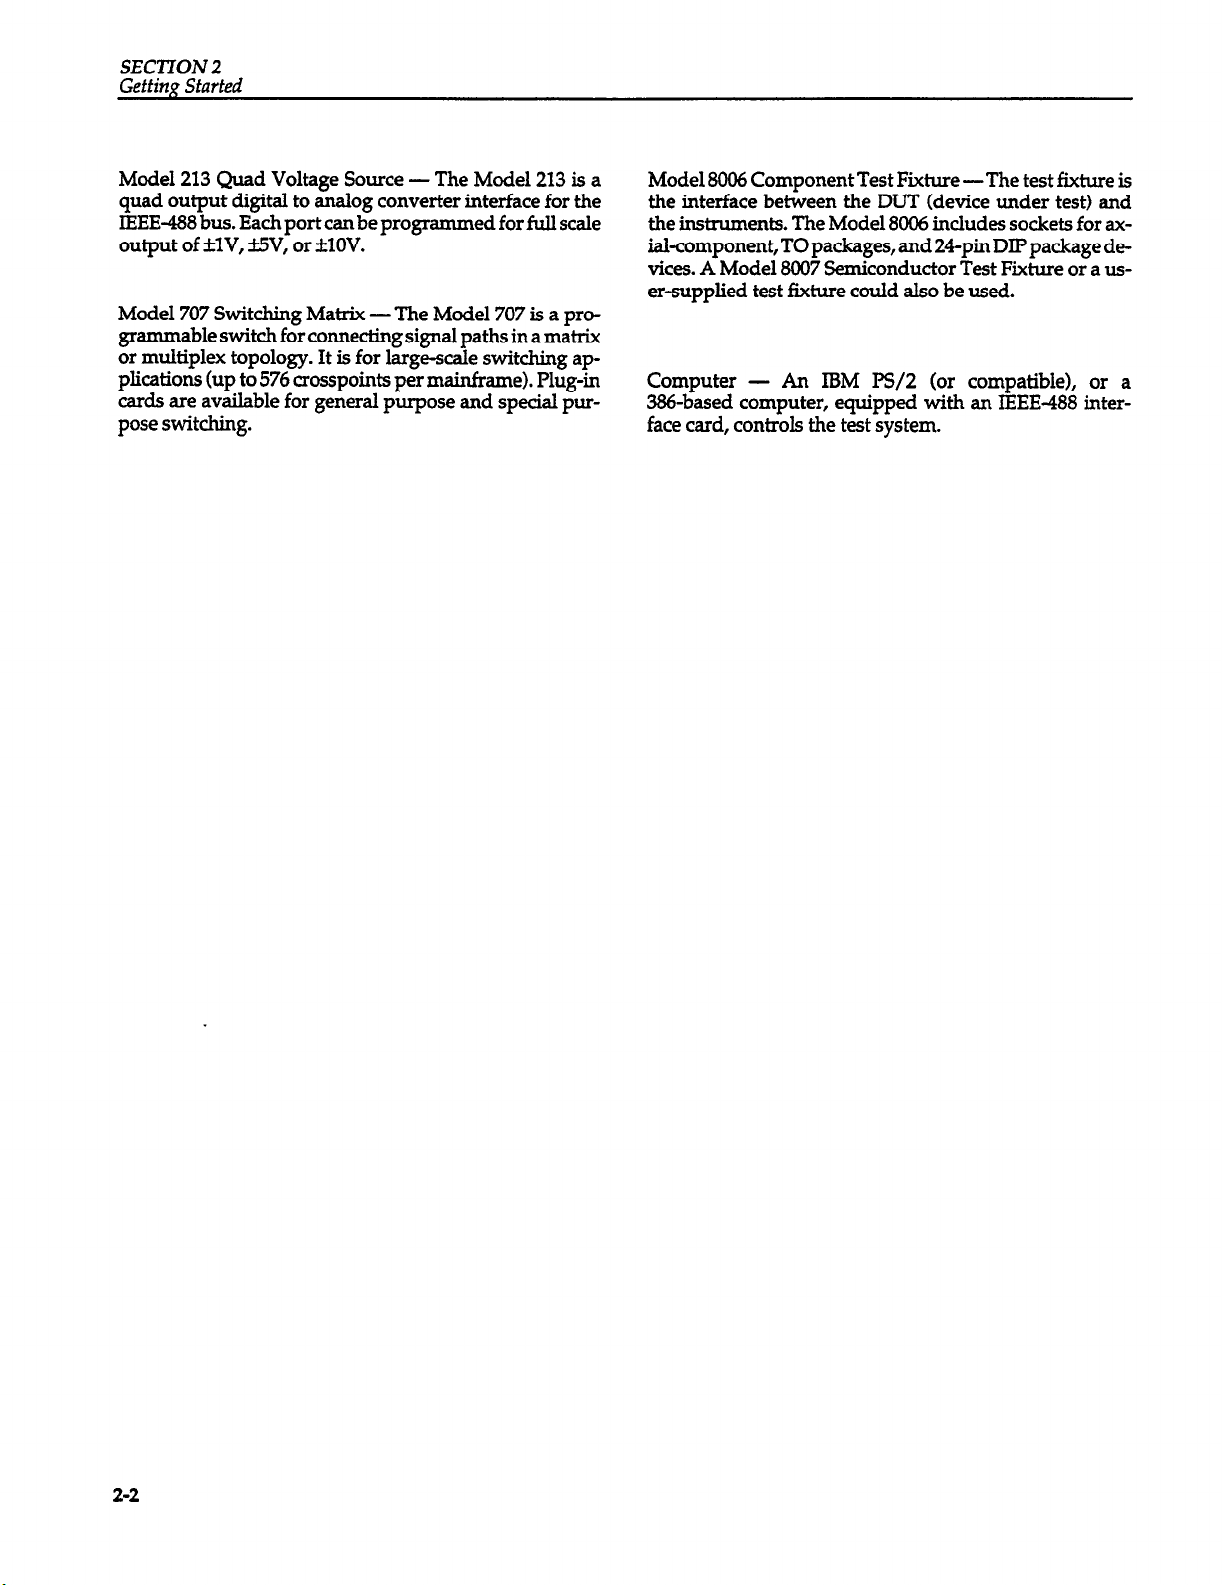
Model 213 Quad Voltage Source - The Model 213 is a
quad output digital to analog converter interface for the
IEEE-488 bus. Each port can be programmed for full scale
output of *lV, i5V, or flOV.
Model 707 Switching Matrix - The Model 707 is a programmable switch for connecting signal paths in a matrix
or multiplex topology. It is for large-scale switching applications (up to 576 crosspoints per mainframe). Plug-in
cards are available for general purpose and special purpose switching.
Model 8006 Component Test Fixture -The test fixture is
the interface between the DUT (device under test) and
the instruments. The Model 8006 includes sockets for axial-component, TO packages, and 24-pin DIP package devices. A Model 8007 Semiconductor Test Fixture or a user-supplied test fixture could also be used.
Computer - An IBM F’S/2 (or compatible), or a
386-based computer, equipped with an IEEE-488 interface card, controls the test sys tern.
Page 19
SECTION 2
Getting Started
Figwe2-2.
m i
I I
II
I
HI I
L
MO&l 251 sonwara
0
0
Q&l
IBM AT, P.Y2 (or compafibb).
ora336+wdoompufsrtih
fdOl@S:
4. subosse~ Of Model 707 swwing Maftfx.
0
Cwnputer
IEEE-488 Inferfaa
1. signal conlwctiotls mada wifh kdel707fJ-TRX Tfiax cabbs.
2 1-r connecUonr male wifh Model 7OWCoax Cab!+%
3. IEEE-483 contwclionr mada wifh Model 7007 Inferfax C&k
(
Semiconductor Matrix Card
I -1
IN OUT
>
IN OUT
Block Diagram of Test System with Model 251 Software
I-
t I
CHl
. Modsl23s1
Trlggsf Controller
CH4
t I
IN OUT IN OUT
CH2
CH5
IN OUT IN OUT
CH3
CHfi
J
2-3
Page 20
SECl’TOiVP
Getting Started
2361 Front Panel
2361 Rear Panel
Figure 2-2. Model 2361 Front and RearPanels
Table 2-l. Signal and Interlock Cables
Model
7078TRX
236-TLC-3
7051
707&TRx-
Description Application
0.9m (also 3m or 6m) low noise triax cable
3m shielded cable
0.6m (also 1.5m or 3m) BNC cable fRG38C) Trigger
3-slat male triax to BNC adapter
BNC
7007
lm (also 2m) shielded IEEE-488 cable
Signal connections between 236/237/238,7072 and
8006or8002A
Interlock
co~eCtions
between 236/237/238 and
8006or8OOL4
COM~C~~OIIS
2361; unguarded signal
between 236/237/238 and
COMWtiOIlS
Unguarded signal connections between
236/237/238,7072 and coax cables
IEEE-488 instrument bus
2.2.2
System Connections
Table 2-l summarizes the necessary cables for a test sys-
tem with Model 236/237/238 Source Measure Units, a
Model 2361 Trigger Controller, a Model 707 Switching
Mainframe with a Model 7072 Semiconductor Matrix
Card, and a Model 8006 or 8002A Test Fixture.
24
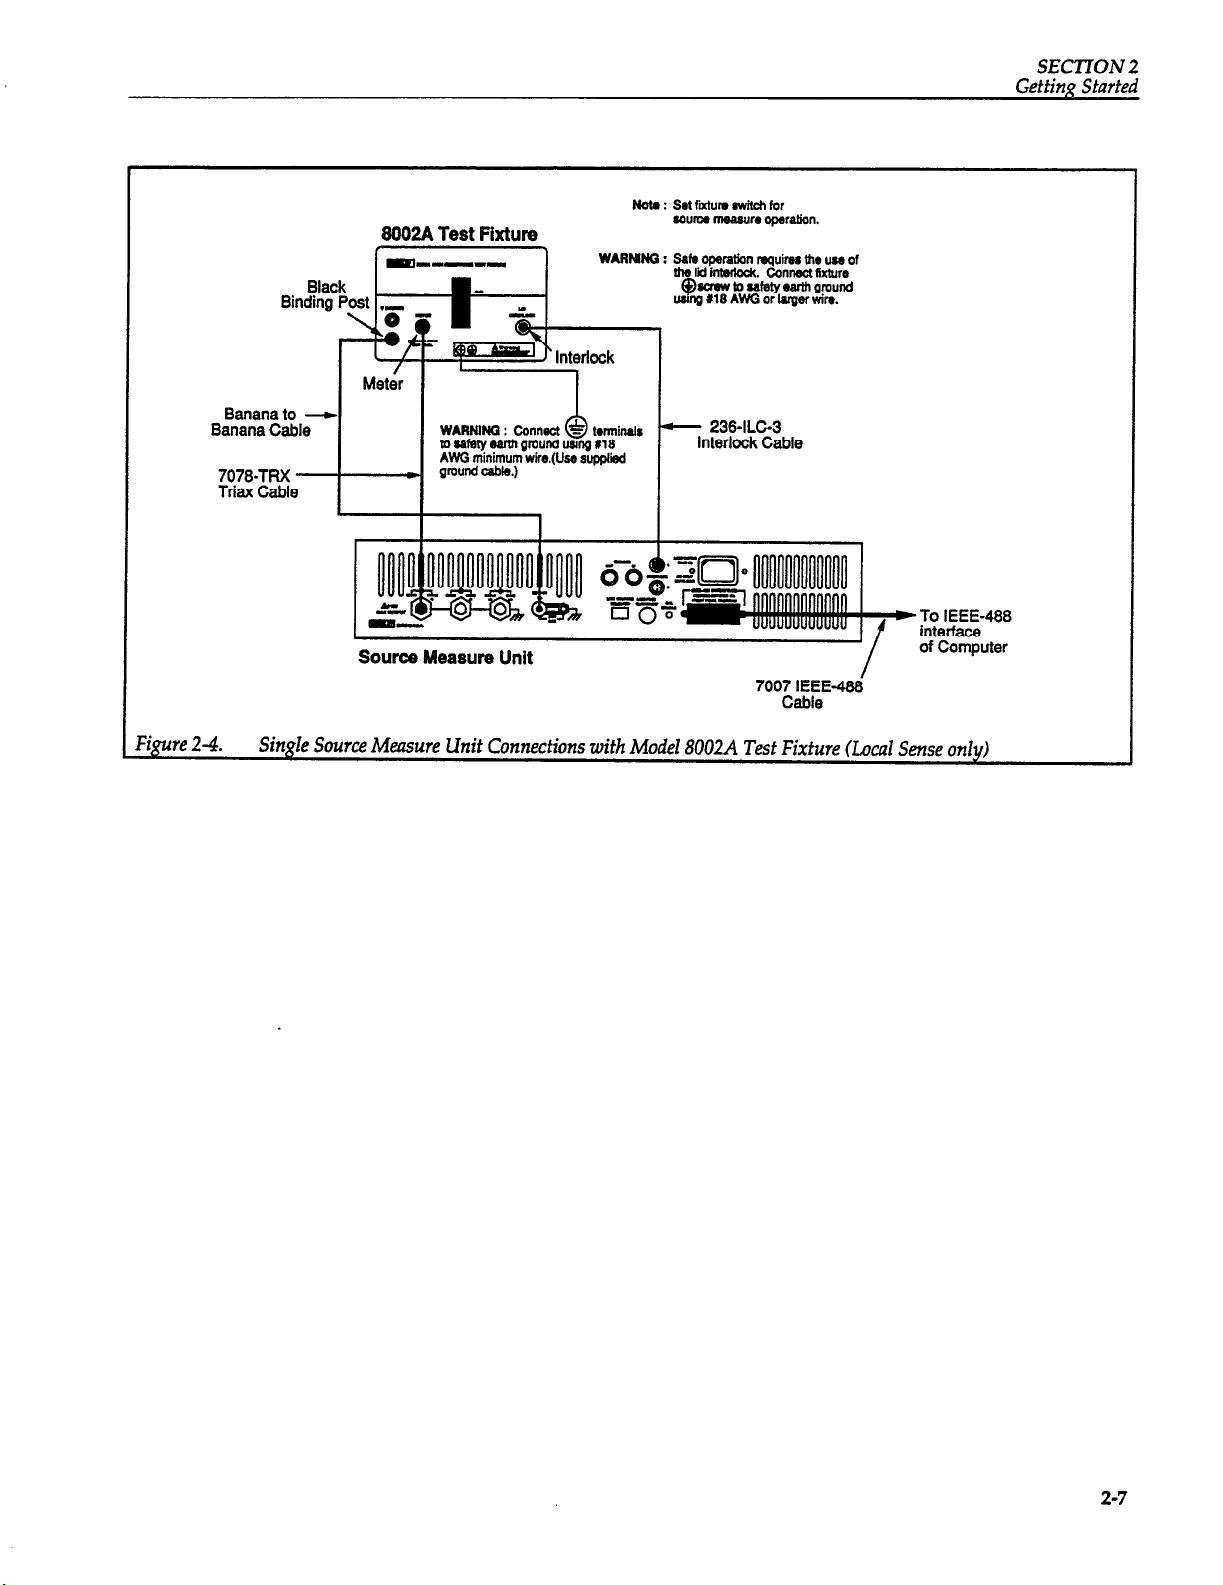
Using Figure 2-3 and Figure 2-4 as a guide for a single
source measure unit, and Figure 2-5 through Figure 2-7
for multiple source measure units, connect the equipment together as shown. For test systems using a Model
213 Quad Voltage Source or a Model 7072 Semiconductor
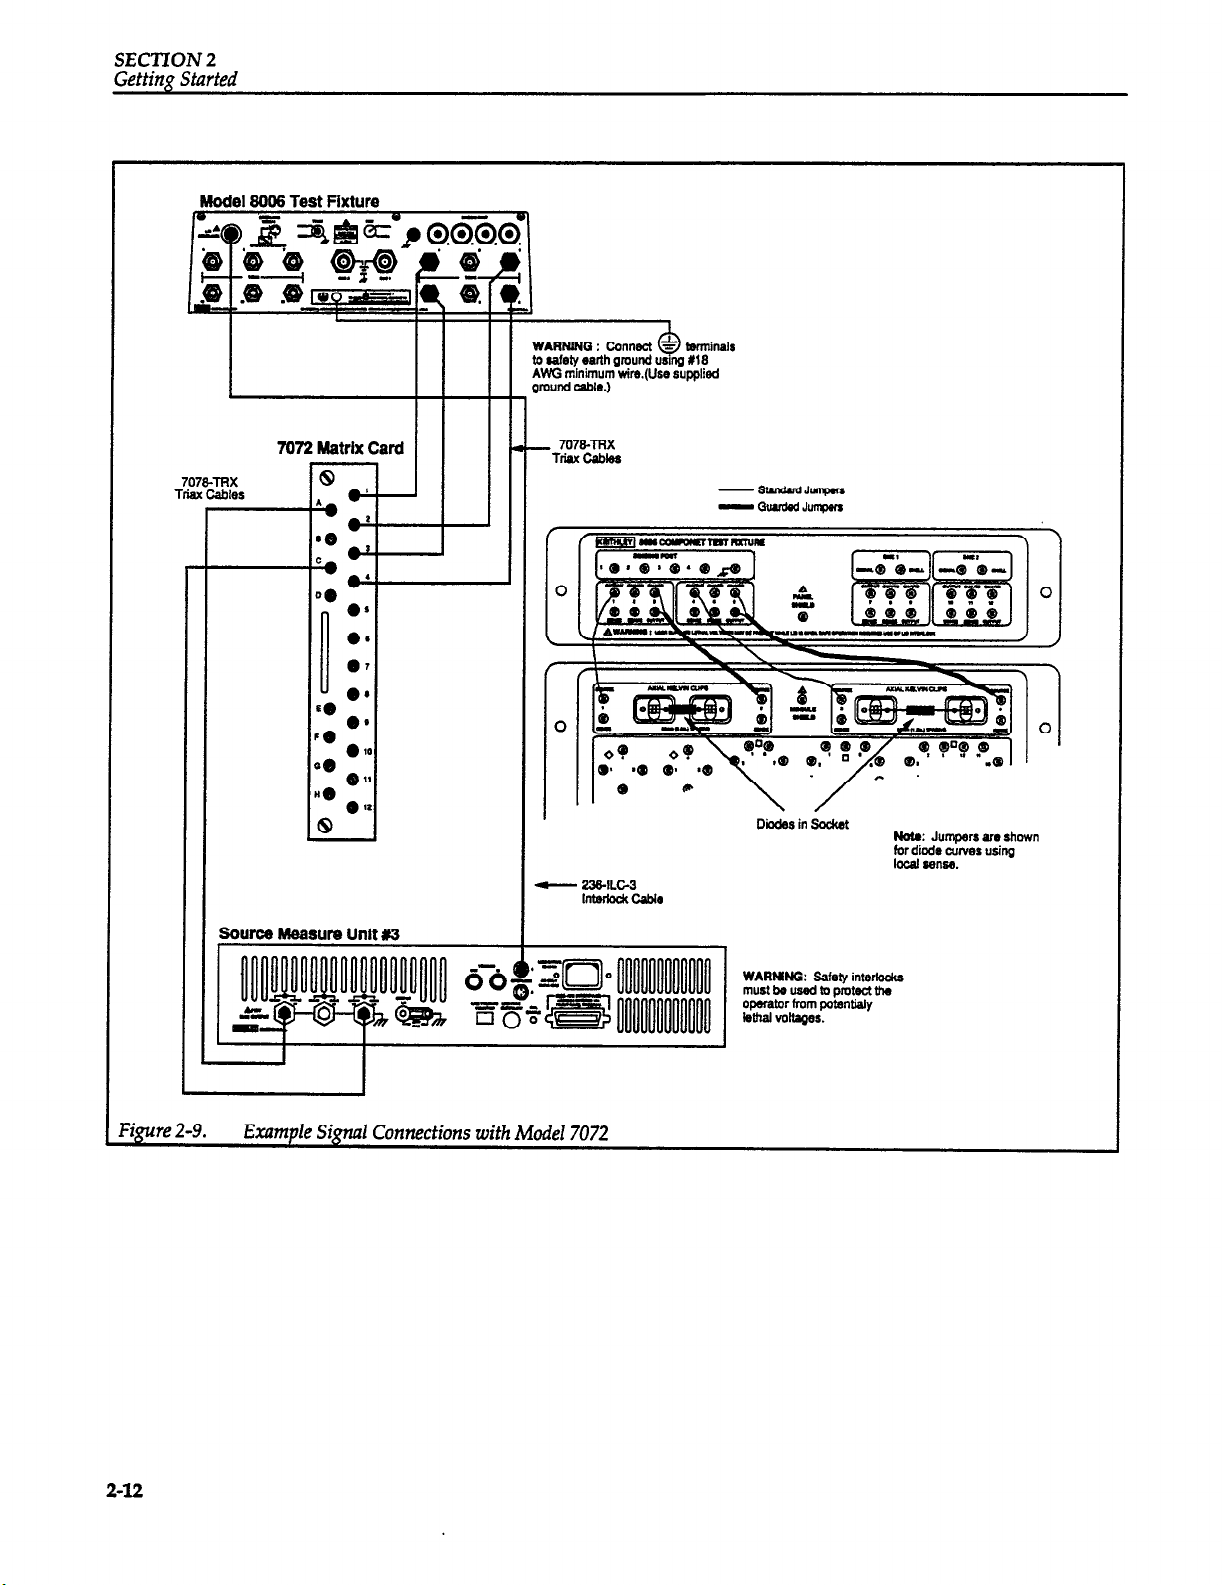
Matrix Card, see Figure 2-8 and Figure 2-9.
Page 21
SECTION 2
Getting Started
WARNING
All equipment should be turned off when
making connections.
WARNING
Safety interlocks must be
used
to protect the
operator from potentially lethal voltages
that could result in injury or death. Keithley
source measure units are designed to be used
with test fixtures that incorporate a safety interlock switch, such as the Keithley Model
8006 Test Fixture. By using the interlock, the
source measure unit cannot source current or
voltage when the lid of the test fixture is
open. Refer to paragraph 2.3 in the Model
23612371238 Operatois Manual for more information on interlock usage for the Model
8006 and custom test fixtures.
WARNING
The test fixtures must be connected to safety
earth ground using 818 AWG or larger wire.
To simplify test connections, most examples in this manual use local sensing for the source measure units. Local
sensing requires connecting only two signal cables between the source measure unit and the test fixture (OUTF’UT HI and OUTPUT LO). Also, the appropriate mpers between the test fixture signal panel and the compo-
nent test module must be installed.
To optimize accuracy, you should use remote sensing in
any of the examples (remote sensing is recommended for
optimal accuracy with currents above ImA). To use remote sensing,
connect
SENSE HI and SENSE LO to the
test fixture, and add the necessary jumpers to the DUT.
See Section 2 of the Model 236/237/238 Operator’s Man-
ual for complete details on test connections.
WARNING
With remote sensing enabled, an open sense
lead will result in lethal voltages appearing
at OUTPUT HI and, GUARD. This voltage
can cause injury
or
death, and damage external circuitry. Always make sure that the
sense leads are properly connected before
enabling remote sense. NEVER change connections with power applied. Be sure to al-
ways discharge and/or disconnect external
power sources.
2-s
Page 22

SECTION 2
A. Local Sense
source Measure Unit 1
I I
7007 IEEE468
l%tM
To IEEE438 Interfisca
of Computer
Figure 2-3.
2-6
I
Source Measure Unit
6. Remote Sense
Single Source Measure Unit Connections with Model 8006 Test Fixtures
To IEEE- Intedaa
of czoqwter
Page 23
8002A Test Fixture
1
------ 1
I-
Source Measure Unit
Not.: Setfbttunswflohfor
sounx nmasum opnraffon.
WARMNQ : Safe oaftmfbn rwuinr the use of
ctewbsafatveafthamu
.-.
_ _..__. -
700;7lE&E48Ei
SECTION 2
Getting Started
e g;;ol-488
of Computer
Figure24
Single Source Measure Unit Connections with Model 8002A Test Fixture @ma1 Sense only)
2-7
Page 24
SECTION 2
Getting Started
WARNINQ : Safetv interbxks
-SImdadJunlm
Not. : Jumpers am shown for
03mmon-emitter curves
urkg local SeXI.
+707&TRx
Figure 2-5.
Triax Cabkr
Sourca Measure Unit #2
1
t-
236-lLC-3
klmdookcabls
Transistor
Under -rest
Source Measure Unit #3
SocketPimuts: 1 -Etaso (Unit 1)
Multiple Source Measure Unit Signal and Interlock Connections - Local Sense
3 - yieco (Unit 2)
I
Notei To ptwent ground loops.
only on* some measure
unit Shou!d have the Qmund
link connect&g OUTPUT LO
to earth amund. usuallv the
unit thatsupplies pow& to
the base (or gate) of a
remiconduotor.
2-8
Page 25
SECTION 2
Gefting Sfarfed
Model 8008
23WLC-3
InterId C&k
Source Measure Unit 81
Test Fixture
terminals
common-emitter curves
I
-8MdrrdJurpwr
--Jurprr
r-z
using mmte sense.
?gure 2-6.
IL
236-lLC-3
InMock C&la
Source Measure4 Unit x3
Multiple Source Measure Unit Signal and Interlock Connections - Remote Sense
ScdwtPinout8: 1 =Base
NOW: To prevent gmurd loop.
; = h&o (Unit 2)
I
only ona souma masure
unit slwkl havcr tlw gmund
link mnneoGng OUTPUT LO
I0 earth gmund. usualy me
unk that supplii paver to
(Unit 1)
2-9
Page 26
SECTION 2
Getting Started
7051 BNC cables
r
~IIIII
II
Model 213 Quad Voltage Source
To IEEE-488
lnterfaca
\
of Computer
Modal 2361 Trigger Controller
I
Source Measure Unit
7007 IEEE-488
cables
I
I
Source Measure Unit
I
r
I !
Sourca Maasum Unlt
Notee : 1. Conneot TFttGGER OUT of source
messura unit to CHANNEL IN
of t@Qer c0ntroiler.
2 Conneot CHANNEL OUT of tr&er
controller to TRIGGER IN of
soura measure unft.
Figure 2-7.
2-10
Model 707 Switching Matrix
Multiple Unit Trigger and Bus Connections
Page 27
WARNING : Safety inbxla
must be used to pmtect
the operator fmm potenlial
lelhal voltages.
SECTlON 2
Getting Started
Source hhasure Unit Wl
I
‘707ETRx
Tliax oables
Source Measure Unit Y2
,
I
I
I
Model 213 Quad Voltaae Source
Banana Cables -
Noto : Jumpers
common-emitter curves
- StsMard Jumrws
-Gw&mtJwrpen
\ ,.
/
MOSFET
Under Test
Socket Pinouts : 1 I Drain
Note: To plwrNlt ground loops.
2=Gate
I
3 Substrate l?A’f)213)
4-soulcfl
only one sour03 measure
unit should have the ground
link connectiq OUTPUT LO
to earth gmund. usually +Jw
unit
that supplies power to
the base (or gate) of
semiconduotor.
am
shown for
using local sense.
(Unit 2)
a
Figure 2-8.
Example Signal Connections with Model 213
2-11
Page 28
SECTION 2
Getting Started
Model 8006 Test Fixture
terminals
X18
lyaied
707BTAX
Trlax Cables
II
Source
I I,
@ .’
A
Measure Unit #3
c- z3wLc-3
lntedookceblr
I
!
--JIMQMIX
-auudedJ~mpm
I
Noto: Jumpers am shown
fXd$b3~NBS USit-kJ
!?gure 2-9.
2-12
Example Signal Connections with Model 7072
Page 29

SECTION 2
Gettim Started
2.3 SYSTEM POWER-UP
2.3.1
The Model 236/237/238 Source Measure Units are de-
signed to operate from 105-125V or 210~250V line power
ranges. A special transformer may be instaIled (at the factory) for 90-1lOV and 195~235V ranges. A slide switch on
the rear panel indicates the present operating voltage. If
the line voltage needs to be changed, refer to the Model
236/237/23S Operator’s Manual.
Both the Model 2361 Trigger Controller and Model 213
Quad Voltage Source operate from 90-125V or 180-250V
line power ranges. The present operating voltage is indicated on the rear panel. If the line voltage needs to be
changed, a slide switch is located inside the unit (refer to
Appendix B or the appropriate instruction manual).
The Model 707 Switching Matrix operates from 105125V
or 210-250V line power ranges. It can be rewired at the
factory for the 90-1lOV and 180-220V ranges. A slide
switch on rear panel indicates the selected line voltage.
To change the selection, refer to the Model 707 Switching
Matrix Instruction Manual.
Instrument Power Requirements
WARNING
As a safety precaution, it is recommended
that all instruments in a rack be connected to
a single power outlet strip. The strip should
be wired to a panel-mounted emergency
stop switch within easy access of the user. A
red push-pull mushroom switch should be
mounted to the top front of the instrument
rack. The switch must be UL recognized and
have sufficient break current capacity for the
load. To specify the break current of the
switch, add up the total VA of the rack instruments and divide by the line voltage.
Multiply the total by 125% to yield the minimum break current specification for an inductive load.
2.3.3 Environmental Conditions
For maximum accuracy, all measuring instruments and
the test fixture must be operated at an ambient temperature between 18 and 28°C at a relative humidity less than
70%. (See specifications in Models 236/237/238 Operatofs Manual.)
2.3.4
Warm-up Period
CAUTION
Do not attempt to operate an instrument on a
supply voltage outside the allowed range, or
instrument damage may occur.
2.3.2
Each instrument should be connected to a grounded AC
outlet using the supplied AC power cord or the equivalent.
Power Connections
WARNING
Each instrument must be connected to a
grounded outlet to ensure protection from
electric shock Failure to use a grounded outlet and a 3-wire power cord may result in personal injury or death because of electric
shock.
The system can be used immediately when all instru-
ments are
tem accuracy, all instruments should be turned on and allowed to warm up for at least one hour before use.
2.3.5
Follow the general procedure below to power up a Model
251 I-V Test system:
1. Connect the instruments together as outlined in
2 Examine the rear panel DIP switches on the Model
3. Turn on each instrument by pressing in its power
first turned on, however, to achieve rated sys-
Power-up Procedure
paragraph 2.2.3.
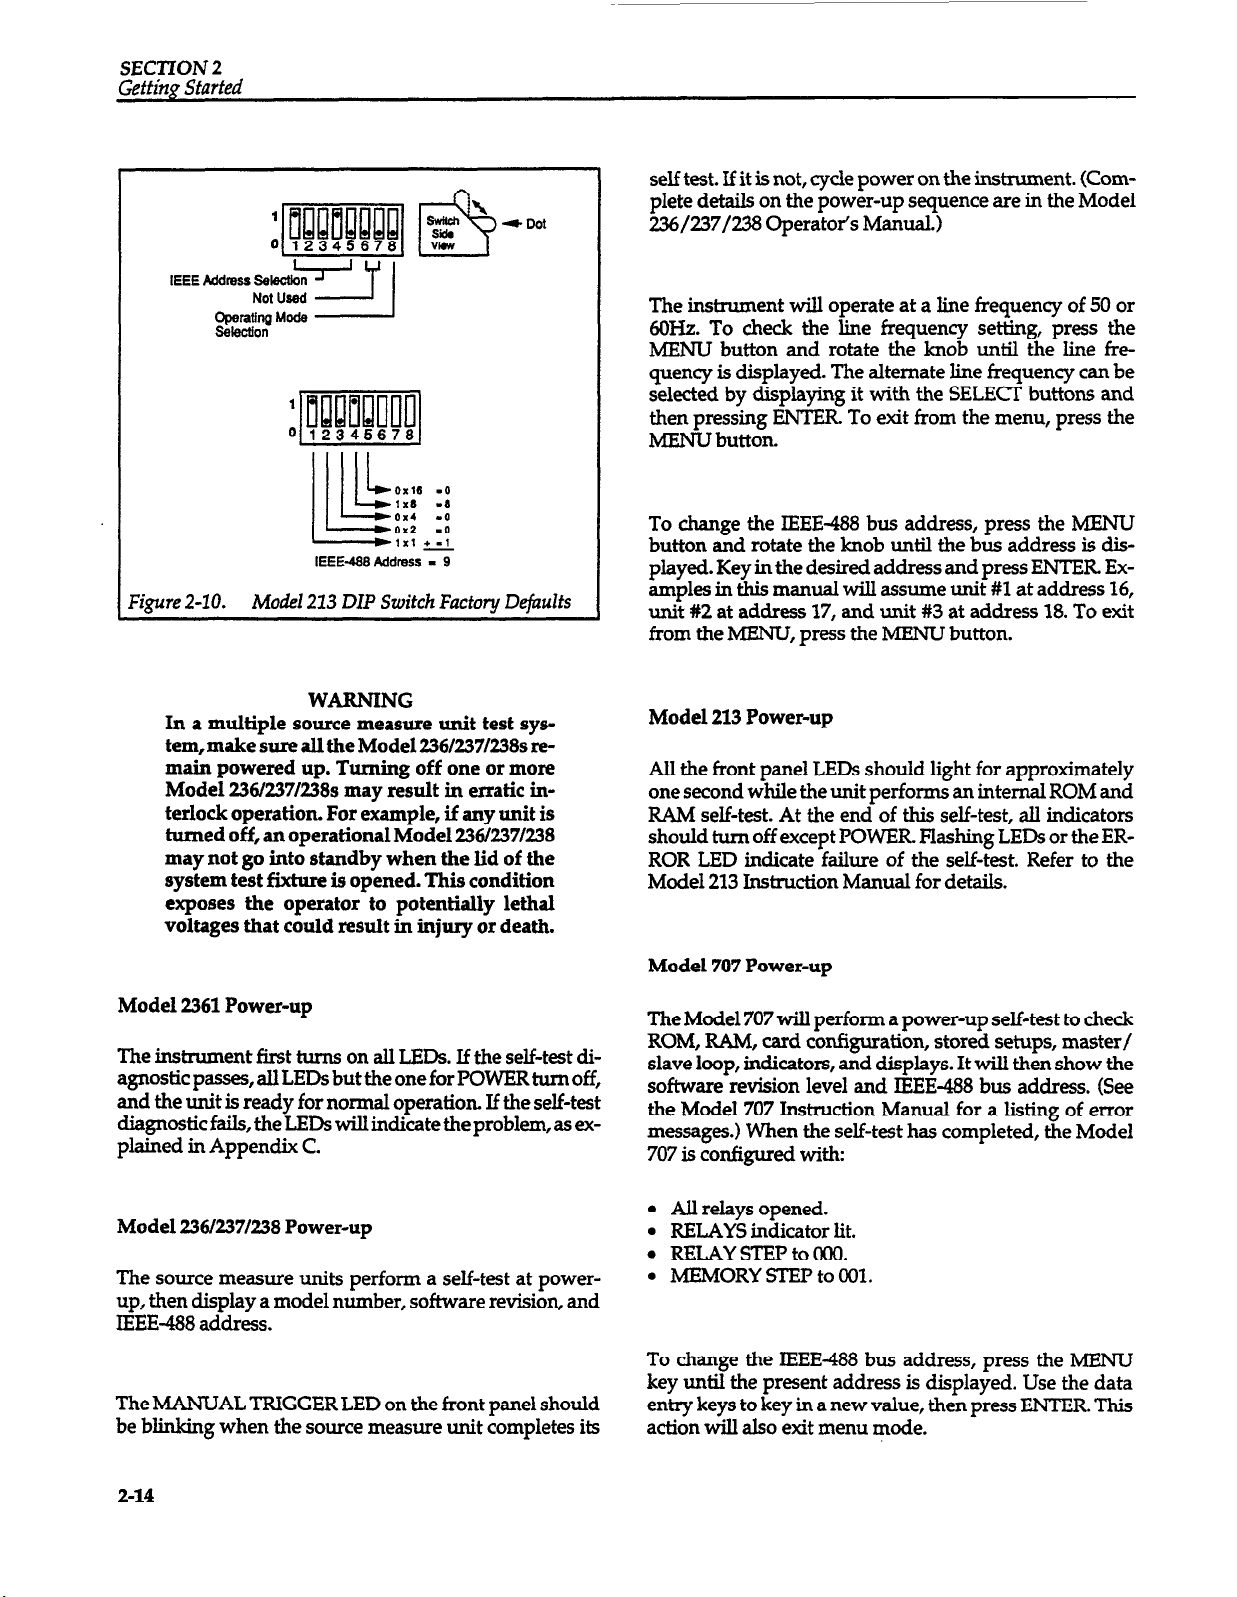
2361 and Model 213. Set switches to desired
IEEE-488 bus addresses. The factory default setting
(15) of the Model 2361 is shown in Figure 2-2. The default setting (9) of the Model 213 is shown in
Figure 2-10.
switch. Verify that each instrument goes through its
normal power-up routine, as described below.
2-13
Page 30
SECTION 2
Geffing Sfarfed
OX16
-0
1x0 -6
0x4 -0
0x2 -0
IX1 + -1
IEEEJ89Address I 9
i
Figure 2-10. Model 213 DIP Switch Facto y Defaults
-
self test. If it is not, cycle power on the instrument. (Complete details on the power-up sequence are in the Model
236/237/238 Operator’s Manual.)
The instrument will operate at a line frequency of 50 or
6OHz. To check the line frequency setting, press the
MENU button and rotate the knob until the line frequency is displayed. The alternate line frequency can be
selected by displaying it with the SELECT buttons and
then pressing ENTER. To exit from the menu, press the
MENU button.
To change the IEEE-438 bus address, press the MENU
button and rotate the knob until the bus address is displayed. Key in the desired address and press ENTER. Examples in this manual will assume unit #l at address 16,
unit #2 at address 17, and unit #3 at address 18. To exit
from the MENU, press the MENU button.
WARNING
In a multiple source measure unit test system, make sure all the Model 236/237/23t3s remain powered up. Turning off one or more
Model 236l237I2389 may result in erratic in-
terlock operation. For example, if any unit is
turned off, an operational Model 236/237/238
may not go into standby when the lid of the
system test fixture is opened. This condition
exposes the operator to potentially lethal
voltages that could result in injury or death.
Model 2361 Power-up
The instrument first turns on all LEDs. If the self-test di-
agnostic passes, all LEDs but the one for ROWER turn off,
and the unit is ready for normal operation. If the self-test
diagnosticfails,theLEDswillindicatetheproblem,asexplained in Appendix C.
Model 236/237/238 Power-up
The source measure units perform a self-test at powerup, then display a model number, software revision, and
IEEE-488 address.
Model 213 Power-up
All the front panel LEDs should light for approximately
one second while the unit performs an internal ROM and
RAM self-test. At the end of this self-test, all indicators
should turn off except POWER Flashing LEDs or the ERROR LED indicate failure of the self-test. Refer to the
Model 213 Instruction Manual for details.
Model 707 Power-up
The Model 707 will perform a power-up self-test to check
ROM, RAM, card configuration, stored setups, master/
slave loop, indicators, and displays. It will then show the
software revision level and IEEE-488 bus address. (See
the Model 707 Instruction Manual for a listing of error
messages.) When the self-test has completed, the Model
707 is configured with:
l
All relays opened.
l
RELAYS indicator lit.
l
RELAYsTErtoOoo.
. MEMORYSTEl’toOOl.
The MANUAL TRIGGER LED on the front panel should
be blinking when the source measure unit completes its
2-14
To change the IEEE-488 bus address, press the MENU
key until the present address is displayed. Use the data
entry keys to key in a new value, then press ENTER. This
action will also exit menu mode.
Page 31

SECTION 2
Gettina Started
2.4 COMPUTER HARDWARE AND
SOFTWARE INSTALLATION
2.4.1 IEEE-488 Interface Card
Installation
Model 251 software can be used with the IEEE-488 interfaces listed in Table 2-2.
Note the configuration settings of your IEEE-488 inter-
face card (also referred to as a GPIB card). If necessary,
see the documentation supplied with the interface card
for interpretation of the switch and jumper settings. Depending-on the pa&~& card, you &-iII be
Table 2-2.
IEEE-488 Boards and Default Configurations
Board Name
Advantech PCL-748
B&CPC488A
BBS GPIB-1000
Capital Equipment PC0488
Capital Equipment PSo488
Capital Equipment 4 x 488
Contect GPIB (PC)
Hewlett-Packard HPIB
IBM GPIB board
ICS48WCl
IOtech GP488
IOtech GP488/2
Keithky PC-488-CEC
Keithky4-488-CEC-OM~ 4-4&3S-CEC-1M
Keithky PS488-CEC
MetraByte IE-488
National Instruments AT-GPIB
National
National
National
National
National
Instruments GPIB-PC
Instruments GPIB-PCII
Instruments GPIB-PCIIA
Instruments GPIB-PCIII
Instruments MC-GPIB
Qua Tech MXI-100
;2ua Tech MXI-1000
Scientific Solutions IBEE 488 LM
Scientific Solutions MC-IEEE 488
Ziatech ZT 1444
Ziatech ZT/2
NA = feature not available on this board
NC = not configured from factory
prom&-d
for kaIIation procedures.
these parameters when Model 251 software is configured
for an IEEE-&38 card
l
I/O port address
l
Memory address
0 System controkr setting
l
Interrupt Iine number
l
Interrupt level
After noting the card configuration, install it in the computer. See the interface card documentation for detaiIed
1
Fault SC
IRQ #
ing;
DMA#
1
cwo&fEM)
2El
390
2B8
2B8
2B8
rzhMEA4
2El
coooMEM)
2El
SE
2B8
2B8
300
2co
2B8
2B8
2El
280
EOO
318
200
2El
2B8
210
800
E
NC
NC
3
NC
7
5
k
NC
is
NC
3
5
11
7
7
7
7
3
z
7
5
GE
LC
NA
1
1
1
1
2
1
kJC
4
1
1
1
:
1
1
1
Ii
3
3
1
0
NC
1
NU’E~yMii5YCliGneI boards can use multiple DMA channels. Non&iicro Channel boards
must use DMA channel number 1 except for the Hewlett-Packard board which uses DMA channel 2. Also note that the Ziatech ZT/2 board cannot use DMA channels 4-7.
2-15
Page 32

SECTION 2
Getting Started
2.4.2
Model 251 I-V Test so&are is copy protected. To run
Model 251 software, you must install the copy protection
block that was shipped with the software. The copy pro-
tection block attaches to any parallel port on the back of
your computer. Figure 2-l 1 shows a block installed on a
computer.
To install the copy protection block, first remove from the
parallel port any device cable, such as a printer cable, if
one is currently attached. Then insert the block into the
port and reattach the device cable. The block will not interfere with the performance of the device attached to the
parallel port. Note that a device does not need to be connected to the block in order to run Model 251 software.
2.4.3
before instalhng Model 251 software on your hard disk,
make backup copies of each of the distribution floppy
disks.Todoso,bootupDOS,thenusetheDOScommand
Copy Protection Block
Software Backup
DISKCOPY, which automaticahy formats blank disks.
(Remember that the DISKCOPY comman
the current directory or path.) For systems with two
floppy disks, the
DISKCOPY A: 8: cEnten
Follow the prompts on the screen to complete copying of
all supplied disks.
Similarly, the comman d for systems with one floppy disk
is:
DISKCOPY A: A: <Enter>
Again, follow the prompts on the screen to copy all supplied disks.
After copying, put the original disks away for safekeeping.
co mmand syntax is:
dfilemustbein
Figure 2-11. Copy Protection Block
1
2-16
Page 33

2.4.4 Software Installation and Configuration
Model 251 software is installed on a hard disk drive by
the program called INSTALL, which is supplied on the
distribution floppy disks. This program creates subdirectories and copies files for initial installation. It may also be
used to reconfigure the software after a change in the
computer configuration (see paragraph 2.4.5). Follow the
procedure below in the order presented to install the software. Press &so at any time to abort installation.
1.
Place the backup copy of the Model 251 Installation
Disk in drive A and enter the following
A: <Enter>
TYPE READMEDOC <Enter>
This file explains the latest changes and how experienced DOS users can install the software without
reading the following instructions.
2.
Type in:
INSTALL &ten
The title screen of the INSIALL program is dis-
played.
SECTION 2
Getting Started
You are then prompted to choose a target hard disk
4.
drive for Model 251 software. The listed options depend on what is available on your computer. The IN-
STALL program will display an error message if the
selected drive does not have at least 3M-bytes of free
disk space.
The next series of questions asks you to select directories for the Model 251 software. The default names
for the root directory and three subdirectories are:
\MODEL251
\MODEIl\DATA
\MODEL251\TESTS
\MODEL251 \CONFIG
(for data files)
(for test setup files)
(for instrument configura-
tion files)
\MODEL251\707
WODEL251 \SEQ
6,
You are then prompted for your computer’s graph-
(for Model 707 files)
(for test sequencer files)
ics adapter type:
EGA or VGA
7.
You are next prompted to select an IEEE-488 (GPIB)
interface card from a displayed list. The INSTALL
procedure will copy the necessary IEEE-488 driver.
The card parameters (I/O port address, memory address, etc.) are not entered until Model 251 software
At this time, the program checks for a minimum
computer configuration:
l
EGA or VGA graphics adapter
l
DOS version 3.2 or higher
l
Math coprocessor
0 At least 64oK-bytes RAM
If minimum requirements are not present, the IN-
STALL program will display an error message.
3.
Press <Eso to quit or any other key to continue. The
next screen asks you if this is a first-time installation
or a reconfiguration of previously installed software.
Select the first option to install Model 251 for the first
time. The second option is used when it is necessary
to reconfigure Model 251 software for different default directories, graphics adapter, IEEE-438 card,
printer, or plotter.
8.
%Grinter and plotter types are then requested. Select appropriate models, and if a plotter was chosen,
the interface type (serial or GPIB) and address.
NOTE
Printer and plotter configuration is further
discussed in paragraph 2.5.3.
After your response, the INSTALL program creates
directories and copies files as they are listed on the
computer screen.
9.
As the INSTALL program is copying files, you will
be prompted to insert Model 251 Program Disks.
When the program has completed, remove any disks
and put them away.
Unless the INSTALL procedure was aborted, you will be
returned to the drive and directory where Model 251
Software is installed.
2-17
Page 34

SECTION2
Getting Started
2.4.5
Software Reconfiguration
As part of a first-time installation, the text file
MODEL251.CFG is created by the INSTALL program to
define the selected subdirectories and computer hardware configuration. MODEL251CFG is placed in the
Model 251 root directory (default name is \MODEL251).
An example file is shown in Figure 2-12.
If any changes are made in the computer hardware, the
“Reconfigure” option of the INSTALL program must be
selected to
change the parameters of the
MODEL251.CFG file. (Although MODEL251CFG is an
Model 251 system configuration file V2.00
GPIB card not configured
C:WODEK51\DATA\
C:WODEKSl\TESTS\
C:\MODEK51\CONFIG\
C:\MODEK51\707\
C:\MODEK51\SEQ\
VGA
;P7470 GPIB 5
C:!MODEK51kONFIG\TESTLlB.CFG
Y File header
- GPIB card not configured during install
- Path for data files
- Path fortest setup files
- Path for configuration files
C--------- Path for Model 707 files
- Path for test sequencer files
- Graphics adapter
- Printer number (IBM Graphics Printer, Epson or Compatible)
- Plotter type
- Default instrument configuration file to use at power up. Set to
ASCII file, do not attempt to edit it as line and character
spacing are exact.)
Since the INSTALL program minimizes the hard disk
space required by only copying the IEEE-488 driver soft-
ware that is needed, it also may be necessary to run the
INSTALL program after changing the IEEE-488 card. As
explained in paragraph 2.5.6, the IEEE-488 card must be
configured through a menu selection. If the desired interface card is not highlighted in the list of available cards,
run the INSTALL program to select the new card before
configuring it through the menu selection.
TESTLIB.CFG during installation.
1 Fimre 2-12. Example
of
MODEL251 .CFG FiZe
2-18
Page 35

SECTION 2
Getting Sfaarfed
Operation Overview
2.5 OPERATlON OVERVIEW
2.5.1
Once the software is installed, running the program is
simply a matter of typing in the following from the
MODEL251 (or other) subdirectory:
MODEL,251 <Enter>
Runnlng the Software
KEITHLEY MODEL 251 I-V TEST SOFTh'm
v2.00
bcurve Family Test
DC Source-Measure Test
File Operations
System Configuration
Getting Started
Exit to DOS
The Model 251 software will read the MODEL2!XCFG
file to configure itself to the computer hardware selections made during installation, then, if everything checks
out, display a logo screen and then the screen shown in
Figure 2-13.
Fl-Help F4-Print
Figure 2-13. Main Menu Screen
Arrow Keys & <Enter> Select Operation
ESC-Exit Current Menu
Page 36

SECTION2
Getting
Started
Table 2-3.
Message
Cant find parallel port copy protect block -
exiting ASYST.
Not enough free DOS memory to run Model
251. Suggestion i Remove any memory resident
Model 251 Ekrors Messages on Start-up
Cause
The copy protect block is missing or is not securely attached to
a parallel port of the computer.
The computer must have 53OK-bytes(542,720 bytes) of free
DOS memory. See paragraph 2.5.2.
programs not necessary for operation to free up
more memory.
System does not have enough expanded memory to boot. Model 251 requires a minimum of
The computer must have lM-byte of free expanded memory.
See paragraph 2.5.3.
lM-byte of expanded memory to operate.
System tie (file name) not found. Run INSTALL
A Model 251 file is missing. You must m-install the software.
to ensure all system files are present.
None Computer must have 53OK-bytes of free DOS memory. (Com-
puter may lock up if this memory is not available; see paragraph 2.5.2.) Or, the copy protect block is missing or is not securely attached to a
parallel port
of the computer.
NOTE
The first time Model 251 software is executed,
a screen telling you that a GPIB card must be
selected is displayed before the main menu
screen. Refer to paragraph 2.5.8.
Note that the version number of the software is listed in
the title bar. Knowing the software version is useful
when discussing problems with the Applications Department at Keithley Instruments.
Possible error conditions for software start-up are listed
in Table 2-3.
2.5.2 DOS Memory Requirement
Model 251 software needs 53OK-bytes (542,720 bytes) of
free DO!3 memory to run. If you
ory to run Model 251 software, follow these guidelines:
Examine your present AUTOEXEC.BAT and CON-
1.
FlG.SYS files to determine which device drivers and
terminate and stay resident (TSR) programs are necessary. For example, a mouse driver, an IEEE488
board driver, and a LIM expanded memory driver
must free
up more mem-
are probably necessary. A network driver or a batch
file for a DOS shell are probably not necessary.
2. Copy your present AUTOEXEC.BAT and CONFIGSYS files to make backups:
COPY AUTOEXEC.BAT AUTOEXEC.SAV
COPY CONFIG.SYS CONFIG.SAV
3.
Create an AUTOEXEC.251 and a CONFIG. in
your root directory to run Model 251 software, including any lines determined necessary in Step 1 and
the following suggested lines:
AUTOEXEC.251
COl’.JFIG.251
4.
Create batch files to switch back and forth between
echo Model 251 Boot Up
buffers = 20
files=20
boot up configurations:
M251.BAT
copy autoexec.251 autoexecbat
copy config. config.sys
MINE.BAT
copy autoexec.sav autoexecbat
copy config.sav config.sys
5. To configure the computer to run Model 251 software enter the following command:
M251
2-20
Page 37

SECTTON 2
Getting Started
This batch file copies the AUTOEXEC and CONF’IG
files you just created with a 251 extension to ones
that will be read on boot up.
6. Reboot the computer.
7. Enter the following from the MODEL251 subdirectory to start Model 251 software:
MODEL251 <Enter>
To configure the computer with your original
AUTOEXEC and CONHG files, follow this procedure:
1. Return to the root directory of your computer’s boot
up drive and type in
MINE’
This batch file copies your original AUTOEXEC and
CONPIG files to ones that will be read on boot up.
2. Reboot the computer.
2.5.4
Setting Up Printers and Plotters
Mode1251 software supports only the peripheral devices
and communications ports shown in Table 24.
Table 2-4. Supported Configurations for
Peripheral Devices
Printer
None
None
None
Parallel
Parallel
Parallel
serial
Plotter
None
serial
IEEE-488
None
Serial
IEEE-488
None
serial IEEE-488
Paral.lel printers and IEEE-488 plotters are completely
configured during the INSTALL program. Serial printers
and plotters need additional configuration.
2.5.3 Expanded Memory Requirement
Model 251 software is compatible with L&us/Intel/
Microsoft (LIM) Expanded Memory, versions 3.2 and 4.0.
Model 251 needs lM-byte of free expanded memory to
run. There are numerous combinations of hardware and
software to attain this requirement. Among them are:
0 DOS 4.0
l
Add-in memory boards offer LIM support in hardware or software.
l
Computers purchased with 2M-byte RAM often include a utility program to convert extended memory
to LIM expanded memory. A free utility for this pur-
pose is available from many computer bulletin boards.
l
Commercially available memory management utilities include QEMM-386 (Quarterback Office Systems)
for 386-based computers.
contains built-in LIM 4.0 support.
After installing or reconfiguring Model 251 software for
serial output devices, it is necessary to properly configure a serial port for the device and, in the case of printers,
to redirect output from a parallel port to a serial port. This
is accomplished by using the DOS MODE command in
your AUTOEXEC2Sl Sle.
Example 1. Connecting an HP 7470A plotter with a
serial interface.
Your AUTOEXEC file will need a MODE command to
configure the baud rate, parity, data bits, and stop bits of
serial port COMl. Assuming 2400 baud, no parity, 8 data
bits, and 1 stop bit, the MODE command in your
AUTOEXEC file would be one of the following:
mode coml: 2400, n, 8,1, p
mode coml: 2400, n, 8,1, b
(for DOS version 3.3)
(for DOS version 4.0)
2-21
Page 38

SECTION 2
Getfing Started
Example 2 Connecting an Epson compatible printer
with a serial interface.
Your ATJTOEXEC file will need two MODE commands,
the first to configure serial port COMl, and the second to
redirect printer output from parallel port LPTl to serial
port COMl. Assuming 2400 baud, no parity, 8 data bits,
and 1 stop bit, the MODE
fol.lowingpairS
mode coml: 2400, n, 8,1, p
mode lptl: = coml:
mode coml: 2400, n, 8,1, b
mode lptl: = coml:
The exact format of the MODE commands should be
verified by referring to your DO8 Reference Manual.
comman d would be one of the
(for DOS version 3.3)
(for DO8 version 4.0)
2.55 Main Menu Options
When the software is started, the cursor defaults to the
first menu item, Curve Family Test. To move the cursor
through a menu, use the up and down arrow keys. To select an operation, use the <Enter> key. For some operations, a submenu pops up; the up/down arrows and
<Enten keys function the same way in a submenu. To return to the main menu from one of its submenus or forms,
use the <Eso key to close the submenu or form and return to the previous screen.
Hot keys are also present, where a single keypress will se-
lect a menu item. At each menu level, the first letter of an
item is treated as a hot key.
Model 251 software supports the Microsoft mouse and
the Logitech mouse. The button assignments depend on
the mouse driver software, but are commonly the following:
Left Button Right Button
cEnten <Escape>
Figure 2-14 shows the hierarchy of functions accessed by
main menu options, in&ding submenus and forms.
For a 3-button mouse, the middle button can be assigned
to the <Fl> key for accessing Model 251 help screens.
2-22
Page 39

SECTION 2
Getfing Started
Main Menu Submenu Level 1
CUIW Family Test
DC Source-Measure Test
Fib operations
System Configuration
Getting stalled
Exit to DOS
W Curve Family Test
c DC &ma _ Measure Test
- FibOperatlons -
- Load File
-
Save File
Rename Fib
Delete !=ib
Define lnSttumentS
Select GPIS Card
System Configuration
Submenu Level 2
=-Load Rle
Data File
Test Setup File
Instrument Configuration
707 Fib
Lotus Import
Instrument Configuration
Pile to Load
Rle to Rename
Define instruments
GPIS ConfIguration
i
F&we 2-14.
Main Menu Options
An explanation of each item on the main menu follows:
l
Curve Family Test - This selection sets the parameters of up to three source measure units for a curve
family test. This can be either a single sweep (e.g., diode I-V curve), a subordinate sweep (e.g., common
emitter curves), or a synchronous sweep (e.g., Gumme1 plot). Also, up to three additional source measure
units can be configured as measuring or non- measuring bias channels.
l
DC Source-Measure Test - This menu selection configures up to six source measure units as dc voltage or
current sources. Optionally, each channel can meas-
ure.
Model 251 Help Utility
l
File Operations - File operations include loading and
saving data files, test setup files, instrument configuration files, 707 files, sequencer files (load only), and
data import/export files WCII or Lotus WKl formats). The location and contents of these files are
shown in Table 2-5.
l
System Configuration -
This selection is used to configure Model 251 software to the hardware: the source
measure units, the trigger controller, and the IEEE-488
interface card.
l
Getting Started -This selection takes you to a topic in
the Help file that lists the steps required for running an
example curve family test.
* ExittoDos - This selection returns you to the DOS
command line after prompting you to save data and
parameters.
2-23
Page 40

SECTlON2
Getting Started
Table 2-5. Load and Save File Types
File TyPe
Data
Test Setup
Instrument Configuration
707
uencer \MODEL251\SEQ\*.SEQ
seq
Data in ASCII File Format
Data in Lotus Fiie Format
Default Path and File Extension Contents
\MODEL251 \DATA\+.DAT GPIEl I/O parameters, test parameters, display
\MODEL251 \TESTS\*.TST GPIB I/O parameters, test parameters, display
\MODEL251\CONFIG\*.CFG
\MODEL251\707\*.707
\MODEL251 \DATA\*.ASC Data, array names, and units.
\MODEL251 \DATA\*.WKl Data, array names, and units.
2.5.6 Using Function Keys
In addition to the screens showing pop-up submenus
and forms accessed by main menu selections, other
screens are accessed by using the function keys. Each
screen lists the available function keys on the bottom line.
(See Table 2-6.) The screens accessed by the function keys
are summarized below:
. Help-Pressing the <Fl> key brings up a context sen-
sitive help screen. Pressing <Fl> again or the <Enter>
key displays an index of help topics. Pressing &so
returns you to the current screen.
* Goto Point-When the VIEW LIST form is displayed,
the <F2> key brings up a pop-up form called Goto
Specified Point You can enter a curve number and an
index into the curve array.
l
Plot
-The 6;3> key plots a hardcopy of the graphical
representation of the data on a plotter.
* Print-The cF4> key prints a hardcopy of the current
screen to a printer.
parameters, data.
parameters.
Source measure unit, trigger controller, quad voltage source, and switching matrix parameters.
Matrix setup.
Commands to run a series of tests.
l
GMB -The GENERAL GPIB OUTPUT form is used
to send device dependent commands to bus instruments, usually those not directly supported by Model
251 software.
l
Disp.Param -The <F7> key brings up the display parameters form where you can set the parameters for
displaying source and measure data arrays and calculated arrays.
0 View
-If data arrays were previously specified on the
display parameters form, the <F8> key shows a list or
graphical representation of the data. A menu of
graphical analysis tools is also available on this screen.
l
Execute
- The cFlO> key initiates test execution,
either a curve family of a dc source measure test. From
the GENERAL GPIB OUTPUT form, the cFlO> key initiates device dependent command execution
highlighting the desired function).
l
Delete - When the DEFINE INSTRUMENTS form is
displayed, the <Del> key will remove the definition of
the instrument at the present cursor position after
prompting you for confirmation.
l Exit
- The &so key returns you to the previous
screen.
(after
2-24
Page 41

Table 2-6. Available Function Keys
unction Ke s Available
-h
SECTION2
Getting Started
Main Menu
Curve Family Test Form
DC Source-Measure Test Form
Define Instruments Form
General GPIB Output Form
Display Parameters Form
View Grauhics
View List&
l
<F2> is LoadFiIe and <F%is SaveFile from these forms only.
2.57
How to Get Help
x
X
X
X
X
X
X
X
*
*
X
Model 251 I-V Test software contains a context sensitive
help function. It is accessed from any text screen by pressing the &l> key. The first help topic displayed is specific
to the menu or form where help was requested. The up/
down arrow keys scroll the display. <PgUp> and
cpgDn> scroll through the help file to present related
topics.
MODEL251 HELP UTILITY V1.23K
X
X
X
:: ::
:: ::
X
X ::
X X
X
X X
:: X
X
The <Enter> or cFl> keys display an index of help topics.
(See Figure 2-15.) Use the arrow keys to move around the
index, then press <EnteD or <Fl> to select the topic. One
of the topics is Help: Usage of Keys. It explains what keys
are active for the help index and help topic screens.
Use the <Escape> key to exit help. You are returned to the
menu or form screen where you requested help.
TOPIC - HELP INDEX
707 Matrix
Curve Family Global Set
DC Source-Measure Chann
Define Instruments
File Operations
GPIB Configuration
Xeithley Instruments
Pulsed-mode Error
Sync Sweep Channel
Time Arrays
ENTER/Fl=Select Topic
Figure 2-15.
Help Index Screen
Bias Channel
Curve Family Test
DC Source-Measure Globa
Display DC Parameters
File Operations Menu
GPIB I/O
Load/Save Menu
Step Channel
System Configuration
View Graphics
ARROW
XEYS=Move Pointer
Curve Family Channels
Data Arrays
DC Source-Measure Test
Display Parameters
Getting Started
Help: Usage of keys
Hain Menu
Sweep Channel
Test Sequencer
View List
ESC=Exit Help
2-2s
Page 42

SECTION 2
Get&n Sfarted
2.58
Configuring the IEEE-488 Card
During the lNSTALL procedure, you selected an
IEEE-488 (GPIB) driver overlay for your interface card.
Before nmning any tests, Model 2X software must be
configured with the hardware specific information of
that IEEE-488 card. Follow this procedure:
1. From the main menu of Model 251 software, select
the System Configuration option.
2. From the System Configuration pop-up, choose Select GPIB Card. After an opening screen explaining
how to get help, you will see the GPIB Configuration
form, an example of which is shown in Figure 2-16.
3. You will be asked:
Which bus do you want to contigure? (0,1,2,or3):
Always respond with: 0
Model 251 software must be configured to bus 0.
4. The next screen displays a list of supported IEEE-488
cards. Use the <PgUp> and <PgDn> keys to see the
complete list. Your IEEE-488 card should be highlighted in the list. (If it is not, the INSTALL program
must be run again; this time choose the Reconfigure
option.)
Enter the appropriate number for your card.
NOTE
If you have a CEC 4 x 488, Keithley
PC-488-CEC, Keithley 4488-CEC-OM, or
Keithley 4-48&CEC-1M card, select the CEC
l?Cc488 from the list. If you have a Keithley
PS-488-CEC, choose the CEC PCo488.
5. You will be asked:
Enter primary address for ME:
Always respond with: 0
6. The next prompt depends on which card type you
have. For NEC type cards, enter the hexadecimal
I/O address. For Hewlett Packard cards, enter the
hexadecimal memory segment address. Responses
depend on how the card jumpers and switches are
configured, which should have been noted in paragraph 2.4.1. Also, refer to Table 2-2 for factory default settings.
7. The next question is:
Is the board the system controller? (Y/N):
Always respond with: Y
Figure 2-16.
Current conFiguratronron:
board
:
: uncontigured
: unconfiqurad
: uncontigured
Which
bus
Capital
type
(NEC
~PD7210
do you vent to configure? (0,1,2,or 3):
GPIB Cunfigwutiun Form Screen
GPIB Configuration
Mel)
Prom Lsc
to
quit
2-26
Page 43

SECTION 2
Getting Started
8. The next prompt is:
Enter interrupt line# used by board (2-7):
Resuond with an unused interrupt line after refer-
ring to Table 2-7. Your choice mu& match that chosen by jumpers or switches on the IEEE-488 card.
NOTE
The Hewlett Packard card only allows inter-
rupt lines 3-6 to be used.
9. If needed for your card, you are prompted with:
Enter interrupt level (O-7):
Respond with a number that is not used by any other
*
board in your computer. Normally, the same value
as the interrupt line number will work.
10. The last prompt is:
Configure another board? (Y/N)
Model 251 software can only be configured for one
board.
If you think you made a wrong entry to one of the
previous prompts, enter a “Y” here to go through the
configuration again. Enter ‘W if you are satisfied
with your configuration. You will be returned to the
main menu of Model 251 software.
Table 2-7. Typical interrupt Line Assignments
Interrupt
(IRQ)
Line Number
2
Description
Access to interrupts
8-15
Serial port 2
Serial port 1
Parallel port 2
Floppy disk
2.5.9
Parallel
Configuring the Instruments
port
1
Before running any tests, the Model 251 software has to
be configured for the bus instruments (source measure
units, trigger controller, and other instruments). The DEFmEINsTR~
form is accessed through a main
menu item as described in the following procedure:
1. Select System Configuration from the main menu.
2. Select Define Instruments from the SYSTEM CONFIGURATION pop-up submenu. The DEFINE INSTRUMENTS form will be displayed. Figure 2-17
shows a completed form.
Figure 2-27.
I------- DEFINE INSTRUHENTS 11
Trigger Controller Address: 15
BASE
EMITTFIR
COLLECTR
DRAIN
GATE
SOURCE
DIODE
RESISTOR
Fl-Help F4-Print Del-Delete Instrument Esc-Configuration Menu
17 K1236
16 1
16
I I
16 K1236 1
17 K1236 2
17
16 K1236 1
16 K1236 1
K1236
ICI236
K1236
1
2
I
/I
2
Define Instruments Form Screen
2-27
Page 44

SECTION2
Getting Started
The cursor first appears in the Instrument Name
field. Type in a name (up to 8 characters) for the unit.
The name will be used on the test setup form to identify the instrument on each channel.
FESS <Enter>. The cursor advances to the GPlJ3 Ad-
4.
dress field. Type in the address for the unit. (Refer to
paragraph 2.3.5 if the source measure unit address is
unknown.)
The address may be set to any value between 1 and
30 as long as address conflicts with other instruments are avoided.
FESS <Enter>. The cursor goes to the Instrument
field. Press <Enter> again. A pop-up menu appears
listing possible choices. Use the up/down arrow
keys and the <Enter> key to select the instrument
type-
6.
Use the right arrow key to advance to the Trigger
Channel field. Type in the trigger channel assignment for the source measure unit and press <Enter>.
7.
Repeat steps 3 through 6 for remaining bus instruments. Recall that only source measure units are assigned to trigger channels.
8.
Use the up arrow key to go to the Trigger Controller
address field. Type in the address selected by the
rear panel DIP switch (see Figure 2-2) on the trigger
controller and press <Enten.
9.
Press &so. You will be prompted with:
Initialize instrument table (Y/N) ?
If the IEEE-488 card is connected to the bus cable,
and all instruments are on, press <Y>, otherwise
press cl+. The screen will display:
4. At the File to Save prompt, type in a file name to complete the path. Optionally, use a CFG file extension,
such as:
\SAMPLE.CFG
5. Press <Enter>. You will be prompted when the file
has been saved. Press any key to return to the main
menu screen.
The name of the instrument configuration file will be
stored in the MODEL25LCFG file. When Model 251 soft-
ware is next started, it will load that instrument configu-
ration as a default.
2.6 SYSTEM CHECKOUT
There are two modes of operation with Model 2.51 software: the interactive mode and the test sequencer mode.
All examples use the interactive mode, unless otherwise
specified. The test sequencer is described in Section 6.
There are four steps involved when interactively running
an I-V test with Model 251 software:
1.
Defining the instrument parameters, test parameters, and display parameters.
2.
Executing the test.
3.
Printing or plotting the results.
4.
Saving the instrument parameters, test parameters,
display parameters, and test data.
Performing instrument initialization
Model 251 software will send a device dependent
command to each source measure unit restoring it to
factory default conditions. You will be prompted if
any error or warning conditions exist.
10.
After initialization has finished, pressing any key returns you to the main menu.
It is recommended that you save the present instrument
configuration in a file stored in the CONFIG subdirectory. This procedure follows:
1. Select File Operations from the main menu.
2. Select Save File from the pop-up submenu.
3. Select Instrument Configuration from the pop-up
submenu.
2-28
The following examples will lead you through step-bystep procedures. The examples will also check out Model
251 software to determine if the system is operational, to
show that all instruments and the software are functioning normally.
2.6.1
The two examples given here will run I-V curves on a diode and a transistor. The first example explains in detail
the hierarchical structure of the menus and forms; the
second will assume familiarity with the structure.
Example Xl -This example outlines a test procedure for
diode forward biased I-V characteristics. It is based on
the test library called DIODELIN for a IN914 diode (see
Appendix Dl. Connect a source measure unit to a diode
as shown in the schematic of Figure 2-18.
Running Simple Tests
Page 45

SECTION 2
Getfing Sfarfed
ID-)
Source Measure
17
Figure Z-18. Schematic for Diode Forward Biased
DEFINE
Select File Operations from the main menu.
1.
Select Load File from the FILE OPERATIONS submenu.
2. Select Instrument Configuration from the LOAD
FILE submenu.
A. Press <Enter> when prompted for “FILE TO
LOAD”.
B. Select TESTLIB.CFG from the listing of the CON-
FIG subdirectory.
C. Hit any key after the file has been loaded.
3. Select Test Setup File from the LOAD FILE submenu.
A. Press <Enter> when prompted for “FILE TO
LOAD”.
B. Select DIODELIN.TST from the listing of the
TESTS subdirectory.
C. Hit any key after the file has been loaded.
D. Press &so twice to return to the main menu
Select System Configuration from the main menu.
r-v Chnwrr+a;c+;m
-I-.-LL, I.TL.C.2
2. Press 4?7> for DispParam (DISPLAY PARAMETERS form).
3. Modify the DISPLAY PAIUMETERS form to match
your test parameters.
EXECUTE
1. Press cFlO> for Execute test.
2.
Compare test results with the curve shown in
Figure 2-19.
PRINT
1. Press -54~ to Print (or cF3> to Plot) the curve, if desired.
2. Press <Eso twice to return to the main menu.
SAVE
Select File Operations from the main menu.
The instrument parameters, test parameters, display parameters, and test data are optionally saved in three files:
0 An instrument configuration file contains instrument
parameters.
* A test setup file contains test and display parameters.
l
A data file contains test and display parameters and
data.
NOTE
Data can also be saved in an export file in
either ASCII or Lotus WKl format.
1.
Select Define Instruments from the SYSTEM CONFIGURATION submenu.
2. Modify the DEFOE INSTRUMENTS form, if
needed, to match your setup. (No trigger controller
is needed for a single unit setup.)
A. Press &so to exit the form.
B. Press <Y> to initialize the instrument table.
C. Hit any key at the “SMU Initialization Finished”
prompt.
D. Press <Eso to return to the main menu.
Select Curve Family Test from the main menu.
1.
Modify the CURVE FAMILY TEST parameters form,
if needed, to match your source measure unit and
diode characteristics.
1. Select Save File from the FILE OPERATIONS submenu.
2. Select Instrument Configuration from the SAVE
FILE submenu.
A. Type in: \MYDIODE.CFG <Enter> when
prompted for “FILE TO SAVE”.
B. Hit any key after the file has been saved.
3. Select Test Setup File from the SAVE FILE submenu.
A. Type in: \MYDIODE.TST <Enter> when
prompted for “FILE TO SAVE”.
B. Hit any key after the file has been saved.
4. Select Data File from the SAVE FILE submenu.
A. Type in: \MYDIODE.DAT <Enter> when
prompted for “FILE TO SAVE”.
B. Hit any key after the file has been saved.
C. Press <Eso twice to return to the main menu.
2-29
Page 46

SECTION 2
Gefting Started
tlarker 1 C X=
tiarker 2 C X=
Line C X-int=
Markers
Line
Horiz. zoom
Wert ica 1 zoom
Rest ore
Autosca Ie
Filter
Over lay
X-Invert
Y-Invert
tlarkerl: Home
tiarker2: End
StepC
1: t/-
PgUp/PgDn
Yl/YZ: Tab
Fl-Help
F3-P lot
F4-Pr int
F7-D isp Par.
Fltl-ExecAtop
Esc-Test Form
I
xE-4
. see
Y=
Y=
Y-int=
Diode
Foruord
-. ..................... ,
__ .... *j.. ..... r.. .... i.. .... i.. .... f..
Slope=
Biased
...... I.. ............................................
3
3
Beta(?lkrl)=
gm(tlkrl)=
l/S lope=
I-U
Chrrs.<Linear Sueep>
. ...... +. ...... +.
....
.....
1
. .....
Figure 2-19.
08/17/S&9
14:48:46
I
Diode Forward Biased I-V Characferisfics
Ud <Uolts>
xE0
I
2-30
Page 47

SECTION 2
Getting Started
Example #2-This example is a test procedure for NF’N
transistor common emitter curves. It is based on the test
library called NPNCRV for a 2N3904 transistor (see Appendix D). Connect two source measure units as shown
in the schematic of Figure 2-20.
DEFINE
1. Load the instrument configuration file called
TESTLlB.CFG.
2. Load the test setup file called NPNCRV.TST.
3. Modify the DEFINE INSTRUMENTS form, if
needed, to match the parameters of your source
measure units and trigger controller.
4. Modify the CURVE FAMILY TEST form, if needed,
to match your transistor characteristics.
5. Modify the DISPLAY P ARAMETEES form to match
your test parameters.
EXECUTE
6. Execute the test.
7. Compare test results with the curves shown in
Figure 2-21.
PRINT
8. Print or plot the curves, if desired.
SAVE
9. Save the instrument configuration file, test setup file,
and data file under new names, if desired.
2.6.2
System Troubleshooting
Troubleshoot any system problems using the basic procedure shown in Table 2-8. Also refer to the error messages of Table 2-3 and Appendix B. For information on
troubleshooting individual instruments, refer to the respective instruction manual(s).
Use of the GENERAL GPIB OUTPUT form to
troubleshoot instruments is described in paragraph 3.7.7.
S&P
scum MeaslJm
o”p”LOI
Figure 2-20.
Channel
Schemafic fir NPN Transistor Common Emiffer Cume Family
Table 2-8.
Symptom
No instrument responds over bus.
One instrument fails to respond.
Instruments not triggered.
Excessive leakage current.
Erratic readings.
BASE
Unit
System Troubleshooting Summary
Possible Cause(s)
Units not connected to system controller, units not configured, system
controller defective, improper card configuration.
Unit not connected to bus, improper configuration, unit defective.
Unit not connected to trigger controller.
Wrong cables used, dirty jacks, test fixture contamination.
FMI interference, poor connections.
2-31
Page 48

SECTlON 2
Getting Started
tlarker 1 E X=
tlarker 2 I: X=
Line C X-int=
Markers
Line
Horiz. zoom
Uert ica 1 zoom
Rest ore
Autosca le
Filter
Over lay
X-Invert
Y-Invert
tlarkerl: Home
tlarker2: End
Stept
I: +/PgUp/PgDn
Yl/YZ: Tab
Fl-Help
F3-P lot
F4-Pr int
F7-Disp Par.
FlQ-ExecAtop
Esc-Test Form
1.30
xE-2
Y=
Y=
Y-int=
NPN Transistor Connon Enittew Curve Fanilu
Slope=
. . ..+................ . . . . . . . . . . . . . . . . . . . . . . . . . . . . . .
. . . . . :* . . . . . . . . . . . . . . i...
I Beta0lkrl)=
1
gn(tikrl)=
l/Slope=
I . . . . . . *. . . . . . . . . . . . . . . .
i5.Y&-q I
.; . . . ...” . . . . . . . > . . . . . . t . . . . . . .
RA-+H-z i!
a.... . . . . i . . . . . . . . . . . . . . . . . . . ..\............................... . . . . . . .
..; . . . . . . . . . . . . . . .
ti!
II I
' .sbe '
i......!......’
i
!
I
I
1.80
:...... i . . . . . . . . . . . . . ..“....... . . . . . . .
! !
I I
' n.!s;;e ' s.kise '
!
! i’f’ i
I 1
I
4.!se '
I
1
i
Figure 2-21.
2-32
08/17/98
14:44:57
I
NPN Transistor Common Emitter Curue Family
wua <Uolts>
xE0
Page 49

3.1 INTRODUCTION
This section describes interactive data acquisition, including instrument configuration, test parameter entry, and test execution. Section 3 contains the following topics:
3.2
Measurements
for acquisition operation.
SECTION 3
Measurements
Overview: Provides an overview of data acquisition and gives a basic procedure
3.3 Data Entry: Lists
3.4 Instrument Configuration:
Model 251 software for a test instrument setup.
3.5 Curve Family Tests:
quire single curve and curve family data.
3.6 DC Source and Measure Tests: Covers use
TEST form to acquire DC data.
3.7
GPIB Input/Output:
instruments other than
Sources and troubleshooting with all bus instruments.
Error messages associated with measurement operations are described in Appendix B.
3.2 MEASUREMENTS OVERVIEW
Once Model 251 software is configured for your instrument setup, acquiring measurement data is
done simply by loading (and modifying, if necessary) a test setup file and executing the test. The
step-by-step procedure is ,outlined below:
guidelines for entering data and using edit keys.
Details use of all of the channels on the CURVE FAMILY TEST form to ac-
Explains using the GENERAL GPIB OUTPUT form to support testing with
Models
Describes using the DEFINE INSTRUMENTS form to configure
of bias channels on the DC SOURCE-MEASURE
236/237/23S Source Measure Units and Model 213 Quad Voltage
3-l
Page 50

SECTION 3
Measurmnts
Step 1: Define Instruments
Model 251 software must be configured for the instruments in your test system. This is done on the
DEFINE INSTRUh4ENTS
form. For an instrument to be used in any test, it must be defined and
named on this form. You specify bus address, instrument type, trigger channel, and assign a name
to this set of parameters.
Step 2 Define Test
There are two tests available from the main menu of Model 251 software:
l
Curve Family Test - Source measure units operate in the sweep function to acquire a single
curve or a curve family. Additional source measure units use the DC function to provide voltage
or current biasing. A quad voltage source can provide voltage biasing.
l
DC Source-Measure Test -Source measure units operate in the DC function to source and measure dc data. A quad voltage source can also be used.
Each test has a corresponding test form to define the parameters of up to six source measure units.
An additional test, GPIB input/output, can be accessed from the CURVE FAMILY TEST form or the
DC SOURCE-MEASURE TEST form. It is used primarily to interface instruments other than the
Keithley Model 236/237/238 units or Model 213 with the software.
Step 3: Select Display Arrays
Before a test can be run, the software must know how to display the source and measure data. This
is done on a display parameters form (one for curve data, another for DC data). As a minimum requirement, you must select which source and measurement arrays you want to graph or list. All
other selections are discussed in Section 4, Data Display.
Step 4~ Execute Test
From a test form or display parameters form, a test can be executed to acquire curve family or DC
measurement data. The results will be displayed in the mode (graphics or list) seiected on a display
parameters form.
3.3 DATA ENTRY
Model 251 software is structured with menus and forms. Where data entry is required, some basic
guidelines are followed for the functions of editing keys, as summarized in Table 3-l. Other guidelines for data entry are as follows:
3-2
l
Name entries can be alphanumeric (up to eight characters) as long as the first character is a letter. Two additional characters, the ampersand (8~) and underscore (J are also legal for names.
l
Source and measure values (up to five significant digits) can be entered with an exponent and/
or an engineering unit and multiplier prefix. The values are displayed with an engineering unit
and prefix. If no engineering unit is entered, the unit defaults to volts, amps, or seconds, depending on the field. (An exception to this is in the calculated arrays, where no units need to be
specified.)
Page 51

SECTION3
Measurements
l
A multiplier prefix for the engineering unit is optional. For example, in the SOURCE Start field
for a current sweep, the following entries are equivalent to 3.4~~4:
3.4e-6 .0000034 3.4~ 3.4uA 3.&3mA 3.4e-9k
Note that in the two rightmost entries above, when an exponent and multiplier prefix are both
specified, they are multiplied together.
l
A rough range checking is performed when a source or compliance value is entered. The entry is
compared with the following limits:
Volts -1lOOV to -1oopv; ov; 1oojlv to 1lOOV
tips
-lA to -lOOfA; OA; 1OOfA to IA
Seconds lmsec to 65sec
Entered values between zero and the minimum resolution are changed to the minimum resolu-
tion. Entered values that are greater than the upper limit are changed to the upper limit.
l
When entering numerical entries with engineering units, the following prefixes are recognized:
Entered Displayed Entered Displayed
Exponent Prefix Pl&iX Exponent Prefix Prefix
10’5 P
10’2 T
109 G
106 M
P
T
G
M
16 Kork k
1W
m
106 uorU
lo-9 norN
w2
lo-‘5 ForF
Note that there are four case-sensitive prefixes: I?, p and M, m.
m
P
n
fp .
3-3
Page 52

SECTION 3
Measuremenfs
Table 3-1. Editing Key Functions
Form
Pop-up Menu
Keys
Backspace
Delete
End
Enter
Esc
Home
Insert
Left/Right cursors
Page Down
Page Up
Space
Tab
Up/Down Cursors
CAln cc>
Backspace
Delete
End
Enter
Esc
Home
Insert
Left/Right Cursors
Page Down
Page Up
CS>
Space
Tab
Up/Down Cursors
Actions
None
On data field, selects field and deletes leftmost character.
OnDEFlNEINSTRUMENTS
selected instrument.
Moves cursor to bottom of column.
Toggles a parameter, or displays a pop-up
menu, or selects a field.
Returns to previous screen.
Moves cursor to top of column
On data field, selects field and inserts
space before leftmost character.
Moves cursor to next column left/right.
OnDEFINEINSTRUMENTS
OnDEFlNEINSTRUMENTS
On data field, selects field and clears data.
Moves cursor one column to the right.
Moves cursor up/down within a column.
Clears test form and data
None
On array name pop-up, deletes the array.
Moves cursor to bottom of menu.
Selects highlighted item and returns to
form.
Returns to form with no item change.
Moves cursor to top of menu
None
None
On name pop-up, moves cursor to bottom of
menu.
On name pop-up, moves cursor to top of menu
On may name pop-up, lists size of array.
None
None
Moves cursor up/down within menu.
form, removes definition of
form, displays next page.
form, displays next page.
34
Data Entry
Field
Backspace
Delete
End
Enter
Esc
Home
Insert
Left/Right Cursors
Page Down
Page UP
Space
Tab
Up/Down Cursors
Deletes character to left of cursor.
Deletes character at present cursor
position.
Moves cursor to right of data.
Selects field for entry, or completes data
entry and returns to form at next row.
Returns to form with no data change.
Moves cursor to beginning of field.
Inserts space at present cursor position.
Moves cursor to left/right within a field.
None
None
Clears field from present cursor position
to end of field.
Moves to next subfield or completes data entry
moves to next cohnnn to right.
Completes data entry and moves cursor
up/down to next row.
Page 53

3.4 INSTRUMENT CONFIGURATION
3.4.1 DEFINE INSTRUMENTS Form
TheDEFINEINS~UMENTS form allows you to configure Model251 software for the insinunents
in your test setup. For an instrument to be used in any test (curve family, DC source-measure, or
GPlB input/output), its bus address, instrument type and, optionally, trigger channel must be defined on this form. This definition process does not have to be performed before every test, but only
when your instrument setup changes.
Parameters on the DEFINE INSTRUMENTS form can be saved in
an instrument configuration file. When Model 251 software is
started, it loads the form with the parameters from the last loaded
or saved instrument configuration file.
Entering the DEFINE INSTRUMENTS Form
To access the DEFINE INSTRUMhNTS form, select System Configuration from the main menu.
The SYSTEM CONFIGURATION pop-up menu will be displayed. Press <Enter> at the Define In-
struments option
SECTION 3
Measurements
NOTE
DEFINE INSTRUMENTS Screen Format
The general format of the DEFINE INSTRUMENTS
entries from a sample instrument configuration file (TFSTTJELCFG). The top field concerns the bus
address for the Mode12361 Trigger Controller, while the
rameters for the test instruments. There can be a maximum of 64 instrument names defined.
form is shown in Figure 3-1, which shows eight
r
emaining fields of the screen concern pa-
3-5
Page 54

SECTION 3
/ DEFINE INSTRUMENTS
Trigger Controller Address: 15
GATE
SOURCE
DIODE
RESISTOR
CAPACITR
SUBSTRAT
MATRIX
TP01315A
Fl-Help F4-Print Del-Delete Instrument
Trigger Controller Address: Enter an integer (l-30) for the IEEE488 (GPIB) address of the Model 2361 Trigger Controller.
1
0
Instrument Name: Type in desired instrument name (up to eight characters, first character must be a letter).
2
0
GPIB Address (l-30): Enter an integer (I-30) for the IEEE488 (GPIB) address of an instrument.
3
0
Instrument: Press <Entee to display a pop-up menu of available instruments. Select wlth up/down arrow keys, then press
4
0
0
<Enter>.
Trigger Channel (lb):.Type in desired channel (l-6) on the trigger controller for a source measure unit.
5
17
17
16
16
16
9
18
10
K1236
K1236
K1236
K1236
K1236
KI213K1707
Other
ml
Esc-Configuration Menu
Figure 3-Z.
3-6
DEFINE INSTRUMENTS Form
Active Function Keys
The following function keys are active while in the DEFINE INSTRUMENT!5 form:
El-Help
F4A?rint
Del-Delete Instrument
Esc-System Config.
Provides on-line help information.
Prints t+e screen to a defined printer.
Removes the instrument definition. You will be prompted for confirma-
tion.
Exits DEFINE INSTRUMENTS form. You will be asked whether you want
the instruments initialize. With a ‘9”’ answer, all Model 236/237/238
units that are turned on and connected to the bus will be initialized.
Page 55

SECTION 3
Mfzasurements
3.4.2
Parameter Description
Trigger Controller
This field contains the IEEE-488 (GPIE0 address of the Model 2361 Trigger Controller. The bus ad-
dress of the Model
setting of 15, which is selected by simple binary weighting.
The Trigger Controller field can be left blank when the test system consists of a single source measure unit configured to measure, without a trigger controller.
Fikure 3-2. Mode12361 Rear Panel DIP Switch
2361
is set with its rear panel DIP switch. Figure 3-2 shows the factory default
?iEimiy
DFLT PRGM
Instrument Name
Each line of instrument parameters is assigned a unique Instrument Name. This name is used to
refer to the parameters of a source measure unit or other instrument in the CURVE FAMILY TEST
form, DC SOURCE-MEASURE
TEST form, and GENERAL GPB OUTPTJT test form.
The instrument name can be alphanumeric as long as the first character is a letter. Two additional
characters, the ampersand (&) and underscore 0 are also legal for name entry. Trailing numbers
can be used to differentiate like names.
GPIB Address (l-30)
The GPIB (IEEE-488) Address field contains the address of each instrument interfaced with Model
251 software. This can be any value between 1 and 30 as long as conflicts with other instruments on
the bus are avoided. Paragraph 23.5 describes verifying and changing IEEE-488 addresses of
source measure units.
Each address must have a unique Instrument type and Trigger Channel, but it is possible to assign
more than one Instrument Name to the same set of parameters.
Instrument
The Instrument field has a pop-up menu listing the model numbers for Keithley instruments sup-
ported by Model 251.
3-7
Page 56

SECTION 3
Measuretnenis
Pressing <Enter brings up a pop-up menu of available instruments:
KT236
Ei
KI213-1
KI213-2
KI213-3
Kl213-4
KI707
Other
Clear
Use the up /down arrows to select an instxument, then press cEnten. Use the <EC= key to keep the
present instrument selection. Specify “Other” for instruments other than those listed. Selecting
‘Clear” del&es any present instrument from the field.
Trigger Channel (l-6)
Up to six trigger channels can be configured for Keithley source measure units.
Trigger channels are used only for K1236, Ki237, and KI238. The Trigger Channel field can also be
left blank when the test system consists of a single source measure unit configured to measure,
without a trigger controller.
Model 236/237/238 Source Measure Units
1
Model 213 Quad Voltage Source
1
- Model 707 Switching Matrix
Page 57

SECTION 3
Measurements
Curve Family Tests
3.5 CURVE FAMILY TESTS
3.51
CURVE FAMILY TEST Form
The CURVE FAMILY TEST form configures Model 251 software to perform voltage and current
sweeps with single or multiple source measure units. Three channels support single, subordinate,
and synchronous sweeps. Three additional channels are available to supply voltage or current biasing
from source
Entering CURVE FAMILY TEST Form
To access the CURVE FAMILY TEST form, select Curve Family Test from the main menu and press
<Enten. The CURVE FAMILY TE!?I form will be displayed.
CURVE FAMILY TEST Screen Format
An example of a CURVE FAMILY TEST form is shown in Figure 3-3, which is a test form for NPN
transistor common emitter curves. (The form is that for NPNCRV.TST
pendix D.) The top portion of the form lists parameters that apply to all channels (global). The lower
portion of the form lists channel specific parameters of the six available channels.
measure units or a quad voltage source.
NOTE
Parameters on the CURVE FAMILY TEST form, alongwith GPIB
I/O parameters and display parameters, can be saved in a test
setup file. This is done from the File Operations selection of the
main menu and is discussed in Section 5.
from the test
library of Ap-
3-9
Page 58

SECTION 3
Measurements
1 ;NPNcRv
0
2 \ SweepType: LINEAR
0 I
3-
0
7’
0
8-
0
QH
0
1
0
2 Mode: Press <Enter> to toggle between Single Test and Auto Repeat.
0
3 Delay Before Curves: Type in desired delay (0 to 65 seconds, in 1 msec increments) for before first curve and between suc-
0
4 Integration Time: Press cEnteD to display pop-up menu. Selections are 416msec, 4ms, 60Hz tine, and 50Hz tine.
0
6 Filter: Press &men= to display pop-up menu. Selections are Disable, 2 Rdg, 4 Rdg, 8 Rdg, 16 Rdg, and 32 Rdg.
0
Mode: Single Test
Delay Bef&e Curves
CHANNEL NAME
on/off
Instrument Name
Src &ray Name
Meas Array Name
- SOURCE
TYPe
Puked Off Value
Range
Start/Biis
stop
Step
# Of curves
$ggg-
Range
Com7Aiance Value
Sweep Type: Press <Enter> to toggle between LINEAR and LOG sweep.
ceeding curves.
Points/Decade (Sweep and Sync Swp Channels) (shown for log sweeps): Press <Enter> to display pop-up menu. Selections
are 5,10,25, and 50 points per decade.
OS
Swfxv
on
COLLECTR
VCe
Ic
V
Best Fix
ov
5V
50
mV
Gal
100 mA
2oxL4
CURVE FAMILY TEST
Integration Time: 416~
Filter: Disable
Delay Betw
Step
on
BASE
p
Vbe
I
Best Fix
1OlJ-A
SOti
1OP.A
5
Lmal
1.1 v -
1v I
I syncswp
Off
-
-
-
-
-
-
-
-
-
-
t
-
en Points: 0 s
Bias 1 1 Bias 2
off off
- -
- -
- -
- -
- -
- -
- -
- -
- -
- -
-
- -
-
I
~ Bias3
off
-
-
-
-
-
-
-
-
-
-
-
-
-6
0
Pulsed Time On, Off (shown for pulsed sweeps): Type in desired pulse on and off times (0 to 65 seconds, in 1 msec increments).
6 Delay Between Points: Type in desired delay (0 to 65 seconds, in 1 msec increments).
0
7 CHANNEL Parameters:
0
On/Off: Press <EnteD to toggle between channel On and channel Off.
Instrument Name: Type in desired instrument name (up to eight characters) or press <Enter to display a pop-up menu of
previously defined names.
Src Array Name: Type in desired source array name (up to eight characters) or press <EnteD to display pop-up menu of
previously defined names.
%pre 3-3.
3-10
Meas Array Name: Type in desired measure
previously defined names.
CURVE FAMILY TEST Form
array
name (up to eight characters) or press <Enter to display pop-up menu of
Page 59

SOURCE Parameters:
8
0
Type: Press <Enten= to display pop-up menu. Selections are V (source voltage), I (source current), V Pulsed (source pulsed
voltage), and I Pulsed (source pulsed current).
Pulsed Off Value (shown for pulsed sweeps): Type in desired voltage or current level for between pulses.
Range: Press <Enter, to toggle between Auto source range and Best FIX source range.
Start/Bias: Type in desired starting voltage or
bias level.
Stop: Type in ending voltage or current level of sweep.
Step: Type in desired incremental value between linear sweep points (1000 pointskuwe maximum).
# of Curves: Type in desired number of curves in a curve family (2-32).
Sense: Press <Enter> to toggle between Local and Remote sense.
MEASURE Parameters:
9
0
Range: Press <Enter> to display a pop-up menu of measure ranges. Selections depend on source type and model of source
measure unit.
Compliance Value: Type in desired compliance limit for current or voltage.
10 Test Title: Name of the test setup file that was loaded or saved.
0
CURVE FAMILY TEST Form kont.)
current
SECTION 3
Measurements
value of a sweep. For bias channels, type in desired voltage or current
Active Function Keys
F&Help
W-Print
F5-GPlB
F7-Disp.Param
F8-View
FlO-Execute Test
ESC-Main Menu
3.5.2 Parameter Description
Global Parameters
Sweep Type
Provides
Prints the screen to a defined printer.
Takes you to the GENERAL
Takes you to the DISPLAY PARAMETERS form.
Takes you to the VIEW screen, if data is available and data arrays have
been specified on the DISPLAY PARAMETERS form.
Performs the sweep if data arrays have been specified on the DISPLAY
PARAMETERS form, then takes you to the VIEW screen.
Exits CURVE FAMILY TEST form and returns you to the
Press the <Enten key to toggle between
Linear sweeps are the default selection. Log sweeps are generally preferred for wider sweep ranges (over three decades or more>. If LINEAR is
chosen, any selected sweep channel (Sweep, Step, or Sync Swp) will perform a linear sweep. If LOG is chosen, the Sweep channel, and Sync Swp if
selected, will perform log sweeps.
on-line
help information
GPIJ3 OUTPUT form.
main
menu.
LINEAR and LOG sweeps.
Mode
Press the <Enter> key to toggle between the two test modes: Single Test
and Auto Repeat. With Single Test, the test will be executed once, then the
data will be graphed or listed. With Auto Repeat, the test will be executed
and the data will be graphed or listed continually. Pressing <Escape> will
immediately abort a test. If Auto Repeat is selected, the &lo> key will interrupt the test repetition after the present test has completed.
3-11
Page 60

SECiTOiV3
Measu7emetlts
Delay Before Curves
A Model213 Quad Voltage Source requires at least 75Op to settle.
Integration Time
Filter Filtering is used to reduce measurement noise. Pressing the <Enter>
Specifies the time before the start of the first sweep, and between successive sweeps of a curve family, to allow the source output to settle.
NOTE
Press the <Enten key to display the following pop-up menu:
Your selection specifies the speed for A/D’conversions within the source
measure units and subsequent usable measurement resolution, with 60112
Line as the default selection. The integration times have the following
measurement resolutions: 416pec (4 digits), 4msec (5 digits), 6OHz line
(16.7msec, 5 digits), and 5OHzliue (2Omsec, 5 digits). If one of the line cycle
selections is chosen, match your power line frequency or noisy readings
are possible.
key displays the following pop-up menu:
Disable
2Rdg
4w3
8 Rdg
16 Rdg
r
32 Rde
Your selection specifies the number of reading conversions that will be averaged to yield a final measurement. The default selection, Disable, is synonymous to averaging one reading conversion. Since filtering increases
measurement time, use only as much as necessary.
Delay Between Points Specifies the time between successive points in a sweep, to allow the
source output to settle.
Points/Decade
(Sweep Channel)
This parameter is displayed for log sweeps. Pressing &ten will display
the following pop-up menu:
3-32
Page 61

SECTION 3
Measurements
The default value is five. Your selection specifies the number of measurement points per logarithmic decade for the Sweep and Sync Swp channels.
Pulsed Time On, Off These parameters are shown for pulsed sweeps. The on and off times de-
fine the entire period for each pulse waveform. Pulse Time On is the duration of the pulse at the sweep level Pulse Time Off is time between pulses
at the level set by Pulsed Off Value.
The on and off times include the effects of integration time, filtering, and
autoranging. If the source measure unit is configured such that it cannot
run fast enough to output pulses at the programmed on and off times, you
are informed with the ‘Pulse times are approximate” message and given
the opportunity to change test parameters.
Channel Parameters
CHANNELNAME
On/Off
To execute a single curve or curve family test, six channels are available.
The channel named Sweep performs a single curve test (e.g., a diode I-V
curve) and is always required. The Step channel is used in combination
with the Sweep channel to generate a curve family (e.g., bipolar common
emitter curves).
A synchronous sweep, where two source measure units trigger each other
back and forth until a sweep is completed, is accomplished with the
Sweep and Sync Swp channels. A typical application for a synchronous
sweep is a Gummel plot. The sync sweep list will have the same number of
points as the primary sweep, and have a slope determined by the Start
and Stop values of the Sync Swp channel.
The three bias channels source a constant DC voltage or current, and optionally measure. The bias channels are commonly used to provide a bias
voltage or current for a semiconductor’s substrate terminal, to supply device power, or to set an operating point for a test.
Press the <Enten key to toggle between the two choices. A channel must
be turned on to configure it for a test and use it during test execution. Only
theInstrumentNamefieldcanbemodifiedifthechannelistumedoff.The
source and measure parameters are saved through a channel On-Off-On
cycle.
Instrument Name Press the <Enten key to display a pop-up menu of the Instrument Names
previously specified on the DEFINE INSTRUMENTS
name of a Keithley source measure unit for any of the channels, or a Keithley quad voltage source for a bias channel. Each channel that is turned on
must have a unique Instrument Name and address.
Src Array Name This field is the name of an array where the source values will be stored.
Pressing <Enter> before modifying the field will display a pop-up menu
of previously created array names.
foim. Select the
3-13
Page 62

SECTION3
Measumnents
Meas Array Name This field Csource measure unit only) is the name of an array where the
SOURCE Parameters
measure values will be stored. Pressing <Enter> before modifying the
field will display a pop-up menu of previously created array names.
Time arrays are created when measure arrays are named on the CURVE
FAMILY TEST form. The time arrays are called SWPTIME, STFPTlME,
SYNCTME, BlTlME, B2TlME, and B3TIME for the respective channels.
They are filled with elapsed time data during acquisition for channels
with measure array names. They can be specified on the DISPLAY PARAMETERS form to view data versus time.
NOTE
Since a test will run faster with fewer arrays, specify only those
that require storeddata. A measure array for the Sweep channel
must be specified.
~~~~~ ~~~~~~
~~~~.~~ ~~~~~
TYPe
Pulsed Off Value
Pressing cEnten will display the following pop-up menu (source measure units only):
V
hulsed
Il?t&d
0
The default selection, V, is for sourcing a voltage sweep (and measuring
current). The next selection, I, is for sourcing a current sweep (and measuring voltage). The last two selections are for pulsed voltage or current
sweeps. Source and measure parameters are saved when the source type
is changed.
This parameter is shown for pulsed sweeps. It is the desired voltage or current level during the pulse off times.
Pressing cEnten toggles between Auto, the default, and Best Fix for the
source range. With Auto range, the source measure unit may change
ranges during a sweep, depending on the Start and Stop values. With Best
Fix range, the source range is dictated by the highest range needed for the
sweep parameters.
3-14
Start/Bias
stop
For the Sweep, Step, and Sync Swp channels, this is the starting voltage or
current value of a sweep. For bias channels, this is the voltage bias level or
current (source measure units only) bias level.
For the Sweep, Step, and Sync Swp channels, this is the ending voltage or
current value of a sweep.
Page 63

SECTION 3
Measurements
Step
For linear sweeps, this is the incremental value between consecutive
sweep points. If a negative value is entered, the absolute value is displayed, as the direction of the sweep is determined by the Start and Stop
levels. Changes to the Step field are reflected in the # of Curves field for the
Step channel.
The maximum number of points per data array is 4000. As shown in
Figure S-4, it is the product of curves per family and points per curve. lMbyte of LIM expanded memory, up to 24 data arrays of this size or smaller
can be created.
:amily
Figure 3-4.
# of Curves
1
. . . I.. 9,. * I I I I I
loo zoo 300 400 500 600 700 800 900 1000
Curues per Family versus Poinfs per Cum
For pulsed sweeps, the Step parameter determines the number of pulses.
Since measurements are t&en during the pulse on and pulse off times, the
maximum number of pulses is 500 (this yields a lOOO-point curve).
For the Step channel, this field specifies the number of curves in a family.
Changes to # of curves are reflected in the Step field. Once all fourparameters (Start, Stop, Step, and # of Curves) are entered, changes to Start or
Stop cause recalculation of Step according to # of Curves.
This field is active for source measure units only. Press the <Enter> key to
toggle between Local sense, the default selection, and Remote sense. Use
remote sensing when sourcing or
measuring
over 1mA. Refer to the m-
strument connection diagrams in Section 2, Getting Started.
PoinWCufve
3-15
Page 64

SECTION 3
Measuretnents
WARNING
With remote sensing enabled, an open sense lead
will result in lethalvoltages appearing at OUTPUT
HI and GUARD of the source measure units. This
voltage can cause injury or death, and damage ex-
ternal circuitry. Always make sure that the sense
leads are properly connected before enabling re-
mote sense. NEVER change connections with
power applied. Be sure to always discharge and/or
disconnect external power sources.
MEASURE Parameters
3.5.3
-%e
Press the <Enten key to display a pop-up menu of auto and fixed ranges
of measure for the model of source measure unit specified by Instrument
Name. Auto is the default selection.
Compliance Value
This field (source measure units only) specifies the compliance limit that is
set to protect external circuitry (i.e., the device under test) from damage.
When sourcing voltage, a current compliance is set; when sourcing current, a voltage compliance is set.
Curve Family Test Examples
The test library of Appendix D contains curve family test examples, including sample data in the
DAT files. This paragraph will describe modifying test examples to meet your needs. Listed below
are the various types of curve family tests from the library.
Test Type
Linear sweep
w3 +=Jeep
Linear sweep with bias
Linear subordinate sweep
Linear synchronous sweep
Linear subordinate pulsed sweep
Trigger Example Test
Controller SetuD File
No
No
Yes
Yes
Yt?S
YeS
DIODELIN.TST
DIODELOG.TST
NJFETTIGTST
NT’NCRVTST
lWNFGUML.TST
NPNEULSl .TST
Instruments and
Channel Names
236 -Sweep
236 - sweep
~
236 Sweep 236-B& 1
236 - Sweep
,236-Step
236 - Sweep
236 - Sync Swp
,236-Sweep
3-16
Single Channel Sweep
This example is for a simple test system consisting of one source measure unit and no trigger con-
troller. If you choose to run the test, refer to Diode Forward Biased I-V Characteristic Linear Sweep
(DIODELlN.TST) in the test library for a schematic.
Step 1: Define the Instruments
Before you can run a test, Model 251 software must be configured for the instruments in your test
system.
Page 65

SECl-ION3
Measuremenis
NOTE
Since Model 251 software defaults to the last loaded or saved in
strument configuration file on start-up, ah parts of this step may
not be necessary.
1. From the main menu, select File Operations, then press <Enter>.
2. select Load File cEnten.
3.
Select Instrument Configuration &men.
4.
Press <Enten, then use the up/down arrow keys to highhght the instrument configuration file
called TESTLIEKFG.
NOTE
If TESTLIB.CFG does not appear in the directory Iisting, the
Model 251 software may not be properly installed; refer to paragraph 2.4 for details on installation.
5.
Press CESO three times to return to the main menu.
6. Select System
The DEFINE INSTRUMENTS
Configuration and press ate-. Select Define Instruments and press <Enter>.
form should appear on the screen.
7. If necessary, modify the form to the match the setup of your test system. Delete lines that refer to
instruments with bus addresses
not
present.
8. Press <Es0 when done. Press <Y> at the Initialize Instruments prompt. You wiII be returned to
the main menu after source measure units are initialized.
Step 2 Load the Test Sefcup File
Load a test setup fiIe, which contains test parameters, display parameters, and GPIB I/O parameters.
1. From the main menu, select File Operations, then press cEnten.
2. Select Load File cEnterx
3.
Select Test Setup File cEnten.
4. Press <Enter>, then use the up/down arrow keys to highhght the test setup fiIe called
DIODEIBLTST, then press <Enter>.
5.
Press &so three times to return to the main menu.
Step 3: Set Up the Test Parameters
Examine the test parameters and modify them, if necessary, for your device and source measure
unit.
1. From the main menu, select Curve Family Test, then press -cEnter>.
2. Edit the CURVE FAMILY TEST form to correctly test your device with your source measure
unit You should be able to test a lN914 diode with a Model 236 without modifying the test parameters shown in Figure 3-5.
3-17
Page 66

SECTION3
Measuremenfs
- DIODELIN
Sweep Type: LINEAR
Mode: Single Test
Delav Before Curves: 0 s
,
CHANNEL NAME
On/Off
Instrument Name
Src Array Name
Meas Array Name
-SOSOURCE
TYPe
Pulsed Off Value
Rwse
Start/Bias
stop
Step
# Of curves
-EURE
Range
Compliance Value
Figure 3-5. Sample Single Channel Test Parameters
on
DIODE
Vd
Id
V
-
Best Fix
ov
5OOmV,
10 mV
-
1mA
1mA
CURVE FAMlLY TEST
step
Hoff
-
-
-
-
-
A
-
-
-
-
-
-
off
-
-
-
-
-
-
Integration Time: 416~~
Filter: Disable
Delav Between Points: 0 s
SyncSwp Bias 1
1 I
Off
I I
i- I -
-
-
I
I- I-
I- I-
- -
I
Bias 2
Off
-
-
Bias 3
Off
-
-
-
-
-
-
-
-
-
-
-
-
Step 4: Set Up the Display Parameters
The display parameters, loaded along with the test parameters in the test setup file, may require
modification.
NOTE
Parameters on the DISPLAY PARAMETERS
with a test setup or data file. Thus, it is not necessary to access this
screen after loading a test setup or data file, unless, of course, you
wish to make changes to the way your data is displayed.
1. Press cF7> from the CURVE FAMILY TEST form to get to the DISPLAY PARAMETERS form.
2. The display parameters may need editing if you are not testing a IN914 diode. (See Section4 for
editing details.)
NOTE
With no test setup or data file loaded, the default values on the
DISPLAY PARAMETERS form will display a graph, as long as
you speciry what Array Names to plot.
Step 5: Execute the Test
1. From the DISPLAY l?w
2. When the test has completed, a graph of the I-V characteristics will be displayed on the screen.
form, press the <FlO> key. This will initiate test execution.
screen are saved
3-18
Page 67

SECTION 3
Measurements
Multichannel Sweep
This‘example will use two source measure units and a trigger controller to acquire curve family
data. If you choose to run the test, refer to NPN Transistor Common Emitter Curve Family
(NPNCRV.TST) in the test library for
Step 1: Define the Instruments
1. From the main menu, select File Operations, then press <Enter>.
2. Select Load File &ten.
3. Select Instrument Configuration <Enter>.
4. Press <Enter>, then highlight the TESTLIBCFG file and press <Enter>.
5. Press <Es0 three times to return to the main menu.
6. Select System Configuration and press -cEnten. Select Define Jnstn&ents and press <Enter>.
7. ModifytheDEFINEINSTRUMENT!3 form to match your test system. This test needs two source
measure units and a trigger controller
8. Press &so when done. Press <Y> at the Initialize Instruments prompt. You will be returned to
the main menu.
a schematic.
Step 2: Load the Test Setup File
1. From the main menu, select File Operations, then press <Enter>.
2. Select Load File <Enten.
3. Select Test Setup File <Enter>.
4. Press <Enter>, then highlight the NPNCRVTST file and press &r&x7.
5. Press <Es0 three times to return to the main menu
Step 3: Set Up the Test Parameters
1. From the main menu, select Curve Family Test, then press <Enter>.
2. Examine the test parameters. Edit them for your device and source measure units, if necessary.
The parameters shown in Figure 3-6 are set for a 2N3904 NPN transistor with two Model 236
Source Measure Units.
Step 4: Set Up the Display Parameters
1. Ress cF7> from the CURVE FAMILY TEST form to get to the DISPLAY PARAMETERS form.
2. The display parameters may need editing if you are not testing a 2N3904 transistor.
Step 5: Execute the Test
1. From the DISPLAY PARAMETERS
form, press the (FlO> key. The sweeps will start.
2. When the sweeps have completed, a graph of the common emitter character&& will be
graphed on the screen.
3-19
Page 68

SECTION 3
- NPNCRV
Sweep Type: LINEAR
Mode: Single Test
Delay Before Curves: 0 s
CHANNELNAME Sweep Step
On/Off on
Instrument Name
COLLECTR BASE
Src Array Name
Meas Array Name
Pulsed Off Value
Figure 3-6.
Sample Multichannel Test Parameters
CURVE FAMILY TEST
Sync Swp Bias 1
on Off
Integration
Time: 416~~
Filter: Disable
Delay Between Points:
Bias2
Off,
Off
DS
Bias 3
Off
-
-
-
-
-
Multichannel Pulsed Sweep with Calculation
This example is a continuation of the previous one. It uses pulsed sweeps and performs a calcula-
tion on the acquired data. If you wish to run the test, refer to NPNTransistor Curve Family and Beta
Using Pulsed Sweep and Step @BWPULSl.TST) in the test library.
Step 1: Define the Instruments
This step has the same parts as the Multichannel Sweep example and does not need to be repeated.
Step 2~ Load the Test Setup File
Perform the same parts as in the previous example, except specifying the NPNPULSl.TST.
Step 3: Set Vp the Test Parameter
Examine the test parameters of Figures 3-7 and modify for your device and instruments, if neces-
sary.
3-20
Page 69

SECTION3
Measurements
Step 4: Set Up the Display Parameters
1. Press -ST’> from the CURVE FAMILY TEST form to get to the DIS’PLAY Ps form.
2. The display parameters may need editing if you are not testing a 2N3904 transistor. Note that
beta will be plotted on the Y2 axis.
3. Move the cursor down to DC-Gain Ratio) and press &terx A pop-up form will be displayed.
4.
Note that the
collector and base current arrays are specified in the form and thqt the calculation
is enabled.
5. Press <Eso to return to the DISPLAY PARAMETERS form.
Step 5: Execute the Test
1. From the DISPLAY PARAMETERS form, press the &lo> key. The pulsed sweeps will start.
2. When the sweeps have completed, the coFon emitter characteristics and beta will be graphed
on the
screen.
3-21
Page 70

SEClIlON3
Measurements
3-22
Page 71

SECTION 3
Measurments
DCSourceand
Measure Tests
3.6 DC SOURCE AND MEASURE TESTS
3.6.1
DC SOURCE-MEASURE TEST Form
The DC SOTJRCE-MEASURE TEST form configures Model 251 software to source, and optionally
measure DC voltage or current. Up to six channels are available for source measure units.
Parameters on the DC SOURCE-MEASURE TEST form, along
with GPIB I/O parameters and display parameters, can be saved
in a test setup file. This is done from the File Operations selection
of the main menu and is discussed in Section 5.
Entering DC SOURCE-MEASURE TEST Form
To access the DC SOTJRCE-MEASURE TEST form, select DC Source-Measure Test from the main
menu and press <Enter>. The DC SOURCE-MEASURE TEST form will be displayed.
DC SOURCE-MEASTJRE TEST Screen Format
An example of a DC SOURCE-MEASURE TEST form is shown in Figure 3-7, which is a test form for
a capacitor leakage test. (The form is for the DCCAPAC.TST from the test library of Appendix D.)
The top portion of the form lists parameters that apply to all channels. The lower portion of the form
lists channel specific parameters of the six bias channels.
NOTE
3-23
Page 72

SECTlON3
Measurements
1 <DCCAPAC
0
2 l Mode: Single Test
0
5-
0
6 ---u-Ra
0
7 ---MEASURE
0
1
0
2
0
3
0
4
0
Delay Time: 10 s
CHANNEL NAME Bias 1
On/Off
Instrument Name
Src Array Name Vc
Mess Array Name Ic
Type
Range
Value
Sense
Range
Compliance Value 1 j.lA
Mode: Press <Enter> to toggle between Single Test and Auto Repeat.
Delay Time: Type in desired delay (0 to 65 seconds, in 1 msec increments).
integration Time: Press cEnten to display pop-up menu. Selections are 416psec, 4ms, 60Hz Line, and 50Hz Line.
Piker: Press <Enter> to display pop-up menu. Selections are Disable, 2 Rdg, 4’Rdg, 8 Rdg, 16 Rdg, and 32 Rdg.
CHANNEL Parameters
DC SOURCE&MEASURE TEST
Integration Time: 6OHz Line
Filter: Disable
Bias 2
&AClTR
V
Best Fix - - - - 2v
Local
1ti
Off Off
-
- - -
-
-
-
-
-
Bias 3 Bias 4 Bias 5
off off’ Off
- - -
- -
- - - -
- - - -
- - - -
- - - -
- - - -
Bias 6
-
-3
-4
0
0
6
0
7
0
8
0
Figure 3-7.
3-24
On/Off: Press <Enter> to toggle between channel On and channel Off.
instrument Name: Type in desired instrument name (up to eight
previously defined names.
Src Array
Meas Array Name: Type in desired measure array name (up to eight characters) or press <Enter> to display pop-up menu of
SOURCE Parameters:
Type: Press <Enter> to toggle between V (source voltage) and I (source current).
Range: Press <Enter> to toggle between
Value: Type in desired voltage or current bias value for DC operation.
Sense: Press <Enter> to toggle between Local and Remote sense.
MEASURE Parameters:
Range: Press <Enter> to display a pop-up menu of measure ranges. Selections depend on source type and model designa-
Compliance Value: Type in desired compliance limit for current or voltage.
Test Title: Name of the test setup file that was loaded or saved.
Name:
previously defined names.
previously defined names.
tion of named instrument.
DC SOURCE-MEASURE Test Form
Type in desired source array name (up to eight characters) or press cEnten to display pop-up menu of
Auto source range
characters)
and Best
or press <Enter> to display a pop-up menu of
Fix source range.
Page 73

Active Function Keys
SECTION3
Measurements
Fl-Help
F4l’rint
F5-GPIB
F7-Disp.Param
F8-View
FIO-Execute Test
ESC-Main Menu
3.6.2 Parameter Description
Global Parameters
Mode
Provides on-line help information.
Prints the screen to a defined printer.
Takes you to the GENERAL
Takes you to i-he DISPLAY DC
GPIB OUTPUT form.
ARAMETERS form.
I?
Takes you to the VIEW screen, if data is available and data arrays have
been specified on the DISPLAY DC PARAMETERS form.
Performs the DC source/measure if data arrays have been specified on the
DISPLAY DC PARAMETE RS
form, then takes you to the VIEW screen.
Exits DC SOURCE-MEASURE TEST form and returns you to the main
menu
Press the <Enter> key to toggle between the two test modes: Single Test
and Auto Repeat. With Single Test, the test will be executed once, then the
data will be listed. With Auto Repeat, the test will be executed and the data
will be listed continuahy. Pressing <Escape> will immediately abort a test.
If Auto Repeat is selected, the cFlO> key will interrupt the test repetition
after the present test has completed.
Delay Time
Jntegration Time
Specifies thehc delay, the time between source and measure phases of a
source-delay-measure cycle, to allow the source output to settle. The DC
delay is in addition to the default delay.
NOTE
A Mode1213 Quad Voltage Source requires at least 750~ to settle.
Press the <Enter> key to display the following pop-up menu:
15OHzLine 1
Your selection specifies the speed for A/D conversions and subsequent
usable measurement resolution, with 6OHz Line as the default selection.
The integration times have the following measurement resolutions:
416psec (4 digits), 4msec (5 digits), 6OHz line (16.7msec, 5 digits), and 5OHz
line (20msec, 5 digits). If one of the line cycle selections is chosen, match
your power line frequency or noisy readings are possible.
3-25
Page 74

SECTION 3
Filter
Channel Parameters
CHANNEL NAME
On/Off
Filtering is used to reduce measurement noise. Pressing the <Enten
key displays the following pop-up menu:
Disable
2 Rdg
4 Rdg
8 Rdg
16 Rdg
32 Rde
Your selection specifies the number of reading conversions that will be averaged to yield a final measurement. With the filter disabled, only one
reading is taken. Since filtering increases measurement time, use only as
much as necessary.
To execute a DC test, up to six bias channels source a constant DC voltage
or current, and optionally measure.
Press the <Enter> key to toggle between the two
choices.
A channel must
be turned on to configure it for a test and use it during test execution. Only
theInstrumentNamefieldcanbemodifiedifthechannelisturnedoff.The
source and measure parameters are saved through a channel On-Off-On
cycle.
Instrument Name
Press the &nter> key to display a pop-up menu of the Instrument Names
previously specified on the DEFINE INSTRUMENTS
form. Select the
name of a Keithley source measure unit or quad voltage source. Each
channel that is turned on
must
have a unique Instrument Name and ad-
dress.
Src Array Name
This field is the name of an array where the source values will be stored.
Pressing <E&e before modifying the field will display a pop-up menu
of previously created array names.
Meas Array Name This field (source measure units only) is the name of an array where the
measure
values will be stored. Pressing <Enter> before modifying the
field will display a pop-up menu of previously created array names.
NOTE
Since a test will run faster with fewer arrays, specify only those
that require stored data.
3-26
Page 75

SOURCE Parameters
SECTION 3
Measurements
TYPe
Range
Value
Sense
Pressing cEnten toggles between two choices (source measure units only): V, the default selection, for sourcing DC voltage (and measuring current), and I, for sourcing DC current (and measuring voltage). Source and
measure
parameters are saved when the source type is toggled back and
forth.
Ressing <Enter> toggles between Auto, the default, and Best Fix for the
source range. With Auto range, the source measure unit may change
ranges. With Best Fix range, the source range is dictated by the highest
range needed for the source value.
This is the voltage bias level or current (source measure units only) bias
level.
This field is active for source measure units only. Press the <Enter> key to
toggle between Local sense, the default selection, and Remote sense. Use
remote sensing when sourcing or measuring over 1mA. Refer to the instrument connection diagrams in Section 2, Getting Started.
WARNING
With remote sensing enabled, an open sense lead
will result in lethal voltages appearing at OUTPUT
HI and GUARD of the source measure units. This
voltage can cause injury or death, and damage external circuitry. Always make sure that the sense
leads are properly connected before enabling remote sense. NEVER change connections with
power applied. Be sure to always discharge and/or
disconnect external power sources.
MEASURE Parameters
Press the <Enter> key to display a pop-up menu of auto and fixed ranges
of measure for the model of source measure unit specified by Instrument
Name. Auto is the default selection.
Compliance Value This field (source measure units only) specifies the compliance limit that is
set to protect external circuiiry (i.e., the device under test) from damage.
When sourcing voltage, a current compliance is set; when sourcing current, a voltage compliance is set.
3-27
Page 76

SECITON 3
Measurements
3.6.3
DC Source-Measure Test Examples
The test library of Appendix D contains DC source-measure test examples, including sample data
in the .DAT files. This paragraph will describe modifying a test example to meet your needs.
This example is for a simple test system consisting of one source measure unit and no trigger controller. If you choose to run the test, refer to Capacitor Leakage Test 0BXAPAC.TST) in the test
library for a schematic.
Step 1: Define the Instruments
Model 251 software must be configured for your test system.
Since Model 251 software defaults to the last loaded or
stnunent configuration file on start-up, all parts of this step may
not be necessary.
1. From the main menu, select File Operations, then press <Enter>.
2. Select Load File, then press <Enter>.
3.
Select Instrument Configuration, then press <Enter>.
4. Press <Enter>, then use the up/down arrow keys to highlight the instrument configuration file
called TESTLJXCFG.
NOTE
saved in-
NOTE
If TE!XLTEKFG does not appear in the directory listing, the
Model 251 software may not be properly installed; refer to paragraph 2.4 for details on installation.
5.
Press <Es0 three times to return to the main menu.
6. Select System Configuration and press cEnten. Select Define Instruments and press <Enter>.
The DEFINE INSTRUMENTS
form should appear on the screen.
7. If necessary, modify the form to the match the setup of your test system. Delete lines that refer to
instruments with bus addresses not present.
8. Press CESO when done. Press cY> at the Initialize Instruments prompt. You will be returned to
the main menu after source measure units are initialized.
Step 2: Load the Test Setup File
Load a test setup file, which contains test parameters, display parameters, and GPlB I/O parameters.
1. From the main menu, select File Operations, then press <Enter>.
2. Select Load File, then press <Enter>.
3.
Select Test Setup File, then press <Enter>.
4. Press <Enter>, then use the up/down arrow keys to highlight the test setup file called
DCCAPAC.TST, then press &ten.
5. Press <Eso three times to return to the main menu.
3-28
Page 77

SECTION3
Measurements
Siep 3: Set Up the Test Parameters
Examine the test parameters and modify them, if necessary, for your device and source measure
unit.
1. From the main menu, select DC Source-Measure Test, then press <Enter>.
2. Edit the DC SOTJRCE-MEASTJRE TEST form to correctly test your device with your source
measure unit. You should be able to test a ll~.F capacitor with a Model 236 without modifying the
test parameters shown in Figure 3-8.
DC SOURCE-MEASURE TEST
Integration Time: 6OHz Line
Filter: Disable
CHANNEL NAME
I
On/Off
Instrument Name
Src Array Name
Meas Array Name
Bias1
On
CAPACIJX
vc
Ic
Bias2
I
Off
-
-
Bias 3
I
~ off
-
‘-
-!xxJRcE
TYPe
R=%e
Value
Sense
V
Auto 2v
Local -
-
-
-
-
-
-
-MEASURE
=we
Compliance Value
-
-
Figure 3-8. Sample DC Source-Measure Test Parameters
Step 4: Set Up the Display Parameters
The display parameters, loaded along with the test parameters in the test setup file, may require
modification
NOTE
Parameters on the DISPLAY PARAMETE RS screen are saved
with a test setup or data file. Thus, it is not necessary to access this
screen after loading a test setup or data file, unless, of course, you
wish to make changes to the way your data is displayed.
Bias 4
I
I
Off Off
-
- -
- -
- -
- -
- -
- -
- -
Bias5
-
Bias 6
Off
-
-
-
-
-
-
-
-
1. Press 67> from the DC !3OURCE-MEASDEE TEST form to get to the DISPLAY DC PARAMETERS form.
2. The display parameters may need editing if you are not testing a l@ capacitor. (See Section 4 for
editing details.)
NOTE
As long as you specify Select All, the default values on the DISPLAYDCPARAME TEBS form will run properly with no test
setup or data file loaded.
3-29
Page 78

SECTION3
Measurements
Step 5: Execute the Test
1. From the DISPLAY DC PARAMETERS form, press the &lo> key. This will initiate test execution.
2. When the test has completed, a list of the source and measure values, and any calculated value,
will be displayed on the screen.
3.7 GPIB INPUT/OUTPUT
3.7.1
Entering GENERAL GPIB OUTPUT Form
GENERAL GPIJ3 OUTPUT Screen Format
GENERAL GPIB OUTPUT Form
The GENERAL GPlB OUTPUT form is used to control any named instrument on the DEFINE INSTRUMENTS form. These can be instruments other than Keithley. If the first output string has been
defined on the GENJZRAL GPlB OUTPUT form, it is sent before a curve family or DC source-measure test is executed. The string can be used, for example, to set a bias voltage level, or trigger a matrix
relay setup, or set the temperature of a hot chuck.
The output strings can also be sent by themselves to troubleshoot specific named instruments. Responses from bus instruments are displayed on the form.
The GJZNERAL GPIB OTJTPUT form is accessed by pressing the <F5> key from the CURVE FAMILY TEST form or the DC SODRCE-MEASURE TEST form. When the GENERkL GPIB OUTPUT
form is exited, you are returned to the appropriate test form.
An example of a GENERAL GPIB OUTPUT form is shown in Figure 3-6, which is confqured to trigger a matrix relay setup on a Keithley Model 707 Switching Matrix. The top portion of the form lists
the output strings to send. The lower portion of the screen lists the available GPIB commands that
are executed with the iFlO> key.
3-30
Page 79

0
1
\
Instrument Name: MATRIX
0
2 M EOS Character: None <Upload from 707>
0
3
4-
0
output strings: <Download to 707>
/ 1. ROX
2. ElCAlX
3. FIX
4. H17X
GENERAL GPIB OUTPUT
707Name: -
Read String
SECTION 3
Measurements
8
-0
9
0
5-
0
GPIB Commands: <GPIB Send>
cGPIB Read>
<Group Execute Trigger (GET)>
<selected Device Clear>
<Send Interface Clear>
cRead SPOLL Byte>
Instrument Name: Type in desired instrument name (up to eight characters) or press <Enter> to display a pop-up menu of
1
0
previously defined names.
EOS Character: Press <Enter> to display pop-up menu of end of string characters. Selections are None, CRLF, CR, and
2
0
0
0
0
0
Decimal.
Output String: Type in up to four device-dependent command strings to output to the named instrument (up to 60 characters).
3
Read String: This window displays responses from the named instrument (up to 70 characters, including terminators).
4
GPIB Commands: These are the commands that can be sent to the named instrument. Select a command with the cursor,
5
then press tFlO> to execute a command.
8 SPOLL Byte: This window displays the serial poll byte response from the named instrument after the Read SPOLL Byte com-
mand is executed.
7 Status: This window displays the status of the requested operation, either pending or complete.
0
Enter string #to send: A pop-up is displayed when the cFlO> key is passed with the cursor on &PIB Send>.
Valid responses are 1-4 (sends single string) and l (sends all strings)..
707 Name: Type in desired instrument name (up to eight characters) or press <Enter> to display a pop-up menu of previously
8
0
defined names.
707 Commands: These are the commands that support uploading and downloading for the Model 707 Switching Matrix. Se-
9
0
lect a command with the cursor, then press cFlO> to execute.
Figure 3-9. GENERAL GPIB OUTPUT Form
3-31
Page 80

Measuremenfs
Active Function Keys
3.7.2
Fl -Help
F42lklt
FlO-Execute GPIB
ESC-Test Form
Parameter Description
Instrument Name
EOS Character
Provides on-line help information.
Prints the screen to a defined printer.
Performs the selected Gl?IB command. If GPIB Send, prompts you to enter
string number to send.
Exits GENERAL GPIB OUTPUT form and returns you to a test form
(curves or DC).
Press the <Enter> key to display a pop-up menu of the Instrument Names
INSTR
previously specified on the DEFINE
the name of any instrument.
Press the <Enter> key to display a pop-up menu listing the valid end of
string (EOS) characters. Select from the following, where “None” is the default:
UMENTS form. You can select
3.7.3
output strings
GPIB Commands
Use the cursor and cFlO> keys to execute the following commands:
Gl’lB Send
GPIB Read Reads a string from the named device and displays the result in the Read
This field specifies the strings to be sent to the named instrument (up to 60
characters). After entering the strings, move the cursor to the the GPIB
Send command and press cFlO>. You will be prompted to enter the individual string number or an asterisk (“1 to send all strings. The strings are
sent as data along with the selected EOS character after each string.
NOTE
The parameter values of Instrument Name, EOS Character, and
the first Output String are saved within .TST and .DAT files.
Sends the desired output string(s) to the named device.
NOTE
Up to four output strings can be sent when the GENERAL GPIl3
OUTPUT form is displayed. Only the first output string is sent
when a curve test or DC test is performed.
Sting window (up to 70 characters, including terminators).
3-32
Page 81

SECTION 3
Measuremenfs
Group Execute
Sends a trigger to the named device. For example, GET initiates a sweep if
Trigger (GET) a Model 236/237/238 is configured for an IEEE GET input trigger origin.
Selected Device Clear Clears a named instrument; returns it to power-up default conditions.
Send Interface Clear Places all bus instruments in the local, talker idle and listener idle state.
Read SPOLL Byte Obtains the serial poll byte from the named instrument and displays it in
the SPOLL Byte display field. See Figure 3-10 for the format of the POLL
byte for a Model 236/237/238.
82 Bl BO
4 2 1
= Warning
= Sweep Done
= Trigger Out
= Reading Done
1 = Compliance
11 SRQ by 236/237/238
1 =Error
1 = Ready for
Trigger
B6 85 84 83
011 O/l O/l
128 64 32 16 8
o/l o/l O/l on O/l
Figure 3-20.
3.7.4
GPIB Display Fields
Read String
SPOLL Byte
Status
3.7.5 Model 707 Fields
. 707Name
Model 236/237/238 Serial Poll Byfe Format
If the GPIB Read command is selected, the response horn the instrument is
displayed in this field (up to 70 characters, including terminators). This
could be a status word or measurement string, for example.
When the Read SPOLL byte command is selected, the serial poll byte re-
spdnse is displayed in this field.
The status of the requested comman d, either Operation Pending or Operation Complete, is displayed in this field.
Press the <Enter> key to display a pop-up menu of the Instrument Names
previously specified on the DEFINE INSTRUMENTS form. You can select
the name of any instrument. However, <Upload from 707> is permitted
only for type KI707.
3-33
Page 82

SECT-TON3
Measurements
Upload from 707
Use the cursor and cFlO> keys to execute this command. It uploads either
the current relay setup or up to 100 stored setups from the Model 707 to
computer memory. (See Figure 3-11.)
Store 707 File
J
A. Currant Relay Setup (Relay Step Pointer = 000)
w
B. 100 Stored Setups (Relay Step Pointer = 100)
Upload from 707
Figzue 3-12.
Uploading and Sfoting
Download to 707
~~~~~~~
Setups
Use the cursor and cFlO> keys to execute. It downloads either the current
relay setup or up to 100 stored setups from computer
memory to the
Model 707. (See Figure 3-12.)
Load 707 File
J
A. Current Relay Setup (Relay Step Pointer is ignored)
B. 100 Stored Setups (Relay Step Pointer is ignored)
3-34
Figzue 3-12.
Loading and Downloading Setups
Page 83

SECTION 3
Measurements
3.7.6
Uploading and Downloading
Relay setups from a standalone Model 707 or a Model 707 master/slave system can be uploaded
and downloaded through the previously described fields. This includes the required Model 707
handshaking if the instrument type for the named instrument (in the 707 Name field) is KI707.
There are several n&s of operation for this feature:
1. The value of the RELAY STEP pointer on the Model 707 determines how many setups are
uploaded. If the RELAY STEP equals 000, only the current relay setup is uploaded. If the RELAY
STEP equals from 001-100, that is how many stored setups are uploaded. The RELAY STEP
pointer is ignored on downloads.
2. The order of user actions affects the current relay setup in the Model 707 according to Table 3-2.
3. Model 251 software watts until the Model 707 reports that it has settled before sending the first
Output String. The Delay Before Curves will occur after the first Output String is sent.
4. Although setups are downloaded in binary format, the Model 707 determines the format by
checking the first byte for binary or ASCII data.
5.
You can specify another instrument type in the 707Name field. In this case, only downloading is
supported, with no handshaking or status checking. (See Table 3-3.)
6. A 707 file can have anything in it, including device-dependent commands for another instru-
ment. This can include binary data, although if the last character in the file is Control-Z (hex lA),
it is considered end-of-file and is not sent. As long as the first line contains an instrument name,
the file is sent over the GPIB bus to that insirumant.
Table 3-2 Order of User Actions
1 User Action
Model 251 Response
CASE 1
A. Change RELAY STEP to 050 on 707 front panel.
B. Select <Upload from 707> and &IO> from
A. None
B. Uploads 50 setups.
GPIB OUTPUT form.
C. Select <FlO>-Execute Test from a test form.
C. Executes test with setup 050.
CASE 2
A. Select Load 707 File.
A. Loads a 707 file that was previ-
ously created. (Assume 50 setups for this example.)
B. Select <Download to 707> and &IO> from
GPIB OTJTPUT form.
B. Downloads 50 setups, copies
setup 001 to setup 000 (relays),
sets RELAY STEP to 000.
C. Select <FlO>-Execute Test from a test form.
NOTE: In Case 1, if the GPlB OLITPUT form contains a
051.
In
Case
2,
the
test is executed with setup
Table 3-3.
Instrument Type Handshaking Uploading
KI236,KI237,Kl238
KI213-1,JCI213-2,KI213-3,KI213-4
la707
Uploading and Downloading Support for Instruments
001, which was previously copied to setup 000.
mmand to trigger the 707, the test is executed with setup
co
C. Executes test with
Other
setup 000.
Downloading
Page 84

SECTION 3
Uploading and Storing Setups
Refer to Figure 3-1lA for the current relay setup and Figure 3-1lB for up to 100 stored setups.
1. On the Model 707 front panel, set the RELAY STEP pointer to the desired number of setups. (Enter number on keypad, then press RELAYS key.)
For example: 000 - selects the current relay setup
001 - selects the stored setup 001
050 -selects stored setups 001-050
100 -selects stored setups 001-100
2. From the Model 251 Gl?lB OUTPUT form, press <Enter> at the 707 Name field to see a pop-up of
instrument names. Select the instrument name of the Model 707 and press <Enter>.
3. Upload setup(s) from the Model 707 by selecting the <Upload from 707> command and pressing
<FlO>.
4. Press &so until you return to the main menu. Save the setups to a 707 file by selecting File Op-
erations - Save
File - 707 File, and by naming it when prompted. Or, press cEso to a test form
and <F3> to save a file. Select Save 707 File and name it when prompted.
5.
Press cEso to return to the main menu.
Loading and Downloading of Setups
Refer to Figure 3-12A for the current relay setup and Figure 3-12B for up to 100 stored setups.
1.
From the Model 251 main menu, load a 707 file by selecting File Operations -Load File - 707 File.
2.
Press <Enter>
at
the File To Load prompt. Select a 707 file from the directory and press <Enter>.
Press <Eso until you return to the main menu.
NOTE
As an alternative to steps 1 and 2, load a file by pressing the <F2>
key from a test form.
3. Go to a test form, then press <F5> for the GPIB OTJTPUT form.
4. Press <Enter> at the 707 Name field to see pop-up of instrument names. Select the instrument
nlmPnC+han~~~,l?n?,-~ --a..-/l&4..-
*L-&c "I YLG I"I"Ucx I "I CULL4 y-rczm LLI1LCA/.
5. Download the setups contained in the 707 file by selecting the <Download to 707> command
and pressing &lo>.
3.7.7 System Troubleshooting with the GPIB Form
In addition to controlling instients other than Keithley Source Measure Units, the GENERAL
GPIB OTJTlWT form can be used to troubleshoot any instrument that is connected to the IEEE-488
bus. You can send device-dependent commands (DDCs) and read data from the instrument named
on the form.
Before using this form to troubleshoot, you should verify that the instruments are properly connected and configured, as follows:
336
1. On the IEEE-488 card, check the cable connection and hardware configuration. (See paragraph
2.2.3 for connections and paragraph 2.4.1 for configuration.)
2. On each instrument, check the bus cable connection and bus address. (See paragraph 2.2.3 for
connections and paragraph 2.3.5 for addresses.)
Page 85

SECTION 3
Measuremenis
3. Within Model 251 software, check that the parameters on the GPIB CONFIGURATION form
match those of your IEEE-488 card. (See paragraph 2.5.8.)
4. Also within Model 251 software, check that the parameters on the DEFINE INSTRUMENTS
form match those of your instrument setup. (See paragraph 2.5.9.)
If the instruxnents still do not respond, use the GENERAL GPIB OUI’PUT form to clear the bus and
attempt to communicate with one instrument:
1. If the Instrument Name field on the form is blank, move the cursor there and press the <Enter>
key to display the previously defined instruments. Use the cursor and <Enter> keys to select a
name.
2. Move the cursor to the <Send Interface Clear> GPIB Command and press the 6”10> key to execute the command. This places all bus instruments in the local, talker idle, and listener idle state.
3. Move the cursor to the elected Device Clean command and press the cFlO> key. This places
the named instrument in the power-up, device clear, selected device clear default conditions.
4. Try to get a simple response from the named instrument, such as the serial poll (SPOLL) byte. Do
this by moving the cursor to the <Read POLL Byte> command and pressing cFlO>. The SPOLL
Byte field should display a byte of data.
5. If unsuccessful, return to the previous procedure to verify connections and configurations with
a single instrument. If successful, continue with the next procedure.
The following example checks whether a Model 213 Quad Voltage Source outputs a specified
volt-
age, but it can be adapted to send DDCs and read the status of any bus instrument:
1. Enter the output strings shown in Figure 3-13. The first string programs port 1 of the Model 213
for 3 volts on the z!5V range; the second string requests the port 1 status.
2. Move the cursor to <Gl?IB Send> and press <FlO>. At the prompt for string number, type in “*I’.
The output strings are sent to the Model 213.
3. Move the cursor to <Gl?IB Read> and press <FlO>. The status word for port 1 of the Mode1213 is
displayed in the Read String display field.
3-37
Page 86

SECTlON3
Measwements
Instrument Name: SUBSTRAT
EOS Character: None
Output Strings:
1. CO Pl A0 R2 V3 X
2. UlX
3.
-Q GENERAL GPIB OUTPUT p
Read String
OOOlPlR2V+03.
707 Name:
<Upload from 707>
<Download to 707>
GPIB Commands: <GPIB Send>
Fl-Help F4-Print FlO-Execute GPIB
<GPIB Read>
<Group Execute Trigger (GET)>
<Selected Device Clear>
<Send Interface Clear>
<Read SPOLL Bvte>
Figure 3-13. Checking Status of Model 213
ESC-Test Form
3-38
Page 87

SECTION 4
4.1 INTRODUCTION
This section includes detailed information on displaying data in various forms. Section 4 contains
the following information:
4.2 Display Overview: Provides overview information on data display and gives a basic step-bystep procedure for display operation.
4.3 Display Parameters: Details programmin
way data is displayed.
4.4 Graphics Display: Describes data plotting and the available graphical analysis tools.
4.5 List Data: Covers methods to list numeric data from both DC and curve tests on the computer
SC!ESl.
Dgtg
g of the display parameters, which are to define the
Display
I---
4.6 Printing and Plotting: Gives procedures for obtaining hard copy of data display information
using a printer or plotter.
4.7 Display Examples: Summarizes step-by-step procedures for performing common display
tasks.
Error messages associated with display operations are covered in Appendix B.
4-l
Page 88

SECiTOiV4
Data Display
4.2 DISPLAY OVERVIEW
The general steps below outline the basic procedure for graphing or listing data. Detailed information for each step is located in the remainder of this section. These steps assume that you have already set up system hardware and software as discussed in Sections 2 and 3. Detailed procedures
for typical graphics applications are covered in paragraph 4.7.
Step 1: Acquire Data
You must, of course, have your data in computer memory before attempting to display it. If you
have already acquired data in a previous session and have saved it on disk, use the Load Data selection in the FILE OPERATIONS menu to load the desired data file. If you are executing a test, the
data will be automatically displayed as part of the test procedure.
Step 2 Choose Display Parameters
From a test form screen, press the F7 key to bring up the DISPLAY Pm screen. You can
use the various parameters on this screen to tailor the way your data is displayed. For example, the
Mode parameter allows you to choose between Graphics and List (The Graphics mode graphs data,
while List displays data in numeric form). See paragraph 4.3 for details on the various parameters
for the graphics mode. Display parameters for the list mode are covered in paragraph 4.5.
Step 3: Display Data
FromtheDISPLAYPARAMETERs screen, press the F8 key to display your data. If you have chosen
the Graphics mode, your data will be plotted on the screen. With the List mode, the numeric values
of arrays or variables will be displayed. Paragraph 4.4 covers the graphics screen mode in detail,
while information on the list mode may be found in paragraph 4.5.
Step 4: Analyze Data
If you have graphed your data, you can use a variety of graphical analysis tools to manipulate and
analyze that data. For example, you can use the Markers and Lines tools to determine data point
values, curve slopes and axis intercept points. The Vertical zoom and Horiz. zoom tools allow you
enlarge a portion of the graph for more detailed analysis, while the Filter tool can be used to smooth
curves, minimizing noise. Graphical analysis tools are covered in detail in paragraph 4.4.
Step 5: Print or Plot Data
You can obtain a hard copy of your data by pressing F3 to plot (graphics screen only) or F4 to print
on your printer while data is being displayed. In order to plot or print properly, you must have the
software properly configured (paragraph 2.4). Paragraph 4.6 gives more information on printing
and plotting.
4-2
Page 89

4.3 DISPLAY PARAMETERS
SECTION 4
Data Display
4.3.1
Display Parameters Screen
The DISPLAY PARAMETERS
such as selecting graphics or data list mode, arrays to plot, and grid, axis, and line parameters (la-
bels, colors and type).
Parameters on the DISPLAY PARAMETERS
data file. Thus, it is not necessary to access this screen after loading a test setup or
data file, unless, of course, you wish to make changes to the way your data is displayed.
The following paragraphs discuss each of these aspects in detail
Entering the DISPLAY PARAMETERS Screen
To access the DISPLAY PARAMETERS screen, press F7 from the Graphics Display screen, a List
Display screen, or the CURVE FAMILY TEST screen Note that you cannot display the graphics
mode screen from the DC SOURCE-MEASURE TEST screen.
DISPLAY PARAMETE RS Screen Format
screen allows you to program various aspects of your data display,
NOTE
screen are saved with a test setup or
The general format of the DISPLAY PARAMETE
Figure 41, which shows the default values for the various selections on the screen. The top part of
the screen includes prompts for general graphics parameters, while the form at the center left of the
screen includes selections for specific parameters for both X and Y axes. The bottom of the screen
includes selections for additional graphics parameters that control grids, labels, colors, and gain
values.
RS screen in the Graphics mode is shown in
4-3
Page 90

SECZOA74
Data Display
DISPLAY PARAHETERS DISPLAY PARAHETERS
Bcalc: Auto Bcalc: Auto
Colors/Curve Labels Colors/Curve Labels
FL-Help F4-Print
FL-Help F4-Print
Mode: Select Graphics to graph (curve test only); List to list numeric data.
1
0
2 Graph Title: Type in desired graph title (50 characters maximum).
0
3 Scale: Select Auto to auto-scale axes maximum, minimum, and number of divisions. Select manual to manually set scaling
0
(set parameters as below).
Axis: Type in parameters for X, Yl, and Y2 (optional) axis. Linear/Log and # of Div of Y2 are the same as those chosen for Yl .
4
0
5 Grid: Select Grid On (Dotted grid lines) or Grid Off (tick marks on axis).
0
5 Labels: Type in desired labels for each axis (default labels are array names).
0
7 Colors/Curve Labels: Select to choose graph colors and step value labels (Figure 4-2).
0
8
0
9
0
10 Overlay Form: Choose to define filename and arrays to overlay data on existing graph (Figure 4-5).
0
Array Name: Defines array to plot along selected axis.
Linear/Log: Selects linear or base 10 log plotting.
Min: Defines X, Yl, or Y2 axis minimum value (Manuel scaling only).
Max: Sets X, Yl, or Y2 axis maximum value (Manual scaling only).
# of Div: Sets number of major divisions, I-1 5 (Manual scaling only).
DC-Gain: Select to calculate DC gain of user-defined arrays (Figure 4-3).
Differential Gain: Select to calculate small-signal gain (Figure 44).
F&View
F&View
FLO-Execute Test
FLO-Execute Test
ESC-Test Form ESC-Test Form
Figure 4-1. DISPLAY PARAMETERS Screen (Graphics Model
I
4-4
Page 91

SECTION 4
Data Display
Entering Parameters
You can control cursor movement around the screen by using the cursor keys. Use the up and down
cursor keys to move the cursor among the various individual parameter selections, and use the left
and right cursor keys or the Tab key to move from left to right for lines which have multiple selec-
iiOnS.
Once the cursor is on the desired parameter, you can select that parameter by pressing the <Enter>
key. The parameter will either become highlighted to show that it is selected, or (with some parameters), pressing <Enter> will toggle between parameter selections or display a pop-up menu. For example, placing the cursor on Mode and pressing cEnten will toggle the display mode between
Graphics and List. With others parameters, you must type in names or numeric values and then
press &nter, to complete the process. Examples of parameters which require numeric entry are
theMinandMaxparameterswhicharethe minimum and plaximum scaling parameters used when
manually-sca.hng the X and Y axes. Keep in mind
For example, “M” = mega,
“m” = a, “P” = p&a and “p” = pica.
that
engineering unit symbols are case sensitive.
While entering these names or numeric value parameters, you can use the standard editing keys
(left and right cursor, Backspace, Delete, Insert, Home, and End) to edit your entry, and you can use
the &so key to cancel a new entry and leave the parameter unchanged. After entering the parame-
ter, press <Enter> to complete the entry process; pressing up or down cursor will also complete parameter entry and move the cursor to the next parameter. If entering an array name that doesn’t
exist, the pop-up array list will be displayed. From that list, you can select a valid array. .
To blank an entry field, first position the cursor over the desired parameter, and press the <Space>
key.
Selecting Pop-Up Menu Parameters
You can move among several parameters in pop-up menus in the same manner. For all pop-up win-
dows that require two or more parameters, pressing the <Eso key accepts all parameters in the
window and closes the window.
Active Function Keys
The following functions keys are active while in the DISPLAY I?
Fl-Help
F4 (Rint)
F8-View
Provides online help information.
Prints the screen to a defined printer.
Displays graph of data, accesses graphical analysis tools.
AR4METEXS screen:
FlO-Execute Test Executes test based on selected test parameters.
Esc-Test Form Exits DISPLAY PARAMETER
screen and returns to test form.
NOTE
The functions keys are not active while a pop-up menu is being displayed. You must
first close the window by pressing &so before using a function key.
Page 92

SEClTON 4
Data Display
43.2
Parameter Description
General Graphics Parameters
Mode
Graph Title
Scale
Press the <Enter> key to toggle between two basic display modes:
Graphics or List.
The Graphics mode is the default display mode for curve family tests, and
it is used to display data in graphical form (the Graphics mode is not available for J3C tests). You can display your graph by pressing l?8 after editing
display parameters (refer to paragraph 4.4 for details). The List mode al-
lows you to list your data in numeric form on the screen. See paragraph
4.5. for complete details on using List.
Selecting Graph Title will allow you to type in a string of up to 50 characters to title your graph. You can use the standard cursor and editing keys
to edit your entry. press <Enter, after typing in the desired characters to
complete the entry process. The Graph Title will be displayed at the top of
the graph.
Press <Enten to toggle between the two scale selections: Manual and
Auto.
Choosing Manual scaling give you the flexibility of selecting the maximumand
Y axes (see below). The Auto scale mode provides for optimum display of
the graph based on measurement results.
Axes Parameters
The parameters discussed below can be individually selected for the X and Y axes of the graph. You
can specify parameters for two Y axes called Yl and Y2. In most cases, you would use only the Yl
axis parameters, but some plots (for example, Gummel plots) require that the Y2 parameters be
specified. The Y2 axis will be displayed only if you specify an array name in the Y2 column.
To select a parameter for a specific axis, be certain you are selecting the parameter in the appropriate
column CC, Yl, or Y2). Place the cursor over the desired parameter, then press <Enter> to select it.
Gnlythearraynameandthe minimum and maximum values can be selected for the Y2 axis. The Y2
linear/log status and number of divisions will be the same as those selected for the YI axis.
minimum values and the number of divisions for both the X and
NOTE
When Manual scaling is selected, a curve will be graphed
on the screen after each sweep. With Auto, however, the
graph will not be generated until all data is taken.
Page 93

SECTION 4
Data Display
Array Name
Linear/Log
This parameter specifies the names of the X, Yl, and Y2 axis arrays to
graph. The Array Name should be specified as a string of up to eight
characters.
You can either type in the desired name directly, or simply press the <Enter> key to pop up a list of available array names (as when editing a test
form). Use the cursor keys to select the Array Name, then press <Enter> to
complete the selection.
Time arrays are created when measure arrays are named on the CURVE
FAMILY TEST form. The time arrays are called SWPTIME, STEPTIME,
SYNCTIME, BITIME, B2TlhE, and B3TIME for the respective channels.
They are filled with elapsed time data during acquisition for channels
with measure
array names. They can be specified on the DISPLAY PA-
RAMETERS form to view data versus time.
Up to 24 array names can be defined, but only eight will be displayed at a
time. Use the up and down cursor keys to scroll among array names, or use
Page Up and Page Down to select the three pages.
Use the <Enter> key to toggle between Linear and Log Chase 10 Logarithmic) axis formats.
Mill
MaX
The Linear option is the default mode for the X, Yl and Y2 axes. Note that
youcanselectLinearfortheXaxisandLogfortheYlaxis(orviceversa),if
desired. Note that the Y2 axis follows the selection for the Yl axis.
NOTE
Negative or zero values cannot be graphed using the log
axis. The absolute value of negative values will be used for
the graph. For a zero value, a value that corresponds to the
minimum resolution of the selected measurement iimction of the Source Measure Unit will be used for the graph.
Ministheminim um endpoint for the X, Yl, or Y2 axis. To enter Mm, type
in the desired numeric value in floating-point format, then press <Enter>.
Note that Min can be programmed only when manual scaling is selected.
Maxisthemaxnn um endpoint for the X, Yl, or Y2 axis. Enter Max by typing in the desired number in floating point format and then pressing the
<Enter> key. Max can be selected only if manual scaling is selected.
Notes:
1. When manually setting the axes of the graph, it is typical to select Min
and Max values that will accommodate all expected data. Otherwise,
data that falls outside the defined axes will not be displayed. Keep in
mind that Min and Max axis values can be changed after a’ test is exe-
4-7
Page 94

SECTlION 4
cuted. After modifying the Mm and Max values, the new graph can
then be displayed cF8>.
2. Maximum resolution for Mm and Max values is five digits.
3. Min values must be less than Max values, otherwise an Invalid Scaling
Parameters error will result.
4. Engineering unit symbols are case sensitive (i.e., ‘T“ = peta, “p” =
pica, ‘W = mega, “m” = miDi).
#ofDiv
Additional Graphics Parameters
Grid This option allows you to turn the grid on or off. Use the <Enter> key to
X Label/
Yl Label/
Y2 Label
Colors/
Curve Labels Figure 42.
# of Div defines the number of major divisions for each axis and is programmed as a positive integer. This option is not valid for an axis that is
defined as having a log format specified. Note that the number of divisions can be defined only for manual scaling. The minimum value for # of
Div is 1 and the maximum value is 15.
toggle between Grid Off and Grid On (default is Grid On). Note that grid
lines are dotted (not solid) lines. When the grid is turned off, tick marks
will appear on the X and Y axes.
These options allow you to enter X axis and Yl and Y2 axis label string up
to a maximum of 30 characters. The entered suing will be used to label the
corresponding axis instead of the default label string, tihich is the array
name chosen in the Axis parameters table (and assigned when you set up
your test form).
If you change the array name after entering a label, the corresponding label will be automatically replaced with the new array name.
Selecting Colors/Curve Labels will open the pop-up menu shown in
4-8
You can select Axes, and Markers colors by placing the cursor over the desired selection and then pressing the <Enter> key to cycle through the
various color selections. Press cursor down or cursor up after displaying
your selection to move on to the next parameter.
.The curve attributes can be individually selected for both Yl and Y2 and
include:
Multiple Colors (for more than one curve): If selected, multiple curves will
be plotted in different colors, as selected by the software. Colors used for
the background and axes will not be used for curves.
One Color: All curves will be plotted using one color. You can cycle
through the available colors by using the <Enter> key.
Page 95

Mode: Graphrcs
SECTION 4
Data Display
Axis Labels: You can individually select the desired color for each label;
press the <Enten key to cycle through available colors.
Step Value Labels: Enabling this attribute will label one end of each curve
on a multiplstep array. For example, when plotting common-emitter characteristics,
curves would typically be labeled with base current values.
Line Symbols: The Line Symbols atfribute allows you to select the type of
line used for the graph itself. Both solid and dashed lines are available, and
they can be selected with the <Enter> key.
DISPLAY PARAMETERS
e graph. The graph will be labeled with values from the
Graph Title:
Scale:
Yl Label:
Y2 Label:
Colors/Curve Labels
DC-GainfRatioj
Differential Garn
Overlay Form
FL-Help F4-Print F&View FLO-Execute Test
Axes and Markers Colors: Use Enter key to cycle through available colors for axes and markers.
1
0
Color Attributes: Use Enter
2
0
3 Step Value Labels: Select Yes to turn on curve step value labeling (curves will be labeled with values from step array).
0
4 tine Symbols: Use enter key to choose desired line type: solid or dashed
0
NOTE: Press
Auto
Axes: Brt White
Markers: Yellow
to
choose multiple colors or one color parameters and axis label colors.
cE.se
to accept displayed parameters and close window.
ESC-Test Form
Figure 4-2. Colors/Curve Labels Window
4-9
Page 96

SECTION 4
Data Disvlau
DC
-Gain
As the name implies, DC-Gain provides calculation of DC Gain. You can
use this feature to calculate the beta of a bipolar transistor or to display the
ratio between any two variables (DC tests) or variable arrays (curve tests).
The results of the DC gain computation will be appended to the list of variables on the DISPLAY PARAMETIZS screen. You can then graph or list
the results as you would any other array or variable. The arrays of the calculated values for CLXVE FAMILY test can be displayed on the graph or
listed on the List Display if you select it for the display.
The entire formula may be modified. Any name may be substituted for
beta, the numerator or the denominator. The system sees the equation as
follows:
NAME=(ARRAYl/ARRAY2)*#
where name is your choice of a legal name, ARRAY1 and ARRAY2 are any
arrays you choose, and # can be any value from -1e32 to le32.
This equation will allow you to perform flexible, general computations.
When displaying a graph, moving Marker 1 provides a readout of calculated values at the top of the screen. The calculated values for DC test can
be listed on the Data points L&t Display. See paragraph 4.5 for listing de-
tails.
To use this feature, position the cursor over DC-Gain, then press <Enter>.
The window shown in Figure 4-3 will then pop up on the screen
TheDCgainisaduallytheratiobetweentwouser-definedvariablesorarrays. You can change the word “Beta” to any desired name of eight characters or less by selecting the “Beta” field (position the cursor, then press
<Enter>). .
You can enter the array or variable names by typing them in, or by pressing the <Enter> key after positioning the cursor over the desired variable
field. A list of available variable or array names will then pop up on the
screen. Use the cursor keys to select the desired variable name, then press
the <Enter> key.
After entering the array or variable names, enable the calculation by selecting “Calculation: On”, and execute the test to acquire DC gain data.
Whenever the cakulation is changed, be sure to m-execute the test to up-
date the DC gain data.
NOTE
Any calculation with zero in the denominator results in a
reading of le32.
4-10
Page 97

Mode: Graphics
Graph Title:
Scale: Auto
AxiS
Array Name
Linear/Log
Mill
Max
# of Divisions
Grid: On
X Label:
Yl Label:
Y2 Label:
Colors/Curve Labels
DC-Gain (Ratio)
Differential Gain
0verlav Form
1
0
’ DISPLAY PARAMETERS
/
Beta =(
Calculation: Off
\\ I
wwww
DC-Gain (Ratio) Calculation
/
nnnn
1 +1
SECTION 4
Data Display
DC Gain Array Name: Defines DC gain array name to plot or list. Default is Beta, but name can be changed, if desired (Four
1
0
characters maximum). :
Numerator: Select desired numerator array for DC gain calculation (either type in name or press Enter to view available array
2
0
names).
Denominator: Select denominator array for calculation (type in name or press Enter to view names).
3
0
Multiplier: Equation may incorporate any value within the range from zero to 1 e32.
4
0
Calculation: Select On to enable calculation, Off to disable calculation. When enabled, DC gain array will be available for
5
0
listing and graphing, and DC gain value will appear at top of graphics screen.
NOTE: Press CESO to accept displayed parameters and close window.
Figure 4-3. DC Gain. Window
4-11
Page 98

SECTION 4
Data Disvh
Differential Gain The differential gain parameter allows you to calculate the small signal
gain for a device. The default name is gm (transconductor) for FETs but
can be changed to a different name. You can differentiate Along Curves or
differentiate Between Curves.
You can enter this selection by positioning the cursor over Differential
Gain, and pressing cEnten. The pop-up window shown in Figure 44 will
appear on the screen.
Parameter entry is similar to that discussed for DC-Gain above. The displayed differential gain name (gm) can be changed to a new name up to
eight characters long. The new name will be added to the pop-up array list
when the test is executed. The numerator and denominator array names
used for the calculation can be typed in or selected from the pop-up array
list. The pop-up array list is displayed by pressing <Enter> while the cursor is positioned over the desired variable field.
Alternate differentiation type (Between Curves or Along Curves) is se-
lected by placing the cursor over the Differentiate field and pressing <Enten. The display will toggle to the alternate selection. Like DC-gain, Differential Gain is enabled by selecting “Calculation: On”. Note that the test
must
be executed to acquire differential gain data. Any time the cakulaiion is changed, be sure to reexecute the test to update the differential
gain data.
Most arrays are valid for differentiation cakulations. The exceptions are as
follows.
Differentiate Between Curves - you cannot use a SWEEP~SOURCE
array or BIAS-SOURCE array in the calculation.
Differentiate Along Curves -
You cannot use a STEP~SOURCE array
or BIA!3SOURCE array in the calculation.
The following example shows how gm (along curves> is calculated if the
array names are Id (STEI~MEASURE array) and Vgs (SWEEP~SOURCE
array):
gm = k%Id)/d(Vgs)) *I
If an invalid calculation is entered an error message will appear and you
will not be able to exit (<Eso) from the ‘Differential Gain Calculation”
mode. Either enter a valid calculation or disable the calculation (Calcula-
tion: Off).
412
Page 99

Mode: Graphics
Graph Title:
Scale: Auto
E
# of Divisions
Grid: On
X Label:
Yl Label:
Y2 Label:
Colors/Curve Labels
DC-Gain (Ratio)
Differential Gain
Diiereniiate: Between curves (at constant sweep)
Calculation: Off
\
6
0
SECTION 4
Dafa Display
Differential Gain Array Name: Defines differential gain array to plot or list. Default is gm, but name can be changed, if desired
1
0
(for characters maximum).
Numerator: Select desired numerator array for gm calculation (either type in name or press Enter to view available names).
2
0
Denominator: Select denominator array for calculation (type in name or press Enter to view names).
3
0
Multiplier: Equation may incorporate any value within the range from -1 e32 to 1 e32.
4
0
Differentiate: Select differentiation type; Between Curves or Along Curves.
5
0
Calculation: Select On to enable calculation, Off
for listing and plotting, and DC gain value will appear at top of graphics screen.
NOTE: Press CESQ to accept displayed parameters and close window.
Figure 4-4. Differenfial Gain Menu
to
disable calculation. When enabled, differential gain array will be available
4-13
Page 100

SECTION 4
Data Display
After acquiring differential gain data, use Marker 1 (on the Graphics Display Screen) to provide a readout of the calculated gm gain values. The
readout is located at the top right-hand side of the screen. The gain data
can be graphed by entering the array name in the “DISPLAY PARAME-
TEES” graphics screen then tiewing it (F8).
You can also list the calculated array as discussed in paragraph 4.5.
Notes:
1. For best accuracy when calculating gain between curves, you should
program the step source for as small a value as possible if using the
step source array in the equation.
2. A graph must contain at least three curves in order to calculate differential gain between curves.
3. Any calculation with zero in the denominator results in a reading of
le32.
Overlay Form
Overlay Form allows you to compare sets of data by overlaying their plots
on the same graph The data currently residing in
memory can
be
com-
pared with similar data in disk files that you specify. For example, you
may wish to compare the common-source curves for two similar transis-
tors to note similarities among various samples of the same type or compare a curve to high and low limit curves previously acquired, or compare
a curve to theoretical data imported from spreadsheet.
To use this feature, place the cursor over the Overlay Form and then press
<Enter>. The Overlay Data window shown in Figure 4-5 will appear on
the screen and the cursor will be located on the first Data File field. Notice
that the path names are automatically included in the data file fields. To
enter a data file name, first press <Enter> to position the cursor after the
path name and then type in the name of the data file (be sure to include the
.DAT extension). With the complete path and data file name displayed,
again press <Enter>. Enter the X and Y array names to overlay by typing in
each desired array name and pressing <Enten. Repeat the process for the
second overlay data set, if desired.
Once you have selected your overlay data, you can display the complete
graph, including the overlay data by using the Overlay tool available from
the graphical analysis screen (see paragraph 4.4). Note that if an invalid
data file or array name is entered in the overlay form, nothing will happen
when the overlay tool is used.
4-14
In order to distinguish between the main and overlay data on the graphs,
the overlay data uses different line types. A long dashed line will be used
for the first data set, and a shorter dashed line will be used for the second
data set.
Selecting Horizontal Zoom, Vertical Zoom, Restore, Autoscale, Filter, XInvert or Y-Invert will remove the overlayed graph(s) from the display.
 Loading...