

Page 1

User Manual
1502C
Metallic Time-Domain Reflectometer
070-7169-05
This document applies for firmware version 5.04
and above.
www.tektronix.com
Page 2

Copyright © T ektronix, Inc. All rights reserved.
T ektronix products are covered by U.S. and foreign patents, issued and pending. Information in this publication supercedes
that in all previously published material. Specifications and price change privileges reserved.
T ektronix, Inc., P.O. Box 500, Beaverton, OR 97077
TEKTRONIX and TEK are registered trademarks of T ektronix, Inc.
Page 3

WARRANTY
T ektronix warrants that the products that it manufactures and sells will be free from defects in materials and
workmanship for a period of one (1) year from the date of shipment. If a product proves defective during this
warranty period, T ektronix, at its option, either will repair the defective product without charge for parts and labor,
or will provide a replacement in exchange for the defective product.
In order to obtain service under this warranty, Customer must notify Tektronix of the defect before the expiration
of the warranty period and make suitable arrangements for the performance of service. Customer shall be
responsible for packaging and shipping the defective product to the service center designated by T ektronix, with
shipping charges prepaid. Tektronix shall pay for the return of the product to Customer if the shipment is to a
location within the country in which the T ektronix service center is located. Customer shall be responsible for
paying all shipping charges, duties, taxes, and any other charges for products returned to any other locations.
This warranty shall not apply to any defect, failure or damage caused by improper use or improper or inadequate
maintenance and care. T ektronix shall not be obligated to furnish service under this warranty a) to repair damage
resulting from attempts by personnel other than T ektronix representatives to install, repair or service the product;
b) to repair damage resulting from improper use or connection to incompatible equipment; c) to repair any
damage or malfunction caused by the use of non-T ektronix supplies; or d) to service a product that has been
modified or integrated with other products when the effect of such modification or integration increases the time
or difficulty of servicing the product.
THIS WARRANTY IS GIVEN BY TEKTRONIX IN LIEU OF ANY OTHER WARRANTIES, EXPRESS
OR IMPLIED. TEKTRONIX AND ITS VENDORS DISCLAIM ANY IMPLIED WARRANTIES OF
MERCHANTABILITY OR FITNESS FOR A PARTICULAR PURPOSE. TEKTRONIX’
RESPONSIBILITY TO REPAIR OR REPLACE DEFECTIVE PRODUCTS IS THE SOLE AND
EXCLUSIVE REMEDY PROVIDED TO THE CUST OMER FOR BREACH OF THIS WARRANTY.
TEKTRONIX AND ITS VENDORS WILL NOT BE LIABLE FOR ANY INDIRECT , SPECIAL,
INCIDENTAL, OR CONSEQUENTIAL DAMAGES IRRESPECTIVE OF WHETHER TEKTRONIX OR
THE VENDOR HAS ADVANCE NOTICE OF THE POSSIBILITY OF SUCH DAMAGES.
Page 4

Contacting Tektronix
Phone 1-800-833-9200*
Address Tektronix, Inc.
Department or name (if known)
14200 SW Karl Braun Drive
P.O. Box 500
Beaverton, OR 97077
USA
Web site www.tektronix.com
Sales support 1-800-833-9200, select option 1*
Service support 1-800-833-9200, select option 2*
Technical support Email: techsupport@tektronix.com
1-800-833-9200, select option 3*
1-503-627-2400
6:00 a.m. – 5:00 p.m. Pacific time
* This phone number is toll free in North America. After office hours, please
leave a voice mail message.
Outside North America, contact a Tektronix sales office or distributor; see
the Tektronix web site for a list of offices.
Page 5

Table of Contents
General Information vii. . . . . . . . . . . . . . . . . . . . . . . . . . . . . . . . . . . . . . . .
Installation and Repacking viii. . . . . . . . . . . . . . . . . . . . . . . . . . . . . . . . . . . . . . . . . .
Safety Summary xi. . . . . . . . . . . . . . . . . . . . . . . . . . . . . . . . . . . . . . . . . . .
Operating Instructions 1–1. . . . . . . . . . . . . . . . . . . . . . . . . . . . . . . . . . . . . .
Overview 1–1. . . . . . . . . . . . . . . . . . . . . . . . . . . . . . . . . . . . . . . . . . . . . . . . . . . . . . .
Preparing to Use the 1502C 1–5. . . . . . . . . . . . . . . . . . . . . . . . . . . . . . . . . . . . . . . . .
Display 1–6. . . . . . . . . . . . . . . . . . . . . . . . . . . . . . . . . . . . . . . . . . . . . . . . . . . . . . . . .
Front-Panel Controls 1–7. . . . . . . . . . . . . . . . . . . . . . . . . . . . . . . . . . . . . . . . . . . . . .
Menu Selections 1–8. . . . . . . . . . . . . . . . . . . . . . . . . . . . . . . . . . . . . . . . . . . . . . . . . .
T est Preparations 1–12. . . . . . . . . . . . . . . . . . . . . . . . . . . . . . . . . . . . . . . . . . . . . . . . .
Cable T est Procedure 1–14. . . . . . . . . . . . . . . . . . . . . . . . . . . . . . . . . . . . . . . . . . . . . .
Additional Features (Menu Selected) 1–29. . . . . . . . . . . . . . . . . . . . . . . . . . . . . . . . . .
Operator Tutorial 2–1. . . . . . . . . . . . . . . . . . . . . . . . . . . . . . . . . . . . . . . . . .
What is the Tektronix 1502C? 2–1. . . . . . . . . . . . . . . . . . . . . . . . . . . . . . . . . . . . . . .
How Does It Do It? 2–1. . . . . . . . . . . . . . . . . . . . . . . . . . . . . . . . . . . . . . . . . . . . . . .
You, the Operator 2–1. . . . . . . . . . . . . . . . . . . . . . . . . . . . . . . . . . . . . . . . . . . . . . . . .
Menus and Help 2–1. . . . . . . . . . . . . . . . . . . . . . . . . . . . . . . . . . . . . . . . . . . . . . . . . .
Getting Started 2–2. . . . . . . . . . . . . . . . . . . . . . . . . . . . . . . . . . . . . . . . . . . . . . . . . . .
The Waveform Up Close 2–5. . . . . . . . . . . . . . . . . . . . . . . . . . . . . . . . . . . . . . . . . . .
A Longer Cable 2–7. . . . . . . . . . . . . . . . . . . . . . . . . . . . . . . . . . . . . . . . . . . . . . . . . .
Ohms-at-Cursor 2–8. . . . . . . . . . . . . . . . . . . . . . . . . . . . . . . . . . . . . . . . . . . . . . . . . .
Noise 2–11. . . . . . . . . . . . . . . . . . . . . . . . . . . . . . . . . . . . . . . . . . . . . . . . . . . . . . . . . .
Set Ref (Delta Mode) 2–13. . . . . . . . . . . . . . . . . . . . . . . . . . . . . . . . . . . . . . . . . . . . . .
VIEW INPUT 2–17. . . . . . . . . . . . . . . . . . . . . . . . . . . . . . . . . . . . . . . . . . . . . . . . . . .
STORE and VIEW STORE 2–18. . . . . . . . . . . . . . . . . . . . . . . . . . . . . . . . . . . . . . . . .
VIEW DIFF 2–20. . . . . . . . . . . . . . . . . . . . . . . . . . . . . . . . . . . . . . . . . . . . . . . . . . . . .
Menu-Accessed Functions 2–21. . . . . . . . . . . . . . . . . . . . . . . . . . . . . . . . . . . . . . . . . .
TDR Questions and Answers 2–26. . . . . . . . . . . . . . . . . . . . . . . . . . . . . . . . . . . . . . . .
Options and Accessories 3–1. . . . . . . . . . . . . . . . . . . . . . . . . . . . . . . . . . . . .
Option 04: YT-1 Chart Recorder 3–1. . . . . . . . . . . . . . . . . . . . . . . . . . . . . . . . . . . . .
Option 05: Metric Default 3–1. . . . . . . . . . . . . . . . . . . . . . . . . . . . . . . . . . . . . . . . . .
Option 07: YT-1S Chart Recorder 3–1. . . . . . . . . . . . . . . . . . . . . . . . . . . . . . . . . . . .
Power Cord Options 3–1. . . . . . . . . . . . . . . . . . . . . . . . . . . . . . . . . . . . . . . . . . . . . . .
T est data record Option 3–2. . . . . . . . . . . . . . . . . . . . . . . . . . . . . . . . . . . . . . . . . . . .
Option DE 3–2. . . . . . . . . . . . . . . . . . . . . . . . . . . . . . . . . . . . . . . . . . . . . . . . . . . . . .
Accessories 3–2. . . . . . . . . . . . . . . . . . . . . . . . . . . . . . . . . . . . . . . . . . . . . . . . . . . . . .
Appendix A: Specifications A–1. . . . . . . . . . . . . . . . . . . . . . . . . . . . . . . . . . .
Electrical Characteristics A–1. . . . . . . . . . . . . . . . . . . . . . . . . . . . . . . . . . . . . . . . . . .
Environmental Characteristics A–3. . . . . . . . . . . . . . . . . . . . . . . . . . . . . . . . . . . . . . .
Certifications and Compliances A–4. . . . . . . . . . . . . . . . . . . . . . . . . . . . . . . . . . . . . .
Physical Characteristics A–5. . . . . . . . . . . . . . . . . . . . . . . . . . . . . . . . . . . . . . . . . . . .
Appendix B: Operator Performance Checks B–1. . . . . . . . . . . . . . . . . . . .
Appendix C: Operator Troubleshooting C–1. . . . . . . . . . . . . . . . . . . . . . . .
Error Messages C–3. . . . . . . . . . . . . . . . . . . . . . . . . . . . . . . . . . . . . . . . . . . . . . . . . . .
1502C MTDR User Manual
i
Page 6

Table of Contents
Appendix D: Application Note D–1. . . . . . . . . . . . . . . . . . . . . . . . . . . . . . . .
Pulse Echo Testing of Electrical Transmission Lines
Using the Tektronix Time-Domain Reflectometry Slide Rule D–1. . . . . . . . . . .
T erms and Symbols D–1. . . . . . . . . . . . . . . . . . . . . . . . . . . . . . . . . . . . . . . . . . . . . . .
Relationships D–2. . . . . . . . . . . . . . . . . . . . . . . . . . . . . . . . . . . . . . . . . . . . . . . . . . . .
VSWR vs. Percent Reflected Voltage D–2. . . . . . . . . . . . . . . . . . . . . . . . . . . . . . . . .
Return Loss (dB) vs. Percent Reflected Voltage D–3. . . . . . . . . . . . . . . . . . . . . . . . .
Percent Reflected Voltage vs. Characteristic Line Impedance D–4. . . . . . . . . . . . . .
Percent Reflected Voltage vs. Load Resistance D–6. . . . . . . . . . . . . . . . . . . . . . . . . .
Characteristic Line Impedance or Load Resistance vs. Reflection Amplitude D–6. .
Centimeters vs. Inches or Meters vs. Feet D–7. . . . . . . . . . . . . . . . . . . . . . . . . . . . . .
Dielectric Constant vs. Velocity Factor D–8. . . . . . . . . . . . . . . . . . . . . . . . . . . . . . . .
Time vs. Short Distances, in Centimeters or Inches (any dielectric) D–8. . . . . . . . . .
Time vs. Long Distances, in Meters or Feet (any dielectric) D–9. . . . . . . . . . . . . . . .
Glossary
Index
ii
1502C MTDR User Manual
Page 7

List of Figures
Table of Contents
Figure 1–1: Rear Panel Voltage Selector, Fuse, AC Receptacle 1–2. . . . .
Figure 1–2: Display Showing Low Battery Indication 1–3. . . . . . . . . . . . .
Figure 1–3: 1502C Front-Panel Controls 1–5. . . . . . . . . . . . . . . . . . . . . . .
Figure 1–4: Display and Indicators 1–6. . . . . . . . . . . . . . . . . . . . . . . . . . . .
Figure 1–5: Vp Set at .30, Cursor Beyond Reflected Pulse
(Set Too Low) 1–13. . . . . . . . . . . . . . . . . . . . . . . . . . . . . . . . . . . . . . . . . . .
Figure 1–6: Vp Set at .99, Cursor Less Than Reflected Pulse
(Set Too High) 1–13. . . . . . . . . . . . . . . . . . . . . . . . . . . . . . . . . . . . . . . . . .
Figure 1–7: Vp Set at .66, Cursor at Reflected Pulse
(Set Correctly) 1–13. . . . . . . . . . . . . . . . . . . . . . . . . . . . . . . . . . . . . . . . . .
Figure 1–8: 20-ft Cable at 5 ft/div 1–14. . . . . . . . . . . . . . . . . . . . . . . . . . . . .
Figure 1–9: Short in the Cable 1–15. . . . . . . . . . . . . . . . . . . . . . . . . . . . . . . .
Figure 1–10: Open in the Cable 1–15. . . . . . . . . . . . . . . . . . . . . . . . . . . . . . .
Figure 1–11: 455-ft Cable 1–16. . . . . . . . . . . . . . . . . . . . . . . . . . . . . . . . . . . .
Figure 1–12: 455-ft Cable 1–16. . . . . . . . . . . . . . . . . . . . . . . . . . . . . . . . . . . .
Figure 1–13: Reflection Adjusted to One Division in Height 1–17. . . . . . .
Figure 1–14: Return Loss 1–18. . . . . . . . . . . . . . . . . . . . . . . . . . . . . . . . . . . .
Figure 1–15: Ohms-at-Cursor 1–19. . . . . . . . . . . . . . . . . . . . . . . . . . . . . . . .
Figure 1–16: Display with VIEW INPUT Turned Off 1–20. . . . . . . . . . . . .
Figure 1–17: Display of a Stored Waveform 1–20. . . . . . . . . . . . . . . . . . . . .
Figure 1–18: Display of a Stored Waveform 1–21. . . . . . . . . . . . . . . . . . . . .
Figure 1–19: Waveform Moved to Top Half of Display 1–22. . . . . . . . . . . .
Figure 1–20: Current Waveform Centered, Stored Waveform
Above 1–22. . . . . . . . . . . . . . . . . . . . . . . . . . . . . . . . . . . . . . . . . . . . . . . . .
Figure 1–21: Current Waveform Center, Stored Waveform Above,
Difference Below 1–23. . . . . . . . . . . . . . . . . . . . . . . . . . . . . . . . . . . . . . . .
Figure 1–22: Waveform of Three-Foot Lead-in Cable 1–24. . . . . . . . . . . .
Figure 1–23: Cursor Moved to End of Three-Foot Lead-in Cable 1–24. . .
Figure 1–24: Cursor Moved to End of Three-Foot Lead-in Cable 1–25. . .
Figure 1–25: Cursor Moved to 0.00 ft 1–25. . . . . . . . . . . . . . . . . . . . . . . . . .
Figure 1–26: Incident Pulse at Three Divisions 1–26. . . . . . . . . . . . . . . . . .
Figure 1–27: Waveform of Short 75 ohm Cable 1–27. . . . . . . . . . . . . . . . . .
Figure 1–28: Waveform Centered and Adjusted Vertically 1–27. . . . . . . .
Figure 1–29: Cursor Moved to Desired Position 1–28. . . . . . . . . . . . . . . . .
Figure 1–30: Waveform Viewed in Normal Operation 1–29. . . . . . . . . . . .
Figure 1–31: Waveform Showing Intermittent Changes 1–30. . . . . . . . . . .
1502C MTDR User Manual
iii
Page 8

Table of Contents
Figure 1–32: Waveform Display with No Outgoing Pulses 1–30. . . . . . . . .
Figure 1–33: A Captured Single Sweep 1–32. . . . . . . . . . . . . . . . . . . . . . . . .
Figure 2–1: Display Showing 3-ft Cable in Start-Up Conditions 2–3. . . .
Figure 2–2: Cursor of Rising Edge of Reflected Pulse 2–3. . . . . . . . . . . . .
Figure 2–3: Waveform with VERT SCALE Increased Showing
an Open 2–4. . . . . . . . . . . . . . . . . . . . . . . . . . . . . . . . . . . . . . . . . . . . . . .
Figure 2–4: Waveform with Short 2–4. . . . . . . . . . . . . . . . . . . . . . . . . . . . .
Figure 2–5: 3-foot Cable with Cursor at Far Left 2–5. . . . . . . . . . . . . . . .
Figure 2–6: 3-foot Cable with Cursor at Incident Pulse 2–6. . . . . . . . . . .
Figure 2–7: 3-foot Cable with Cursor at Incident Pulse, Vertical
Scale at 25 dB 2–6. . . . . . . . . . . . . . . . . . . . . . . . . . . . . . . . . . . . . . . . . .
Figure 2–8: Cursor on End of Longer Cable 2–7. . . . . . . . . . . . . . . . . . . .
Figure 2–9: Scrolling Down the Cable 2–8. . . . . . . . . . . . . . . . . . . . . . . . . .
Figure 2–10: Ohms-at-Cursor 2–9. . . . . . . . . . . . . . . . . . . . . . . . . . . . . . . .
Figure 2–11: Ohms-at-Cursor Near Beginning of Cable 2–9. . . . . . . . . . .
Figure 2–12: Ohms-at-Cursor Beyond Reflected Pulse 2–10. . . . . . . . . . . .
Figure 2–13: Ohms-at-Cursor Beyond Reflected Pulse 2–10. . . . . . . . . . . .
Figure 2–14: Noise on the Waveform 2–11. . . . . . . . . . . . . . . . . . . . . . . . . . .
Figure 2–15: Noise Reduced 2–12. . . . . . . . . . . . . . . . . . . . . . . . . . . . . . . . . .
Figure 2–16: Noise Reduced to Minimum 2–12. . . . . . . . . . . . . . . . . . . . . . .
Figure 2–17: Incident and Reflected Pulses with Cursor at 0.00 ft 2–13. .
Figure 2–18: Cursor at 3.000 ft 2–14. . . . . . . . . . . . . . . . . . . . . . . . . . . . . . .
Figure 2–19: New Zero Set at End of Test Cable 2–14. . . . . . . . . . . . . . . . .
Figure 2–20: Display with 3-ft Cable and NOISE FILTER turned to
VERT SET REF 2–15. . . . . . . . . . . . . . . . . . . . . . . . . . . . . . . . . . . . . . . .
Figure 2–21: VERT SCALE adjusted to Make Pulse Two Divisions
High 2–16. . . . . . . . . . . . . . . . . . . . . . . . . . . . . . . . . . . . . . . . . . . . . . . . . .
Figure 2–22: Display with VIEW INPUT Turned Off 2–17. . . . . . . . . . . . .
Figure 2–23: Display with VIEW INPUT Turned On 2–17. . . . . . . . . . . . .
Figure 2–24: Waveform Moved to Upper Portion of the Display 2–18. . . .
Figure 2–25: Waveform with Cable Shorted 2–19. . . . . . . . . . . . . . . . . . . .
Figure 2–26: Waveform with Both Current and Stored Waveforms 2–19.
Figure 2–27: Stored, Current, and Difference Waveforms 2–20. . . . . . . . .
Figure 2–28: Display with VIEW STORE and VIEW DIFF Disabled 2–21
Figure 2–29: Short and Open Viewed via Max Hold 2–22. . . . . . . . . . . . . .
Figure 2–30: Waveform Strobed Down Display in Max Hold 2–22. . . . . .
Figure 2–31: Display with Pulse Turned Off 2–24. . . . . . . . . . . . . . . . . . . .
Figure 2–32: Test Cable 2–25. . . . . . . . . . . . . . . . . . . . . . . . . . . . . . . . . . . . . .
iv
1502C MTDR User Manual
Page 9

Table of Contents
Figure 2–33: Captured Single Sweep of Shorted Test Cable 2–25. . . . . . . .
Figure B–1: Start-up Measurement Display B–2. . . . . . . . . . . . . . . . . . . . .
Figure B–2: Measurement Display with 3-foot Cable B–3. . . . . . . . . . . . .
Figure B–3: Cursor at End of 3-foot Cable B–3. . . . . . . . . . . . . . . . . . . . . .
Figure B–4: Cursor at End of 3-foot Cable, Vp Set to .30 B–4. . . . . . . . . .
Figure B–5: Flat-Line Display Out to 50,0000+ Feet B–4. . . . . . . . . . . . . .
Figure B–6: Flat-Line Display at –2.000 ft B–5. . . . . . . . . . . . . . . . . . . . . .
Figure B–7: Waveform Off the Top of the Display B–5. . . . . . . . . . . . . . . .
Figure B–8: Waveform at the Bottom of the Display B–6. . . . . . . . . . . . . .
Figure B–9: Waveform with Gain at 5.00 mr/div B–6. . . . . . . . . . . . . . . . .
Figure B–10: Top of Pulse on Center Graticule B–8. . . . . . . . . . . . . . . . . .
Figure B–11: Rising Edge of Incident Pulse in Left-most Major
Division B–8. . . . . . . . . . . . . . . . . . . . . . . . . . . . . . . . . . . . . . . . . . . . . . . .
Figure B–12: Waveform Centered, Cursor at 0.000 ft B–9. . . . . . . . . . . . .
Figure B–13: Pulse Centered on Display B–9. . . . . . . . . . . . . . . . . . . . . . . .
Figure B–14: Cursor on Lowest Major Graticule that Rising Edge
crosses B–10. . . . . . . . . . . . . . . . . . . . . . . . . . . . . . . . . . . . . . . . . . . . . . . . .
Figure B–15: Cursor on Highest Major Graticule that Rising Edge
crosses B–10. . . . . . . . . . . . . . . . . . . . . . . . . . . . . . . . . . . . . . . . . . . . . . . . .
Figure B–16: Jitter Apparent on Leading Edge of Incident Pulse B–11. . .
Figure B–17: Jitter Captured Using Max Hold B–11. . . . . . . . . . . . . . . . . .
Figure D–1: Slide Rule of VSWR vs. Percent Reflected Voltage D–2. . . .
Figure D–2: Slide Rule of Return Loss vs. Percent Reflected
Voltage D–3. . . . . . . . . . . . . . . . . . . . . . . . . . . . . . . . . . . . . . . . . . . . . . . .
Figure D–3: Slide Rule 50 ohm Source D–4. . . . . . . . . . . . . . . . . . . . . . . . .
Figure D–4: Slide Rule 75 ohm Source D–5. . . . . . . . . . . . . . . . . . . . . . . . .
Figure D–5: Calculating Resistance/Impedance from Waveform
Amplitude D–6. . . . . . . . . . . . . . . . . . . . . . . . . . . . . . . . . . . . . . . . . . . . .
Figure D–6: English-Metric, Metric-English Conversion Scales D–7. . . .
Figure D–7: Dielectric Constant and Velocity Factor, Short
Distance D–8. . . . . . . . . . . . . . . . . . . . . . . . . . . . . . . . . . . . . . . . . . . . . . .
Figure D–8: Dielectric Constant and Velocity Factor, Long
Distance D–9. . . . . . . . . . . . . . . . . . . . . . . . . . . . . . . . . . . . . . . . . . . . . . .
1502C MTDR User Manual
v
Page 10

Table of Contents
List of Tables
Table i: Shipping Carton Test Strength ix. . . . . . . . . . . . . . . . . . . . . . . .
Table 1–1: Fuse and Voltage Ratings 1–2. . . . . . . . . . . . . . . . . . . . . . . . . .
Table 1–2: Vp of Various Dielectric Types 1–12. . . . . . . . . . . . . . . . . . . . . .
Table A–1: Electrical Characteristics A–1. . . . . . . . . . . . . . . . . . . . . . . . . .
Table A–2: Environmental Characteristics A–3. . . . . . . . . . . . . . . . . . . . .
Table A–3: Physical Characteristics A–5. . . . . . . . . . . . . . . . . . . . . . . . . . .
vi
1502C MTDR User Manual
Page 11

General Information
Product Description
Battery Pack
Options
The Tektronix 1502C Metallic Time-Domain Reflectometer (MTDR) is a
short-range cable tester capable of finding faults in metal cable. Tests can be
made on coaxial, twisted pair, or parallel cable.
The 1502C sends an electrical pulse down the cable and detects any reflections
made by discontinuities. This is known as time-domain reflectometry. The
1502C is sensitive to impedance changes. Problems in the cable will be detected
and displayed as changes in impedance along the cable. These will be displayed
as hills and valleys in the reflected pulse. The 1502C is capable of finding shorts,
opens, defects in the shield, foreign substances in the cable (e.g., water), kinks,
and more. Even though other instruments might show a cable as “good.” the
1502C can show many previously undetected faults.
The waveform may be temporarily stored within the 1502C and recalled or may
be printed using the optional dot matrix strip chart recorder, which installs into
the front-panel Option Port.
The 1502C may be operated from an AC power source or an internal lead-acid
battery that supply a minimum of five hours operating time (see the Specifica-
tions appendix for specifics).
Options available for the 1502C are explained in the Options and Accessories
chapter of this manual.
Standards, Documents,
and References Used
Changes and History
Information
1502C MTDR User Manual
Terminology used in this manual is in accordance with industry practice.
Abbreviations are in accordance with ANSI Y1.1–19722, with exceptions and
additions explained in parentheses in the text. Graphic symbology is based on
ANSI Y32.2–1975. Logic symbology is based on ANSI Y32.14–1973 and
manufacturer’s data books or sheets. A copy of ANSI standards may be obtained
from the Institute of Electrical and Electronic Engineers, 345 47th Street, New
York, NY 10017.
Changes that involve manual corrections and/or additional data will be incorporated into the text and that page will show a revision date on the inside bottom
edge. History information is included in any diagrams in gray.
vii
Page 12

General Information
Installation and Repacking
Unpacking and Initial
Inspection
Power Source and Power
Requirements
Before unpacking the 1502C from its shipping container or carton, inspect for
signs of external damage. If the carton is damaged, notify the carrier. The
shipping carton contains the basic instrument and its standard accessories. Refer
to the replaceable parts list in the Service Manual for a complete listing.
If the contents of the shipping container are incomplete, if there is mechanical
damage or defect, or if the instrument does not meet operational check requirements, contact your local Tektronix Field Office or representative. If the shipping
container is damaged, notify the carrier as well as Tektronix.
The instrument was inspected both mechanically and electrically before
shipment. It should be free if mechanical damage and meet or exceed all
electrical specifications. Procedures to check operational performance are in the
Performance Checks appendix. These checks should satisfy the requirements for
most receiving or incoming inspections.
The 1502C is intended to be operated from a power source that will not apply
more than 250 volts RMS between the supply conductors or between either
supply conductor and ground. A protective ground connection, by way of the
grounding conductor in the power cord, is essential for safe operation.
The AC power connector is a three-way polarized plug with the ground (earth)
lead connected directly to the instrument frame to provide electrical shock
protection. If the unit is connected to any other power source, the unit frame
must be connected to earth ground.
Repacking for Shipment
viii
Power and voltage requirements are printed on the back panel. The 1502C can be
operated from either 115 VAC or 230 VAC nominal line voltage at 45 Hz to
440 Hz, or a battery pack.
Further information on the 1502C power requirements can be found in the Safety
Summary in this section and in the Operating Instructions chapter.
When the 1502C is to be shipped to a Tektronix Service Center for service or
repair, attach a tag showing the name and address of the owner, name of the
individual at your firm who may be contacted, the complete serial number of the
instrument, and a description of the service required. If the original packaging is
unfit for use or is not available, repackage the instrument as follows:
1. Obtain a carton of corrugated cardboard having inside dimensions that are at
least six inches greater than the equipment dimensions to allow for cushioning. The test strength of the shipping carton should be 275 pounds
(102.5 kg). Refer to the following table for test strength requirements:
1502C MTDR User Manual
Page 13

General Information
T able i: Shipping Carton Test Strength
Gross Weight (lb) Carton Test Strength (lb)
0 – 10 200
11 – 30 275
31 – 120 375
121 – 140 500
141 – 160 600
2. Install the front cover on the 1502C and surround the instrument with
polyethylene sheeting to protect the finish.
3. Cushion the instrument on all sides with packing material or urethane foam
between the carton and the sides of the instrument.
4. Seal with shipping tape or an industrial stapler.
If you have any questions, contact your local Tektronix Field Office or represen-
tative.
1502C MTDR User Manual
ix
Page 14

General Information
x
1502C MTDR User Manual
Page 15
General Safety Summary
The safety information in this summary is for operating personnel. Specific
warnings and cautions will be found throughout the manual where they apply,
but might not appear in this summary. For specific service safety information,
see the 1502C Service Manual.
Safety Terms and Symbols
Terms in this manual:
WARNING. Warning statements identify conditions or practices that could result in
injury or loss of life.
CAUTION. Caution statements identify conditions or practices that could result in
damage to this product or other property.
Terms on the Product:
DANGER indicates an injury hazard immediately accessible as you read the
marking.
WARNING indicates an injury hazard not immediately accessible as you read the
marking.
CAUTION indicates a hazard to property including the product.
Symbols in the Manual:
1502C MTDR User Manual
WARNING or CAUTION
Information
Symbols on the Product:
DANGER
High Voltage
Protective Ground
(Earth) T erminal
ATTENTION
Refer to
Manual
Double
Insulated
xi
Page 16

General Safety Summary
Power Source
Grounding the Product
Danger Arising from Loss
of Ground
Use the Proper Power
Cord
This product is intended to operate from a power source that will not apply more
than 250 volts RMS between the supply conductors or between the supply
conductor and ground. A protective ground connection, by way of the grounding
conductor in the power cord, is essential for safe operation.
This product is grounded through the grounding conductor of the power cord. To
avoid electrical shock, plug the power cord into a properly wired receptacle
before connecting to the product input or output terminals. A protective ground
connection by way of the grounding conductor in the power cord is essential for
safe operation.
Upon loss of the protective-ground connection, all accessible conductive parts
(including knobs and controls that appear to be insulating) can render an electric
shock.
Use only the power cord and connector specified for this product. Do not use this
instrument without a rated AC line cord.
The standard power cord (161-0288-00) is rated for outdoor use. All other
optional power cords are rated for indoor use only.
Use the Proper Fuse
Do Not Operate in
Explosive Atmosphere
Do Not Remove Covers or
Panels
Connecting Cables to the
Front-Panel BNC
Disposal of Batteries
Use only a power cord that is in good condition.
Refer cord and connector changes to qualified service personnel.
To avoid fire hazard, use only a fuse of the correct type.
Refer fuse replacement to qualified service personnel.
To avoid explosion, do not operate this product in an explosive atmosphere
unless it has been specifically certified for such operation.
To avoid personal injury, do not remove the product covers or panels. Do not
operate the product without the covers and panels properly installed.
To avoid possible damage to the front-end circuitry, connection of a cable that is,
or can be, driven by active circuitry should be avoided if the voltage could
exceed 400 V.
This instrument contains a lead-acid battery. Some states and/or local jurisdictions might require special disposition/recycling of this type of material in
accordance with Hazardous Waste guidelines. Check your local and state
regulations prior to disposing of an old battery.
xii
1502C MTDR User Manual
Page 17

General Safety Summary
Tektronix Factory Service will accept 1502C batteries for recycling. If you
choose to return the battery to us for recycling, the battery cases must be intact,
the battery should be packed with the battery terminals insulated against possible
short-circuits, and should be packed in shock-absorbant material.
Tektronix, Inc.
Attn: Service Department
P.O. Box 500
Beaverton, Oregon 97077 U.S.A.
For additional information, phone:1–800–TEK–WIDE
1502C MTDR User Manual
xiii
Page 18

General Safety Summary
xiv
1502C MTDR User Manual
Page 19

Operating Instructions
Overview
Handling
Powering the 1502C
The 1502C front panel is protected by a watertight cover, in which the standard
accessories are stored. Secure the front cover by snapping the side latches
outward. If the instrument is inadvertently left on, installing the front cover will
turn off the POWER switch automatically.
The carrying handle rotates 325° and serves as a stand when positioned beneath
the instrument.
Inside the case, at the back of the instrument, is a moisture-absorbing canister
containing silica gel. In extremely wet environments, it might be be necessary to
periodically remove and dry the canister. This procedure is explained in the
1502C Service Manual.
The 1502C can be stored in temperatures ranging from –62° C to +85° C if a
battery is not installed. If a battery is installed and the storage temperature is
below –35° C or above +65° C, the battery pack should be removed and stored
separately (see 1502C Service Manual for instructions on removing the battery).
Battery storage temperature should be between –35° C to +65° C.
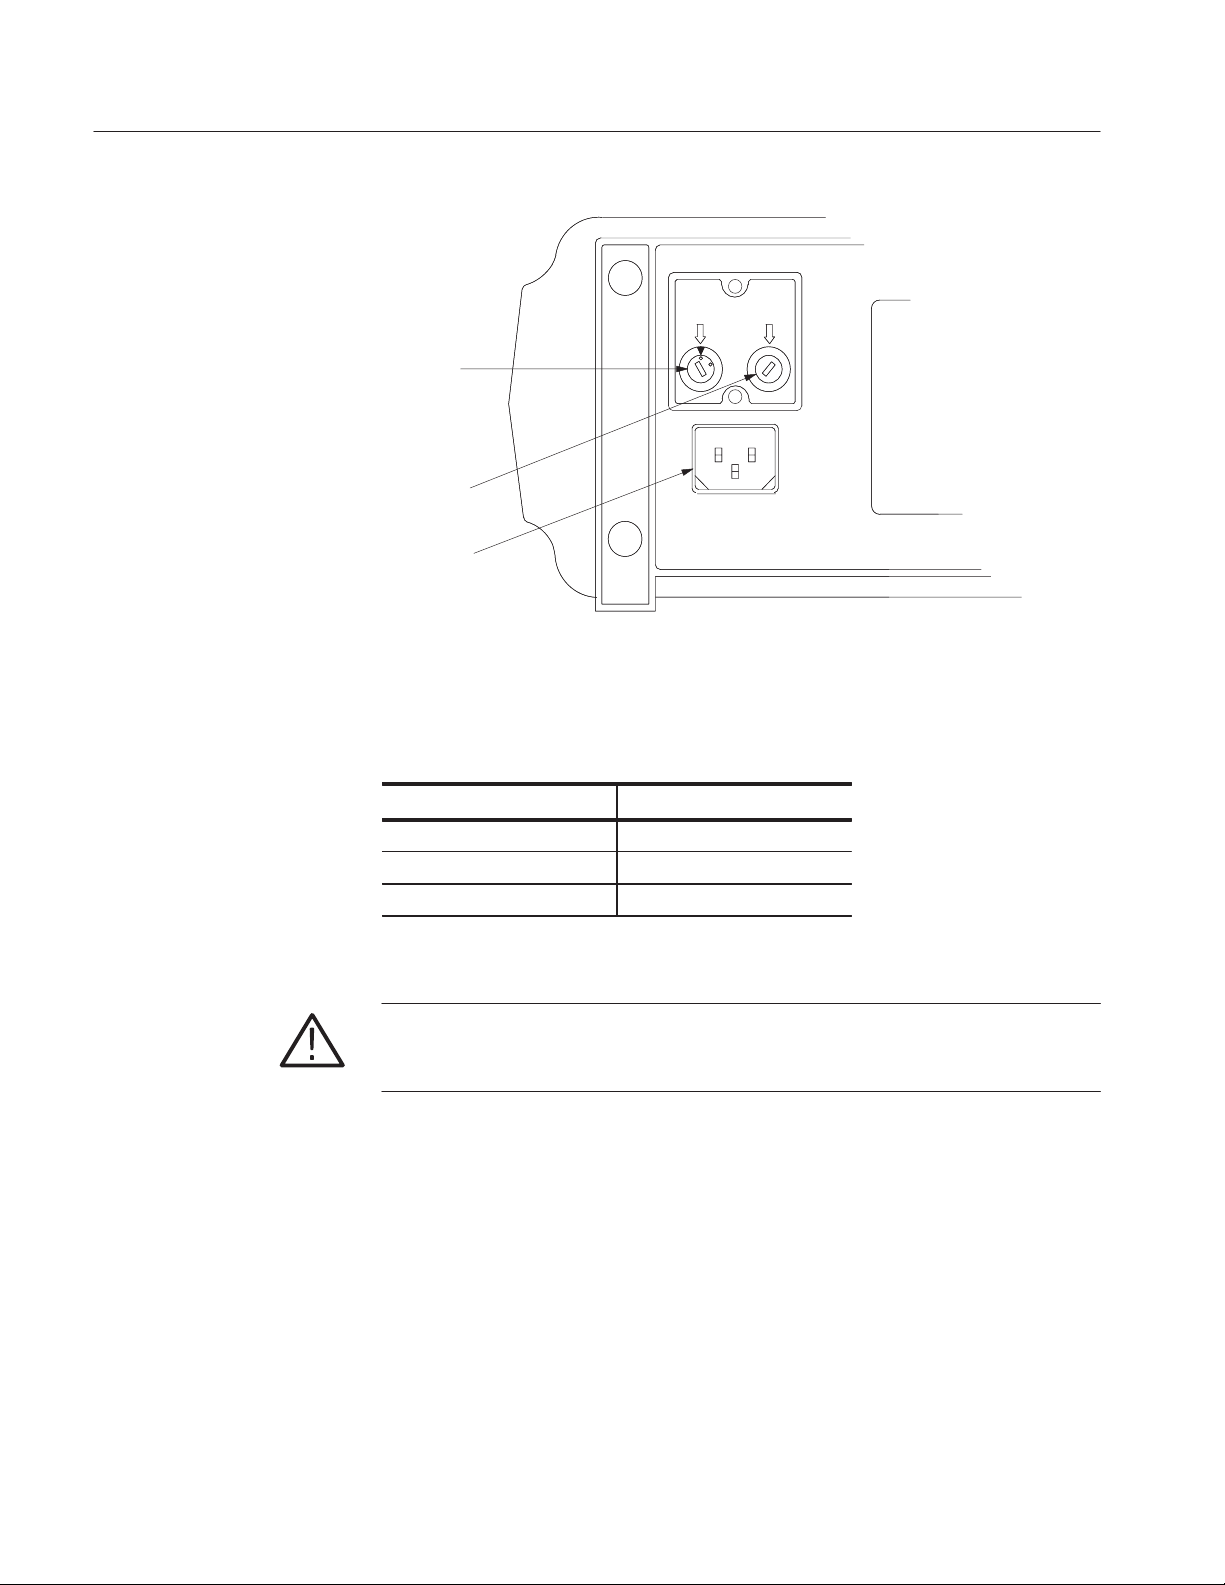
In the field, the 1502C can be powered using the internal battery. See Figure 1–1.
For AC operation, check the rear panel for proper voltage setting. The voltage
selector can be seen through the window of the protective cap. If the setting
differs from the voltage available, it can be easily changed. Simply remove the
protective cap and select the proper voltage using a screwdriver.
1502C MTDR User Manual
The 1502C is intended to be operated from a power source that will not apply
more than 250 V RMS between the supply conductors or between either supply
conductor and ground. A protective ground connection by way of the grounding
conductor in the power cord is essential for safe operation.
The AC power connector is a three-way polarized plug with the ground (earth)
lead connected to the instrument frame to provide electrical shock protection. If
the unit is connected to any other power source, the unit frame must be
connected to an earth ground. See Safety and Installation section.
CAUTION. If you change the voltage selector, you must change the line fuse to the
appropriate value as listed near the fuse holder and in the table below.
1–1
Page 20
Operating Instructions
REMOVE
CAP TO
SELECT
VOLTAGE
REMOVE
CAP TO
REPLACE
FUSE
Voltage
Selector
Line Fuse
AC Power
Cord Receptacle
Figure 1–1: Rear Panel V oltage Selector, Fuse, AC Receptacle
T able 1–1: Fuse and Voltage Ratings
Fuse Rating Voltage Rating
250 V Nominal Range
0.3 AT 115 VAC (90 – 132 V AC)
0.15 AT 230 VAC (180 – 250 VAC)
Care of the Battery Pack
1–2
CAUTION. Read these instructions concerning the care of the battery pack. They
contain instructions that reflect on your safety and the performance of the
instrument.
The 1502C can be powered by a rechargeable lead-gel battery pack that is
accessible only by removing the case from the instrument. When AC power is
applied, the battery pack is charged at a rate that is dependent on the battery
charge state.
The battery pack will operate the 1502C for a minimum of eight continuous
hours (including making 30 chart recordings) if the LCD backlight is turned off.
1502C MTDR User Manual
Page 21
Operating Instructions
Battery Charging
The battery pack will charge fully in 16 hours when the instrument is connected,
via the power cord, to an AC power source with the instrument turned off. The
instrument may be turned on and operated while the batteries are charging, but
this will increase the charging time. For longest battery life, a full charge is
preferred over a partial charge.
For maximum capacity, the batteries should be charged within a temperature
range of +20° C to +25° C. However, the batteries can be charged within a
temperature range of 0° C to +40° C and operated in temperatures ranging from
–10° C to +55° C.
CAUTION. Do not charge battery pack below 0° C or above +40° C. Do not
discharge battery pack below –10° C or above +55° C. If removing the battery
pack during or after exposure to these extreme conditions, turn the instrument off
and remove the AC power cord.
The battery pack should be stored within a temperature range of –35° C to
+65° C. However, the self-discharge rate will increase as the temperature
increases.
If the instrument is stored with the battery pack installed, the battery pack should
be charged every 90 days. A fully charged battery pack will lose about 12% of its
capacity in three to four months if stored between +20° C and +25° C.
Low Battery
If the battery is low, it will be indicated on the LCD (bat/low). If this is the case,
protective circuitry will shut down the 1502C within minutes. Either switch to
AC power or work very fast. If the instrument is equipped with a chart recorder,
using the recorder will further reduce the battery level, or the added load might
shut down the instrument.
bat/low 0.00 ft
O
N
O
F
F
O
F
F
O
F
F
1 avg
500 mr 500 ft
Low Battery
Indicator
Figure 1–2: Display Showing Low Battery Indication
1502C MTDR User Manual
1–3
Page 22

Operating Instructions
Protection circuits in the charger prevent deep discharge of the batteries during
instrument operation. The circuits automatically shut down the instrument
whenever battery voltage falls below approximately 10 V. If shutdown occurs,
the batteries should be fully recharged before further use.
NOTE. Turn the POWER switch off after instrument shutdown to prevent
continued discharge of the batteries.
Low Temperature
Operation
When the instrument is stored at temperatures below –10° C, voids might
develop in the liquid crystal display (LCD). These voids should disappear if the
instrument is placed in an ambient temperature ≥ +5° C for 24 hours.
When operating the 1502C in an environment below +10° C, a heater will
activate. The element is built into the LCD module and will heat the display to
permit normal operation. Depending on the surrounding temperature, it might
take up to 15 minutes to completely warm the crystals in the LCD. Once
warmed, the display will operate normally.
1–4
1502C MTDR User Manual
Page 23
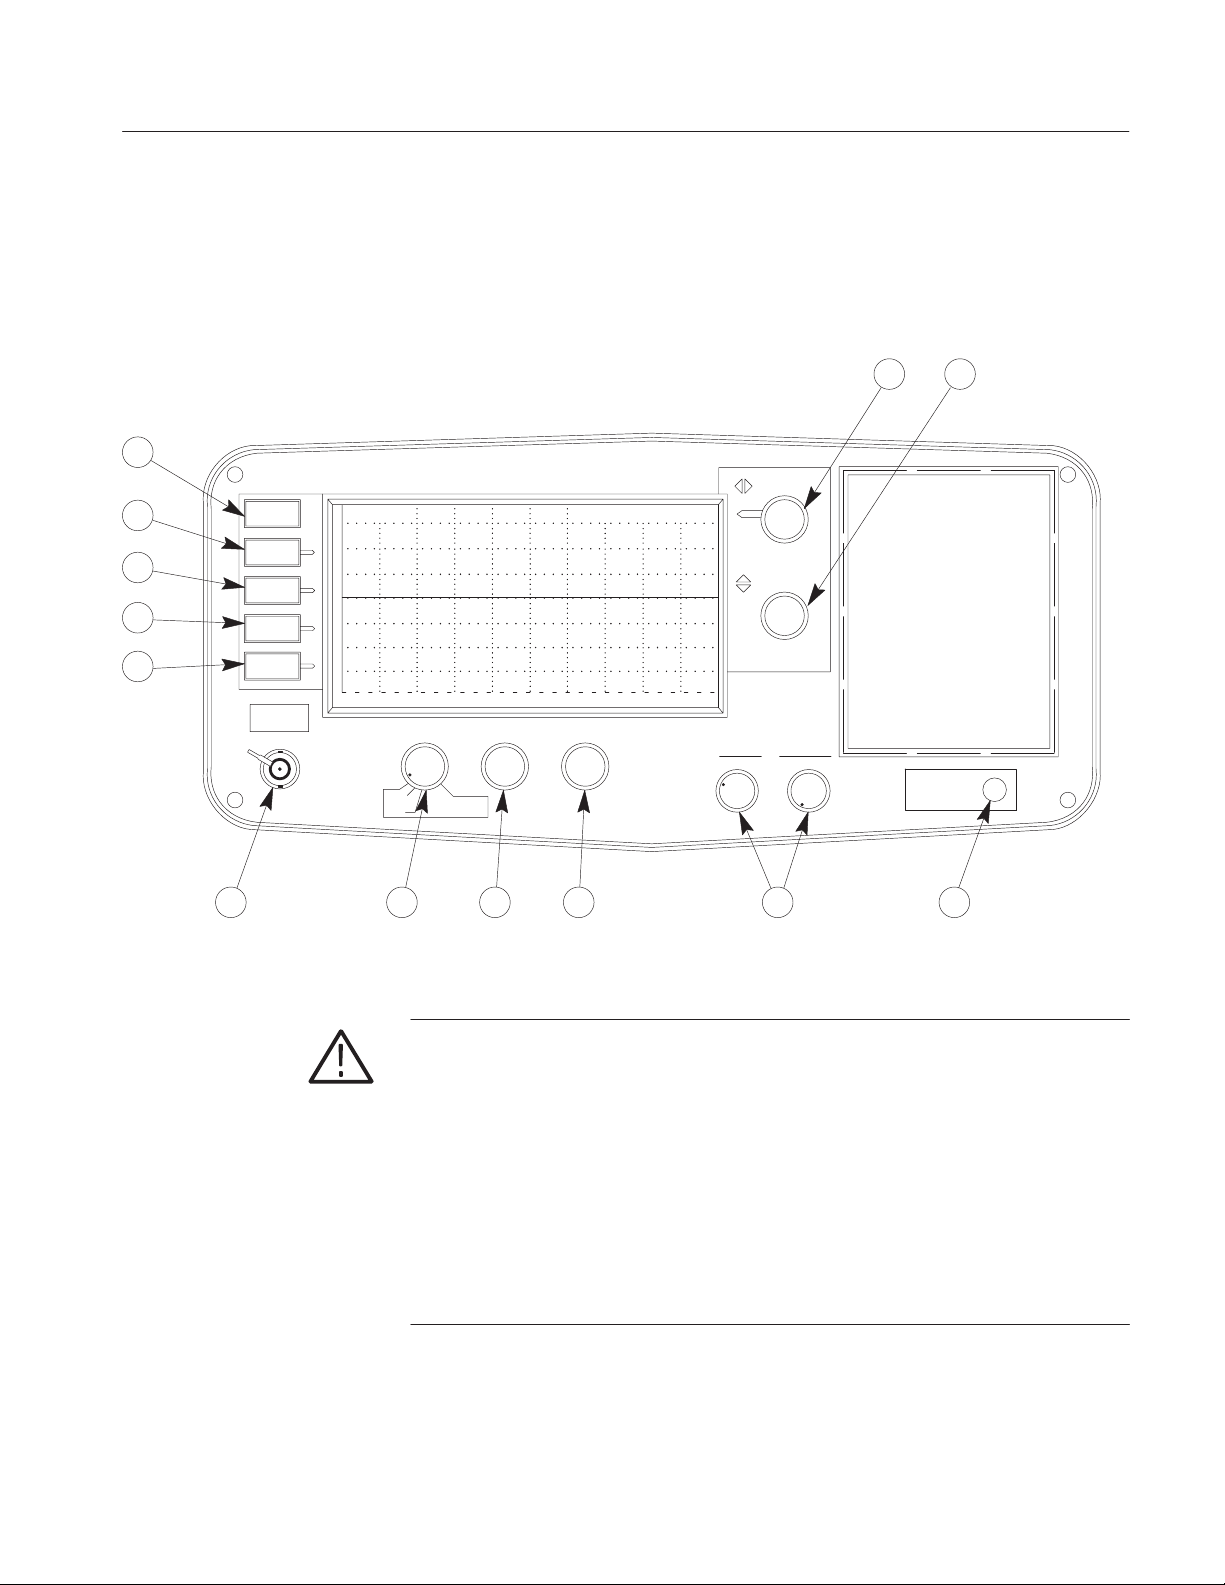
Preparing to Use the 1502C
Check the power requirements, remove the front cover, and you are ready to test
cables. The following pages explain the front-panel controls.
Operating Instructions
10
11
12
13
8
7
9
0.2 ft
METALLIC TDR
CABLE TESTER
POSITION
POSITION
Vp
.5
.4
.3
.04
.6
.9
.05
.03
.7
.8
.06
.07
.02
.08
.01
.09
.00
POWER
(PULL ON)
1
MENU
VIEW
INPUT
VIEW
STORE
VIEW
DIFF
STORE
DO NOT APPLY
EXT VOLTAGE
Tektronix
1502C
ac 0.00 ft
O
N
O
F
F
O
F
F
O
F
F
1 avg
NOISE FILTER VERT SCALE DIST/DIV
HORZ
VERT
2
500 mr
SET REF
3 4 5 6
Figure 1–3: 1502C Front-Panel Controls
CAUTION. Do not connect live circuits to the CABLE connector. Voltages
exceeding 5 volts can damage the pulser or sampler circuits.
Bleed the test cable of any residual static charge before attaching it to the
instrument. T o bleed the cable, connect the standar d 50 W terminator and standard
female-to-female BNC connector together, then temporarily attach both to the
cable. Remove the connectors before attaching the cable to the instrument.
When testing receiving antenna cables, avoid close proximity to transmitters.
Voltages may appear on the cable if a nearby transmitter is in use, resulting in
damage to the instrument. Before testing, be sure that there are no RF voltages
present, or disconnect the cable at both ends.
1502C MTDR User Manual
1–5
Page 24
Operating Instructions
Display
View Input
Indicator
View Store
Indicator
View Difference
Indicator
Store
Indicator
Power
Type
ac
O
N
O
F
F
O
F
F
O
F
F
Waveform Cursor
1 avg
Selected
Noise Filter
Vertical Scale
500 mr 0.2 ft
Selected
Figure 1–4: Display and Indicators
Front-Panel to Cursor
Distance Window
0.00 ft
Grid
Selected
Distance per
Division
1–6
1502C MTDR User Manual
Page 25

Front-Panel Controls
Operating Instructions
1. CABLE: A female BNC connector for attaching a cable to the 1502C for
testing.
NOISE FILTER
HORZ
VERT
SET REF
VERT SCALE
DIST/DIV
2. NOISE FILTER: If the displayed waveform is noisy, the apparent noise can
be reduced by using noise averaging. Averaging settings are between 1 and
128. The time for averaging is directly proportional to the averaging setting
chosen. A setting of 128 might take the instrument up to 35 seconds to
acquire and display a waveform. The first two positions on the NOISE
FILTER control are used for setting the vertical and horizontal reference
points. The selected value or function is displayed above the control on the
LCD.
3. VERT SCALE: This control sets the vertical sensitivity, displayed in mr
per division, or the vertical gain, displayed in dB. Although the instrument
defaults to millirho, you may choose the preferred mode from the Setup
Menu. The selected value is displayed above the control on the LCD.
4. DIST/DIV: Determines the number of feet (or meters) per division across
the display. The minimum setting is 0.1 ft/div (0.025 meters) and the
maximum setting is 200 ft/div (50 meters). The selected value is displayed
above the control on the LCD.
A standard instrument defaults to ft/div. A metric instrument (Option 05)
defaults to m/div, but either may be changed temporarily from the menu. The
default can be changed by changing an internal jumper (see 1502C Service
Manual and always refer such changes to qualified service personnel).
Vp
.3
.4 .5
POWER
(PULL ON)
n
o
n
o
.03
.6
.7
.02
.8
.01
.9 .00
POSITION
POSITION
.04 .05
.06
.07
.08
.09
1502C MTDR User Manual
5. Vp: The two Velocity of Propagation controls are set according to the
propagation velocity factor of the cable being tested. For example, solid
polyethylene commonly has a Vp of 0.66. Solid polytetraflourethylene
(Teflon ) is approximately 0.70. Air is 0.99. The controls are decaded: the
left control is the first digit and the right control is the second digit. For
example, with a Vp of 0.30, the first knob would be set to .3 and the second
knob to .00.
6. POWER: Pull for power ON and push in for power OFF. When the front
cover is installed, this switch is automatically pushed OFF.
n
7.
POSITION: This is a continuously rotating control that positions the
o
displayed waveform vertically, up or down the LCD.
n
o
8.
POSITION: This is a continuously rotating control that moves a
vertical cursor completely across the LCD graticule. In addition, the
waveform is also moved when the cursor reaches the extreme right or left
side of the display. A readout (seven digits maximum) is displayed in the
1–7
Page 26

Operating Instructions
upper right corner of the LCD, showing the distance from the front panel
BNC to the current cursor location.
MENU
VIEW
INPUT
VIEW
STORE
VIEW
DIFF
STORE
Menu Selections
9. MENU: This pushbutton provides access to the menus and selects items
chosen from the menus.
10. VIEW INPUT: When pushed momentarily, this button toggles the display
of the waveform acquired at the CABLE connector. This function is useful to
stop displaying a current waveform to avoid confusion when looking at a
stored waveform. This function defaults to ON when the instrument is
powered up.
11. VIEW STORE: When pushed momentarily, this button toggles the display
of the stored waveform.
12. VIEW DIFF: When pushed momentarily, this button toggles the display of
the current waveform minus the stored waveform and shows the difference
between them.
13. STORE: When pushed momentarily, the waveform currently displayed will
be stored in the instrument memory. If a waveform is already stored, pushing
this button will erase it. The settings of the stored waveform are available
from the first level menu under View Stored Waveform Settings.
Main Menu
There are several layers of menu, as explained below.
The Main Menu is entered by pushing the MENU button on the front panel.
1. Return to Normal Operations puts the instrument into normal operation
mode.
2. Help with Instrument Controls explains the operation of each control.
When a control or switch is adjusted or pushed, a brief explanation appears
on the LCD.
3. Cable Information has these choices:
a. Help with Cables gives a brief explanation of cable parameters.
b. Velocity of Propagation Values displays a table of common dielectrics
and their Vp values. These are nominal values. The manufacturer’s listed
specifications should be used whenever possible.
c. Impedance Values displays impedances of common cables. In some
cases, these values have been rounded off. Manufacturer’s specifications
should be checked for precise values.
1–8
1502C MTDR User Manual
Page 27

Operating Instructions
d. Finding Unknown Vp Values describes a procedure for finding an
unknown Vp.
4. Setup Menu controls the manner in which the instrument obtains and
displays its test results.
a. Acquisition Control Menu has these choices:
i. Max Hold Is: On/Off. Turn Max Hold on by pushing MENU then
STORE. In this mode, waveforms are accumulated on the display . Max
Hold can be deactivated by pushing STORE or the mode exited by
using the Setup Menu.
ii. Pulse Is: On/Off. T urns the pulse generator of f so the 1502C does not
send out pulses.
iii. Single Sweep Is: On/Off. This function is much like a still camera; it
will acquire one waveform and hold it.
b. Ohms-at-Cursor is: On/Off. When activated, the impedance at thee
point of the cursor is displayed beneath the distance window on the
display.
c. Vertical Scale Is: dB/mr. This offers you a choice as to how the vertical
gain of the instrument is displayed. You may choose decibels or millirho.
When powered down, the instrument will default to millirho when
powered back up.
d. Distance/Div Is: ft/m. Offers you a choice of how the horizontal scale is
displayed. You may choose from feet per division or meters per division.
When powered up, the instrument will default to feet unless the internal
jumper has been moved to the meters position. Instructions on changing
this default are contained in the 1502C Service Manual.
e. Light Is: On/Off. This control turns the electroluminescent backlight
behind the LCD on or off.
5. Diagnostics Menu lists an extensive selection of diagnostics to test the
operation of the instrument.
NOTE. The Diagnostics Menu is intended for instrument repair and calibration.
Proper instrument setup is important for correct diagnostics results. Refer to the
1502C Service Manual for more information on diagnostics.
a. Service Diagnostics Menu has these choices:
1502C MTDR User Manual
i. Sampling Efficiency Diagnostic displays a continuous efficiency
diagnostic of the sampling circuits.
1–9
Page 28

Operating Instructions
ii. Noise Diagnostic measures the internal RMS noise levels of the
instrument.
iii. Offset/Gain Diagnostic reports out-of-tolerance steps in the program-
mable gain stage. This can help a service technician to quickly isolate
the cause of waveform distortion problems.
iv. RAM/ROM Diagnostics Menu performs tests on the RAM (Random
Access Memory) and the ROM (Read Only Memory).
v. Timebase Is: Normal - Auto Correction / Diagnostic - No
Correction. When in Normal - Auto Correction, the instrument
compensates for variations in temperature and voltage. This condition
might not be desirable while calibrating the instrument. While in
Diagnostic - No Correction, the circuits will not correct for these
variations.
b. Front Panel Diagnostics aids in testing the front panel.
c. LCD Diagnostics Menu has these choices:
i. LCD Alignment Diagnostic generates a dot pattern of every other
pixel on the LCD. These pixels can be alternated to test the LCD.
ii. Response Time Diagnostic generates alternate squares of dark and
light, reversing their order. This tests the response time of the LCD and
can give an indication of the effectiveness of the LCD heater in a cold
environment.
iii. LCD Drive Test Diagnostic generates a moving vertical bar pattern
across the LCD.
iv. Contrast Adjust allows you to adjust the contrast of the LCD. It
generates an alternating four-pixel pattern. The nominal contrast is set
internally . When in Contrast Adjust mode, VERT SCALE is used as the
contrast adjustment control. This value ranges from 0 to 255 units and
is used by the processor to evaluate and correct circuit variations caused
by temperature changes in the environment. When the diagnostic menu
is exited, the LCD contrast returns to that set by internal adjust.
d. Chart Diagnostics Menu offers various tests for the optional chart
recorder.
i. LCD Chart allows adjusting the number of dots per segment and the
number of prints (strikes) per segment.
1–10
ii. Head Alignment Chart generates a pattern to allow mechanical
alignment of the optional chart recorder.
1502C MTDR User Manual
Page 29

Operating Instructions
6. View Stored Waveform Settings displays the instrument settings for the
stored waveform.
7. Option Port Menu contains three items. Two items allow configuration of
the option port for communicating with devices other than the optional chart
recorder and one item test the option port.
a. Option Port Diagnostic creates a repeating pattern of signals at the
option port to allow service technicians to verify that all signals are
present and working correctly.
b. Set Option Port Timing allows adjustment of the data rate used to
communicate with external devices. The timing rate between bytes can
be set from about 0.05 to 12.8 milliseconds.
c. Option Port Debugging Is Off/On. Off is quiet, On is verbose. This
chooses how detailed the error message reporting will be when
communicating with an external device.
It is possible to connect the instrument to a computer through a parallel
interface with a unique software driver. Because different computers vary
widely in processing speed, the instrument must be able to adapt to differing
data rates while communicating with those computers. With user-developed
software drivers, the ability to obtain detailed error messages during the
development can be very useful. For more information, contact your
Tektronix Customer Service representatives. They have information
describing the option port hardware and software protocol and custom
development methods available.
The SP-232, a serial interface product, also allows for connection of the
1502C to other instrumentation, including computers, via the option port.
SP-232 is an RS-232C-compatible interface. For more information, contact
your Tektronix Customer Service Representative. They can provide you with
additional details on the hardware and software protocol.
8. Display Contrast (Software Version 5.02 and above)
a. Press the MENU button firmly once. If the display is very light or very
dark, you might not be able to see a change in the contrast.
b. Turn the VERTICAL SCALE knob slowly clockwise to darken the
display or counterclockwise to lighten the display. If you turn the knob
far enough, the contrast will wrap from the darkest to lightest value.
c. When the screen is clearly readable, press the MENU button again to
return to normal measurement operation. The new contrast value will
remain in effect until the instrument is turned off.
1502C MTDR User Manual
1–11
Page 30

Operating Instructions
n
o
Test Preparations
The Importance of Vp
(Velocity of Propagation)
Vp is the speed of a signal down the cable given as a percentage of the speed of
light in free space. It is sometimes expressed as a whole number (e.g., 66) or a
percentage (e.g., 66%). On the 1502C, it is the percentage expressed as a decimal
number (e.g., 66% = .66). If you do not know the velocity of propagation, you
can get a general idea from the following table, or use the Help with Cables
section of the Cable Information menu. You can also find the Vp with the
procedure that follows using a cable sample.
NOTE. If you do not know the Vp of your cable, it will not prevent you from
finding a fault in your cable. However, if the Vp is set wrong, the distance
readings will be affected.
All Vp settings should be set for the cable under test, not the supplied jumper
cable.
T able 1–2: Vp of Various Dielectric Types
Dielectric Probable Vp
Jelly Filled .64
Polyethylene (PIC, PE, or SPE) .66
PTFE (Teflon R) or TFE .70
Pulp Insulation .72
Foam or Cellular PE (FPE) .78
Semi-solid PE (SSPE) .84
Air (helical spacers) .98
Finding an Unknown Vp
1. Obtain a known length of cable of the exact type you wish to test. Attach the
cable to the CABLE connector on the front panel.
2. Pull POWER on.
3. Turn the DIST/DIV to an appropriate setting (e.g., if trying to find the Vp of
a three-foot cable, turn the DIST/DIV to 1 ft/div).
4. Turn the
POSITION control until the distance reading is the same as the
known length of this cable.
5. Turn the Vp controls until the cursor is resting on the rising portion of the
reflected pulse. The Vp controls of the instrument are now set to the Vp of
the cable.
1–12
1502C MTDR User Manual
Page 31

Operating Instructions
The following three illustrations show settings too low, too high, and correct for
a sample three-foot cable.
ac 3.000 ft
O
N
O
F
F
O
F
F
O
F
F
Figure 1–5: Vp Set at .30, Cursor Beyond Reflected Pulse (Set Too Low)
ac 3.000 ft
O
N
O
F
F
O
F
F
O
F
F
Figure 1–6: Vp Set at .99, Cursor Less Than Reflected Pulse (Set T oo High)
ac 3.000 ft
O
N
O
F
F
O
F
F
O
F
F
1502C MTDR User Manual
Figure 1–7: Vp Set at .66, Cursor at Reflected Pulse (Set Correctly)
1–13
Page 32

Operating Instructions
Cable Test Procedure
Distance to the Fault
Be sure to read the previous paragraphs on Vp.
1. Set the 1502C controls:
POWER On
CABLE Cable to BNC
NOISE FILTER 1 avg
VERT SCALE 500 mr
DIST/DIV (see below)
Vp (per cable)
2. If you know approximately how long the cable is, set the DIST/DIV
appropriately (e.g., 20-ft cable would occupy four divisions on the LCD if
5 ft/div was used). The entire cable should be displayed.
ac 0.000 ft
O
N
O
F
F
O
F
F
O
F
F
1–14
Figure 1–8: 20-ft Cable at 5 ft/div
If the cable length is unknown, set DIST/DIV to 200 ft/div and continue to
decrease the setting until the reflected pulse is visible. Depending on the cable
length and the amount of pulse energy absorbed by the cable, it might be
necessary to increase the VERT SCALE to provide more gain to see the reflected
pulse.
1502C MTDR User Manual
Page 33

Operating Instructions
n
o
ac 20.000 ft
O
N
O
F
F
Short
O
F
F
O
F
F
Figure 1–9: Short in the Cable
When the entire cable is displayed, you can tell if there is an open or a short.
Essentially, a large downward pulse indicates a short (see Figure 1–9), while a
large upward pulse indicates an open (see Figure 1–10). Less catastrophic faults
can be seen as smaller reflections. Bends and kinks, frays, water, and interweaving all have distinctive signatures.
ac 20.000 ft
O
N
O
F
F
O
F
F
O
F
F
Open
Figure 1–10: Open in the Cable
3. To find the distance to the fault or end of the cable, turn the
POSITION
control until the cursor rests on the leading edge of the rising or falling
reflected pulse (see Figure 1–10). Read the distance in the distance window
in the upper right corner of the display.
A more thorough inspection might be required. This example uses a longer
cable:
4. When inspecting a 452-foot cable, a setting of 50 ft/div allows a relatively
fast inspection. If needed, turn VERT SCALE to increase the gain. The
higher the gain, the smaller the faults that can be detected. If noise increases,
increase the NOISE FILTER setting.
1502C MTDR User Manual
1–15
Page 34

Operating Instructions
n
o
ac 452.000 ft
O
N
O
F
F
O
F
F
O
F
F
Open
Figure 1–11: 455-ft Cable
5. Change DIST/DIV to 20 ft/div. The entire cable can now be inspected in
detail on the LCD. Turn the
POSITION control so the cursor travels to
the far right side of the LCD. Keep turning and the cable will be “dragged”
across the display.
ac 452.000 ft
O
N
O
F
F
O
F
F
O
F
F
Short
Figure 1–12: 455-ft Cable
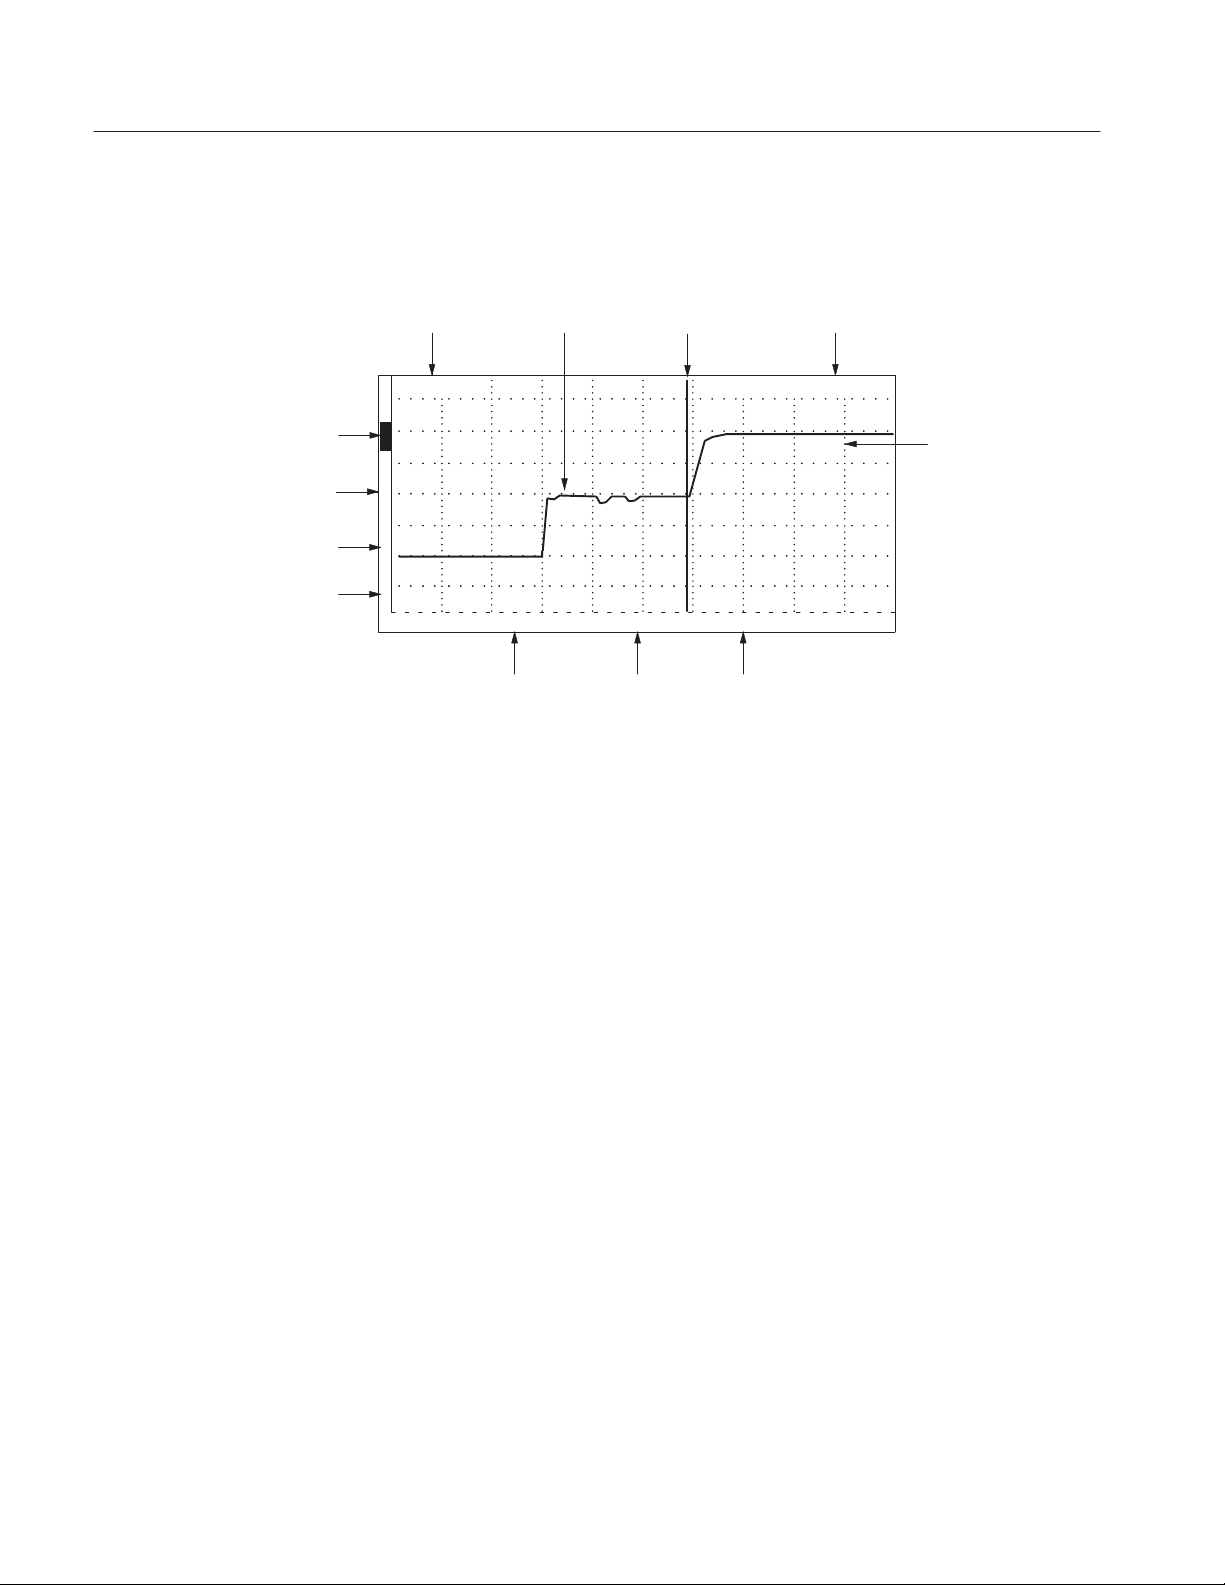
A “rise” or “fall” is a signature of an impedance mismatch (fault). A dramatic
rise in the pulse indicates and open. A dramatic lowering of the pulse indicates a
short. Variations, such as inductive and capacitive effects on the cable, will
appear as bumps and dips in the waveform. Capacitive faults appear as a
lowering of the pulse (e.g., water in the cable). Inductive faults appear as a rising
of the pulse (e.g., fray). Whenever an abnormality is found, set the cursor at the
beginning of the fault and read the distance to the fault on the distance window
of the LCD.
1–16
1502C MTDR User Manual
Page 35

Operating Instructions
Reflection Coefficient
Measurements
The reflection coefficient is a measure of the impedance change at a point in the
cable. It is the ratio of the signal reflected back from a point, divided by the
signal going into that point. It is designated by the Greek letter r and is written
in this manual as rho. The 1502C measures the reflection coefficient in millirho
(thousandths of a rho).
To measure a reflection, adjust VERT SCALE to make the reflection one
division high. Read the reflection coefficient directly off the display above the
VERT SCALE control. For reflections that are greater than 500 mr/div, adjust
VERT SCALE for a reflection that is two divisions high and multiply the VERT
SCALE reading by two.
ac 0.000 ft
O
N
O
F
F
O
F
F
O
F
F
Figure 1–13: Reflection Adjusted to One Division in Height
In an ideal transmission system with no changes in impedance, there will be no
reflections, so rho is equal to zero. A good cable that is terminated in its
characteristic impedance is close to ideal and will appear as a flat line on the
1502C display.
Small impedance changes, like those from a connector, might have reflections
from 10 to 100 mr. If rho is positive, it indicates an impedance higher than that
of the cable before the reflection. It will show as an upward shift or bump on the
waveform. If rho is negative, it indicates an impedance lower than that of the
cable prior to the reflection. It will show as a downward shift or dip on the
waveform.
If the cable has an open or short, all the energy sent out by the 1502C will be
reflected. This is a reflection coefficient of rho = 1, or +1000 mr for the open
and –1000 mr for the short.
Long cables have enough loss to affect the size of reflections. In the 1502C, this
loss will usually be apparent as an upward ramping of the waveform along the
length of the cable. In some cases, the reflection coefficient measurement can be
corrected for this loss. This correction can be made using a procedure very
1502C MTDR User Manual
1–17
Page 36

Operating Instructions
similar to the Vertical Compensation for Higher Impedance Cable procedure (see
the VERT SET REF section).
Return Loss
Measurements
Return loss is another was of measuring impedance changes in a cable. Mathematically, return loss is related to rho by the formula:
Return Loss (in dB) = –20 * log (base ten) of Absolute Value of Rho (Vref/Vinc)
The 1502C can be made to display in dB instead of mr/div through the menu:
1. Press MENU.
2. Select Setup Menu.
3. Press MENU again.
4. Select Vertical Scale is: Millirho.
5. Press MENU again. This should change is to Vertical Scale is: Decibels.
6. Press MENU twice to return to normal operation.
To measure return loss with the 1502C, adjust the height of the reflected pulse to
be two divisions high and read the dB return loss directly off the LCD. The
incident pulse is set to be two divisions high at zero dB automatically when the
instrument is turned on.
ac 0.000 ft
O
N
O
F
F
O
F
F
O
F
F
Figure 1–14: Return Loss
A large return loss means that most of the pulse energy was lost instead of being
returned as a reflection. The lost energy might have been sent down the cable or
absorbed by a terminator or load on the cable. A terminator matched to the cable
would absorb most of the pulse, so its return loss would be large. An open or
short would reflect all the energy, so its return loss would be zero.
1–18
1502C MTDR User Manual
Page 37

Operating Instructions
Ohms-at-Cursor
The 1502C can compute and display what impedance mismatch would cause a
reflection as high (or low) as the point at the cursor. This measurement is useful
for evaluating the first impedance mismatch (first reflection) or small impedance
changes along the cable (e.g., connectors, splices).
This function can be selected in the Setup Menu. Once it is enabled, the
impedance value will be displayed under the distance in the distance window.
ac 2.800 ft
O
N
O
F
F
O
F
F
O
F
F
50 W
Ohms-at-Cursor
Readout
Figure 1–15: Ohms-at-Cursor
The accuracy of the difference measurement in impedance between two points
near each other is much better than the absolute accuracy of any single point
measurement. For example, a cable might vary from 51.3 W to 58.4 W across a
connector, the 7.1 W difference is accurate to about 2%. The 51.3 W measure-
ment by itself is only specified to be accurate to 10%.
The series resistance of the cable to the point at the cursor affects the accuracy of
the impedance measurement directly. In a cable with no large impedance
changes, the series resistance is added to the reading. For example, the near end
of a long 50 W coaxial cable might read 51.5 W, but increase to 57.5 W several
hundred feet along the cable. The 6 W difference is due to the series resistance of
the cable, not to a change in the actual impedance of the cable.
Another limitation to the ohms-at-cursor function is that energy is lost going
both directions through a fault. This will cause readings of points farther down
the cable to be less accurate than points nearer to the instrument.
In general, it is not wise to try to make absolute measurements past faults
because the larger the fault, the less accurate those measurements will be.
Although they do not appear as faults, resistive pads (often used to match cable
impedances) also affect measurements this way.
1502C MTDR User Manual
1–19
Page 38

Operating Instructions
Using VIEW INPUT
How to Store the
Waveform
When pushed, the VIEW INPUT button displays the input at the front panel
CABLE connector. When VIEW INPUT is turned off and no other buttons are
pushed, the display will not have a waveform on it (see Figure 1–16). The
default condition when the instrument is powered up is to have VIEW INPUT
on.
ac 0.000 ft
O
F
F
O
F
F
O
F
F
O
F
F
Figure 1–16: Display with VIEW INPUT Turned Off
When pushed, the STORE button puts the current waveform being displayed into
memory. If already stored, pushing STORE again will erase the stored waveform.
The front panel control settings and the menu-accessed settings are also stored.
They are accessed under View Stored Waveform Settings in the first level of the
menu.
ac 3.000 ft
O
N
O
F
F
O
F
F
O
N
Figure 1–17: Display of a Stored Waveform
1–20
1502C MTDR User Manual
Page 39

Operating Instructions
Using VIEW STORE
Using VIEW DIFF
The VIEW STORE button, when pushed on, displays the waveform stored in the
memory as a dotted line. If there is no waveform in memory, a message appears
on the LCD informing you of this.
ac 3.000 ft
O
F
F
O
N
O
F
F
O
N
Figure 1–18: Display of a Stored Waveform
When pushed on, the VIEW DIFF button displays the difference between the
current waveform and the stored waveform as a dotted line. If no waveform has
been stored, a message will appear. The difference waveform is made by
subtracting each point in the stored waveform from each point in the current
waveform.
NOTE. If the two waveforms are identical (e.g., if STORE is pushed and VIEW
DIFF is immediately pushed) the difference would be zero. Therefore you would
see the difference waveform as a straight line.
The VIEW DIFF waveform will move up and down with the current input as you
move the
n
POSITION control. Any of the waveforms may be turned on or off
o
independently. You might want to turn off some waveforms if the display
becomes too busy or confusing.
NOTE. Because the stored waveform is not affected by changes in the instrument
controls, care should be taken with current waveform settings or the results
could be misleading.
One method to minimize the overlapping of the waveforms in VIEW DIFF is:
1. Move the waveform to be stored into the top half of the display.
1502C MTDR User Manual
1–21
Page 40

Operating Instructions
ac 3.000 ft
O
N
O
F
F
O
F
F
O
N
Figure 1–19: Waveform Moved to Top Half of Display
2. Push STORE to capture the waveform. Remember, once it is stored, this
waveform cannot be moved on the display.
3. Move the current waveform (the one you want to compare against the stored
waveform) to the center of the display.
4. Push VIEW STORE and the stored waveform will appear above the current
waveform.
ac 3.000 ft
O
N
O
N
O
F
F
O
N
Figure 1–20: Current Waveform Centered, Stored W aveform Above
5. Push VIEW DIFF and the difference waveform will appear below the current
waveform.
1–22
1502C MTDR User Manual
Page 41

Operating Instructions
n
o
ac 3.000 ft
O
N
O
N
O
N
O
N
Stored
Waveform
VIEW STORE
Current
Waveform
VIEW INPUT
Difference
VIEW DIFF
Figure 1–21: Current Waveform Center , Stored W aveform Above, Difference Below
Notice the VIEW INPUT waveform is solid, VIEW DIFF is dotted, and VIEW
STORE is dot-dash.
There are many situations where the VIEW DIFF function can be useful. One
common situation is to store the waveform of a suspect cable, repair the cable,
then compare the two waveforms after the repair. During repairs, the VIEW
INPUT, VIEW DIFF, and VIEW STORE waveforms can be used to judge the
effectiveness of the repairs. The optional chart recorder can be used to make a
chart of the three waveforms to document the repair.
Another valuable use for the VIEW DIFF function is for verifying cable integrity
before and after servicing or periodic maintenance that requires moving or
disconnecting the cable.
The VIEW DIFF function is useful when you want to see any changes in the
cable. In some systems, there might be several reflections coming back from
each branch of the network. It might become necessary to disconnect branch
lines from the cable under test to determine whether a waveform represents a
physical fault or is simply an echo from one of the branches. The STORE and
VIEW DIFF functions allow you to see and compare the network with and
without branches.
Two important things to be observed when using the VIEW DIFF function:
H If you change either the VERT SCALE or DIST/DIV, you will no longer be
comparing features that are the same distance apart or of the same magnitude
on the display. It is possible to save a feature (e.g., a connector or tap) at one
distance down the cable and compare it to a similar feature at a different
distance by moving the
POSITION and
n
POSITION controls.
o
H When this is done, great care should be taken to make sure the vertical and
horizontal scales are identical for the two waveforms being compared. If
either the stored or current waveform is clipped at the top or bottom of the
display, the difference waveform will be affected.
1502C MTDR User Manual
1–23
Page 42

Operating Instructions
n
o
Using Horizontal Set
Reference
HORZ SET REF (D mode) allows you to offset the distance reading. For
example, a lead-in cable to a switching network is three feet long and you desire
to start the measurement after the end of the lead-in cable. HORZ SET REF
makes it simple.
ac 0.000 ft
O
N
O
F
F
O
F
F
O
F
F
End of
3-ft cable
Figure 1–22: Waveform of Three-Foot Lead-in Cable
1. Turn the NOISE FILTER control to HORZ SET REF. The noise readout on
the LCD will show: set D.
2. Turn the
POSITION control to set the cursor where you want to start the
distance reading. This will be the new zero reference point. For a three-foot
lead-in cable, the cursor should be set at 3.00 ft.
ac 3.000 ft
O
N
O
F
F
O
F
F
O
F
F
move cursor to reference and Press STORE
Figure 1–23: Cursor Moved to End of Three-Foot Lead-in Cable
3. Push STORE.
4. Turn the NOISE FILTER control to 1 avg. The instrument is now in HORZ
SET REF, or delta mode. The distance window should now read 0.00 ft. As
the cursor is scrolled down the cable, the distance reading will now be from
the new zero reference point.
1–24
1502C MTDR User Manual
Page 43

Operating Instructions
n
o
ac
O
N
O
F
F
O
F
F
O
F
F
0.000 ft
D
Figure 1–24: Cursor Moved to End of Three-Foot Lead-in Cable
NOTE. Vp changes will affect where the reference is set on the cable. Be sure to
set the Vp first, then set the delta to the desired location.
5. To exit HORZ SET REF, use the following procedure:
a. Turn the NOISE FILTER control to HORZ SET REF.
b. Turn DIST/DIV to .1 ft/div. If the distance reading is extremely high,
you might want to use a higher setting initially, then turn to .1 ft/div for
the next adjustment.
c. Turn the
POSITION control until the distance window reads 0.00 ft.
ac 0.000 ft
O
N
O
F
F
O
F
F
O
F
F
move cursor to reference and Press STORE
Figure 1–25: Cursor Moved to 0.00 ft
d. Push STORE.
e. Turn NOISE FILTER to desired setting.
1502C MTDR User Manual
1–25
Page 44

Operating Instructions
Using Vertical Set
Reference
VERT SET REF works similar to HORZ SET REF except that it sets a reference
for gain (pulse height) instead of distance. This feature allows zeroing the dB
scale at whatever pulse height is desired.
1. Turn NOISE FILTER fully counterclockwise. “Set Ref” will appear in the
noise averaging area of the LCD.
2. Adjust the incident pulse to the desired height (e.g., four divisions). It might
n
be necessary to adjust
ac 0.000 ft
O
N
O
F
F
O
F
F
O
F
F
set vertical scale and press STORE
POSITION.
o
Figure 1–26: Incident Pulse at Three Divisions
Vertical Compensation for
Higher Impedance Cable
3. Push STORE.
4. Return NOISE FILTER to the desired setting. Notice that the vertical scale
now reads 500 mr/div.
NOTE. The millirho vertical scale will not be in calibration after arbitrarily
adjusting the pulse height.
The millirho scale is the reciprocal of the number of divisions high the pulse has
been set. For example, 1 pulse divided by 3 divisions equals 0.25 mr equals
250 mr/div.
When testing cables other than 50W, this procedure allows reflection measurements in millirho.
1. Attach a short sample of the given cable (75 W in this example) to the
instrument.
1–26
1502C MTDR User Manual
Page 45

ac 19.200 ft
n
o
n
o
O
N
O
F
F
O
F
F
O
F
F
Figure 1–27: Waveform of Short 75 ohm Cable
Operating Instructions
2. Adjust the
POSITION control to position the reflected pulse at center
screen.
3. Turn NOISE FILTER to VERT SET REF.
4. Adjust VERT SCALE so the reflected pulse (from open at far end of cable
sample) is two divisions high.
ac 19.200 ft
O
N
O
F
F
O
F
F
O
F
F
set vertical scale and press STORE
Figure 1–28: Waveform Centered and Adjusted Vertically
5. Press STORE.
6. Return NOISE FILTER to the desired setting.
7. Adjust the
POSITION control to the desired position on the waveform to
measure loss.
1502C MTDR User Manual
1–27
Page 46

Operating Instructions
ac 1.840 ft
O
N
O
F
F
O
F
F
O
F
F
Figure 1–29: Cursor Moved to Desired Position
The instrument is now set to measure reflections in millirho relative to the
sample cable impedance.
To measure reflections on a 50 W cable, the VERT SET REF must be reset.
8. To exit VERT SET REF, use the following procedure:
a. Turn NOISE FILTER to VERT SET REF.
b. Adjust VERT SCALE to obtain an incident pulse height of two
divisions.
c. Push STORE.
d. Turn NOISE FILTER to desire filter setting.
The instrument can be turned off and back on to default to the two division pulse
height.
1–28
1502C MTDR User Manual
Page 47

Additional Features (Menu Selected)
Operating Instructions
Max Hold
The 1502C will capture and store waveforms on an ongoing basis. This is useful
when the cable or wire is subjected to intermittent or periodic conditions. The
1502C will monitor the line and display any fluctuations on the LCD.
1. Attach the cable to the 1502C front-panel CABLE connector.
2. Push MENU to access the main menu.
3. Scroll to Setup Menu and push MENU again.
4. Scroll to Acquisition Control Menu and push MENU again.
5. Scroll to Max Hold is: Off and push MENU again. This line will change to
Max Hold is: On. The monitoring function is now ready to activate.
6. Repeatedly push MENU until the instrument returns to normal operation.
ac 0.000 ft
O
N
1502C MTDR User Manual
O
F
F
Figure 1–30: Waveform Viewed in Normal Operation
7. When you are ready to monitor this cable for intermittents, push STORE.
The 1502C will now capture any changes in the cable.
1–29
Page 48

Operating Instructions
ac 0.000 ft
O
N
Captured
changes
O
N
Figure 1–31: Waveform Showing Intermittent Changes
8. To exit monitor mode, push STORE again.
9. To exit Max Hold, access the Acquisition Control Menu again, turn off Max
Hold, and push MENU repeatedly until the instrument returns to normal
operation.
Pulse On/Off
This feature puts the 1502C in a “listening mode” by turning off the pulse
generator.
1. Attach a cable to the 1502C front-panel CABLE connector.
2. Push MENU to access the Main Menu.
3. Scroll to Setup Menu and push MENU again.
4. Scroll to Acquisition Control Menu and push MENU again.
5. Scroll to Pulse is: On and push MENU again. This will change to Pulse is:
Off.
ac 0.000 ft
O
N
O
F
F
O
F
F
O
F
F
1–30
Figure 1–32: Waveform Display with No Outgoing Pulses
1502C MTDR User Manual
Page 49

Operating Instructions
6. Repeatedly press MENU until the instrument returns to normal operation.
CAUTION. This function is used mostly for troubleshooting by qualified technicians. It is not recommended that you use the 1502C as a stand-alone monitoring device. The input circuitry is very sensitive and can be easily damaged by
even moderate level signals.
NOTE. In this mode, the 1502C is acting as a detector only. Any pulses detected
will not originate from the instrument, so any distance readings will be invalid.
If you are listening to a local area network, for example, it is possible to detect
traffic, but not possible to measure the distance to its origin.
Pulse is: Off can be used in conjunction with Max Hold is: On.
7. To exit Pulse is: Off, access the Acquisition Control Menu again, turn the
pulse back on, then repeatedly push MENU until the instrument returns to
normal operation.
Single Sweep
The single sweep function will acquire one waveform only and display it.
1. Attach a cable to the 1502C front-panel CABLE connector.
2. Push MENU to access the Main Menu.
3. Scroll to Setup Menu and push MENU again.
4. Scroll to Acquisition Control Menu and push MENU again.
5. Scroll to Single Sweep is: Off and push MENU again. This will change to
Single Sweep is: On.
6. Repeatedly press MENU until the instrument returns to normal operation.
7. When you are ready to begin a sweep, push VIEW INPUT. A sweep will
also be initiated when you change any of the front-panel controls. This
allows you to observe front panel changes without exiting the Single Sweep
mode.
As in normal operation, averaged waveforms will take longer to acquire.
1502C MTDR User Manual
1–31
Page 50

Operating Instructions
ac 0.000 ft
O
F
F
O
F
F
O
F
F
O
F
F
Figure 1–33: A Captured Single Sweep
8. To exit Single Sweep is: On, access the Acquisition Control Menu again, turn
the Single Sweep back off, then repeatedly push MENU until the instrument
returns to normal operation.
1–32
1502C MTDR User Manual
Page 51

Operator Tutorial
This chapter will show, step by step, the features and uses of the 1502C.
What is the Tektronix 1502C?
The Tektronix 1502C Metallic Time-Domain Reflectometer is a short range
metallic cable tester capable of finding faults in metal cable. Tests can be made
on coaxial cable, twisted pair, or parallel cable.
How Does It Do It?
The 1502C sends an electrical pulse down the cable and receives reflections back
made by any discontinuities. This is known as time-domain reflectometry. The
1502C is sensitive to impedance changes. Problems in the cable will be detected
and displayed as changes in impedance along the cable. These will be displayed
as hills and valleys in the reflected pulse. The 1502C is capable of finding shorts,
opens, defects in the shield, foreign substances in the cable (e.g., water), kinks,
and more. Even though other instruments might show a cable as good, the
1502C can show many previously hidden faults.
You, the Operator
Menus and Help
The 1502C is a highly accurate cable tester. It is easy to use and will provide
fast, accurate measurements. Because of electrical and environmental differences
in cables and their applications, each waveform will likely differ. The best way
to learn these differences is experience with the instrument. You are the 1502C’s
most important feature.
Experiment with different cables in known conditions and see how they
compare. Subject cables to situations you might find in your application and
learn the effects. We have included some examples of cable faults in this manual
to help you gain familiarity. With practice, you will quickly become familiar
with even the most subtle differences in waveforms, thereby increasing the value
of the 1502C in locating problems.
The 1502C is equipped with various help screens. Simply press MENU for
assistance. The instrument will prompt you. More information on MENU is
located in the Operating Instructions chapter of this manual.
1502C MTDR User Manual
2–1
Page 52

Operator Tutorial
Getting Started
Let’s start by inspecting a cable. For the next few examples, we will use the
3-foot precision test cable provided with the 1502C (Tektronix part number
012–1350–00).
1. Pull on the POWER switch. The instrument will initialize, give instructions
for accessing the menu, and enter normal operation mode.
2. Set the 1502C front-panel controls to:
CABLE Attach 3-ft cable
NOISE FILTER 1 avg
VERT SCALE 500 mr (default)
DIST/DIV 1 ft/div (0.25 m if using metric)
Vp .66
NOTE. Vp (velocity of propagation) of the test cable is important for making
accurate distance measurements. If you do not know the Vp factor of a cable,
distance readings will be directly affected. You can get a general idea from the
table on page 1–12 or find the Vp with a sample piece of cable using the
procedure on page 1–12, or use the Cable Information Menu. If it is impossible
to obtain the Vp of the cable, the instrument will still show cable faults, but the
distance readings might be erroneous. The test cable used in this tutorial has a
Vp of .66.
VERT SCALE will already be set to 500 mr (default). The cursor will be near
the leading edge of the incident pulse (at the point on the waveform representing
the front panel). Other information displayed includes the type of power used (ac
or bat) and the distance window in the upper right corner of the LCD displays
the distance from the front panel to the cursor (0.000 ft in this case). This data
will be displayed when the instrument is turned on. Switch status and other
instrument functions are also displayed (see Figure 1–4 on page 1–6 for
descriptions).
2–2
1502C MTDR User Manual
Page 53

Operator Tutorial
ac 0.000 ft
O
N
O
F
F
Figure 2–1: Display Showing 3-ft Cable in Start-Up Conditions
3. The rising pulse on the left is the test pulse (incident pulse) leaving the
instrument. The rising reflected pulse on the right displays the echo coming
back. Turn the
n
o
POSITION control clockwise until the cursor rests on the
rising edge of the reflected pulse.
ac 3.000 ft
O
N
Reflected
Pulse
O
F
F
Incident
O
F
F
O
F
F
Pulse
Figure 2–2: Cursor of Rising Edge of Reflected Pulse
The upper right corner should read 3.000 ft. Note that the reflected pulse
rises. This is the classic signature of an open cable, a point of higher
impedance.
4. Adjust the VERT SCALE control. This will increase the height of the pulse.
For accurate measurements, the pulse should occupy most of the display.
Note that the LCD shows the VERT SCALE setting in mr. For now, set this
control to 354 mr/div.
1502C MTDR User Manual
2–3
Page 54

Operator Tutorial
ac 3.000 ft
O
N
O
F
F
O
F
F
O
F
F
Open
Figure 2–3: Waveform with VERT SCALE Increased Showing an Open
n
5. The
POSITION control moves the waveform up and down the display.
o
Adjust this for best viewing.
6. Short the end of the cable with an electrical clip or other suitable device. See
the pulse take a dive? That is the classic signature of a short, a point of lower
impedance.
ac 3.000 ft
O
N
O
F
F
Short
O
F
F
O
F
F
Figure 2–4: Waveform with Short
The distance window still reads 3.000 ft. If the short is not directly across the
conductors of the BNC (e.g., needle nose pliers) the downward edge of the
waveform might be slightly past the cursor, indicating the length of the
shorting device (e.g., jumper wire).
7. Remove the short.
With a little practice, you will be able to identify many kinds of cable faults.
2–4
1502C MTDR User Manual
Page 55

The Waveform Up Close
Operator Tutorial
It helps to know what makes up a pulse. Here is the waveform anatomy using the
3-foot test cable as an example:
n
o
1. Turn the
POSITION control counterclockwise until the distance window
reads –2.000 ft. The cursor will be on the far left side of the display and the
reflected pulse will be near center.
2. Set the 1502C front-panel controls:
CABLE 3-ft test cable, no short
NOISE FILTER 1 avg
VERT SCALE 500 mr
DIST/DIV 1 ft (0.25 m)
Vp .66
3. The first (left) step is the incident pulse, as sent from the pulse generator (see
Figure 2–5). The second step is the reflected pulse, as it bounces back from
the end of the cable. The reflected pulse and the time between pulses
provides the information needed for calculating the distance between faults
or the end of the cable.
ac –2.000 ft
O
N
O
F
F
O
F
F
O
F
F
Reflected
Pulse
Incident
Pulse
Figure 2–5: 3-foot Cable with Cursor at Far Left
n
o
4. Adjust the
POSITION control so the cursor is at the beginning of the rise
of the incident pulse. Note the distance window reads approximately
–0.520 ft. This is the distance from the front panel BNC connector to the
pulse generator circuit board inside the instrument (where the test pulse in
generated).
1502C MTDR User Manual
2–5
Page 56

Operator Tutorial
ac –0.520 ft
O
N
O
F
F
O
F
F
O
F
F
Figure 2–6: 3-foot Cable with Cursor at Incident Pulse
5. Adjust the VERT SCALE control to approximately 25 mr. Adjust the
n
POSITION control to keep the middle portion of the pulse on the display.
o
The bumps following the incident pulse are the aberrations from the internal
circuitry and reflections between the open end of the cable and the front
panel.
ac –0.520 ft
O
N
O
F
F
O
F
F
O
F
F
Front-panel
Connector
Figure 2–7: 3-foot Cable with Cursor at Incident Pulse, Vertical Scale at 25 dB
2–6
1502C MTDR User Manual
Page 57

A Longer Cable
Operator Tutorial
Longer cables might not fit in the display. Let’s demonstrate that with a longer
cable.
Obtain a known length of 50 W cable. For this example, we are using a coaxial
cable approximately 452 feet long. Your cable length will probably differ, but the
following test procedure remains fundamentally correct for any cable length up
to 2,000 feet.
1. Set the 1502C front-panel controls:
CABLE available longer cable
NOISE FILTER 1 avg
VERT SCALE 500 mr
DIST/DIV 50 ft (25 m)
Vp appropriate setting for your cable
2. With these settings, we can view the entire cable. By placing the cursor at
the rise of the reflected pulse, we can see this particular cable is 452.000 ft.
ac 452.000 ft
O
N
O
F
F
O
F
F
O
F
F
Figure 2–8: Cursor on End of Longer Cable
3. By decreasing the DIST/DIV control, the cable can be more closely
inspected at the point of the cursor. Decrease the DIST/DIV to 10 ft/div. This
has expanded the cable across the display.
n
o
4. Turn the
POSITION control counterclockwise. Note that the distance
window changes as you scroll down the cable. In reality, you are electrically
inspecting the cable, foot by foot.
1502C MTDR User Manual
2–7
Page 58

Operator Tutorial
ac 362.800 ft
O
N
Cursor
Ohms-at-Cursor
O
F
F
O
F
F
O
F
F
Cable Scrolling
in this direction
Figure 2–9: Scrolling Down the Cable
NOTE. When testing a long cable, it is helpful to set DIST/DIV to a higher setting
when scrolling to either end of the cable. For example, if testing a 1,500-ft cable,
it would be very tiring to scroll the entire length from end to end at 1 ft/div.
Using the long cable as an example, we can find the impedance at the cursor.
1. Set the 1502C front-panel controls:
CABLE available longer cable
NOISE FILTER 1 avg
VERT SCALE 500 mr
DIST/DIV 50 ft (25 m)
Vp .66 (or whatever your cable is)
2. Press MENU.
3. Scroll to Setup Menu and press MENU again.
4. Scroll to Ohms at Cursor is: Off and press Menu. This line will then change
to Ohms at Cursor is: On.
5. Press MENU repeatedly until the instrument returns to normal operation
mode.
n
o
6. Turn the
POSITION control to set the cursor near the end of the cable as
illustrated (see Figure 2–10).
In our example, you see the distance reading is 408.000 feet and the
ohms-at-cursor is 59.5 W. The ohms-at-cursor tells you that the loss in the
cable results in an impedance measurement of 59.5 W. You may then assume
2–8
1502C MTDR User Manual
Page 59

Operator Tutorial
50 W impedance plus 9.5 W series resistance. You can check this by putting a
known reference on the end of the cable and measuring its impedance with
ohms-at-cursor. The difference between the actual reading and the expected
reference reading is the series resistance.
ac
O
N
O
F
F
O
F
F
O
F
F
408.000 ft
59.5 W
Ohms-at-Cursor
Readout
Figure 2–10: Ohms-at-Cursor
n
o
7. Turn the
POSITION control to set the cursor near the beginning of the
cable. In this example, the ohms-at-cursor reading is 50.9 W at 17.880 feet.
There is less loss at the beginning of the cable because there is less series
resistance.
ac
O
N
17.880 ft
50.9 W
1502C MTDR User Manual
O
F
F
O
F
F
O
F
F
Figure 2–11: Ohms-at-Cursor Near Beginning of Cable
n
8. Turn the
o
POSITION control clockwise to set the cursor past the reflected
pulse. Note that the ohms-at-cursor reading is ≥1 kW.
2–9
Page 60

Operator Tutorial
ac
578.000 ft
>=1 K W
O
N
O
F
F
O
F
F
O
F
F
Figure 2–12: Ohms-at-Cursor Beyond Reflected Pulse
n
o
9. Turn the
POSITION control to move the cursor to the far left side of the
display (–2.000 ft). Note that the ohms-at-cursor reading is now < 1 W.
ac
O
N
O
F
F
–2.000 ft
< 1 W
O
F
F
O
F
F
Figure 2–13: Ohms-at-Cursor Beyond Reflected Pulse
If the cursor is placed too near a fault, the reflection will not have stabilized,
which will make the ohms-at-cursor reading misleading. This is especially true
very near the instrument where some aberrations are still significant. See the
Ohms-at-Cursor section of the Operating Instructions chapter for more on the
limitations of this feature.
2–10
1502C MTDR User Manual
Page 61

Noise
Operator Tutorial
On a longer cable, “grass” might appear on the displayed waveform. This is
primarily caused by the cable acting as an antenna, picking up nearby electrical
noise.
1. Set the 1502C front-panel controls:
CABLE 3-ft cable
NOISE FILTER 1 avg
VERT SCALE 500 mr
DIST/DIV 1 ft (0.25 m)
Vp .66
n
o
POSITION 40.000 ft
2. Attach the 50 W terminator to the end of the test cable using the female-to-
female BNC adaptor (both of these items are supplied with the instrument).
n
3. Increase VERT SCALE to 1.00 mr. Use the
POSITION control to keep
o
the waveform on the display. As the VERT SCALE setting increases, there
will be noise in the form of a moving, fuzz-like waveform with a few
random spikes.
ac 40.000 ft
O
N
O
F
F
O
F
F
O
F
F
Figure 2–14: Noise on the Waveform
4. Turn the NOISE FILTER control clockwise to 8. This will average out much
of the noise.
1502C MTDR User Manual
2–11
Page 62

Operator Tutorial
ac 40.000 ft
O
N
O
F
F
O
F
F
O
F
F
Figure 2–15: Noise Reduced
5. Increase the NOISE FILTER setting to 128.
NOTE. The higher the setting, the more time the instrument takes to average the
waveform.
ac 40.000 ft
O
N
O
F
F
O
F
F
O
F
F
Figure 2–16: Noise Reduced to Minimum
6. Move the
n
POSITION control and notice how averaging restarts at a low
o
value to allow easy positioning.
The 50 W terminator was used here because it gives a good impedance match.
Because there are no large discontinuities, it appears to the instrument as an
endless cable. The noise seen in this demonstration is noise picked up on the
cable and a tiny amount of internal noise in the 1502C. When testing cables, the
noise filter is extremely effective in reducing noise.
2–12
1502C MTDR User Manual
Page 63

Set Ref (Delta Mode)
Operator Tutorial
HORZ SET REF
Horizontal Set Reference establishes the starting point at which the distance
window begins reading the distance to the cursor. If, for example, you have a
3-foot cable leading to a patch panel, you could eliminate this jumper from your
distance readings.
1. Set the 1502C front-panel controls to:
CABLE Attach 3-ft cable
NOISE FILTER 1 avg
VERT SCALE 500 mr (default)
DIST/DIV 1 ft/div (0.25 m)
NOTE. If the POWER was left on from the previous step, return the distance
window reading to 0.000 ft with the
ac 0.000 ft
O
N
O
F
F
n
o
POSITION control.
O
F
F
O
F
F
move cursor to reference and Press STORE
Figure 2–17: Incident and Reflected Pulses with Cursor at 0.00 ft
2. Turn the NOISE FILTER control counterclockwise to HORZ SET REF. The
noise filter reading on the LCD will indicate set D.
n
o
3. Adjust the
POSITION control so the cursor is on the rising edge of the
reflected pulse. In this case, the distance window should read 3.000 ft.
4. Press STORE.
1502C MTDR User Manual
2–13
Page 64

Operator Tutorial
ac 3.000 ft
O
N
O
F
F
O
F
F
O
F
F
return FILTER to desire setting . . .
Figure 2–18: Cursor at 3.000 ft
5. Turn the NOISE FILTER control to 1 avg. Note that the distance window
now reads 0.00 ftD. This means that everything from the front panel BNC to
the end of the cable is subtracted from the distance calculations. You have set
zero at the far end of the test cable.
ac 0.000 ft
O
N
O
F
F
O
F
F
O
F
F
D
Figure 2–19: New Zero Set at End of T est Cable
6. To change the HORZ SET REF position, turn the NOISE FILTER back to
HORZ SET REF and repeat the above procedure with a new cursor location.
7. To exit HORZ SET REF, do the following:
n
o
a. Set the
POSITION control to exactly 0.00 ft (you might have to set
DIST/DIV to .1 ft/div).
b. Push STORE.
2–14
c. Turn the NOISE FILTER control to the desired noise setting.
1502C MTDR User Manual
Page 65

Operator Tutorial
VERT SET REF
This control is nearly the same as HORZ SET REF except it sets the vertical
zero reference. It would be helpful to read the section of VERT SET REF in the
Operating Instructions chapter to give you some technical background.
The VERT SET REF function allows manual control of the vertical calibration
of the 1502C. This can be used to compensate for cable loss or to increase the
resolution of the millirho scale. The following example shows how to compensate for cable loss.
The reflection from an open or a short at the far end of a long cable is often less
than two divisions high at 500 mr/div. This is because of the energy lost in the
cable. Here is how to correct for this loss and be able to make accurate measurements at the far end of the cable.
1. Connect the test cable.
2. Create a short across the far end of the cable.
3. Turn the NOISE FILTER all the way counterclockwise to VERT SET REF.
A prompt will appear and the LCD will indicate set ref.
ac 0.000 ft
O
N
O
F
F
O
F
F
O
F
F
Figure 2–20: Display with 3-ft Cable and NOISE FILTER turned to VERT SET REF
4. Adjust the VERT SCALE control until the reflection from the short is two
divisions high.
5. Push STORE.
1502C MTDR User Manual
2–15
Page 66

Operator Tutorial
ac 0.000 ft
O
N
O
F
F
O
F
F
O
F
F
return FILTER to desired setting ...
Figure 2–21: VERT SCALE adjusted to Make Pulse Two Divisions High
6. Return NOISE FILTER to the desired setting.
The vertical scale now reads 500 mr/div.
Return-loss measurements at the far end of the cable (or a similar cable in that
bundle) can now be made using normal methods. To make measurements closer
or farther from the instrument requires that you reset the VERT SET REF.
NOTE. Care must be taken in changing the VERT SET REF because of the
calibration change. The 1502C automatically starts the pulse at two divisions
high. When you change the vertical reference, you essentially defeat this
function.
7. To change the VERT SET REF, turn the noise filter back to VERT SET REF
and repeat the preceding procedure.
8. If you wish to totally exit VERT SET REF, do the following:
a. Turn NOISE FILTER to VERT SET REF.
b. Turn VERT SCALE for a pulse two divisions high.
c. Push STORE.
d. Return the NOISE FILTER control to the desired setting.
This function can also be exited by turning the instrument power off and
back on again. The automatic function will adjust the pulse to two divisions
high.
2–16
1502C MTDR User Manual
Page 67

VIEW INPUT
Operator Tutorial
This push button allows you to view what is coming in the CABLE connector, or
to eliminate it from the display.
1. Set the 1502C front-panel controls to:
CABLE Attach 3-ft cable
NOISE FILTER 1 avg
VERT SCALE 500 mr
DIST/DIV 1 ft/div (0.25 m)
2. Press VIEW INPUT. The indicator block on the LCD should read OFF and
the waveform should disappear from the display.
ac 0.000 ft
O
F
F
O
F
F
O
F
F
O
F
F
Figure 2–22: Display with VIEW INPUT Turned Off
3. Press VIEW INPUT again. The indicator block will reappear and the
waveform should be displayed again.
ac 0.000 ft
O
N
O
F
F
O
F
F
O
F
F
1502C MTDR User Manual
Figure 2–23: Display with VIEW INPUT Turned On
2–17
Page 68

Operator Tutorial
This function can be used to make the display less busy when viewing stored
waveforms.
STORE and VIEW STORE
These functions allow you to store a waveform and view the stored waveform.
1. Set the 1502C front-panel controls to:
CABLE Attach 3-ft cable
NOISE FILTER 1 avg
VERT SCALE 500 mr
DIST/DIV 1 ft/div (0.25 m)
2. Make sure you have a waveform on the LCD, then adjust the
n
POSITION
o
control to place the waveform in the upper section of the display.
ac 0.000 ft
O
N
O
F
F
O
F
F
O
N
Figure 2–24: Waveform Moved to Upper Portion of the Display
3. Press STORE. The indicator block should become highlighted (black) and
read ON. The waveform is now stored in non-volatile memory in the
instrument.
4. Turn the POWER off for a few seconds, then turn it back on. Note that the
STORE indicator block is ON, showing that there is a waveform in memory.
2–18
5. Short the connector at the far end of the test cable. The reflected pulse will
invert from the previous open position.
6. Adjust the
n
POSITION control to place the waveform in the middle portion
o
of the LCD.
1502C MTDR User Manual
Page 69

Operator Tutorial
ac 0.000 ft
O
N
O
F
F
O
F
F
O
N
Figure 2–25: Waveform with Cable Shorted
7. Press VIEW STORE to view the stored waveform. What you see on the
display is the waveform you stored previously with the open cable and the
current waveform with the shorted cable.
ac 0.000 ft
O
N
O
N
O
O
FF
F
F
O
N
Stored Waveform
VIEW STORE
Current Waveform
VIEW INPUT
Figure 2–26: Waveform with Both Current and Stored Waveforms
Comparing new cables with old cables, or repaired cables with damaged cables
is easy using these two pushbuttons.
Leave the instrument in this condition for the next lesson.
1502C MTDR User Manual
2–19
Page 70

Operator Tutorial
VIEW DIFF
Press VIEW DIFF. This adds a waveform in the lower portion of the display that
is the mathematical difference between the stored waveform and the current
waveform.
ac 0.000 ft
O
N
O
N
O
O
FF
N
O
N
Difference
VIEW DIFF
Figure 2–27: Stored, Current, and Difference Waveforms
NOTE. There must be a waveform stored before it can be compared by the VIEW
DIFF function. Pressing this button with no waveform in storage will caused an
error message to be displayed.
If the stored waveform and the current waveform are identical, the difference
waveform will appear as a straight line.
2–20
1502C MTDR User Manual
Page 71

Menu-Accessed Functions
NOTE. If you get lost or confused while in a menu, repeatedly press the MENU
button until the instrument returns to normal operation mode.
Operator Tutorial
Max Hold
1. Set the 1502C front-panel controls to:
CABLE Attach 3-ft cable
NOISE FILTER 1 avg
VERT SCALE 500 mr (default)
DIST/DIV 1 ft/div (0.25 m)
2. Pull POWER on.
3. Press MENU to access the Main Menu.
n
4. Using the
POSITION control, scroll down to Setup Menu.
o
5. Press MENU to accept this selection.
6. Scroll down to Acquisition Control Menu.
7. Press MENU to accept this selection.
8. Scroll down to Max Hold is: Off.
9. Press MENU to toggle this selection. It should now read Max Hold is: On.
The Max Hold function is now ready.
10. Read the instructions on the display and press MENU again.
1502C MTDR User Manual
11. Press MENU again to exit the Acquisition Control Menu.
12. Press MENU again to exit the Setup Menu.
ac 0.000 ft
O
N
O
F
F
Figure 2–28: Display with VIEW STORE and VIEW DIFF Disabled
2–21
Page 72

Operator Tutorial
13. Press MENU again to enter normal operations mode. Note that the VIEW
STORE and VIEW DIFF indicator blocks have disappeared. This tells you
that both of these functions have been disabled.
14. Press STORE. This activates the Max Hold function. Notice that the STORE
indicator block has darkened.
15. With a clip lead or other device, short the far end of the test cable, then
remove the short. Note that both conditions now appear on the display.
ac 0.000 ft
O
N
O
N
Figure 2–29: Short and Open Viewed via Max Hold
16. Turn the
n
POSITION control counterclockwise. THe waveform will strobe
o
down the display, leaving traces of its movement.
ac 0.000 ft
O
N
O
N
Figure 2–30: Waveform Strobed Down Display in Max Hold
2–22
17. Press STORE. The display will clear, awaiting STORE to be pressed again,
which would activate another Max Hold monitor cycle.
1502C MTDR User Manual
Page 73

Operator Tutorial
You can probably see how this function is useful for monitoring lines for
changes over a period of time, or for intermittent conditions. For example:
H A coastal phone line only has problems during high tide. Overnight
monitoring reveals water in the line during the high tide period.
H A data communications line is monitored for an intermittent short. Three
days of monitoring reveals the shorts occur only during the hours of
darkness. Rodents are found in the cable ducts.
H A cable becomes defective only during daytime hours. Monitoring reveals
the line length increases (sags) during the heat of the day, shorting out on a
tree limb. During the night, the cable cools, tightens, and is no longer
shorted on the tree limb.
18. To exit Max Hold, access the Acquisition Control Menu again, turn off Max
Hold, and push MENU repeatedly until the instrument returns to normal
operation.
Pulse On / Off
1. Set the 1502C front-panel controls to:
CABLE Attach 3-ft cable
NOISE FILTER 1 avg
VERT SCALE 500 mr (default)
DIST/DIV 1 ft/div (0.25 m)
2. Pull POWER on.
3. Press MENU to access the Main Menu.
n
4. Using the
POSITION control, scroll down to Setup Menu.
o
5. Press MENU to accept this selection.
6. Scroll down to Acquisition Control Menu.
7. Press MENU to accept this selection.
8. Scroll down to Pulse is: On.
9. Press MENU to toggle this selection. It should now read Pulse is: Off.
10. Press MENU repeatedly until the instrument returns to normal operation
mode.
1502C MTDR User Manual
2–23
Page 74

Operator Tutorial
ac 0.000 ft
O
N
O
F
F
O
F
F
O
F
F
Figure 2–31: Display with Pulse Turned Off
CAUTION. This function is used mostly for troubleshooting by qualified technicians. It is not recommended that you use the 1502C as a stand-alone monitoring device. The input circuitry is very sensitive and can be easily damaged by
even moderate level signals.
Single Sweep
11. To turn the pulse back on, enter the Acquisition Control Menu again, scroll
to Pulse is: Off and press MENU to turn the pulse back on. Repeatedly press
MENU until the instrument returns to normal operation.
1. Set the 1502C front-panel controls to:
CABLE Attach 3-ft cable
NOISE FILTER 1 avg
VERT SCALE 500 mr (default)
DIST/DIV 1 ft/div (0.25 m)
2. Pull POWER on.
3. Press MENU to access the Main Menu.
4. Using the
n
POSITION control, scroll down to Setup Menu.
o
5. Press MENU to accept this selection.
6. Scroll down to Acquisition Control Menu.
7. Press MENU to accept this selection.
8. Scroll down to Single Sweep is: Off.
2–24
9. Press MENU to toggle this selection. It should now read Single Sweep is:
On.
1502C MTDR User Manual
Page 75

Operator Tutorial
10. Press MENU repeatedly until the instrument returns to normal operation.
The waveform on the display is the familiar test cable.
ac 0.000 ft
O
N
O
F
F
O
F
F
O
N
Figure 2–32: Test Cable
11. Short the far end of the test cable.
12. Press VIEW INPUT. The 1502C has done a single sweep, capturing just one
frame.
ac 0.000 ft
O
N
O
F
F
O
F
F
O
N
Figure 2–33: Captured Single Sweep of Shorted Test Cable
13. Remove the short and notice that the waveform does not change.
14. Press VIEW INPUT again and a new sweep will be made and displayed,
showing the change in the cable.
1502C MTDR User Manual
Single Sweep is useful for snap-shot tests of the cable, capturing only one
waveform.
2–25
Page 76

Operator Tutorial
15. To exit Single Sweep, access the Acquisition Control Menu again, toggle the
Single Sweep is: line back to Off, then push the MENU button repeatedly
until the instrument returns to normal operations.
TDR Questions and Answers
Q1: What does TDR stand for?
A1: Time-Domain Reflectometer.
Q2: What is the difference between time domain and frequency domain?
A2: Within the time domain, things are expressed in units of time (e.g.,
Q3: What does a TDR actually measure?
A3: Voltage over time.
nanoseconds). In frequency domain, things are expressed in frequency,
cycles per second (e.g., kiloHertz).
Q4: How does a TDR display this information?
A4: Voltage on the vertical axis (as amplitude of the waveform) and time on the
horizontal axis (as distance to the event).
Q5: Does electricity travel the same speed (velocity) in all materials?
A5: No. Electricity is like light; its velocity is affected by the material through
which it passes.
Q6: What is that difference called?
A6: The relative velocity of propagation (Vp). The velocity of the cable is
expressed in time/distance (e.g., feet per nanosecond). The velocity of
electricity traveling in a vacuum is compared to the velocity of electricity
traveling in a cable. This relationship is shown as a decimal number. A
relative propagation velocity of .50 would mean the electricity will travel at
50%, or one-half, as fast as it would in a vacuum.
Q7: If a reflection takes 30 nanoseconds to r eturn in a cable with a Vp of .66, how
far away is the point on the cable that caused the reflection?
A7: The one-way time would be 30 divided by 2, or 15 nanoseconds. The velocity
of 1 ns/ft in a vacuum would mean a distance of 15 feet. Because the cable
is slower, we multiply the distance by the Vp (.66 in this case) and arrive at
a distance of 10 feet. Of course, the 1502C does all this automatically and
displays the information on the LCD.
2–26
1502C MTDR User Manual
Page 77

Operator Tutorial
Q8: What is resistance?
A8: Resistance is the opposition to DC current flow, or DC voltage divided by DC
current.
Q9: What is impedance?
A9: Impedance is the total opposition (resistance plus reactance) a circuit offers
to the flow of alternating current at a given frequency.
Q10: What factors determine the resistance of a cable?
A10: The cross sectional area (gauge), length, and the type of material the
conductor is made of (usually copper).
Q11: What factors determine the impedance of a cable?
A11: Dielectric value of the insulation and geometry of the conductors.
Q12: Why should cables of the same impedance be used?
A12: Because a mismatch of impedance means a loss of energy at the mismatch.
Q13: Why is that important to us?
A13: Because a TDR displays the energy reflected back from an impedance
mismatch.
1502C MTDR User Manual
2–27
Page 78

Operator Tutorial
2–28
1502C MTDR User Manual
Page 79

Options and Accessories
The following options are available for the 1502C MTDR:
Option 04: YT-1 Chart Recorder
Option 04 instruments come equipped with a chart printer. Refer to the YT-1/
YT-1S Chart Recorder Instruction Manual that comes with this option for
instructions on operation, paper replacement, and maintenance. Refer to the
table on the following page for manual part numbers.
Option 05: Metric Default
Option 05 instruments will power up in the metric measurements mode.
Standard measurements may be selected from the menu, but metric will be the
default.
Option 07: YT-1S Chart Recorder
Power Cord Options
Option 07 instruments come equipped with a splashproof chart printer. Refer to
the YT-1/ YT-1S Chart Recorder Instruction Manual that comes with this option
for instructions on operation, paper replacement, and maintenance. Refer to the
table on the following page for manual part numbers.
The following power cord options are available for the 1502C TDR. Note that
these options require inserting a 0.15 A fuse in the rear panel fuse holder.
NOTE. The only power cord rated for outdoor use is the standard cord included
with the instrument (unless otherwise specified). All other optional power cords
are rated for indoor use only.
Option A1 220 VAC, 16 A, Universal Europe 161-0066-09
Option A2 240 VAC, 13 A, United Kingdom 161-0066-10
Option A3 240 VAC, 10 A, Australia 161-0066-11
Option A4 240 VAC, 15 A, North America 161-0066-12
Option A5 240 VAC, 6 A, Switzerland 161-0154-00
1502C MTDR User Manual
3–1
Page 80

Options and Accessories
Test Data Record Option
This option provides the test data record obtained during the Performance
Verification of the instrument and is limited to the primary characteristics of this
instrument type.
Option DE
German language firmware Tektronix part number 160-8999-xx.
Accessories
Standard Accessories
Optional Accessories
Internal Lead-gel Battery Assembly 016-0915-00
Replacement Fuse (AC line fuse, 115 VAC) 159-0029-01
Replacement Fuse (AC line fuse, 230 VAC) 159-0054-00
Power Cord (outdoor rated) 161-0228-00
Option Port Cover Assembly 200-3737-00
Precision 50 W Test Cable (S/N ≥B010298) 012-1350-00
50 W BNC Terminator 011-0123-00
BNC Connector, female-to-female 103-0028-00
Slide Rule Calculator 003-0700-00
Slide Application Note (bound in this manual) 062-8344-xx
Accessory Pouch 016-0814-00
Operator Manual 070-7169-xx
Service Manual 070-7168-xx
Battery Kit 040-1276-00
Chart Recorder, YT -1S 119-3616-00
3–2
Chart Recorder, YT-1S Service manual. 070–6270–xx
Chart Paper, single roll 006-7647-00
Chart Paper, 25-roll pack 006-7677-00
Chart Paper, 100-roll pack 006-7681–00
Connector, BNC male to BNC male 103-0029-00
Connector, BNC female to Alligator Clip (S/N ≥B010298) 013-0261-00
Connector, BNC female to Hook-tip Leads 013-0076-01
1502C MTDR User Manual
Page 81

Options and Accessories
Connector, BNC female to Dual Banana Plug 103-0090-00
Connector, BNC male to Dual Binding Post 103-0035-00
Connector, BNC male to N female 103-0058-00
Connector, BNC female to N male 103-0045-00
Connector, BNC female to UHF male 103-0015-00
Connector, BNC female to UHF female 103-0032-00
Connector, BNC female to Type F male 103-0158-00
Connector, BNC male to Type F female 013-0126-00
Connector, BNC female to GR 017-0063-00
Connector, BNC male to GR 017-0064-00
Terminator, 75 W BNC 011-0102-00
Adapter, Direct Current 015-0327-00
Adapter, 50/75 W * 017-0091-00
Adapter, 50/93 W * 017-0092-00
Adapter, 50/125 W * 017-0900-00
Interconnect Cable, 108 inch 012-0671-02
* These adapters should be purchased if GR connectors (Tektronix part numbers
017-0063-00 and/or 017-0064-00) are purchased.
1502C MTDR User Manual
3–3
Page 82

Options and Accessories
3–4
1502C MTDR User Manual
Page 83

Appendix A: Specifications
The tables in this chapter list the characteristics and features that apply to this
instrument after it has had a warm-up period of at least five minutes.
The Performance Requirement column describes the limits of the Characteristic.
Supplemental Information describes features and typical values or other helpful
information.
Electrical Characteristics
T able A–1: Electrical Characteristics
Characteristic Performance Requirement Supplemental Information
Excitation Pulse
Reflected Pulse ≤200 ps (0.096 feet) Vp set to 0.99; 10 to 90%, into a precision short
Aberrations ±5% peak within 0 to 10 feet after rise
±0.5% peak beyond 10 feet
Jitter ≤0.02 feet (≤40 ps) peak-to-peak Vp set to 0.99, DIST/DIV set to 0.1 ft/div
Output Impedance 50 W ±2% After risetime stabilizes into 50 W termination
Pulse Amplitude 300 mV nominal into 50 W load
Pulse Width 25 ms nominal
Pulse Repetition Time 200 ms nominal
Vertical
Scales 0.5 mr/div to 500 mr/div, >240 values Includes 1, 2, 5 sequences
Accuracy Within ±3% of full scale
Set Adj Set incident pulse within 3% Combined with VERT SCALE control
Vertical Position Any waveform point is moveable to center
screen
Displayed Noise ±5 mr peak or less, filter set to 1
±2 mr peak or less, filter set to 8
Input Susceptibility ±1 A Into diode clamps
Distance Cursor
Resolution 1/25th of 1 major division
Cursor Readout
Range –2 ft to ≥2,000 ft
Resolution 0.004 ft
Excluding front panel aberrations
At 23.4 feet to 46.8 feet, jitter is ≤0.04 feet.
1502C MTDR User Manual
A–1
Page 84

Appendix A: Specifications
T able A–1: Electrical Characteristics (Cont.)
Characteristic Supplemental InformationPerformance Requirement
Distance Measurement
Accuracy 1.6 inches or ±1% of distance measured,
whichever is greater
Cursor Ohms Readout
Range 1 W to 1 kW
Resolution 3 significant digits
Accuracy ±10% with serial cable impedance
correction (relative impedance
measurements ±2%)
Horizontal
Scales 0.1 ft/div to 200 ft/div (0.25 m/div to 50 m/div)
Range 1 ft to 2,000 ft (0.25 m to 500 m)
Horizontal Position Any distance to full scale can be moved on
screen
Vp Propagation velocity relative to air
Range 0.30 to 0.99
Resolution 0.01
Accuracy Within ±1% Included in total timebase error tolerance
Custom Option Port Tektronix Chart Recorders YT–1 and YT–1S are
designed to operate with the 1502C. Produces
a high resolution thermal dot matrix recording of
waveform and switch values.
Line Voltage 1 15 VAC (90 to 132 VAC) 45 to 440 Hz
230 VAC (180 to 250 VAC) 45 to 440 Hz
Battery Pack
Operation 8 hours minimum, 30 chart recordings maxi-
mum
Full Charge Time 20 hours maximum
Overcharge Protection Charging discontinues once full charge is
attained
Discharge Protection Operation terminates prior to battery damage
Charge Capacity 3.4 Amp-hours typical
Charge Indicator Bat/low will be indicated on LCD when capacity
reaches approximately 10%
For cables with Vp = 0.66
For delta mode measurements
Error ≤0.5% for distance ≥27 ft
Error ≤1.0% for distance ≥14 ft
Error ≤2.0% for distance ≥7 ft
Error ≤10% for distance ≥1.5 ft
Fused at 0.3 A
Fused at 0.15 A
+15°C to +25°C charge and discharge temp,
LCD backlight off. Operation of instrument with
backlight on or at temps below +10°C will
degrade battery operation specification
A–2
1502C MTDR User Manual
Page 85

Appendix A: Specifications
Environmental Characteristics
T able A–2: Environmental Characteristics
Characteristic Performance Requirement Supplemental Information
Temperature
Operating –10°C to +55°C Battery capacity reduced at other than +15°C to
+25°C
Non-operating –62°C to +85°C With battery pack removed. Storage temp with
battery pack in is –35°C to +65°C. Contents on
non-volatile memory (stored waveform) might
be lost at temps below –40°C.
Humidity to 100% Internal desiccant with cover on and option port
cover installed.
Altitude
Operating to 15,000 ft MIL–T–28800C, Class 3
Non-operating to 40,000 ft
Vibration 5 to 15 Hz, 0.06 inch p-p
15 to 25 Hz, 0.04 inch p-p
25 to 55 Hz, 0.013 inch p-p
Shock, Mechanical
Pulse 30 g, 1 1 ms 1/2 sine wave, total of 18 shocks MIL–T–28800C, Class 3
Bench Handling MIL–STD–810, Method 516, Procedure V
Operating 4 drops each face at 4 inches or 45 degrees
with opposite edge as pivot
Non-operating 4 drops each face at 4 inches or 45 degrees
with opposite edge as pivot. Satisfactory
operation after drops.
Loose Cargo Bounce 1 inch double-amplitude orbital path at 5 Hz,
6 faces
Water Resistance
Operating Splash-proof and drip-proof MIL–T–28800C, Style A, Front cover off
Salt Atmosphere Withstand 48 hours, 20% solution without
corrosion
Sand and Dust Operates after test with cover on, non-operating MIL–STD–810, Method 510, Procedure I
Washability Capable of being washed
Fungus Inert Materials are fungus inert
MIL–T–28800C, Class 3
Cabinet on, front cover off
Cabinet off, front cover off
MIL–STD–810, Method 514, Procedure XI,
Part 2
1502C MTDR User Manual
A–3
Page 86

Appendix A: Specifications
Certifications and Compliances
Category Standard or description
EC Declaration of Conformity –
EMC
Australia/New Zealand
Declaration of Conformity – EMC
EMC Compliance Meets the intent of Directive 89/336/EEC for Electromagnetic Compatibility when it is used with the
FCC Compliance Emissions comply with FCC Code of Federal Regulations 47, Part 15, Subpart B, Class A Limits.
Safety Standards
U.S. Nationally Recognized
Testing Laboratory Listing
Canadian Certification CAN/CSA C22.2 No. 231 CSA safety requirements for electrical and electronic measuring and
European Union Compliance Low Voltage Directive 73/23/EEC, amended by 93/68/EEC
Meets intent of Directive 89/336/EEC for Electromagnetic Compatibility . Compliance was demonstrated
to the following specifications as listed in the Official Journal of the European Union:
EN 50081-1 Emissions:
EN 55022 Class B Radiated and Conducted Emissions
EN 60555-2 AC Power Line Harmonic Emissions
EN 50082-1 Immunity:
IEC 801-2 Electrostatic Discharge Immunity
IEC 801-3 RF Electromagnetic Field Immunity
IEC 801-4 Electrical Fast Transient/Burst Immunity
IEC 801-5 Power Line Surge Immunity
Complies with EMC provision of Radiocommunications Act per the following standard(s):
AS/NZS 2064.1/2 Industrial, Scientific, and Medical Equipment: 1992
product(s) stated in the specifications table. Refer to the EMC specification published for the stated
products. May not meet the intent of the directive if used with other products.
UL1244 Standard for electrical and electronic measuring and test equipment.
test equipment.
EN 61010-1/A2 Safety requirements for electrical equipment for measurement,
control, and laboratory use.
Additional Compliance IEC61010-1/A2 Safety requirements for electrical equipment for measurement,
control, and laboratory use.
Safety Certification Compliance
Equipment Type Test and measuring
Safety Class Class 1 (as defined in IEC 61010-1, Annex H) – grounded product
Overvoltage Category Overvoltage Category II (as defined in IEC 61010-1, Annex J)
Pollution Degree Pollution Degree 3 (as defined in IEC 61010-1).
Installation (Overvoltage)
Category
Terminals on this product may have different installation (overvoltage) category designations. The
installation categories are:
CA T III Distribution-level mains (usually permanently connected). Equipment at this level is
typically in a fixed industrial location.
CA T II Local-level mains (wall sockets). Equipment at this level includes appliances, portable
tools, and similar products. Equipment is usually cord-connected.
CA T I Secondary (signal level) or battery operated circuits of electronic equipment.
(continued next page)
A–4
1502C MTDR User Manual
Page 87

Appendix A: Specifications
Category Standard or description
Pollution Degree A measure of the contaminates that could occur in the environment around and within a product.
Typically the internal environment inside a product is considered to be the same as the external. Products
should be used only in the environment for which they are rated.
Pollution Degree 1 No pollution or only dry, nonconductive pollution occurs. Products in this
category are generally encapsulated, hermetically sealed, or located in
clean rooms.
Pollution Degree 2 Normally only dry, nonconductive pollution occurs. Occasionally a
temporary conductivity that is caused by condensation must be
expected. This location is a typical office/home environment. Temporary
condensation occurs only when the product is out of service.
Pollution Degree 3 Conductive pollution, or dry, nonconductive pollution that becomes
conductive due to condensation. These are sheltered locations where
neither temperature nor humidity is controlled. The area is protected from
direct sunshine, rain, or direct wind.
Pollution Degree 4 Pollution that generates persistent conductivity through conductive dust,
rain, or snow. Typical outdoor locations.
Physical Characteristics
T able A–3: Physical Characteristics
Characteristic Description
Weight
without cover 14.25 lbs (6.46 kg)
with cover 15.75 lbs (7.14 kg)
with cover, chart recorder, and battery pack 19.75 lbs (8.96 kg)
Shipping Weight
domestic 25.5 lbs (11.57 kg)
export 25.5 lbs (11.57 kg)
Height 5.0 inches (127 mm)
Width
with handle 12.4 inches (315 mm)
without handle 11.8 inches (300 mm)
Depth
with cover on 16.5 inches (436 mm)
1502C MTDR User Manual
with handle extended to front 18.7 inches (490 mm)
A–5
Page 88

Appendix A: Specifications
A–6
1502C MTDR User Manual
Page 89

Appendix B: Operator Performance Checks
This appendix contains performance checks for many of the functions of the
1502C. They are recommended for incoming inspections to verify that the
instrument is functioning properly. Procedures to verify the actual performance
requirements are provided in the 1502C Service Manual.
Performing these checks will assure you that your instrument is in good working
condition. These checks should be performed upon receipt of a new instrument
or one that has been serviced or repaired. It does not test all portions of the
instrument to Calibration specifications.
The purpose of these checks is not to familiarize a new operator with the
instrument. If you are not experienced with the instrument, you should read the
Operating Instructions chapter of this manual before going on with these checks.
If the instrument fails any of these checks, it should be serviced. Many failure
modes affect only some of the instrument functions.
Equipment Required
Getting Ready
Power On
Metric Instruments
Item Tektronix Part Number
50 W precision terminator 011-0123-00
3-foot precision coaxial cable 012-1350-00
Disconnect any cables from the front-panel CABLE connector. Connect the
instrument to a suitable power source (a fully charged battery pack or AC line
source). If you are using AC power, make sure the fuse and power switch are
correct for the voltage you are using (115 VAC requires a different fuse than
230 VAC).
Pull the POWER switch on the front panel. If a message does not appear on the
display within a second or two, turn the instrument off. There are some failure
modes that could permanently damage or ruin the LCD if the power is left on for
more than a minute or so. Refer to Appendix C: Operator Troubleshooting in this
manual.
Option 05 instruments default to metric; however, you can change the metric
scale to ft/div in the Setup Menu or use the metric numbers provided. To change
the readings, press the MENU button. Using the
down to Setup Menu and press MENU again. Scroll down to Distance/Div is:
m/div and press MENU again. This will change to ft/div. Press the MENU button
repeatedly to return to normal operation mode. If the instrument power is turned
n
POSITION control, scroll
o
1502C MTDR User Manual
B–1
Page 90

Appendix B: Operator Performance Checks
off, these checks must be repeated again when the instrument is powered on
again.
Set Up
1. Horizontal Scale
(Timebase) Check
Set the 1502C front-panel controls:
NOISE FILTER 1 avg
VERT SCALE no adjustment
DIST/DIV 1 ft/div (0.25 m)
Vp .66
If the instrument fails this check, it must be repaired before any distance
measurements can be made with it.
1. Turn the 1502C power on. The display should look very similar to Fig-
ure B–1.
ac 0.000 ft
O
N
O
F
F
O
F
F
O
F
F
B–2
Figure B–1: Start-up Measurement Display
2. Connect the 3-foot cable to the front-panel CABLE connector. The display
should now look like Figure B–2.
1502C MTDR User Manual
Page 91

Appendix B: Operator Performance Checks
ac 0.000 ft
O
N
O
F
F
O
F
F
O
F
F
Figure B–2: Measurement Display with 3-foot Cable
n
o
3. Using the
POSITION control, measure the distance to the rising edge of
the waveform at the open end of the cable. The distance shown on the
display distance window (upper right corner of the LCD) should be from
2.87 to 3.13 feet (0.875 to 0.954 m).
ac 3.000 ft
O
N
O
F
F
O
F
F
O
F
F
Figure B–3: Cursor at End of 3-foot Cable
4. Change the Vp to .30.
n
o
5. Using the
POSITION control, measure the distance to the rising edge of
the waveform at the open end of the cable. The distance shown on the
display distance window should be from 1.30 to 1.42 feet (0.396 to
0.433 m).
1502C MTDR User Manual
B–3
Page 92

Appendix B: Operator Performance Checks
ac 1.360 ft
O
N
O
F
F
O
F
F
O
F
F
Figure B–4: Cursor at End of 3-foot Cable, Vp Set to .30
6. Remove the 3-foot cable and connect the 50 W terminator.
7. Change the DIST/DIV to 200 ft/div (50 m/div)
8. Turn the
distance greater than 2,000 feet (> 600 m). The waveform should be a flat
line from the pulse to this point.
n
o
POSITION control clockwise until the distance window shows a
ac 2051.000 ft
O
N
O
F
F
O
F
F
O
F
F
Figure B–5: Flat-Line Display Out to 50,0000+ Feet
n
o
9. Turn the
POSITION control counterclockwise until the distance window
shows a distance less than 10.000 feet (< 3.1 m).
10. Set the DIST/DIV control to .1 ft/div (0.025 m/div).
n
o
11. Turn the
POSITION control counterclockwise until the distance window
shows a distance of –2.000 feet (–0.611 m).
B–4
1502C MTDR User Manual
Page 93

Appendix B: Operator Performance Checks
ac –2.000 ft
O
N
O
F
F
O
F
F
O
F
F
Figure B–6: Flat-Line Display at –2.000 ft
This last step has set up the instrument for the next check.
2. Vertical Position
(Offset) Check
If the instrument fails this test, it can be used, but should be serviced when
possible. Not all of the waveforms will be viewable at all gain settings.
n
1. Using the
POSITION control, verify that the entire waveform can be
o
moved to the very top of the display (off the graticule area).
ac –2.000 ft
O
N
O
F
F
O
F
F
O
F
F
Waveform
off display
Figure B–7: Waveform Off the Top of the Display
n
2. Using the
POSITION control, verify that the entire waveform can be
o
moved to the very bottom of the display (to the bottom graticule line).
1502C MTDR User Manual
B–5
Page 94

Appendix B: Operator Performance Checks
ac –2.000 ft
O
N
O
F
F
O
F
F
O
F
F
Figure B–8: Waveform at the Bottom of the Display
Waveform
3. Noise Check
If the instrument fails this check, it can still be usable for measurements of large
faults that do not require a lot of gain, but send the instrument to be serviced
when possible. A great deal of noise reduction can be made using the NOISE
FILTER control.
n
1. Adjust the
o
POSITION control to obtain 100.000 ft (30.500 m) in the
distance window.
ac 100.000 ft
O
N
O
F
F
O
F
F
O
F
F
Figure B–9: Waveform with Gain at 5.00 mr/div
B–6
n
2. Using the
POSITION control and VERT SCALE control, set the gain to
o
5.00 mr/div. Keep the waveform centered vertically in the display.
3. Press MENU.
n
4. Using the
POSITION control, select Diagnostics Menu.
o
5. Press MENU again.
n
6. Using the
POSITION control, select Service Diagnostic Menu.
o
1502C MTDR User Manual
Page 95

Appendix B: Operator Performance Checks
7. Press MENU again.
n
8. Using the
POSITION control, select Noise Diagnostics.
o
9. Press MENU again and follow the instructions on the display.
10. Exit from Noise Diagnostics, but do not exit from the Service Diagnostic
Menu yet.
4. Offset/Gain Check
5. Sampling Efficiency
Check
If the instrument fails this check, it should not be used for loss or impedance
measurements. Send it to be serviced when possible.
1. In the Service Diagnostic Menu, select the Offset/Gain Diagnostic and
follow the directions on the display.
There are three screens of data presented in this diagnostic. The Pass/Fail level is
3% for any single gain setting tested. A failure message is displayed if the 3%
limit for any combination of gains over the three ranges is exceeded.
2. Exit from Offset/Gain Diagnostic, but do not leave the Service Diagnostic
Menu yet.
If the instrument fails this check, the waveforms might not look normal. If the
efficiency is more than 100%, the waveforms will appear noisy. If the efficiency
is below the lower limit, the waveform will take longer (more pixels) to move
from the bottom to the top of the reflected pulse. This smoothing effect might
completely hide some faults that would normally only be one or two pixels wide
on the display.
1. In the Service Diagnostic Menu, select Sampling Efficiency and follow the
directions on the screen.
2. When done with the test, press the MENU button repeatedly until the
instrument returns to normal operation.
1502C MTDR User Manual
B–7
Page 96

Appendix B: Operator Performance Checks
6. Aberrations Check
If the aberrations are out of specification, the ohms-at-cursor function might be
less accurate than specified.
1. Connect the 50 W precision terminator to the front-panel CABLE connector.
2. Set the DIST/DIV control to 5 ft/div (1 m/div).
3. Increase the VERT SCALE control to 50 mr/div.
n
4. Using the
POSITION control, move the top of the pulse to the center
o
graticule line.
ac –1.872 ft
O
N
O
F
F
O
F
F
O
F
F
Figure B–10: T op of Pulse on Center Graticule
5. Set the DIST/DIV control to 0.2 ft/div (0.05 m/div).
n
o
6. Turn the
POSITION control clockwise until the rising edge of the
incident pulse is in the left-most major division on the display.
ac 1.744 ft
O
N
O
F
F
O
F
F
O
F
F
Figure B–11: Rising Edge of Incident Pulse in Left-most Major Division
n
o
7. Using the
POSITION control, move the cursor back to 0.000 ft (0.00 m).
B–8
1502C MTDR User Manual
Page 97

Appendix B: Operator Performance Checks
All the aberrations, except the one under the cursor (see Figure B–12), must
be within one division of the center graticule line from out to 10 feet (3.5 m)
past the rising edge of the pulse.
7. Risetime Check
To verify distances past the right edge of the display, scroll along the
waveform by turning the
n
o
POSITION control clockwise.
ac 0.000 ft
O
N
O
F
F
O
F
F
O
F
F
Figure B–12: Waveform Centered, Cursor at 0.000 ft
If the risetime is out of specification, it might be difficult to make accurate
short-distance measurements near the front panel.
1. Set the 1502C front-panel controls:
NOISE FILTER 1 avg
VERT SCALE 500 mr/div
DIST/DIV 0.2 ft/div (0.05 m)
Vp .99
n
o
2. Using the
POSITION control, move the incident pulse to the center of the
display as shown below.
ac –1.432 ft
O
N
O
F
F
O
F
F
O
F
F
Figure B–13: Pulse Centered on Display
1502C MTDR User Manual
B–9
Page 98

Appendix B: Operator Performance Checks
3. Turn the VERT SCALE control clockwise until the leading edge of the
incident pulse is five major divisions high (about 205 mr).
4. Position the waveform so that it is centered about the middle graticule line.
ac –0.848 ft
O
N
O
F
F
O
F
F
O
F
F
Crosses
Lowest
Point
Figure B–14: Cursor on Lowest Major Graticule that Rising Edge crosses
n
o
5. Using the
POSITION control, and noting the distances displayed, verify
that the distance between the points where the leading edge crosses the
highest and lowest major graticule lines is less than or equal to 0.096 feet
(0.029 m).
ac –0.768 ft
O
N
O
F
F
O
F
F
O
F
F
Crosses
Highest
Point
B–10
Figure B–15: Cursor on Highest Major Graticule that Rising Edge crosses
In the above example, the distances are –0.848 feet and –0.768 feet. The
difference between these two measurements is 0.080 feet, which is well within
specification.
1502C MTDR User Manual
Page 99

Appendix B: Operator Performance Checks
8. Jitter Check
Jitter is the uncertainty in the timebase. Its main effect is that the waveform
appears to move back and forth a very small amount. If the jitter is too great, it
will affect the repeatability of very precise distance measurements.
1. Set the VERT SCALE less than or equal to 1.0 mρ/div.
2. Watch the leading edge of the pulse move and verify that this movement is
less than five pixels, or < 0.02 ft (0.006 m).
ac –1.624 ft
O
N
O
F
F
O
F
F
O
F
F
Jitter
Figure B–16: Jitter Apparent on Leading Edge of Incident Pulse
Using the Max Hold function (accessed in the Setup Menu, Acquisition Control)
can simplify your observation of jitter. Max Hold allows you to observe the
accumulated jitter without having to stare continuously at the display.
ac –1.624 ft
O
N
O
F
F
Accumulated
Jitter
O
F
F
O
F
F
Figure B–17: Jitter Captured Using Max Hold
1502C MTDR User Manual
B–11
Page 100

Appendix B: Operator Performance Checks
Conclusions
If the instrument failed Jitter or Risetime checks, it is probably still adequate for
all but extremely precise distance measurements. If it failed the Horizontal Scale
check, you should not use the instrument until the cause of the failure has been
identified and corrected.
All of the previous checks only test the major functional blocks of the instrument
that could prevent you from being able to make measurements. It is possible for
the front-panel controls or the LCD to have problems that would interfere with
controlling or displaying measurements. Most problems of this type would
become evident as you perform the checks. If you suspect a problem of this
nature, you should have the instrument checked by a qualified service technician,
using the diagnostics in the 1502C Service Manual.
If the instrument passed all of the previous checks, it is ready for use.
B–12
1502C MTDR User Manual
 Loading...