

Page 1
V1.0
1
TBMA2
`
30MHz – 300 MHz Biconical Measurement Antenna
1 Introduction
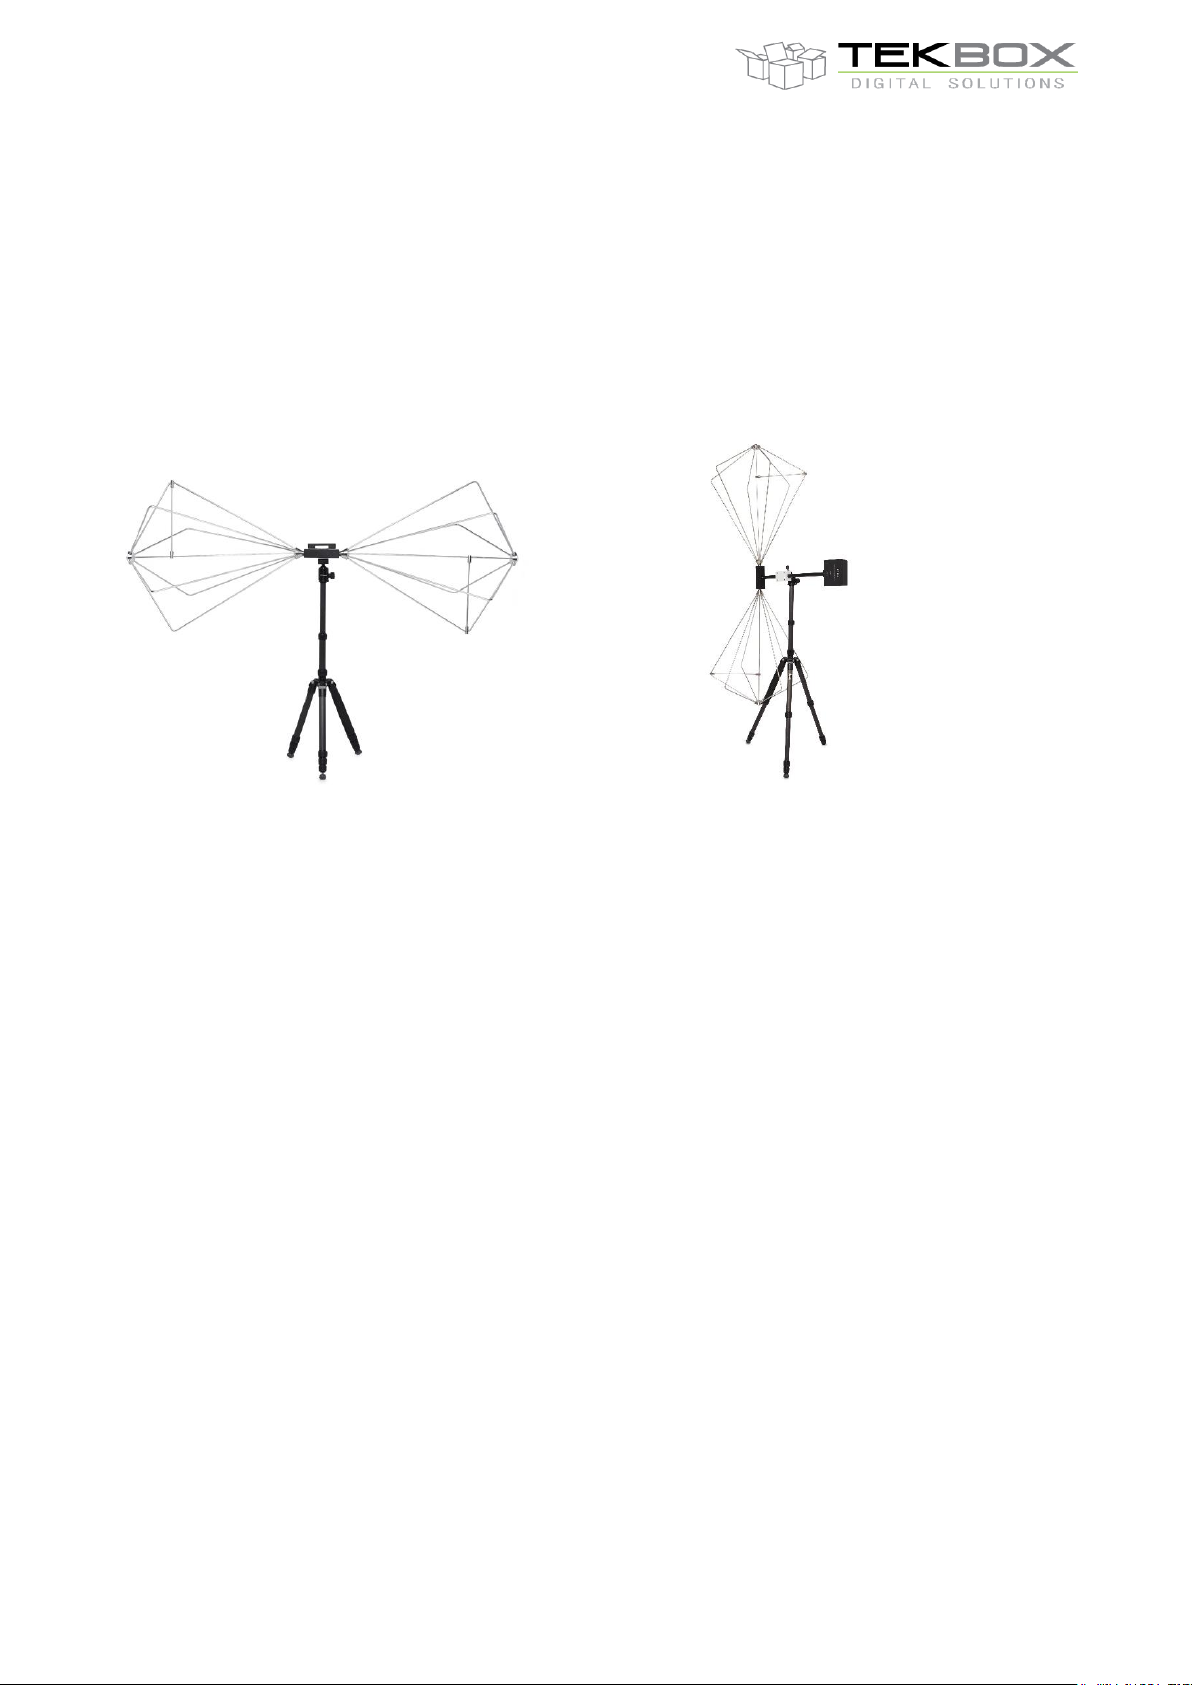
The TBMA2 is a biconical measurement antenna for EMC radiated emission testing and generating defined
field strength. With its affordable price it is an excellent choice for any lab carrying out in house pre-compliance
testing.
It is characterized from 30 MHz to 300 MHz and has a directional pattern similar to a dipole antenna.
2 Product overview
The TBMA2 comes with a POM bracket with a ¼ " thread insert for mounting the antenna on standard tripods.
The TBMA2 radiating elements are made of stainless steel parts to avoid the disadvantages of contact
degeneration over time, which are associated with non-welded designs using aluminum. The radiating
elements are not welded but fastened with grub screws, which makes assembly / disassembly simple and
makes the antenna easily storable and transportable. The antenna elements are fed via a 1:4 balun with 100
W power handling capability.
3 Technical specifications
- Type: passive biconical
- Frequency range: 30 MHz– 300 MHz
- Nominal impedance: 50 Ω
- Balun: 1:4
- Maximum continuous input RF power: 100 W
- Connector: N type female
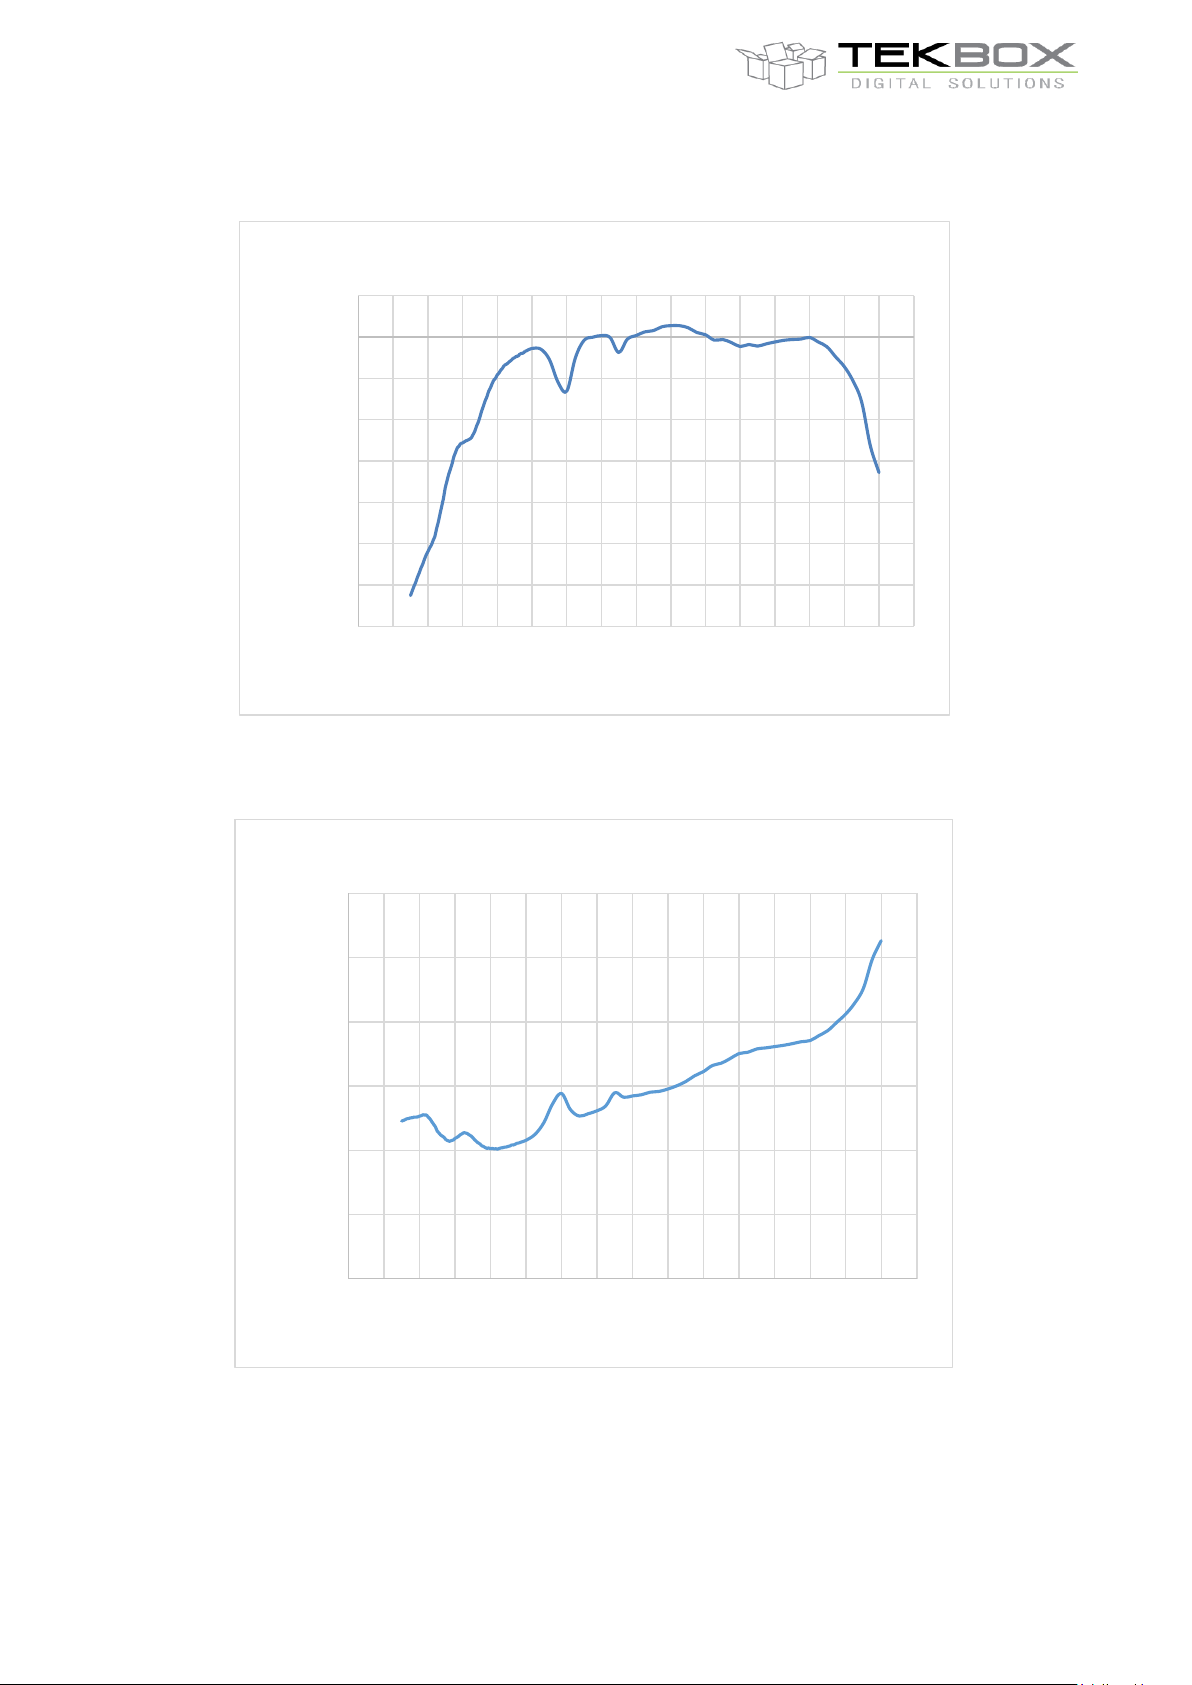
- Isotropic Gain: -12.51 to 0.55, see Figure 2 and Table 1
- Antenna Factor: 10.8 to 26.3, see Figure 3 and Table 1
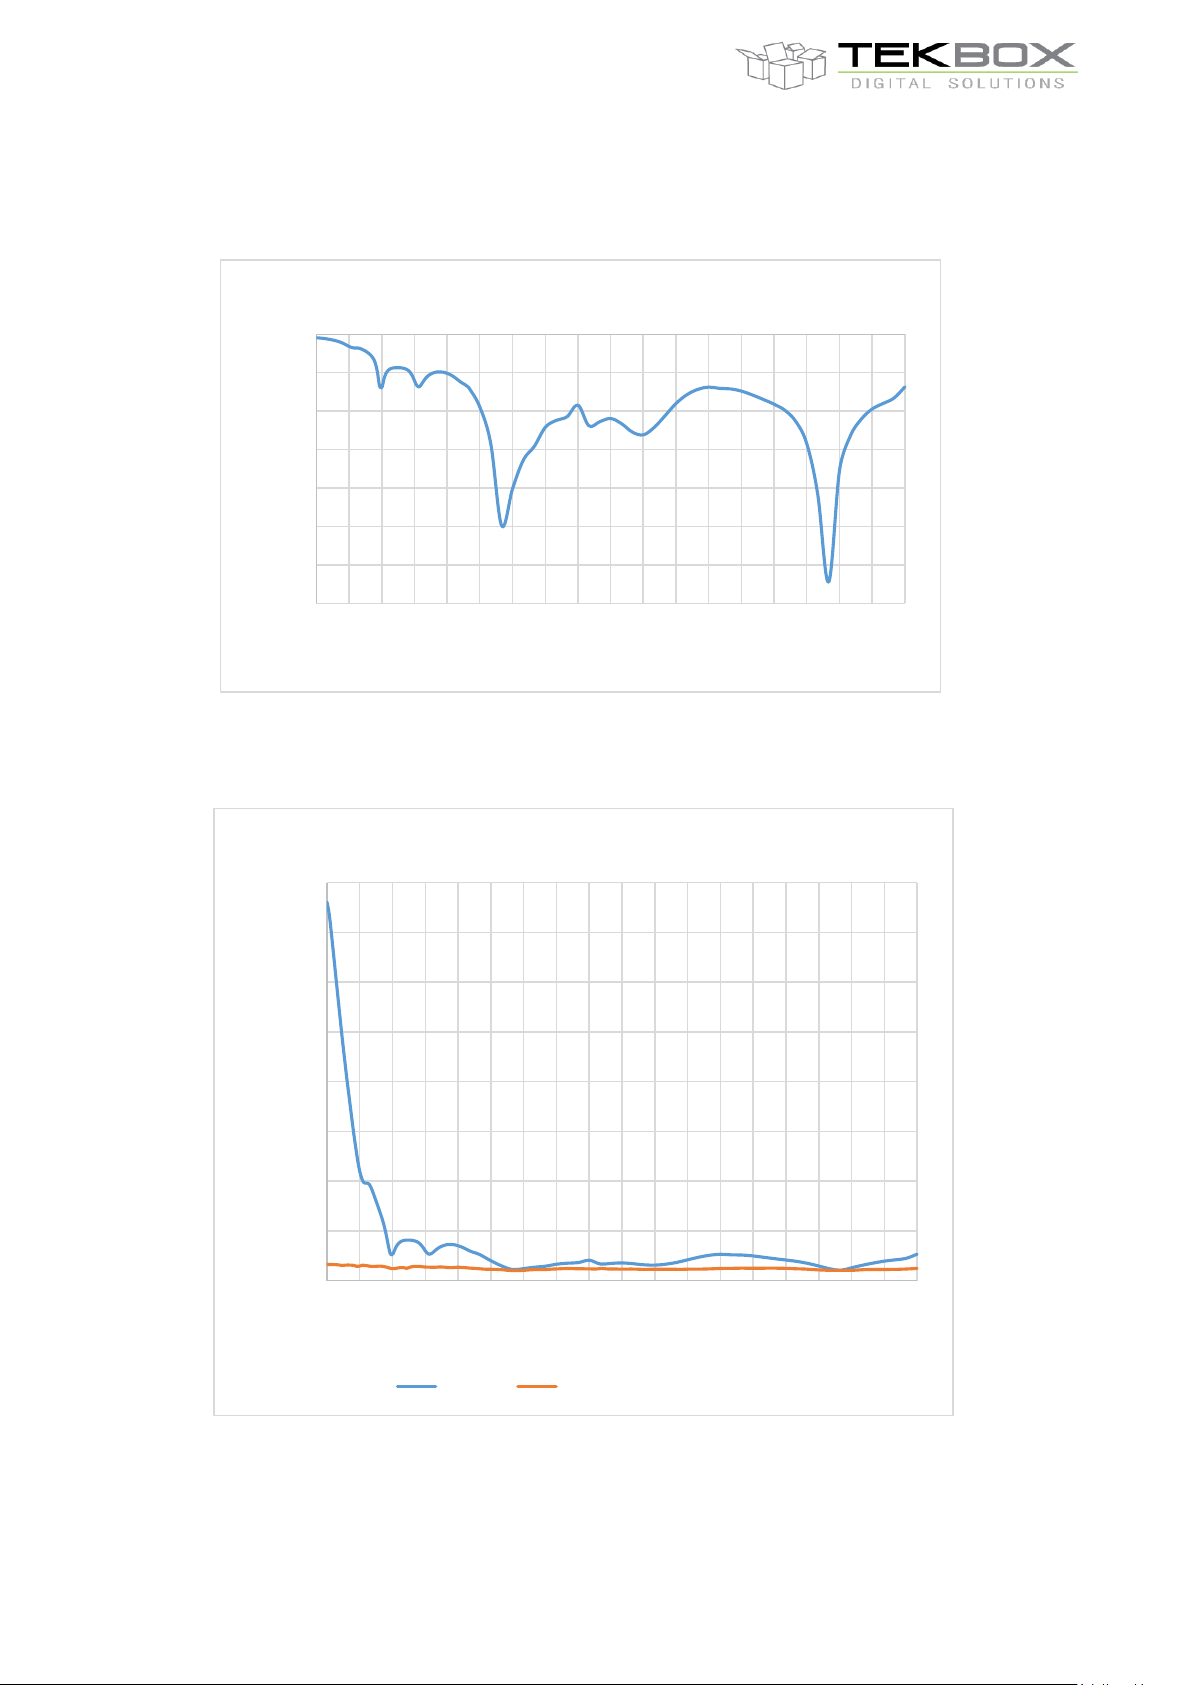
- Voltage Standing Wave Ratio (VSWR): 1.05 to 38.05, see Figure 4 and Figure 5
- Test standards: FCC, CISPR, SAE, RTCA-DO-160, Mil-STD-461, etc.
Page 2
V1.0
2
TBMA2
`
30MHz – 300 MHz Biconical Measurement Antenna
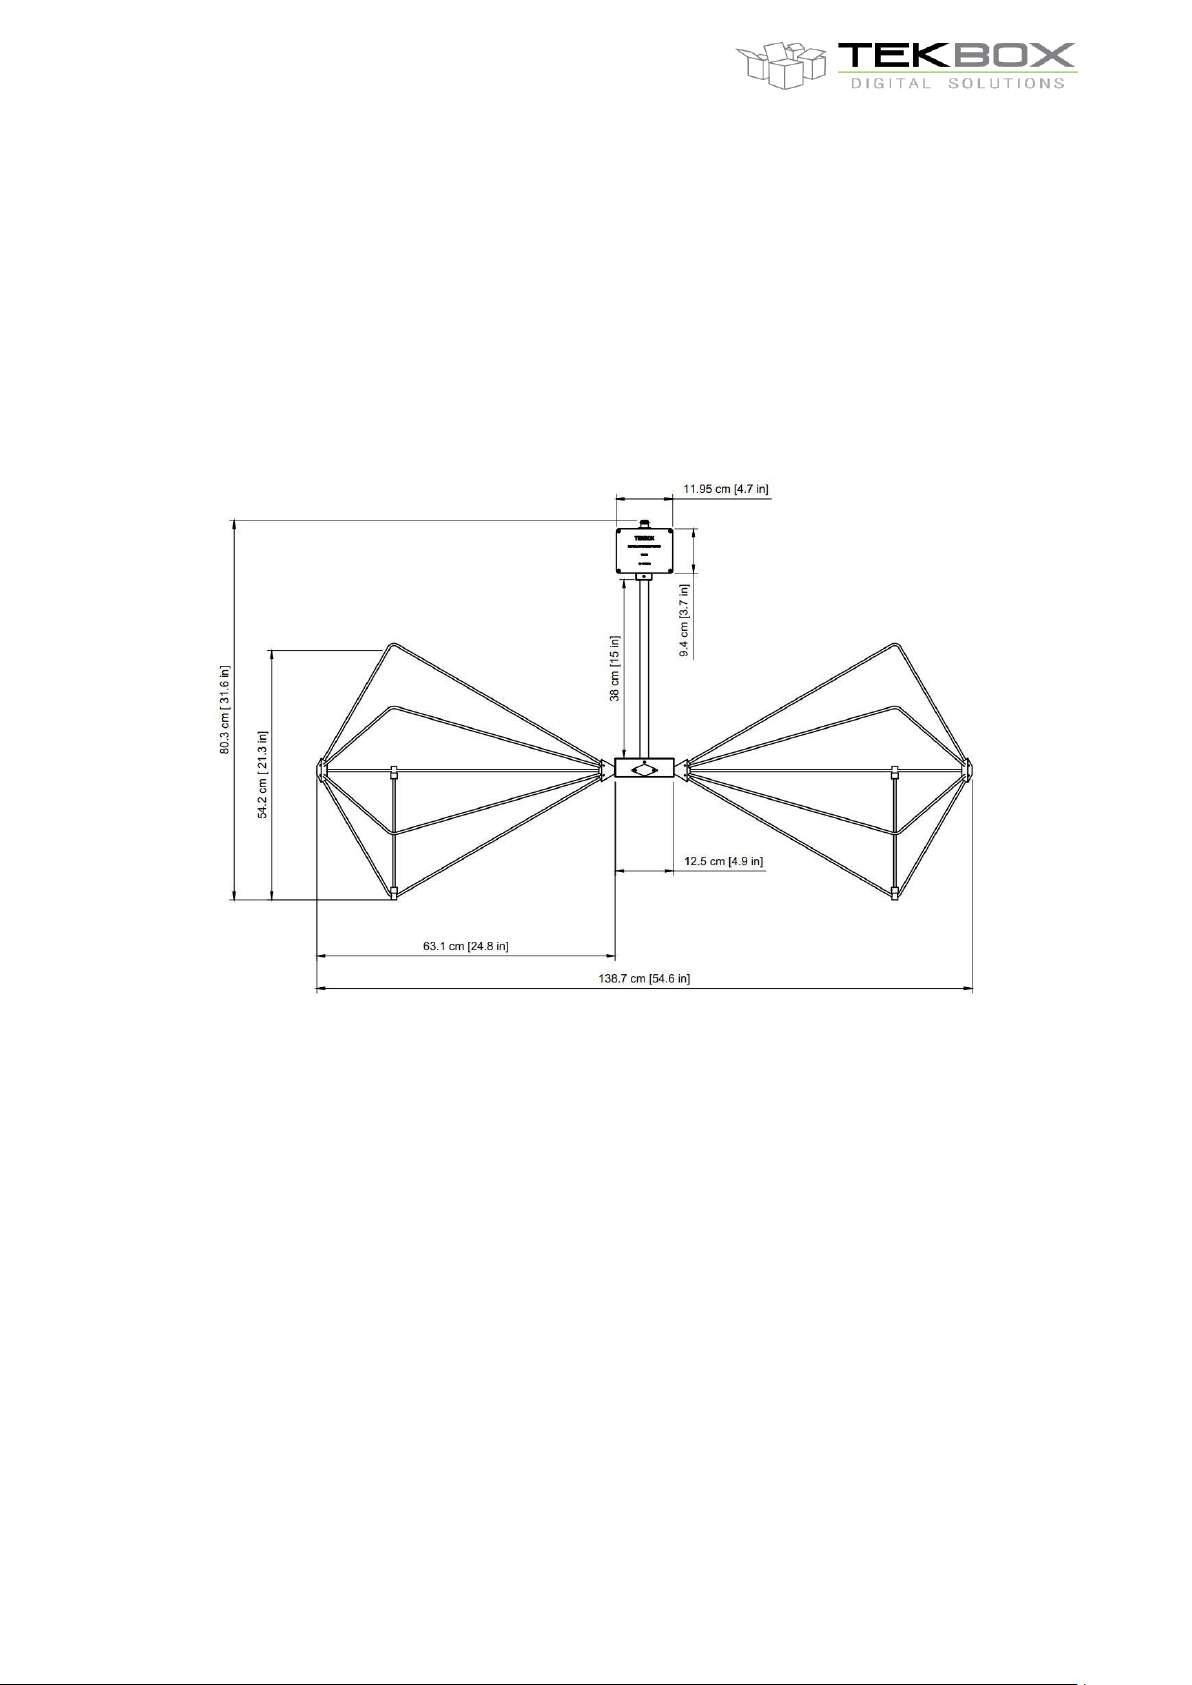
- Length: 138.7 cm (54.6 ") tip-to-tip
- Diameter: 54.2 cm (21.3 ")
- Depth: 80.3 cm (31.6 ") including balun
- Weight of one radiating element: 1.28 kg (2.82 lbs)
- Weight of holder/balun: 0.96 kg (2.12 lbs)
Figure 1: TBMA2 mechanical dimensions
4 TBMA2 Antenna characterization
The TBMA2 has been characterized according SAE-ARP-958 standard by Seibersdorf Laboratories, an
accredited Calibration Body for Antennas and Field Probes. The properties of the antenna are documented in
the table and plots on the following pages. The test report of the Seibersdorf Laboratories and parameters in
Excel format can also be downloaded from our web site.
Every TBMA2 antenna ist tested on the OATS test site of Tekbox for the antenna factor to be within ± 1.5 dB
of the results documented in the test report of Seibersdorf Laboratories.
Page 3

V1.0
3
Frequency [MHz]
Wavelength [m]
Gain (Isotropic) [dBi]
Gain (Dipole) [dBd]
Antenna Factor [dB/m]
30.00
10.00
-12.51
-14.70
12.27
31.00
9.70
-12.28
-14.40
12.32
32.00
9.40
-12.06
-14.20
12.38
33.00
9.10
-11.87
-14.00
12.46
34.00
8.80
-11.62
-13.80
12.47
35.00
8.60
-11.42
-13.60
12.52
36.00
8.30
-11.18
-13.30
12.53
37.00
8.10
-11.00
-13.20
12.58
38.00
7.90
-10.76
-12.90
12.58
39.00
7.70
-10.55
-12.70
12.59
40.00
7.50
-10.39
-12.50
12.65
41.00
7.30
-10.21
-12.40
12.69
42.00
7.10
-10.07
-12.20
12.76
43.00
7.00
-9.85
-12.00
12.74
44.00
6.80
-9.66
-11.80
12.75
45.00
6.70
-9.28
-11.40
12.57
46.00
6.50
-8.96
-11.10
12.44
47.00
6.40
-8.56
-10.70
12.22
48.00
6.20
-8.18
-10.30
12.02
49.00
6.10
-7.80
-10.00
11.83
50.00
6.00
-7.30
-9.50
11.50
51.00
5.90
-6.97
-9.10
11.34
52.00
5.80
-6.64
-8.80
11.18
53.00
5.70
-6.39
-8.50
11.09
54.00
5.60
-6.12
-8.30
10.99
55.00
5.50
-5.78
-7.90
10.80
56.00
5.40
-5.57
-7.70
10.75
57.00
5.30
-5.36
-7.50
10.69
58.00
5.20
-5.27
-7.40
10.76
59.00
5.10
-5.14
-7.30
10.78
60.00
5.00
-5.13
-7.30
10.92
61.00
4.90
-5.07
-7.20
10.99
62.00
4.80
-5.02
-7.20
11.08
63.00
4.80
-4.99
-7.10
11.20
64.00
4.70
-4.94
-7.10
11.28
65.00
4.60
-4.89
-7.00
11.37
66.00
4.50
-4.73
-6.90
11.34
67.00
4.50
-4.57
-6.70
11.31
68.00
4.40
-4.32
-6.50
11.19
69.00
4.30
-4.13
-6.30
11.13
70.00
4.30
-3.87
-6.00
10.99
71.00
4.20
-3.58
-5.70
10.83
72.00
4.20
-3.34
-5.50
10.70
73.00
4.10
-3.09
-5.20
10.57
74.00
4.10
-2.90
-5.10
10.51
75.00
4.00
-2.63
-4.80
10.35
76.00
3.90
-2.47
-4.60
10.30
77.00
3.90
-2.26
-4.40
10.21
78.00
3.80
-2.08
-4.20
10.14
79.00
3.80
-2.00
-4.20
10.18
80.00
3.70
-1.83
-4.00
10.11
81.00
3.70
-1.74
-3.90
10.14
82.00
3.70
-1.60
-3.80
10.10
83.00
3.60
-1.51
-3.70
10.12
84.00
3.60
-1.37
-3.50
10.08
85.00
3.50
-1.33
-3.50
10.14
TBMA2
`
30MHz – 300 MHz Biconical Measurement Antenna
4.1 Gain & Antenna Factor versus frequency
Page 4

V1.0
4
Frequency [MHz]
Wavelength [m]
Gain (Isotropic) [dBi]
Gain (Dipole) [dBd]
Antenna Factor [dB/m]
86.00
3.50
-1.27
-3.40
10.18
87.00
3.40
-1.19
-3.30
10.20
88.00
3.40
-1.13
-3.30
10.24
89.00
3.40
-1.04
-3.20
10.25
90.00
3.30
-1.00
-3.20
10.30
91.00
3.30
-0.93
-3.10
10.33
92.00
3.30
-0.93
-3.10
10.42
93.00
3.20
-0.82
-3.00
10.41
94.00
3.20
-0.79
-2.90
10.47
95.00
3.20
-0.78
-2.90
10.55
96.00
3.10
-0.69
-2.80
10.56
97.00
3.10
-0.66
-2.80
10.62
98.00
3.10
-0.61
-2.80
10.66
99.00
3.00
-0.58
-2.70
10.71
100.00
3.00
-0.55
-2.70
10.77
105.00
2.90
-0.58
-2.70
11.22
110.00
2.70
-1.08
-3.20
12.13
115.00
2.60
-2.18
-4.30
13.61
120.00
2.50
-2.63
-4.80
14.43
125.00
2.40
-1.01
-3.20
13.17
130.00
2.30
-0.16
-2.30
12.66
135.00
2.20
-0.01
-2.20
12.84
140.00
2.10
0.07
-2.10
13.07
145.00
2.10
-0.02
-2.20
13.46
150.00
2.00
-0.75
-2.90
14.49
155.00
1.90
-0.10
-2.30
14.12
160.00
1.90
0.07
-2.10
14.23
165.00
1.80
0.25
-1.90
14.32
170.00
1.80
0.31
-1.80
14.52
175.00
1.70
0.50
-1.70
14.58
180.00
1.70
0.55
-1.60
14.77
185.00
1.60
0.55
-1.60
15.02
190.00
1.60
0.45
-1.70
15.35
195.00
1.50
0.22
-1.90
15.80
200.00
1.50
0.11
-2.00
16.13
205.00
1.50
-0.15
-2.30
16.60
210.00
1.40
-0.12
-2.30
16.78
215.00
1.40
-0.27
-2.40
17.14
220.00
1.40
-0.46
-2.60
17.53
225.00
1.30
-0.36
-2.50
17.63
230.00
1.30
-0.44
-2.60
17.89
235.00
1.30
-0.33
-2.50
17.97
240.00
1.20
-0.24
-2.40
18.07
245.00
1.20
-0.16
-2.30
18.17
250.00
1.20
-0.12
-2.30
18.30
255.00
1.20
-0.10
-2.30
18.45
260.00
1.20
-0.02
-2.20
18.54
265.00
1.10
-0.24
-2.40
18.93
270.00
1.10
-0.47
-2.60
19.32
275.00
1.10
-0.96
-3.10
19.96
280.00
1.10
-1.43
-3.60
20.60
285.00
1.10
-2.12
-4.30
21.44
290.00
1.00
-3.14
-5.30
22.61
295.00
1.00
-5.26
-7.40
24.87
300.00
1.00
-6.56
-8.70
26.32
TBMA2
`
30MHz – 300 MHz Biconical Measurement Antenna
Table 1: TBMA2, gain and antenna factor vs. frequency
Page 5
V1.0
5
-14.00
-12.00
-10.00
-8.00
-6.00
-4.00
-2.00
0.00
2.00
0 20 40 60 80 100 120 140 160 180 200 220 240 260 280 300 320
Isotropic Gain [dBi]
Frequency [MHz]
Isotropic Gain
0.00
5.00
10.00
15.00
20.00
25.00
30.00
0 20 40 60 80 100 120 140 160 180 200 220 240 260 280 300 320
Antenna Factor [dB/m]
Frequency [MHz]
Antenna Factor
TBMA2
`
30MHz – 300 MHz Biconical Measurement Antenna
Figure 2: TBMA2 Isotropic Gain (30 MHz…300 MHz)
Figure 3: TBMA2 Antenna Factor (30 MHz…300 MHz)
Page 6
V1.0
6
0.00
5.00
10.00
15.00
20.00
25.00
30.00
35.00
40.00
30 45 60 75 90 105 120 135 150 165 180 195 210 225 240 255 270 285 300
VSWR at N Connector
Frequency [MHz]
TBMA2 VSWR
VSWR VSWR (With 6 dB Attenuator)
-35
-30
-25
-20
-15
-10
-5
0
30 45 60 75 90 105 120 135 150 165 180 195 210 225 240 255 270 285 300
Return Loss [dB]
Frequency [MHz]
TBMA2 Return Loss
TBMA2
`
30MHz – 300 MHz Biconical Measurement Antenna
4.2 TBMA2 Return Loss / VSWR
Figure 4: TBMA2 Return Loss 30 MHz … 300 MHz
Figure 5: TBMA2 VSWR 30 MHz … 300 MHz (without/ with 6 dB Attenuator)
Page 7

V1.0
7
Conversion 1 m to 3 m
subtract 9.5 dB
Conversion 1 m to 10 m
subtract 20 dB
Conversion 2 m to 3 m
subtract 3.5 dB
Conversion 2 m to 10 m
subtract 14 dB
Conversion 3 m to 10 m
subtract 10.5 dB
TBMA2
`
30MHz – 300 MHz Biconical Measurement Antenna
5 Application
The TBMA2 was designed, targeting EMC radiated noise measurements.
To make optimum use of the TBMA2, a few details need to be considered:
The TBMA2 does not contain any filters at the output port. Consequently, high amplitude signals that appear
at the RF output, especially when employing external pre-amplifiers might overdrive the spectrum analyzer
and the resulting intermodulation will cause measurement errors. In environments with high ambient noise
levels, using suitable filters may be of advantage.
The ambient noise level picked up by the antenna in an unshielded environment, combined with the base noise
level of the analyzer may already cross the radiated emission limits of certain CISPR standards, even with no
DUT present. Consequently, it may be very difficult to differentiate ambient noise and radiated noise from the
DUT in an unshielded environment.
Even turning ON/OFF the DUT to identify the radiated noise from the DUT may often not be a solution, given
the dynamic characteristics of contemporary sources of ambient noise.
A suitable procedure is first measuring the radiated noise of the DUT in a TEM cell which is placed in a shielded
tent or shielded bag. This will give an excellent overview of the emitted noise spectrum of the DUT. You can
easily identify the strongest emissions of the DUT and thereafter re-measure it in an open area test site (OATS)
with the measurement antenna. You then don´t need to confuse yourself with the entire ambient spectrum.
Simply set the center frequency of the analyzer to the critical emission frequencies of the DUT, one by one.
Choose a span as narrow as possible to zoom only at the frequency of the investigated DUT spurious. In case
that the base noise is still too high, you can use suitable external band pass filters, reduce the resolution
bandwidth of the analyzer or move the antenna closer to the DUT until you can clearly identify the DUT spurious
and measure its level. As long as you keep your antenna in the far field, you can easily convert from the actual
measurement distance to the equivalent level in 3m or 10m distance.
In case that the DUT spurious exceed the limit of the standard, take it back to your lab and use near field
probes to locate the origin of the spurious on your DUT PCBA. Take suitable measures to reduce the emissions
of your product. Track the effect of the modifications by TEM cell measurements, until the relative improvement
measured in the TEM cell matches the relative improvement required to meet the far field limits according to
the relevant standard.
Then carry out another OATS measurement of the DUT to validate, if the DUT´s radiated emissions are within
the limits when measured with an antenna.
Use following formula to convert the measurement result from the actual measurement distance to the distance
specified in the relevant standard:
where is the actual measurement distance and is the specified distance in the relevant standard
is the RF power measured in the actual measurement distance
represents the calculated equivalent RF power in the distance specified in the relevant standard
Alternatively use the conversion table below:
[dBm]
Table 2: path loss vs. measurement distance conversion
Page 8

V1.0
8
Frequency
Wavelength
Reactive Near Field Region
Radiative Near Field Region
Transition Zone
Far Field Region
MHz m m
m
m
m
30
10.00
<1.59
1.59 – 10.00
10.00 – 20.00
>20.00
35
8.60
<1.37
1.37 – 8.60
8.60 – 17.20
>17.20
40
7.50
<1.19
1.19 – 7.50
7.50 – 15.00
>15.00
45
6.70
<1.07
1.07 – 6.70
6.70 – 13.40
>13.40
50
6.00
<0.95
0.95 – 6.00
6.00 – 12.00
>12.00
55
5.50
<0.87
0.87 – 5.50
5.50 – 11.00
>11.00
60
5.00
<0.79
0.79 –5.00
5.00 – 10.00
>10.00
65
4.60
<0.73
0.73 – 4.60
4.60 – 9.20
>9.20
70
4.30
<0.68
0.68 – 4.30
4.30 – 8.60
>8.60
75
4.00
<0.64
0.64 – 4.00
4.00 – 8.00
>8.0
80
3.70
<0.59
0.59 – 3.70
3.70 – 7.40
>7.40
85
3.50
<0.56
0.56 – 3.50
3.50– 7.00
>7.00
90
3.30
<0.52
0.52 – 3.30
3.30 – 6.60
>6.60
95
3.20
<0.51
0.51 – 3.20
3.20 – 6.40
>6.40
100
3.00
<0.48
0.48 – 3.00
3.00 – 6.00
>6.00
105
2.90
<0.46
0.46 – 2.90
2.90 – 5.80
>5.80
110
2.70
<0.43
0.43-1.54
1.54-8.95
>8.95
115
2.60
<0.41
0.41-1.57
1.57-9.30
>9.30
120
2.50
<0.40
0.40-1.61
1.61-9.67
>9.67
125
2.40
<0.38
0.38-1.64
1.64-10.07
>10.07
130
2.30
<0.37
0.37-1.67
1.67-10.51
>10.51
135
2.20
<0.35
0.35-1.71
1.71-10.99
>10.99
140
2.10
<0.33
0.33-1.75
1.75-11.51
>11.51
145
2.10
<0.33
0.33-1.75
1.75-11.51
>11.51
150
2.00
<0.32
0.32-1.80
1.80-12.09
>12.09
155
1.90
<0.30
0.30-1.84
1.84-12.72
>12.72
160
1.90
<0.30
0.30-1.84
1.84-12.72
>12.72
165
1.80
<0.29
0.29-1.80
1.80-13.43
>13.43
170
1.80
<0.29
0.29-1.80
1.80-13.43
>13.43
175
1.70
<0.27
0.27-1.70
1.70-14.22
>14.22
180
1.70
<0.27
0.27-1.70
1.70-14.22
>14.22
185
1.60
<0.25
0.25-1.60
1.60-15.11
>15.11
190
1.60
<0.25
0.25-1.60
1.60-15.11
>15.11
195
1.50
<0.24
0.24-1.50
1.50-16.12
>16.12
200
1.50
<0.24
0.24-1.50
1.50-16.12
>16.12
205
1.50
<0.24
0.24-1.50
1.50-16.12
>16.12
210
1.40
<0.22
0.22-1.40
1.40-17.27
>17.27
215
1.40
<0.22
0.22-1.40
1.40-17.27
>17.27
220
1.40
<0.22
0.22-1.40
1.40-17.27
>17.27
225
1.30
<0.21
0.21-1.30
1.30-18.60
>18.60
230
1.30
<0.21
0.21-1.30
1.30-18.60
>18.60
235
1.30
<0.21
0.21-1.30
1.30-18.60
>18.60
240
1.20
<0.19
0.21-1.20
1.20-20.15
>20.15
245
1.20
<0.19
0.19-1.20
1.20-20.15
>20.15
250
1.20
<0.19
0.19-1.20
1.20-20.15
>20.15
255
1.20
<0.19
0.19-1.20
1.20-20.15
>20.15
260
1.20
<0.19
0.19-1.20
1.20-20.15
>20.15
265
1.10
<0.18
0.18-1.10
1.10-21.98
>21.98
270
1.10
<0.18
0.18-1.10
1.10-21.98
>21.98
TBMA2
`
30MHz – 300 MHz Biconical Measurement Antenna
However, when applying the conversions above, be aware, that even in the set up specified in the standards,
the measurement antenna is not in the far field across the entire frequency range. This would physically be
impossible, given the size limitations of anechoic chambers.
The following table gives an overview of the near field and far field distances from TBMA2 depending on
frequency. As an example, assuming an actual measurement distance of 10 m, the above conversions would
become valid between 60 MHz up to 120 MHz.
Page 9
V1.0
9
Part Number
Description
TBMA2
30 – 300 MHz biconical measurement antenna, plastic mounting bracket with ¼” thread
Version
Date
Author
Changes
V1.0
14.8.2020
Mayerhofer
Creation of the document
275
1.10
<0.18
0.18-1.10
1.10-21.98
>21.98
280
1.10
<0.18
0.18-1.10
1.10-21.98
>21.98
285
1.10
<0.18
0.18 –1.10
1.10-21.98
>21.98
290
1.00
<0.16
0.16 – 1.00
1.00-24.17
>24.17
295
1.00
<0.16
0.16 – 1.00
1.00-24.17
>24.17
300
1.00
<0.16
0.16 – 1.00
1.00-24.17
>24.17
TBMA2
`
30MHz – 300 MHz Biconical Measurement Antenna
Table 3: Near field / Far field vs. frequency
Note that the discontinuity in the above table between 105 MHz and 110 MHz originates from applying two
models. The first model applies for antennas physically shorter than half of the wavelength and the second
model applies for antennas physically longer than half of the wavelength. Obviously, the formulas for the two
models do not smoothly transit into each other.
6 Ordering Information
7 History
Table 4: Ordering Information
Table 5: Revision History
 Loading...