

SWR SCIENCE SenseDisc, SenseDisc Physics, SD0010, SD0030, SenseDisc Biochem Basic User Manual
...Page 1

All-In-One
USER GUIDE
Page 2
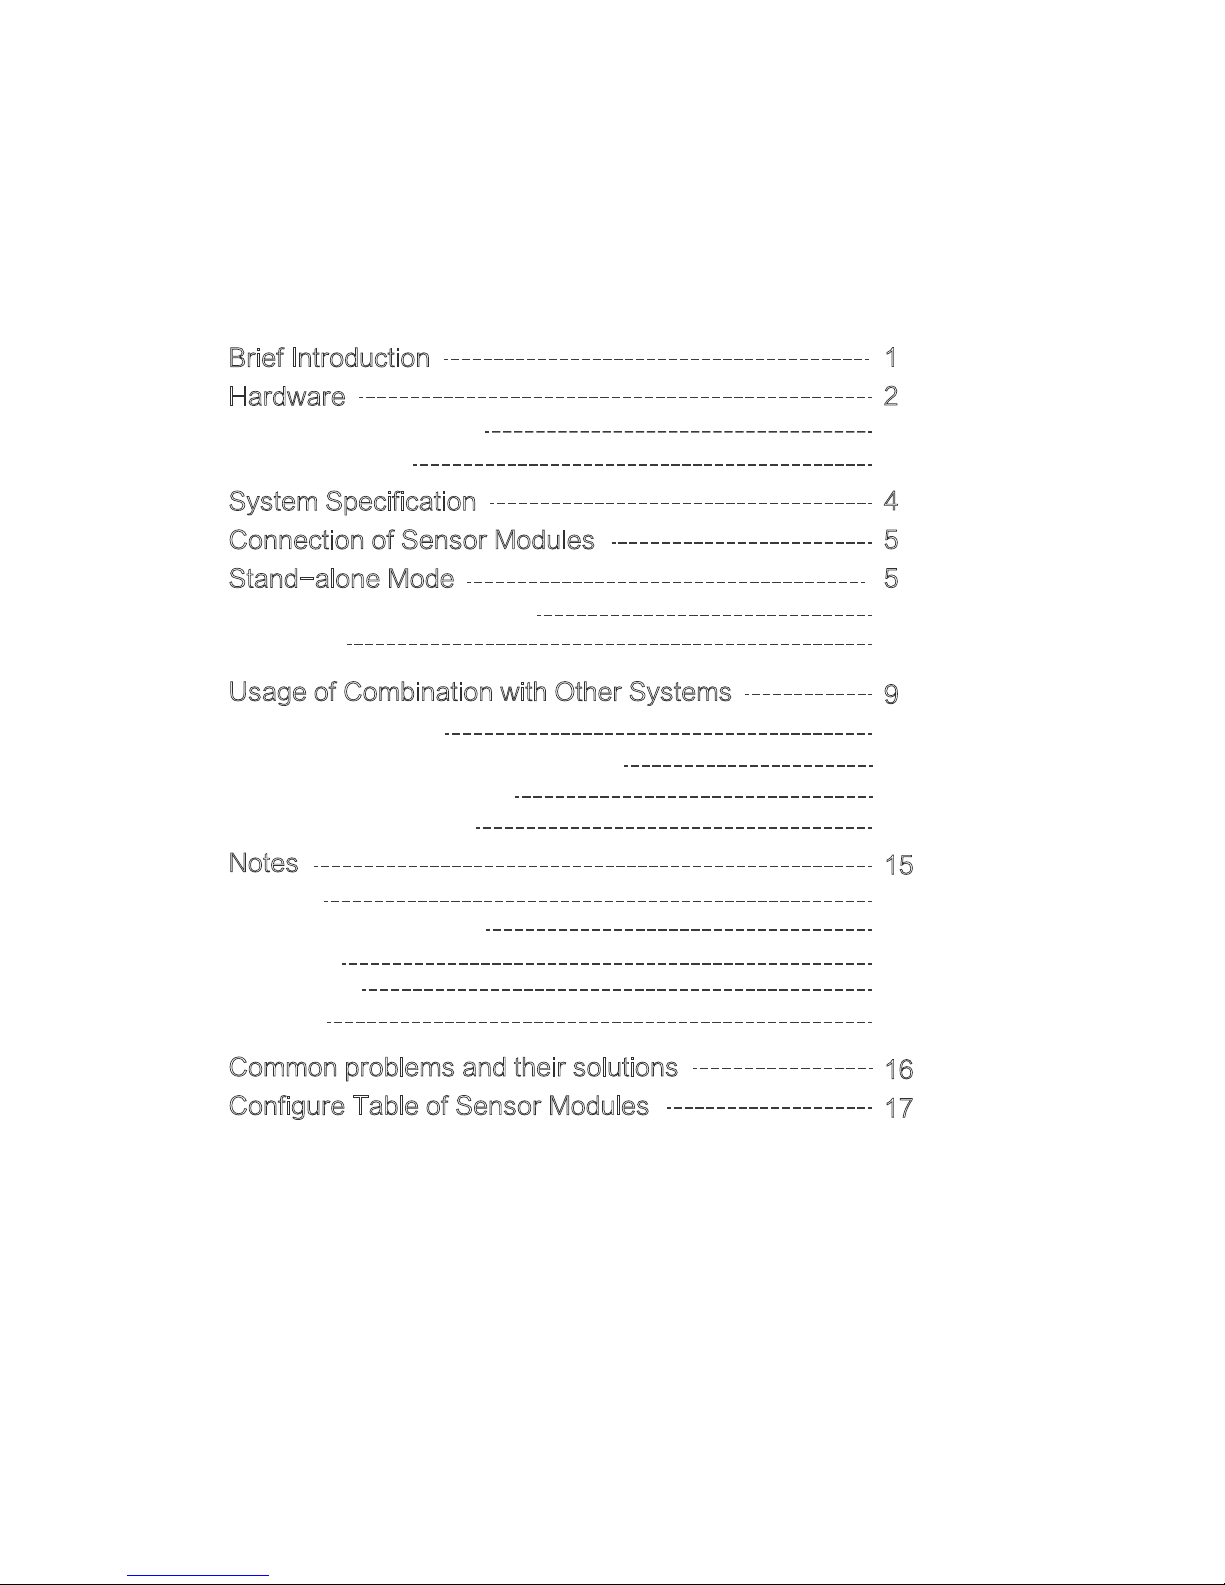
Brief Introduction
Hardware
System Specification
Connection of Sensor Modules
Stand-alone Mode
Usage of Combination with Other Systems
Notes
Common problems and their solutions
Configure Table of Sensor Modules
Contents
Standard Configuration
Buttons & ports
Interface of Built-in Software
Function
Connection Modes
Usage of Windows&Mac OSX System
Usage of Android Platform
Usage of iOS Platform
Clean
Applicable environment
Storage
Attentions
Reset
1
2
2
3
4
5
5
6
6
9
9
9
11
13
15
15
15
15
15
15
16
17
Page 3

SenseDisc is a new concept of portable digital experimental
system with powerful function, which is available to the experimental teaching of primary and secondary schools all over the
world. Equipped with wireless & exquisite sensor modules, create
a simple and safe experimental environment for students, and
they can explore the science world as they wish.
SenseDisc is a multi-channel data logger, the entire�outward
appearance designs�succinctly�naturally and human friendly.
Every sensor modules are set around data logger flexibly, and has
its own independent connection port, not stereotypical. Each
series of SenseDisc data logger, has built-in accelerometer (3
Axis), GPS, ambient temp and barometer, more diversified and
high efficient.
SenseDisc adopts 3.5' TFT 480*320 touchscreen, and a built-in
1800mAh lithium battery (over 6 months of standby time). SenseDisc has two acquisition modes to choose from, stand-alone and
external equipment mode. When connect to an external equipment, can supports the Windows, Android, Mac OSX and iOS ope
ating systems, and provided wired mode and wireless linking
methods.
1
Brief Introduction
1
Page 4
2
Hardware
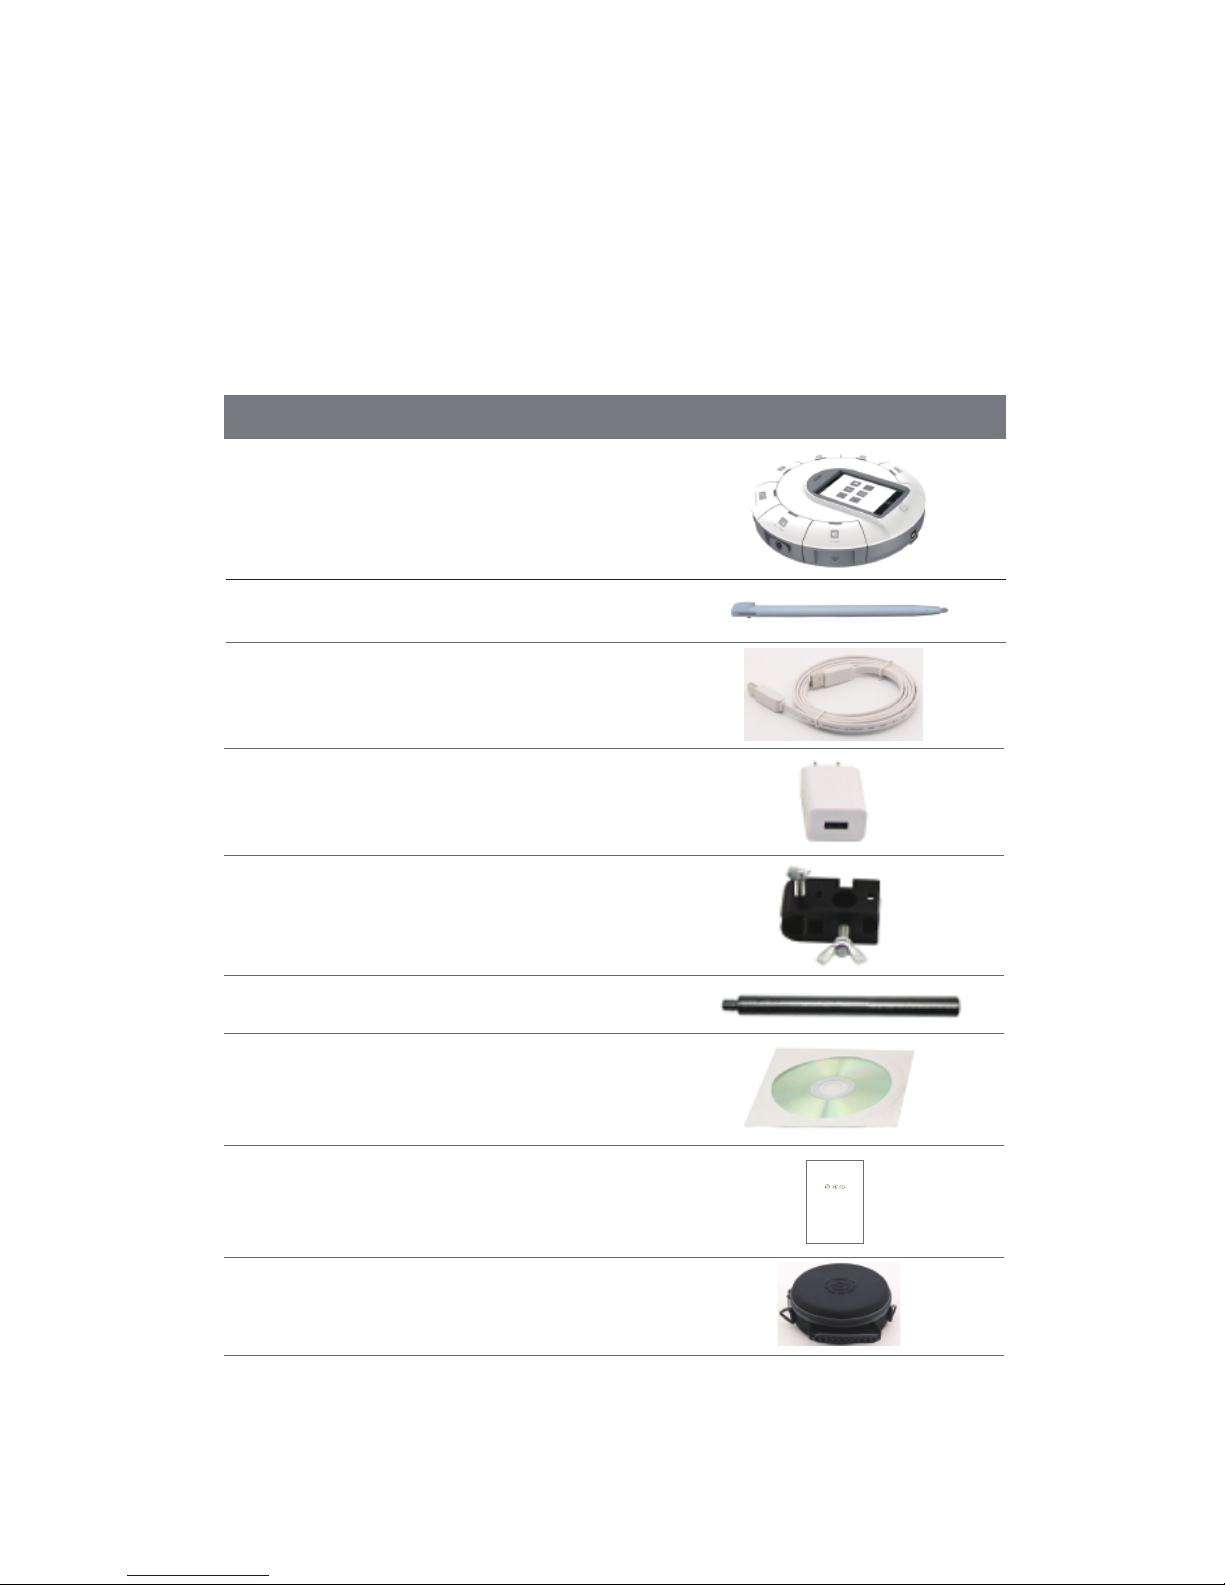
Standard Configuration
NO. Name Picture
SenseDisc Data Logger 1
2
3
4
5
6
7
8
9
Screen Stylus
USB Cable
Power Adapter
Universal Joint
Aluminium rod
Software CD
Manual
Bag
2
All-In-One
USER GUIDE
Page 5
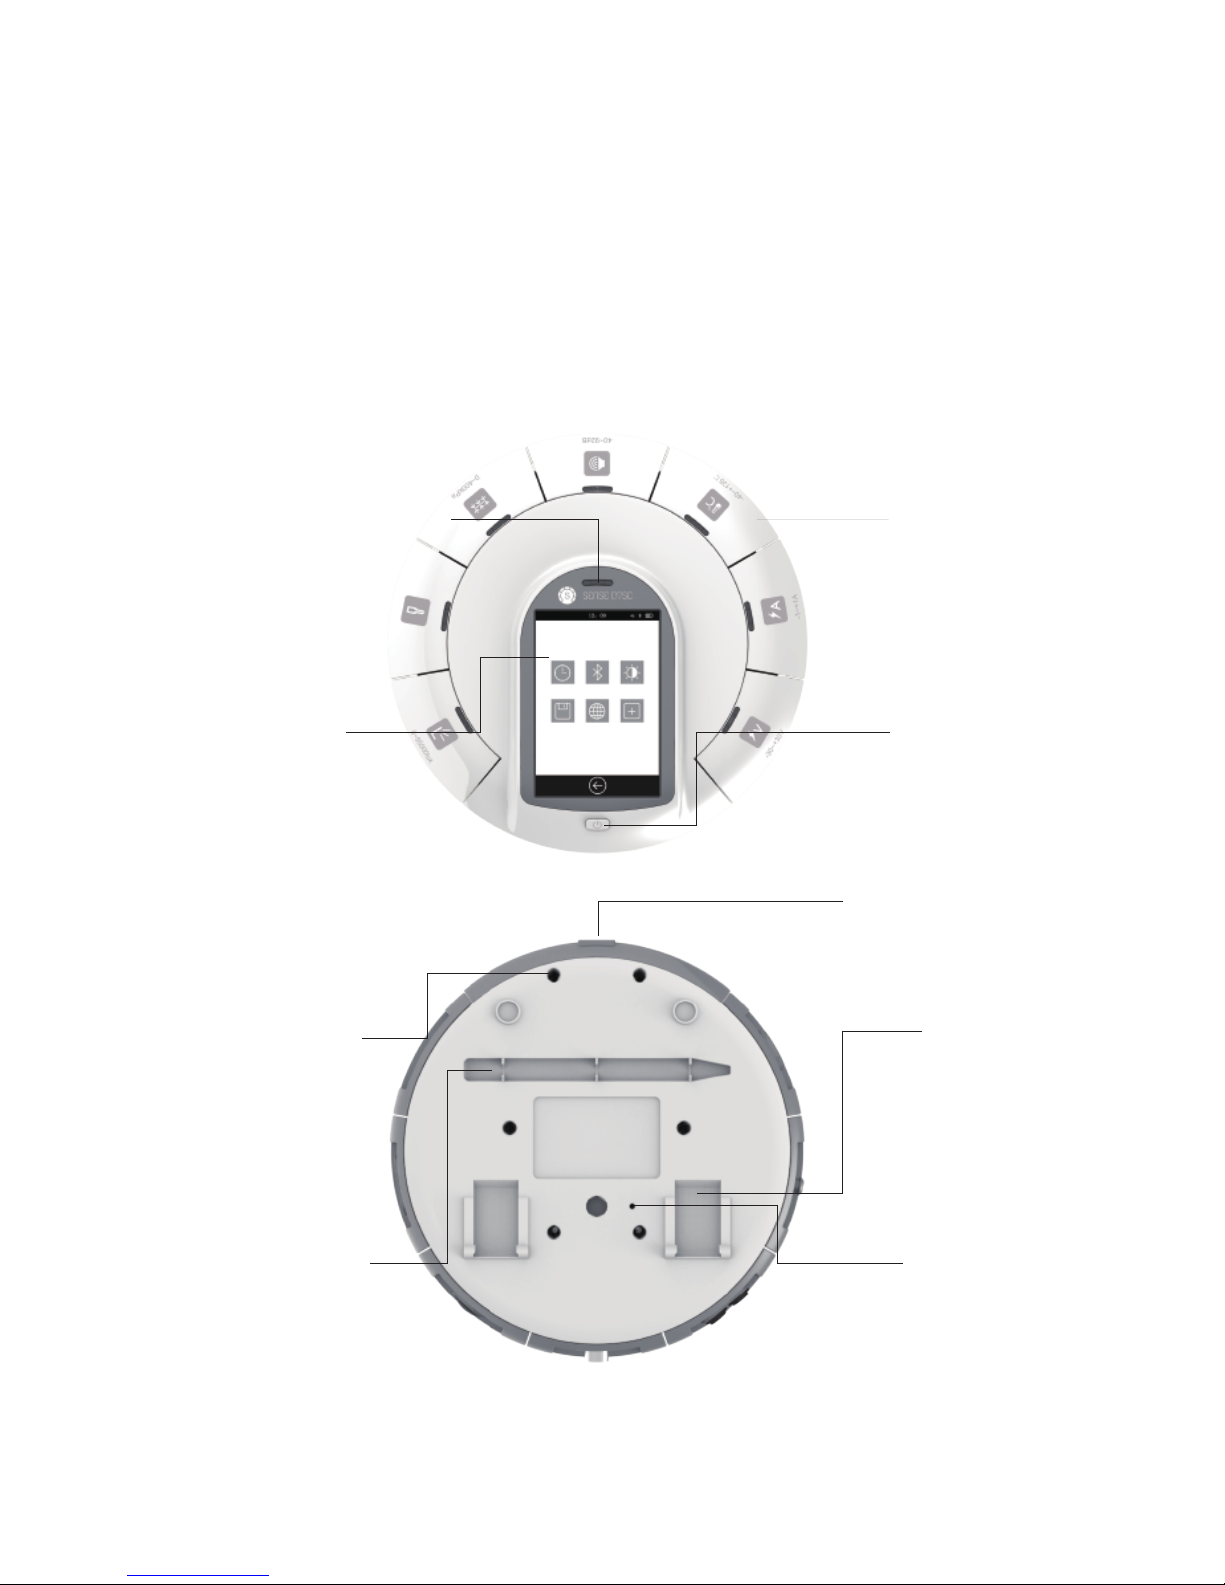
Buttons & ports
Touch Screen
Power Button
USB Port
Threaded Hole
Slot for Screen Stylus Reset Hole
Sensor Modules
Indicator Light of Power Supply
Bracket
3
Page 6

3
System Information
Platform
GPS
Stand-alone mode
Max sampling rate
Sampling Resolution 12-bit
4MStorage
Battery 1800 mAh lithium battery
Stand-by > 6 months
3.5’TFT 480*320 touch screen
USB 2.0
Screen
Port
Wireless connection √
Size ɸ=170mm, H=46mm
Temperature Range -20∽70 °C
Power Adapter 100∽240V AC / 5V DC 1A
Software SenseDisc iLab
Sensor Port 7
√
√
100,000 times/s
Stand-alone mode, Windows, iOS,
Android, Mac and etc.
Accelerometer (3 Axis), GPS, ambient temp,
barometer and etc.
Built-in sensors
(Each series of different configuration)
Item Specification
4
Page 7

4
Connection of Sensor Modules
SenseDisc uses surround-type
design philosophies, namely the
sensor modules and the data
logger to form a circle-type
connection, 7 sensor modules can
be connected to the main body
simultaneously; Using pluggable
measuring modulus, and these
modulus can according the
requirements of experiment to be
combined freely.
When in usage, only need to insert
one module into any port of the
main body. Indicated as follows:
5
Page 8
5
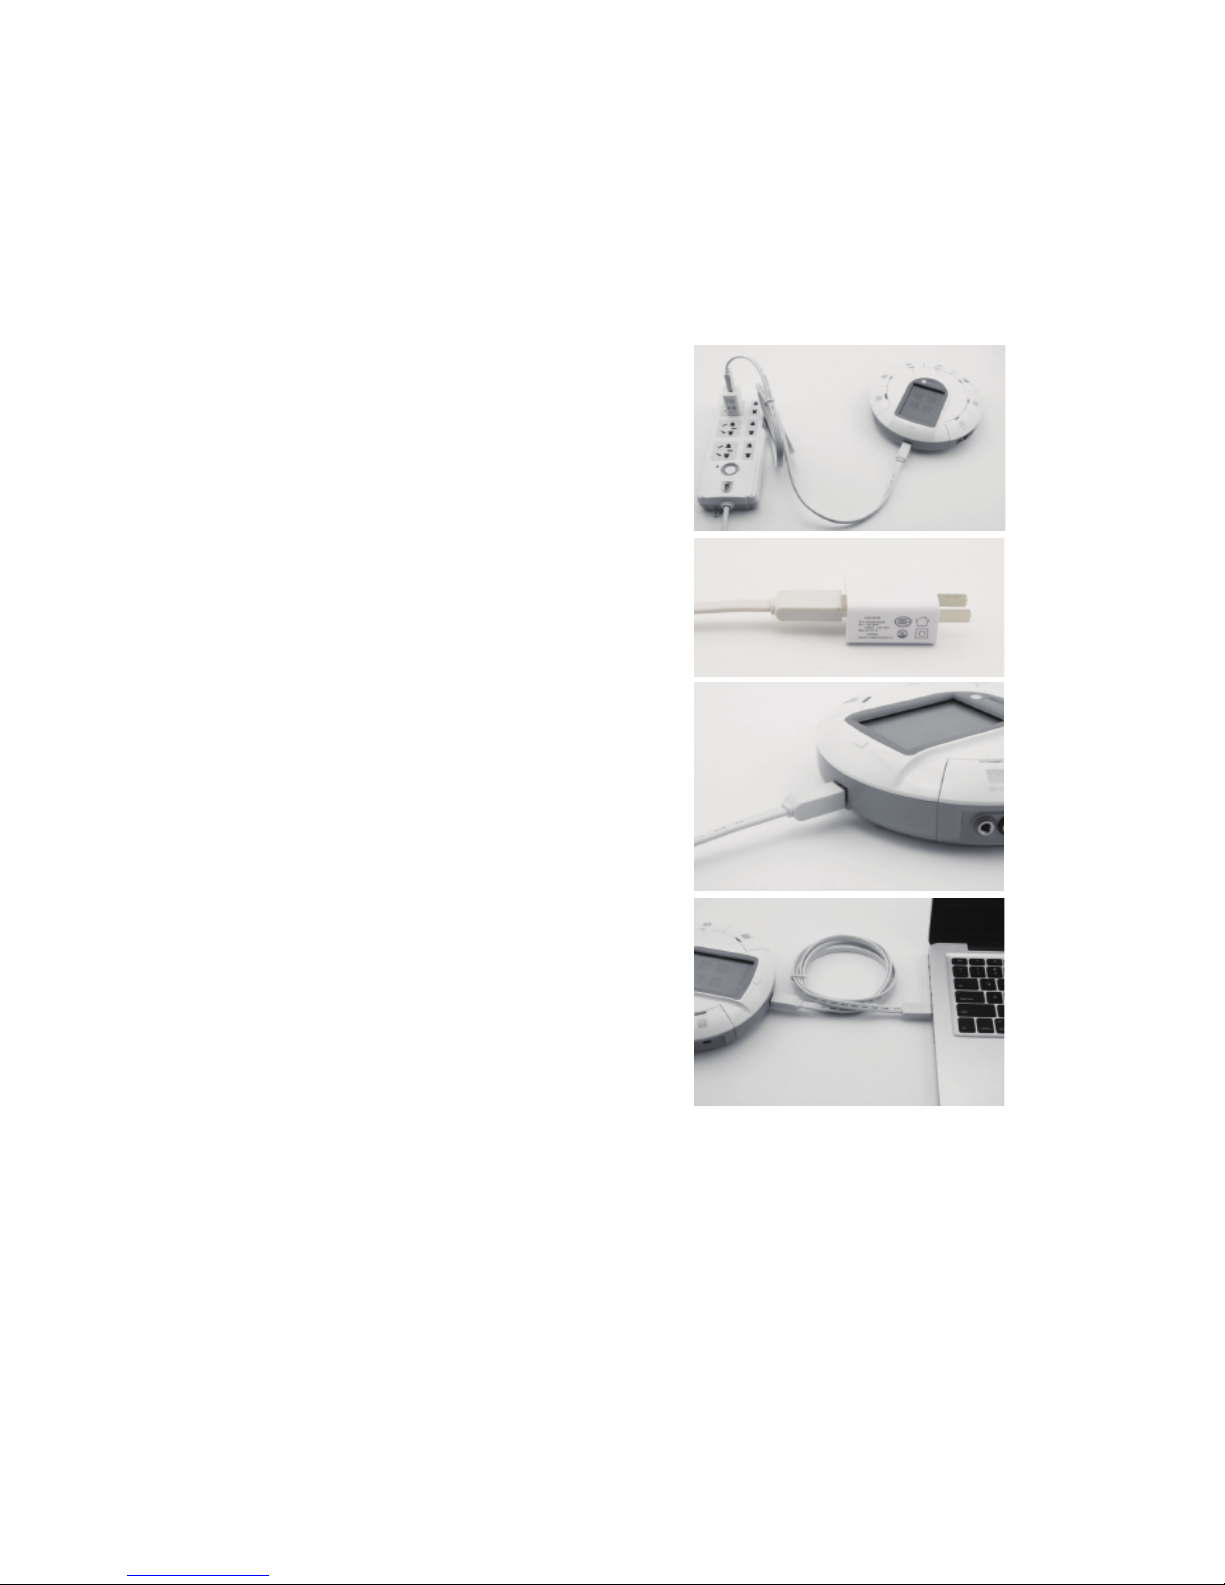
Stand-alone Mode
Before the first usage, please make
ensure the power is enough! In the
case of power shortage and power
unknown, please charging or connect
to power supply. When in charging,
1st, connect the USB cable to the
power adapter; 2nd, connect the USB
cable to the USB port of main body;
3rd, connect the power adapter to
power source.Or, connect the USB
cable to computer.
Power on: long press the power button
until the screen lit, and determines the
indicator light of sensor were lit (the
state of sensor communication can be
controlled via the built-in software:
when connecting to a sensor, the
indicator light is bright; Otherwise off).
Power off: long press the power button
until the screen turned off, and the
indicator light off.
6
Page 9
Interface of Built-in Software
status bar
main function area
function button bar
Function
Collect
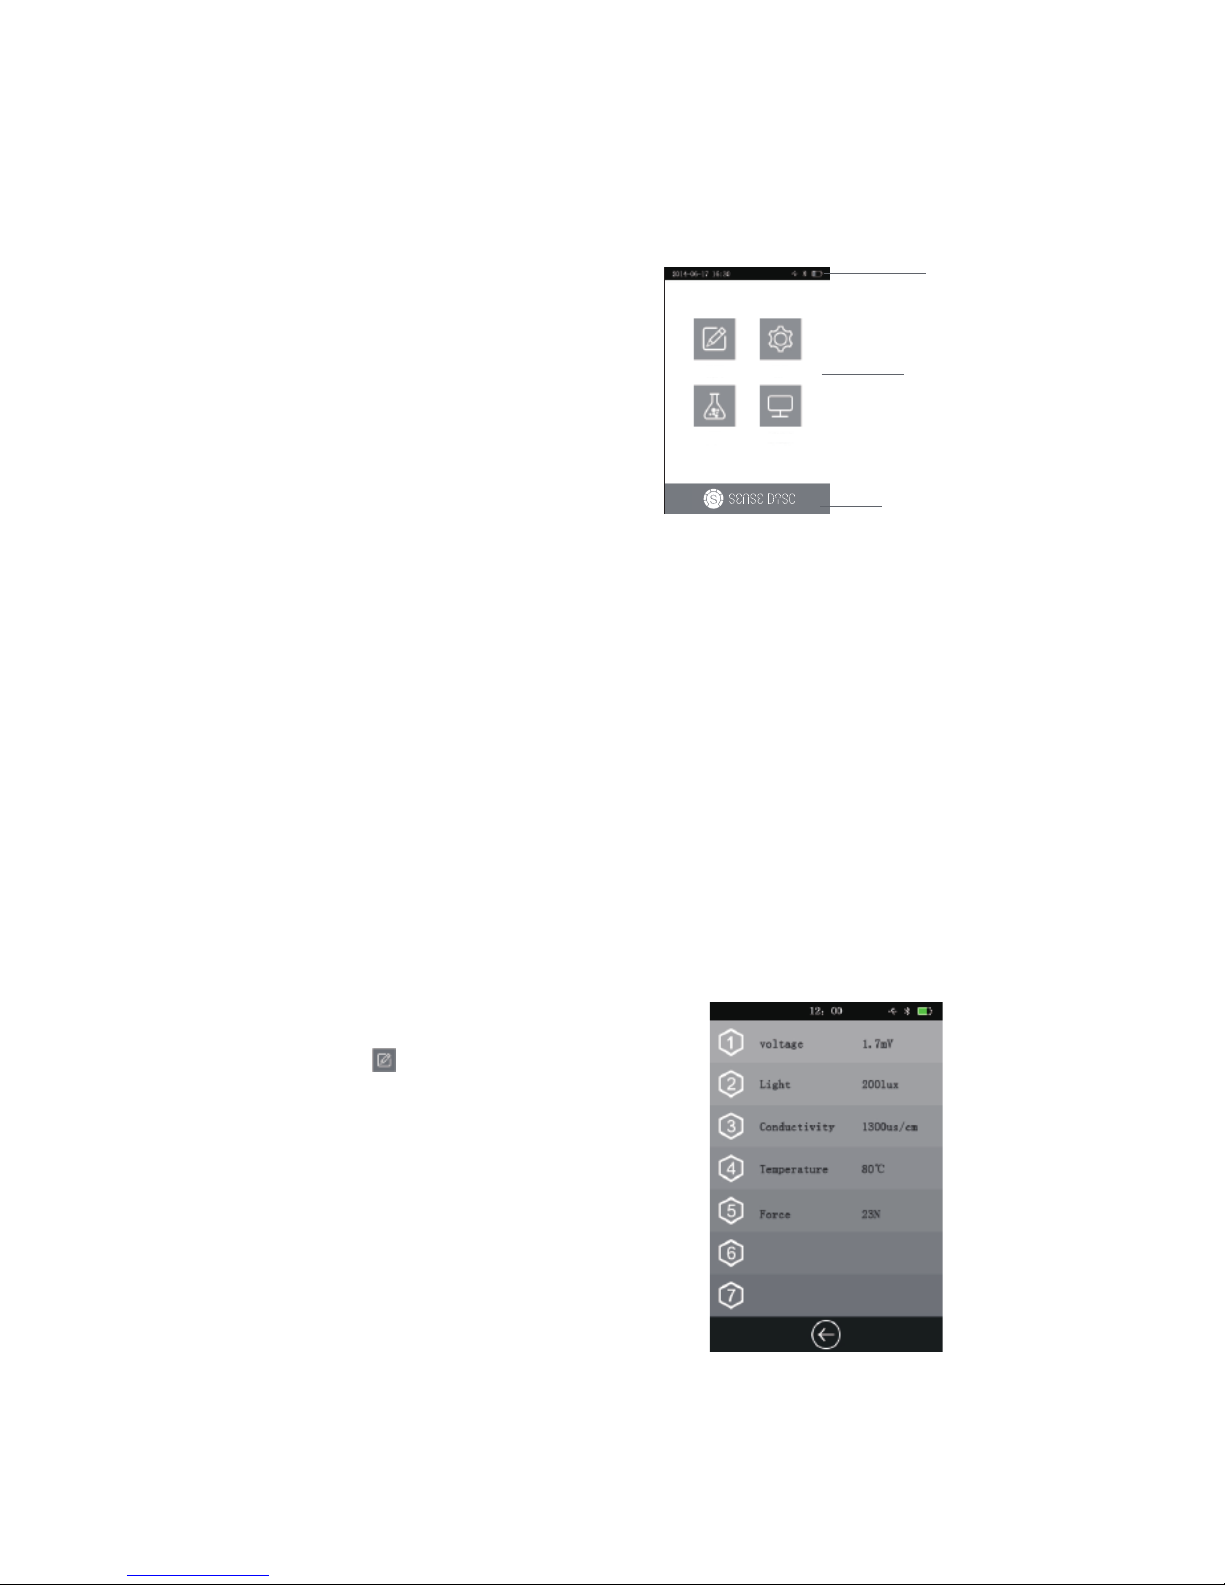
After starting up the SenseDisc,
enter into the Home page, you
can find the status bar, major
functional areas and function
button.
Status bar: display the date&time,
battery, USB, Bluetooth, charging
state, sign of experimental
acquisition and etc.
Major functional areas: contains
collect, setting, experiment and
system info.
Function button: the Home page
will display our logo; other pages
will show the Return button.
click this icon ,SenseDisc will
identify the connected sensor
automatically, and real-time display
the acquired data of sensor.
The opened interface will show the
information of connected sensor
modules, such as name, real-time
value and etc. For instance:
7
Page 10
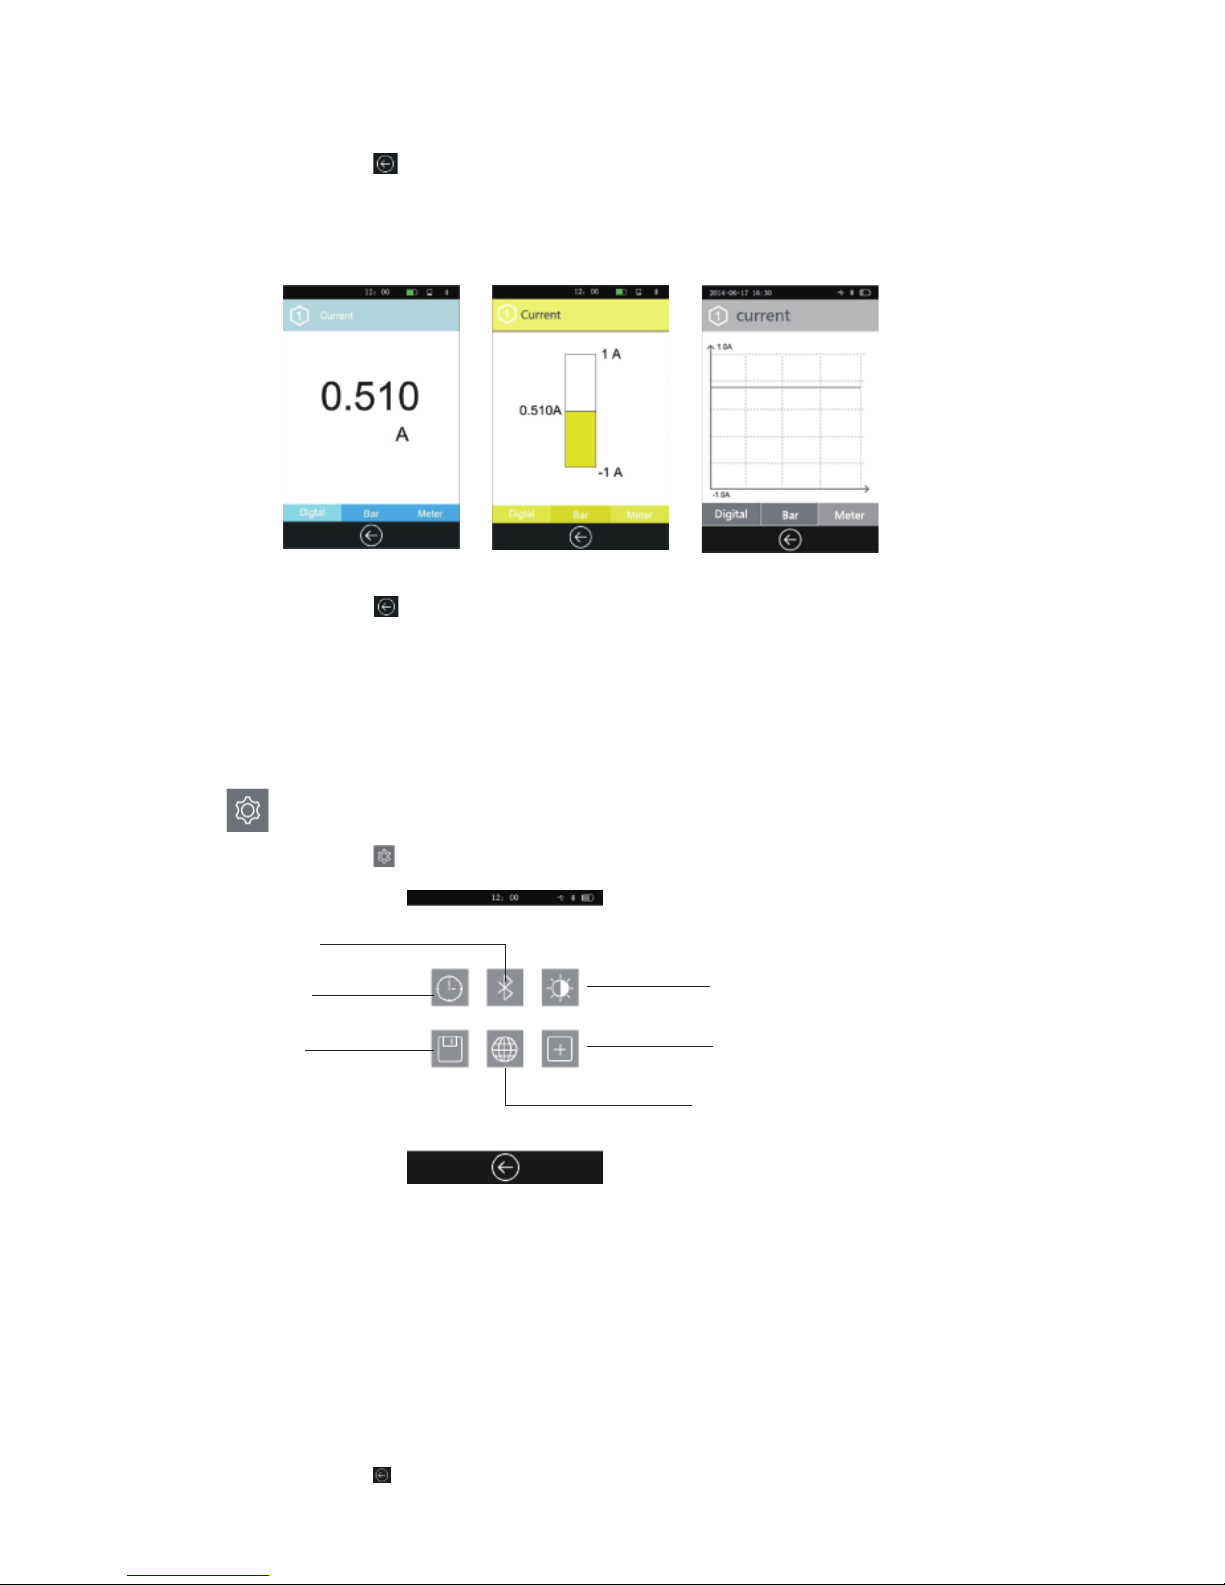
Setting
Click this icon or the Power button, will back to the Home page;
Click on any one of the sensor channel, can show the detail information of
the corresponding sensor and in three types: digital, bar, meter (e.g.
current sensor):
Click this icon or the Power button, will back to the previous interface.
Datetime: can set the date & time;
Bluetooth: turn on or off the Bluetooth communication, mainly used to
connect with external device;
Bright: set the brightness;
Storage: save the experimental data and import it to external device for
detailed analysis;
Language: switch language;
Calibration: calibrate the accuracy of screen;
Click this icon to enter into the setting interface:
Datetime
Storage
Bluetooth
Language
Bright
Calibration
8
: Setting of SenseDisc:
Click this icon or the Power button, will back to the Home page.
Page 11
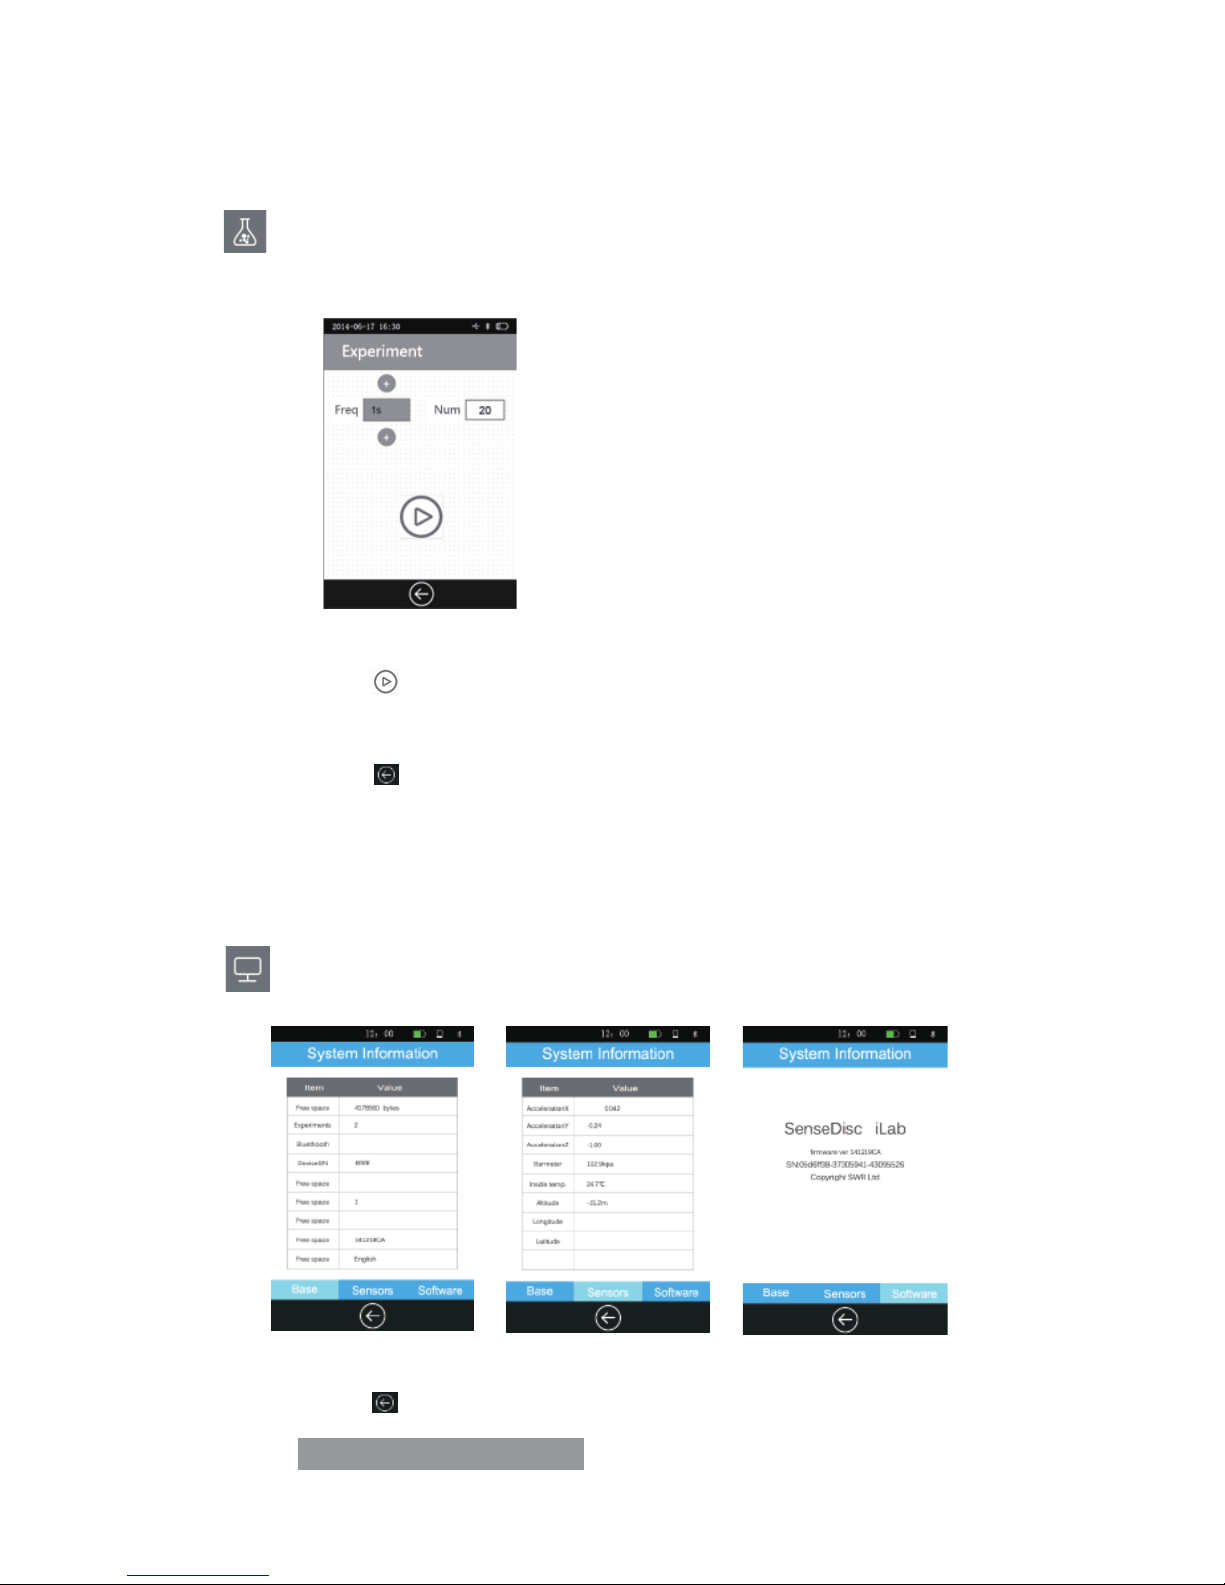
:Setting the experimental time and data acquisition frequency. The
default frequency is 1/s and with 20 samples.
: Contains basic infor., sensors info. and software info. of SenseDisc.
Click this icon or the Power button, will back to the Home page.
Experiment
System Information
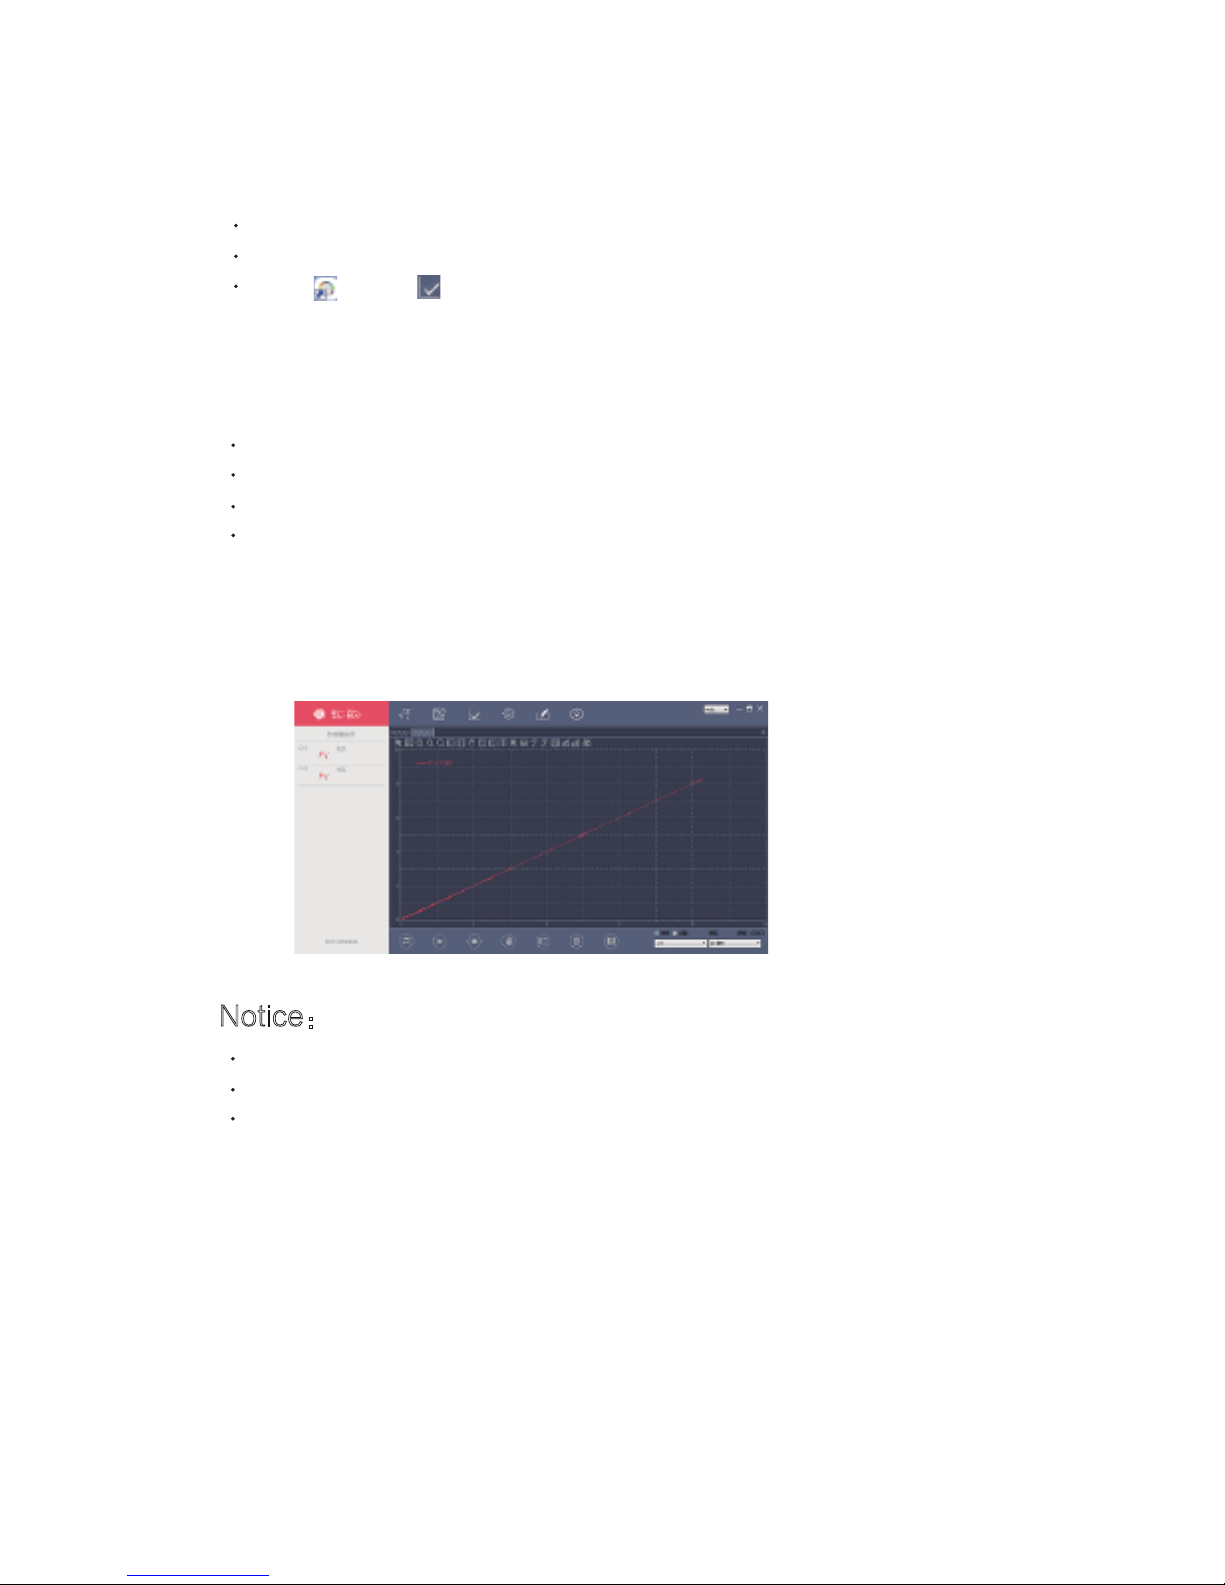
Click this icon , system will start data acquisition; after completing the
acquisition, experimental data will be saved automatically.
Click this icon or the Power button, will back to the Home page.
9
Page 12

6
Usage of Combination with
Other Systems
SenseDisc not only support the stand-alone mode, also support wired
and wireless connection mode. Multiple operating platforms like Windows,
Mac OSX, Android, iOS, can realize the real-time data acquisition via
combined with PC, laptop and ipad.
There is a briefly introduction as follows, and the detailed instructions
please refer to SenseDisc iLab software manual.
Connection Modes
Wired √
√
√
√
√
√
X
√Wireless
Connection mode Windows Mac OSX Android iOS
10
Page 13
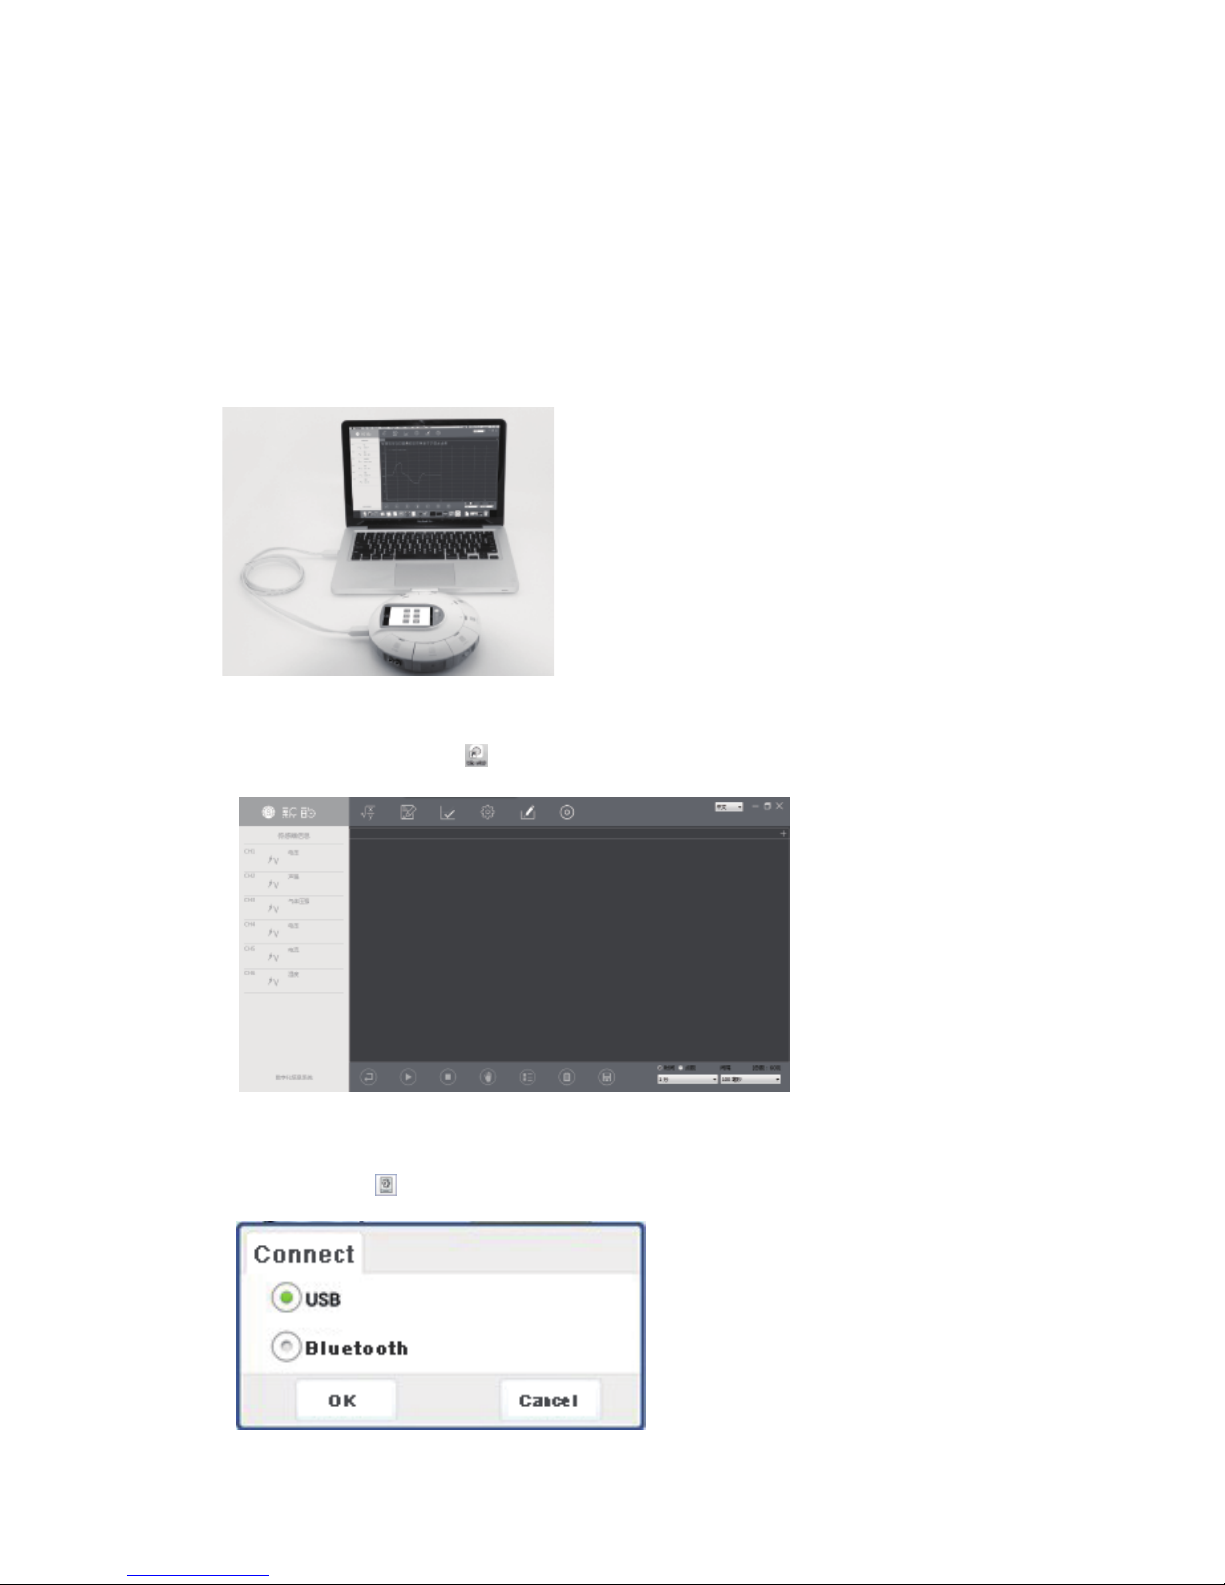
Connect SenseDisc to computer by USB cable:
Click the software icon , enter into the main interface:
Usage of Windows&Mac OSX System
Click this icon , choose “USB”, click“OK”:
Wired Connection
11
Page 14
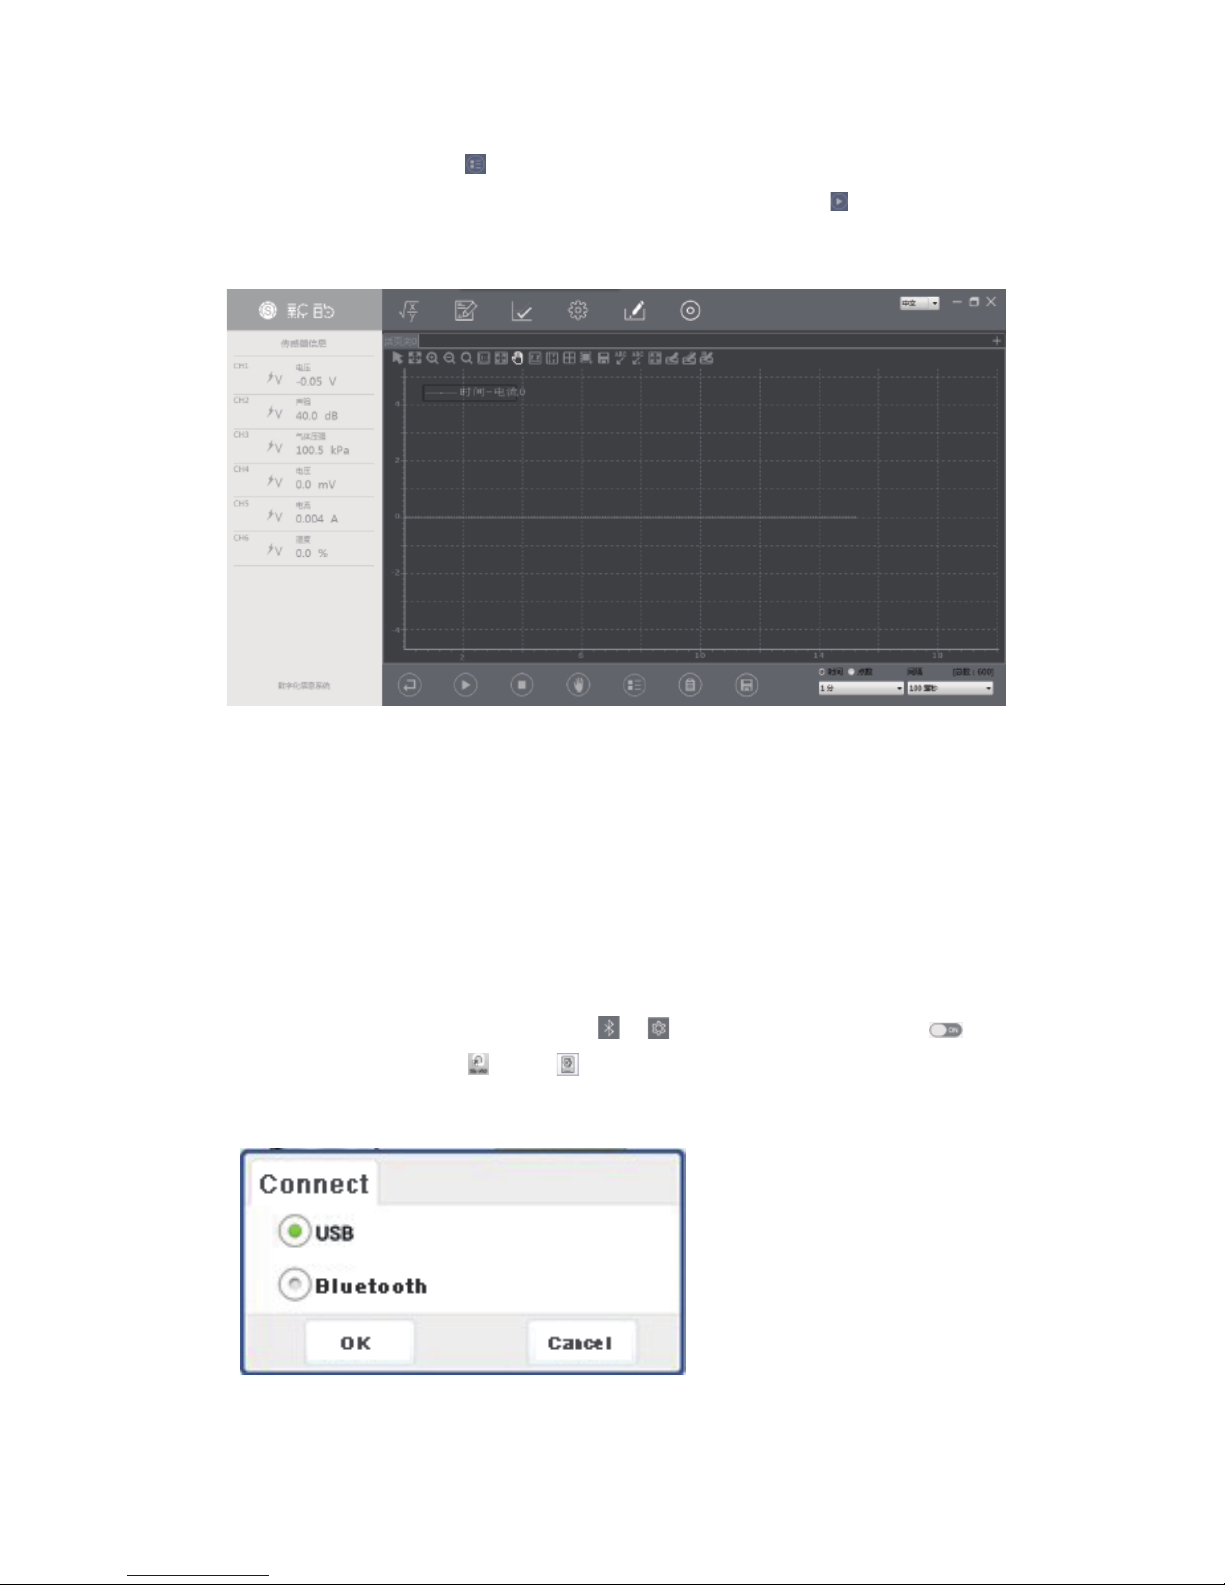
For example, click this , choose“current”, click “OK”, set the
“Current-Time” coordinate system, then click this icon to start data
acquisition:
Wireless Connection
Please make sure the power is sufficient before use!
Starting up the SenseDisc, choose in , slide to open Bluetooth ;
Click the software icon , click in the Home page, choose “Bluetooth”
then click “OK”; other steps are same with the wired connection:
12
Page 15
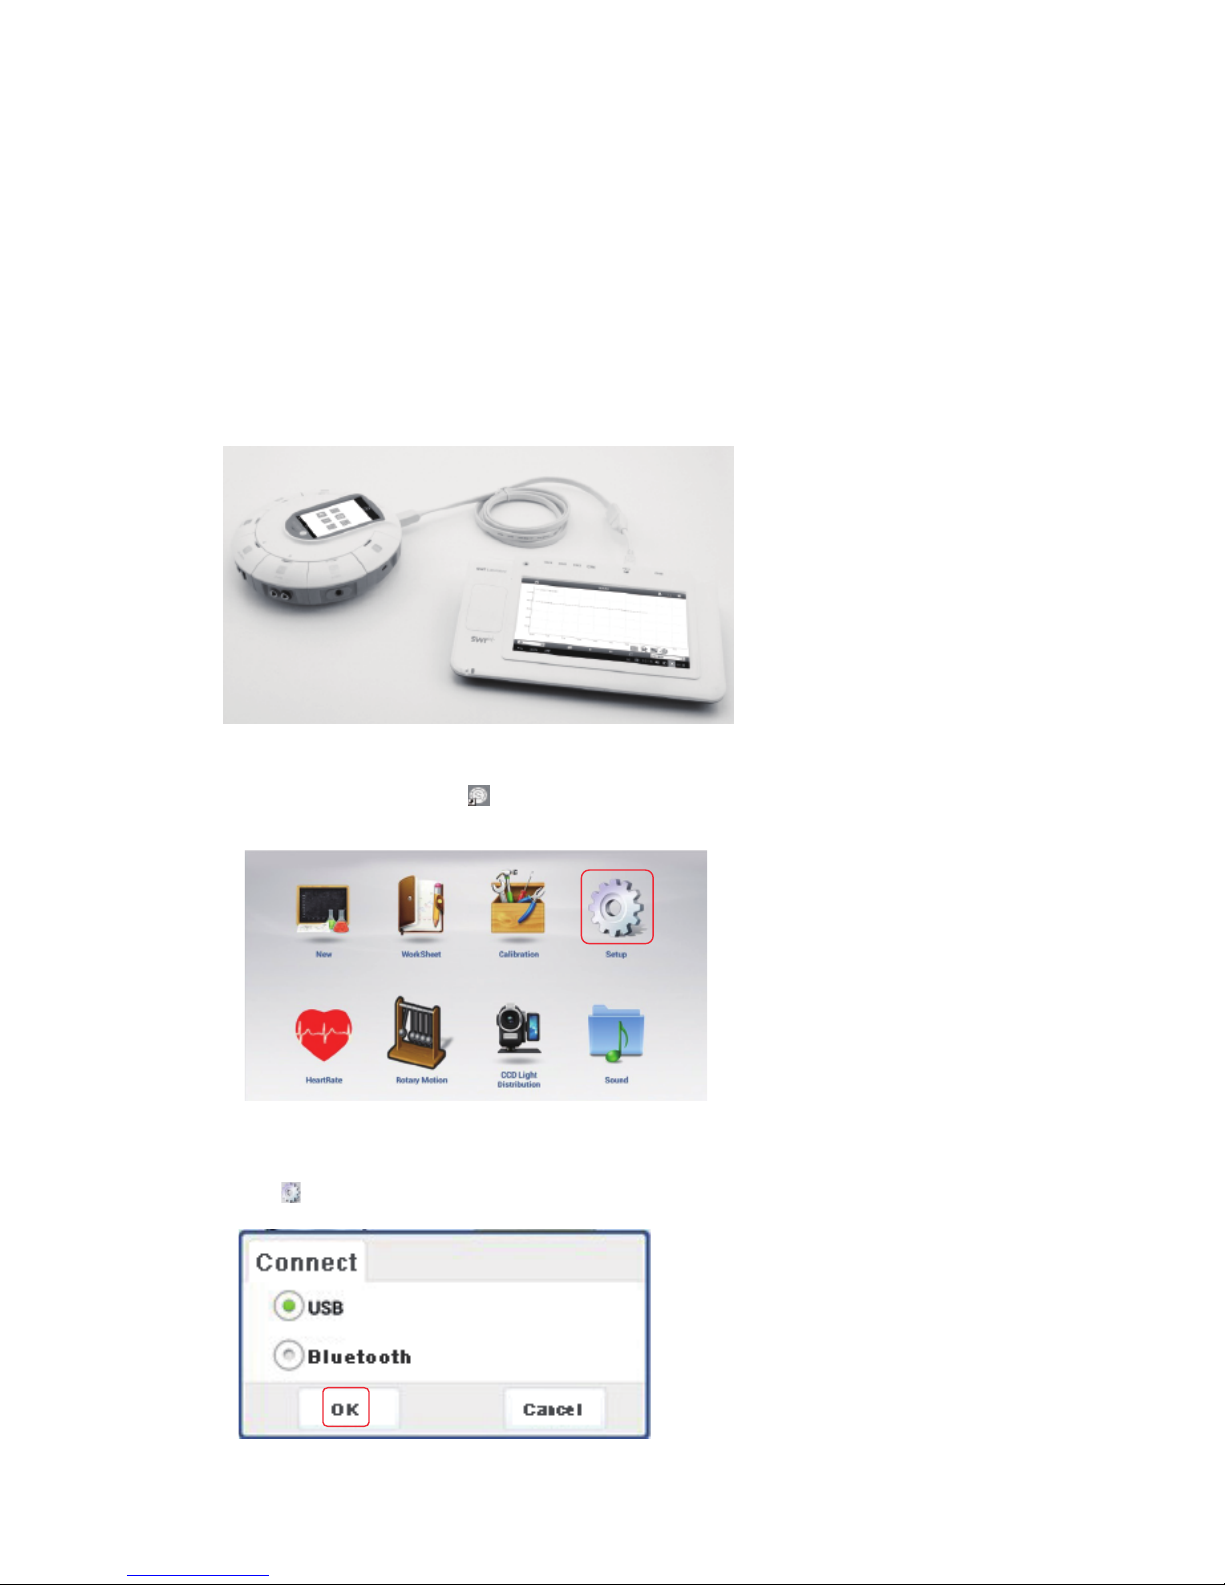
Connect the SenseDisc to the Pad datalogger(Android) by USB cable, as
follows:
Click the software icon , enter into the Home page:
Usage of Android Platform
Wired Connection
Click , choose “Bluetooth” , then click “OK”:
13
Page 16

Click , (for example: current), choose“current”, click“OK”, create
the “Current-Time” coordinate system:
Click , enter the experimental page:
Click , start data acquisition:
14
Choose template , enter experimental platform:
Page 17
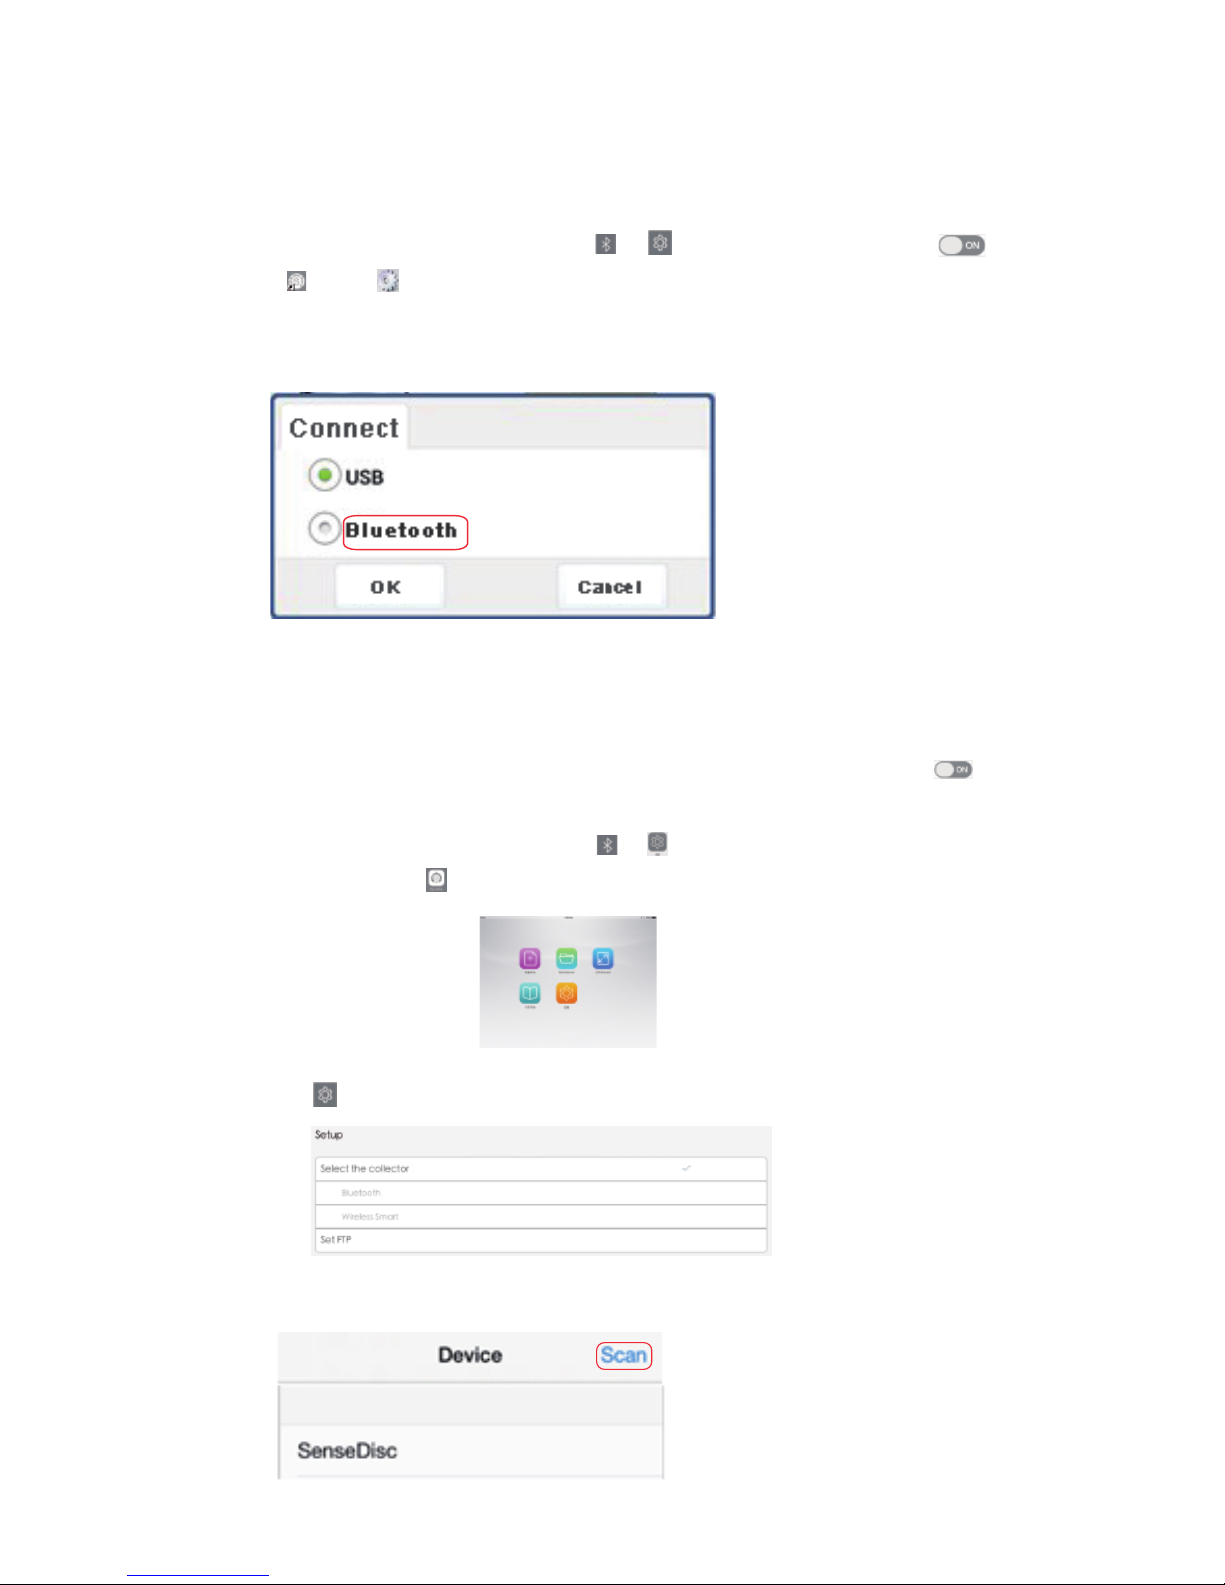
Usage of iOS Platform
Wireless Connection
Before use, make ensure the power is enough!
Starting up the SenseDisc, choose in , slide to open Bluetooth ;
Click , click , choose “Bluetooth”, then click “OK”; other steps
are same with wired connection:
Before use, make ensure the power is enough!
Starting up the SenseDisc, choose in , slide to open Bluetooth ;
Open the software in iPad, enter into the experimental page:
Choose , choose “Bluetooth”in “Setup”:
Click “Bluetooth”, enter the device scan page:
15
Page 18
Click“scan”, then click “scan Bluetooth”:
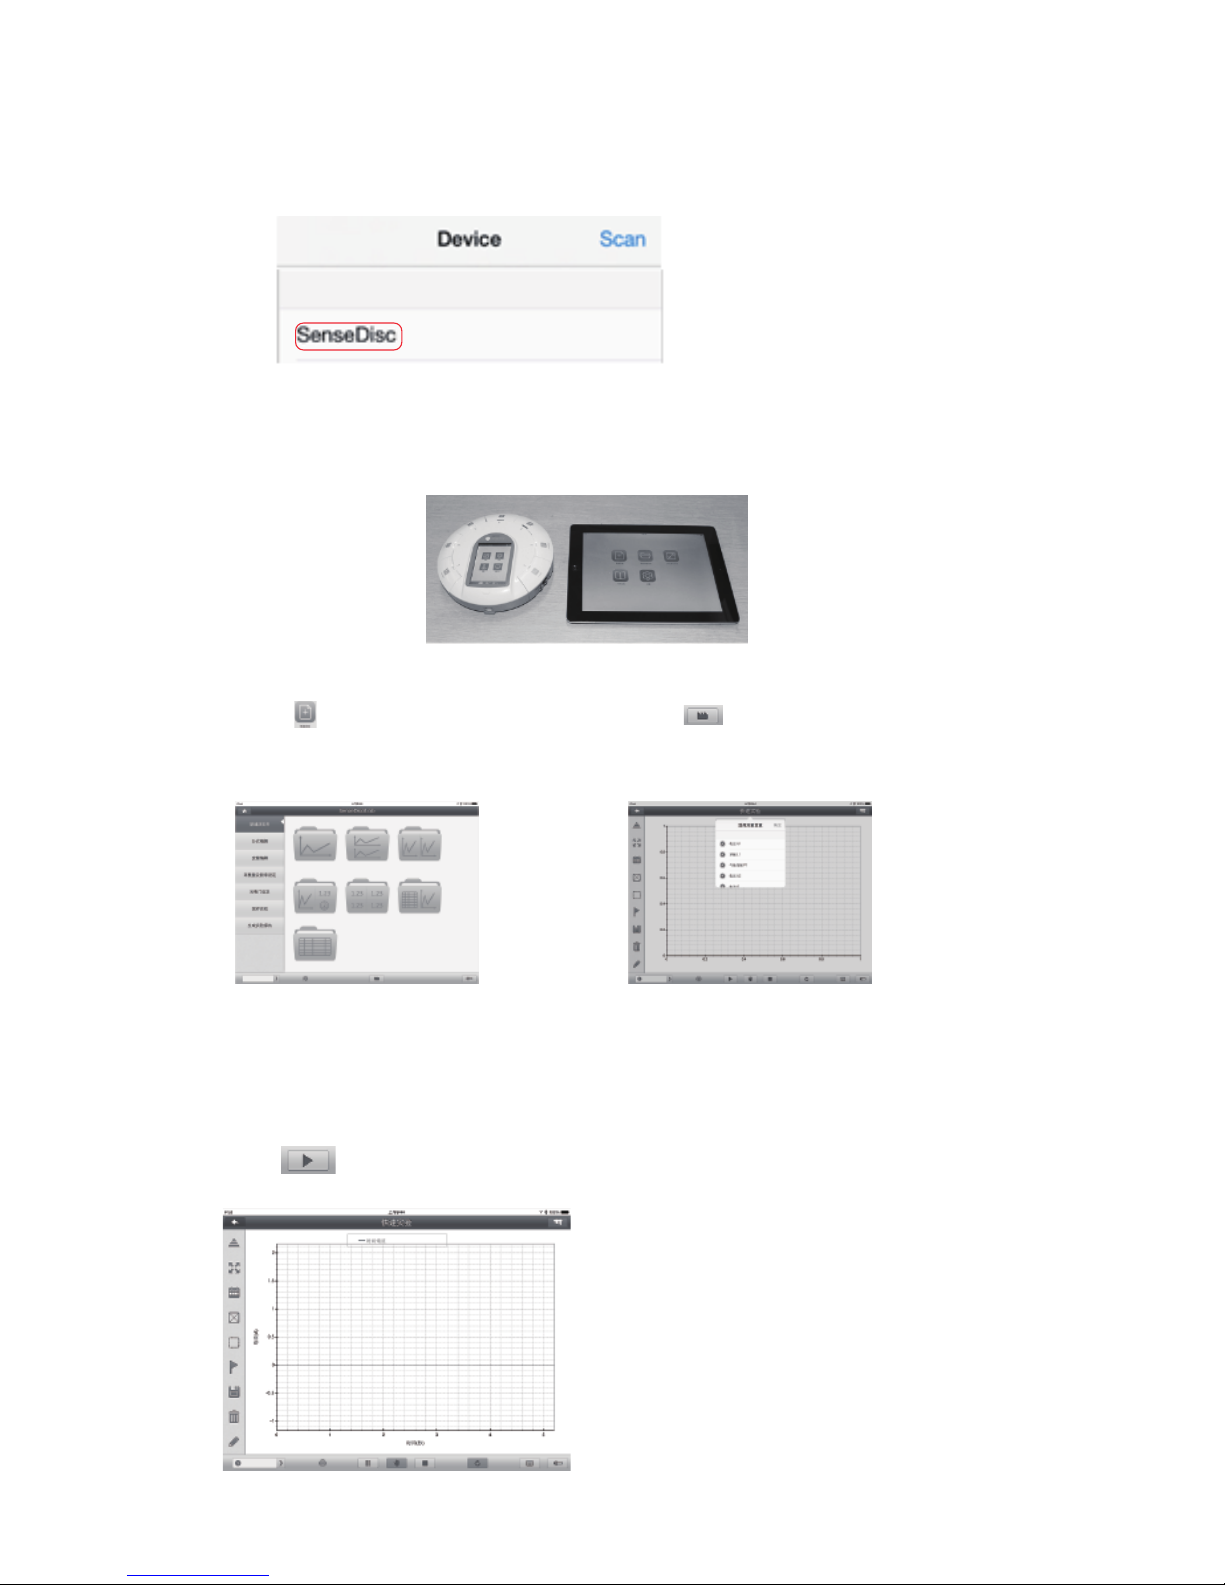
Choose “SenseDisc”, this connection will be created successfully after
prompted “Successful”;
Open , enter into the
experimental page:
Click , enter into the
experimental platform:
For example: current, choose“current”, click“OK”, to create the
“Current-Time” coordinate system,
click to start data acquisition:
16
Page 19

7
Notes
Clean
Applicable environ ment
Storage
Attentions
Reset
If there have stains on the surface, please clean with wet towel or cloth
to wipe the device;
Do not be immersed in water or wash with detergent.
Storage in dry and shade environment with room temperature;
When storage, make ensure the power is enough.
It is strictly prohibited in the long time exposure under the sun;
It is strictly prohibited to immersion in water and any other liquid;
Do not close to the heat source;
Do not store it in too hot or too cold or moist environment;
Field operation to avoid the following weather conditions: rainy, snow,
hail, heavy fog, strong wind, lightning and etc.
The SenseDisc is apply to -10~70 ℃ and 0~95%RH ( Noncondensation ).
The SenseDisc is equipped with
a reset hole on its reverse side,
insert a fine needle, the system
will immediately reboot.
17
Page 20

8
Common problems and
their solutions
please make sure the SenseDisc is in charging firstly; then long press
the power button, or press the reset hole to reboot.
check that whether the driver is installed properly, if can not installed
automatically, try to manually install: search the install position of the
software, open the corresponding folder, find the folder which named
"Drive" , open it, find “Setup.exe”, open it, click "install";
When wireless connection, please check the Bluetooth setting of
SenseDisc and external device are turned on.
Can not work
Can not connect with external devices:
18
Page 21
9
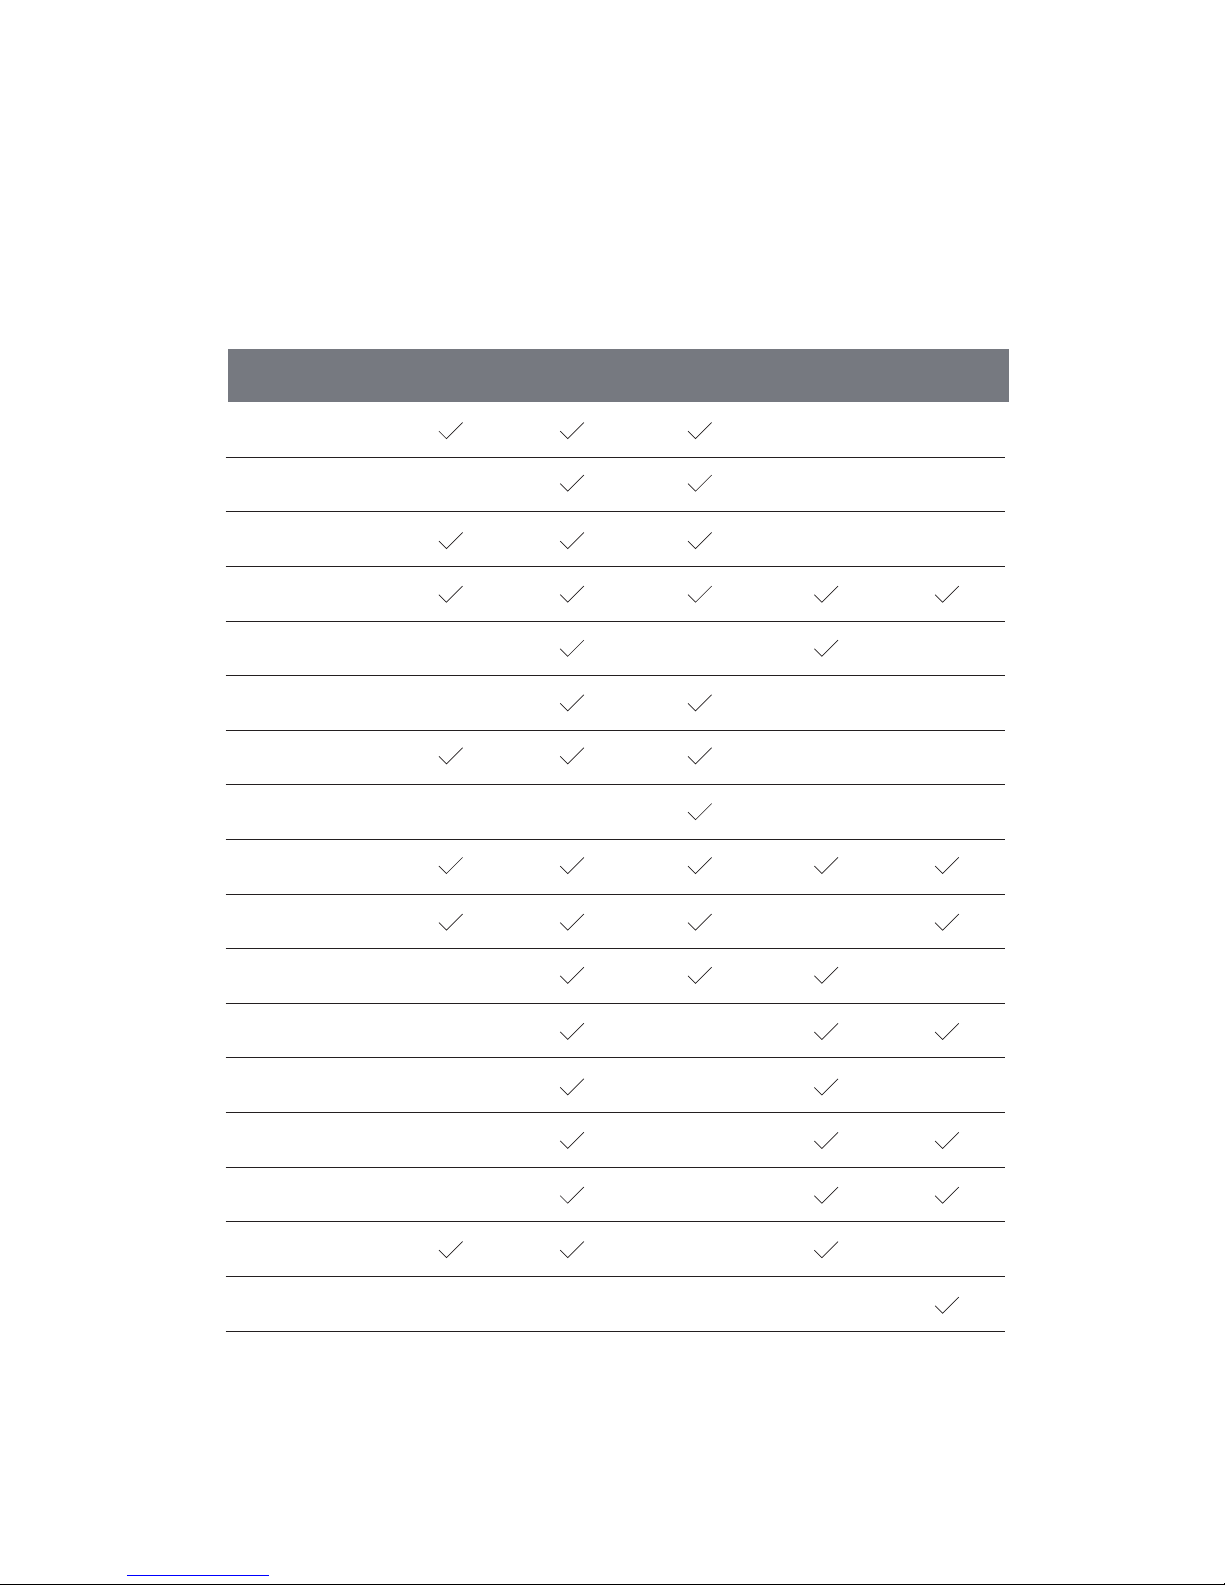
Configure Table of
Sensor Modules
No./Series
Biochem
SD0040
Environ
SD0050
S0001 Voltage
S0005 Current
S0009 Temperature
S0019 Light
S0021 Sound Level
S1024 Heart Rate
S0015 Motion
S0024 Heart Rate
S1002 pH
S1008 Humidity
S0002 mV
S1003 Conductivity
S1005 Dissolved O
S0013 Thermocoup
S0014 Force
S0016 Photogate
S1040 UV
Basic
SD0010
Advance
SD0020
Physics
SD0030
19
2
Page 22
Sensor Manual
for Basic
Page 23
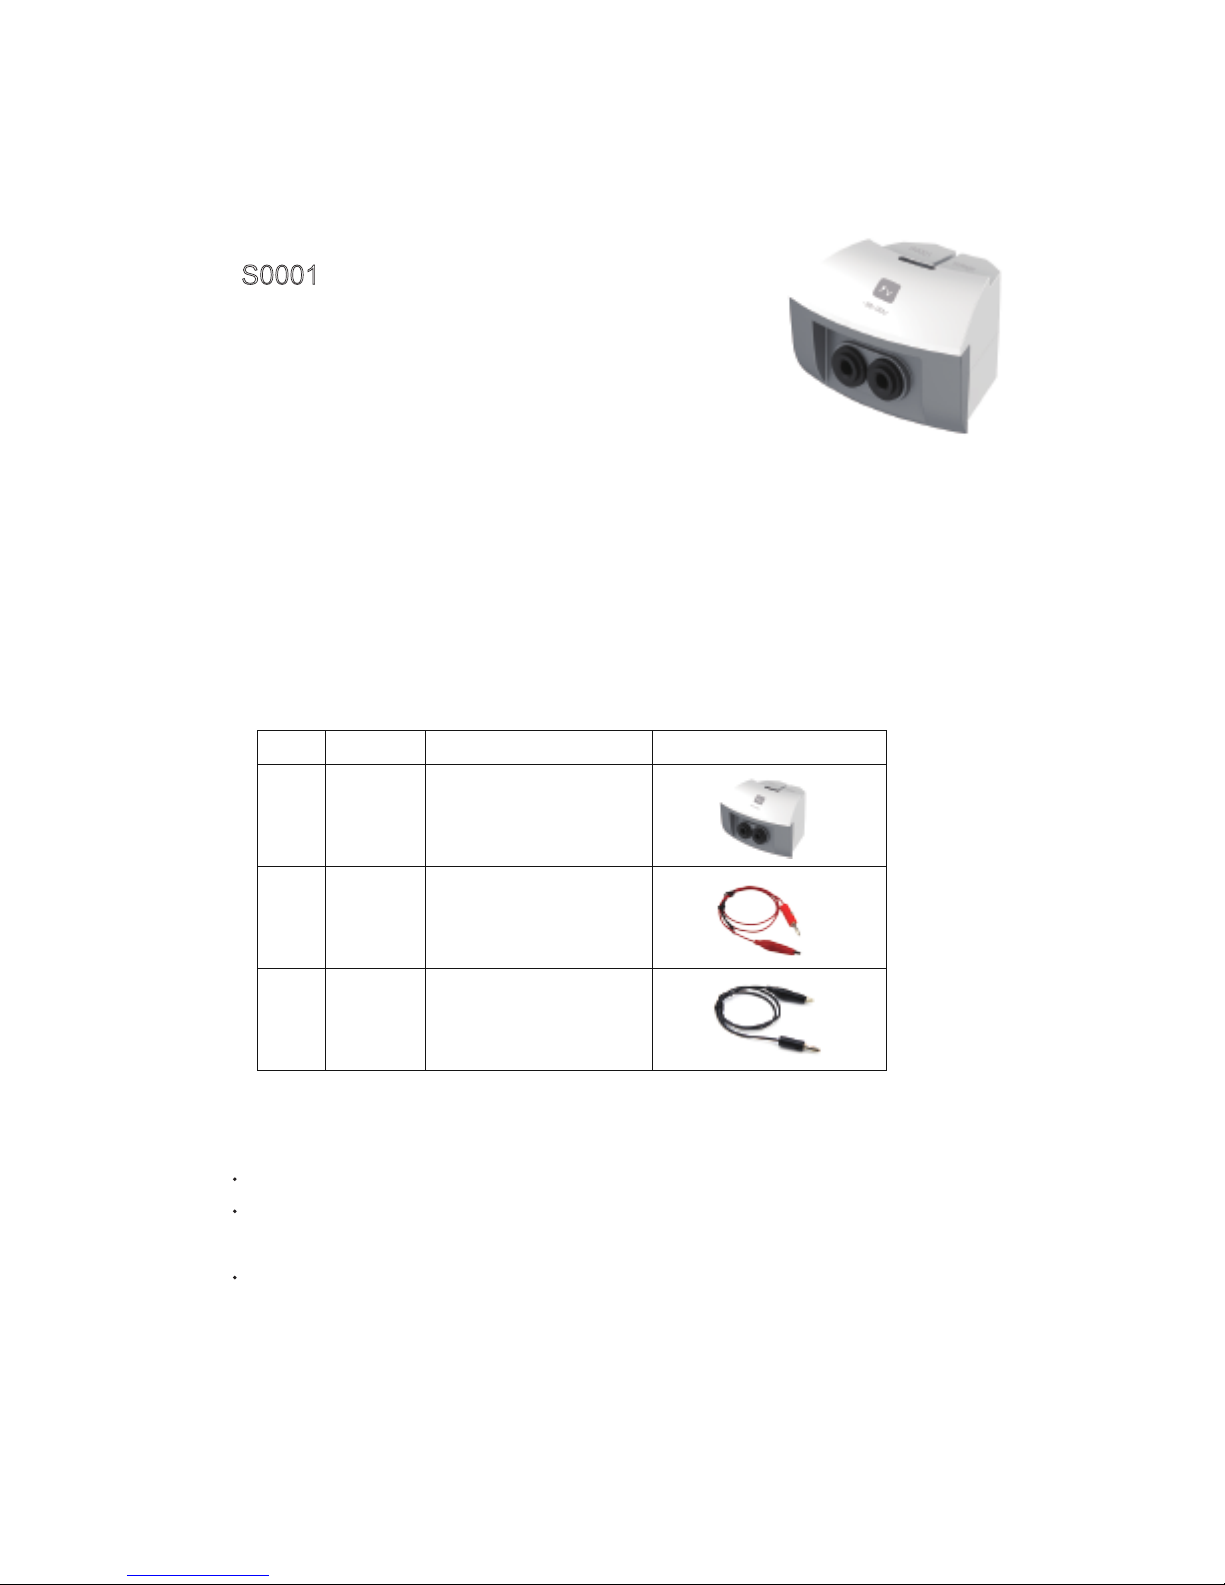
Voltage sensor
S0001
Range: -30~30V
Accuracy: ±1%
Resolution: 0.02V
Input impedence: 2MΩ
Voltage sensor is used to measure the electric potential difference at
both ends of the electrical equipments or circuits, after the circuit of
voltage sensor transfering the voltage it collects, then it can realize the
measurement. The voltage sensor can be used in the DC circuit and
low-voltage AC circuit.
Component
Usage
No. Type Name Illustration
1
2
3
S0001
Voltage sensor
Red crocodile clip
Black crocodile clip
Connect the voltage sensor into any port of the SensorDisc
Wires of red-black crocodile clip should be inserted into the positive and negative
port of voltage sensor
Red-black crocodile clips of voltage sensor are parallel connected to both ends of
circuit or electrical equipment
Page 24

Calibration
Typical experiment
Notice:
Case: Measure the EMF of dry battery
Calibrate the voltage sensor before use
Short connected the red-black crocodile clips of voltage sensor
Open ,click ,choose“voltage sensor”,
click“Calibration”,then click“OK”.
Measure the voltage at both ends of small bulb
Build a simple circuit
Measure the electromotive force of dry battery
Voltage sensor should be parallel into the circuit when in usage
Calibration before using voltage sensor
Voltage sensor can not bear the voltage over 250V
Page 25
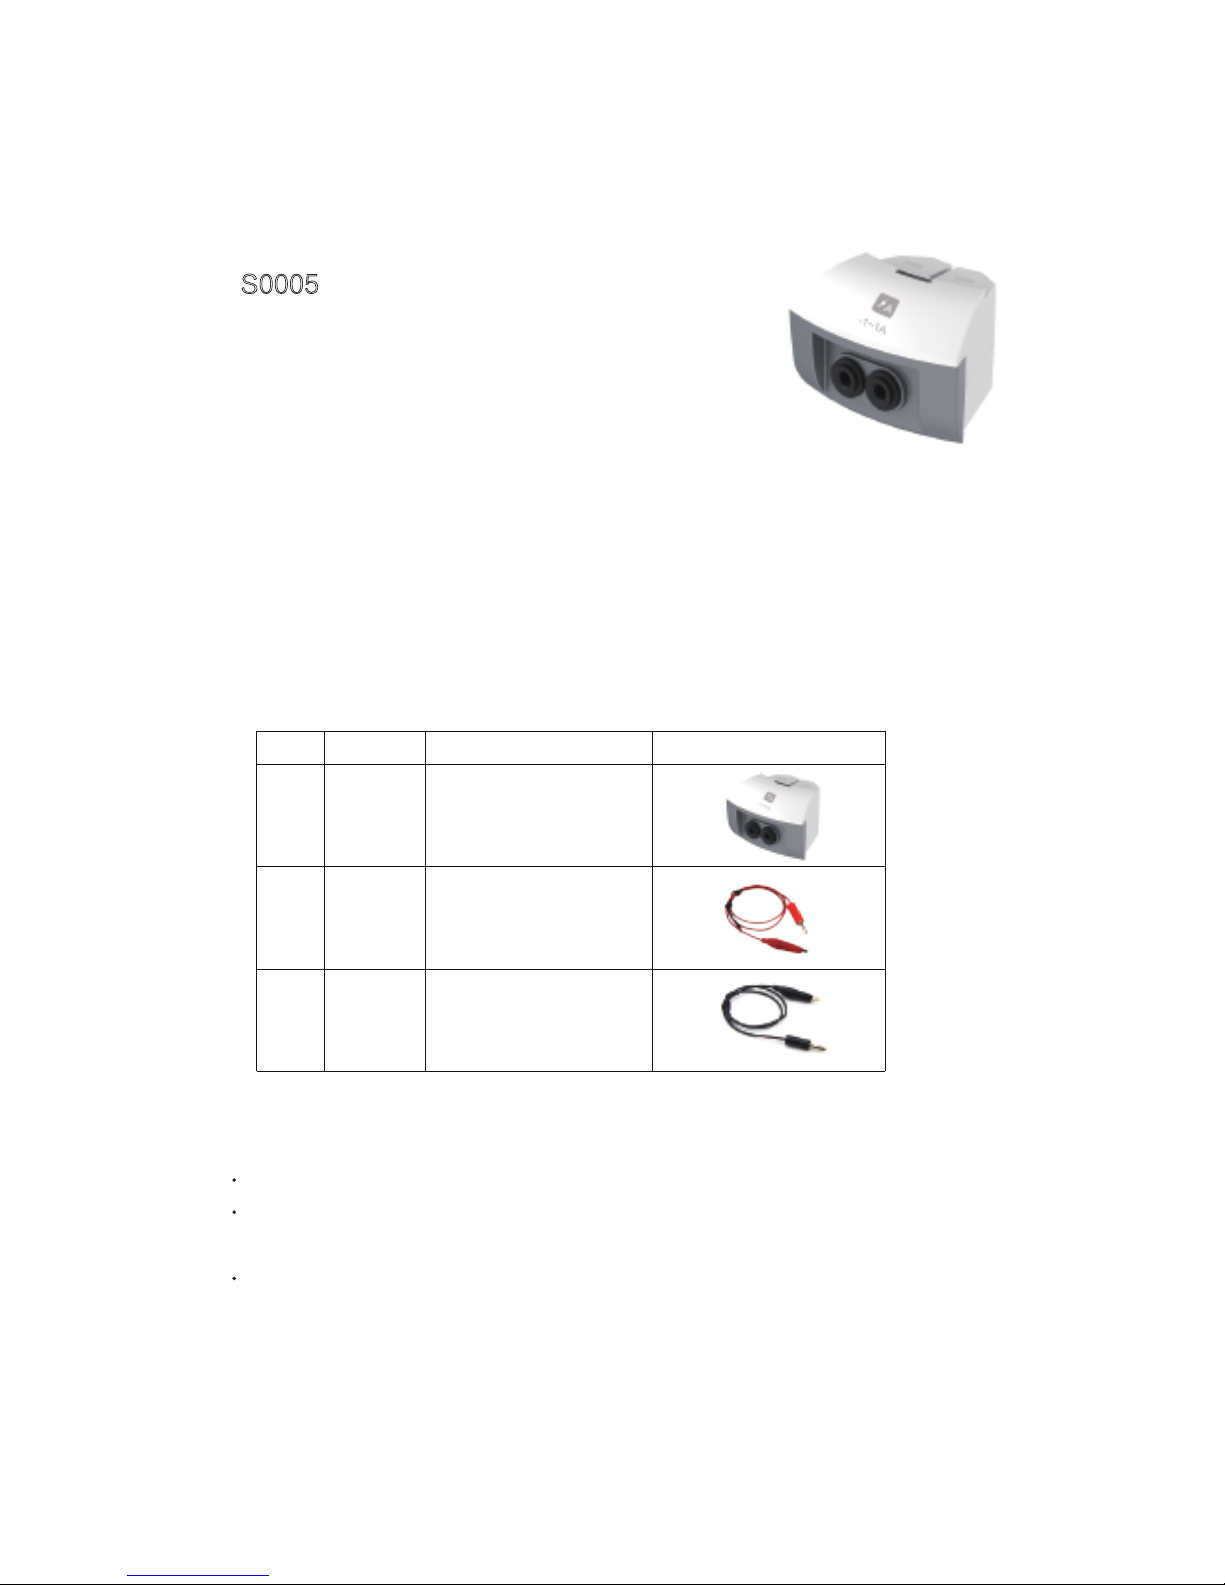
Current sensor
S0005
Range: -1~1A
Accuracy: ±1%
Resolution: 0.001A
Internal resistance: 0.22Ω
Current sensor is used to measure the current in circuit. When current
is passing the sampling resistance, it will form a tiny electric
potential difference at both ends of the resistance; After enlarging the
circuit, it can accurately measure the current in DC circuit or low-voltage AC.
Component
Usage
No. Type Name Illustration
1
2
3
S0005
Current sensor
Red crocodile clip
Black crocodile clip
Connect the current sensor into any port of the SensorDisc
Wires of red-black crocodile clip should be inserted into the positive and negative
port of current sensor
Red-black crocodile clips of current sensor are series connected to both ends of
circuit or electrical equipment
Page 26
Calibration
Typical experiment
Notice:
Case: measure the VA characteristic
curve of small bulb
Calibrate the current sensor before use
Short connected the red-black crocodile clips of current sensor
Open ,click ,choose “current sensor”,
click“Calibration”,then click“OK”.
Serial-parallel circuit of resistance
Measure the VA characteristic curve of small bulb
Measure the electrodynamic potential and internal resistance of battery
Ohm's Law
Serial into the circuit when using current sensor
Calibration before using current sensor
Current sensor can not bear the current over 3A
Page 27
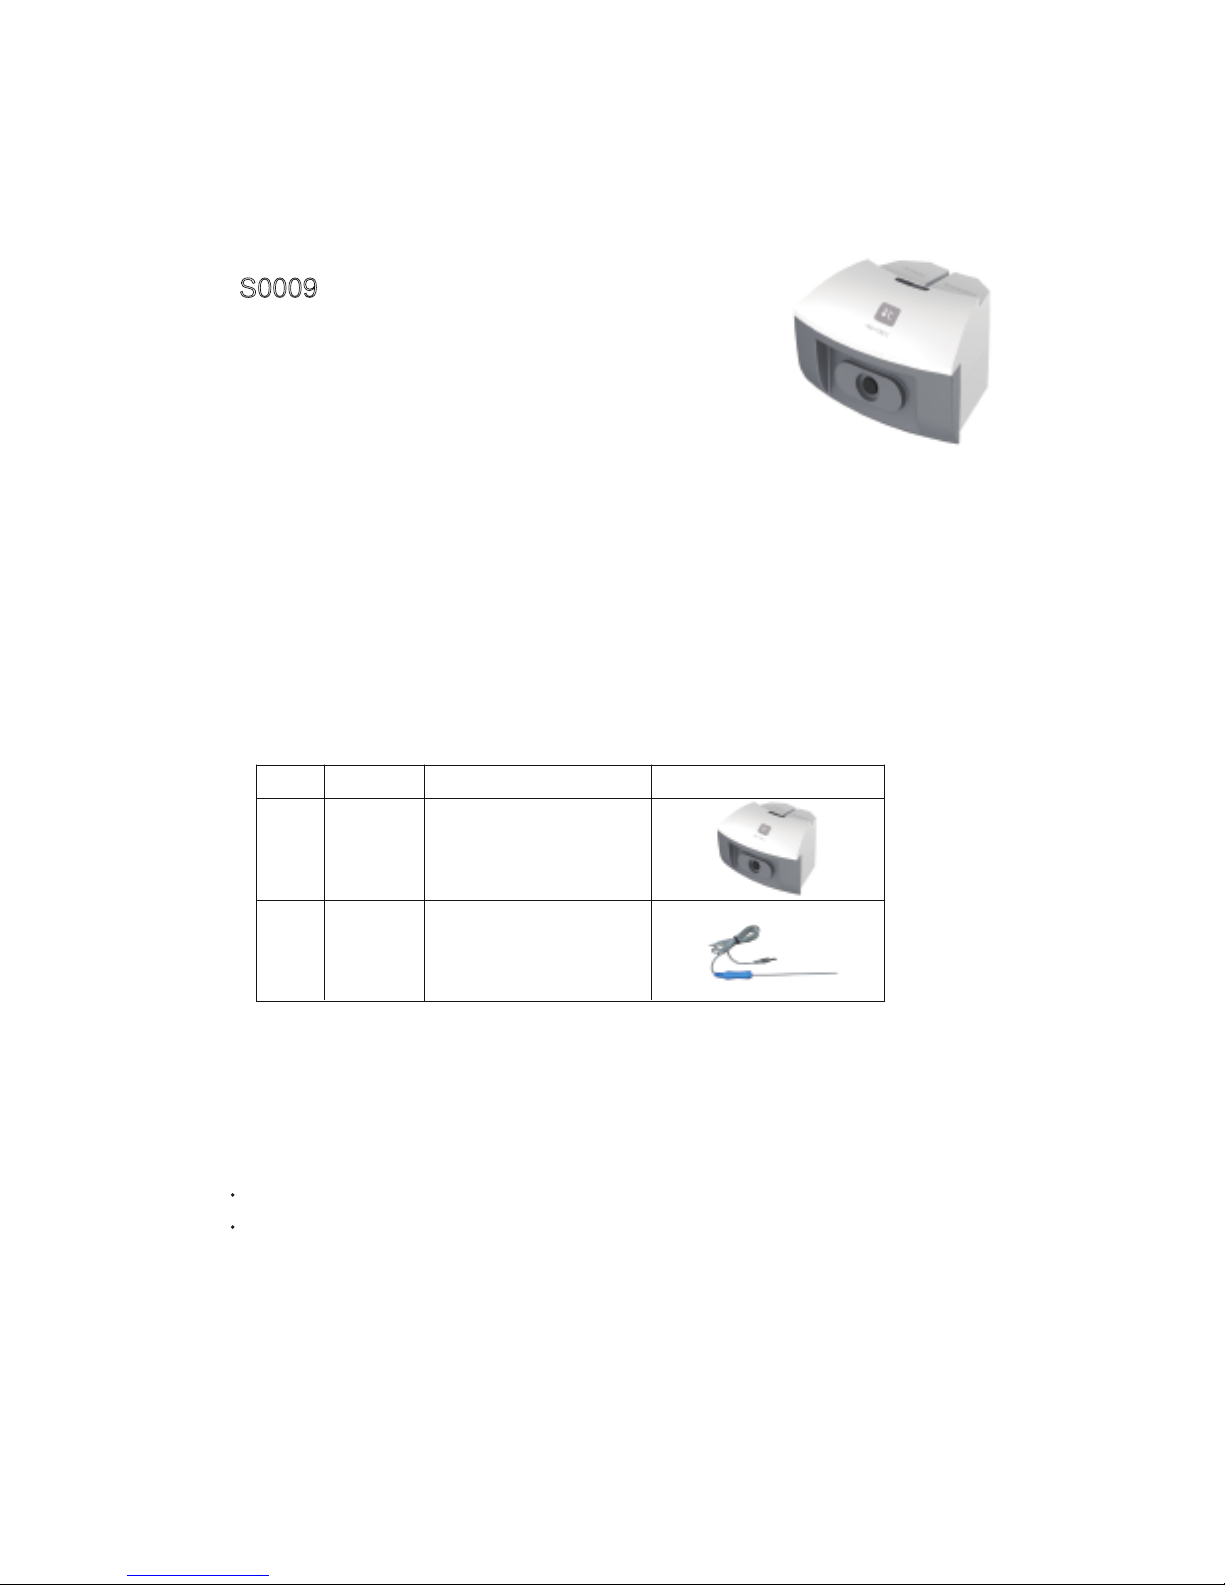
Temperature sensor
S0009
Range: -40~135℃
Accuracy: ±0.6℃
Resolution: 0.1℃
Temperature sensor adopts the NTC electronic temperature sensing
element, when the ambient temperature changes, the NTC resistance
changes accordingly. Normally the temperature needs no zero calibration and with relatively higher stability; therefore, the temperature
sensor is rather popular in the low-middle temperature measurements.
Component
Usage
No. Type Name Illustration
1
2
S0009
Temperature
sensor
Probe
Connect the temperature sensor into any port of the SensorDisc
The probe of sensor insert to the socket of temperature sensor
Page 28
Typical experiment
Notice:
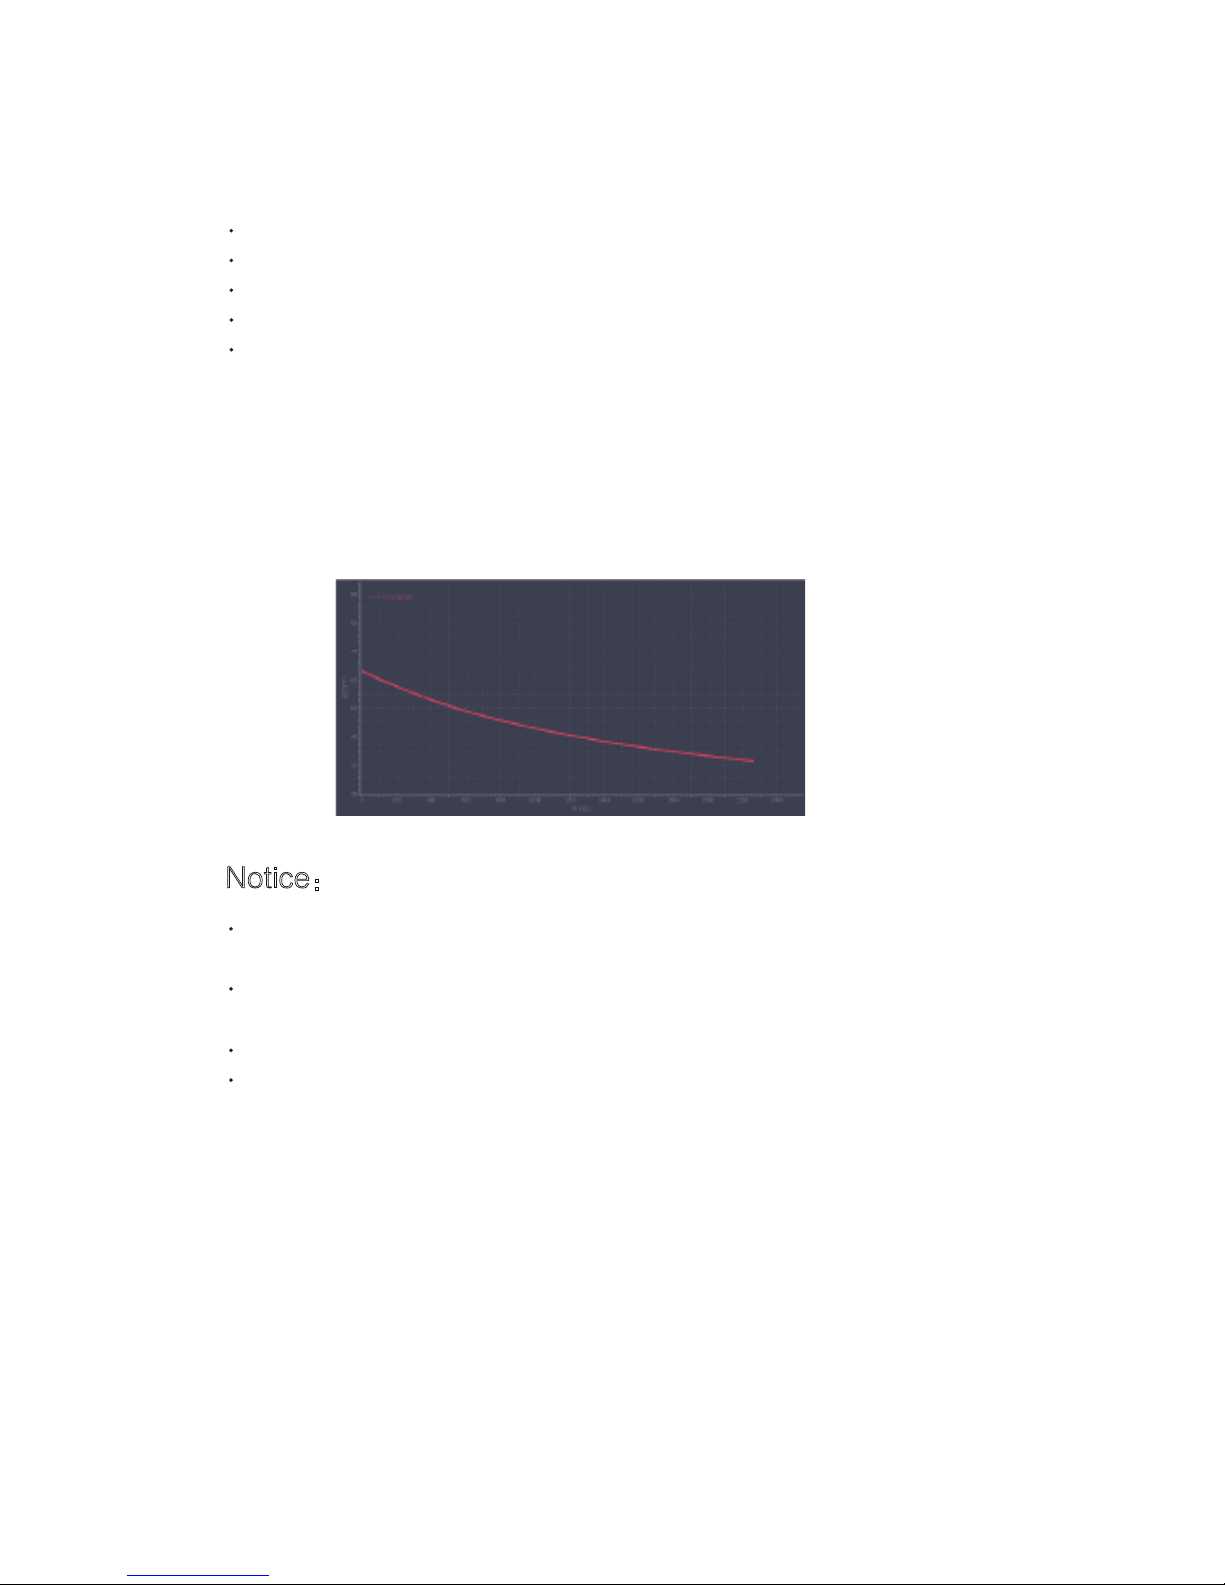
Case: water cooling
Measuring the temperature of the hot and cold water
Water Cooling
Explore the direction of heat transfer
Explore the endothermic effects of different colors of objects
Converging lens effect
We can't put any part of the sensor on the open flame or heating plate
directly
When measure the temperature of liquid, should avoid the other partially
of sensor immersed in liquid except stainless steel rod
After use, cleaning sensor thoroughly
Don’t over measured range
Page 29
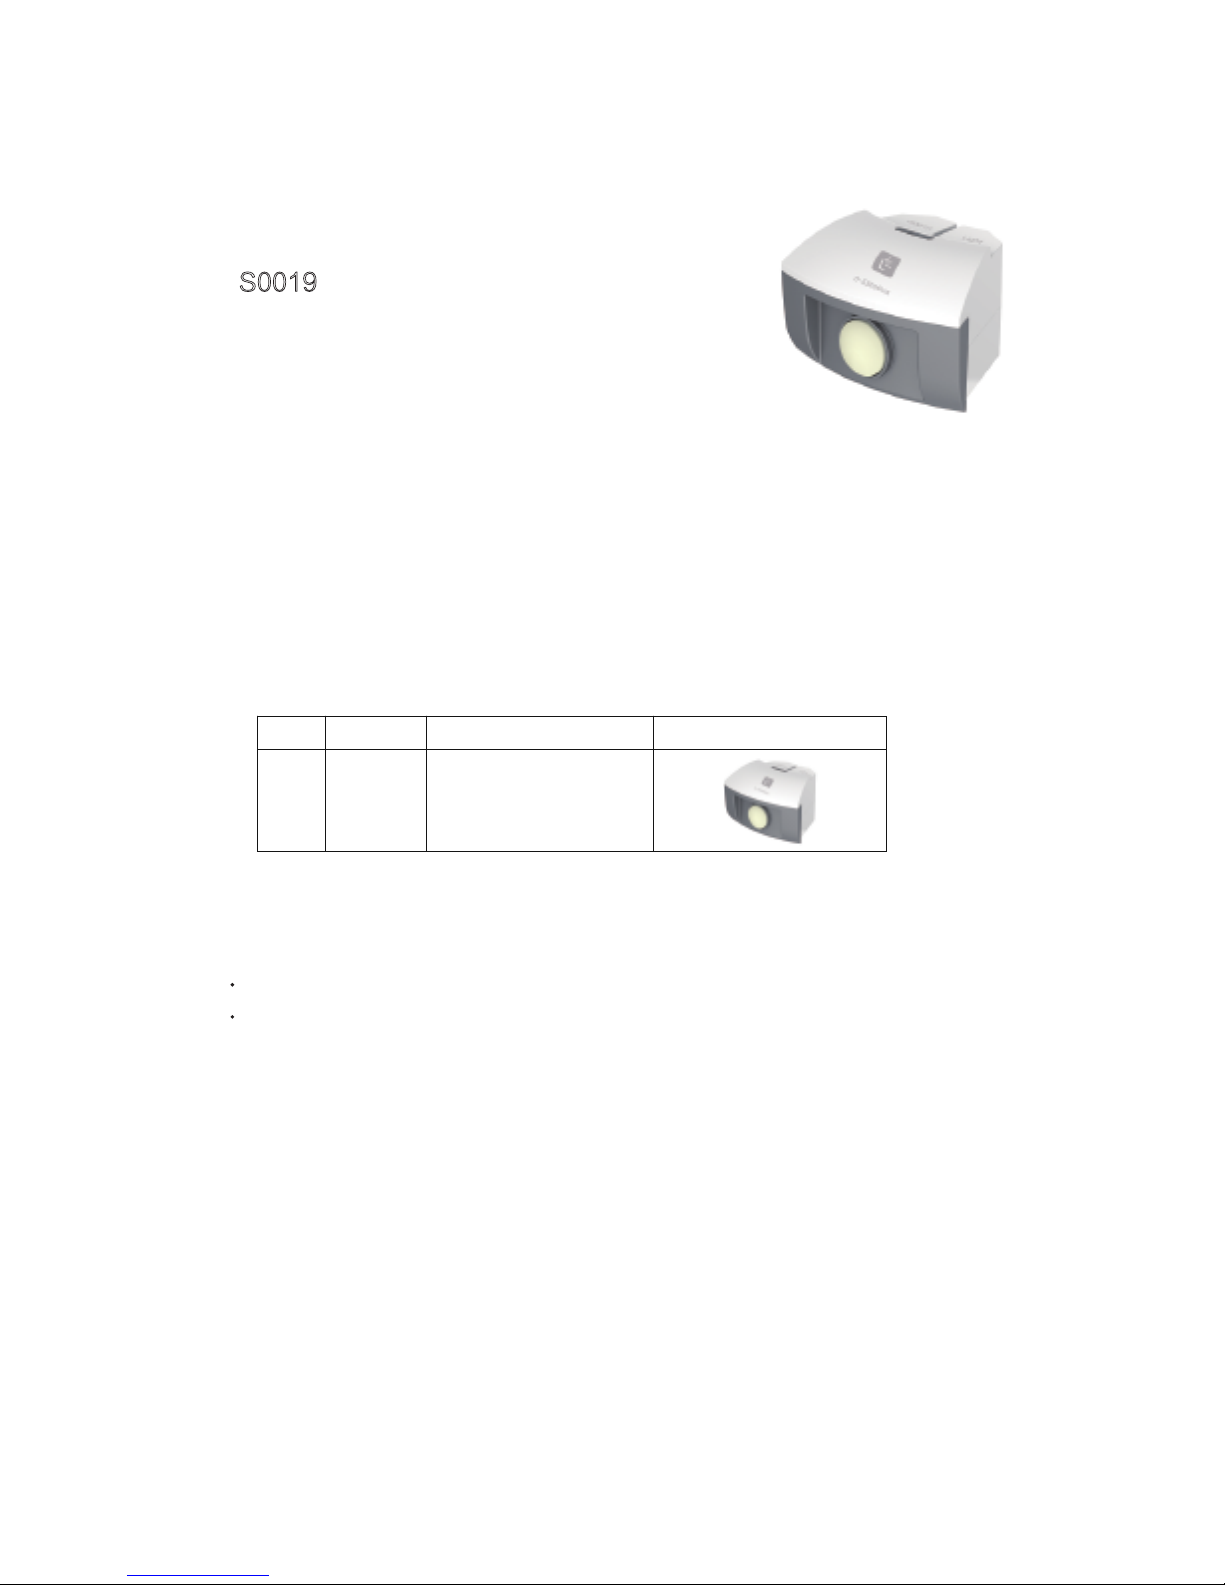
Light sensor
S0019
Range: 0~55000Lux
Accuracy: ±5%
Resolution: 15Lux
Light sensor uses the silicon photoelectric cell as the sensing element;
it can convert the light ntensity into a voltage signal, keeping a direct
proportion. For the sensor, the effective light spectrum is in the range of
380nm to 730nm, it is an ideal intensity sensor for visible light.
Component
Usage
Connect the light sensor into any port of the SensorDisc
The probe of light sensor is located at the front of sensor, when use, pointed the
photosurface at light
No. Type Name Illustration
1
S0019
Light sensor
Page 30

Typical experiment
Notice:
Case: Measure the light intensity of environment
Explore the effects of light intensity on photosynthesis
Explore the relation between light intensity and distance
Measure the light intensity of environment
When use, always maintain the probe of sensor that facing light source
Don't wear or scratch the receives of probe
Page 31

Sound level sensor
S0021
Range: 40~92dB
Accuracy: ±4dB
Resolution: 0.1dB
Sound sensor can measure the intensity of environmental sound. Use
the electret microphone collecting the sound signal , after amplifying
processing, can output the value of sound intensity.
Component
Usage
Connect the Sound level sensor into any port of the SensorDisc
Put the SenseDisc into the measured environment
No. Type Name Illustration
1
S0021
Sound level sensor
Page 32

Typical experiment
Notice:
Case: Measure the noise of environment
Measure the level of sound intensity
Measure the noise of environment
Ensure that the measured sound intensity within the range. If over range,
let the sensor away from the sound source or reduce the sound level
The sensor are not waterproof, if in the humid environment, must do the
protection measures to avoid the liquid into the sensor
Page 33

Heart rate sensor
S1024
Range: 0-200 bpm
Resolution: ±2 bpm
Accuracy: 1 bpm
Heart rate sensor is used to detect heart rate of human body. The
probe adopts a transmissive ear clip, when in use, make the clip onto
the ear lobe of the tester.
Component
Usage
Connect the Heart rate sensor into any port of SensorDisc
Connect the transmissive ear clip to the sensor module
Make the clip onto the ear lobe of the tester
No. Type Name Illustration
1
2
S1024
Heart rate
sensor
Probe
Page 34

Typical experiment
Notice:
Case: Test on human heart rate
Test on human heart rate
If the water vapor condensation in the detected environment (when is
very humid ), must prevent liquid invasion to the circuit part of sensor
The response speed of humidity sensor will be faster in the flow air
If measured environment are very dirty, you should cover the ear clip by
nylon cloth to avoid pollution
Page 35

Motion sensor
S0015
Range: 20~600cm
Accuracy: ±2%
Resolution: 0.1cm
Motion sensor is a sonar equipment emitting ultrasonic pulse, it
receives signal through the reflection of object, and then measure the
time T when the high frequency sound wave goes around between the
object and sensor; in accordance with the speed of sound in air, i.e. V, it
can calculate the distance between the object and the sensor, i.e.:
d=V*T/2.
Component
Usage
No. Type Name Illustration
1
S0015
Motion sensor
Connect the motion sensor into any port of the SensorDisc
Pointed the ultrasonic probe at the measured object
Measured object to be placed within the range of motion sensor
Page 36

Typical experiment
Notice:
Case: explore the curve of uniform variable
rectilinear motion
Curve of uniform linear motion and uniform variable rectilinear motion
Simple harmonic motion
Forced vibration
When use ,should pay attention to the blind area of measuring sensor
To ensure the accuracy of measurement results, the reflection surface of
measured object should be facing the probe of sensor and as large as
possible
We should pay attention: motion sensor only can sense the motion of
object which nearest and produces a very strong echo
Page 37

Sensor Manual
for Advance
Page 38

Absolute pressure sensor
S0024
Range: 0~400kPa
Accuracy: ±6kPa
Absolute pressure sensor is used to measure the absolute pressure of
air, it is connected with the exterior air under measurement by the front
luer, whereas the luer and the sealed vacuum reference cavity inside
the sensor forms a pressure difference; after the pressure difference is
converted into a voltage signal, its output voltage and absolute pressure
to be proportional.
Component
Usage
No. Type Name Illustration
1
S0024
Absolute pressure
sensor
Syringe
Connect the Absolute pressure sensor into any port of the
SensorDisc
Connect the syringe with the luer port of air pressure sensor
Page 39

Absolute pressure sensor can be used directly,if you want exact
measurements, please calibrate as follows:
Air pressure sensor - will be placed on the stable pressure environment
in current
Open ,click , choose“Absolute pressure sensor”,click
“Calibration”,enter a value(within range),click“OK”
Typical experiment
Calibration
Notice:
Case: The effects of Catalyst have an
influence on chemical reaction rate
Boyle's Law
Charles' Law
Magdeburger Halbkugeln
The effects of Catalyst have an influence on chemical reaction rate
Absolute pressure sensor can only measure: non corrosive gases, such
as air, dry gas
The sensor is not suitable for the measurement of flammable gas
Can be used to detect the steam pressure of liquid, but avoid the liquid
enters into hose of probe
In the pressure system, the gas in the container has a certain degree of
overflow, therefore, longer research time, greater influence of gas
leakage, so if conditions allow, should complete the experiment as soon
as possible
Page 40

Current sensor
S0005
Range: -1~1A
Accuracy: ±1%
Resolution: 0.001A
Internal resistance: 0.22Ω
Current sensor is used to measure the current in circuit. When current
is passing the sampling resistance, it will form a tiny electric
potential difference at both ends of the resistance; After enlarging the
circuit, it can accurately measure the current in DC circuit or low-voltage AC.
Component
Usage
No. Type Name Illustration
1
2
3
S0005
Current sensor
Red crocodile clip
Black crocodile clip
Connect the current sensor into any port of the SensorDisc
Wires of red-black crocodile clip should be inserted into the positive and negative
port of current sensor
Red-black crocodile clips of current sensor are series connected to both ends of
circuit or electrical equipment
Page 41

Calibration
Typical experiment
Notice:
Case: measure the VA characteristic
curve of small bulb
Calibrate the current sensor before use
Short connected the red-black crocodile clips of current sensor
Open ,click ,choose “current sensor”,
click“Calibration”,then click“OK”.
Serial-parallel circuit of resistance
Measure the VA characteristic curve of small bulb
Measure the electrodynamic potential and internal resistance of battery
Ohm's Law
Serial into the circuit when using current sensor
Calibration before using current sensor
Current sensor can not bear the current over 3A
Page 42

Light sensor
S0019
Range: 0~55000Lux
Accuracy: ±5%
Resolution: 15Lux
Light sensor uses the silicon photoelectric cell as the sensing element;
it can convert the light ntensity into a voltage signal, keeping a direct
proportion. For the sensor, the effective light spectrum is in the range of
380nm to 730nm, it is an ideal intensity sensor for visible light.
Component
Usage
Connect the light sensor into any port of the SensorDisc
The probe of light sensor is located at the front of sensor, when use, pointed the
photosurface at light
No. Type Name Illustration
1
S0019
Light sensor
Page 43

Typical experiment
Notice:
Case: Measure the light intensity of environment
Explore the effects of light intensity on photosynthesis
Explore the relation between light intensity and distance
Measure the light intensity of environment
When use, always maintain the probe of sensor that facing light source
Don't wear or scratch the receives of probe
Page 44

pH sensor
S1002
Range: 0~14
Accuracy: ±0.2
Resolution: 0.01
The pH electrode composes of an internal reference electrode and an
glass electrode. It is mainly used to measure the hydrogen ion concentration of a solution and show the pH value of the solution.
Component
Usage
Connect the pH sensor into any port of the SensorDisc
Tighten the port of electrode probe with sensor
Unscrew the protective bottle of electrode probe
Immerse the electrode probe of pH sensor into the solution completely
Calibration
Calibrate before use,before Calibration, prepare two kinds of buffer solution with
known pH value,e.g. pH4.00 andf pH9.18. The calibration process, please refer
to“Notes”
No. Type Name Illustration
1
S1002
pH sensor
Electrode
probe
Page 45

Typical experiment
Notice:
Calibration pH sensor:
Case: Measure the pH value of orange juice
Acid-base neutralization titration
pH value of different solutions
Acidity of phenol
The mechanism of organism that maintain pH stability
Study on impact of pH value on pectinase activity
Note
: pH calibration fluid (pH buffer), can use the solution by known pH
value, or self configuration, or buy it in the chemical reagents store
Rinse the electrodes before each measurement, do not use absorbent paper
to wipe the glass ball of electrode, this may lead the electrode does not work,
you'd better rinse the electrodes by measured solution
In order to keep the exchange process of electrode ion occurred, the glass
ball should be stored in the saturated KCl solution, If the electrode was
drying, immersed in saturated KCl solution for 24 hours, make it back to the
common state.
Don't storeage the electrodes in distilled water or deionized water, this will
lead saturated solution around the electrode moving
Avoid use in the extreme acid solution or extreme temperature value
Open ,click ,choose“pH sensor”,click“Calibration”;
The electrode is rinsed with distilled water, and wipe with an absorbent
paper,sock it in pH4.0 calibration fluid,when the value(on the left-lower
corner) is stability, click (at the back of the );
High-end value calibration by pH9.18 calibration fluid,repeat the previous
step;
Remove electrodes, rinse the electrodes with distilled water and wipe with an
absorbent paper;
Click ,click in the dialog
Page 46

Temperature sensor
S0009
Range: -40~135℃
Accuracy: ±0.6℃
Resolution: 0.1℃
Temperature sensor adopts the NTC electronic temperature sensing
element, when the ambient temperature changes, the NTC resistance
changes accordingly. Normally the temperature needs no zero calibration and with relatively higher stability; therefore, the temperature
sensor is rather popular in the low-middle temperature measurements.
Component
Usage
No. Type Name Illustration
1
2
S0009
Temperature
sensor
Probe
Connect the temperature sensor into any port of the SensorDisc
The probe of sensor insert to the socket of temperature sensor
Page 47

Typical experiment
Notice:
Case: water cooling
Water cooling
Liquid's evaporation cooling
Energy conversion
The relation between boiling point of liquid and air pressure
Measure the heat of acid-base neutralization reaction
Compare the heat conductivity of different materials
The germination of seed
We can't put any part of the sensor on the open flame or heating plate
directly
When measure the temperature of liquid, should avoid the other partially
of sensor immersed in liquid except stainless steel rod
After use, cleaning sensor thoroughly
Don’t over measured range
Page 48

Relative humidity sensor
S1008
Range: 0~100%
Accuracy: ±4%(10%~90%RH)
Resolution: 0.1%
The relative humidity sensor is designed based on the sensitive
humidity prototype, namely a polymer capacitance, and its capacitance
will vary with the environmental humidity. The humidity sensor is
designed to monitor the relative humidity of air.
Component
Usage
Connect the relative humidity sensor into any port of the SensorDisc
Insert the probe of sensor into the socket of relative humidity sensor
No. Type Name Illustration
1
2
S1008
Relative humidity
sensor
Probe
Page 49

Typical experiment
Notice:
Case: Hydroscopicity of concentrated
sulfuric acid
Measurement on the change of environmental humidity
Hydroscopicity of concentrated sulfuric acid
Design and make an ecological cylinder and observe its stability
Transpiration of plant
If the water vapor condensation in the detected environment (when is
very humid ), must prevent liquid invasion to the circuit part of sensor
The response speed of humidity sensor will be faster in the flow air
If measured environment are very dirty, you should cover sensor by
nylon cloth to avoid pollution
Page 50

Sound level sensor
S0021
Range: 40~92dB
Accuracy: ±4dB
Resolution: 0.1dB
Sound sensor can measure the intensity of environmental sound. Use
the electret microphone collecting the sound signal , after amplifying
processing, can output the value of sound intensity.
Component
Usage
Connect the Sound level sensor into any port of the SensorDisc
Put the SenseDisc into the measured environment
No. Type Name Illustration
1
S0021
Sound level sensor
Page 51

Typical experiment
Notice:
Case: Measure the noise of environment
Measure the level of sound intensity
Measure the noise of environment
Ensure that the measured sound intensity within the range. If over range,
let the sensor away from the sound source or reduce the sound level
The sensor are not waterproof, if in the humid environment, must do the
protection measures to avoid the liquid into the sensor
Page 52

Motion sensor
S0015
Range: 20~600cm
Accuracy: ±2%
Resolution: 0.1cm
Motion sensor is a sonar equipment emitting ultrasonic pulse, it
receives signal through the reflection of object, and then measure the
time T when the high frequency sound wave goes around between the
object and sensor; in accordance with the speed of sound in air, i.e. V, it
can calculate the distance between the object and the sensor, i.e.:
d=V*T/2.
Component
Usage
No. Type Name Illustration
1
S0015
Motion sensor
Connect the motion sensor into any port of the SensorDisc
Pointed the ultrasonic probe at the measured object
Measured object to be placed within the range of motion sensor
Page 53

Typical experiment
Notice:
Case: Explore the curve of uniform variable
rectilinear motion
Curve of uniform linear motion and uniform variable rectilinear motion
Simple harmonic motion
Forced vibration
When use ,should pay attention to the blind area of measuring sensor
To ensure the accuracy of measurement results, the reflection surface of
measured object should be facing the probe of sensor and as large as
possible
We should pay attention: motion sensor only can sense the motion of
object which nearest and produces a very strong echo
Page 54

mV sensor
S0002
Range: -500~500mV
Accuracy: ±1%
Resolution: 0.3mV
Input impedence: 500KΩ
mV sensor is used to measure the electric potential difference at both
ends of electric equipment or circuit. After dividing the voltage collected
by the circuit of the micro voltage sensor, it can measure the mV in DC
circuit or low-voltage AC circuit.
Component
Usage
No. Type Name Illustration
1
2
3
S0002
mV sensor
Red crocodile clip
Black crocodile clip
Connect the mV sensor into any port of the SensorDisc
Wires of red-black crocodile clip should be inserted into the positive and negative
port of mV sensor
Red-black crocodile clips of mV sensor are parallel connected to both ends of circuit
or electrical equipment
Page 55

Calibration
Typical experiment
Notice:
Case: Primary cell
Calibrate the mV sensor before use
Short connected the red-black crocodile clips of mV sensor
Open ,click ,choose“mV sensor”,click“Calibration”,then
click“OK”.
Solar power
Primary cell
Faraday’s law of electromagnetic induction
mV sensor should be parallel into the circuit when in usage
Calibration before using mV sensor
mV sensor can not bear the voltage over 250V
Page 56

Voltage sensor
S0001
Range: -30~30V
Accuracy: ±1%
Resolution: 0.02V
Input impedence: 2MΩ
Voltage sensor is used to measure the electric potential difference at
both ends of the electrical equipments or circuits, after the circuit of
voltage sensor transfering the voltage it collects, then it can realize the
measurement. The voltage sensor can be used in the DC circuit and
low-voltage AC circuit.
Component
Usage
No. Type Name Illustration
1
2
3
S0001
Voltage sensor
Red crocodile clip
Black crocodile clip
Connect the voltage sensor into any port of the SensorDisc
Wires of red-black crocodile clip should be inserted into the positive and negative
port of voltage sensor
Red-black crocodile clips of voltage sensor are parallel connected to both ends of
circuit or electrical equipment.
Page 57

Calibration
Typical experiment
Notice:
Case: Ohm’s Law
Calibrate the voltage sensor before use
Short connected the red-black crocodile clips of voltage sensor
Open ,click ,choose“voltage sensor”,
click“Calibration”,then click“OK”.
Serial-parallel circuit of resistance
Measure the VA characteristic curve of small bulb
Ohm's Law
Resistance law
Charging & discharging of capacitor
Measurement of EMF and inner resistance of battery
Voltage sensor should be parallel into the circuit when in usage
Calibration before using voltage sensor
Voltage sensor can not bear the voltage over 250V
Page 58

Conductivity sensor
S1003
Range: 0~20000μs/cm
Accuracy: ±4%
Resolution: 6μs/cm
The conductivity sensor is used to measure the conductivity of solution
and its change. It couldn’t distinguish the category of solution’s ions, but
can determine the total ionic concentration of solution.
Component
Usage
Connect the conductivity sensor into any port of the SensorDisc
Tighten the port of electrode probe with sensor
Unscrew the protective bottle of electrode probe
Put the electrode probe of conductivity sensor into test solution
No. Type Name Illustration
1
2
S1003
Conductivity
sensor
Electrode
probe
Calibration
Conductivity sensor has been calibration in factory, the user can use it
directly, if has large error, re-calibration again, calibration steps see
"Notes"
Tighten electrode probe and sensor
Open ,click ,choose“conductivity sensor”,to Calibrate it
Page 59

Typical experiment
Notice:
Case: Ionization of glacial acetic acid
Comparison on the conductivity of different water
Reaction of phenol and saturated bromine water
Study on the purity of drinking water
Relation between cell size and material transport
After experiment, clean the electrode thoroughly, to avoid pollution
before next time when you are using
Clean after usage, wipe with absorbent paper and storage. Electrode
must be kept clean, prevent sediment fouling and other types of fouling
Notes
calibrate the conductivity sensor(conductivity sensor has been calibration in factory, the user can use it directly, if has large error,
re-calibration again):
Note: the Configuration method of standard solution of conductivity,
please reference《Digital Experimental Cases of Biochemistry》
Click , display a “Calibration” dialog, choose“conductivity sensor”;
Click
The electrode is rinsed with distilled water, and wipe with an absorbent
paper,when the value(on the left-lower corner) is stability, click
(at the back of the )
Calibrate it with known calibration fluid, enter conductivity value of known
calibration fluid in (e.g.:1413μS/cm), repeat the previous step
Remove electrodes, rinse the electrodes with distilled water and wipe
with an absorbent paper
Click ,click button
Page 60

Dissolved oxygen sensor
S1005
Range: 0~20mg/L
Accuracy: ±0.4mg/L(10~35℃)
The probe of the dissolved oxygen sensor works as per the polarogram
measurement principle. The probe electrode composes of the anode,
cathode and membrane. When is usage, immerse the electrode into the
solution and apply the electric potential between the anode and the
cathode to generate the electrochemical reaction;
Dissolved oxygen sensor also can be used for measuring oxygen
content in gas.
Component
Usage
Connect the dissolved oxygen sensor into any port of the SensorDisc
Tighten the port of electrode probe and sensor
The probe placed in the test solution or gas environment to measure
No. Type Name Illustration
1
2
S1005
Dissolved
oxygen sensor
Probe
Page 61

Typical experiment
Notice:
Case: study the breathing way of
saccharomycetes
Study the breathing way of saccharomycetes
Study the dissolved oxygen of different water
Factors that effect plant photosynthesis
Avoid contact with oil or other organic matter
If there have scale on electrode, immerse it in the 10% hydrochloric acid
solution for 3 minutes, then rinse by clean water; If stained with organics,
immerse it in the 8% alcohol solution for 10 minutes, then rinse by clean
water;
Page 62

Heart rate sensor
S1024
Range: 0-200bpm
Accuracy: 1bpm
Resolution: ±2bpm
Heart rate sensor is used to detect heart rate of human body. The
probe adopts a transmissive ear clip, when in use, make the clip onto
the ear lobe of the tester.
Component
Usage
Connect the Heart rate sensor into any port of SensorDisc
Connect the transmissive ear clip to the sensor module
Make the clip onto the ear lobe of the tester
No. Type Name Illustration
1
2
S1024
Heart rate
sensor
Probe
Page 63

Typical experiment
Notice:
Case: Test on human heart rate
Test on human heart rate
If the water vapor condensation in the detected environment (when is
very humid ), must prevent liquid invasion to the circuit part of sensor
The response speed of humidity sensor will be faster in the flow air
If measured environment are very dirty, you should cover the ear clip by
nylon cloth to avoid pollution
Page 64

Thermocouple sensor
S0013
Range: -200 to 1200℃
Accuracy: ±6℃(-200-0℃)
±3℃(0-200℃)
±6℃(200~1200℃)
Resolution: 0.25℃
The thermocouple sensor can be used to measure higher temperature.
In the physical and chemical experiment in middle school, it can
measure the temperature of flame directly, there is no need to worry
about whether the cable could be damaged by high temperature.
Component
Usage
Connect the thermocouple sensor into any port of the SensorDisc
Connect the probe to the socket of thermocouple sensor
No. Type Name Illustration
1
2
S0013
Thermocouple
sensor
Probe
Page 65

Typical experiment
Notice:
Case: Explore the temperature changes
when a solid melts
Measurement of acid-base reaction heat
The hot water cooling
Explore the temperature changes when a solid melts
Explore different parts of the alcohol lamp flame temperature
When in use, do not exceed the sensor’s measuring range
Probe can be immersed in corrosive liquids or object for measurement,
but remember to wipe the probe after testing, and keep it dry for storage
Page 66

Force sensor
S0014
Range: -50~50N
Accuracy: ±1%
Resolution: 0.03N
Force sensor has adopted a resistance strain member to convert the
force into the voltage message. After circuit amplification and processing the voltage message, we can measure the force value accurately.
Component
Usage
Connect the Force sensor with universal port,then Connect the Universal port into
any port of the SensorDisc
The Force sensor can be measured the tension and pressure simultaneously,
pushing the metal hook, display the positive value, pulling the metal hook, display the
negative value
No. Type Name Illustration
1
2
3
S3000
S0014
Universal port
Force sensor
Trilobular screw
Page 67

Typical experiment
Calibration
Notice:
Case: Relationship between action and reaction force
Hooke's Law
Relationship between action and reaction force
Overweight and weightlessness
Simple harmonic motion
Law of buoyancy
Calibrate the Force sensor before use
Calibrate the Force sensor before use
Should pay attention that the force direction of sensor and the sensor to
be vertical in the measurement process , otherwise it will infect the
results of the measurement
Don’t over measured range, otherwise, irreparable�damage�to�
Force sensor
Hook of force sensor not tighten too much,otherwise it will infect the
results of the measurement
Firstly, tighten and fixed the hook of force sensor
Measuring what state forces that placed the force sensor at what state (such
as measuring the horizontal force, placed the Force sensor at horizontal )
Open ,click ,choose“Force sensor”,click“Calibration”, then
click“OK”
Page 68

Sensor Manual
for Physics
Page 69

Absolute pressure sensor
S0024
Range: 0~400kPa
Accuracy: ±6kPa
Absolute pressure sensor is used to measure the absolute pressure of
air, it is connected with the exterior air under measurement by the front
luer, whereas the luer and the sealed vacuum reference cavity inside
the sensor forms a pressure difference; after the pressure difference is
converted into a voltage signal, its output voltage and absolute pressure
to be proportional.
Component
Usage
No. Type Name Illustration
1
S0024
Absolute pressure
sensor
Syringe
Connect the Absolute pressure sensor into any port of the
SensorDisc
Connect the syringe with the luer port of air pressure sensor
Page 70

Absolute pressure sensor can be used directly,if you want exact
measurements, please calibrate as follows:
Absolute pressure sensor - will be placed on the stable pressure
environment in current
Open ,click , choose“Absolute pressure sensor”,click
“Calibration”,enter a value(within range),click“OK”
Typical experiment
Calibration
Notice:
Case: Boyle's Law
Boyle's Law
Charles' Law
Magdeburger Halbkugeln
Absolute pressure sensor can only measure: non corrosive gases, such
as air, dry gas
The sensor is not suitable for the measurement of flammable gas
Can be used to detect the steam pressure of liquid, but avoid the liquid
enters into hose of probe
In the pressure system, the gas in the container has a certain degree of
overflow, therefore, longer research time, greater influence of gas
leakage, so if conditions allow, should complete the experiment as soon
as possible
Page 71

Voltage sensor
S0001
Range: -30~30V
Accuracy: ±1%
Resolution: 0.02V
Input impedence: 2MΩ
Voltage sensor is used to measure the electric potential difference at
both ends of the electrical equipments or circuits, after the circuit of
voltage sensor transfering the voltage it collects, then it can realize the
measurement. The voltage sensor can be used in the DC circuit and
low-voltage AC circuit.
Component
Usage
No. Type Name Illustration
1
2
3
S0001
Voltage sensor
Red crocodile clip
Black crocodile clip
Connect the voltage sensor into any port of the SensorDisc
Wires of red-black crocodile clip should be inserted into the positive and negative
port of voltage sensor
Red-black crocodile clips of voltage sensor are parallel connected to both ends of
circuit or electrical equipment.
Page 72

Calibration
Typical experiment
Notice:
Case: Ohm’s Law
Calibrate the voltage sensor before use
Short connected the red-black crocodile clips of voltage sensor
Open ,click ,choose“voltage sensor”,
click“Calibration”,then click“OK”.
Serial-parallel circuit of resistance
Measure the VA characteristic curve of small bulb
LC oscillation
Ohm's Law
Voltage sensor should be parallel into the circuit when in usage
Calibration before using voltage sensor
Voltage sensor can not bear the voltage over 250V
Page 73

Light sensor
S0019
Range: 0~55000Lux
Accuracy: ±5%
Resolution: 15Lux
Light sensor uses the silicon photoelectric cell as the sensing element;
it can convert the light ntensity into a voltage signal, keeping a direct
proportion. For the sensor, the effective light spectrum is in the range of
380nm to 730nm, it is an ideal intensity sensor for visible light.
Component
Usage
Connect the light sensor into any port of the SensorDisc
The probe of light sensor is located at the front of sensor, when use, pointed the
photosurface at light
No. Type Name Illustration
1
S0019
Light sensor
Page 74

Typical experiment
Notice:
Case: Explore the relation between illumination
intensity and distance
Explore the relation between light intensity and distance
Measure the light intensity of environment
When use, always maintain the probe of sensor that facing light source
Don't wear or scratch the receives of probe
Page 75

Temperature sensor
S0009
Range: -40~135℃
Accuracy: ±0.6℃
Resolution: 0.1℃
Temperature sensor adopts the NTC electronic temperature sensing
element, when the ambient temperature changes, the NTC resistance
changes accordingly. Normally the temperature needs no zero calibration and with relatively higher stability; therefore, the temperature
sensor is rather popular in the low-middle temperature measurements.
Component
Usage
No. Type Name Illustration
1
2
S0009
Temperature
sensor
Probe
Connect the temperature sensor into any port of the SensorDisc
Insert the probe of sensor into the socket of temperature sensor
Page 76

Typical experiment
Notice:
Case: Water cooling
Water cooling
Water freezes and ice melt
Energy conversion
The relation between boiling point of liquid and air pressure
Compare the heat conductivity of different material
We can't put any part of the sensor on the open flame or heating plate
directly
When measure the temperature of liquid, should avoid the other partially
of sensor immersed in liquid except stainless steel rod
After use, cleaning sensor thoroughly
Don’t over measured range
Page 77

Current sensor
S0005
Range: -1~1A
Accuracy: ±1%
Resolution: 0.001A
Internal resistance: 0.22Ω
Current sensor is used to measure the current in circuit. When current
is passing the sampling resistance, it will form a tiny electric
potential difference at both ends of the resistance; After enlarging the
circuit, it can accurately measure the current in DC circuit or low-voltage AC.
Component
Usage
No. Type Name Illustration
1
2
3
S0005
Current sensor
Red crocodile clip
Black crocodile clip
Connect the current sensor into any port of the SensorDisc
Wires of red-black crocodile clip should be inserted into the positive and negative
port of current sensor
Red-black crocodile clips of current sensor are series connected to both ends of
circuit or electrical equipment.
Page 78

Calibration
Typical experiment
Notice:
Case: Measure the VA characteristic
curve of small bulb
Calibrate the current sensor before use
Short connected the red-black crocodile clips of current sensor
Open ,click ,choose “current sensor”,
click“Calibration”,then click“OK”.
Serial-parallel circuit of resistance
Measure the VA characteristic curve of small bulb
Measure the electrodynamic potential and internal resistance of battery
Ohm's Law
Serial into the circuit when using current sensor
Calibration before using current sensor
Current sensor can not bear the current over 3A
Page 79

Sound level sensor
S0021
Range: 40~92dB
Accuracy: ±4dB
Resolution: 0.1dB
Sound sensor can measure the intensity of environmental sound. Use
the electret microphone collecting the sound signal , after amplifying
processing, can output the value of sound intensity.
Component
Usage
Connect the Sound level sensor into any port of the SensorDisc
Put the SenseDisc into the measured environment
No. Type Name Illustration
1
S0021
Sound level sensor
Page 80

Typical experiment
Notice:
Case: Measure the noise of environment
Measure the level of sound intensity
Measure the noise of environment
Ensure that the measured sound intensity within the range. If over range,
let the sensor away from the sound source or reduce the sound level
The sensor are not waterproof, if in the humid environment, must do the
protection measures to avoid the liquid into the sensor
Page 81

Motion sensor
S0015
Range: 20~600cm
Accuracy: ±2%
Resolution: 0.1cm
Motion sensor is a sonar equipment emitting ultrasonic pulse, it
receives signal through the reflection of object, and then measure the
time T when the high frequency sound wave goes around between the
object and sensor; in accordance with the speed of sound in air, i.e. V, it
can calculate the distance between the object and the sensor, i.e.:
d=V*T/2.
Component
Usage
No. Type Name Illustration
1
S0015
Motion sensor
Connect the motion sensor into any port of the SensorDisc
Pointed the ultrasonic probe at the measured object
Measured object to be placed within the range of motion sensor
Page 82

Typical experiment
Notice:
Case: Explore the curve of uniform variable
rectilinear motion
Curve of uniform linear motion and uniform variable rectilinear motion
Simple harmonic motion
To explore the trajectory of the object
The movement of bubbles
Measure the velocity via sensor
When use ,should pay attention to the blind area of measuring sensor
To ensure the accuracy of measurement results, the reflection surface of
measured object should be facing the probe of sensor and as large as
possible
We should pay attention: motion sensor only can sense the motion of
object which nearest and produces a very strong echo
Page 83

mV sensor
S0002
Range: -500~500mV
Accuracy: ±1%
Resolution: 0.3mV
Input impedence: 500KΩ
mV sensor is used to measure the electric potential difference at both
ends of electric equipment or circuit. After dividing the voltage collected
by the circuit of the micro voltage sensor, it can measure the mV in DC
circuit or low-voltage AC circuit.
Component
Usage
No. Type Name Illustration
1
2
3
S0002
mV sensor
Red crocodile clip
Black crocodile clip
Connect the mV sensor into any port of the SensorDisc
Wires of red-black crocodile clip should be inserted into the positive and negative
port of mV sensor
Red-black crocodile clips of mV sensor are parallel connected to both ends of circuit
or electrical equipment
Page 84

Calibration
Typical experiment
Notice:
Case: Primary cell
Calibrate the current sensor before use
Short connected the red-black crocodile clips of current sensor
Open ,click ,choose“mV sensor”,click“Calibration”,then
click“OK”.
Faraday’s law of electromagnetic induction
Solar power
Primary cell
mV sensor should be parallel into the circuit when in usage
Calibration before using mV sensor
mV sensor can not bear the voltage over 250V
Page 85

Force sensor
S0014
Range: -50~50N
Accuracy: ±1%
Resolution: 0.03N
Force sensor has adopted a resistance strain member to convert the
force into the voltage message. After circuit amplification and processing the voltage message, we can measure the force value accurately.
Component
Usage
Connect the Force sensor with universal port,then Connect the Universal port into
any port of the SensorDisc
The Force sensor can be measured the tension and pressure simultaneously,
pushing the metal hook, display the positive value, pulling the metal hook, display the
negative value
No. Type Name Illustration
1
2
3
S3000
S0014
Universal port
Force sensor
Trilobular screw
Page 86

Typical experiment
Calibration
Notice:
Case: Relation between action and reaction force
Hooke's Law
Relation between action and reaction force
Overweight and weightlessness
Simple harmonic motion
Law of buoyancy
Calibrate the Force sensor before use
Calibrate the Force sensor before use
Should pay attention that the force direction of sensor and the sensor to
be vertical in the measurement process , otherwise it will infect the
results of the measurement
Don’t over measured range, otherwise, irreparable�damage�to�
Force sensor
Hook of force sensor not tighten too much,otherwise it will infect the
results of the measurement
Firstly, tighten and fixed the hook of force sensor
Measuring what state forces that placed the force sensor at what state (such
as measuring the horizontal force, placed the Force sensor at horizontal )
Open ,click ,choose“Force sensor”,click“Calibration”, then
click“OK”
Page 87

Photogate
S0016
Range: 0~∞s
Accuracy: ±1μs
Resolution: 1μs
In essence, the photogate sensor is a digital-switch sensor, with the
infrared emitter and infrared receiver at both ends respectively. If the
infrared receiver receives the light beam,the photogate sensor will be in
low-voltage (on-state); if the infrared beam is blocked off, and the
infrared receiver fails to receive the beam, the photogate sensor will be
in high-voltage (off-state).
Component
Usage
Connect the phtotgate sensor with universal port,then Connect the Universal port
into any port of the SensorDisc
When use phtotgate sensor, according to the experimental type and accessories,
we can set it as follows:
No. Type Name Illustration
1
2
3
S3000
S0016
Universal port
Phtotgate
Trilobular screw
open ,click ,choose experimental type、type of light barrier,
then choose measured physical quantity, input related parameters,
click“OK”(because different set in different experiment,detailed
settings please refer to the 《SenseDisc All-in-one Experimental
Cases》)
Page 88

Typical experiment
Notice:
Case: Freely-falling body motion
Explore the relationship among force, mass and acceleration
Simple pendulum
Theorem of momentum
Mechanical Energy Conservation Law
Freely-falling body motion
Calibrate the phtotgate sensor before usage
Installation of phtotgate sensor is varied, should according to the specific
experimental flexibly assembled, pay attention that accurate positioning
and firm connection in the assembly process
The phtotgate is very sensitive to the high intensity infrare and heat of
surrounding environment, should avoid bright light. Because the glare,
will produce an error closed results
Page 89

Sensor Manual
for Biochemistry
Page 90

Absolute pressure sensor
S0024
Range: 0~400kPa
Accuracy: ±6kPa
Absolute pressure sensor is used to measure the absolute pressure of
air, it is connected with the exterior air under measurement by the front
luer, whereas the luer and the sealed vacuum reference cavity inside
the sensor forms a pressure difference; after the pressure difference is
converted into a voltage signal, its output voltage and absolute pressure
to be proportional.
Component
Usage
No. Type Name Illustration
1
S0024
Absolute pressure
sensor
Syringe
Connect the Absolute pressure sensor into any port of the
SensorDisc
Page 91

Absolute pressure sensor can be used directly,if you want exact
measurements, please calibrate as follows:
Absolute pressure sensor - will be placed on the stable pressure
environment in current
Open ,click , choose“Absolute pressure sensor”,click
“Calibration”,enter a value(within range),click“OK”
Typical experiment
Calibration
Notice:
Case: The effects of Catalyst have an
influence on chemical reaction rate
Boyle's Law
Charles' Law
Magdeburger Halbkugeln
The effects of Catalyst have an influence on chemical reaction rate
Absolute pressure sensor can only measure: non corrosive gases, such
as air, dry gas
The sensor is not suitable for the measurement of flammable gas
Can be used to detect the steam pressure of liquid, but avoid the liquid
enters into hose of probe
In the pressure system, the gas in the container has a certain degree of
overflow, therefore, longer research time, greater influence of gas
leakage, so if conditions allow, should complete the experiment as soon
as possible
Page 92

Conductivity sensor
S1003
Range: 0~20000μs/cm
Accuracy: ±4%
Resolution: 6μs/cm
The conductivity sensor is used to measure the conductivity of solution
and its change. It couldn’t distinguish the category of solution’s ions, but
can determine the total ionic concentration of solution.
Component
Usage
Connect the conductivity sensor into any port of the SensorDisc
Tighten the port of electrode probe and sensor
Unscrew the protective bottle of electrode probe
Put the electrode probe of conductivity sensor into test solution
No. Type Name Illustration
1
2
S1003
Conductivity
sensor
Electrode
probe
Calibration
Conductivity sensor has been calibration in factory, the user can use it
directly, if has large error, re-calibration again, calibration steps see
"Notes"
Tighten electrode probe and sensor
Open ,click ,choose“conductivity sensor”,to Calibrate
Page 93

Typical experiment
Notice:
Case: Ionization of glacial acetic acid
Comparison on the conductivity of different water
Reaction of phenol and saturated bromine water
Study on the purity of drinking water
Relation between cell size and material transport
After experiment, clean the electrode thoroughly, to avoid pollution
before next time when you are using
Clean after usage, wipe with absorbent paper and storage. Electrode
must be kept clean, prevent sediment fouling and other types of fouling
Notes
calibrate the conductivity sensor(conductivity sensor has been calibration in factory, the user can use it directly, if has large error,
re-calibration again):
Note: the Configuration method of standard solution of conductivity,
please reference《Digital Experimental Cases of Biochemistry》
Click , display a “Calibration” dialog, choose“conductivity sensor”;
Click
The electrode is rinsed with distilled water, and wipe with an absorbent
paper,when the value(on the left-lower corner) is stability, click
(at the back of the )
Calibrate it with known calibration fluid, enter conductivity value of known
calibration fluid in (e.g.:1413μS/cm), repeat the previous step
Remove electrodes, rinse the electrodes with distilled water and wipe
with an absorbent paper
Click ,click button
Page 94

Light sensor
S0019
Range: 0~55000Lux
Accuracy: ±5%
Resolution: 15Lux
Light sensor uses the silicon photoelectric cell as the sensing element;
it can convert the light ntensity into a voltage signal, keeping a direct
proportion. For the sensor, the effective light spectrum is in the range of
380nm to 730nm, it is an ideal intensity sensor for visible light.
Component
Usage
Connect the light sensor into any port of the SensorDisc
The probe of light sensor is located at the front of sensor, when use, pointed the
photosurface at light
No. Type Name Illustration
1
S0019
Light sensor
Page 95

Typical experiment
Notice:
Case: Measure the light intensity of environment
Explore the effects of light intensity on photosynthesis
Measure the light intensity of environment
When use, always maintain the probe of sensor that facing light source
Don't wear or scratch the receives of probe
Page 96

Thermocouple sensor
S0013
Range: -200 to 1200℃
Accuracy: ±6℃(-200-0℃)
±3℃(0-200℃)
±6℃(200~1200℃)
Resolution: 0.25℃
The thermocouple sensor can be used to measure higher temperature.
In the physical and chemical experiment in middle school, it can
measure the temperature of flame directly, there is no need to worry
about whether the cable could be damaged by high temperature.
Component
Usage
Connect the thermocouple sensor into any port of the SensorDisc
Connect the probe to the socket of thermocouple sensor
No. Type Name Illustration
1
2
S0013
Thermocouple
sensor
Probe
Page 97

Typical experiment
Notice:
Case: The hot water cooling
The hot water cooling
Explore different parts of the alcohol lamp flame temperature
When in use, do not exceed the sensor’s measuring range
Probe can be immersed in corrosive liquids or object for measurement,
but remember to wipe the probe after testing, and keep it dry for storage
Page 98

Heart rate sensor
S1024
Range: 0-200bpm
Accuracy: 1bpm
Resolution: ±2bpm
Heart rate sensor is used to detect heart rate of human body. The
probe adopts a transmissive ear clip, when in use, make the clip onto
the ear lobe of the tester.
Component
Usage
Connect the Heart rate sensor into any port of SensorDisc
Connect the transmissive ear clip to the sensor module
Make the clip onto the ear lobe of the tester
No. Type Name Illustration
1
2
S1024
Heart rate
sensor
Probe
Page 99

Typical experiment
Notice:
Case: Test on human heart rate
Test on human heart rate
If the water vapor condensation in the detected environment (when is
very humid ), must prevent liquid invasion to the circuit part of sensor
The response speed of humidity sensor will be faster in the flow air
If measured environment are very dirty, you should cover the ear clip by
nylon cloth to avoid pollution
Page 100

Relative Humidity sensor
S1008
Range: 0~100%
Accuracy: ±4%(10%~90%RH)
Resolution: 0.1%
The relative humidity sensor is designed based on the sensitive
humidity prototype, namely a polymer capacitance, and its capacitance
will vary with the environmental humidity. The humidity sensor is
designed to monitor the relative humidity of air.
Component
Usage
Connect the relative humidity sensor into any port of the SensorDisc
The probe of sensor insert to the socket of relative humidity sensor
No. Type Name Illustration
1
2
S1008
Relative
humidity sensor
Probe
 Loading...