

Page 1
USER MANUAL
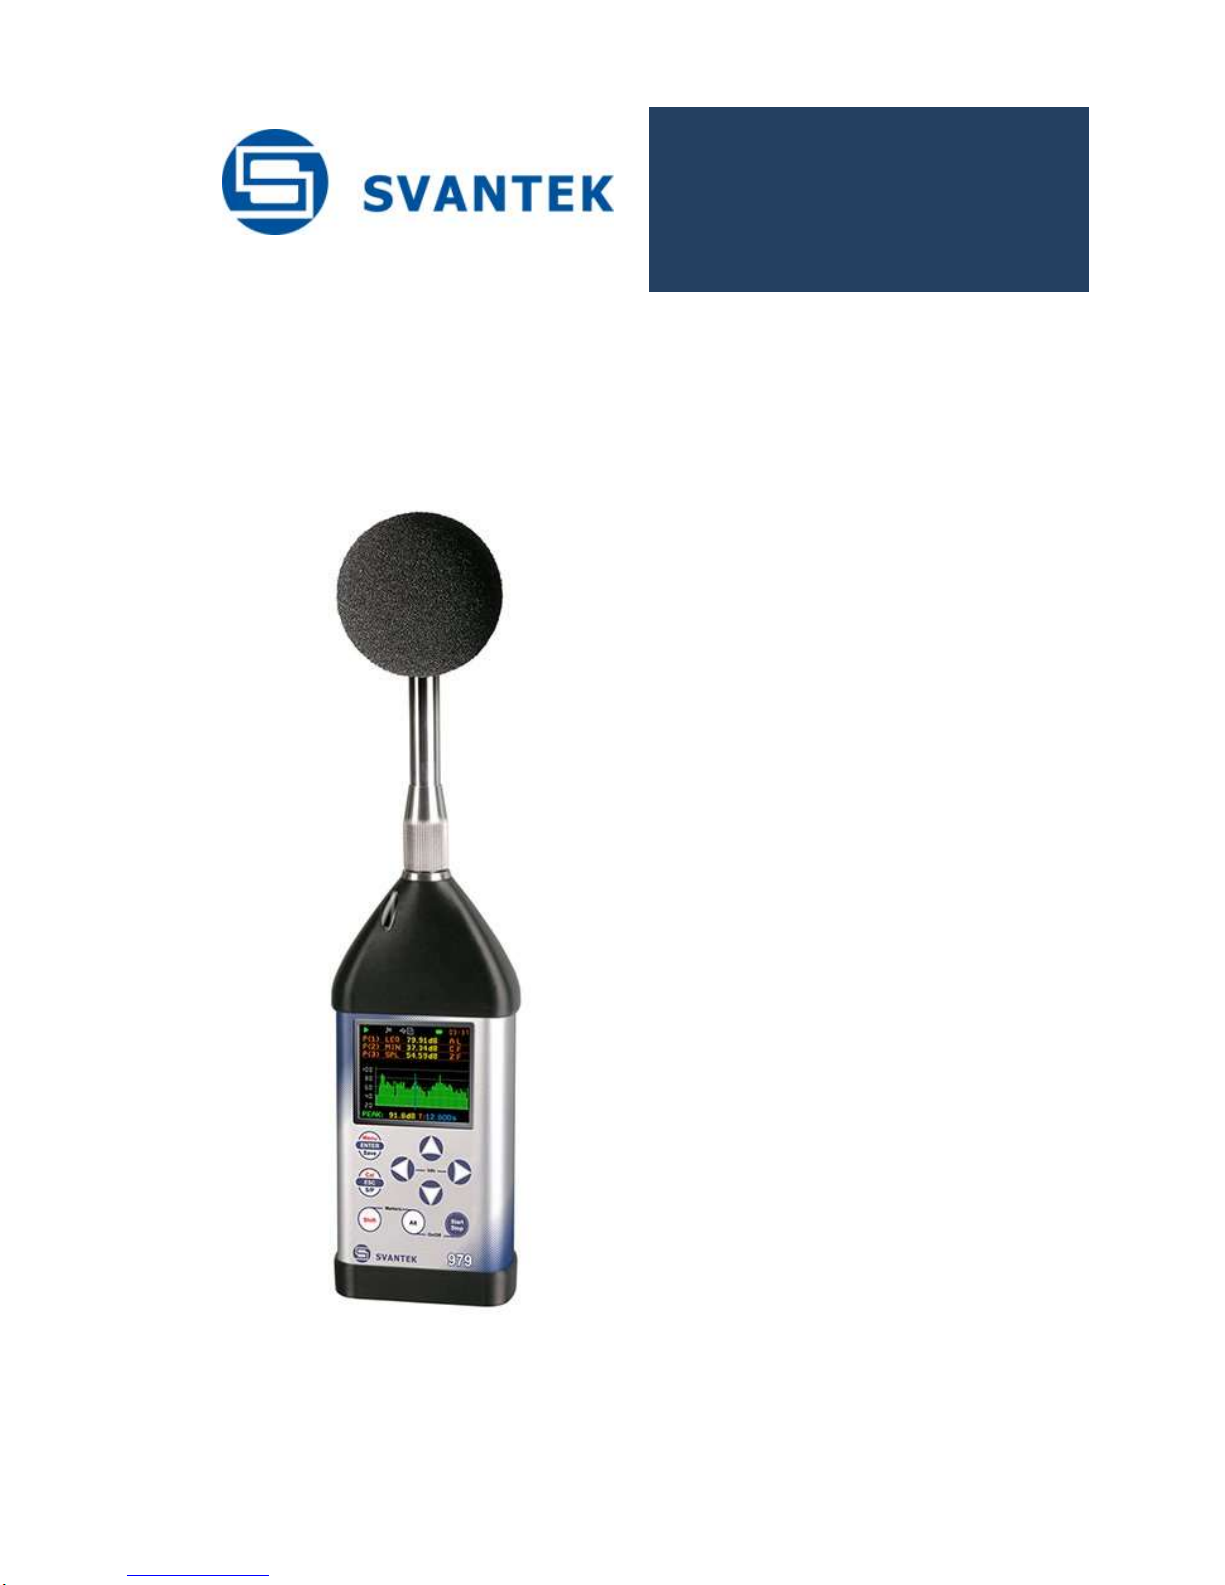
SVAN 979
SOUND & VIBRATION
ANALYSER
Warsaw, July 2017
Copyright © 2017 SVANTEK. All rights reserved.
Page 2
SVAN 979 USER'S MANUAL_______________________________________________ _2
Note: On account of continuous product improvement SVANTEK reserves the right to make
changes to product specifications without notice. To download the most up to date user's manual please visit
our web site at www.svantek.com.
This user’s manual presents the firmware revision named 1.25.1 and bootstrap revision named 1.06 (see the
Unit Label review to check version details).
The succeeding software revisions (marked with the higher numbers) can change the view of some displays
presented in the text of the manual.
WEEE Notice: Do not throw the device away with the unsorted municipal waste at the end of its life.
Instead, hand it in at an official collection point for recycling. By doing this you will help to preserve
the environment.
The software described in this manual is furnished under a license agreement and may be used only in
accordance with the terms of that agreement.
Copyright Notice
Copyright © 2017 Svantek Sp. z o.o.
All rights reserved.
Reproduction without permission is prohibited.
Trademarks
Trademarks or registered marks in this manual belong to their respective manufacturers.
Microsoft and Windows are registered trademarks of Microsoft Corporation.
The Bluetooth® word mark and logos are registered trademarks owned by Bluetooth SIG, Inc.
Disclaimer
Information in this document is subject to change without notice and does not represent a commitment on the
part of Svantek.
Svantek provides this document “as is,” without warranty of any kind, either expressed or implied, including,
but not limited to, its particular purpose. Svantek reserves the right to make improvements and/or changes to
this manual, or to the products and/or the programs described in this manual, at any time.
Information provided in this manual is intended to be accurate and reliable. However, Svantek assumes no
responsibility for its use, or for any infringements on the rights of third parties that may result from its use.
This product might include unintentional technical or typographical errors. Changes are periodically made to
the information herein to correct such errors, and these changes are incorporated into new editions of the
publication.
Technical Support Contact Information:
web: www.svantek.com
e-mail: [email protected]
Page 3

SVAN 979 USER'S MANUAL_______________________________________________ _3
CONTENTS
1. INTRODUCTION 7
1.1. SVAN 979 as a Sound Level Meter & Analyser 8
1.2. SVAN 979 as a Vibration Level Meter & Analyser 8
1.3. General features of SVAN 979 8
1.4. Accessories included 8
1.5. Accessories available 9
1.6. Firmware options available 9
2. MANUAL CONTROL OF THE INSTRUMENT 10
2.1 Control push-buttons on the front panel 10
2.2 Input and output sockets of the instrument 13
3. SETTING THE INSTRUMENT 14
3.1. Basis of the instrument’s control 14
3.2. Powering of the instrument 16
3.3. Starting the instrument 17
3.4. Initial Setup of the instrument 19
3.5. Description of icons 19
3.6. Memory organisation and saving files 21
4. FUNCTIONS OF THE INSTRUMENT – Function 24
4.1. Selecting the mode of the instrument – Mode 24
4.2. Measurement functions of the instrument – Measurement Function 24
4.3. Instrument’s calibration – Calibration 25
4.3.1. In-situ System Check 26
4.3.2. Calibration by Sensitivity in case of Acoustic signal 26
4.3.3. Calibration by Sensitivity in case of Vibration signal 27
4.3.4. Calibration By Measurement in case of acoustic signal 28
4.3.5. Calibration By Measurement in case of vibration signal 29
4.3.6. History of the calibrations - Last Calibration 29
4.3.7. Clear calibration records - Clear Calibr. History 30
4.3.8. Automatic calibration – Auto Calibration 30
5. MEASUREMENT PARAMETERS SETTING – Measurement 31
5.1 Selection of measurement parameters - General Settings 31
5.2 Measurement Trigger parameters selection – Measurement Trigger 34
5.3 Setting parameters in a profile – Profiles 35
5.4 Setting the data logging functionality – Logging 36
5.4.1 Data logger programming – Logger Setup 36
5.4.2 Results selection – Logger Results 38
5.4.3 Selection of the summary results to be saved in the logger file – Summary Results 38
5.4.4 Logger trigger parameters setup – Logger Trigger 39
5.4.5 The marker setup – Marker Setup 40
Page 4

SVAN 979 USER'S MANUAL_______________________________________________ _4
5.4.6 Wave recording setup – Wave Recording 41
5.5 Selection the 1/1 Octave - 1/12 Octave spectrum parameters – Spectrum 42
5.6 Selection of the microphone compensation filters – Compensation Filter 42
5.7 Measurement range setting – Range 43
5.8 Exposure time setting - Exposure Time 43
5.9 Setting ten statistical levels - Statistical Levels 43
5.10 Programming the instrument’s internal timer – Timer 44
5.11 Description of an exemple timer function 45
5.12 Alarm function - Alarms 46
6. DATA AVAILABLE ON THE DISPLAY – Display 47
6.1 Selection of the modes of measurement results presentation - Display Modes 47
6.2 Setting scale and grid of the plot - Display Scale 55
6.3 Setting the parameters of the logger files presentation - Logger View 56
6.4 Setting the display brightness and power saver- Screen 57
6.5 Setting the colour theme of the display – Themes 57
7. SAVING THE MEASUREMENT RESULTS – File 59
7.1 Manual saving of Summary Results 59
7.2 Managing files saved in the external memory – File Manager 60
7.2.1 Setting the directory for saving files – Set Working Directory 61
7.2.2 Creating new catalogue and new file 62
7.2.3 Deleting all files from Internal memory – Delete All 62
7.2.4 Opening file/catalogue – Open 62
7.2.5 Copying file/catalogue – Copy 63
7.2.6 Moving file/catalogue – Move 63
7.2.7 Renaming file/catalogue – Rename 63
7.2.8 Information about file/catalogue – Info 64
7.2.9 Deleting file/catalogue – Delete 64
7.3 Managing the setup files – Setup Manager 64
7.3.1 Saving the setup files 64
7.3.2 Operations on the setup files 65
8. SETTINGS THE INSTRUMENT PARAMETERS – Instrument 66
8.1. Measurement auto start - Auto Start 66
8.2. Checking the state of the internal battery – Battery 67
8.3. Bluetooth® activation – Bluetooth 67
8.4. Selection of the active port - Communication Ports 67
8.5. Setting the external power parameters - External Power 68
8.6. Setting the GPS parameters – GPS 68
8.7. Selection of the IEPE current supply - IEPE Current 69
8.8. Selection of keyboard modes – Keyboard Settings 69
8.9. Checking the modem status – Modem Status 70
8.10. Setting parameters of the I/O port - Multifunction I/O 70
Page 5

SVAN 979 USER'S MANUAL_______________________________________________ _5
8.11. Setting the microphone polarisation voltage – Polarisation Voltage 72
8.12. Remote control mode configuration – Remote Control Mode 72
8.13. Setting the parameters of the serial interface - RS232 72
8.14. Programming the instrument’s internal Real Time Clock – RTC 73
8.15. Checking the instrument's vibration – Self Vibration 73
8.16. Signal generator activation – Signal Generator 74
8.17. Parameters of remote communication - Wireless Transfer 74
8.17.1. Selection of the network type – Network 74
8.17.2. Selection of the data transfer type - Data 74
8.17.3. Configuration of modem basic settings – Modem 75
8.17.4. Setting of support modem options - Modem Connection 76
8.17.5. Configuration of SMS service - SMS Option 77
8.17.6. Configuration of e-mail service - E-mail 77
8.17.7. Data transfer with the Modbus protocol – Modbus 78
8.18. Checking specification of the instrument - Unit Label 79
9. AUXILIARY SETTINGS – Auxiliary Setup 80
9.1. Setting the language of the user interface – Language 80
9.2. Return to the factory settings – Factory Settings 80
9.3. Reference signal in vibration measurements - Reference Levels 81
9.4. RPM measurement setting – RPM Measurement 81
9.5. Setting the coefficients of the user filters - User Filters 82
9.5.1 Introduction the parameters of real time filters - Real Time Filters 82
9.6. Selection of the units for vibration measurements - Vibration Units 83
9.7. Warnings setup – Warnings 83
10. REPORTS PRINTING – Report 85
10.1. Printing the measurement results - Print Results 86
10.2. Printing the statistics of sound measurement results - Print Statistics 87
10.3. Printing the coefficients of the user filters - Print User Filters 87
10.4. Selection the printing options – Options 87
11. 1/1, 1/3, 1/6 AND 1/12 OCTAVE ANALYSER 89
11.1. Selection of 1/1 Octave - 1/12 Octave analysis mode 89
11.2. Selecting the parameters of 1/1 Octave - 1/12 Octave analysis 89
11.3. Measurement range selection - Range 90
11.4. Pre-weighting filter and frequency band selection - Spectrum 90
11.5. Saving of 1/1 Octave - 1/12 Octave analysis results - Logger Results 91
11.6. Selecting the result for triggerring recording of 1/x Octave - Logger Trigger 91
11.7. Display options in 1/1 Octave - 1/12 Octave analysis mode 91
11.8. Presentation of 1/1 Octave - 1/12 Octave analysis results 92
11.9. Setting the scale of spectrum presentation - Scale 93
11.10. Setting the parameters of the spectrum presentation - Spectrum View 94
Page 6

SVAN 979 USER'S MANUAL_______________________________________________ _6
11.11. Selection of the Spectrum Type in the Vibration modes - Spectrum Type 95
11.12. Setting filter coefficients for 1/1 Octave - 1/12 Octave analysis - Spectrum Based Filter 96
11.13. Setting the parameter for spectrum comparison – Spectrum Compare 97
12. FFT ANALYSER 100
12.1. Selection of FFT analysis mode 100
12.2. Selecting the parameters of FFT analysis 100
12.3. Measurement range selection - Range 100
12.4. Setting the parameters of FFT analysis - FFT 101
12.5. Saving of FFT analysis results - Logger Results 101
12.6. Display options in FFT analysis mode 102
12.7. Presentation of FFT analysis results 102
12.8. Setting the scale of spectrum presentation - Scale 103
12.9. Setting the parameters of the spectrum presentation - Spectrum View 104
12.10. Selection of the Spectrum Type in Vibration mode - Spectrum Type 105
12.11. Setting the parameter for spectrum comparison – Spectrum Compare 105
13. RT 60 MEASUREMENT OF THE REVERBERATION TIME 106
13.1. Selection of RT 60 function 106
13.2. Setting the RT60 parameters 106
13.3. Setting the result display mode 108
13.4. Start RT60 measurements 109
13.5. Visualization of the RT 60 measurements results 110
14. TONE MEASUREMENT - Tonality 114
14.1. Selection of Tonality function 114
14.2. Setting the parameters of the Tonality function 114
14.3. Start Tonality measurements 115
14.4. Visualization of the Tonality measurements results 115
15. LOUDNESS MEASUREMENT - Loudness 116
15.1. Selection of Loudness function 116
15.2. Visualization of the Loudness measurements results 116
APPENDIXES
A. REMOTE CONTROL
B. DATA FILE STRUCTURES
C. TECHNICAL SPECIFICATIONS
D. DEFINITIONS AND FORMULAE OF MEASURED VALUES
I. OBJECTIVE METHOD FOR ASSESSING THE AUDIBILITY OF TONES IN NOISE -
REFERENCE METHOD
H. REVERBERATION TIME
Page 7
SVAN 979 USER'S MANUAL_______________________________________________ _7
1. INTRODUCTION
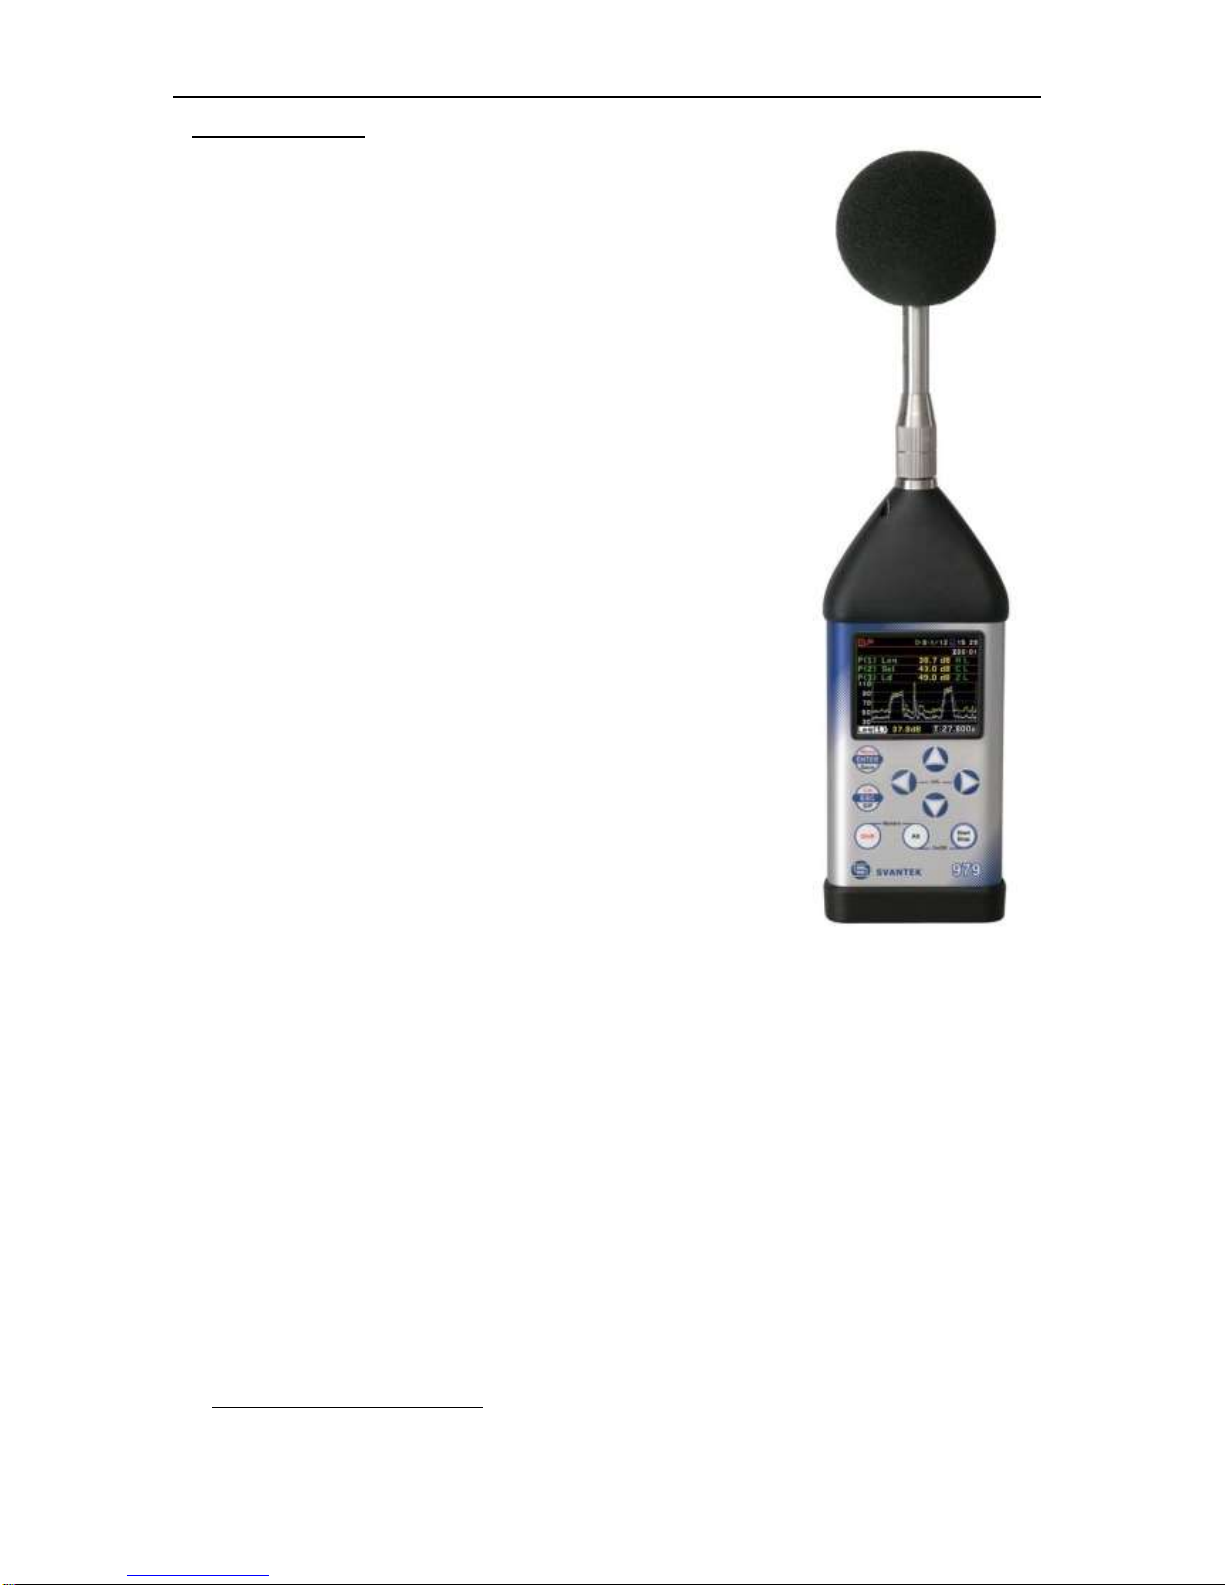
The SVAN 979 is all digital, Class 1 Sound & Vibration level meter (SLM
and VLM) as well as a real time 1/1, 1/3 octave analyser. The instrument
is designed for general acoustic and vibration measurements,
environmental monitoring, occupational health and safety monitoring.
Three acoustic or vibration user configurable profiles allow parallel
measurements with independently defined frequency filters and RMS
detector time constants. Each profile provides a significant number of
results (like Spl, Leq, SEL, Lden, LEPd, Ltm3, Ltm5, LN%, LR15,
LR60, Ovl, Peak, Max, Min in case of sound measurements or RMS,
Ovl, Peak, P-P, MTVV in case of vibration measurements). Advanced
time history logging for each profile provides complete information about
the measured signal using the external SD-card or USB Memory Stick
and can be easily downloaded to any WindowsTM PC using the USB
interface and SvanPC++ software.
All required frequency weighting filters (e.g.: A, B, C, G, Z in case of
sound measurements are available with this instrument. General
vibration measurements (acceleration, velocity and displacement) are
also available.
Standard version of SVAN 979 is equipped with 1/1 and 1/3 octave realtime analysis as well as FFT. In the sound level meter mode the statistic
analysis in 1/1 or 1/3 octaves is also available. Frequency analysis is an
essential tool for sound & vibration engineers. Depending on an
application it can be more or less detailed. For advanced applications that
require the narrow band frequency analysis, SVAN 979 offers options of
the 1/6* or 1/12* octave real-time analysis.
The frequency analysis is a critical tool in building acoustics
measurements. Depending on the application, frequency analysis can be
done in 1/1 octave or 1/3 octave spectra. SVAN 979 records the time
history of spectra with milliseconds logging step. It enables one to
calculate RT60 results as well as sound insulation results. Additionally
SVAN 979 offers the functionality of a signal generator which is capable
of generating pink noise, white noise or a selected sine wave. The signal
generator works together with the RT 60 function which is calculated in
1/1 or 1/3 octave bands.
Another feature of SVAN 979 is a time signal recording, which stands for a recording of the raw signal
samples with defined frequency up to 48 kHz. Analysis of the raw signal is used whenever frequency
analysis is not sufficient. Postprocessing of wave files such as calculation of tonality is available in
SvanPC++ program. Time signal is recorded in a wave format which means that it can be played back in
the PC software and used for noise source recognition (audio recording).
A fast USB 1.1 interface (12 MHz) creates a real time link for the PC "front-end" application using the
SVAN 979. The USB Host functionality is also available. The USB Host controller installed in the instrument
enables the user to connect this meter to USB memory sticks, USB hard disks, USB printers etc. With the
use of optional interfaces (RS 232, Bluetooth
®
1
or IrDA) the instrument can be remotely controlled from the
PC or smartphone. Measurement results can be downloaded to the PC using all the interfaces mentioned
above.
Working as a part of SV 279 PRO monitoring station, equipped with 3G modem, SVAN 979 can transfer
measured data via Internet to the PC with the use of SvanPC++_RC option or via SvanNET Web service.
The instrument can be fully remotely controlled via these interfaces. The instrument has extended alarms
features, that enables the user notification about exceeded threshold levels by SMS or mails.
1
“The Bluetooth® word mark and logos are registered trademarks owned by Bluetooth SIG, Inc. and any use of such marks by
SVANTEK is under license. Other trademarks and trade names are those of their respective owners.
Page 8

SVAN 979 USER'S MANUAL_______________________________________________ _8
The instrument is powered from four AA standard alkaline or rechargeable batteries (i.e. NiMH - separate
charger is required). Powering the instrument from an External DC power source or the USB interface is
also possible. A robust and lightweight design enhances the exceptional features of this new generation of
sound and vibration measurement instrument.
1.1. SVAN 979 as a Sound Level Meter & Analyser
• noise measurements (Spl, Lmax, Lmin, Lpeak, Leq, Sel, Lden, LEPd, Ltm3, Ltm5 and 10 x LN%
statistics) with Class 1 IEC 61672:2013 accuracy in the frequency range 3.15 Hz ÷ 20 kHz with
GRAS 40AE microphone
• parallel Impulse, Fast and Slow detectors for the measurements with A, B, C, G, Z frequency filters
• two measurement ranges 22 dB RMS(A) ÷ 123 dB Peak (Low) and 30 dB RMS(A) ÷ 140 dB Peak
(High)
• 1/1 Octave (15 filters with centre frequencies 1 Hz ÷16 kHz, Type 1 – IEC 1260), 1/3 Octave (45
filters with centre frequencies 0.8 Hz ÷ 20 kHz), 1/6 Octave (90 filters with centre frequencies 0.73 Hz
÷ 21.4 kHz) and 1/12 Octave (180 filters with centre frequencies 0.71 Hz ÷ 22 kHz) real time analysis
- all with Type 1 – IEC 1260 filters.
1.2. SVAN 979 as a Vibration Level Meter & Analyser
• General Vibration measurements (acceleration, velocity and displacement) meeting ISO 8041:2005
standard in the frequency range depending on the parameters of the attached accelerometer, i.e. with
SV80 general purpose transducer is equal to 1Hz ÷ 5 kHz
• parallel RMS, VDV, MTVV or Max, Peak, Peak–Peak measurements
• Z, HP1, HP3, HP10, Vel1, Vel3, Vel10, VelMF, Dil1, Dil3, Dil10, Wh weighting filters
• 1/1 Octave (15 filters with centre frequencies 1 Hz ÷16 kHz, Type 1 – IEC 1260), 1/3 Octave (45
filters with centre frequencies 0.8 Hz ÷ 20 kHz), 1/6 Octave (90 filters with centre frequencies 0.73 Hz
÷ 21.4 kHz) and 1/12 Octave (180 filters with centre frequencies 0.71 Hz ÷ 22 kHz) real time analysis
-with all Type 1 – IEC 61260 filters.
1.3. General features of SVAN 979
• Advanced Data Logger including spectrum logging on the micro SD-card or USB Memory Stick
providing almost unlimited logging capacity
• Time domain waveform signal recording
• Advanced trigger and alarm functions
• USB 1.1 Host & Client interface (real time PC "front end" application supported)
• RS 232 (as option) and Bluetooth® (as standard) interface
• Integration time programmable up to 24 h
• Power supply by four AA rechargeable or standard alkaline batteries
• Hand held, light weight and robust case
• Easy to use with menu driven user interface
1.4. Accessories included
• GRAS 40AE - prepolarised ½” free field microphone with nominal sensitivity 50 mV/Pa
• SV 17 - microphone preamplifier 7 pin Lemo connector
• SA 22 – foam windscreen
• SC 16 - USB 1.1 cable
• SC 59 - I/O cable
• SA 33 power supply
• SA 31 charger for rechargeable batteries
• SA 60 microSD card 8 GB
• SA 143 carrying case for SVAN 979/977 instrument and accessories
Page 9
SVAN 979 USER'S MANUAL_______________________________________________ _9
• four AA alkaline batteries
• SvanPC++ - download and viewing software
1.5. Accessories available
• SA 17A - external battery pack using 6 x AA batteries
• SA 47 - carrying bag for the SVAN 97x/95x and accessories (fabric material)
• SA 79 - carrying case for the SVAN 97x/95x and accessories (waterproof)
• SA 279 – outdoor protection kit for the SVAN 979 microphone (microphone, desiccator and cable
• not included)
• SV 55 - RS 232 option for the SVAN 979/977
• SV 80 – Accelerometer 100 mV/g, TNC top connector, 10-32 mounting hole
• SC 18T – Lemo 7pin to TNC integrated connector
• SC 27 – TNC (plug) to TNC (plug) coil cable (2 meters).
1.6. Firmware options available
SVAN979 - SVAN 979 including 1/1 and 1/3 octave analysis, FFT analysis, RT60, Time Domain Signal
recording, signal recording, SvanMobile Android application
• SV 979_6 – Tonality analysis option for SVAN 979
• SV 979_7 – Loudness analysis option for SVAN 979
• SV 979_8 – Rotation measurement option without RPM tachometer
• SV 979_16 – User programmable second order band pass filters*
• SV 979_23 – 1/6 and 1/12 analysis option for SVAN 979
Notice: The firmware options for the instrument can be purchased at any time as only the
introduction of a special unlock code is required for their activation in a specific instrument.
Contact your local Svantek distributor for further information and costs for these options.
Page 10
SVAN 979 USER'S MANUAL_______________________________________________ _10
2. MANUAL CONTROL OF THE INSTRUMENT
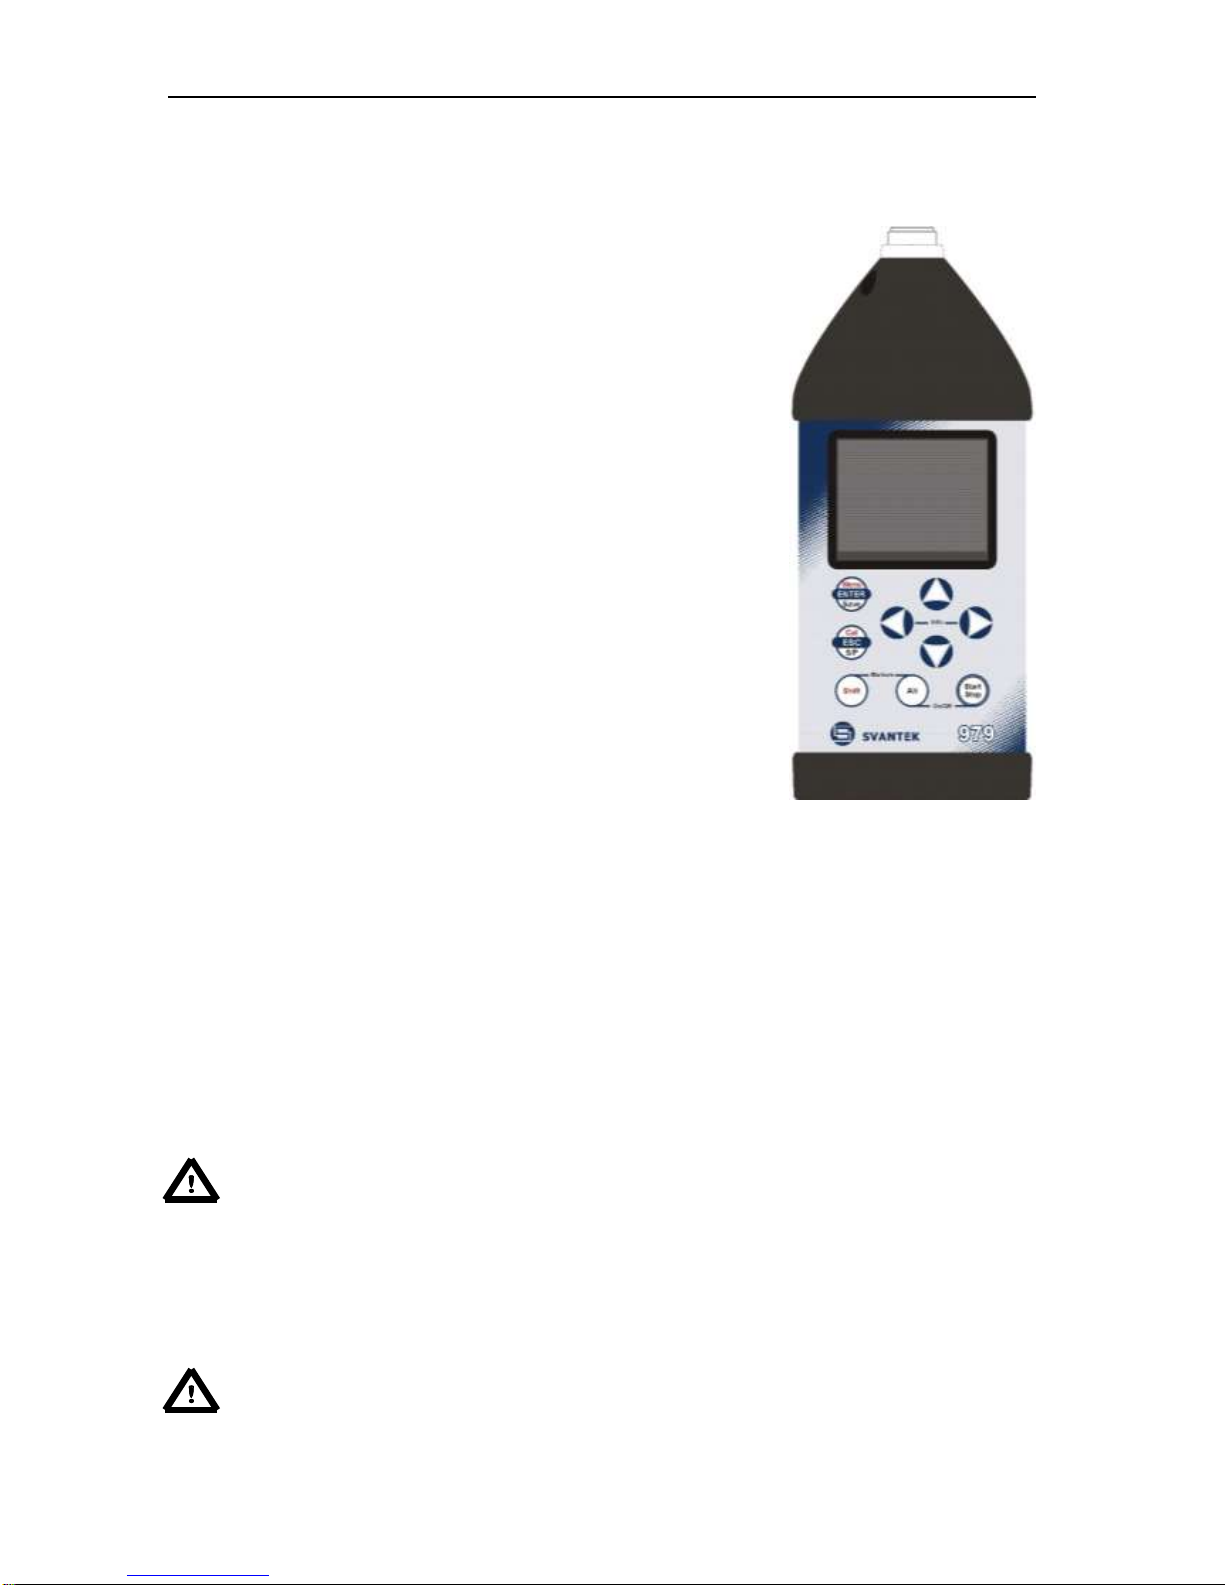
Control of the instrument has been developed in a fully interactive manner. The user can operate the
instrument by selecting the appropriate position from the selected Menu list. Thanks to that, the number of
push-buttons for control of the instrument has been reduced to nine for ease of use and convenience.
2.1 Control push-buttons on the front panel
The following control push-buttons are located on the front panel of the
instrument:
• <ENTER>, (<Menu>), [<Save>],
• <ESC>, (<Cal.>), [<S/P>],
• <Shift>, [Markers]
• <Alt>, [Markers]
• <>,
• <>,
• <>,
• <>,
• <Start/Stop>.
The name given in (...) brackets denotes the second push-button function
which is available after pressing it in conjunction (or in sequence) with the
<Shift> push-button. For the first two push-buttons the name given in
square brackets […] denotes also the third push-button function which is
available after pressing it in conjunction (or in sequence) with the <Alt>
push-button.
<Shift>
The second function of a push-button (written in red colour on a push-button) can be used
when the <Shift> push-button is pressed. This push-button can be used in two different ways:
• as Shift like with a computer keyboard (e.g. while typing the filename); both <Shift>
and the second push-button must be pressed together (two finger operation);
• as 2nd Fun; this push-button can be pressed and released before pressing the
second one or pressed in parallel (while operating in “2nd Fun” mode, see the
following notice) with the second push-button (one finger operation).
The <Shift> push-button pressed in conjunction with <Alt> enables the user to activate the
Markers on the plots during the measurement.
<Alt>
This push-button enables the user to choose the third push-button function in case of [<Save>]
and [<Pause>] push-buttons. In order to select the third function the user must press the <Alt>
and the second push-button simultaneously.
Notice: Simultaneously pressing the <Alt> and <Start/Stop> push-buttons switches the
instrument on or off.
<Start/Stop
>
This push-button enables the user to start the measurement process, when the instrument is
not measuring or to stop it, when the instrument is in course of the measurement. It is also
possible to set the mode of this push-button such that in order to start or stop the
measurements the user has to press it simultaneously with the <Shift> push-button. This can
prevent accidentally starting or stopping a measurement at the wrong time by just brushing
against the Start/Stop button on its own.
Notice: Changing the <Start/Stop> push-button mode is performed in the
Keyboard Settings window of the Instrument list (see description of the Instrument list).
Page 11

SVAN 979 USER'S MANUAL_______________________________________________ _11
<ENTER>
This push-button enables the user to enter the selected position shown on the screen Menu
list or to confirm selected settings. Some additional functions of this push-button will be
described in the following chapters of this manual.
(<Menu>)
This push-button (pressed together with <Shift>) enables the user to enter the main list
containing seven sub-lists: Function, Measurement, Display, File, Instrument,
Auxiliary Setup and Report. Each of the above mentioned menu lists consists of sub-lists,
elements and data windows. These main sub-lists will be described in detail in the following
chapters of the manual. Double pressing the <Menu> push-button enters a list containing the
last eight opened sub-lists. It often speeds up the control of the instrument as the user has
faster access to the most frequently used sub-lists for easy navigation.
[<Save>]
This push-button (pressed together with <Alt>) enables the user to save measurement results
as a file in the instrument’s internal memory or on the SD-card or USB memory stick. There
are two available functions: Save Next - save a file with the name increased by one (e.g.
02JAN0, 02JAN1, 02JAN3) and Save - save a file with the edited name.
<ESC>
This push-button closes the control lists, sub-lists or windows. It acts in an opposite way to the
<ENTER> push-button. When the window is closed after pressing the <ESC> push-button,
any changes made in it are ignored in almost all cases.
(<Cal.>)
This push-button (pressed together with <Shift>) opens the Calibration sub-list.
[<S/P>]
This push-button enables the user to pause or break the measurement process temporarily. If
there is no current running measurement in progress this push-button opens the Setup
Manager menu.
<>, <>
These push-buttons enable the user specifically to:
• select the column in a multi column parameter list;
• select the parameters value in an active position (e.g. filter Z, A, B or C, Integration period:
1s, 2s, 3s … etc.);
• control the cursor in Spectrum, Logger and Statistics modes of result’s presentation;
• select the position of the character in the text editing screen;
• activate markers 2 and 3
• speed up changing the numerical values of the parameters when pressed and held.
(<>, <>)
The <>, <> push-buttons pressed in conjunction (or in sequence) with <Shift> enable the
user specifically to:
• change the parameters value with double step (e.g. Start Delay period: form 1s to 11s, 21s
… etc.);
• to shift cursor from the first to the last position and back on the graphical presentation mode
(except 1/6 and 1/12 octave spectrum presentation);
• zoom in or zoom out in the 1/6 and 1/12 octave spectrum presentation modes.
[<>, <>]
The <>, <> push-buttons pressed in conjunction (or in sequence) with <Alt> enable the
user specifically to:
• select the parameters value in an active position in the matrix parameter list;
• select the parameters value in an active position (e.g. filter Z, A, B or C, Start Delay period:
1s, 2s, 3s … etc.);
• insert or delete a character in the text edition screen.
<>, <>
The <>, <> push-buttons enable the user specifically to:
• select lines in the list;
• select the correct character from the list in the text edition screen;
• activate markers 1 and 4
(<>, <>)
The <>, <> push-buttons pressed in conjunction (or in sequence) with <Shift> enable the
user specifically to:
• shift the cursor from the first to the last position and back on the menu list;
• change the relationship between the Y-axis and X-axis of all plots presented on the screen.
Page 12
SVAN 979 USER'S MANUAL_______________________________________________ _12
[<>, <>]
The <>, <> push-buttons pressed in conjunction (or in sequence) with <Alt> enable the
user specifically to:
• change the mode of result presentation;
• programme the Real Time Clock (RTC) and Timer.
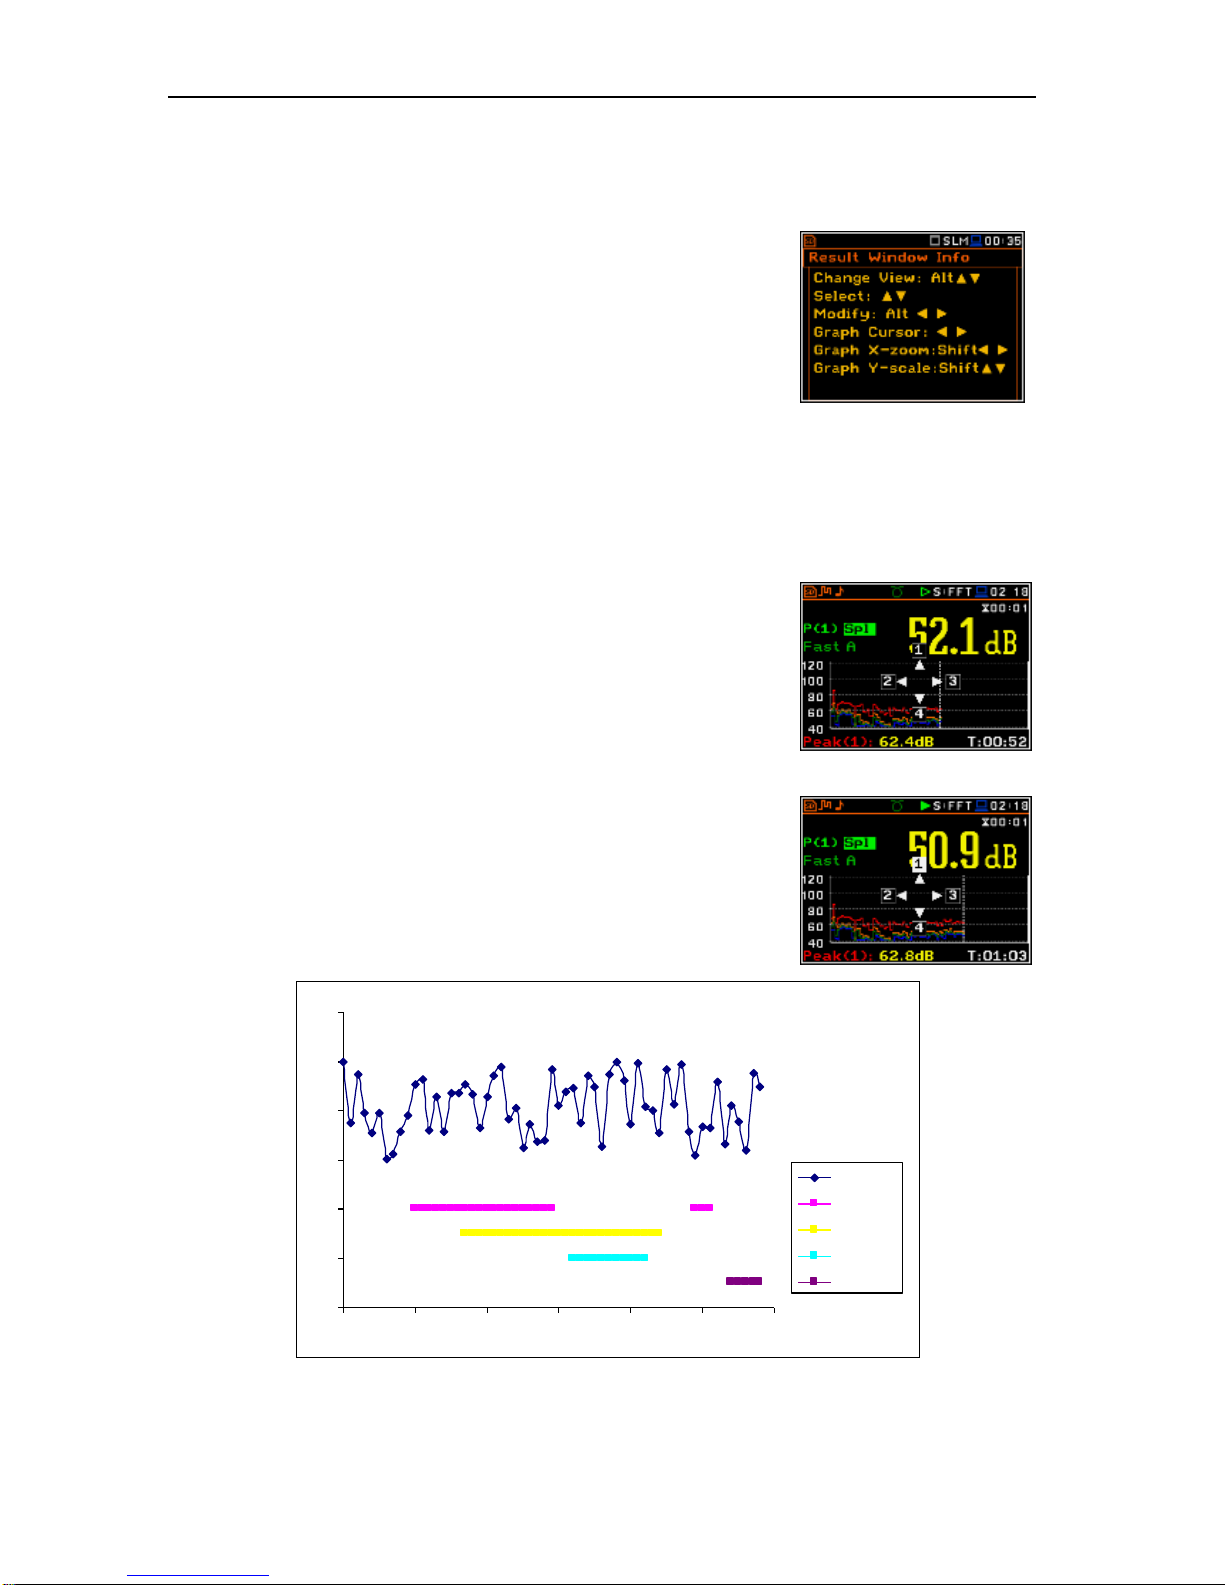
[Info]
The <Info> push-button (simultaneous pressing the <>,
<> push-buttons) opens the window with the help
information in the measurement display modes. Press
<ESC> or <ENTER> to exit the Info screen.
[Markers]
The Markers enable the user to mark special events, which occurred during the performed
measurements (i.e. the airplane flight, the dog barking, the train’s drive etc.). In order to
activate the markers the logger has to be switched on (path: <Menu> / Measurement / Logging
/ Logger Setup) and one or more logger results (Peak, Max, Min, Leq for sound
measurements or Peak, P–P, Max, RMS for Vibration measurements) in profiles have to be
activated (path: <Menu> / Measurement / Logging / Logger Results).
In order to enter the marker mode the user must press <Shift> and <Alt>
push-buttons simultaneously during the measurement. Then four
available markers appear on the screen. To choose marker number 1 the
user must press <> push button (number 2 - <>, number - 3 <>
and number 4 - <>).
The markers disappear automatically and the chosen marker is activated
(after pressing <Shift> + <Alt> again active marker number will be
highlighted). In order to switch off the marker, the user has to press
<Shift> + <Alt> and press the arrow push-button, which refers to the
marker to be switched off.
The current state of the markers is indicated in the logger file (cf. App. B
for details) and can be used to show them with the help of the dedicated
presentation software.
An example presentation of the markers on the time history plot is shown
below (to view a plot with markers the user has to transfer data to the
appropriate software such as SvanPC++).
<Shift> / <Alt>
<>
20
30
40
50
60
70
80
13:30:00 13:30:09 13:30:17 13:30:26 13:30:35 13:30:43 13:30:52
Leq
Marker 1
Marker 2
Marker 3
Marker 4
Page 13
SVAN 979 USER'S MANUAL_______________________________________________ _13
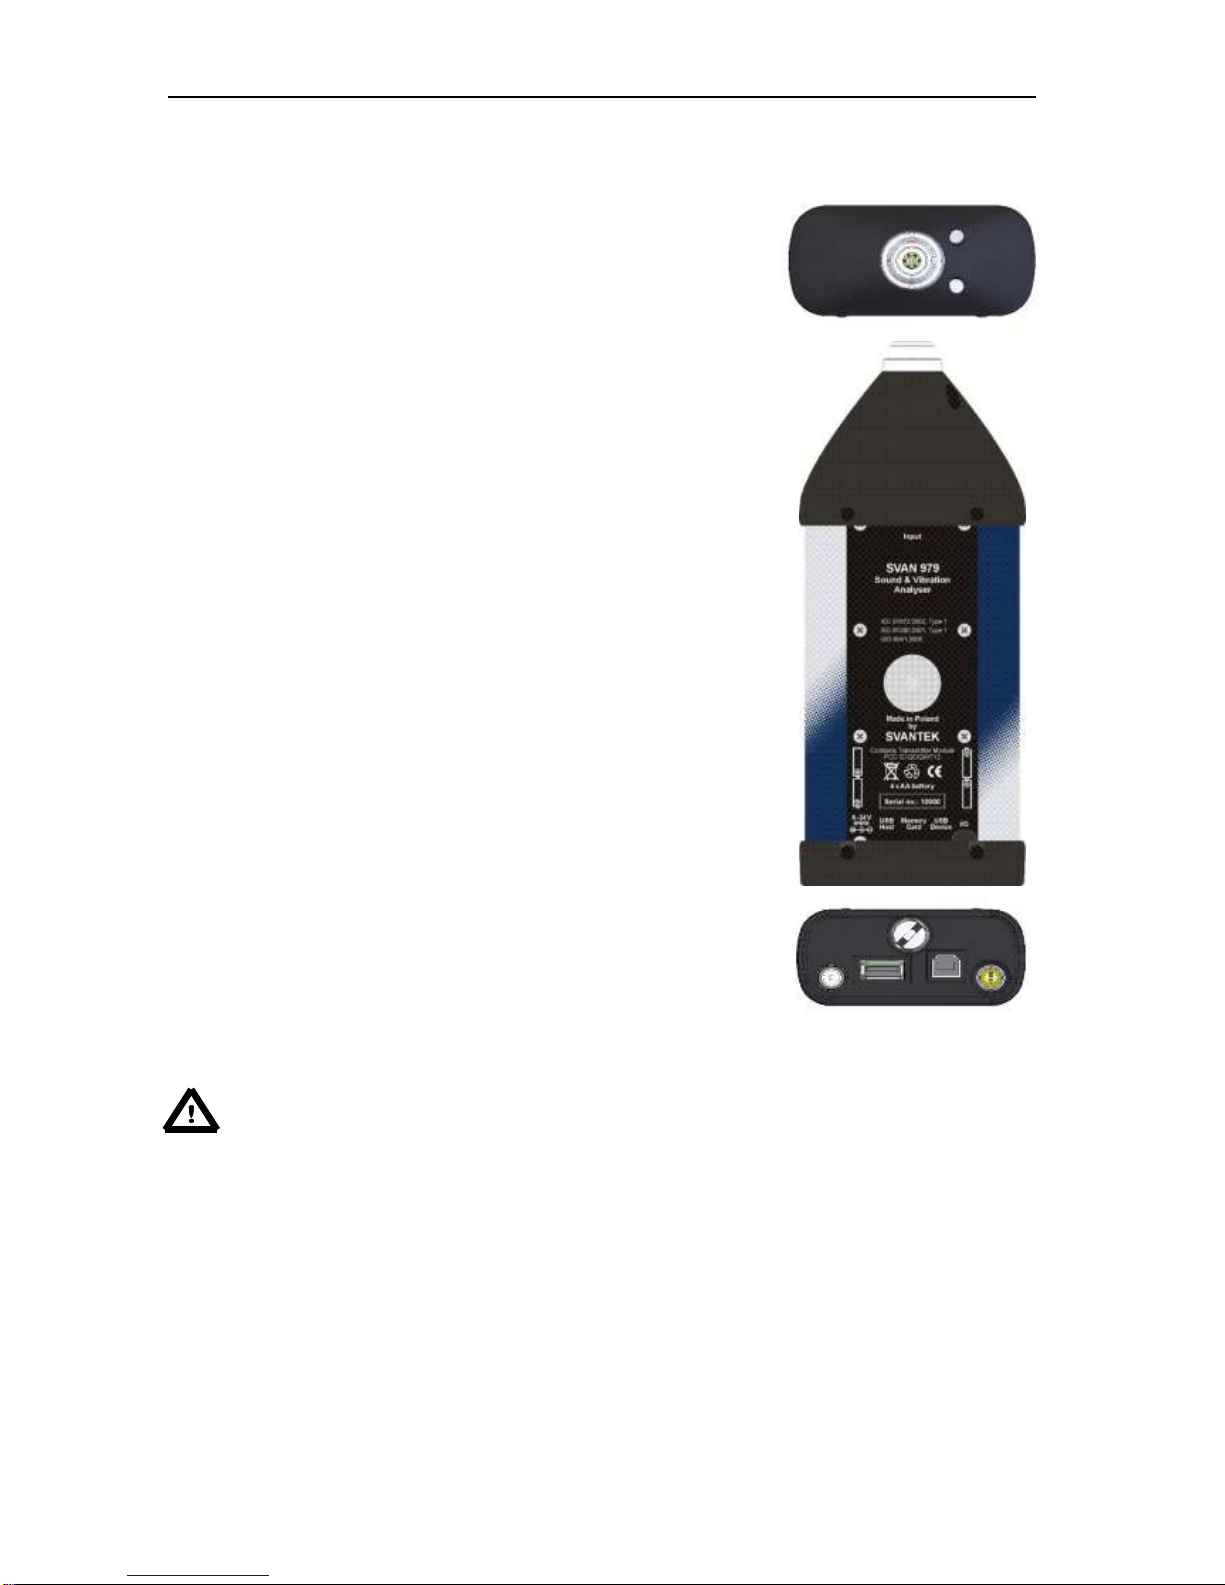
2.2 Input and output sockets of the instrument
Top cover of the instrument
The measurement input is placed in the centre of the instrument’s top
cover. It is the Lemo-7 compatible socket. The SV 17 microphone
preamplifier has a specially designed matching plug and a locking screw
to secure the preamplifier to the meter body. The accelerometers have to
be connected to the instrument also using the Lemo-7 connector. After
connecting the preamplifier or the accelerometer cable to the
measurement input, the screw should be tightened to light resistance
only. Do not over tighten this connector. It is not necessary to remove this
preamplifier from the top of the instrument unless the meter is in a
calibration laboratory as it is always used close coupled to the meter
body. The full description of the signals connected to the sockets is given
in Appendix C.
Bottom cover of the instrument
In the bottom cover there are four sockets, placed from the right to the
left as follows: Ext. 6-24Vdc, USB Host, USB Device and I/O.
There is a micro SD memory-card socket under the bottom cover of the
instrument and spaces for the 4 x AA batteries.
The USB Device 1.1 interface is the serial interface working with 12 MHz
clock. Thanks to its speed, it is widely used in all PC. In the instrument,
the standard 4-pin socket is used and described in detail in Appendix C.
The USB Host 1.1 interface can be used to connect an external USB
Memory Stick or USB hard disk, enabling the device to register virtually
infinite sequence of measurement results.
The additional multi-purpose input / output socket, called I/O, is a two-pin
LEMO socket. On this socket, in the case when the Analogue Output
functionality is selected, the signal from the input of the analogue / digital
converter (before any frequency correction) is available. This signal can
be recorded using magnetic recorder or observed on the oscilloscope.
The Digital Input is another functionality that serves as the external trigger
to the instrument, while the Digital Output is used to generate the trigger
pulse or alarm pulse from the instrument.
The user can connect an external DC power 6-24V adapter to the 6-24V
socket located on the bottom cover of the instrument. The current
consumption depends on the voltage of the power supplier.
Notice: Switch the power off before connecting the instrument to any other device (e.g. a
printer or a Personal Computer).
Page 14
SVAN 979 USER'S MANUAL_______________________________________________ _14
3. SETTING THE INSTRUMENT
In order to perform measurements using the instrument the user only has to plug-in the preamplifier with the
microphone already screwed on or the proper vibration transducer and to switch the power on by pressing
of the <Alt> and <Start/Stop> push-buttons at the same time. Hold both buttons down for 1 or 2 seconds
and release to switch on.
3.1. Basis of the instrument’s control
The instrument is controlled by means of nine push-buttons on the keyboard. Using these push-buttons the
user can access all available functions and change the value of all available parameters. The functions are
placed in a system of lists and sub-lists.
The instrument's menu consists of different type of windows, which include: main menu list, sub-menu list,
option list, parameter list, text editor window, information window and file manager window with file command
list.
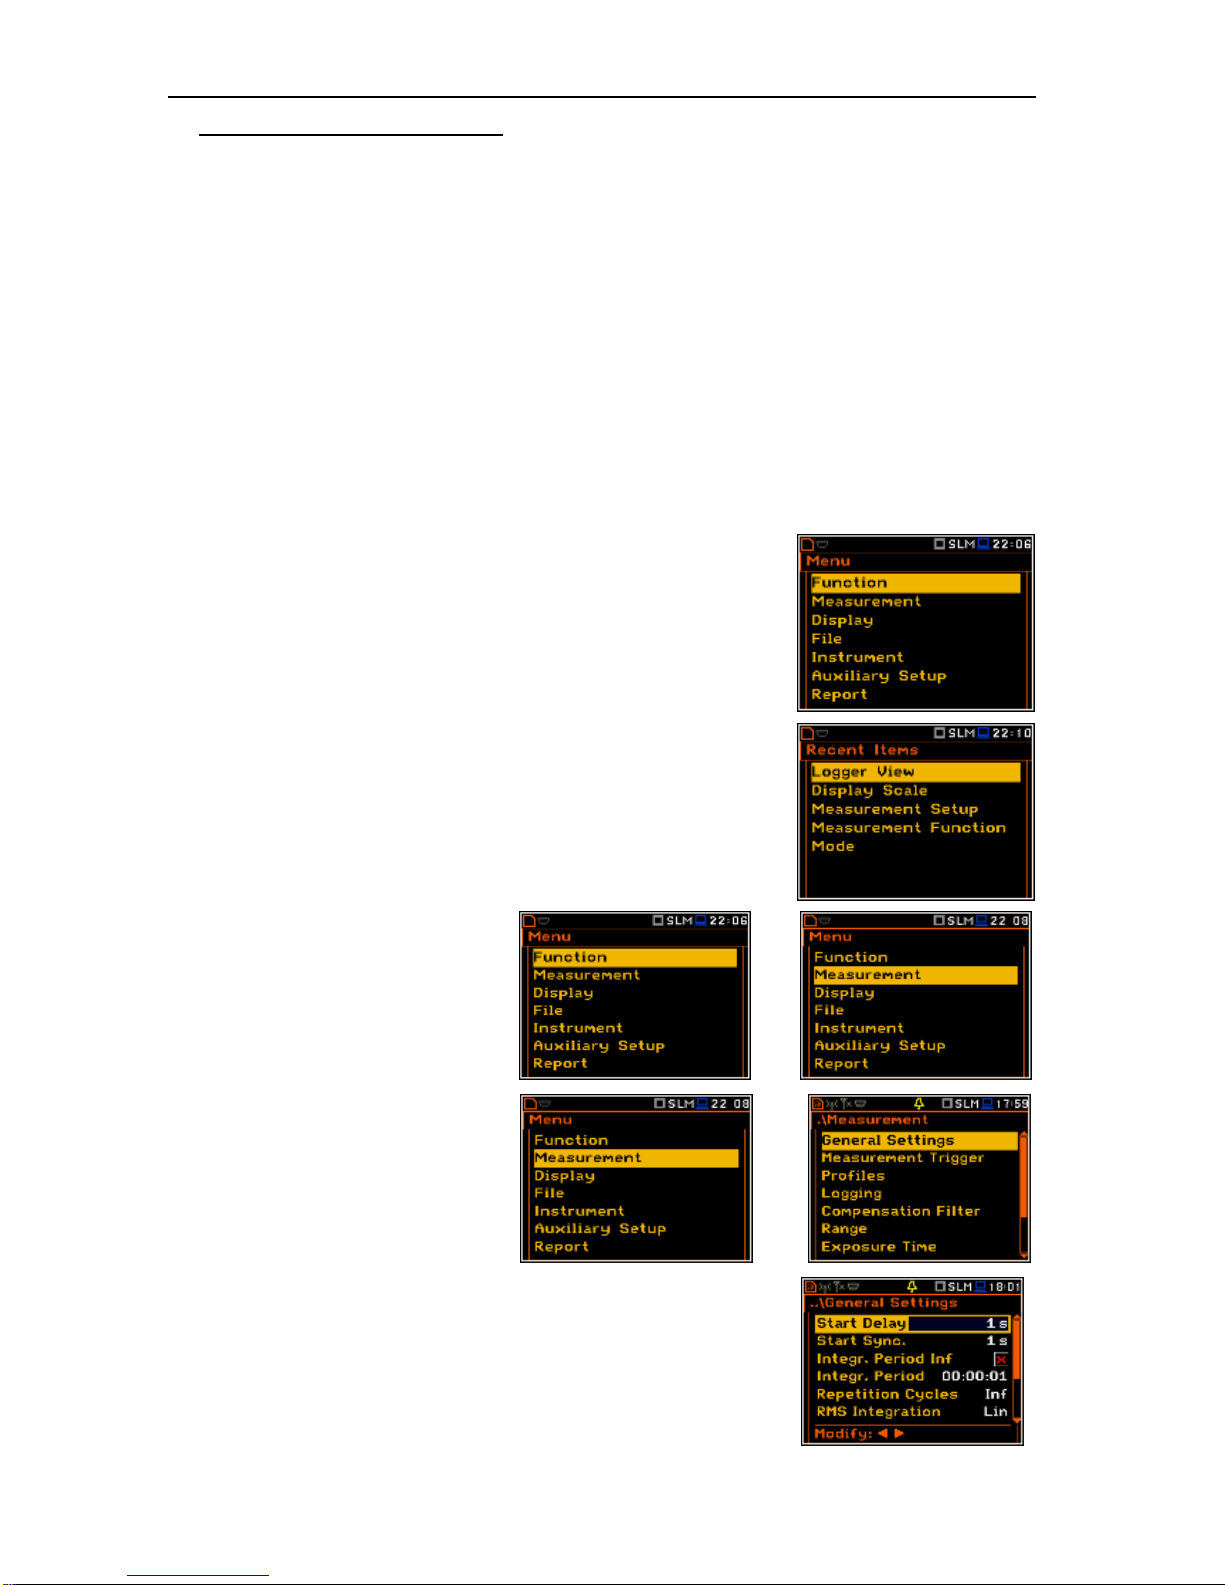
Main menu
The main list contains the headers of seven lists, which also contain sublists or positions (elements). The main list is opened after pressing the
<Menu> push-button. This list contains the following sub-lists: Function,
Measurement, Display, File, Instrument, Auxiliary Setup and Report.
Recent Items list
Double pressing the <Menu> push-button opens the list of recently
accessed menu items. This enables the user to access the most
frequently used lists quickly, without the necessity of passing through the
whole menu path.
Position selection
The desired position in menu list is
selecting using the <> or <> pushbuttons.
<>
Entering selected position
After selection of the desired position in
the menu list, the user has to press the
<ENTER> push-button in order to enter
it. After this operation a new sub-menu,
option list, parameter list or information
window appears on the display.
<ENT>
List of parameters
The parameter list contains parameters for which the user may select the
value from the available range. Pressing the <ENTER> push-button
enables the user to access the above mentioned sub-lists.
▪ The desired position in a list is accessed after pressing the <> or
<> push-button.
Page 15
SVAN 979 USER'S MANUAL_______________________________________________ _15
▪ The change of the value in a selected position is performed by the
<> or <> push-buttons (or pressed together with <Shift>).
Option list
The option list consists of different choices, from which only one may be
selected. The selection of the option is performed as follows. The user
has to highlight the desired option by means of the <> or <> pushbuttons and then press <ENTER>. This option became active and the list
is closed. When the user re-enters this list again the last selected option
will be marked.
If the parameter has a numerical value the user may keep pressing the <> or <> push-buttons (or
pressed together with <Shift>) longer than 1 second to speed up the selection. In this case the parameter
starts to change automatically until the user releases the pressed buttons.
The user may change the numerical parameter value with a larger step (usually 10, 20) by means of the
<> or <> push-buttons pressed together with <Alt>.
Matrix of parameters
When the list of parameters consists of more than one column the user
may change:
▪ column by means of <> or <>
▪ line in the same column by means of <> or <>
▪ value in a selected position by means of <> or <> with <Alt>
▪ all values in the same column by means of <> or <> with <Shift>
▪ all values in the same line by means of <> or <> with <Shift>.
Complex parameters
Some parameters like Start Hour,
Start Day etc. are complex (consisting of
more than one value field). The selection of
values for such parameters is performed in
a special window, which is opened with the
<> or <> push-buttons. In the special
window the value is selected with the f <>,
<> or <>, <> push-buttons and then
is confirmed by pressing <ENTER>.
In all cases the <ENTER> push-button is used for confirmation of the selection in a position and for closing
the opened sub-list. The sub-list is closed ignoring any changes made the list by pressing the <ESC> pushbutton and the user returns to the previous menu.
Information window
Some windows inform the user about the state of the instrument,
available memory, none existing files or loggers, standards fulfilled by the
unit, etc. In order to scroll through the list, the user has to use the <>
or <> push-button. In order to close such a window, the user has to
press <ESC>.
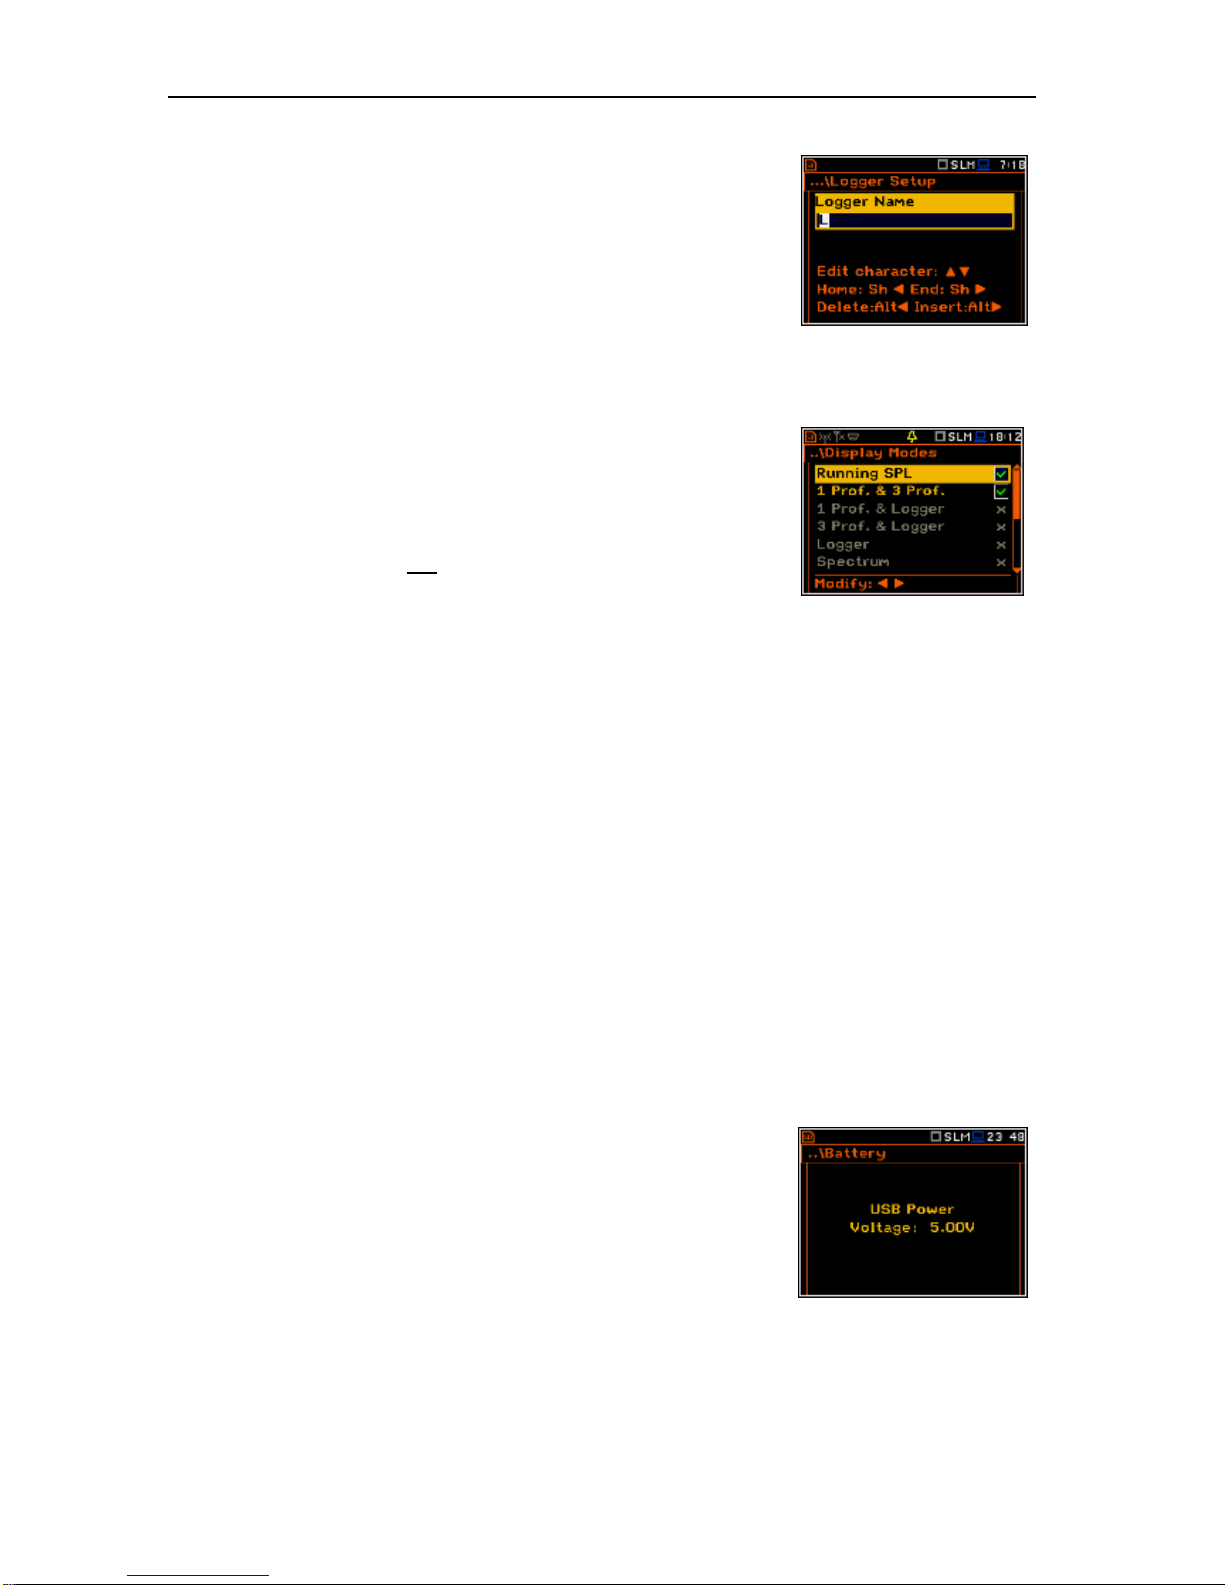
Text editing window
There are also windows, in which the user may edit some text (i.e. the
name of the file). This window contains help information to guide the user
how to edit the text. The character which is displayed inversely may be
edited.
▪ The user can select the position of the character in the edited text
using the <>, <> push-buttons.
Page 16
SVAN 979 USER'S MANUAL_______________________________________________ _16
▪ The available ASCII characters can be changed using the <> or
<> push-button. The subsequent digits, underline, upper case
letters and space appear on the display in the inversely displayed
position after each press of the above mentioned push-buttons.
▪ The user can insert or delete the position in the edited text using the
<>, <> push-buttons pressed together with <Alt>.
<>
Help information
In most windows the last line or several lines at the bottom of the screen contain help information. It informs
the user how to select or modify the parameter’s value, change the character in the text line etc.
Inactive parameters
If some functions or parameters are not available, the positions in the
menu or parameter lists linked with this function or parameter became
inactive (their colour became grey). For example, if Logger (path:
<Menu> / Measurement / Logging / Logger Setup) is switched off the
Logger presentation mode is not active!
3.2. Powering of the instrument
The SVAN 979 can be powered by one of the following sources:
• External DC power source – 6 V DC÷24 V DC (1.5 W)
• SA 17A external battery pack – operation time > 24 h (option)
• Four AA standard size internal batteries. In the case of alkaline type, a new fully charged set can
operate more than 12 h (6.0 V / 1.6 Ah). Instead of the ordinary, four AA rechargeable batteries can
be used (a separate external charger is required for charging them). In this case, using the best NiMH
type, the operation time can be increased up to 16 h (4.8 V / 2.6 Ah)
• USB interface – 500 mA HUB
For each of the three kinds of possible power source there is a different view presented in the Battery window
of the Instrument list.
When the instrument is powered from its internal batteries, the “Battery” icon is presented on the top line of
the display. When the voltage of the batteries is too low for reliable measurements, the icon is red or during
attempt to switch the instrument on the Low Battery! message occurs on the display for 2 seconds and the
instrument switches off by itself. A fully charged set of 4 batteries ensures more than 12 hours of continuous
operation of the instrument (with Dim LCD switched on). The battery condition can be checked by means of
the Battery function. It is also presented continuously on the top line of the display by means of the “Battery”
icon.
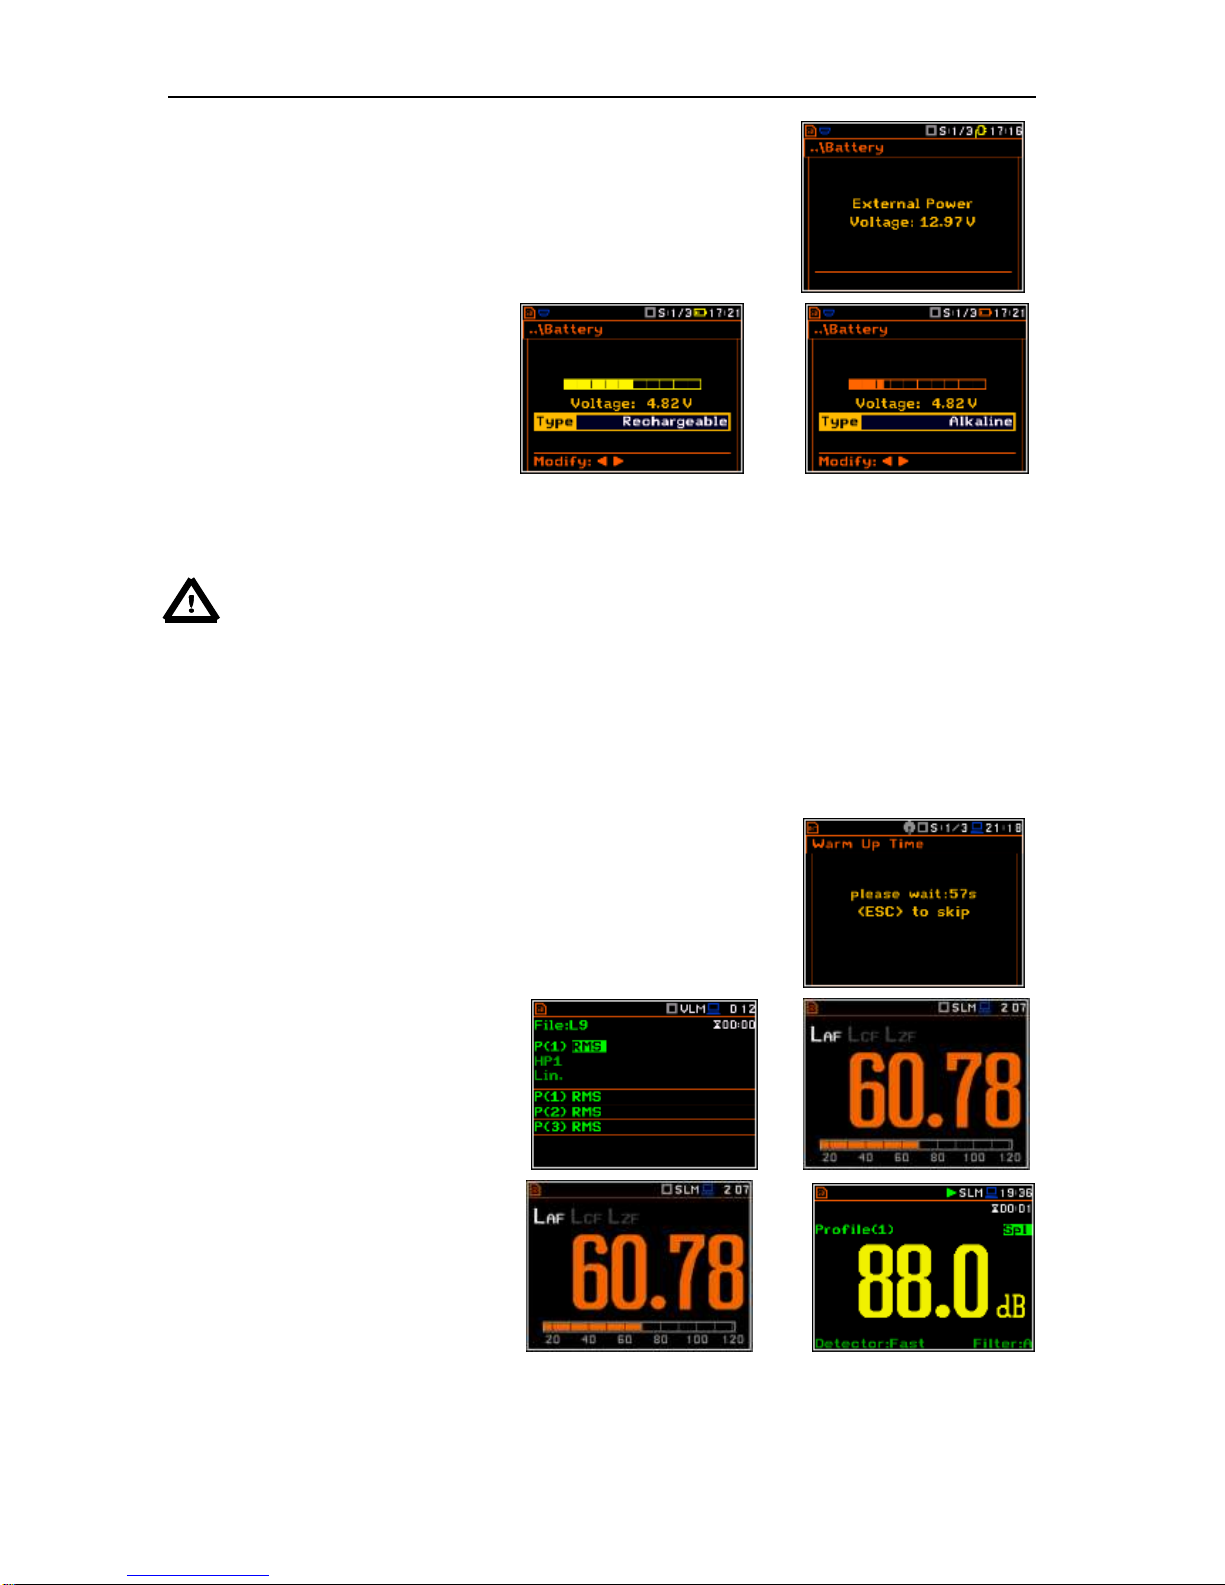
When there is a connection to the USB interface (USB Device socket is
connected by means of the cable to a PC), the “computer” icon is
presented on the top of the display and in the Battery window there is
the USB Power: Voltage: x.xxV message.
Page 17
SVAN 979 USER'S MANUAL_______________________________________________ _17
When there is a connection to the 6–24V socket, the “plug” icon is
presented on the top of the display and in the Battery window there is
the External Power: Voltage: yy.yyV message.
When the instrument is powered from
the internal batteries the “battery” icon
is presented on the top of the display
and the Battery window presents the
battery status scale and battery voltage
Voltage: x.xx. The colour of the
battery and the scale reflects the
battery capacity: green (>75%), yellow
(>25%), red (<25%).
<>
To have right indication of the battery status the user should select the battery type in the Type position:
Alkaline or Rechargeable.
Notice: In case when “Battery” icon is red, it is strongly recommended to use an external power
adapter or USB interface as soon as possible to ensure reliable operation. If no suitable external
power source is provided the instrument will be switched off automatically after a short time!
Prolonging the internal source of the instrument’s power can be achieved by reducing the brightness of the
screen when possible. The settings of Brightness and power saver function may be done in the
Screen Setup window (path: <Menu> / Display / Screen Setup).
3.3. Starting the instrument
Switching the instrument on
To switch the power on the user should press the <Alt> and <Start/Stop>
push-buttons at the same time. The instrument goes through the self-test
routine after switching on (displaying the manufacturer and the name of
the instrument) and then it enters:
• the last used just before the unit
switch off presentation mode in
case of Vibration measurements or
• the Running SPL presentation
mode in case of Sound
measurements.
Starting measurement
To start the measurements the user has
to press the <Start/Stop> push-button.
The measurement will be performed with
the current instrument settings, which
are preserved in the internal memory of
the instrument.
<Start>
Page 18
SVAN 979 USER'S MANUAL_______________________________________________ _18
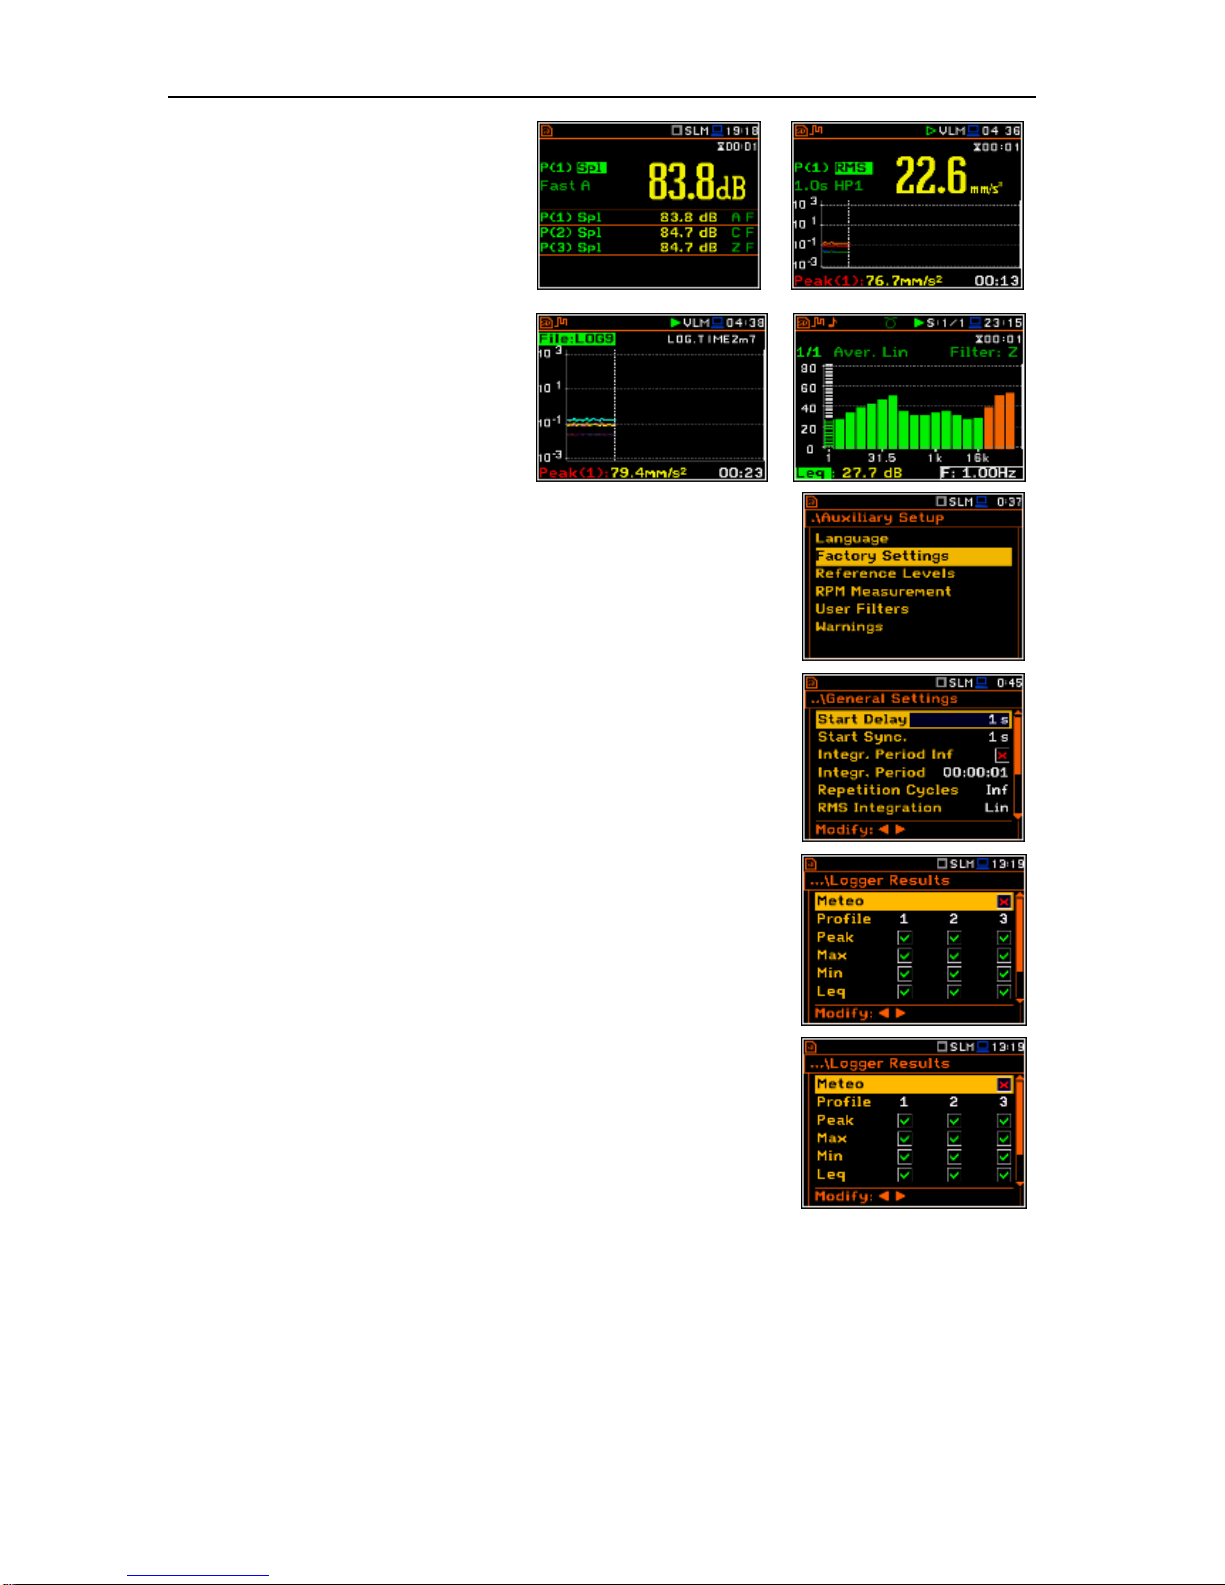
The results of the measurements can
also be presented in so called combined
mode. In this mode the screen is divided
into two parts and the results for one
profile and three profiles can be
presented together, as well as for one
profile and logger and for three profiles
and logger.
The Logger mode is used for
presentation the time history of the
measurement.
The Spectrum moded are used for
spectrum presentation.
Setting the measurement parameters
The instrument as sold has default settings which the user may change,
but always return to them with the use of Factory Settings option in the
Auxiliary Setup menu.
Next chapters of the manual will describe in details what each parameter
means and how to change the instrument settings.
Main default settings
With default settings the instrument will measure sound pressure level by
virtual meters, so called profiles (Measurement Mode: Sound;
Measurement Function: Level Meter) with 1 sek delay from the <Start>
push-button pressure (Start Delay: 1 s), 1 second integration time
(Integration Period: 00:00:01), infinitive repetition till press <Stop>
push-button (Repetition Cycle: Inf), linear integration
(RMS Integration: Lin), free field compensation (Compensation Filter:
Free Field), active logging of the selected results with 1 sek step
(Logger: On; Logger Step: 1 s; Logger Results: Peak, Max, Min and
Leq for all profiles) and summary results saving including Statistics.
Other functions are switched off like:
- measurement trigger (Measurement Trigger: Off),
- logger trigger (Logger Trigger: Off),
- event recording (Events: Off)
- wave recording (Wave Rec.: Off),
- timer (Timer Mode: Off).
The logger and summary results will be automatically saved in the file with
the name defined by the instrument and presented in the Logger Setup
sub-list (Logger Name: Lxxxx).
Page 19
SVAN 979 USER'S MANUAL_______________________________________________ _19
3.4. Initial Setup of the instrument
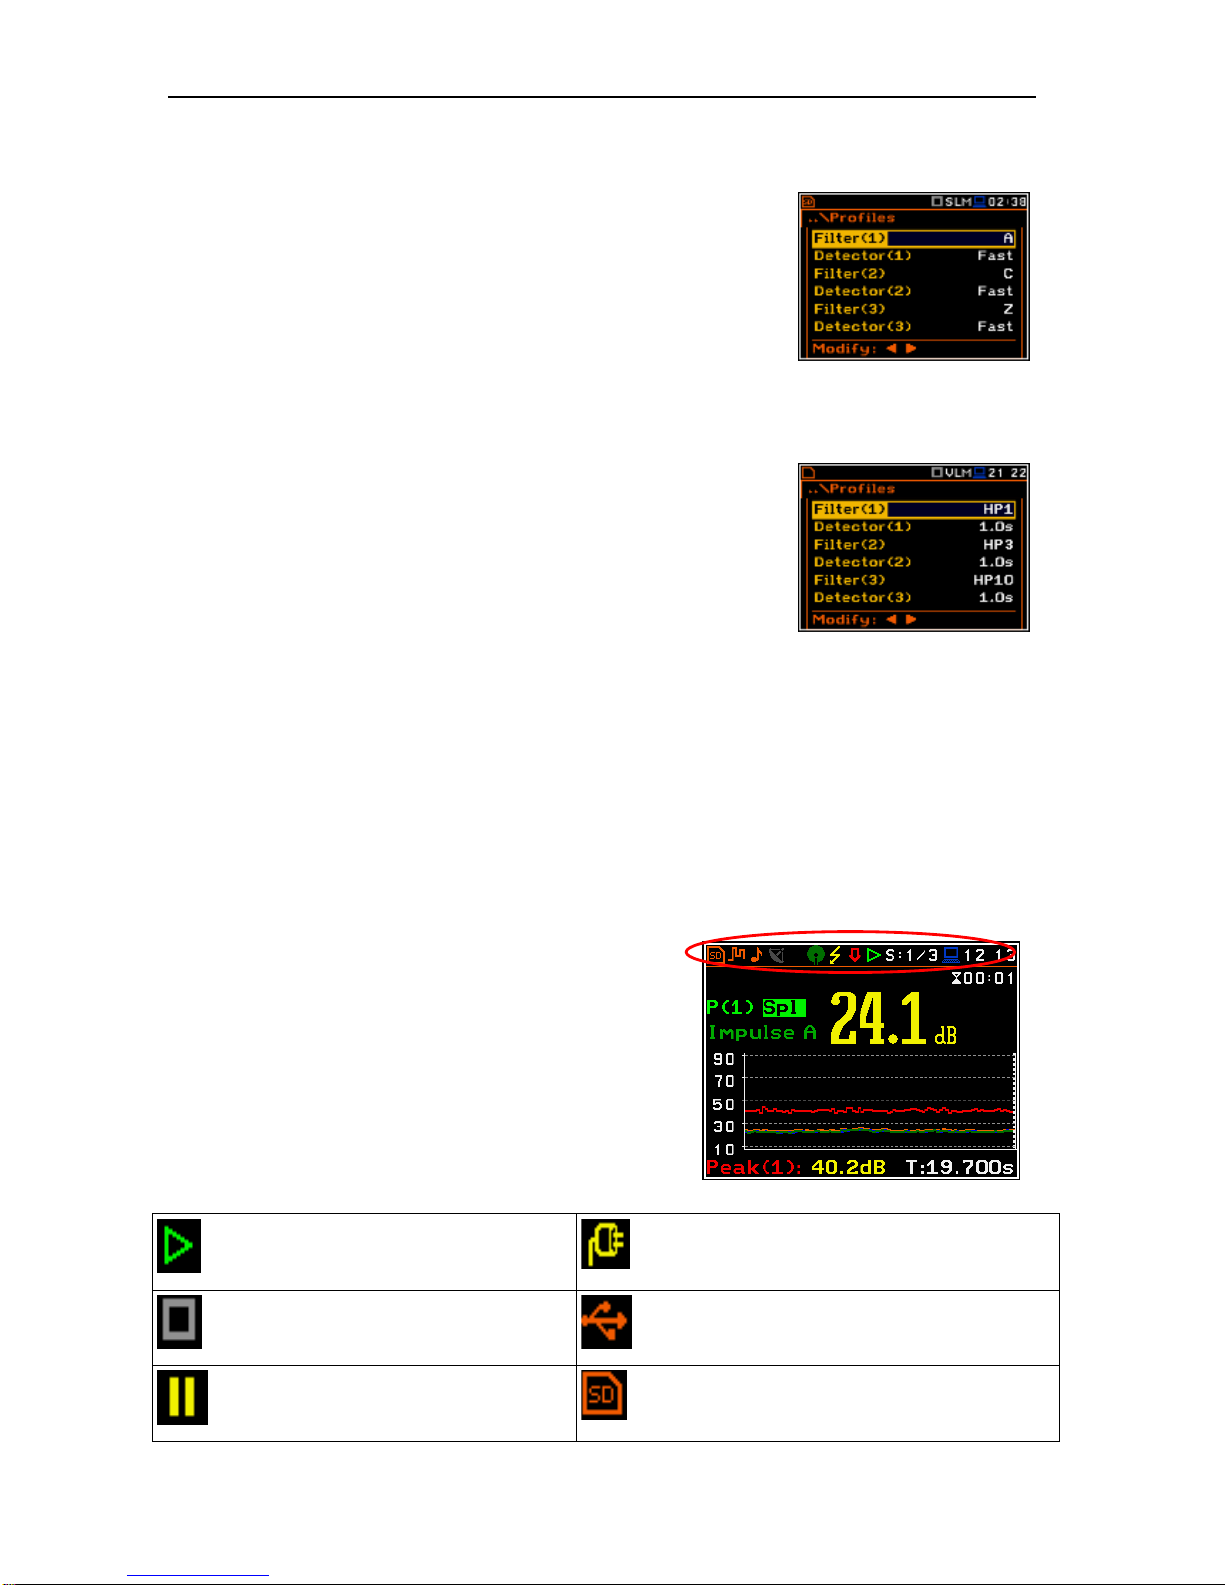
Default profile settings for Sound measurements:
Profile 1 - A weighting filter (Filter(1)=A), Fast for the RMS detector
(Detector(1)=Fast), the results of the measurements are
not stored in the logger’s file;
Profile 2 - C weighting filter (Filter(2)=C), Fast for the RMS detector
(Detector(2)=Fast), the results of the measurements are
not stored in the logger’s file;
Profile 3 - Z weighting filter (Filter(3)=Z), Fast for the detector
(Detector(3)=Fast), the results of the measurements are
not stored in the logger’s file.
Default profile settings for Vibration measurements:
Profile 1 - HP1 weighting filter (Filter(1)=HP1); 1.0s for the RMS
detector (Detector(1)=1.0s), the results of the
measurements are not stored in the logger’s file;
Profile 2 - HP3 weighting filter (Filter(2)=HP3), 1.0s for the RMS
detector (Detector(2)=1.0s), the results of the
measurements are not stored in the logger’s file;
Profile 3 - HP10 weighting filter (Filter(3)=HP10), 1.0s for the RMS
detector (Detector(3)=1.0s), the results of the
measurements are not stored in the logger’s file.
The user can change all the above mentioned settings using Profiles sub-list of the Measurement list. The
instrument remembers all changes for the next time it is used. Return to the default settings (set up by the
manufacturer) is possible after the selection of the Factory Settings position available in the
Auxiliary Setup list.
3.5. Description of icons
Description of the instrument state
Additional information about the instrument’s state is given
by means of the row of icons visible in the top of the display.
The type of measurement function and the measurement
mode (SLM, VLM, S:1/3 etc.) as well as real time clock
(RTC) is also displayed in the same line together with icons.
The meanings of the icons are as follows:
“play” icon is displayed when the
measurement is started.
“plug” icon is displayed when the
instrument is powered from the external
source.
“stop” icon is displayed when the
measurement is stopped.
“USB Disk” icon is displayed when USB
disc is assigned for file saving. USB disc is
connected and activated.
“pause” icon is displayed when the
measurement is paused.
“SD Card” icon is displayed when external
micro SD card memory is assigned for file
saving. Micro SD card is inserted.
Page 20
SVAN 979 USER'S MANUAL_______________________________________________ _20
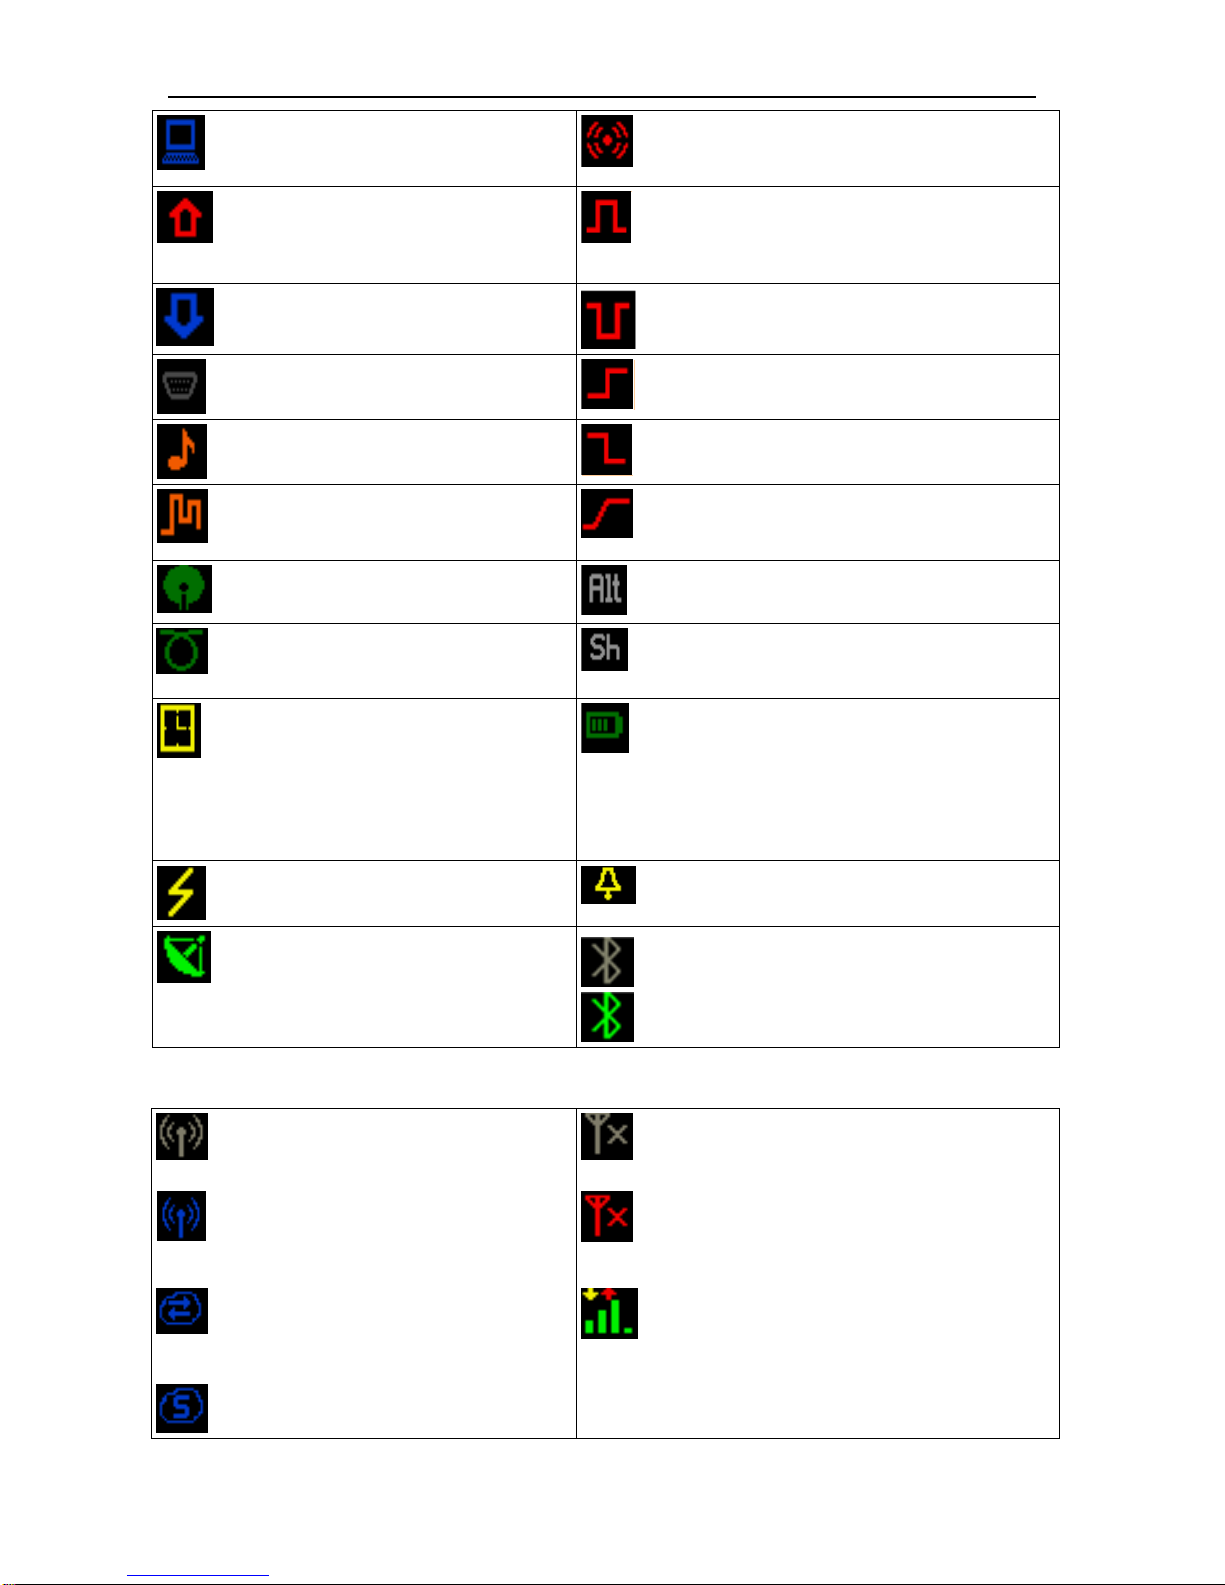
“computer” icon is displayed when
there is a successful USB connection
with the PC.
“vibration” icon is displayed when self
vibration level is exceeded.
“arrow up” icon is displayed when
overload appears.
“Trigger Level +” icon is displayed when
the trigger condition is set up to „Level+”.
The icon appears alternately with the „play”
icon.
“arrow down” icon is displayed when
under range appears.
“Trigger Level –“ icon is displayed when
the trigger condition is set up to „Level-”.
“RS232” icon is displayed when the
RS232 port is activated.
“Trigger Slope +” icon is displayed when
the trigger condition is set up to „Slope+”.
“tone” icon is displayed during wave
recording.
“Trigger Slope –“ icon is displayed when
the trigger condition is set up to „Slope-”
“curve” icon is presented when the
current measurement results are
logged in the instrument’s logger file.
“Trigger Gradient“ icon is displayed when
the trigger condition is set up to „Gradient”
“windscreen” icon is displayed when
windscreen is applied.
“Alt” icon is displayed when the <Alt>
push-button is pressed.
“cable” icon is displayed when the
microphone is connected via extension
cable.
“Shift” icon is displayed when the <Shift>
push-button is pressed.
“clock” icon is displayed when the
timer is On. Is active when the
instrument is waiting for the
measurement start up to occur. When
the measurement start up is close, the
icon changes its colour to green and
starts to blink.
“battery” icon is displayed when the
instrument is powered from the internal
batteries. Icon corresponds to the status of
the batteries (three, two, one or none vertical
bars inside the icon). When voltage of
batteries is too low, the icon becomes red.
“lightning” icon is displayed when
polarisation voltage is 200V.
“bell’ icon is displayed when any alarm
appears
“satellite” icon is displayed when GPS
is active. Colours of the icon define the
state of the GPS: green – active, blue
– searching, grey – disconnected.
“Bluetooth” icon is displayed when the
Bluetooth® is switched on. Colours of the
icon define the state of the connection:
green – connected, grey – disconnected.
Icons in connection with the modem functionality:
or
Icon is displayed when the GPRS
function is swithed on and there is no
cable connection with the modem
or
Icon is displayed when the GPRS function is
swithed on and there is no cable connection
with the modem
or
icon is displayed when the wireless
transmission (GPRS modem) is active,
but there is no connection with Host or
SvanNET
or
icon is displayed if there is no GPRS
connection
or
icon is displayed if there is connection
with Host
icon is displayed if there is GPRS connection
and shows the level of the GPRS signal. In
additional GPRS connection yellow and red
arrows appear
icon is displayed if there is connection
with SvanNET.
Page 21
SVAN 979 USER'S MANUAL_______________________________________________ _21
3.6. Memory organisation and saving files
Memory options
All available measurement results and settings can be stored in the external Memory (micro SD Card or
USB Disk) as files in the predefined or assigned catalogues. The setup files are stored in the predefined
catalogue SETUP. The predefined catalogues can be changed by the user or renamed.
The SD Card external memory is activated automatically after insertion of the card. The manual activation of
the USB Disk is needed.
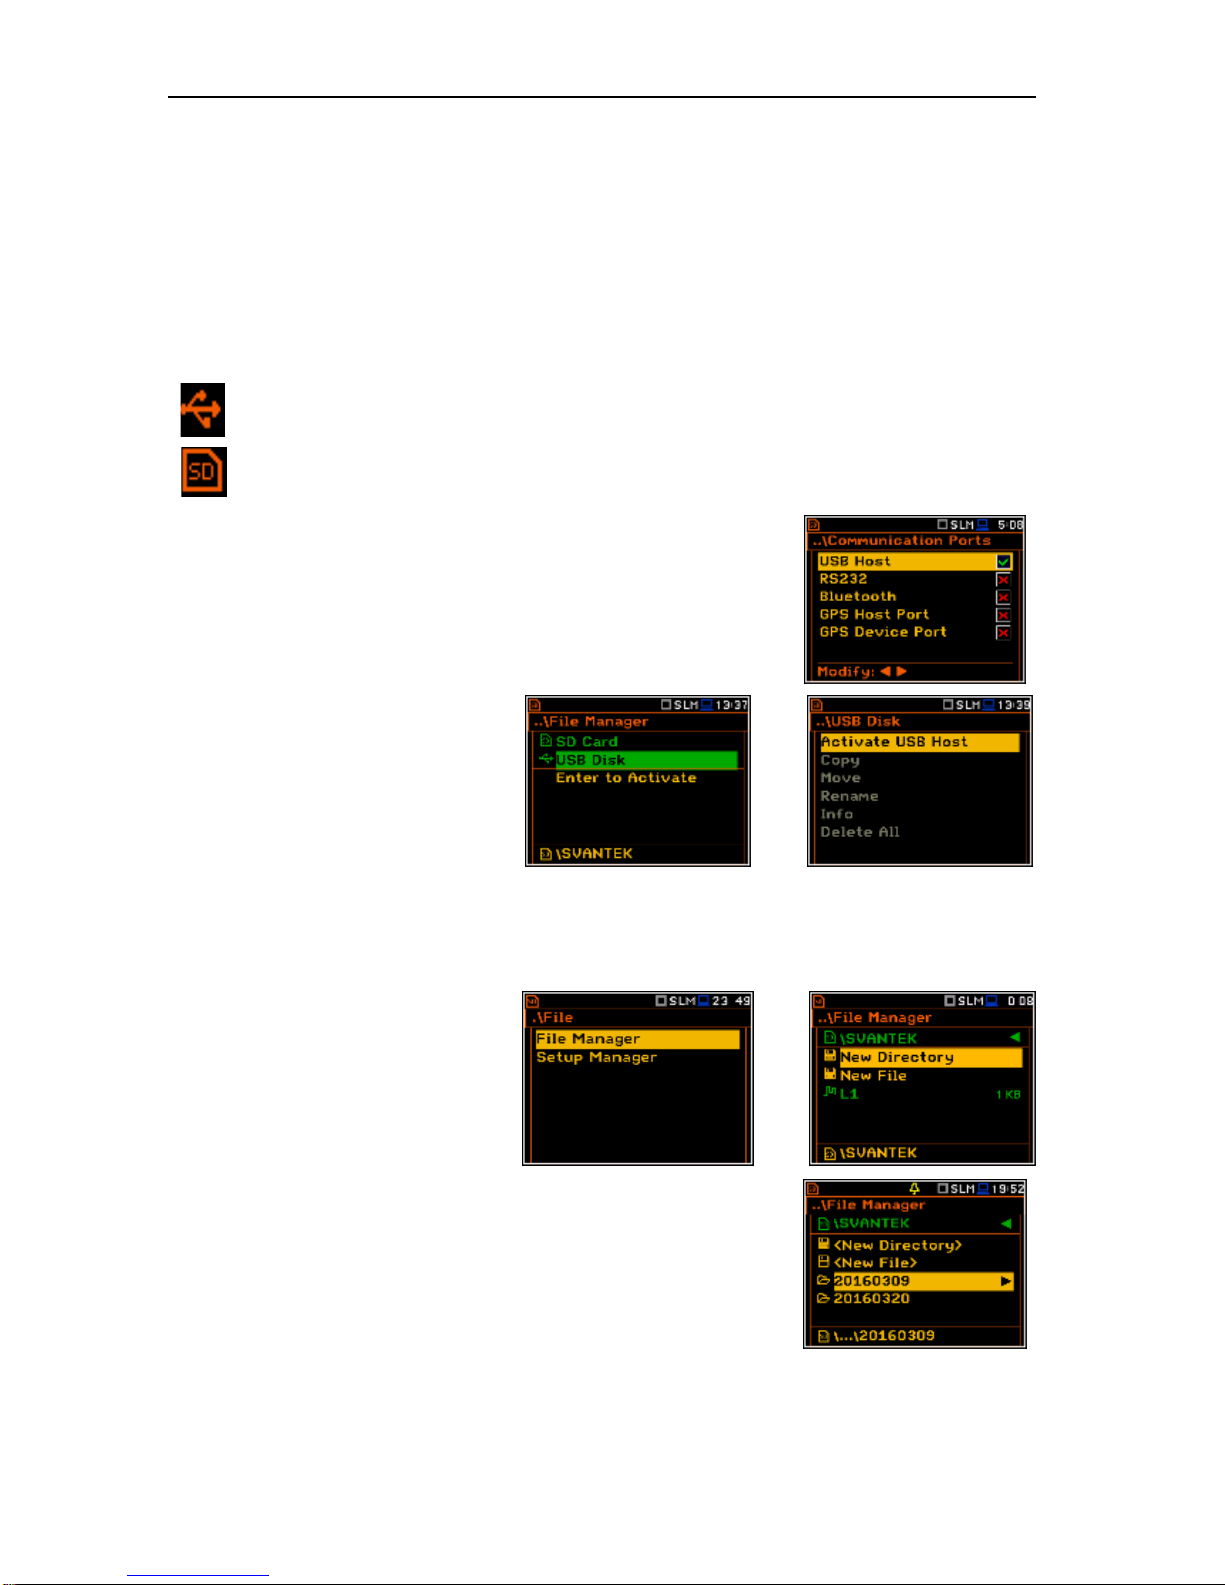
The type of the selected memory shows the icon at the top left hand corner of the display.
“USB Disk” icon is displayed when USB disc is assigned for file saving. USB disc is connected
and activated.
“SD Card” icon is displayed when external SD card memory is assigned for file saving. Micro SD
card is connected.
USB Disc activation
USB Disc activation is performed in the Communication Ports window
of the Instrument menu (path: <Menu> / Instrument /
Communication Ports).
Activation of the USB Disk can also be
performed in the File Manager window.
The user should select the USB Disk
position and press the <ENTER> pushbutton. Then in the Command list select
the Activate USB Host position and
press the <ENTER> push-button again.
<ENT>
The SD Card and USB Disk memories are organised as standard memory with directories and subdirectories. It is possible to create and to delete the directory structure.
The content of each memory file type can be checked with the help of the File Manager or Setup Manager
function of the File menu.
Catalogues and files managing
The user can manage the files saved on
SD card with the help of the
File Manager or Setup Manager
function of the File menu.
<ENT>
The files are saved in the catalogue, which was set up as the working
catalogue. The working directory is displayed in the bottom line of the
File Manager window. The working Memory type is displayed as the icon
in the left position of the icon line.
Some catalogues are created automatically every time the measurements
are performed.
The catalogues can be also created manually with the use of
<New Directory> position.
Page 22
SVAN 979 USER'S MANUAL_______________________________________________ _22
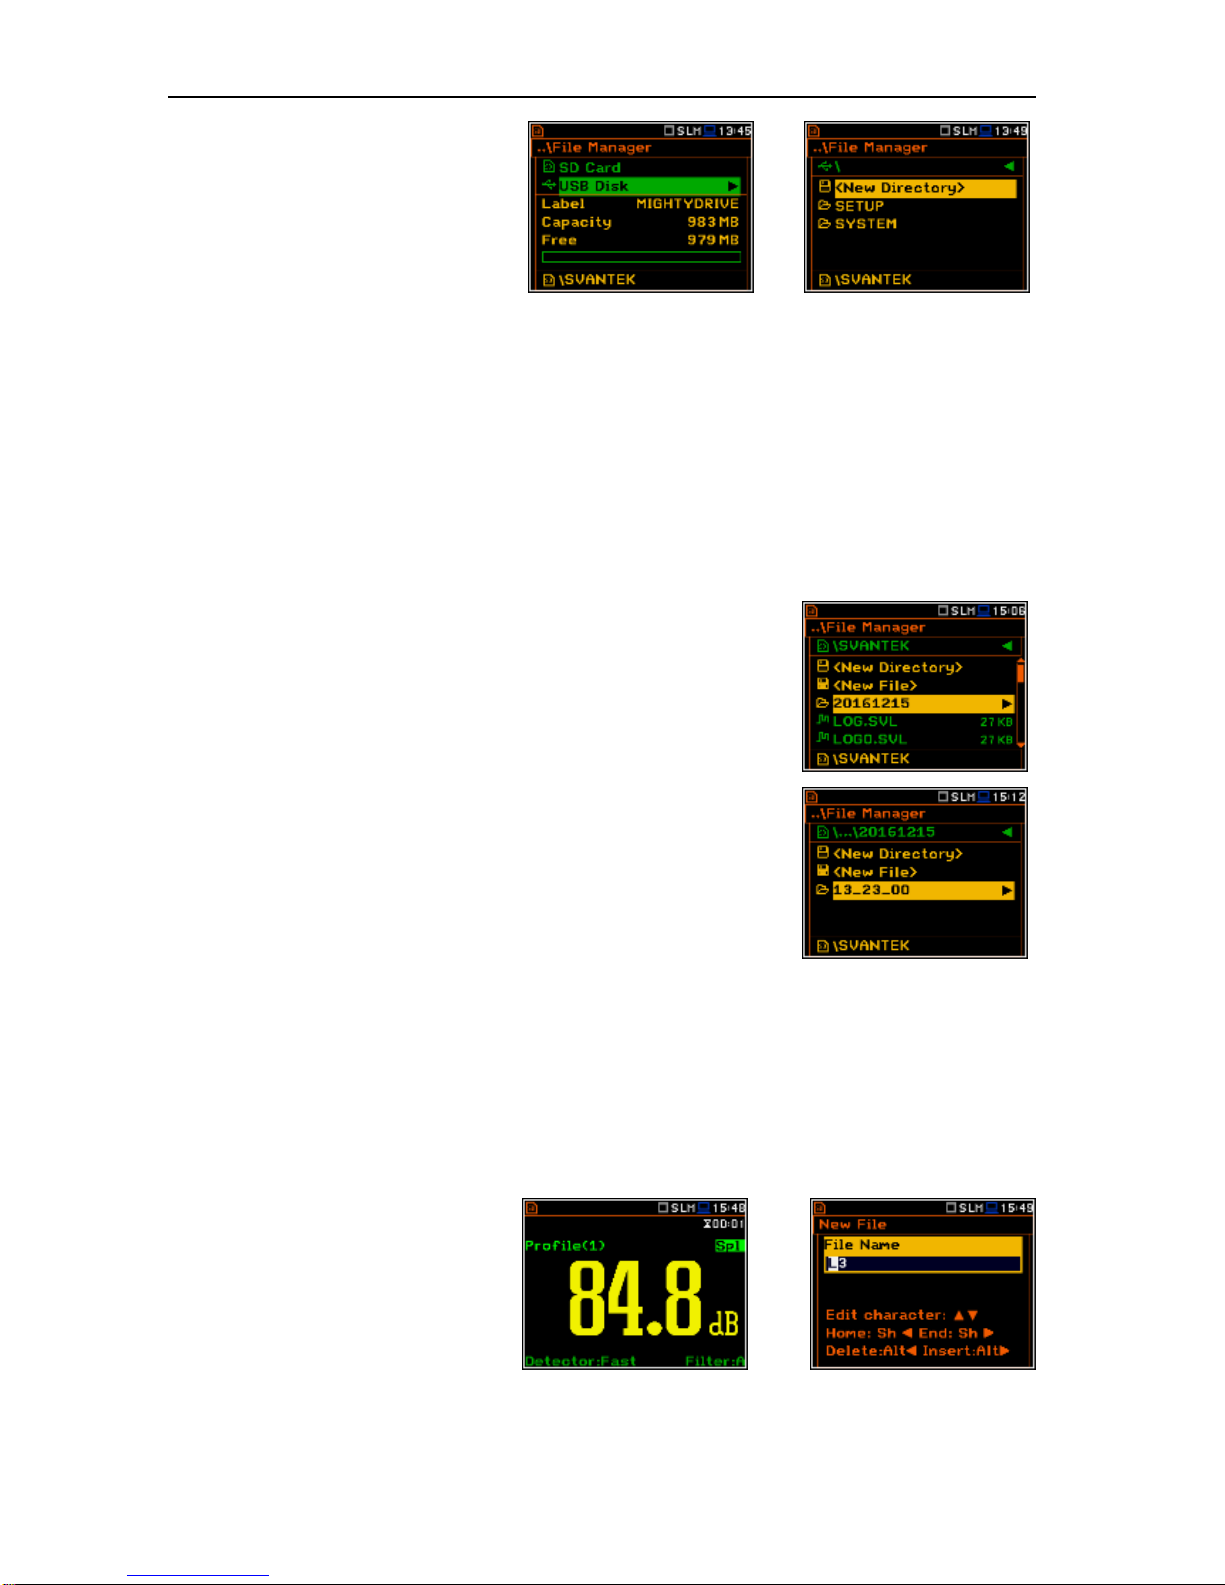
If the user is going to save files on the
USB Disc he should:
• enter the USB Disc catalogue
system,
• select pre-defined SYSTEM
catalogue or create own new
catalogue and
• make the selected catalogue as a
working one (see File menu
description).
<>
Automatic result files saving
Files which contain the logger data are saved automatically to the SD Card or USB Disk memory. To enable
automatic saving several conditions should be fulfilled:
1. SD card or USB disc should be inserted and there should be enough space on it.
2. The Logger (path: <Menu> / Measurement / Logging / Logger Setup) should be switched on.
3. The file name should be defined aa a unique one (path: <Menu> / Measurement / Logging /
Logger Setup / Logger Name).
Once the user has performed the first measurement during a certain day
the instrument automatically creates the unique catalogue with the name
YYYMMDD in the working directory, where YYYY is a year, MM is a month
and DD is a day of the first measurement.
For example if the first measurement is performed on 15th of December
2016 the catalogue name is 20161215.
Files are saved in another automatically created catalogues with the
names structure hh-mm-ss (where hh is an hour, mm is a minute and ss
is a second of the measurement start), when the measurement starts.
Manual result files saving
If Logger is switched off the automatic saving function is switched off too. Then some result data (so called
Summary Results) can be saved only manually. In fact Summary Results can be saved manually even if
Logger is switched on.
In both cases files that can be saved manually are saving in the catalogue defined as the working one.
There are two methods for saving manually Summary Results data. One option is to press <Save> pushbutton right after the measurement finishes. Another option is to create <New File> in the File Manager.
Both methods are described in the File menu section of the manual.
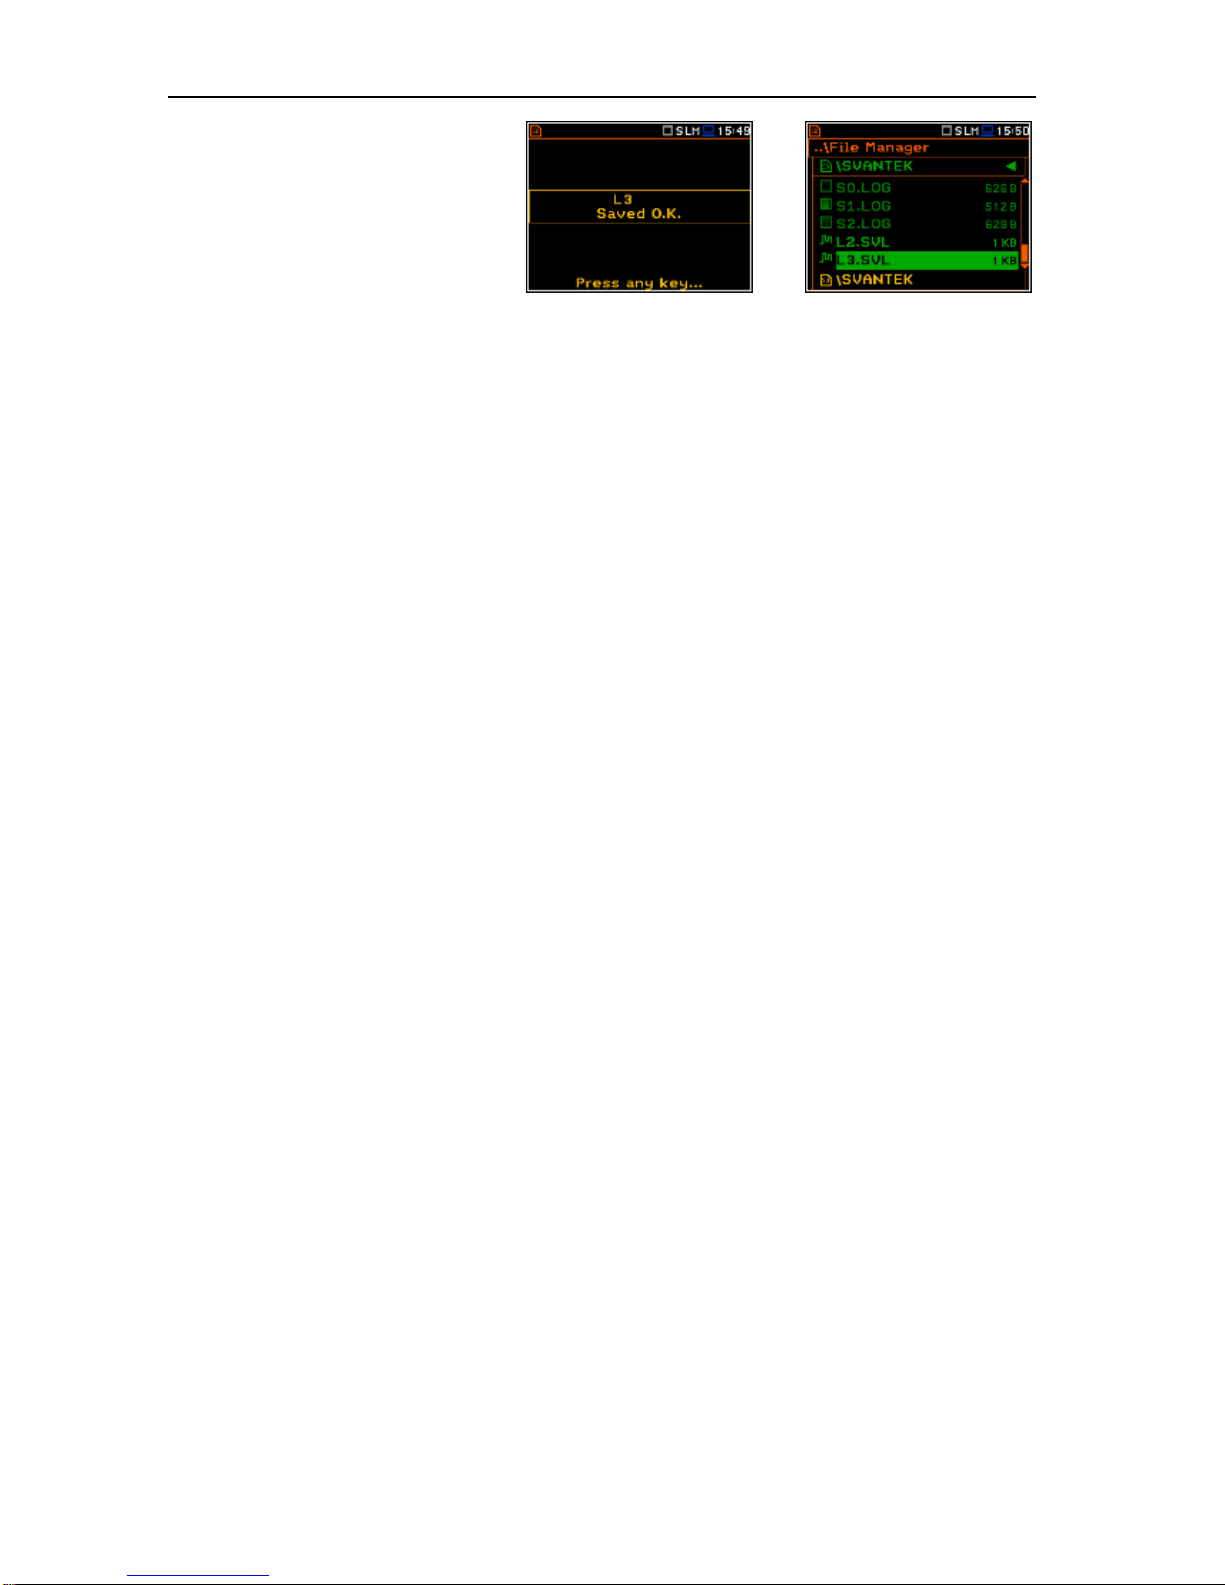
After pressing the <Save> push-button
the New File window appears with the
predefid name which has number
increased by one to the latest saved. In
the New File window the user can enter
a new name for the result file.
<Save>
Page 23
SVAN 979 USER'S MANUAL_______________________________________________ _23
After pressing the <ENTER> pushbutton the file will be saved in the
working catalogue.
=>
Setup files saving
The measurement configuration Setup files can be stored also by means of <S/P> push-button and by
creating the <New File> in the Setup Manager list.
Page 24
SVAN 979 USER'S MANUAL_______________________________________________ _24
4. FUNCTIONS OF THE INSTRUMENT – Function
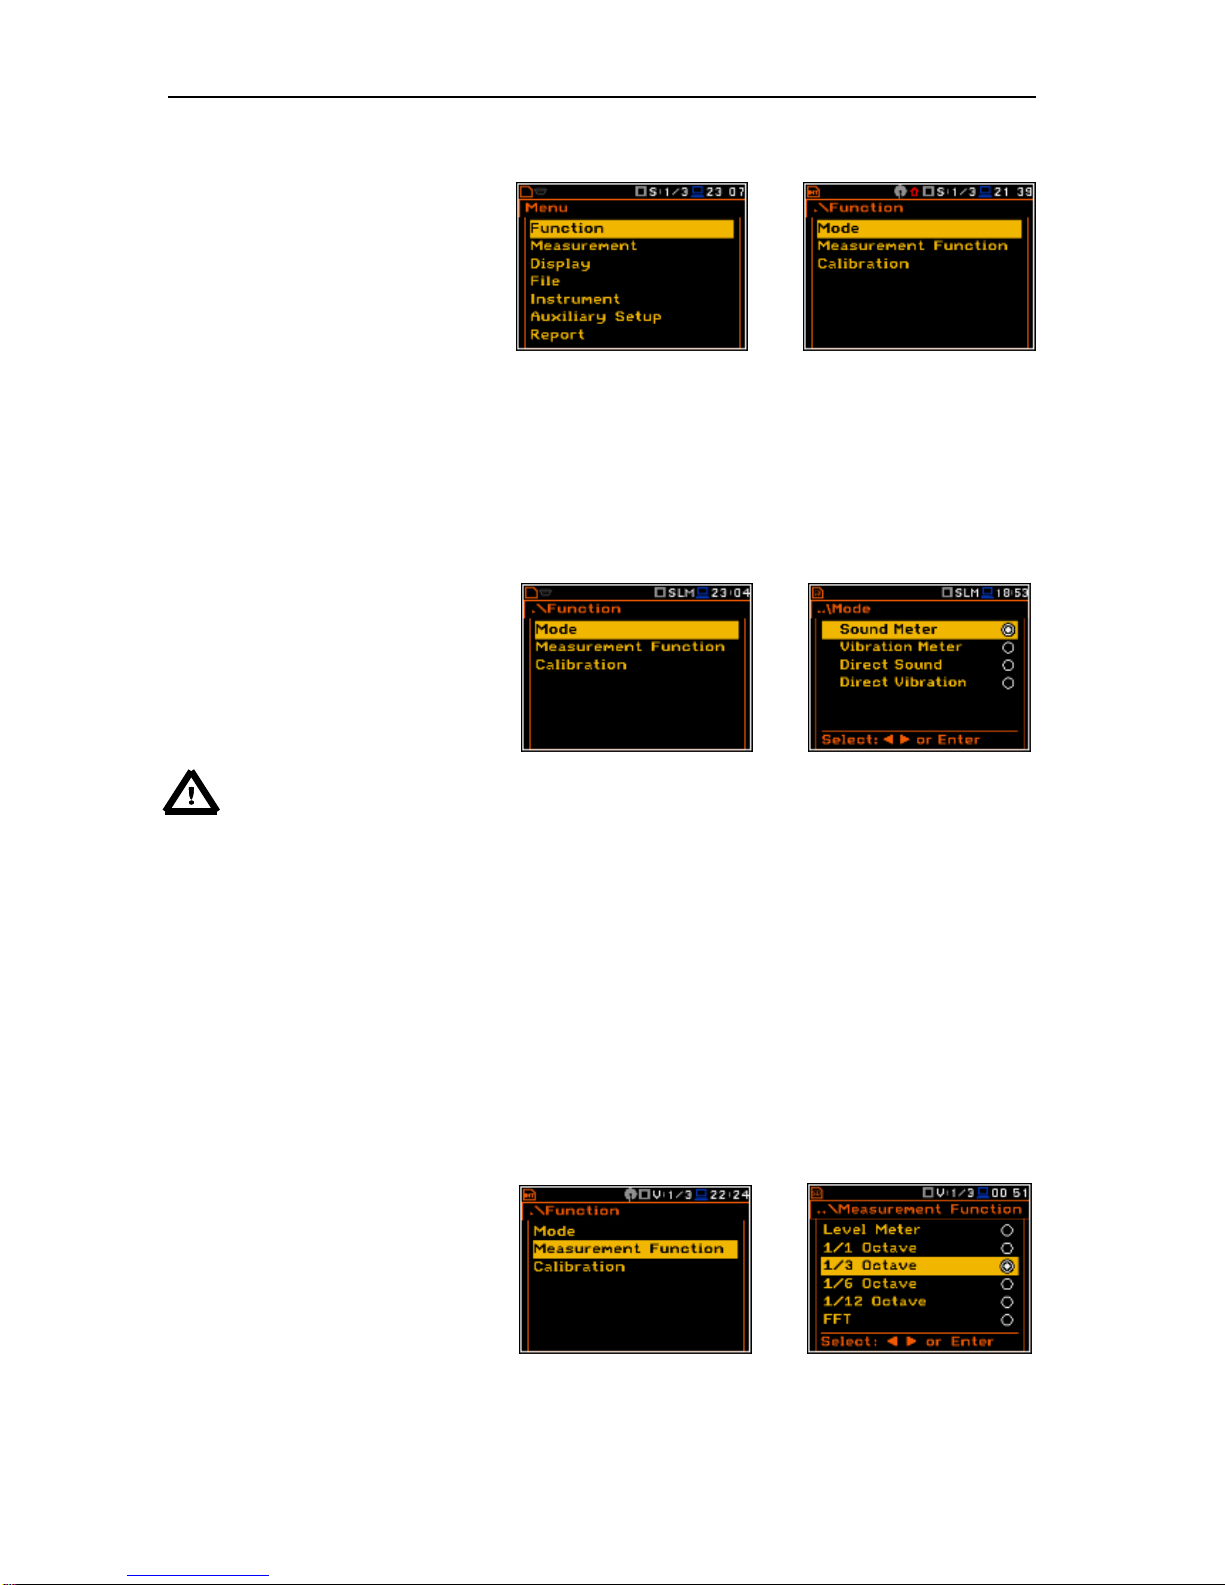
In order to select the Function list the
user has to press the <Menu> pushbutton, select the Function text and
press <ENTER>. The Function list
contains three elements: Mode,
Measurement Function and
Calibration.
<ENT>
The Function list consists of:
Mode enables the user to select the sound or vibration mode of the instrument;
Measurement Function enables the user to select the measurement function of the instrument;
Calibration enables the user to perform a calibration of instrument’s measurement channel.
4.1. Selecting the mode of the instrument – Mode
The device can work in four modes –
two sound modes: Sound Meter and
Direct Sound; and two vibration
modes: Vibration Meter and
Direct Vibration.
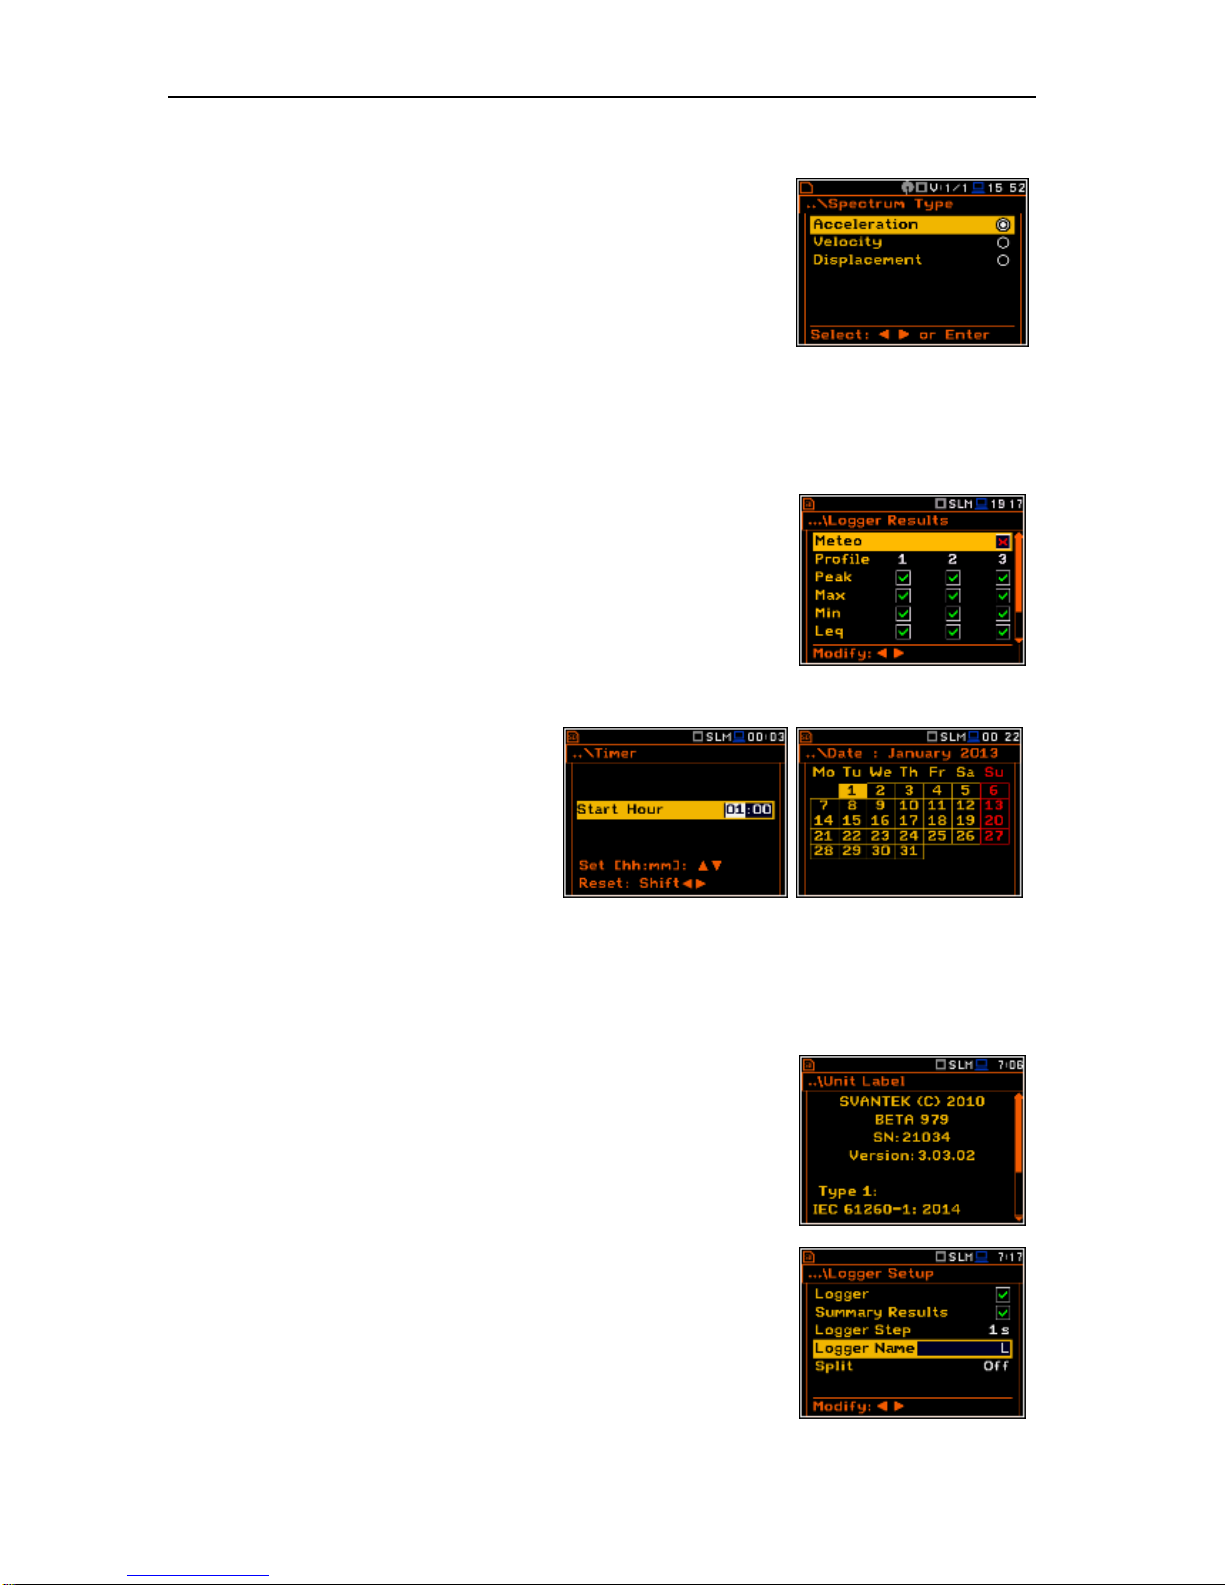
<ENT>
Notice: In the user manual text the Sound mode (or Sound measurements) refers to the
Sound Meter and Direct Sound modes and the appropriate functions dedicated for the
measurement and analysis of the acoustic signal: Level Meter, 1/1 Octave, 1/3 Octave, FFT; the
Vibration mode (or Vibration measurements) refers to the Vibration Meter and Direct Vibration
modes and the appropriate functions dedicated for the measurement and analysis of the vibration
signal: Level Meter, 1/1 Octave, 1/3 Octave, FFT.
4.2. Measurement functions of the instrument – Measurement Function
The main function of the instrument is the measurement of Sound pressure or Vibration broad band level
(Level Meter). The Sound Level Meter (SLM) function provides the user with functions meeting the standard
IEC 61672:2013 for Type 1 accuracy and the Vibration Level Meter (VLM) meeting the standard
ISO 8041:2005. The instrument can also be used for medium to the long-term acoustic monitoring using the
huge capacity data logger in which all the measurement results are stored.
The user may also use 1/1, 1/3, 1/6 and 1/12 real time octave band frequency analysis functions. These
functions extend the main broad band Level Meter functions of the instrument, because the selected 1/1 1/12 octave analysis is performed together with all calculations of the Level Meter functions.
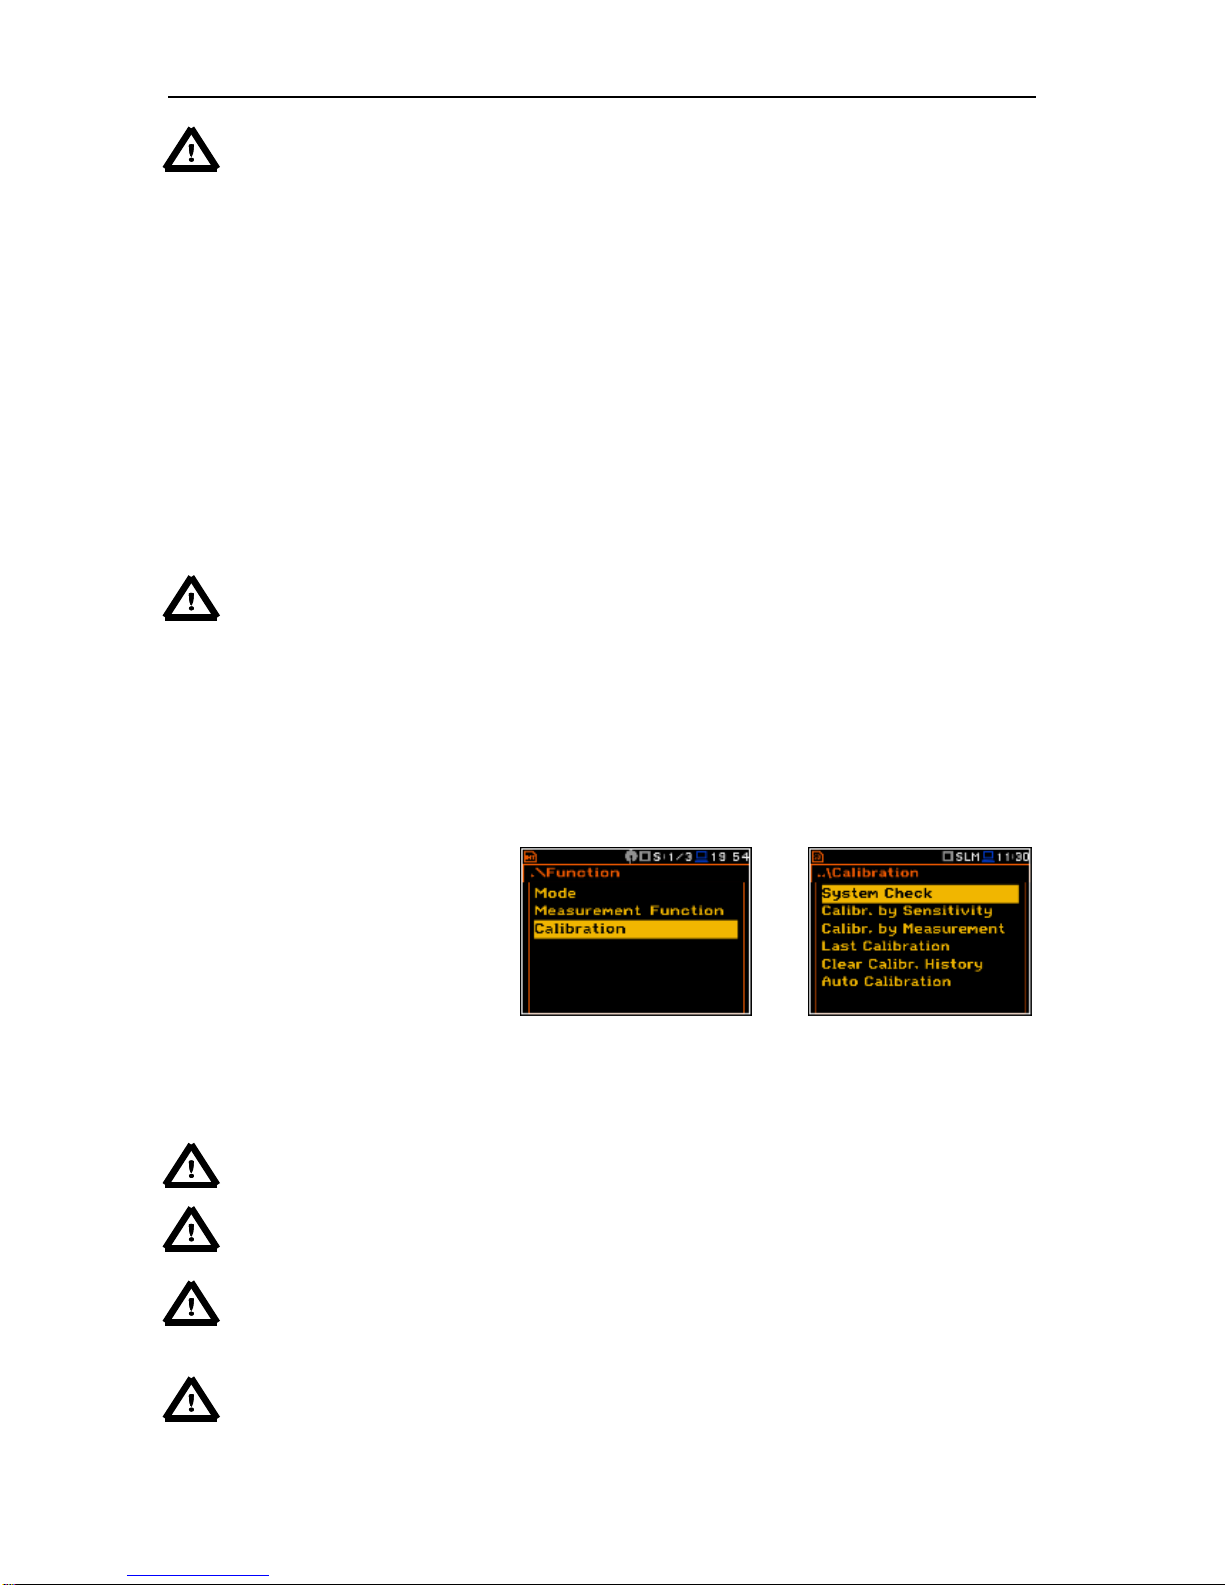
In order to select the required function
the user has to enter the
Measurement Function list. After
entering the Measurement Function
list, the set of the available functions
appears on the display: Level Meter,
1/1 Octave, 1/3 Octave, 1/6 Octave,
1/12 Octave and FFT (in case of
Vibration modes) and also RT60 and
Tonality (in case of Sound modes). The
currently active function is marked.
<ENT>
Page 25
SVAN 979 USER'S MANUAL_______________________________________________ _25
Notice: The type of measurement function and the measurement mode is displayed in the upper
line of the screen.
- SLM Sound Level Meter,
- S: 1/1 Sound 1/1 Octave,
- S: 1/3 Sound 1/3 Octave,
- S: 1/6 Sound 1/6 Octave,
- S: 1/12 Sound 1/12 Octave,
- S: FFT Sound FFT,
- DSLM Direct Sound Level Meter,
- DS: 1/1 Direct Sound 1/1 Octave,
- DS: 1/3 Direct Sound 1/3 Octave,
- DS: 1/6 Direct Sound 1/6 Octave,
- DS: 1/12 Direct Sound 1/12 Octave,
- DS: FFT Direct Sound FFT,
- S:RT60 Sound RT60,
- S:TON. Sound Tonality,
- S:LOUD Loudness
- VLM Vibration Level Meter,
- V: 1/1 Vibration 1/1 Octave,
- V: 1/3 Vibration 1/3 Octave,
- V: 1/6 Vibration 1/6 Octave,
- V: 1/12 Vibration 1/12 Octave,
- V: FFT Vibration FFT,
- DVLM Direct Vibration Level Meter,
- DV: 1/1 Direct Vibration 1/1 Octave,
- DV: 1/3 Direct Vibration 1/3 Octave,
- DV: 1/6 Direct Vibration 1/6 Octave,
- DV: 1/12 Direct Vibration 1/12 Octave,
- DV: FFT Direct Vibration FFT.
Optional measurement functions that broaden the applications of the instrument can be easily installed.
These options can be initially supplied by the manufacturer or purchased later and added by the user.
Notice: It is not possible to change the measurement function during a measurement run. In this
case the instrument displays for about 3 seconds the message: “Measurement in Progress”. In
order to change the mode of the instrument the current measurement in progress must be
finished!
4.3. Instrument’s calibration – Calibration
The instrument is factory calibrated with the supplied microphone for the standard environmental conditions.
Because the microphone sensitivity is a function of the temperature, ambient pressure and humidity, when
the absolute sound pressure level value is important, the absolute calibration of the measurement channel
should be performed. In order to select the calibration function the user has to enter the Calibration sub-list.
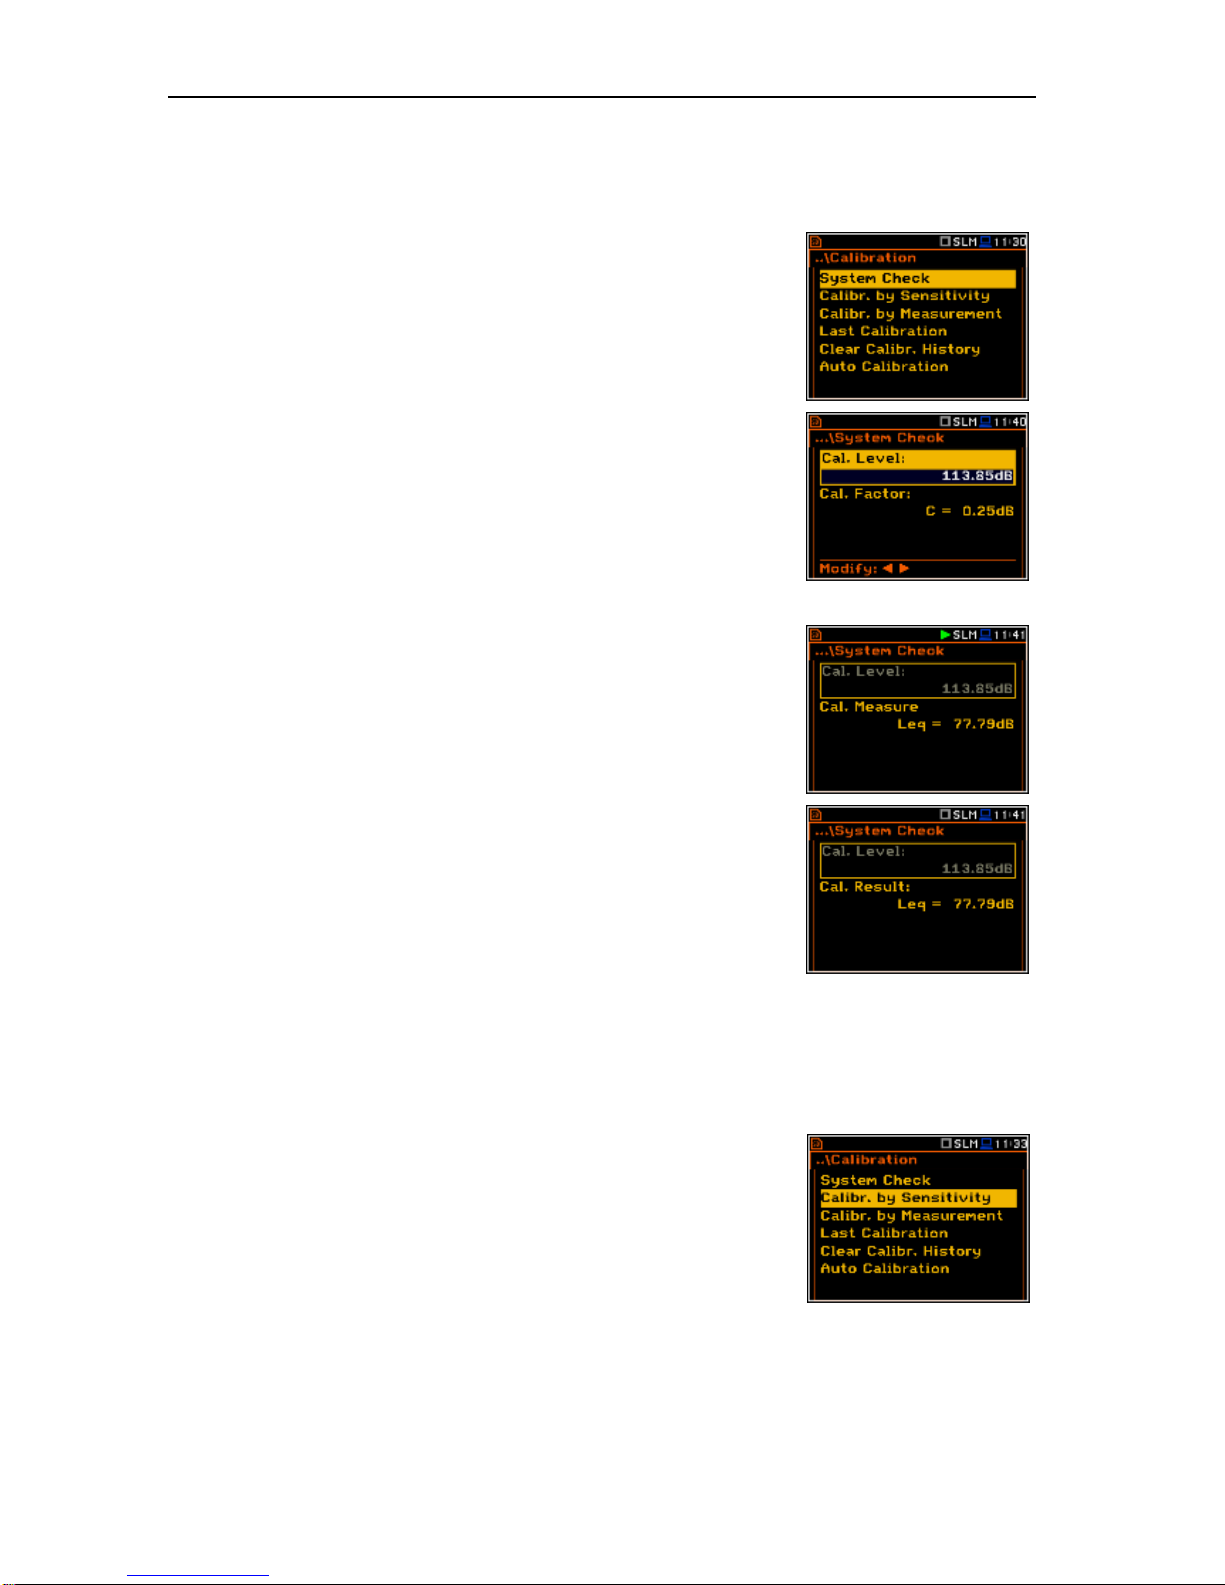
The Calibration sub-list consists of
three positions: System Check,
Calibr. By Sensitivity,
Calibr. By Measurement, which are
used to perform the actual calibration;
Last Calibration position, which
contains the list of calibration
measurements performed earlier and
the results obtained,
Clear Calibr. History position, used for
erasing the calibration history list and
Auto Calibration position, which
switches the auto calibration mode on.
<ENT>
Notice: The calibration factor is always added to the results in the Level Meter, 1/1 Octave,
1/3 Octave, FFT and other modes.
Notice: It is advised to perform the system check of the instrument each time before the
measurements begin. If system check shows negative result then it is necessary to perform
calibration.
Notice: The calibration level and the calibration result are expressed in different units depending
on the settings of the instrument. The metric or non-metric Vibration units are set in the
Vibration Units window (path: <Menu> / Auxiliary Setup / Vibration Units). Additionally, the linear
or logarithmic units are set in the Display Scale window (path: <Menu> / Display / Display Scale).
Notice: It is not possible to check and calibrate the instrument during the execution of live
measurements. It is possible to open different lists and sub-lists but the positions in these lists are
displayed greyed out inversely and so - not accessible. The flashing “►” icon on the top line
Page 26
SVAN 979 USER'S MANUAL_______________________________________________ _26
indicates that the instrument is in the measurement process. In order to change the sensitivity the
current measurement in progress must be finished!
4.3.1. In-situ System Check
ISO 8041 standard advises users to perform in-situ checks of
measurement instrumentation. Checking should be carried out
immediately before and after measurements are made.
1. Select System Check from Calibration sub-list and press the
<ENTER> push-button.
2. Select the calibrator signal level.
3. Attach the vibration calibrator to the instrument’s accelerometer.
4. Switch on the calibrator and wait approximately 30 seconds before
starting the system check measurement.
5. Start the calibration measurement by pressing the <Start/Stop> pushbutton.
The measurement starts without delay. The system check measurement
lasts until the Leq value became stable (with 0.5 dB tolerance). During the
calibration period the <ESC> and <Pause> push-buttons do not operate
but it is possible to stop the measurement using the <Start/Stop> pushbutton.
Measurement results in relationship with calibrator level will be compared
against current calibration factor and the instrument will assess whether
the system check was successful or failed, displaying relevant message
together with current calibration factor and measured calibration.
System check is considered successful in case its result is not more than
2 dB different than the current calibration factor.
Press <ENTER> to exit System Check.
If system check measurement shows bigger difference than 2 dB the user
should manually stop the measurement with the <Start/Stop> push-button.
4.3.2. Calibration by Sensitivity in case of Acoustic signal
Calibration by introducing the microphone’s sensitivity can be performed in
the following way:
1. Select this type of the calibration (highlight the Calibr. by Sensitivity
text) from the Calibration sub-list and press the <ENTER> pushbutton.
Page 27
SVAN 979 USER'S MANUAL_______________________________________________ _27
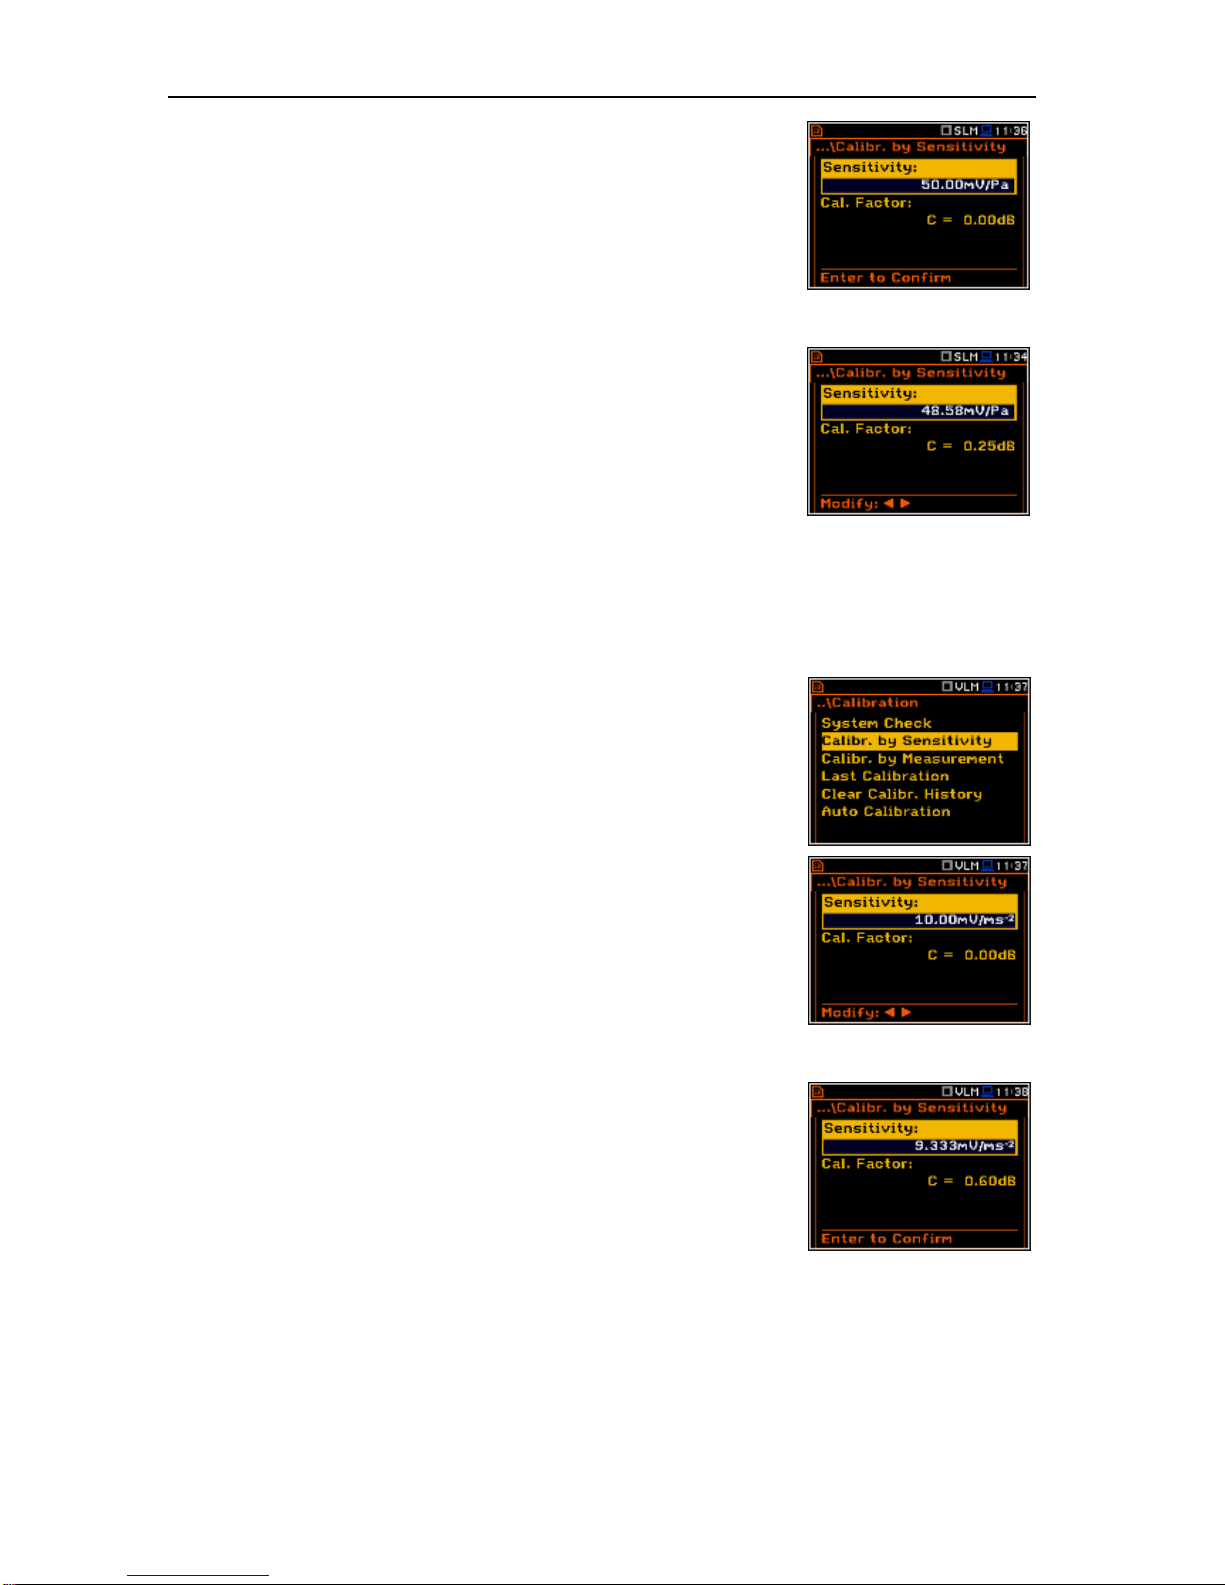
2. Set the sensitivity of the microphone taken from its calibration certificate
using the <Shift> with <>, <> push-buttons and then press
<ENTER>.
The calibration factor is calculated, after pressing the <ENTER> pushbutton, in relation to the nominal value of 50.0 mV / Pa. In order to exit the
calculation the user has to leave the Calibration sub-list by pressing
<ESC>.
For a microphone sensitivity higher than 50.0 mV / Pa the calibration factor
will always be negative.
For a microphone sensitivity lower than 50.0 mV / Pa the calibration factor
will always be positive.
The lowest available value of the sensitivity that can be introduced is equal
to 50.0 V / Pa (it conforms to the calibration factor equal to 60.0 dB) and
the highest value is equal to 50.0 V / Pa (calibration factor is equal to -
60.0 dB).
In order to return to the Calibration sub-list the user has to press the <ESC> push-button.
4.3.3. Calibration by Sensitivity in case of Vibration signal
Calibration by using the accelerometer’s published sensitivity information
can be performed in the following way:
1. Select this type of calibration (highlight the Calibr. by Sensitivity text)
from the Calibration sub-list and press the <ENTER> push-button.
2. Set the sensitivity of the accelerometer taken from its calibration
certificate using the <Shift> with <>, <> push-buttons and then
press <ENTER>.
The calibration factor is calculated, after pressing the <ENTER> pushbutton, in relation to the nominal value of 10.0 mV / ms-2. In order to exit
the calculation the user has to leave the Calibration sub-list by pressing
<ESC>.
For an accelerometer sensitivity higher than 10.0 mV / ms-2 the calibration
factor will always be negative.
For an accelerometer sensitivity lower than 10.0 mV / ms-2 the calibration
factor will always be positive.
The lowest available applicable value of the sensitivity that can be
introduced is equal to 10.0 V / ms-2 (it conforms to the calibration factor
equal to 60.0 dB) and the highest value is equal to 10.0 V / ms-2 (calibration
factor is equal to -60.0 dB).
Page 28
SVAN 979 USER'S MANUAL_______________________________________________ _28
4.3.4. Calibration By Measurement in case of acoustic signal
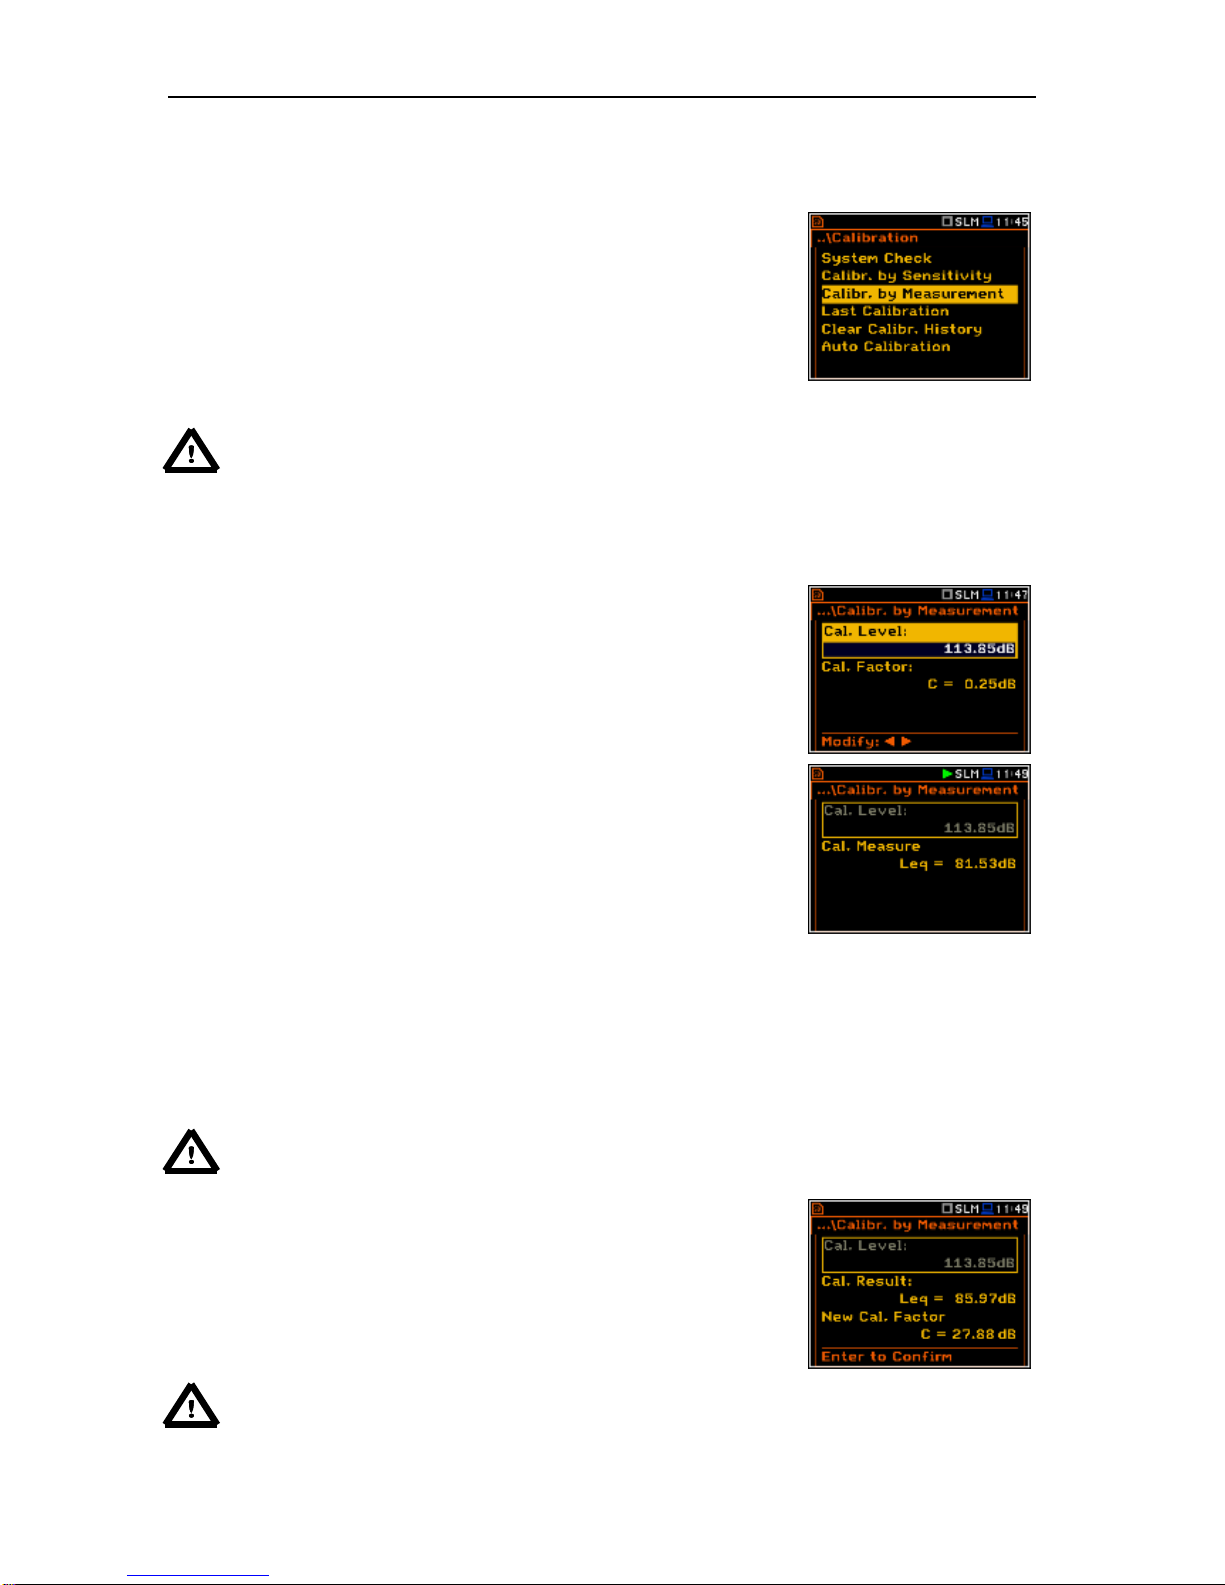
Calibration by measurement for the sound measurements can be done in
the following way:
1. Select the calibration by measurement (highlight the
Calibr. by Measurement text) from the Calibration sub-list and press
the <ENTER> push-button.
2. Attach the acoustic calibrator SV 30A (or equivalent 114 dB / 1000 Hz)
carefully over the microphone of the instrument.
Notice: It is also possible to use an electro-mechanical pistonphone, which generates a signal
(ca 124 dB) or different type of acoustic calibrator dedicated for ½” microphones. In any case,
before starting the calibration measurement, the user has to set the level of the signal generated
by the given calibrator (Cal. Level position of Calibr. by Measurement sub-list), which is stated
in the calibration certificate of the unit (the value of the Cal. Level set by the manufacturer of
SVAN 979 is equal to 114 dB). It is also necessary to switch the instrument Range to the High
level setting.
3. Switch on the calibrator and wait approximately 30 seconds for the
tone to stabilise before starting the calibration measurement.
4. Start the calibration measurement by pressing the <Start/Stop> push-
button.
The measurement starts without delay. The calibration measurement lasts
until the Leq value became stable (with 0.5 dB tolerance). During the
calibration period the <ESC> and <Pause> push-buttons do not operate
but it is possible to stop the measurement using the <Start/Stop> pushbutton.
It is recommended to repeat the calibration measurement a few times to ensure the integrity and stability of
the calibration. The obtained results should be almost identical (with 0.1 dB difference). Some possible
reasons for unstable results are as follows:
• the calibrator is not properly attached to the instrument,
• there are external acoustic disturbances such as high noise levels close by,
• the calibrator or the measurement channel (the microphone, the preamplifier or the instrument
itself) are damaged.
Notice: During the calibration measurement, any external disturbances (acoustic noise or
vibrations) should not exceed a value of 100 dB (when using a calibrator that generates a level
of 114 dB).
5. Press the <ENTER> push-button to accept the calibration
measurement result.
The calibration factor is calculated, stored and displayed after pressing the
<ENTER> push-button.
Notice: The user can press the <ESC> push-button to quit the calibration procedure without
saving the calibration factor.
Page 29
SVAN 979 USER'S MANUAL_______________________________________________ _29
4.3.5. Calibration By Measurement in case of vibration signal
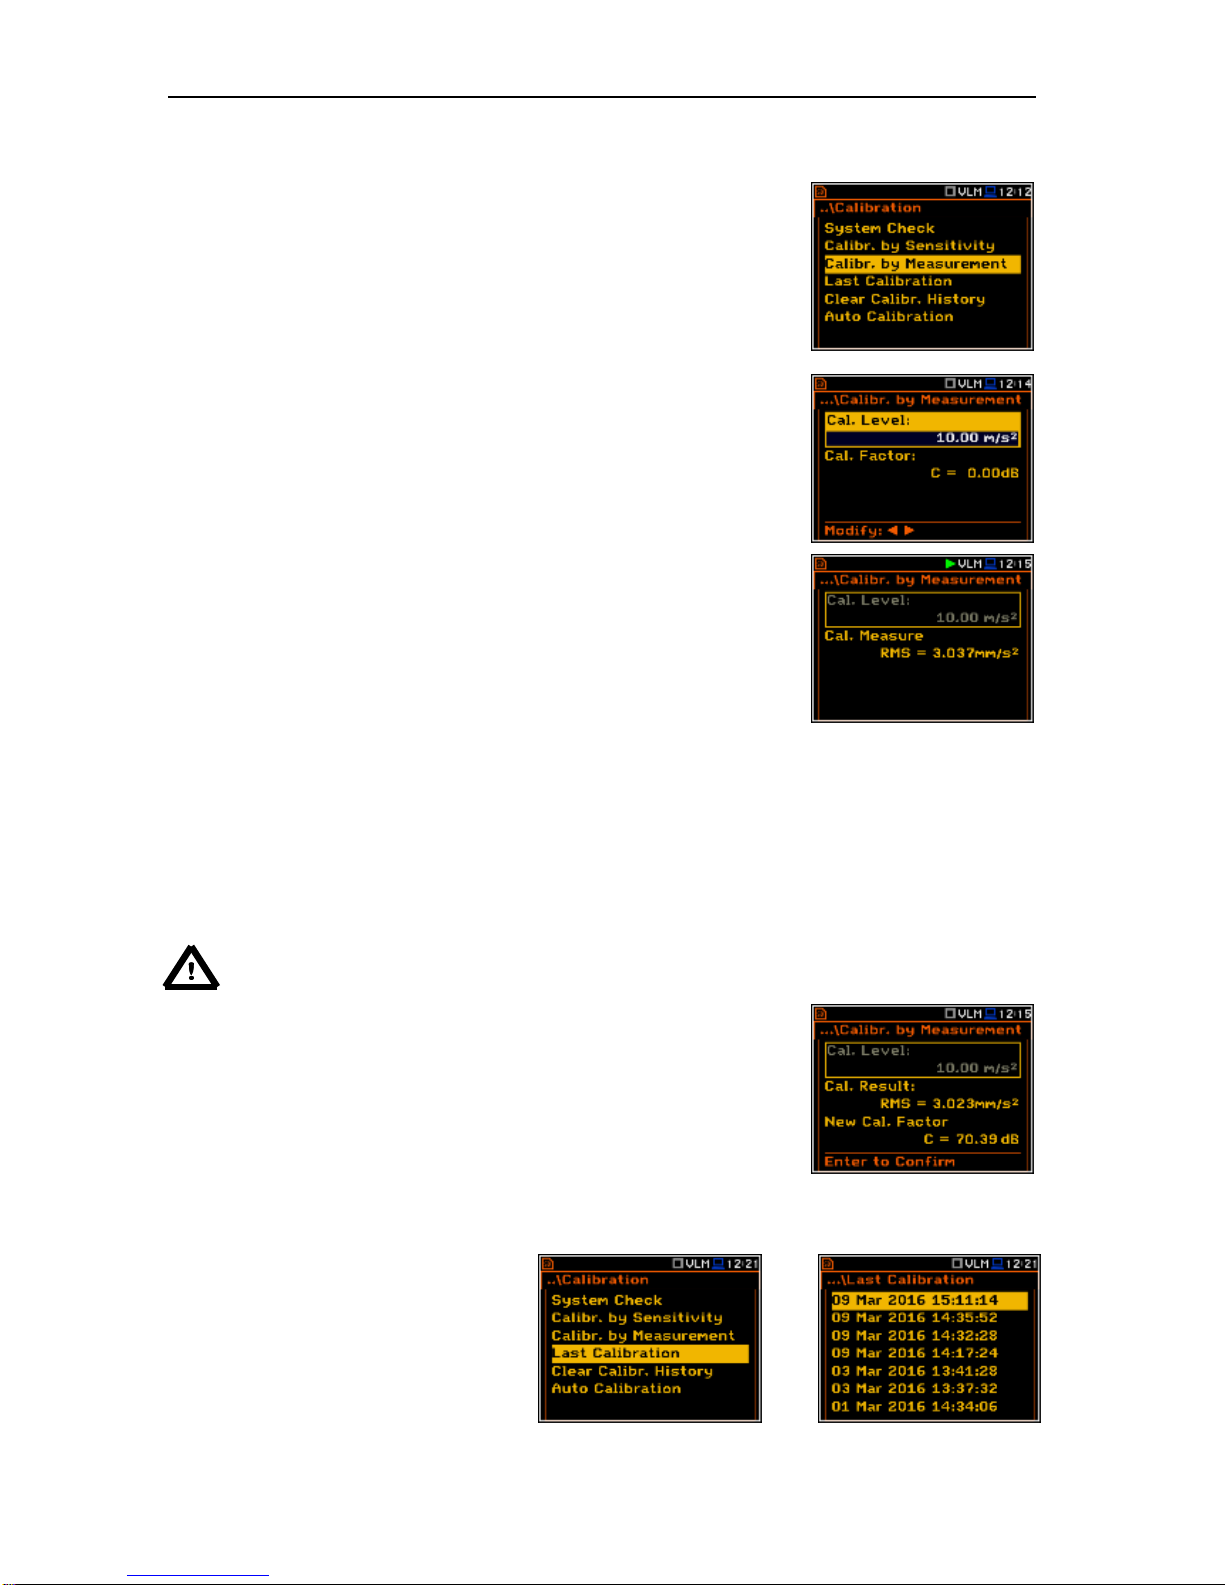
Calibration by measurement for the vibration measurements can be done
in the following way:
1. Select the calibration by measurement (highlight the
Calibr. by Measurement text) from the Calibration sub-list and press
the <ENTER> push-button.
2. Attach the instrument’s accelerometer to the vibration calibrator using
an appropriate or recommended fixing method.
3. Switch on the calibrator and wait approximately 30 seconds before
starting the calibration measurement. The default level for calibration in
the vibration mode is 10 m/s2 at 159.2 Hz. Remember to change this
level if using an alternative vibration calibration signal source.
4. Start the calibration measurement by pressing the <Start/Stop> pushbutton.
The measurement starts without delay. The calibration measurement lasts
until the Leq value became stable (with 0.5 dB tolerance). During the
calibration period the <ESC> and <Pause> push-buttons do not operate but
it is possible to stop the measurement using the <Start/Stop> push-button.
It is recommended to repeat the calibration measurement a few times to ensure the integrity and stability of
the calibration. The obtained results should be almost identical (with 0.1 dB difference). Some possible
reasons for unstable results are as follows:
• the accelerometer is not properly attached to the calibrator,
• there are external disturbances,
• the calibrator or the measurement channel (the accelerometer or the instrument itself) are
damaged.
Notice: During the calibration measurement, the external disturbances (vibrations or acoustic
noise) should not exceed a value of 1/10 of the level of the calibration level signal being used dB.
6. Press <ENTER> in order to accept the measurement result.
The calibration factor is calculated, stored and displayed after pressing the
<ENTER> push-button.
4.3.6. History of the calibrations - Last Calibration
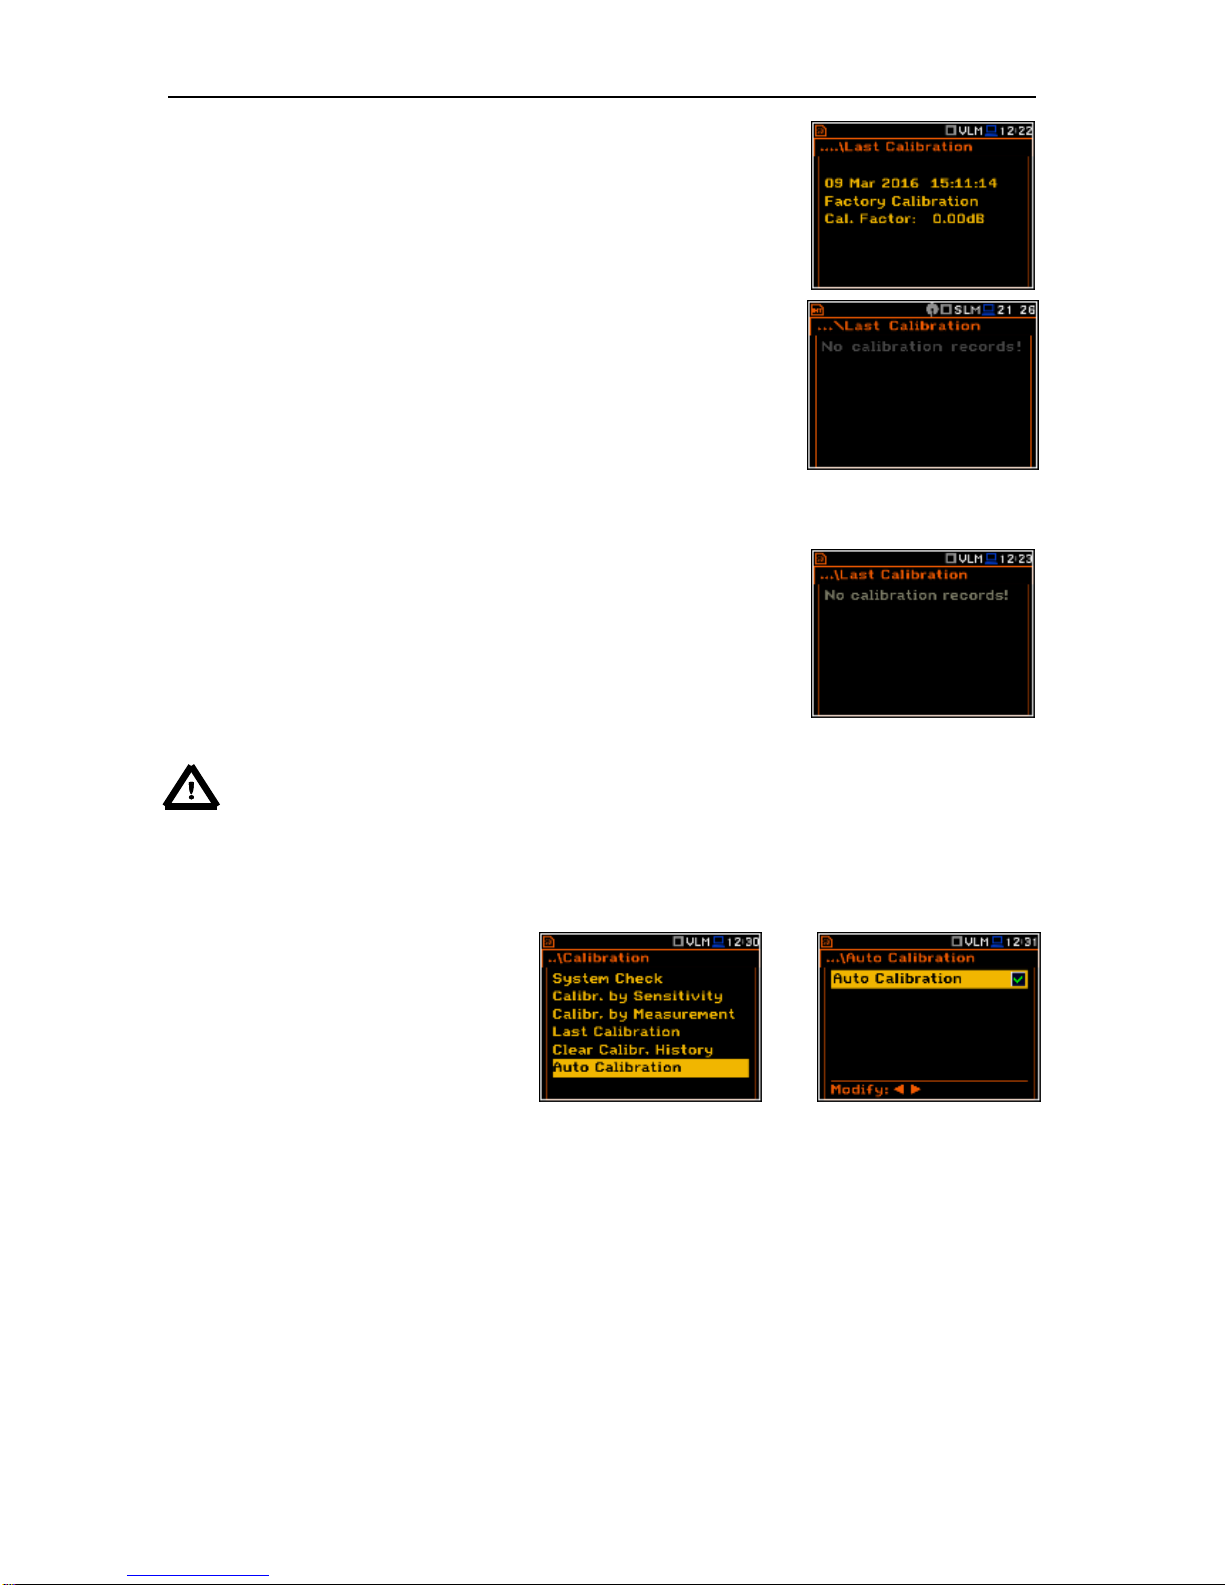
The Last Calibration window displays
records from up to the ten last calibration
records.
<ENT>
Page 30
SVAN 979 USER'S MANUAL_______________________________________________ _30
In order to review the calibration records, the user has to select the required
line in the Last Calibration window and press <ENTER>. The opened
window will contain the date and time of the performed calibration
measurement, the way the calibration was done (Calibr. by Measurement
or Calibr. by Sensitivity), the desired calibration level (Cal. Level) in the
case of the measurements and the obtained calibration factor (Cal. Factor).
If calibration measurements were not performed, the Last Calibration
window does not contain any previous calibration records. The content of
this window is cleared after selection of the default Factory Settings
operation.
4.3.7. Clear calibration records - Clear Calibr. History
The user can clear all stored calibrations records. In order to do this the user
has to choose the position Clear Calibr. History in the Calibration sub-list
and press <ENTER> to perform this operation.
The instrument requests the confirmation of the operation. The next
pressing of the <ENTER> push-button, when the No option is selected,
closes the window and returns the instrument to the Calibration sub-list.
After Clear Calibr. History operation has been performed the
Calibration History window does not contain any more records.
Notice: Both acoustic and vibration calibration histories are stored in the same memory so
clearing the calibration history when in the vibration mode will also clear all acoustic calibration
history information as well.
4.3.8. Automatic calibration – Auto Calibration
The Auto Calibration position enables the
user to perform automatic calibration when
the sound calibrator is attached. In this
case the window Calibration will appear
automatically. If Auto Calibration is
switched off, the user should enter this
window through the Menu.
<ENT>
Page 31
SVAN 979 USER'S MANUAL_______________________________________________ _31
5. MEASUREMENT PARAMETERS SETTING – Measurement
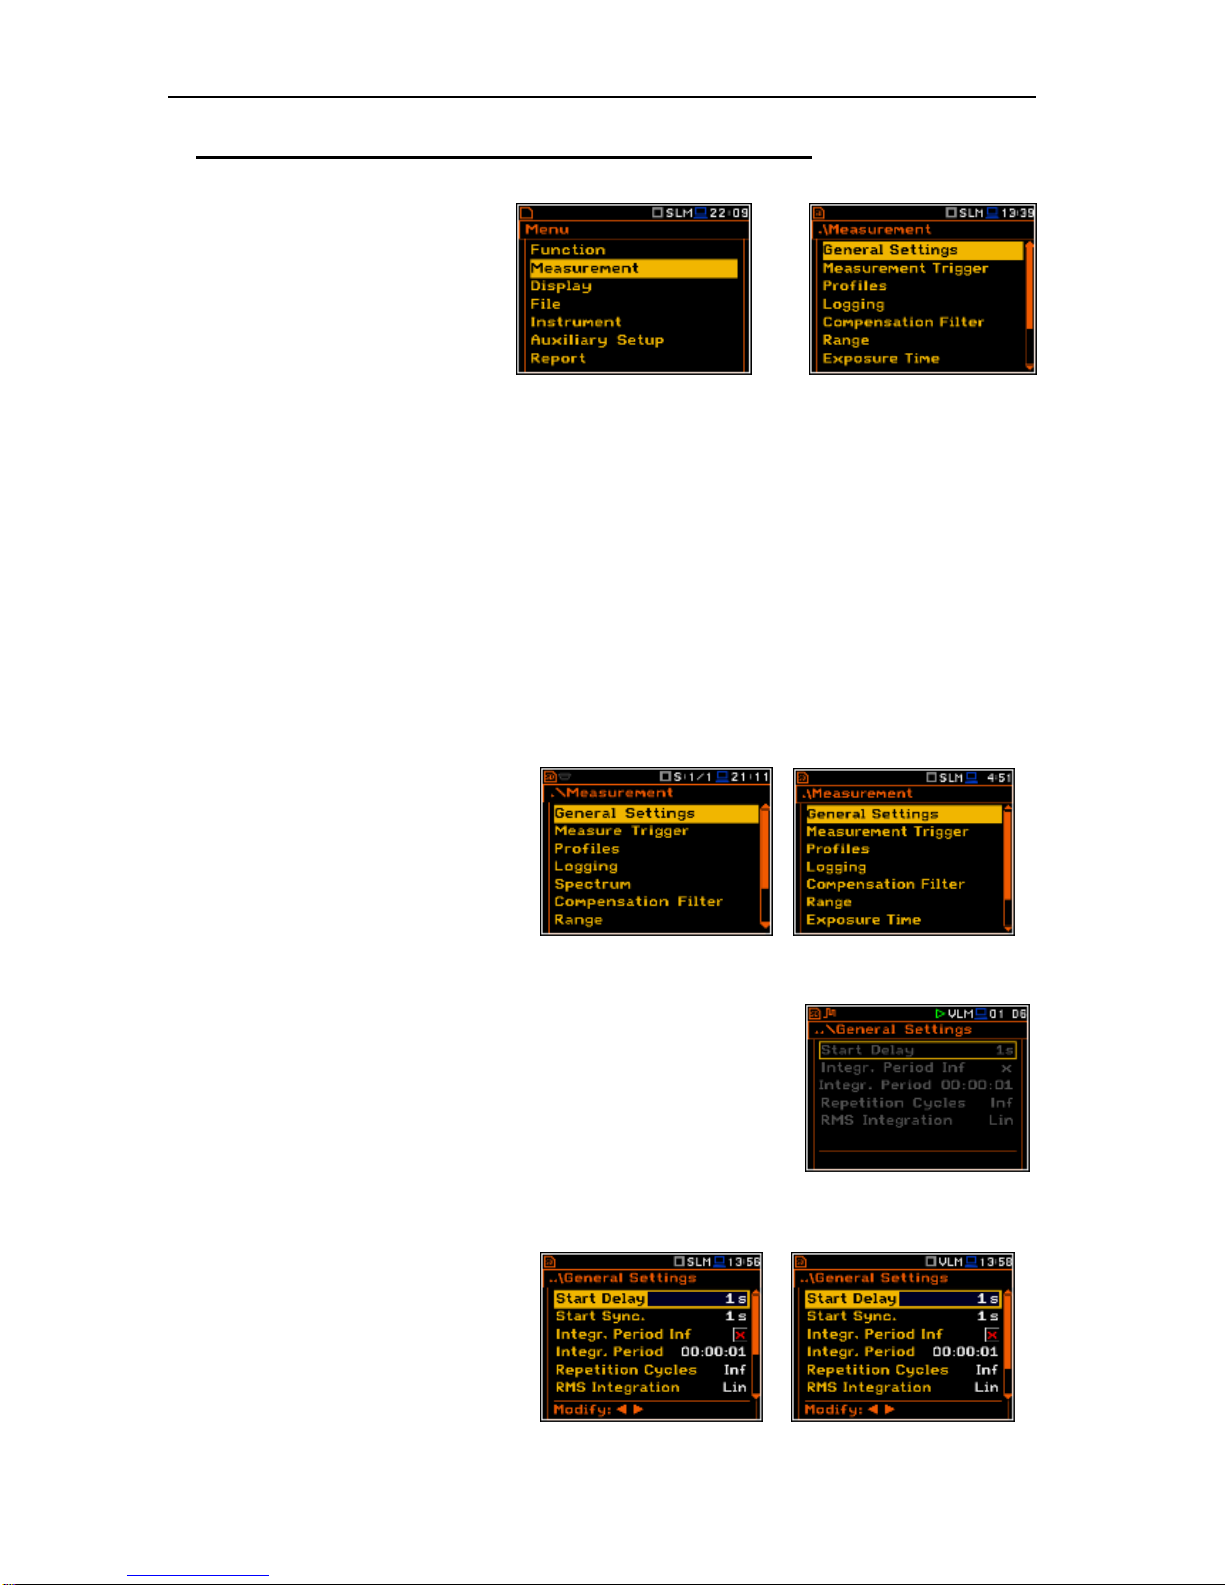
The Measurement list contains the
elements that enable the user to set the
measurement parameters. To open the
Measurement list the user has to press
the <Menu> push-button, select the
Measurement text and press
<ENTER>.
<ENT>
The Measurement list contains the following items:
General Settings enables the user to set various general measurement parameters;
Measurement Trigger enables the user to set up the measurement trigger;
Profiles enables the user to program the profile configuration parameters;
Logging enables the user to program the time history logging function;
Spectrum enables the user to set spectrum analysis parameters;
Compensation Filter enables the user to switch on required microphone compensation filter;
Range enables the user to set the correct measurement range;
Exposure Time enables the user to set the daily exposure time for dose results;
Statistical Levels enables the user to define 10 statistical LN% levels;
Timer enables the user to program the internal delay start/stop timer.
The content of the Measurement list is
different for different Mode and
Measurement Function and other
settings. The Measurement lists for
Direct Sound and Direct Vibration
modes are identical to Sound Meter
and Vibration Meter modes
accordingly. Some examples for
different modes and measurement
functions are presented.
Any parameter in the Measurement list can be changed only when the
instrument is not currently executing a measurement. The parameters are
displayed with grey colour. The blinking “►” icon on the top row indicates
that the instrument is performing a measurement.
5.1 Selection of measurement parameters - General Settings
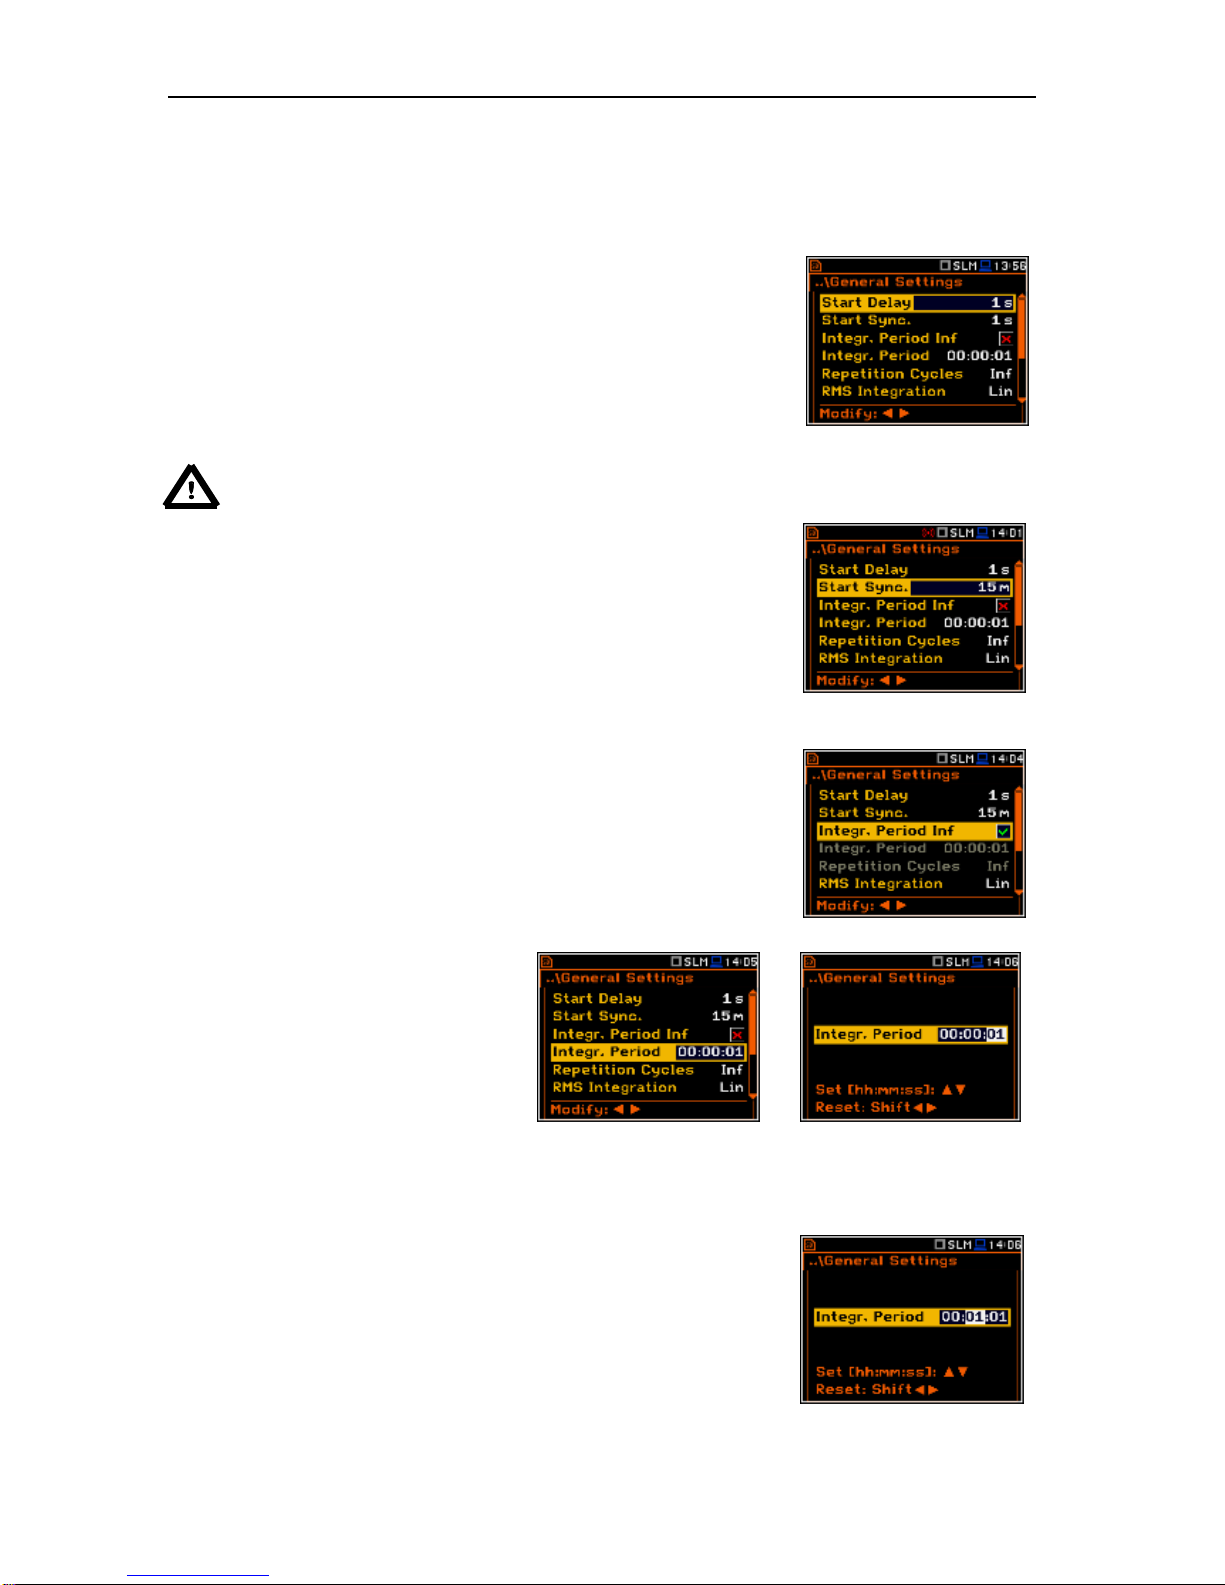
The General Settings list consists of
the following parameters: the delay of
the start of measurements
(Start Delay), the maximum delay
period for the synchronization with RTC
(Start Sync.), the integration period /
measurement run time
(Integration Period), the repetition of
Page 32
SVAN 979 USER'S MANUAL_______________________________________________ _32
the measurement cycles
(Repetition Cycles), the RMS detector
type (RMS Integration) and the
intervals for day time period
(Day Time Limits) in case of Sound
modes.
Setting time delay before the start of measurements
The Start Delay position defines the delay period from the moment the
<Start/Stop> push-button is pressed to the start of the actual
measurements (the digital filters of the instrument constantly analyse the
input signal even when the measurement is stopped). This delay period
can be set from 0 second to 60 seconds (with 1 second step by means
of the <>, <> push-buttons and with 10 seconds step by means of the
<>, <> push-buttons pressed together with <Shift>.
Notice: The minimum delay period is equal to 0 second. In the Calibration mode, the delay
period is always equal to 3 seconds.
Setting synchronisation of the measurement start
The Start Sync. position defines maximum delay period from pressing
the <Start/Stop> push-button to the start of the measurements to allow
synchronisation with the instrument’s RTC. The Start Sync. parameter
can be set as: Off, 1s, 1m, 15m, 30m and 1h. For example, if 1h was
selected, then each measurement starts from the first second of next real
time hour after pressing <Start/Stop> push-button, and then each hour
after Integr. Per, if Rep. Cycles is greater than one. The default value is
set to Off.
Switching on/off the integration period settings
The integration period can be set as infinite or can be defined together
with the Repetition Cycles number. The Integr. Period Inf position
defines if the period during which the signal is being measured is infinite
or not. If the Integr. Period Inf parameter is switched on then the signal
will be averaged all the time until the <Stop> push-button is pressed and
the measurement is stopped (1 continuous cumulative result). If
integration period is infinite, then two next positions become inactive.
Setting the integration period
The Integr. Period position (integration
period) defines the period during which
the signal is being measured
(integrated). The integration period can
be set in the special window, which is
opening by pressing the <> or <>
push- buttons.
<>
The measurement will stop automatically after this period, or the measurement will start again when the
selected Repetition Cycle is greater than 1 (one). The definitions of the measurement results in which the
integration period is used is given in App. D.
To set the integration period the user should define the required hours,
minutes and seconds field.
▪ The appropriate field may be selected by pressing the <> or <>
push- buttons.
▪ Value of hour, minute and second is changed by means of the <>
or <> push- buttons.
Page 33
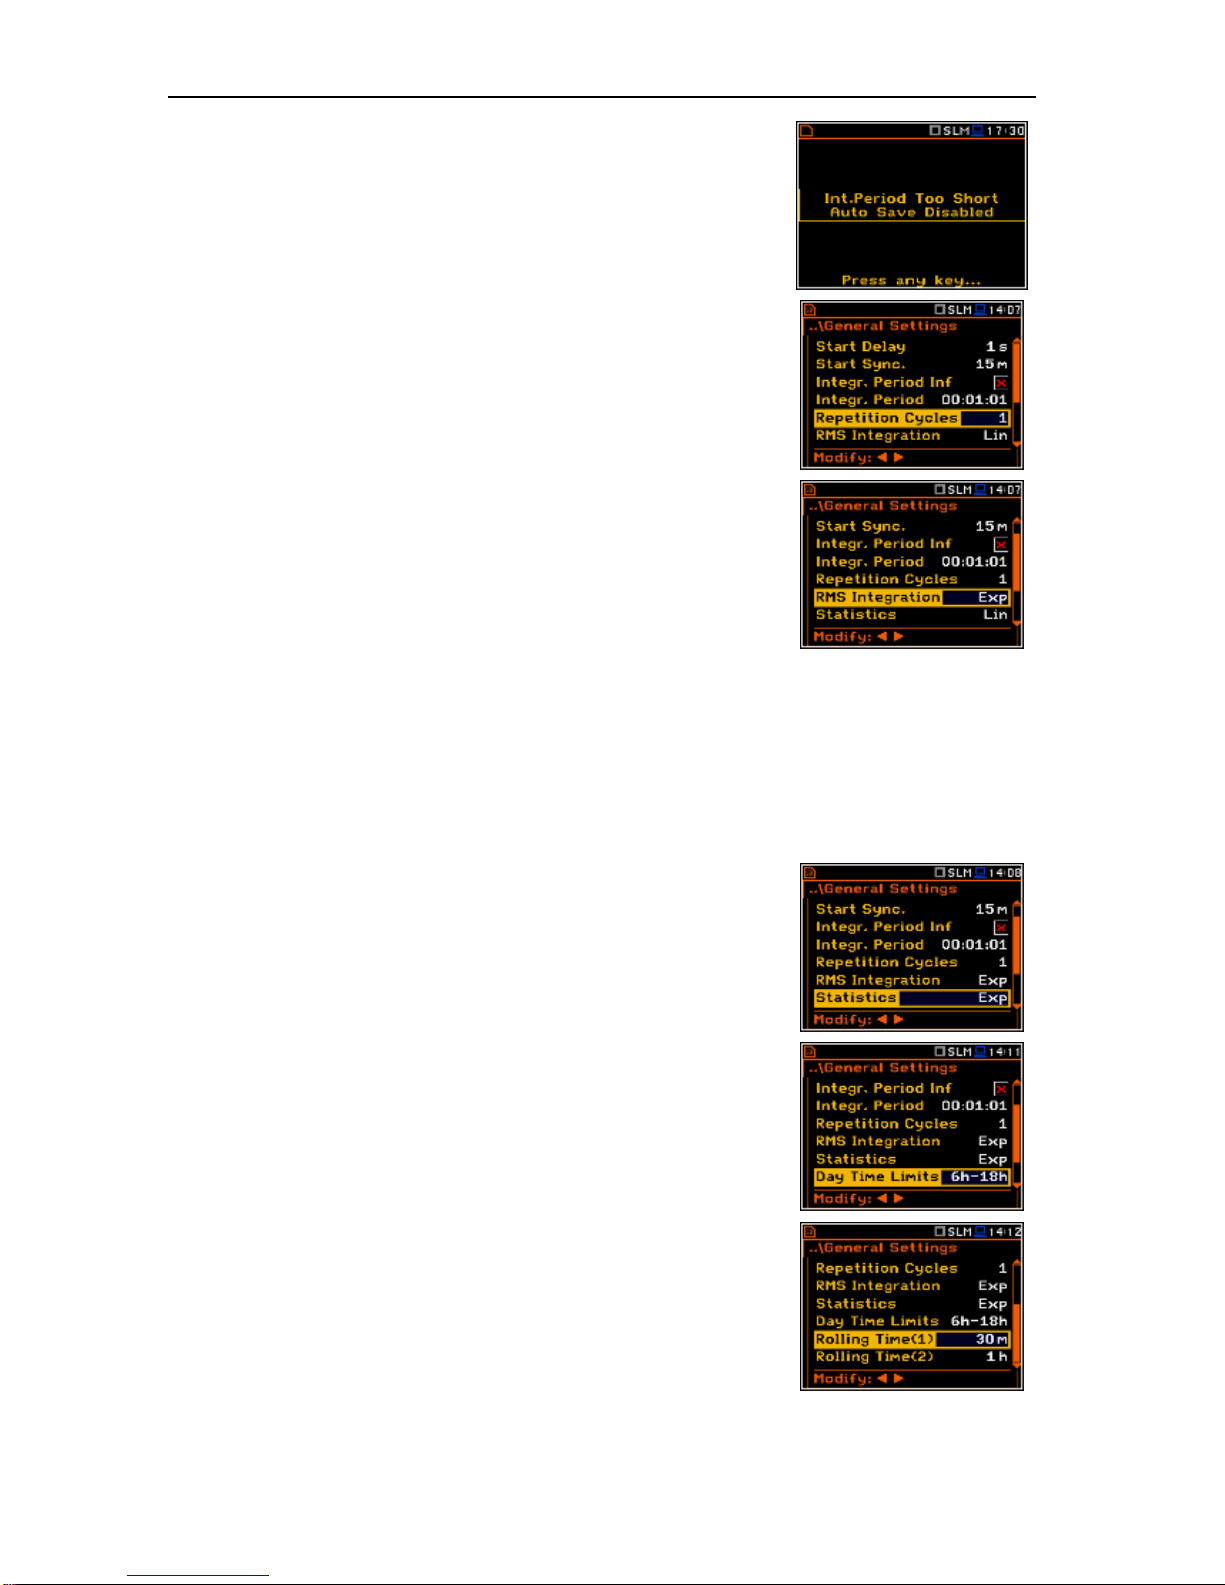
SVAN 979 USER'S MANUAL_______________________________________________ _33
If the user uses the Auto Save option (path: <Menu> / File /
Save Options / Auto Save) the integration period value has to be greater
or equal than 10 seconds. When the Auto Save option was switched on
and new entered integration period value is less than 10 seconds
Auto Save option switches off and the Int. Period Too Short /
Auto Save Disabled message appears on the display.
Setting the repetition number of measurement cycles
The Repetition Cycles position defines the number of cycles (with the
measurement period defined by Integr. Period) to be performed by the
instrument. The Repetition Cycles number values are within the limits
[1, 1000].
Detector’s type selection
The RMS Integration position defines the detector type for the
calculations of the Leq, Lden, LEPd, LN% and Sel functions. Two
options are available: linear (Lin) and exponential (Exp). The formulae
used for the Leq calculation are given in Appendix D.
Selecting Lin is required to obtain the true RMS value of the measured signal. When this option is selected
the value of the Leq, Lden, LEPd, LN% and Sel functions do not depend on the detector time constant:
Fast, Slow or Impulse (the results are displayed without the indicator of the detectors selected in the
profiles). In this case, the indicator Lin. (or L) is displayed in the different modes of the result presentation.
Selecting Exp enables the user to fulfil the requirements of another standard for the time averaged Leq
measurements. When this option is selected the value of the Leq, Lden, LEPd, LN% and Sel function
depends on the detector time constant (Slow, Fast, Impulse). The results are displayed with the indicator
of the detectors selected in the profiles (path: <Menu> / Measurement / Profiles).
Statistic calculation
The Statistics position defines the method for calculation of the
statistical results.The statistics for profiles will be calculated based on
RMS results with linear detector (Lin) or exponential detector (Exp), e.g.
Impulse, Fast or Slow, defined in the Profiles list.
Day time limits selection
The Day Time Limits position appears only in Sound modes and
enables the user to select the definition of the day and night periods
required by the local standards. These limits are used for the calculation
of the Lden function (cf. App. D for the definition).Two options are
available: 6H–18H and 7H–19H.
The Rolling Time(1 & 2) parameters define „time frame” for "Rolling
Leq" calculation. The Rolling Leq are presented as LR+<time frame>.
For example, if the Rolling Time is equal to 30 minuts, the appropriate
result will be named as LR30 and will be calculated each second as Leq
of last 30 minuts. If the Rolling Time is in seconds, for example is equal
to 50s, the result name will have letter "s" in the end (LR50s), to make it
different from 50 minuts LR50.
Page 34
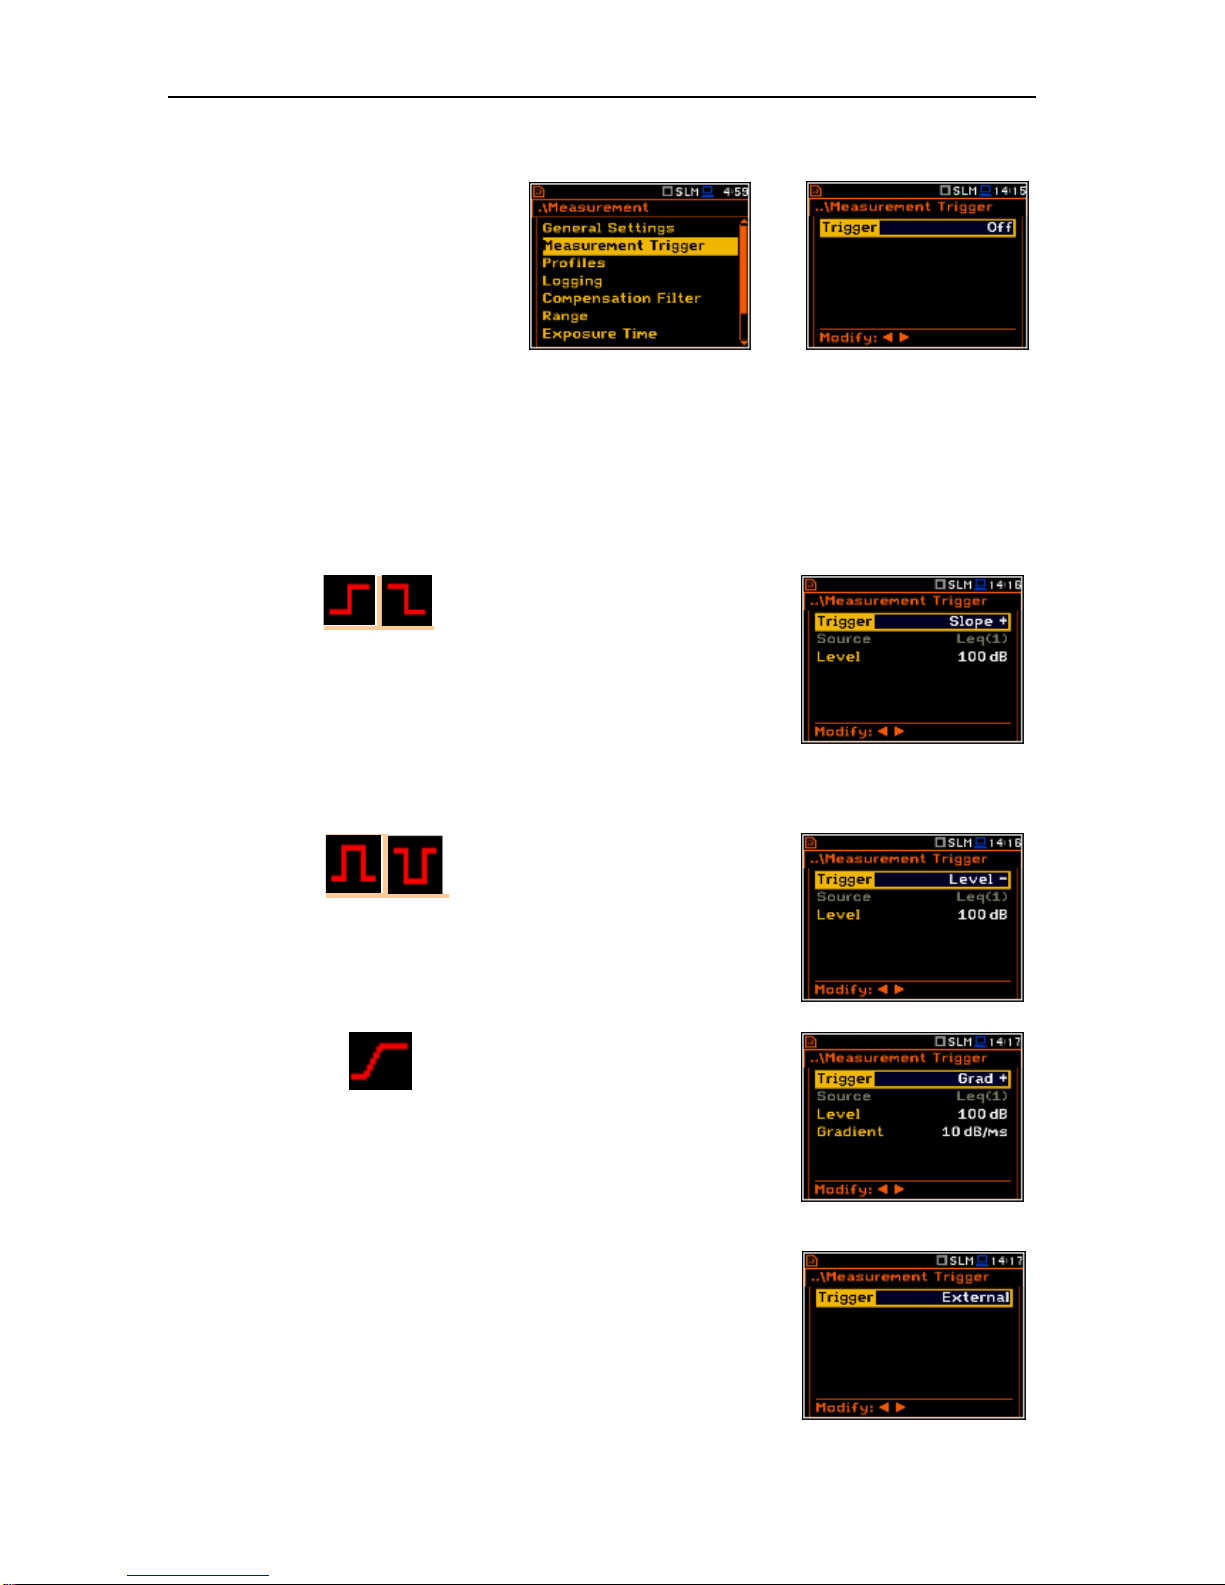
SVAN 979 USER'S MANUAL_______________________________________________ _34
5.2 Measurement Trigger parameters selection – Measurement Trigger
The Measurement Trigger sub-list
enables the user to set the parameters
for the Measurement Trigger. The
Measurement Trigger is a context sublist in which the triggering can be
switched off or on (Trigger), when the
source of the triggering signal can be
determined (Source), using its level
(Level) and sometimes also the speed
of changes (Gradient). Triggering of the
measurement (Trigger) can be switched
off using the <> push-buttons.
<ENT>
Triggering is switched on if one of its six available modes is selected: Slope +, Slope –, Level +, Level –,
Grad + or External. If the instrument works with the triggering switched on, the appropriate icon appears on
the display when the triggering condition is not fulfilled.
The triggering condition is checked every 0.5 milliseconds. This parameter (Trigger period) is constant and
is displayed inversely.
Slope type trigger
When Slope + is selected, the measurement starts when the rising result
value (Source) passes above the level determined by the selected
decibel Level. When Slope – is selected, the measurement starts when
the falling result value (Source) passes below the level determined by
the selected decibel Level. The measurement is stopped when the
conditions set in the General Settings sub-list are fulfilled or after
pressing the <Start/Stop> push-button or after receiving the proper
control code remotely.
Level type trigger
When Level + or Level – is selected for the measurement the triggering
condition is checked every 0.5 millisecond. The measurement is recorded
only when the result value (Source) has the greater/ lower level than that
determined in the Level position otherwise the measurement result is
skipped.
Gradient type trigger
When Grad + is selected the triggering condition is checked every 0.5
millisecond of the measurement. The measurement is recorded only
when the result value (Source) has a greater level than that determined
by the selected decibel Level and the gradient of the signal is greater
than determined in the Gradient position. Otherwise the measurement
result is skipped.
External type trigger
When External is selected the triggering is done by the signal on the I/O
socket. In this case it is necessary to set up the I/O Mode parameter as
Digital In (path: <Menu> / Instrument / Multifunction I/O). In the other
case the measurement result is skipped.
Page 35
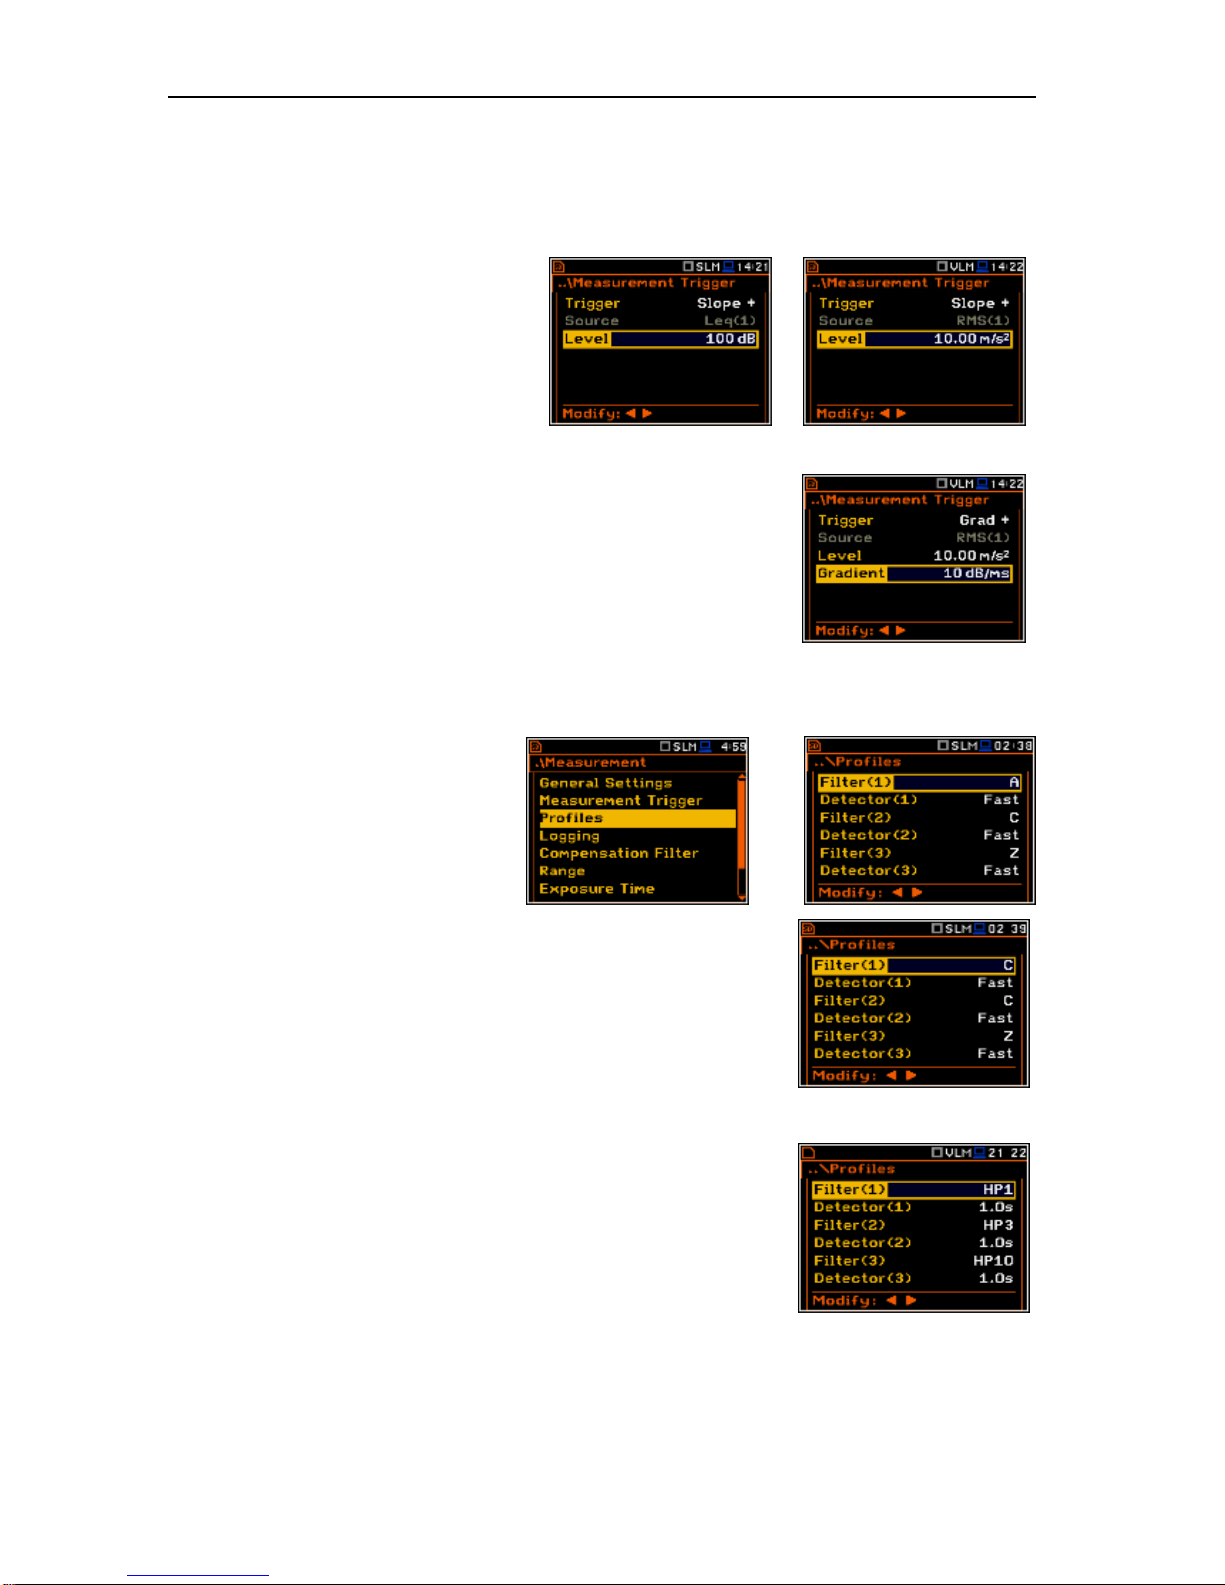
SVAN 979 USER'S MANUAL_______________________________________________ _35
Selection of the triggering signal
It is assumed that only one measured result can be used as a source of the triggering signal in the
Level Meter mode, namely the output signal from the RMS detector coming from the first profile which is
denoted here as Leq(1). This position does not become active (it is not displayed inversely) and the text
stated here remains unchanged. After pressing there the <> push-button, the Source line is skipped.
Setting the level of the triggering signal
The level of the triggering signal (Level)
can be set in 1 dB step (or 10 dB steps)
from 24 dB to 136 dB range. The Level
value of the triggering signal refers to the
instantaneous value of the RMS result
from the first profile calculated during the
period depending on selected Detector
(path: <Menu> / Measurement / Profiles ).
Setting the speed of the triggering signal changes
This position appears when the Grad+ trigger is chosen. The speed of
change of the triggering signal (Gradient) can be set within the range
from 1 dB/ms to 100 dB/ms.
5.3 Setting parameters in a profile – Profiles
In the Profiles sub-list the following
parameters can be programmed
independently for each user defined
profile: weighting filter (Filter) and RMS
detector type (Detector).
<ENT>
Weighting filter selection
Sound measurements
• Z type 1 according to IEC 61672-1 standard,
• A type 1 according to IEC 651 and IEC 61672-1 standards,
• C type 1 according to IEC 651 and IEC 61672-1 standards,
• B type 1 according to IEC 651 standard,
• G according to ISO 7196:1995 standard.
• R1, R2, R3 if the Real Time Filters are activated in the Setup list
(path: <Menu> / Auxiliary Setup / User Filters / Real Time Filters)
Vibration measurements
▪ acceleration measurements: Z, HP1, HP3, HP10, Wh,
▪ velocity measurements: Vel1, Vel3, Vel10 and VelMF,
▪ displacement measurements: Dil1, Dil3 and Dil10.
Page 36
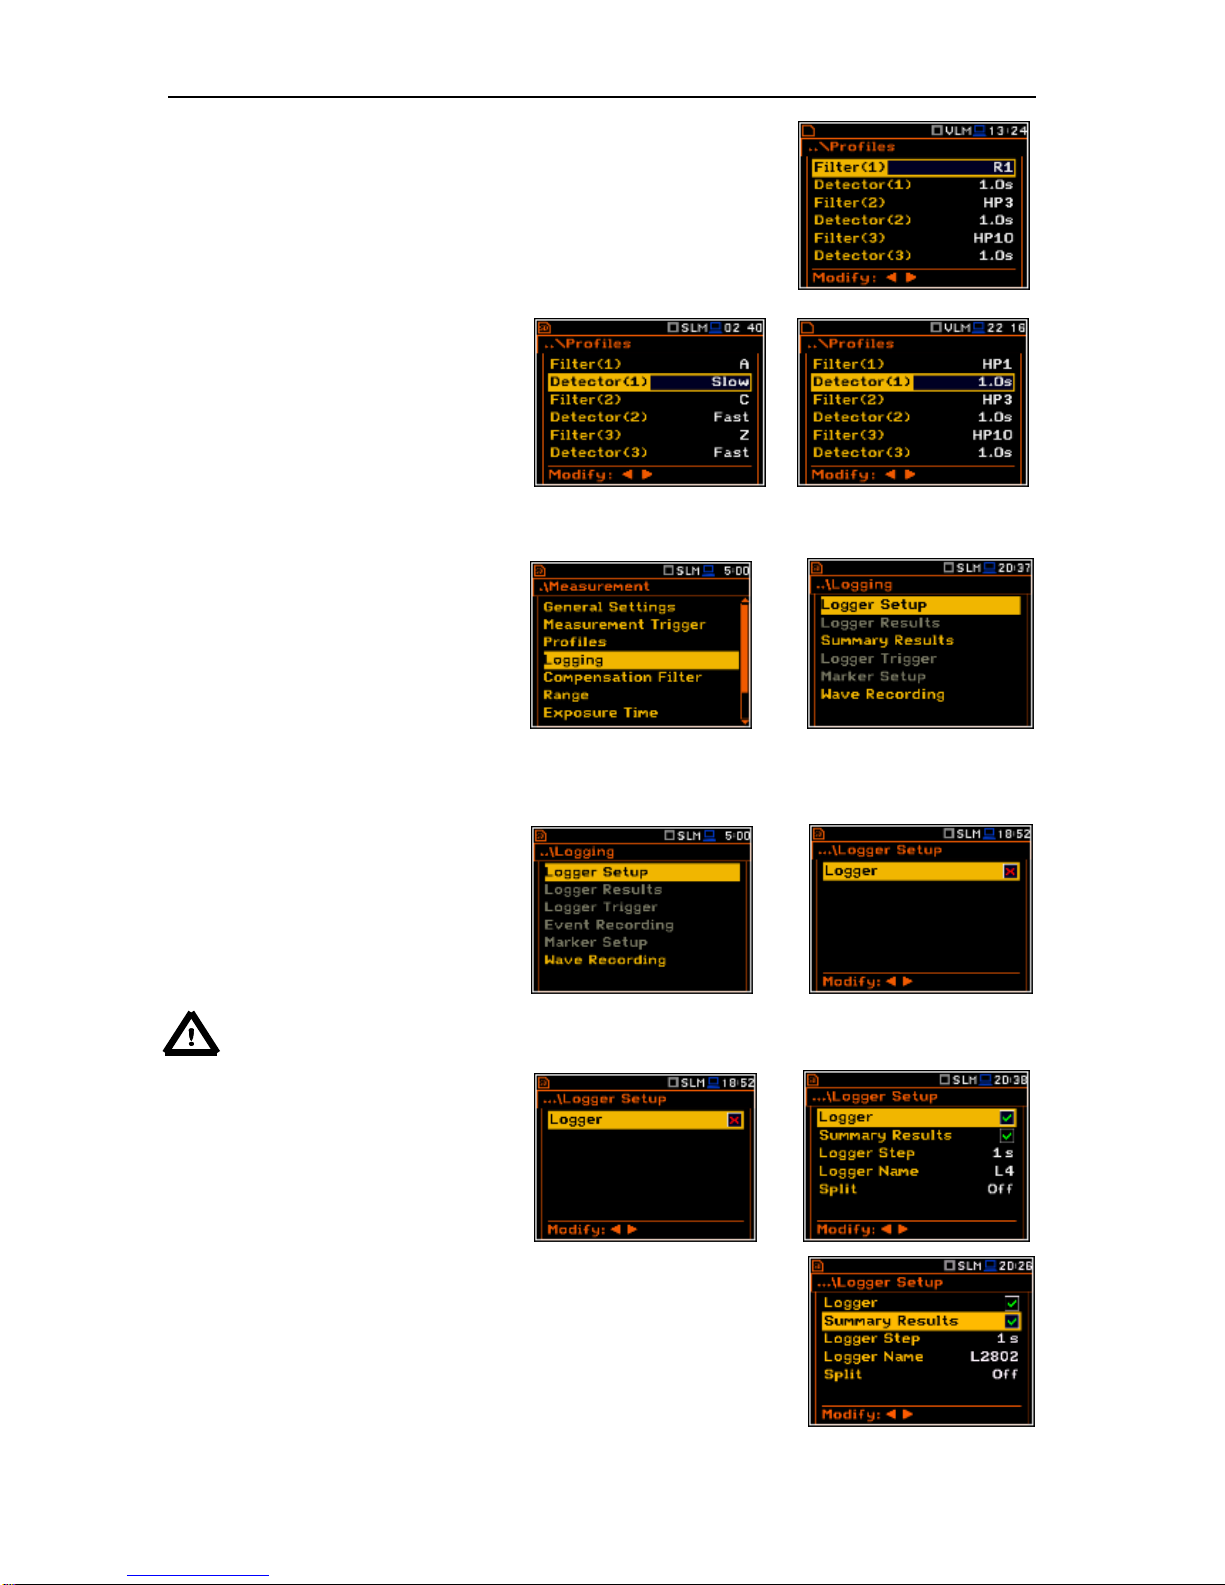
SVAN 979 USER'S MANUAL_______________________________________________ _36
For all types of signal it is possible to use real time filters R1, R2, R3 if
they are activated in the Setup list (path: <Menu> / Setup / User Filters
/ Real Time Filters)
The characteristics of the filters are given in App. D.
The Real Time Filters for the SVAN 979 are an extra cost option, part
number SV 979-16.
RMS detector selection
The following RMS detectors are
available in the instrument: Impulse,
Fast and Slow (in the case of Sound
measurements) and 100ms, 125ms,
200ms, 500ms, 1.0s, 2.0s, 5.0s, 10.0s
(in the case of Vibration measurements).
5.4 Setting the data logging functionality – Logging
The Logging list enables the user to
program the logger functions: the
recording of the measurement time
history results (TH) and program the
markers and parameters of the event or
signal (wave) recording. The Logging list
consists of five positions: Logger Setup,
Logger Results, Logger Trigger,
Marker Setup and Wave Recording.
<ENT>
5.4.1 Data logger programming – Logger Setup
The Logger Setup list enables the user
to activate logger functionality and meteo
results logging. It also allows the user to
edit the name of the logger file and to set
the logger interval step.
<ENT>
Notice: If Logger is Off, logger files are not created and the time history results are not
saved!
The Logger position switches on and off
the functionality, which enables the user
to save selected results from the three
user profiles with the defined interval
selected in Logger Step.
<>
The Summary Results position allows the user to select or deselect the
saving of the full set of profile results that the instrument generates during
total measurement time and which are not belonged to the time history
data.These results are: Spl, Leq, Sel, Lden, LEPd, Ltm3, Ltm5, LN%,
LR15, LR60, Ovl, Peak, Max, Min, in case of sound measurements or
RMS, Ovl, Peak, P-P in case of vibration measurements. In addition to
abowe mentioned results it is possible to add summary meteo results,
Page 37
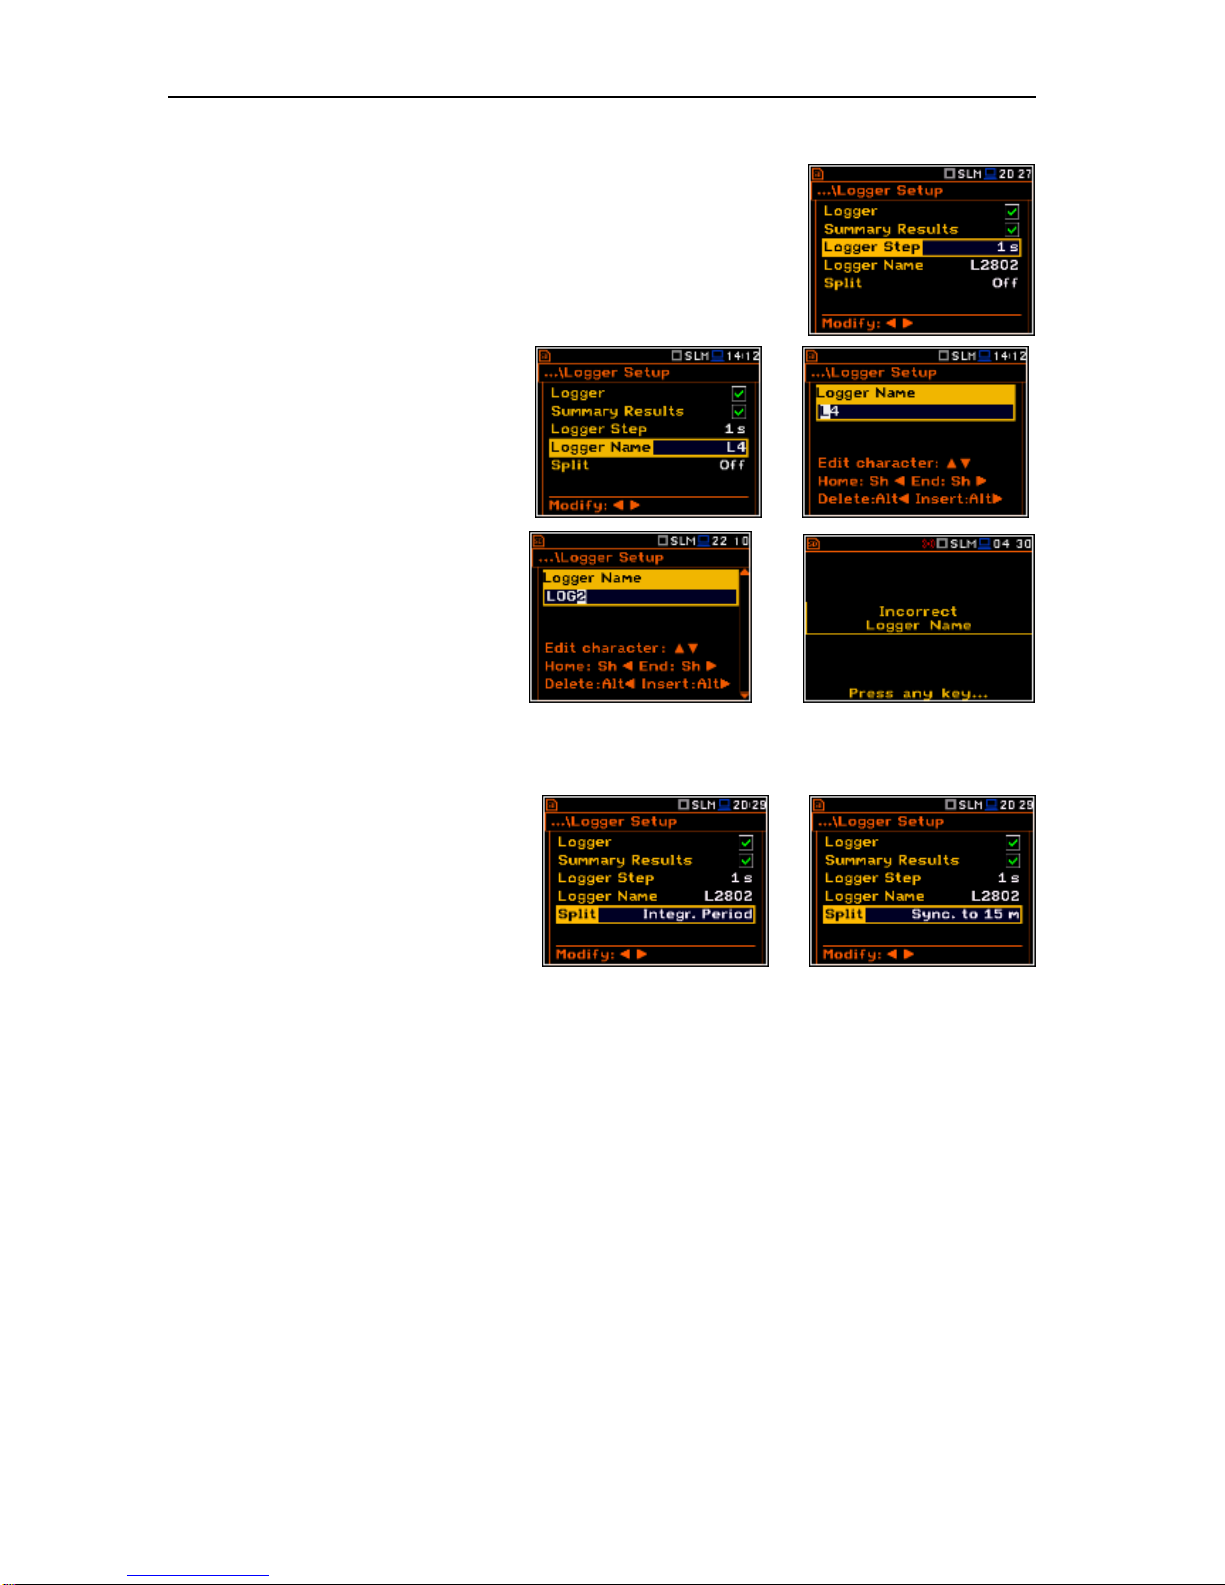
SVAN 979 USER'S MANUAL_______________________________________________ _37
Statistics and Spectra, from the Summary Results list, which became
active in the Logging list.
The Logger Step defines the period of the data logging in a file. It can be
set from 2 milliseconds to 1 second in 1, 2, 5 sequences, the values from
1 second to 59 seconds, the values from 1 minute to 59 minute and 1 hour.
The Logger Name position enables the
user to define the logger file name. The
default name is LOG. The name can be
up to eight characters long. After
pressing the <>, <> push-buttons,
the special window with text editing
function is opened.
<>
The edited name is accepted and saved
after pressing the <ENTER> pushbutton. The special warning is displayed
in case a file with the edited name
already exists in the memory. The
instrument waits then for a reaction of the
user (any push-button should be pressed
except <Shift> or <Alt>).
<ENT>
The Split position enables the user to split the logger registration data into separate files. If Split parameter
is Off the registration of time history data will be continuously performed in one logger file with the name
defined in the Logger Name position.
In other cases the registration is performed
in separate files and the registration period
is equal to: integration period
(Integr. Period), 15 minute
(Sync. to 15m), 30 min (Sync. to 30m)
and 1 hour (Sync. to 1h). Every time when
registration period is achieved the logger
file is closed and new file with the
increased by one name number is opened
for subsequent measurement data.
<>
The main measurement results (cf. App. B) are calculated during the period set in the Integration Period.
These results can be saved in the result files by means of the <Save> button or the <New File> function
(path: <Menu> / File / File Manager).
When the Logger is switch on and the logging results have been defined, then in parallel with measurements
during Integration Period results, the partial measurement results are saved in the file with the interval step,
defined by Logger Step parameter. Up to 18 results can be logged simultaneously from three independent
user defined profiles of the instrument (Peak / Max / Min / Leq / LR15 / LR30 for sound measurements or
Peak/ P–P/ Max/ RMS for Vibration measurements) with time step down to 2 ms. These results are saved in
the logger file in the external memory in all modes and functions of the instrument. The recording in the
logger’s memory is stopped after the period, which is equal to Integration Period multiplied by
Repetition Cycles, after pressing the <Start/Stop> push-button or after stopping the measurements
remotely.
Page 38
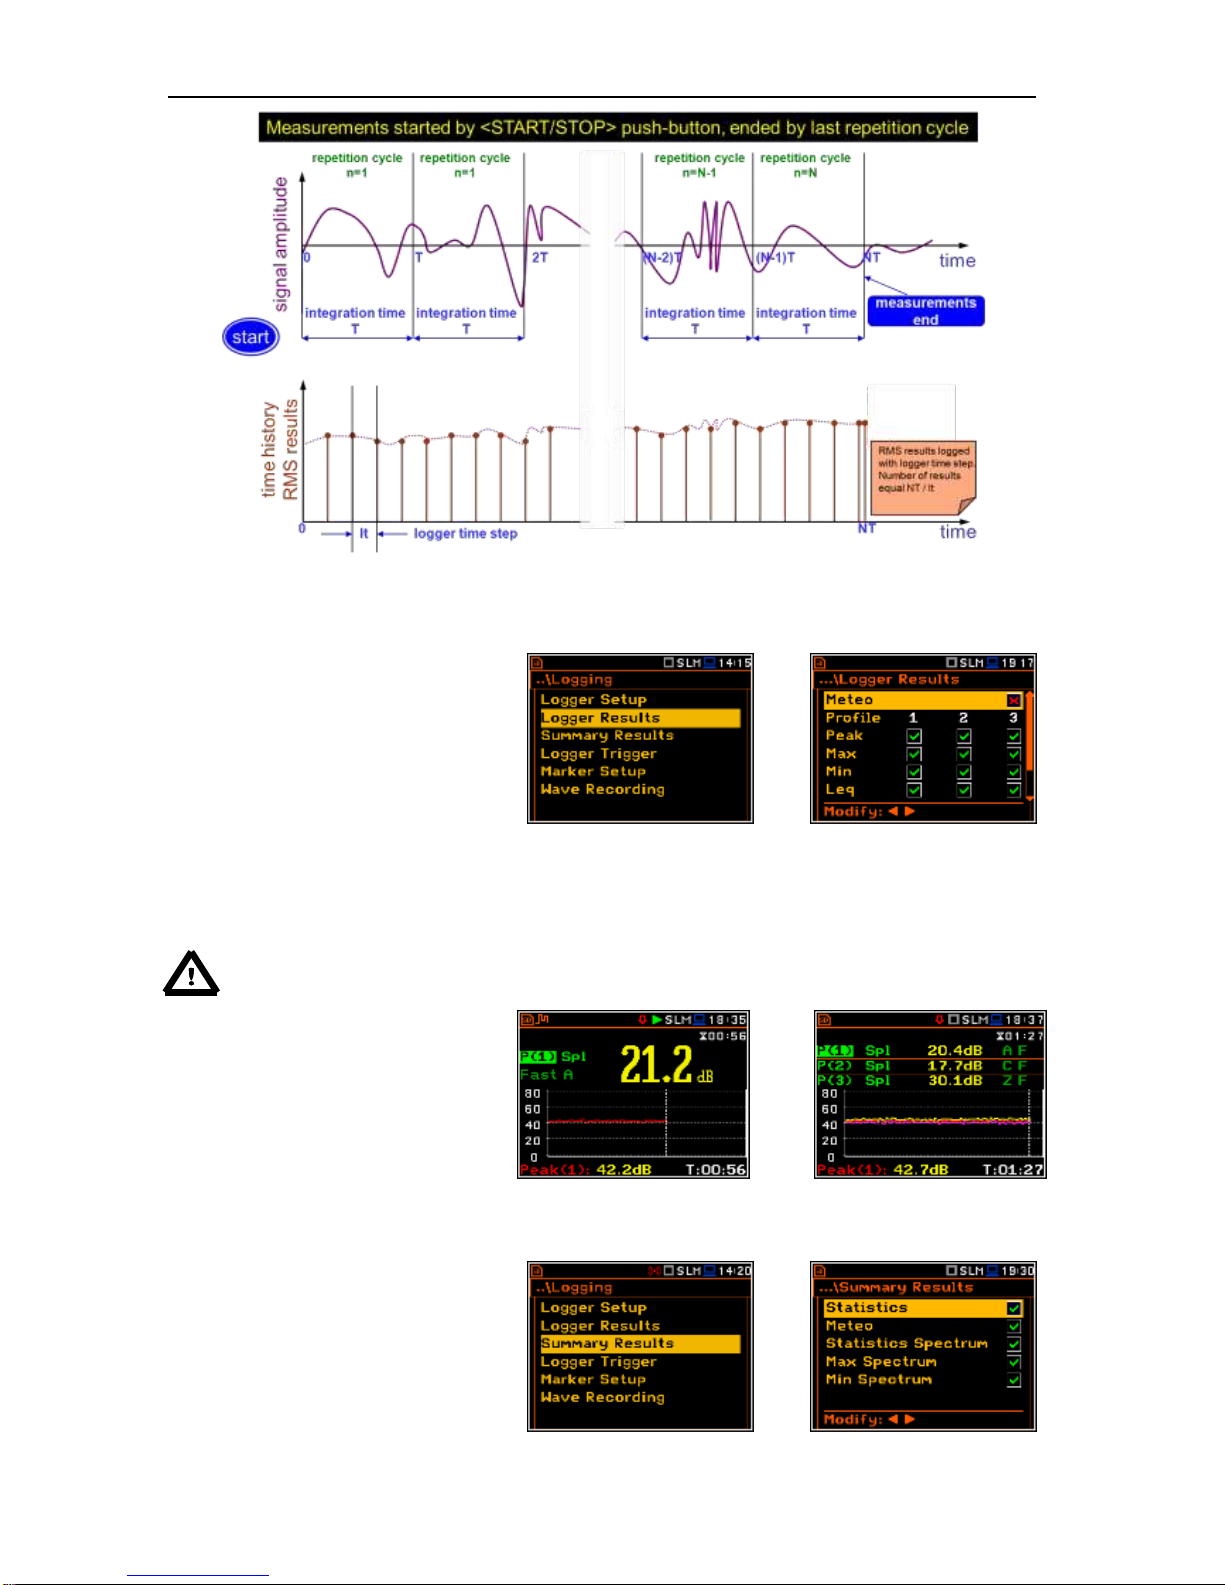
SVAN 979 USER'S MANUAL_______________________________________________ _38
Relations between Integration Period and Logger Step
5.4.2 Results selection – Logger Results
The Logger Results list enables the
user to activate the results for three
independent user defined profiles (Peak,
Max, Min, Leq, LRxxx and LRyyy for
acoustic measurements and Peak, P-P,
Max and RMS for vibration
measurements) and results taken from
the meteo module (Meteo) which will be
recorded to the logger file during the
measurement period.
<ENT>
Activation / deactivation can be done by means of the <>, <> push-buttons pressed together with <Alt>.
The position is changed by means of <>, <> and <>, <> push-buttons.
Notice: When Logger is switched off or there are no results for logging, the logger plot
cannot be activated in Disp. Modes and accordingly doesn’t appear on the display.
When Logger is switched on and with
selected results for logging, the logger
plot will be available in all visualisation
modes.
<Alt/>
5.4.3 Selection of the summary results to be saved in the logger file – Summary Results
The Summary Results list became
active if Summary Results position in
the Logger Setup list is switched on and
enables the user to activate additional to
the main results saving in the logger file:
Statistics, Meteo, Statistics Spectrum,
Max Spectrum and Min Spectrum for
the acoustic measurements and Meteo,
<ENT>
Page 39
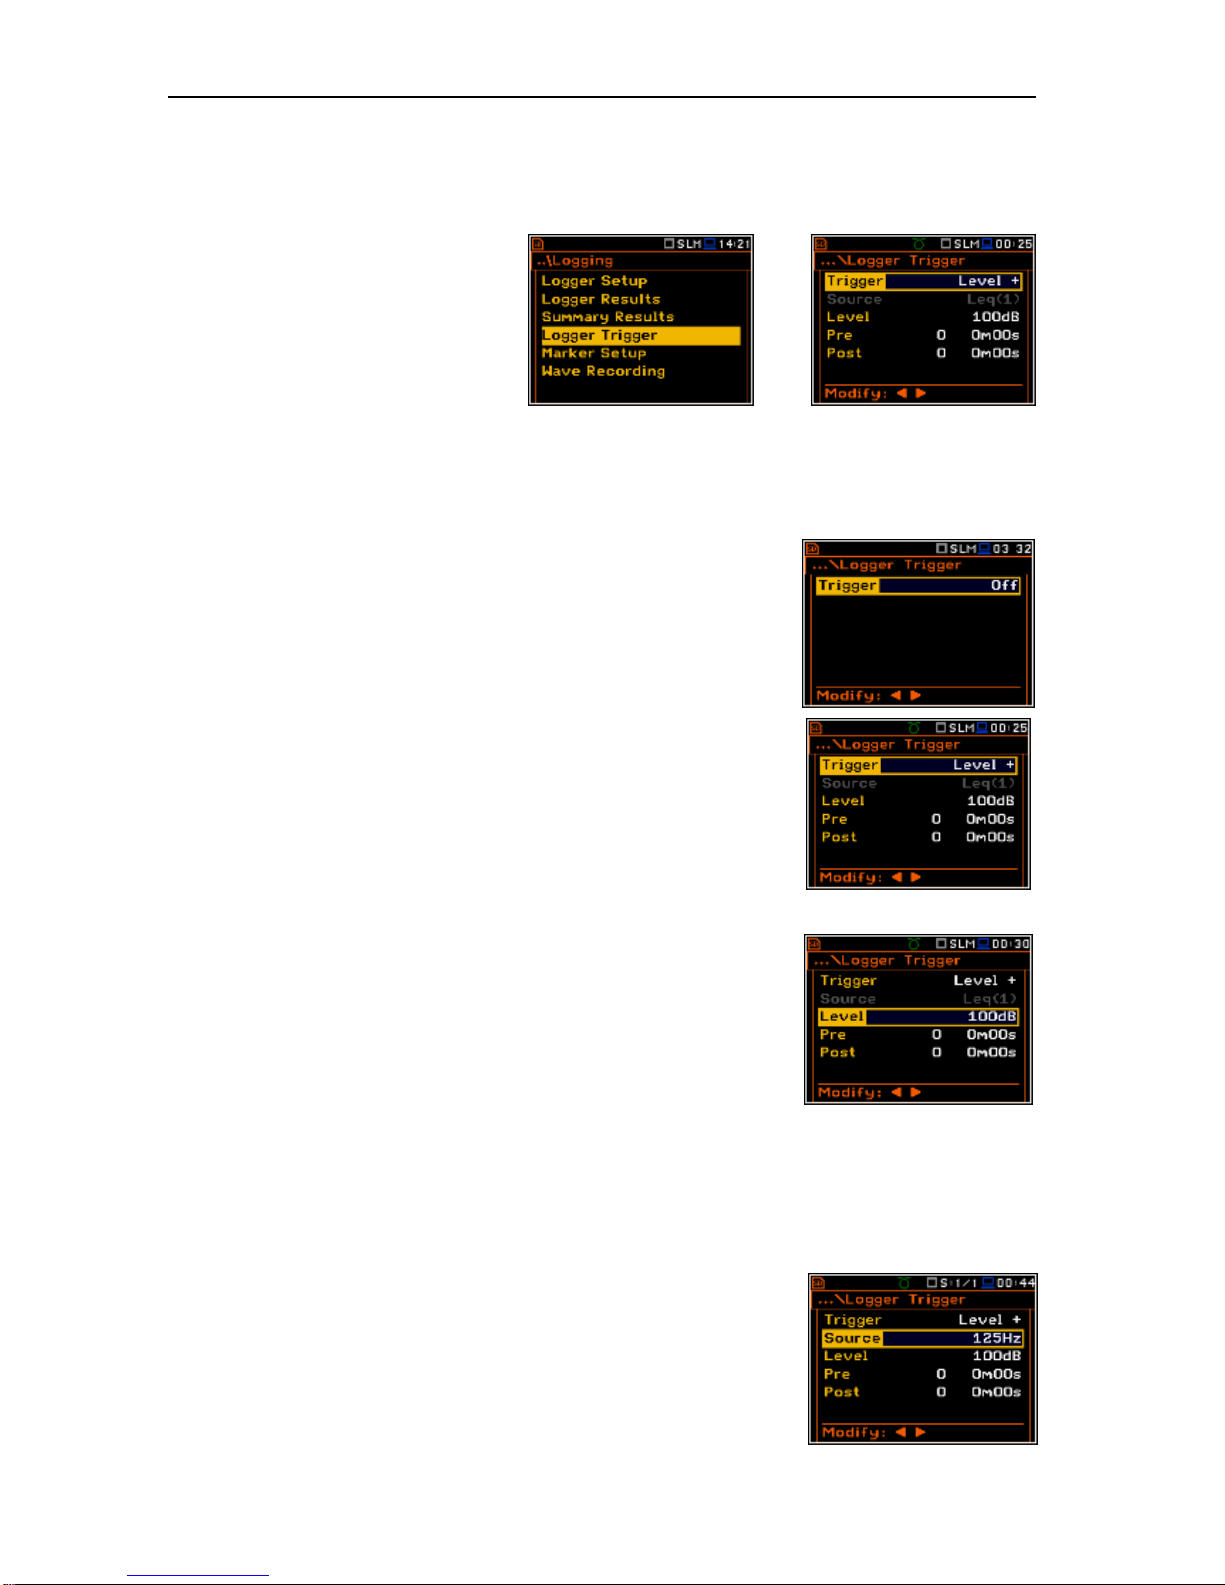
SVAN 979 USER'S MANUAL_______________________________________________ _39
Max Spectrum and Min Spectrum for
the vibration measurements.
5.4.4 Logger trigger parameters setup – Logger Trigger
The Logger Trigger parameters
influence the way the measurement
results are saved in the logger. It is a
context sub-list in which: the trigger can
be switched off or it’s type selected
(Trigger), the source of the triggering
signal can be determined (Source), it’s
level can be selected (Level), the number
of the results saved in the logger before
the fulfilment of the triggering condition
(Pre) and the number of the results saved
in the logger after the fulfilment of the
triggering condition (Post).
<ENT>
Trigger disabling
The logger triggering of the measurements (Trigger) can be switched off
using the <> push-button. The triggering is switched on if the Level + or
Level – mode is selected using the <> push-button.
Level type trigger
If the triggering signal is greater than the selected in Level + or less than
Level -, the logger contains:
• the measurement results recorded directly before the fulfilment of the
triggering condition; time of the recording can be calculated by
multiplying the value set in the Pre by the time period taken from the
Logger Step (path: <Menu> / Measurement / Logging / Logger Setup);
• all measurement results up to the moment the triggering signal falls
below the Level;
• the results recorded directly after the fulfilment of the triggering
condition; time of the recording can be calculated by multiplying the
value set in the Post by the time period taken from the Logger Step
(path: <Menu> / Measurement / Logging / Logger Setup).
<>
Trigger Source selection
When Level Meter mode is chosen only one measured result can be used as a source of the triggering signal
in the logger, namely the output signal from the RMS detector coming from the first profile which is denoted
here as Leq(1). This position does not become active (it is shown greyed out) and the text shown here
remains unchanged. After pressing the <> push-button, the Source line is skipped.
When the 1/1 Octave or 1/3 Octave mode is chosen it is possible to use
the RMS band-pass value of one of the 1/1 octave or 1/3 octave spectrum
filters with the appropriate central frequency as the source of the triggering
signal for the logger.
Available values of the Source parameter for the 1/1 Octave mode:
Leq (1), 250Hz, 500Hz, 1.00kHz, 2.00kHz, 4.00kHz, 8.00kHz, 16.0kHz.
Page 40
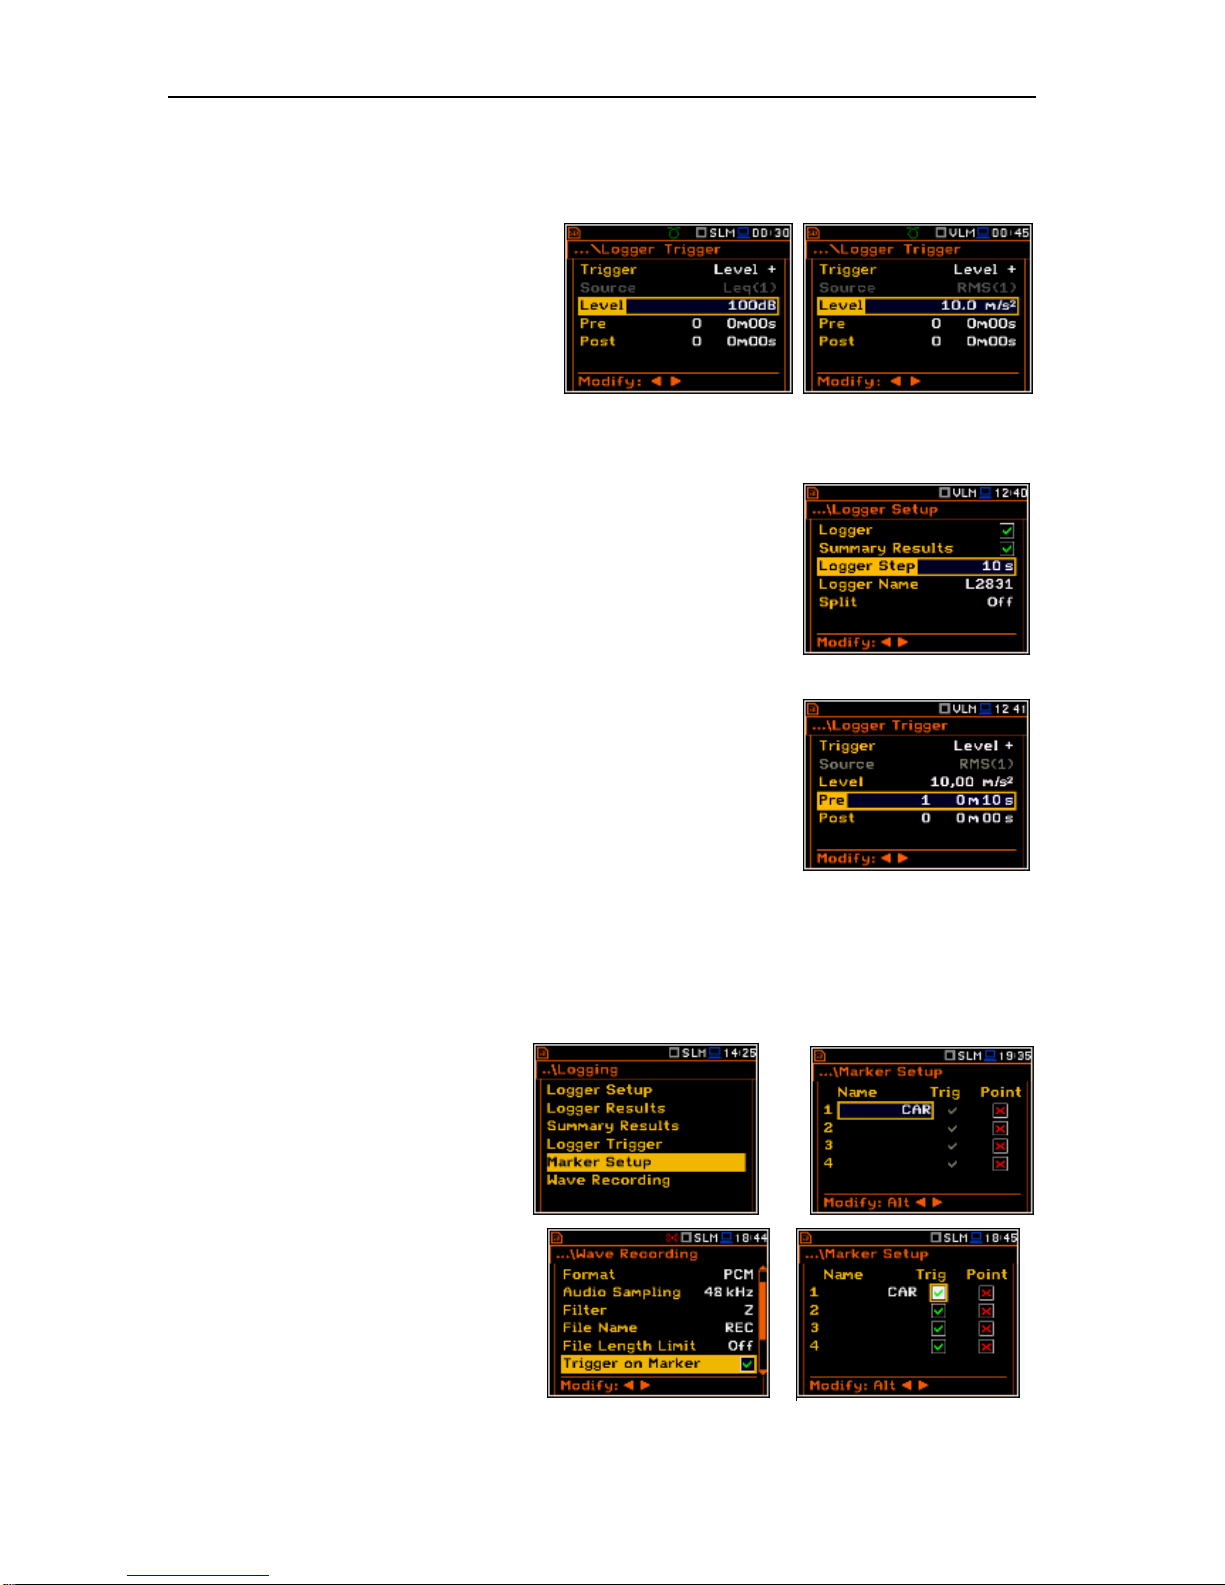
SVAN 979 USER'S MANUAL_______________________________________________ _40
Available values for the Source parameter for the 1/1 Octave mode:
Leq (1), 125Hz, 160Hz, 200Hz, 250Hz, 315Hz, 400Hz, 500Hz, 630Hz,
800Hz, 1.00kHz, 1.25kHz, 1.60kHz, 2.00kHz, 2.50kHz, 3.15kHz, 4.00kHz,
5.00kHz, 6.30kHz, 8.00kHz, 10.0kHz, 12.5kHz, 16.0kHz, 20.0kHz.
Level of the triggering signal
The level of the triggering signal for the logger
(Level) can be set in sound modes in 1 dB
steps in the range from 24 dB to 136 dB and
in vibration modes from 1.00 mm/s
2
to
10.0 km/ s2. The Level value of the triggering
signal for the logger refers to the
instantaneous value of the RMS result from
the first profile calculated during the period
depending on selected Detector (1) (path:
<Menu> / Measurement / Profiles).
Pre and post trigger recording
In the Pre line the number of results recorded in the logger’s file before
the fulfilment of the triggering condition can be set. This number is within
the limits 0..50.
In the Post line the number of the results recorded in the logger’s file after
the fulfilment of the triggering condition can be set. This number is within
the limits 0..200.
The period of the measurements that are saved in the logger before or
after the fulfilment of the triggering condition can be calculated multiplying
the value set in the Pre or Post positions by the value set in the
Logger Step positions (path: <Menu> / Measurement / Logging /
Logger Setup). The result of the calculation is presented in the same line,
at the right side of the display.
=>
5.4.5 The marker setup – Marker Setup
Marker is used to mark (or highlight) special events during the measurement such as "airplane flight" and is
nothing but an indication of the beginning and end of the block of logger results in which the event occurred.
In case of point markers there is no start and end of the marker, but only one record in the logger file. Markers
are activated in the result presentation window by pressing the arrow keys.
The Marker Setup enables the user to
assign a specific name for each marker,
select its type (normal or Point) and
switch on the marker by wave recording
trigger (Trig).
<ENT>
The Trig column is active only when
Trigger on Marker (path: <Menu> /
Measurement / Logging /
Wave Recording / Wave Rec. =
On Trigger) is switched on.
When Trigger on Marker is switched on
the user may enable the marker to be
activated by the trigger switching on the
Trig parameter.
=>
Page 41
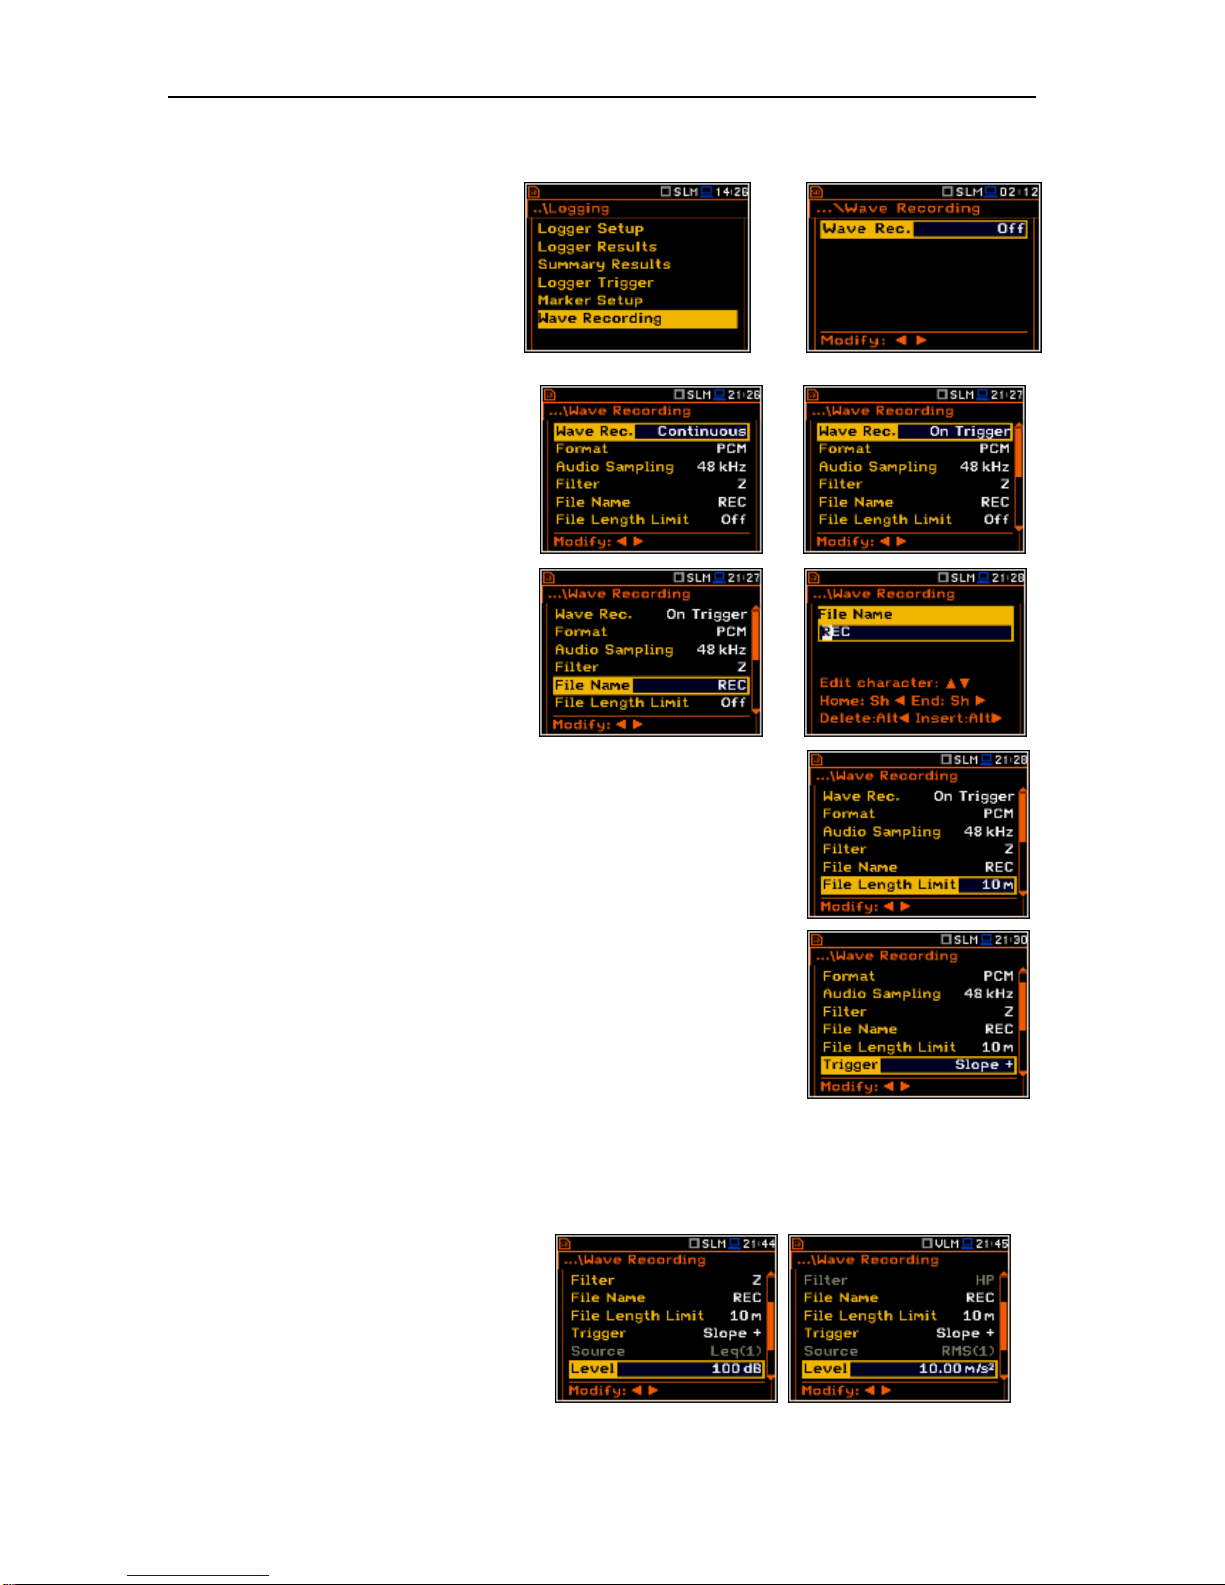
SVAN 979 USER'S MANUAL_______________________________________________ _41
5.4.6 Wave recording setup – Wave Recording
The Wave Recording enables the user
to activate and to set the parameters of
the raw time waveform recording on the
external memory (SD Card or
USB Disk).
The Wave Rec. position, if it is not Off,
defines the type of the wave recording:
Continuous or On Trigger.
<ENT>
The Format position enables the user to
select the format of the wave file header:
PCM or Extensible.
The Audio Sampling position enables
the user to select the sampling frequency
of the wave recording: 12 kHz, 24 kHz
and 48 kHz.
<>
The Signal Gain position enables the
user to select the gain of the recorded
signal, when 16 bits per sample was
selected: 0dB … 40dB.
The File Name position enables the user
to edit the name of the wave file.
<>
The File Length Limit enables the user to define the limit length of the
signal record to be saved in the logger file. When Off is selected, the signal
will be recorded without limitation. To put limitation on record time the user
should select the value in the range from 10 min to 8 hours with 10 minute
step.
The Wave Recording enables the user to activate and programme the
wave recorder trigger. This option became active only when the value of
the Wave Rec. parameter was set as On Trigger.
In the Trigger position the following options are available: Slope +,
Slope –, Level +, Level – and External.
The Source position indicates the triggering signal source. Only one measured result can be used as a
source of the triggering signal in all modes, namely the output signal from the RMS detector coming from the
first profile which is denoted here as Leq(1). This position does not become active (it is not displayed
inversely) and the text shown here remains unchanged. After pressing the <> push-button the Source line
is skipped.
The level of the triggering signal for
recording (Level) can be set from 24 dB
to 136 dB range in 1 dB steps. In the case
of Vibration measurements the level can
be expressed not only in decibels but also
in linear units. The vibration unit scale can
be set in the Display Scale window
(path: <Menu> / Display / Display Scale /
Scale).
Page 42
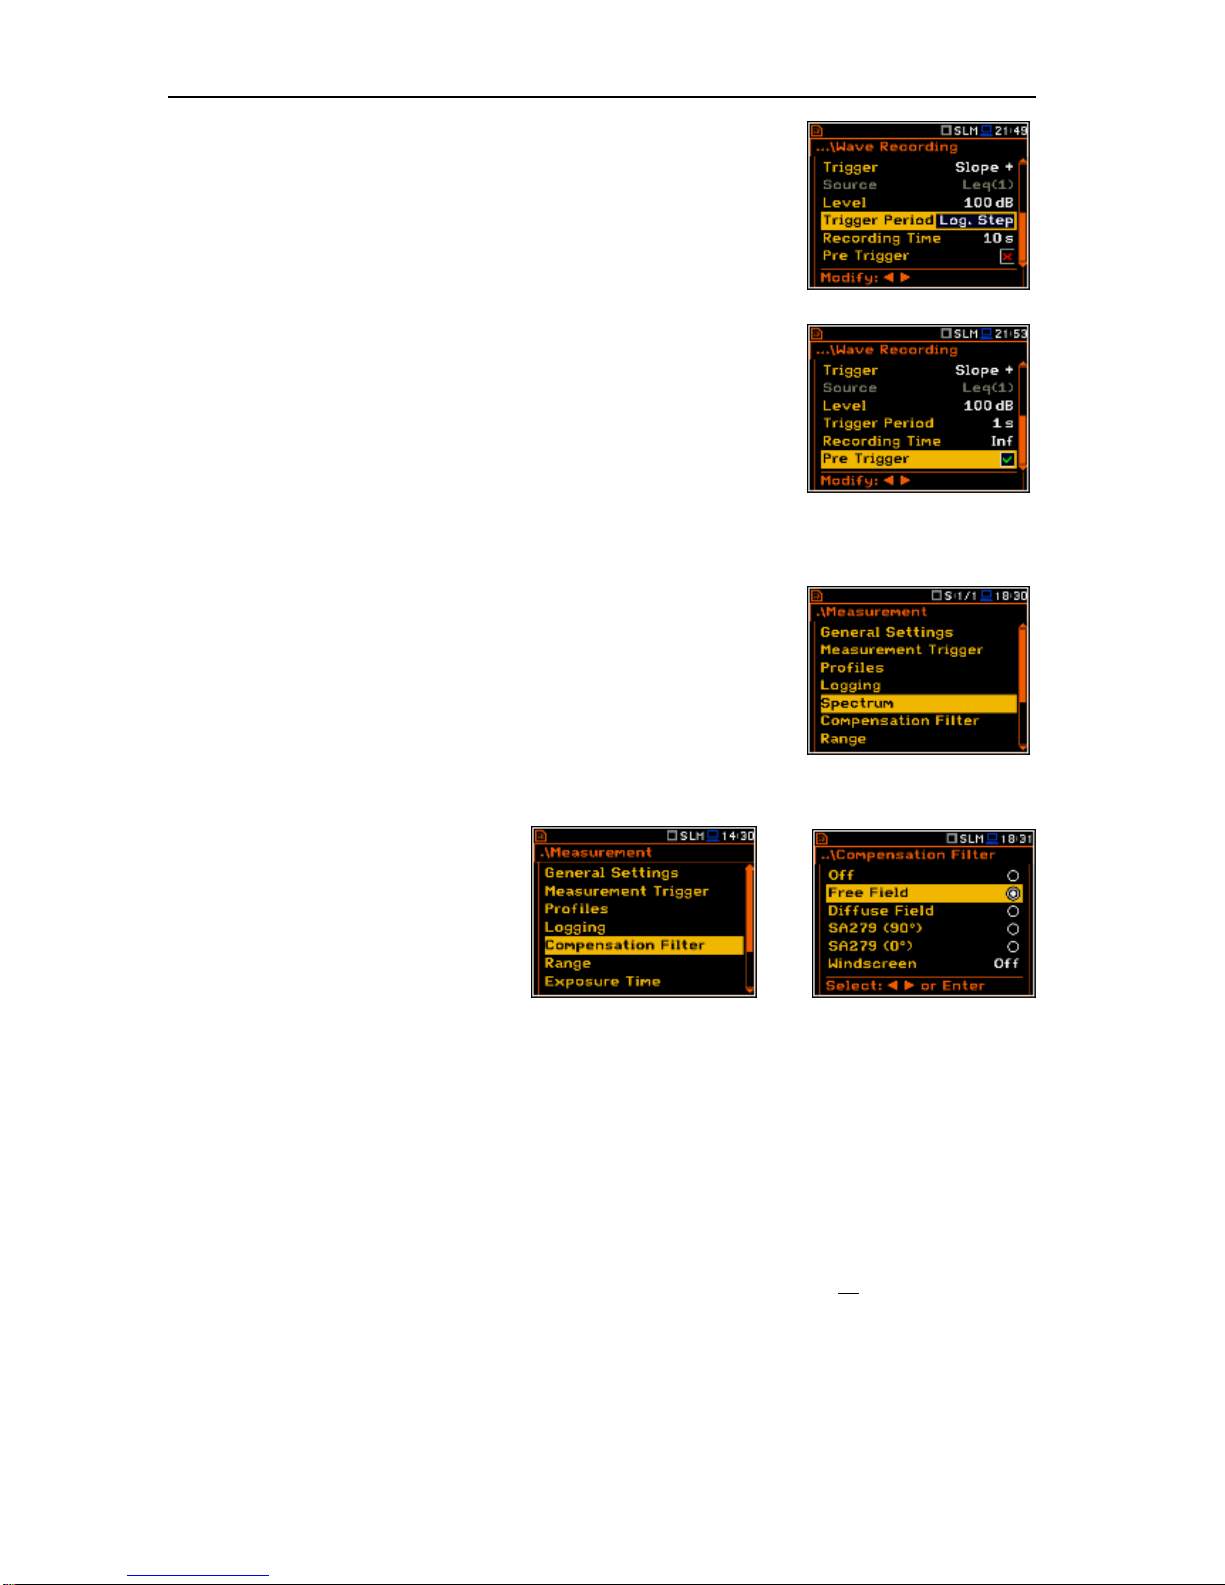
SVAN 979 USER'S MANUAL_______________________________________________ _42
In the Trigger Period position it is possible to select the time interval of
checking the triggering conditions. This parameter can be set on:
Log. Step (same as Logger Step value), 0.5ms, 100.0ms and 1s.
In the Recording Time position it is possible to select the time of signal
recording after triggering starts. If another triggering condition that satisfies
the selected conditions appears then the signal will be recorded for an
additional Recording Time. The available values can be selected from 1s
to 8h or Inf.
When Pre Trigger position is switched on then the signal is recorded
immediately before the triggering condition. The interval of such recording
depends on the sample frequency. For 48 kHz the time interval is 1s, for
24 kHz the time interval is 2 s, for 12 kHz the time interval is 4s.
5.5 Selection the 1/1 Octave - 1/12 Octave spectrum parameters – Spectrum
The Spectrum position appears in the Measurement list when the
1/1 Octave or 1/3 Octave function is selected in the
Measurement Function list (path: <Menu> / Function /
Measurement Function / 1/1 Octave or 1/3 Octave). See section 10 for
more details.
5.6 Selection of the microphone compensation filters – Compensation Filter
The Compensation Filter position is
available only in the case of the
Sound Meter or Direct Sound modes. It
enables the user to select the appropriate
frequency response compensation filter
and the additional windscreen filter.
<ENT>
The Compensation Filter window consists of a list with 6 positions: Off, Free Field, Diffuse Field,
Outdoor Environ., Outdoor Airport and Windscreen. The position in the sub-list is changed after pressing
the <>, <> push-buttons. In order to switch the filter on the user should mark it, by means of the <>,
<> push-buttons, and to confirm the selection with the <ENTER> push-button. Pressing <ENTER> pushbutton closes the sub-list. After pressing the <ESC> push-button the sub-list is also closed but any changes
will be ignored.
The Free Field and Diffuse Field filters enable the user to set compensation for sound measurements in
the free field conditions or in the diffuse field conditions. The microphone supplied with the SVAN 979
instrument (GRAS 40AE) is designed for sound measurements in free field conditions. The Free Field option
means that the correction filter for the diffuse field conditions is switched off. In the case of sound
measurements performed with the use of different specific diffuse field response microphone types the option
Diffuse Field should never be used and the compensation filter should be turned off.
SA279 (90o) and SA279 (0o) filters are dedicated for the permanent outdoor monitoring application. The
characteristics of the outdoor filters depend on the application: the acoustic signal is perpendicular to the
microphone’s grid or the acoustic signal is parallel to the microphone’s grid. The frequency characteristic of
the designed filters is given in App. D.
Windscreen filter can be switch Off, On or set to automatic detection – Auto.
Page 43
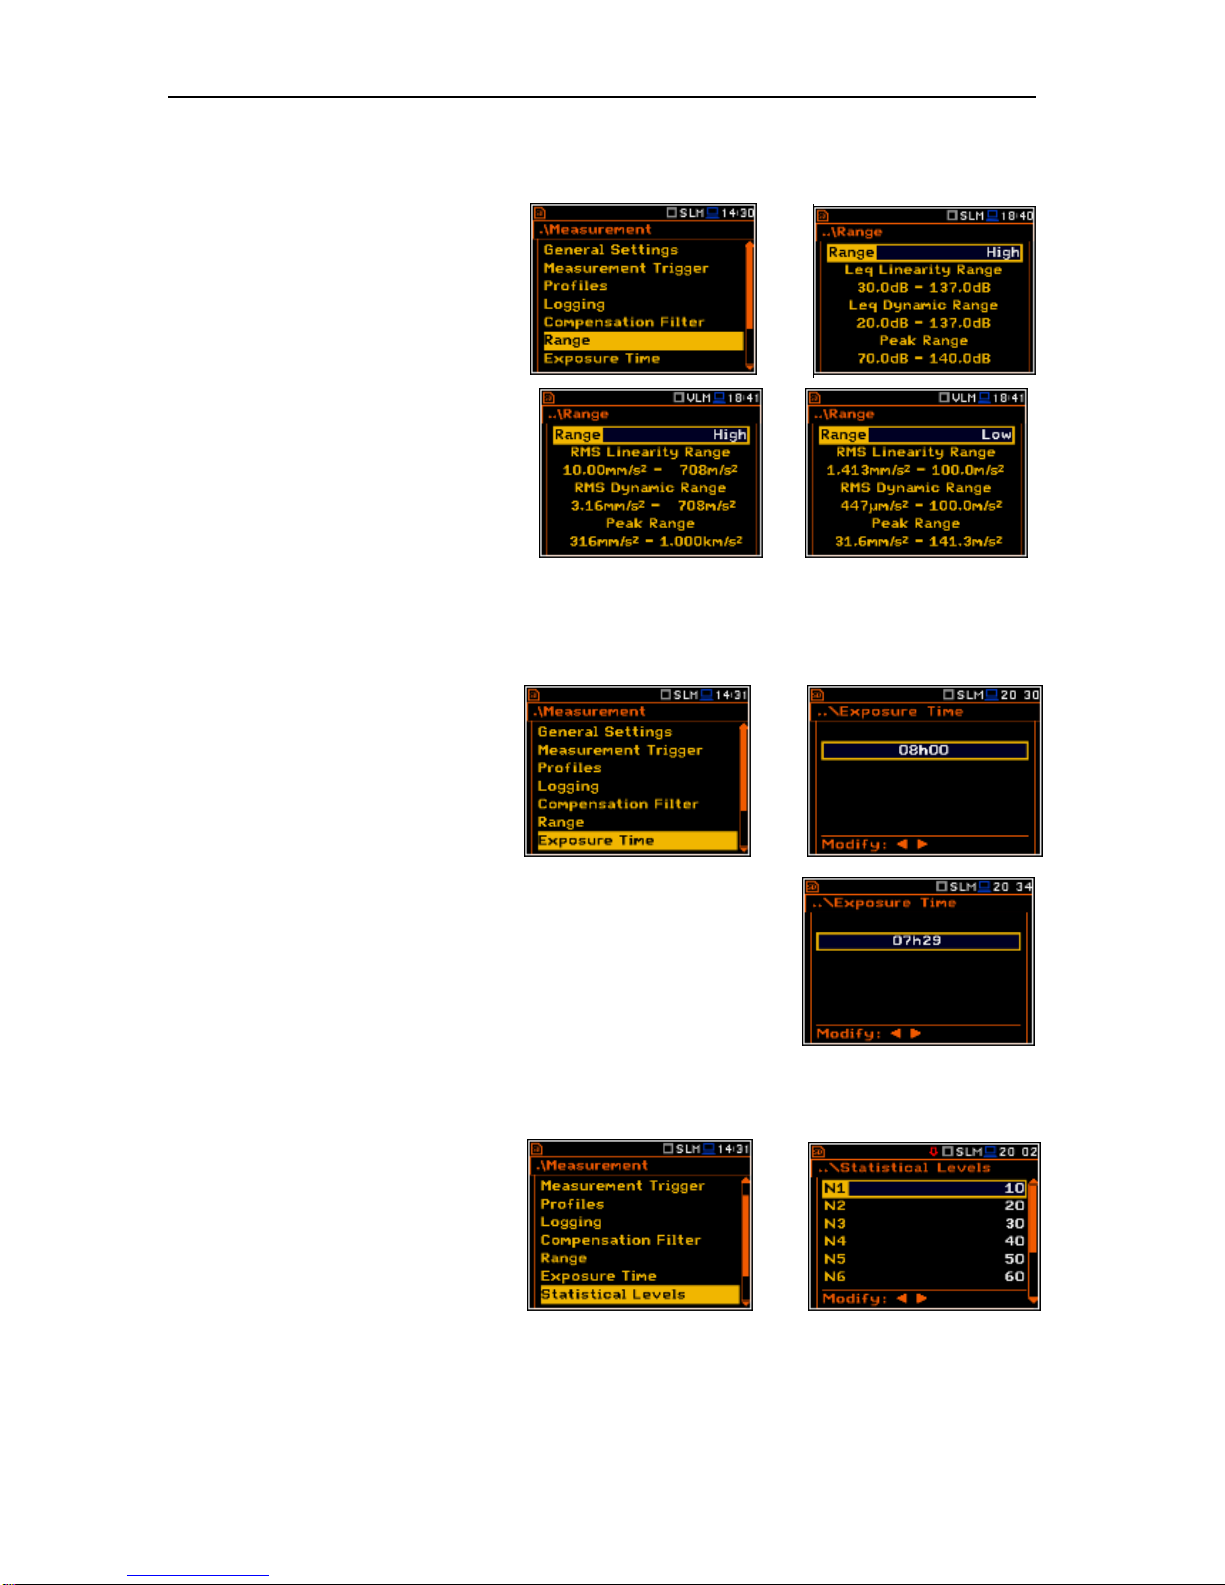
SVAN 979 USER'S MANUAL_______________________________________________ _43
5.7 Measurement range setting – Range
The Range position is used to set one of
the available measurement ranges in the
instrument.
The absolute range values changes due
to the current calibration factor and are
shown on the screen of the instrument.
<ENT>
There are two ranges available High and
Low. The detailed description of the
measurement ranges parameters is
given in App. C. After pressing the
<ENTER> push-button the change is
confirmed and the window closes. Press
the <ESC> push-button to return to the
Measurement list ignoring any changes
made in the sub-list.
<>
5.8 Exposure time setting - Exposure Time
The Exposure Time enables the user to
set the desired value of the workday
exposure time that is used for the
calculation of LEPd (cf. App. D for the
definitions of the functions). This sub-list
is available only in the sound mode; in
Vibration and voltage (Vibration) modes it
is taken off from the Measurement list.
<ENT>
The Exposure Time values are within the range [00h01, 08h00]. The
required value can be set using the <> / <> push-buttons – after each
button press the exposure time is decremented / incremented by one
minute. The step can be decremented / incremented in 30 minutes steps
by pressing the <> / <> push-buttons together with <Shift>.
5.9 Setting ten statistical levels - Statistical Levels
The Statistical Levels position is
available only in the case of the sound
measurements (in the Sound Meter or
Direct Sound modes).
In the Statistical Levels window it is
possible to define ten statistical LN%
levels, named from N1 to N10, to be
calculated, displayed and saved in the
files together with the main results.
<ENT>
Page 44
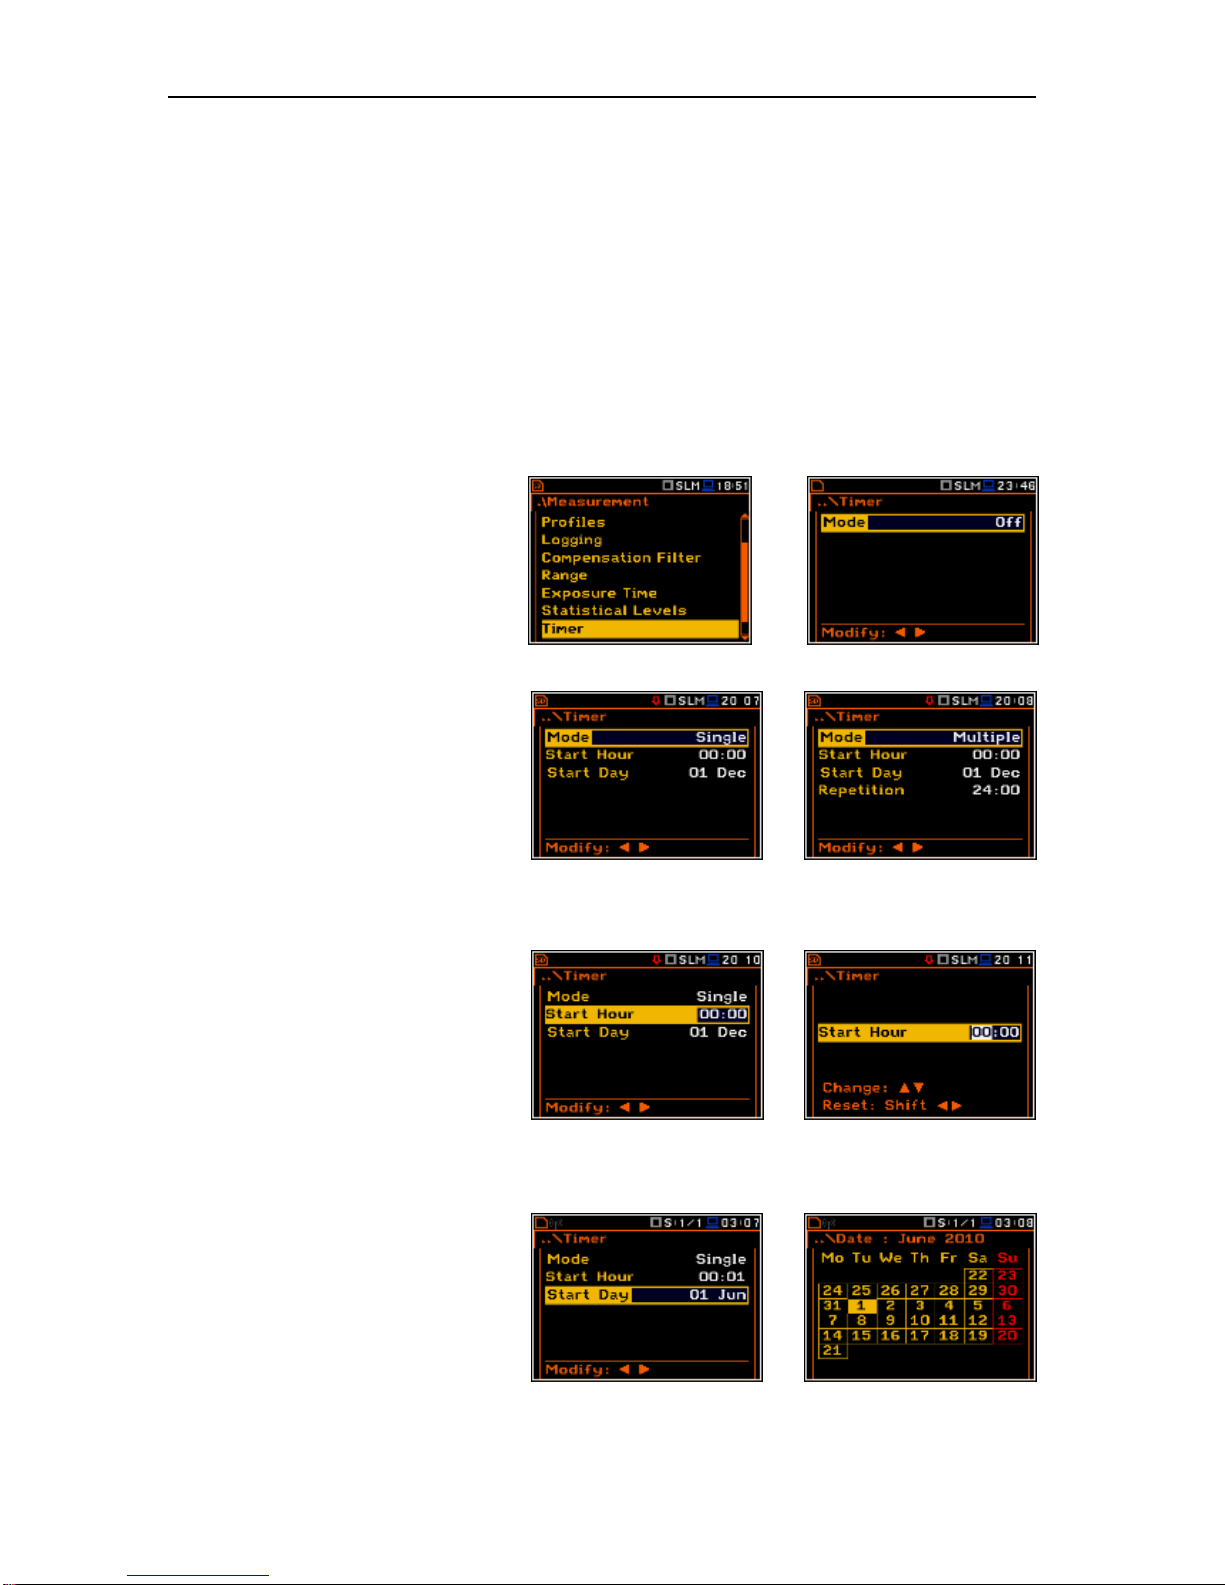
SVAN 979 USER'S MANUAL_______________________________________________ _44
The default statistical levels have the following settings: 10, 20, 30, 40, 50, 60, 70, 80, 90 and 95. All values
have to be within the integer range [1, 99]. Each individual value can be set independently from the others.
The selection of the Nx in the list is made by means of the <>, <> push-buttons.
The first Nx is visible on the display and becomes active for editing after pressing the <> push-button
together with <Shift>. The last Nx is visible on the display and becomes active for editing after pressing the
<> push-button together with <Shift>.
The Nx current value is decreased / increased in 1 % steps by means of the <> / <> push-buttons. The
step can be decreased / increased up to ten % by simultaneously pressing the <> / <> push-buttons with
<Shift>.
The sub-list is closed and the instrument returns to the Measurement list after pressing the <ENTER> (with
the confirmation of all changes made in this list) or <ESC> push-button (ignoring all changes).
5.10 Programming the instrument’s internal timer – Timer
The Timer position enables the user to
programme the internal real time clock to
act as a delayed start and stop timer. The
instrument can be switched on
automatically at the pre-selected
programmed time and perform the
measurement with the same settings
used before the instrument was switched
off.
<ENT>
Selecting the mode of the timer
function
The timer can be switched off – Off,
switched on only once – Single, or
switched on many times regularly –
Multiple with the period between two
consecutive measurements set in the
Repetition line.
<>
In case when the timer function is active (Single or Multiple) and the instrument is switched on the “clock”
icon appears until the measurements are finished.
Setting the time for the measurement
to start
The Start Hour position determines the
time for the measurement to start. The
required hour and minute can be selected
in a special window, which is opened by
means of the <>, <> push-buttons.
<>
In order to set hours or minutes the user has to enter the left or right field by pressing the <>, <> push
button and then select the proper value by means of the <>, <> push-buttons and finally to press
<ENTER>.
Setting the day for the measurement to
start
The Start Day position determines the
date for the measurement to start. The
timer can be programmed up to one
month ahead and during the date setting
the current state of the Real Time Clock
(RTC) is taken into account. The required
date can be selected in a special window,
<>
Page 45
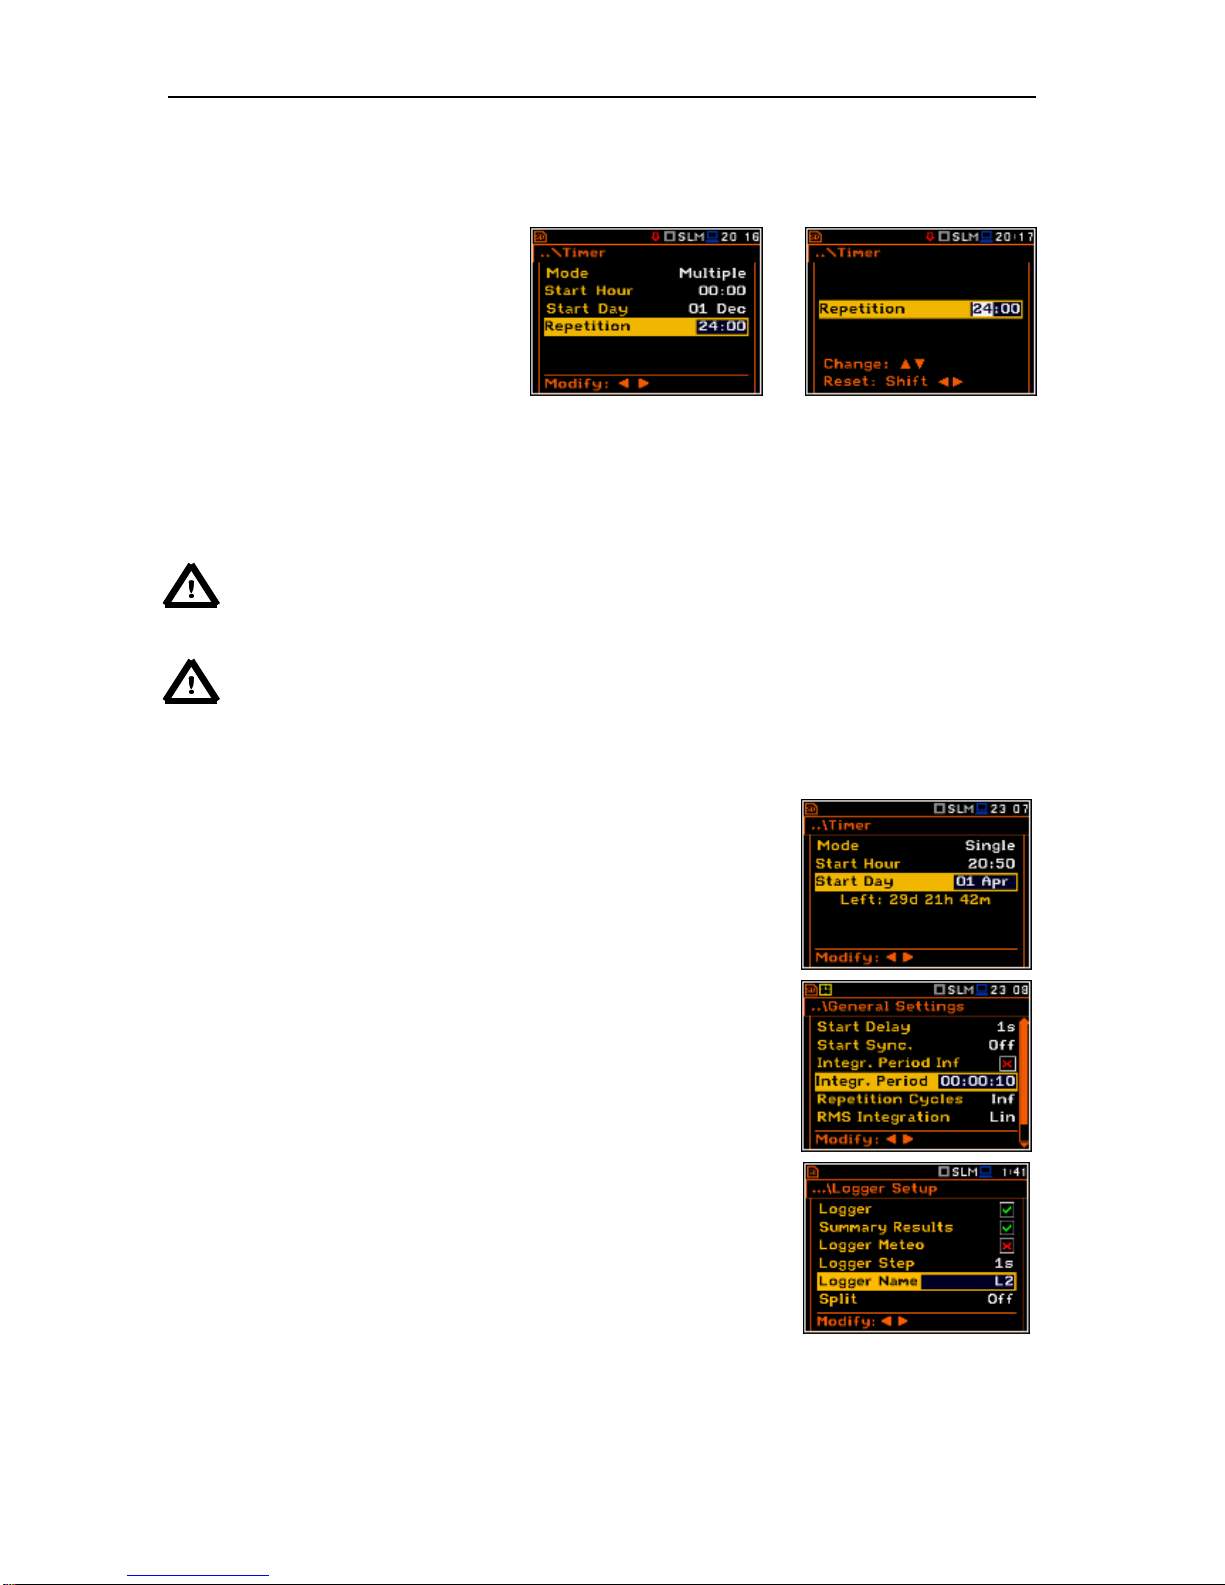
SVAN 979 USER'S MANUAL_______________________________________________ _45
which is opened by means of the <>,
<> push-buttons.
In order to set date the user has to select its position by means of the <>, <> and <>, <> push button
and then press <ENTER>.
Selecting the period between two
consecutive measurement start times
The Repetition position is displayed
when the Multiple mode is selected. This
parameter can be programmed in the
range from 00:00 up to 99:59. The
required time can be selected in a special
window, which is opened by means of the
<>, <> push-buttons when the
Repetition text is displayed inversely in
the Timer sub-list.
<>
In order to set the proper value the user has to select hours or minutes pressing the <>, <> push-buttons
and then, pressing the <>, <> push-buttons to select the proper value.
Notice: The instrument’s Timer function can be used for multiple measurements (at the
programmed day and time with the selected repetition number). The first switch on and recording
of the instrument must be within one month ahead. Make sure that the RTC is set correctly before
trying to set a value for a delayed Start/Stop Timer.
Notice: Make sure that there is sufficient power available for the instrument to carry out the required
measurement when it wakes up and starts the recording.
5.11 Description of an exemple timer function
The Timer function is used to programme the instrument to switch on at
the desired time and perform the measurements with the parameters set
in the Measurement sub-list.
Let us assume that the user wants to switch on the instrument on the 1st
of April, at 20:50, measure the sound for 10 seconds and save the results
in a file named L2.
In order to do this the user has to set the parameters of the Timer function,
the measurement parameters (path: <Menu> / Measurement / General
Settings), name the file (path: <Menu> / Measurement / Logger /
Logger Setup) and finally – switch off the instrument.
The instrument will be switched on the 1st of April at 20:50 and will be
warmed up for the period of 60 seconds decrementing the counter visible
on the display by one after each second.
After warming up the instrument and the preset Start Delay time, the
measurements will be performed for a period of ten seconds. Then, the
results will be saved in the previously named file and finally – the
instrument will switch off.
In this example the delayed start time on the meter can be configured any
time during the previous month. It is recommended that for simplicity the
Start Delay time is set to 0 seconds for use with the Timer function.
Page 46
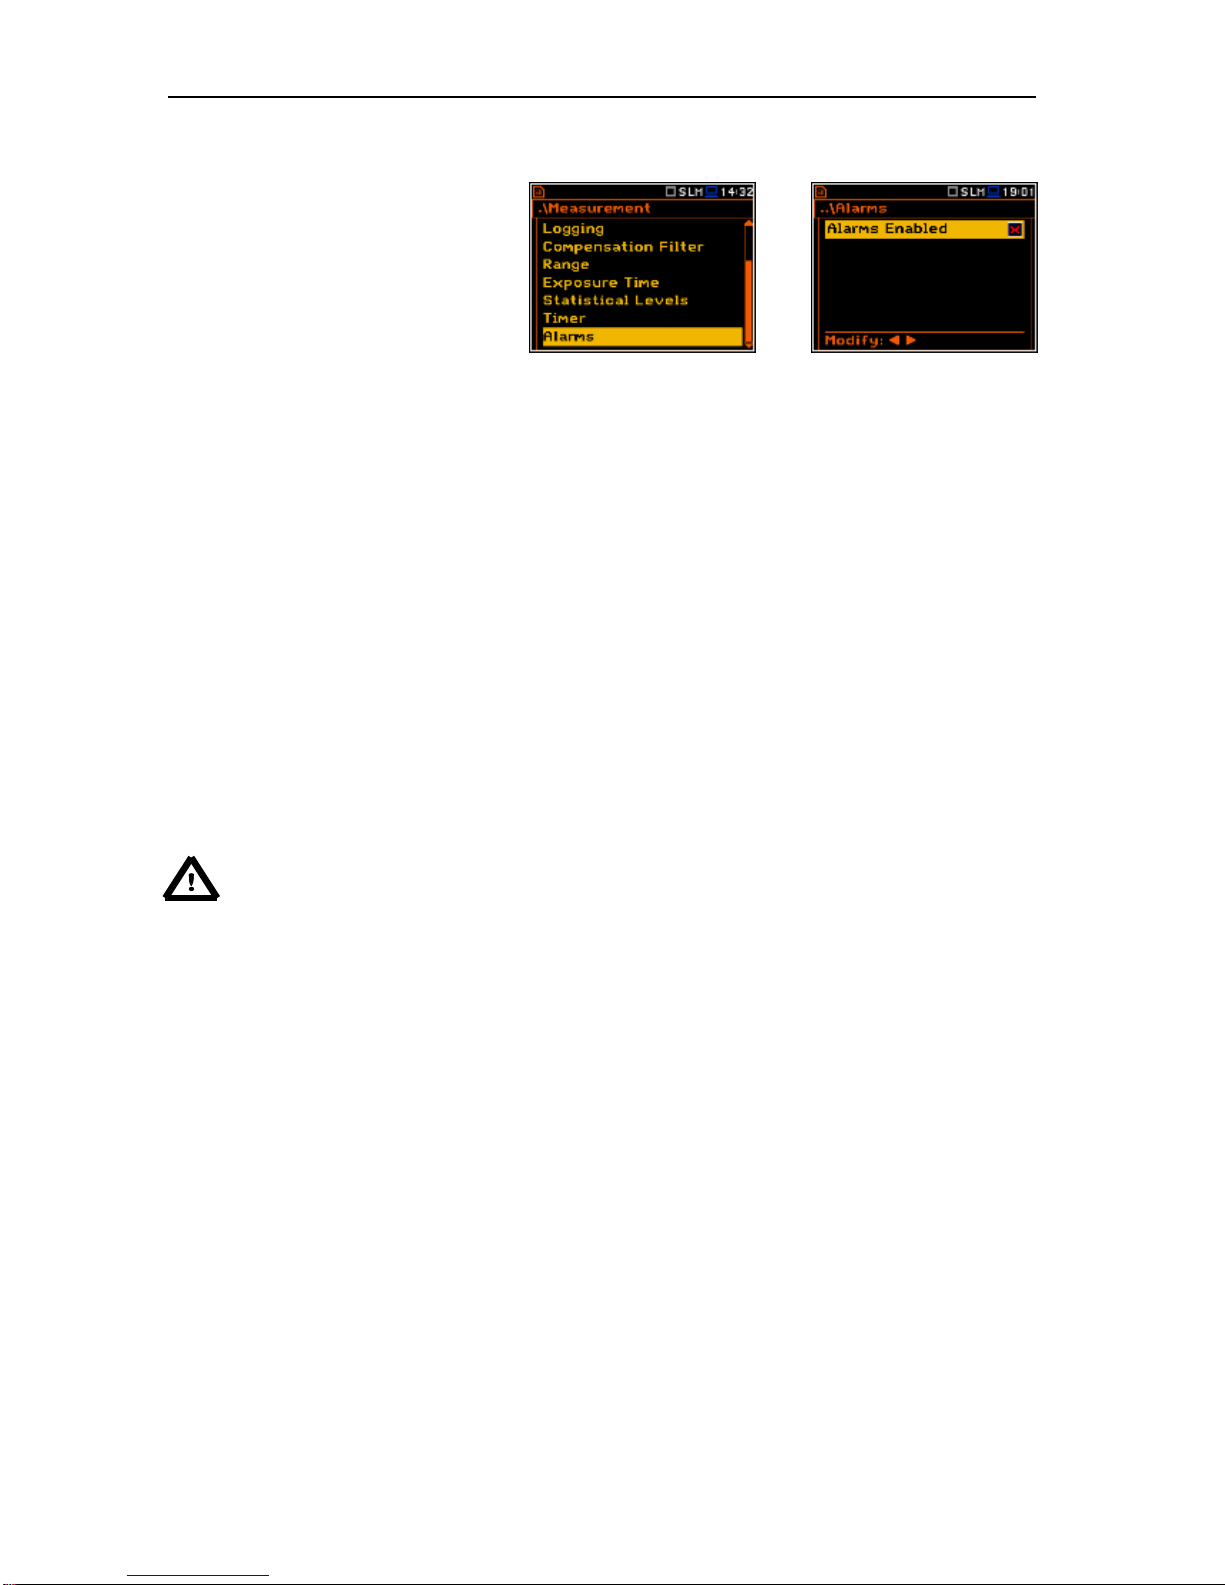
SVAN 979 USER'S MANUAL_______________________________________________ _46
5.12 Alarm function - Alarms
The Alarms position enables the user to
enable or disable the alarm functionality.
<ENT>
Alarms is a mechanism to log events that meet user-defined conditions. Such an event may be, for example,
the train or other noise sources. Alarms also facilitate registration of data on certain days of the week or
times of day.
There are two types of conditions:
1) exceeding the level of the selected result (Threshold),
2) time period on certain days of the week (Time).
If certain conditions are met the next action assigned to the event starts:
1) data record to the logger file;
2) audio record to the WAV file;
3) marker record file logger file;
4) sms sending;
5) an e-mail sending.
Alarm configuration is done remotely in the SvanPC++ software using the Remote Communication Center
module (an option in the menu Svan > Remote Communication). This module allows the user to create a
configuration file and send it to the instrument. The devices can only enable or disable the alarm function,
and preview events on special views in the results window.
Notice: The “bell’ icon is displayed when any alarm appears.
Page 47
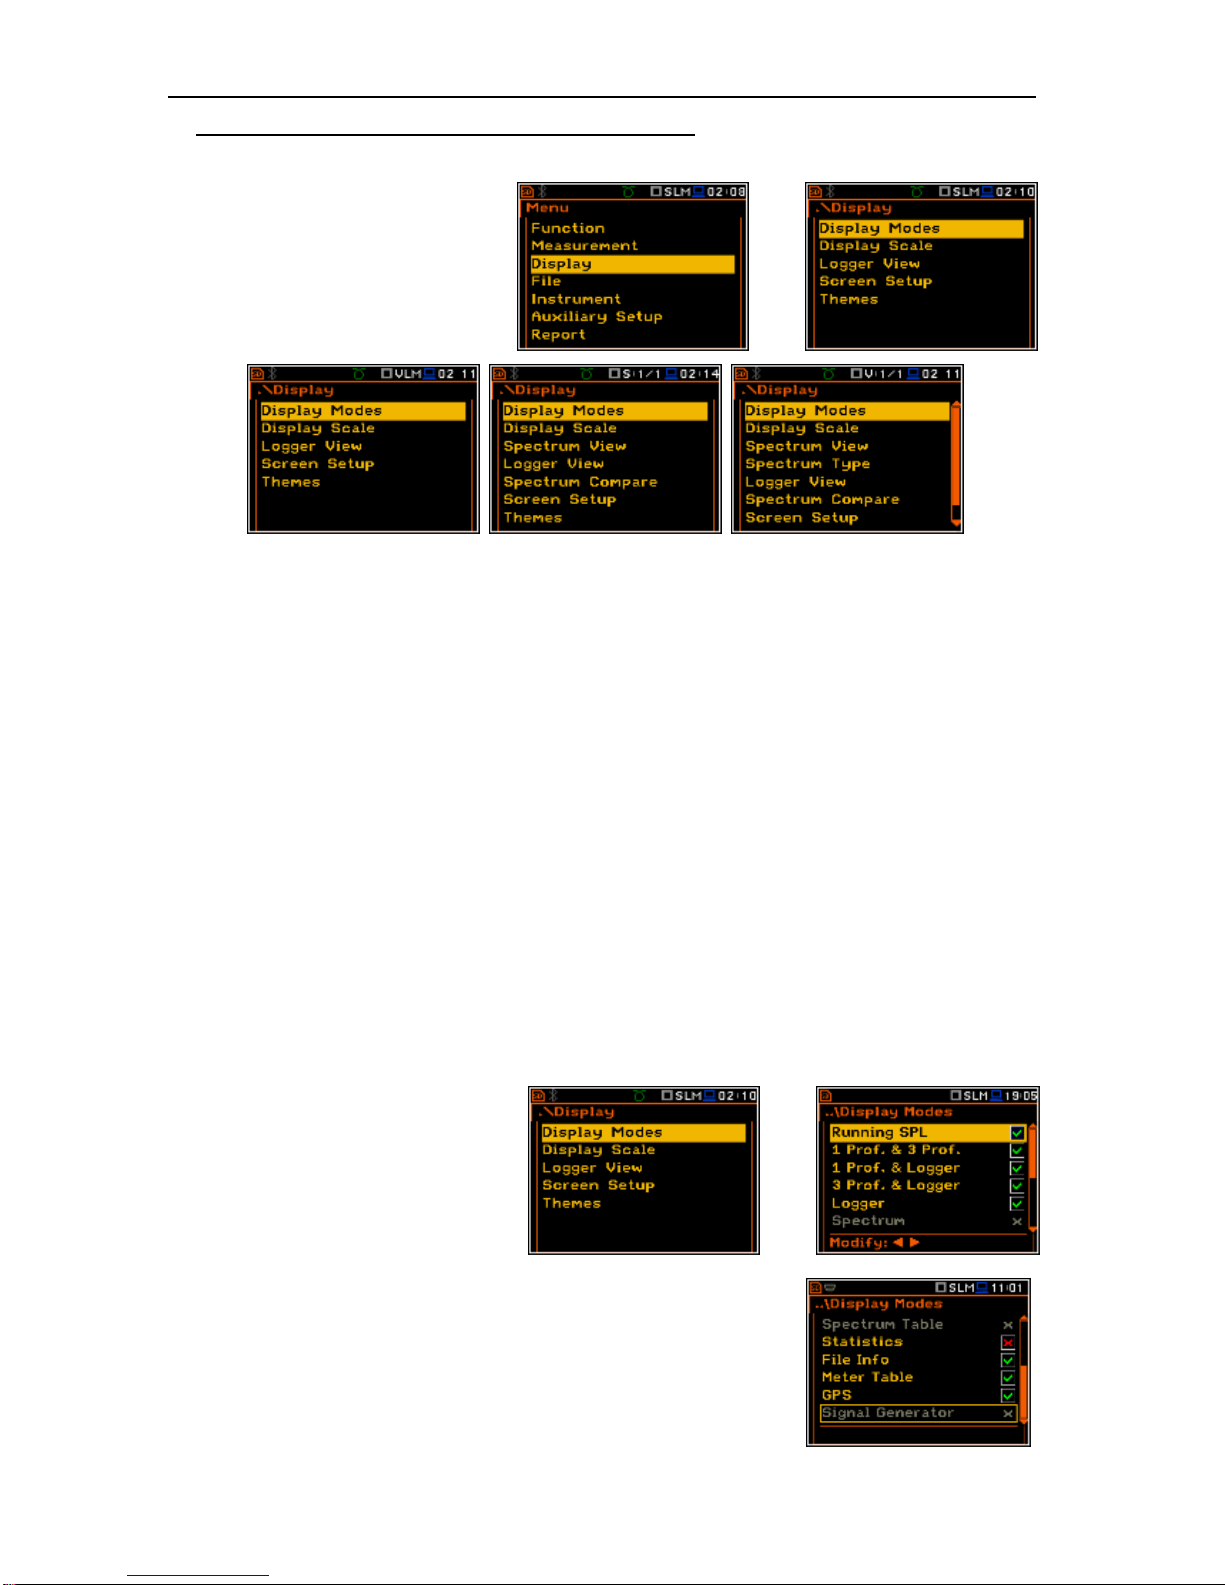
SVAN 979 USER'S MANUAL_______________________________________________ _47
6. DATA AVAILABLE ON THE DISPLAY – Display
The Display list contains the elements
that enable the user to independently
programme the display parameters.
The content of the Display list differs for
the spectrum analyser modes.
<ENT>
The Display list is used for setting the various parameters, which are dedicated to the control of the LCD
screen display and contains the following items:
Display Modes enables the user to select the mode of the measurement results presentation;
Display Scale enables the user to change the scale in the graphical modes of result’s presentation;
Spectrum View enables the user to change the type of the spectrum and to activate the Max and
Min spectrum. This position appears only in 1|1 Octave - 1/12 Octave modes;
Spectrum Type enables the user to change the spectrum type presented on the display:
Acceleration, Velocity and Displacement. This position appears only in
1|1 Octave - 1/12 Octave modes when the Vibration Meter mode is selected;
Logger View enables the user to select and present the results stored in the logger’s files;
Spectrum Compare enables the user to compare spectrum with the reference one. This position appears
only in 1|1 Octave - 1/12 Octave modes;
Screen Setup enables the user to set the brightness and the switch on/off the energy saver
function;
Themes enables the user to set the colour theme of the display.
6.1 Selection of the modes of measurement results presentation - Display Modes
The One Profile mode is always available
in all measurement modes. Other
presentation modes can be switched on
or off in the Display Modes sub-list.
The mode of the results presentation is
related to the selection of the instrument’s
function (SLM or VLM, 1/1 Octave,
1/3 Octave, etc.).
<ENT>
For the Sound Level Meter the following display modes are available:
Running SPL, 1 Prof. & 3 Prof., 1 Prof. & Logger, 3 Prof. & Logger,
Statistics, File Info, Meter Table, GPS and Signal Generator.
For the Vibration Level Meter the following display modes are available:
1 Prof. & 3 Prof., 1 Prof. & Logger, 3 Prof. & Logger, File Info,
Meter Table, GPS and Signal Generator.
Page 48
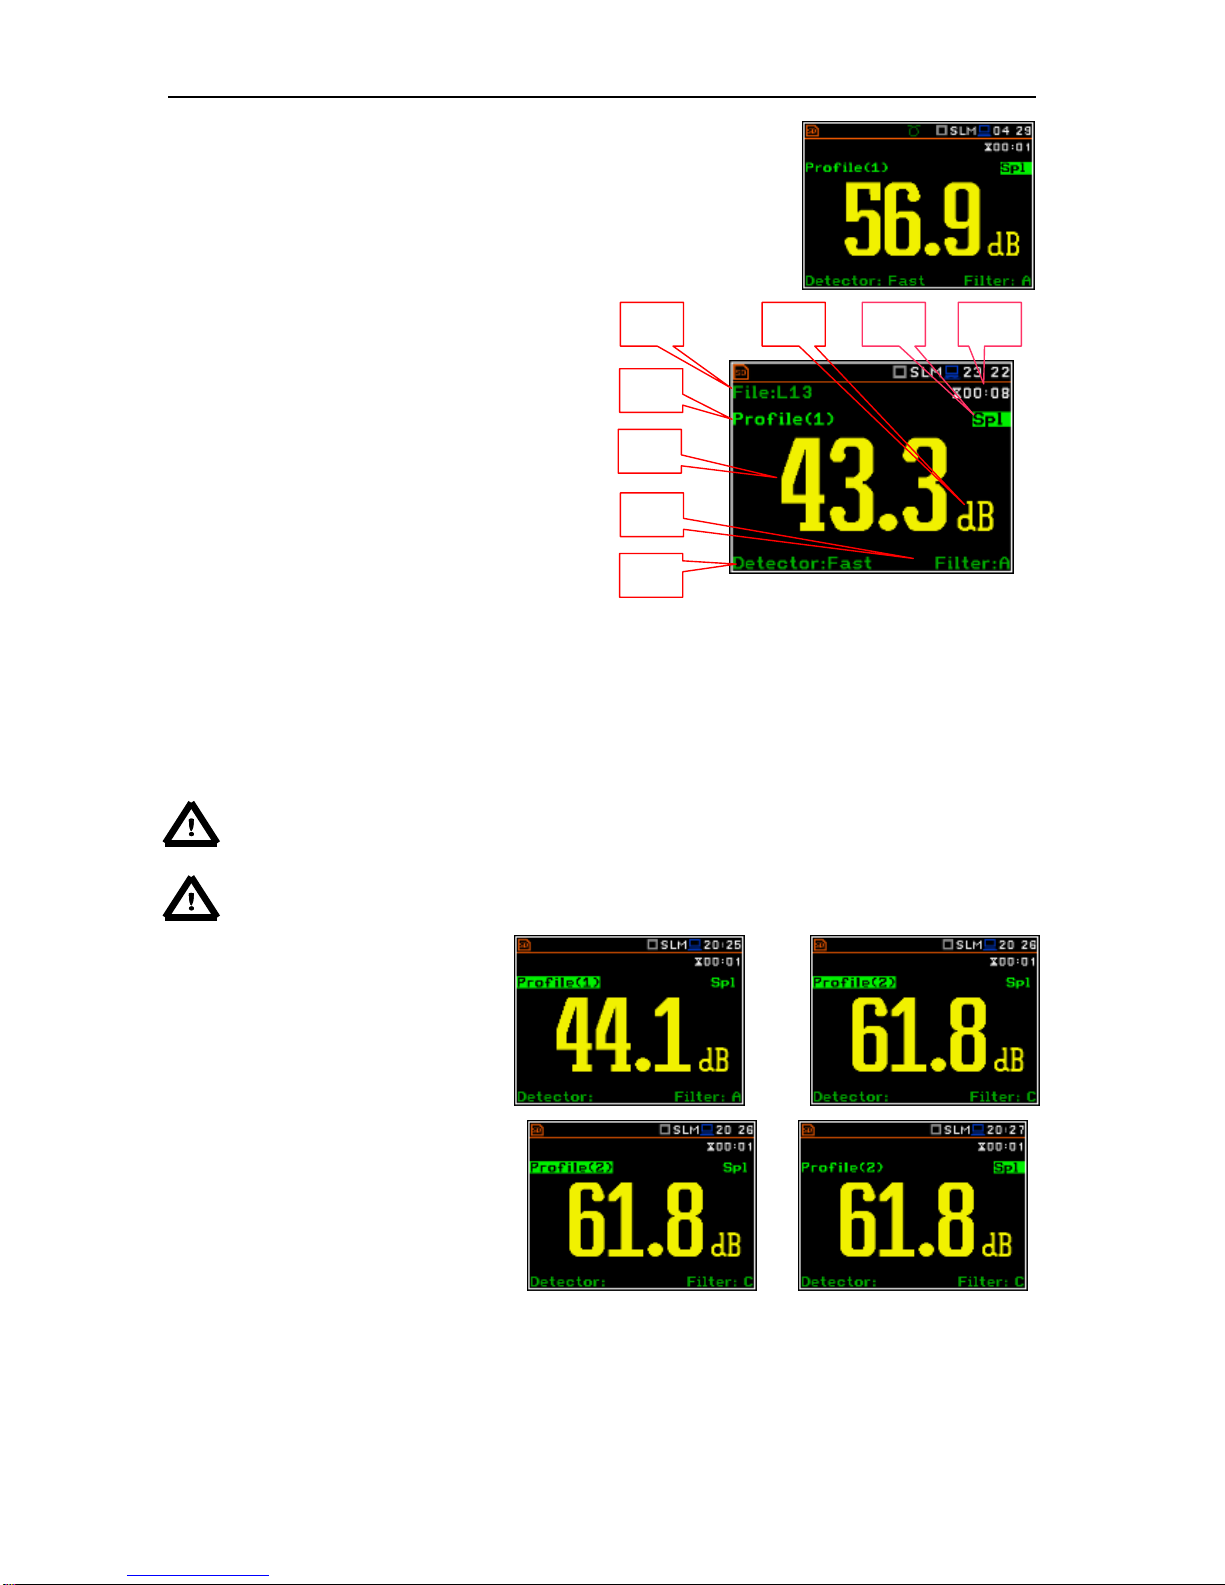
SVAN 979 USER'S MANUAL_______________________________________________ _48
One Profile presentation mode
The One Profile presentation mode is always available in all measurement
modes. The display with the measurement result in One Profile mode is
presented here.
Field description of the One Profile view
1. Logger file name.
2. Profile number.
3. The value of the measured function.
4. The name of the implemented filter: Z, A, C, B
in case of Sound measurements or HP, HP1,
HP3, HP10, Vel1, Vel3, Vel10, VelMF, Dil1,
Dil3, Dil10 in case of Vibration measurements.
5. Detector time constant: in case of Sound
measurements when the detector is
exponential: Imp., Fast, Slow or Lin when the
detector is linear and in case of Vibration
measurements: 100 ms, 125 ms, .. 10.0 s,
6. Units of the measured value.
7. Function name: Spl, Leq, Sel, LEPd, Ltm3,
Ltm5, LN%, Ovl, Peak, Max, Min in case of
Sound measurements or RMS, Ovl, Peak, P–
P, MTVV in case of Vibration measurements.
8. Elapsed time shows the current second of the
measurement. The value presented there
belongs to the range [1, Integration Period].
Notice: In the case the RMS Integration is linear (path: <Menu> / Measurement /
General Settings / RMS Integration: Lin) for the Leq, Sel, Le, LEPd and LN% results Lin. Text
appears on the display instead of Imp., Fast or Slow detector time constant.
Notice: There is no displayed indication of the detector in the case of Peak and Ovl results.
Changing the field content
The content of some fields can be
changed after pressing the <> and
<> push-buttons together with <Alt>.
<Alt/>
Changing the active fields
The change of the active field is made
by pressing the <> / <> (horizontal)
push-buttons.
<>
Changing the presentation mode
The presentation mode is changed after pressing the <> or <> push-buttons together with <Alt>.
6
1 3 7
5
4
8
2
Page 49
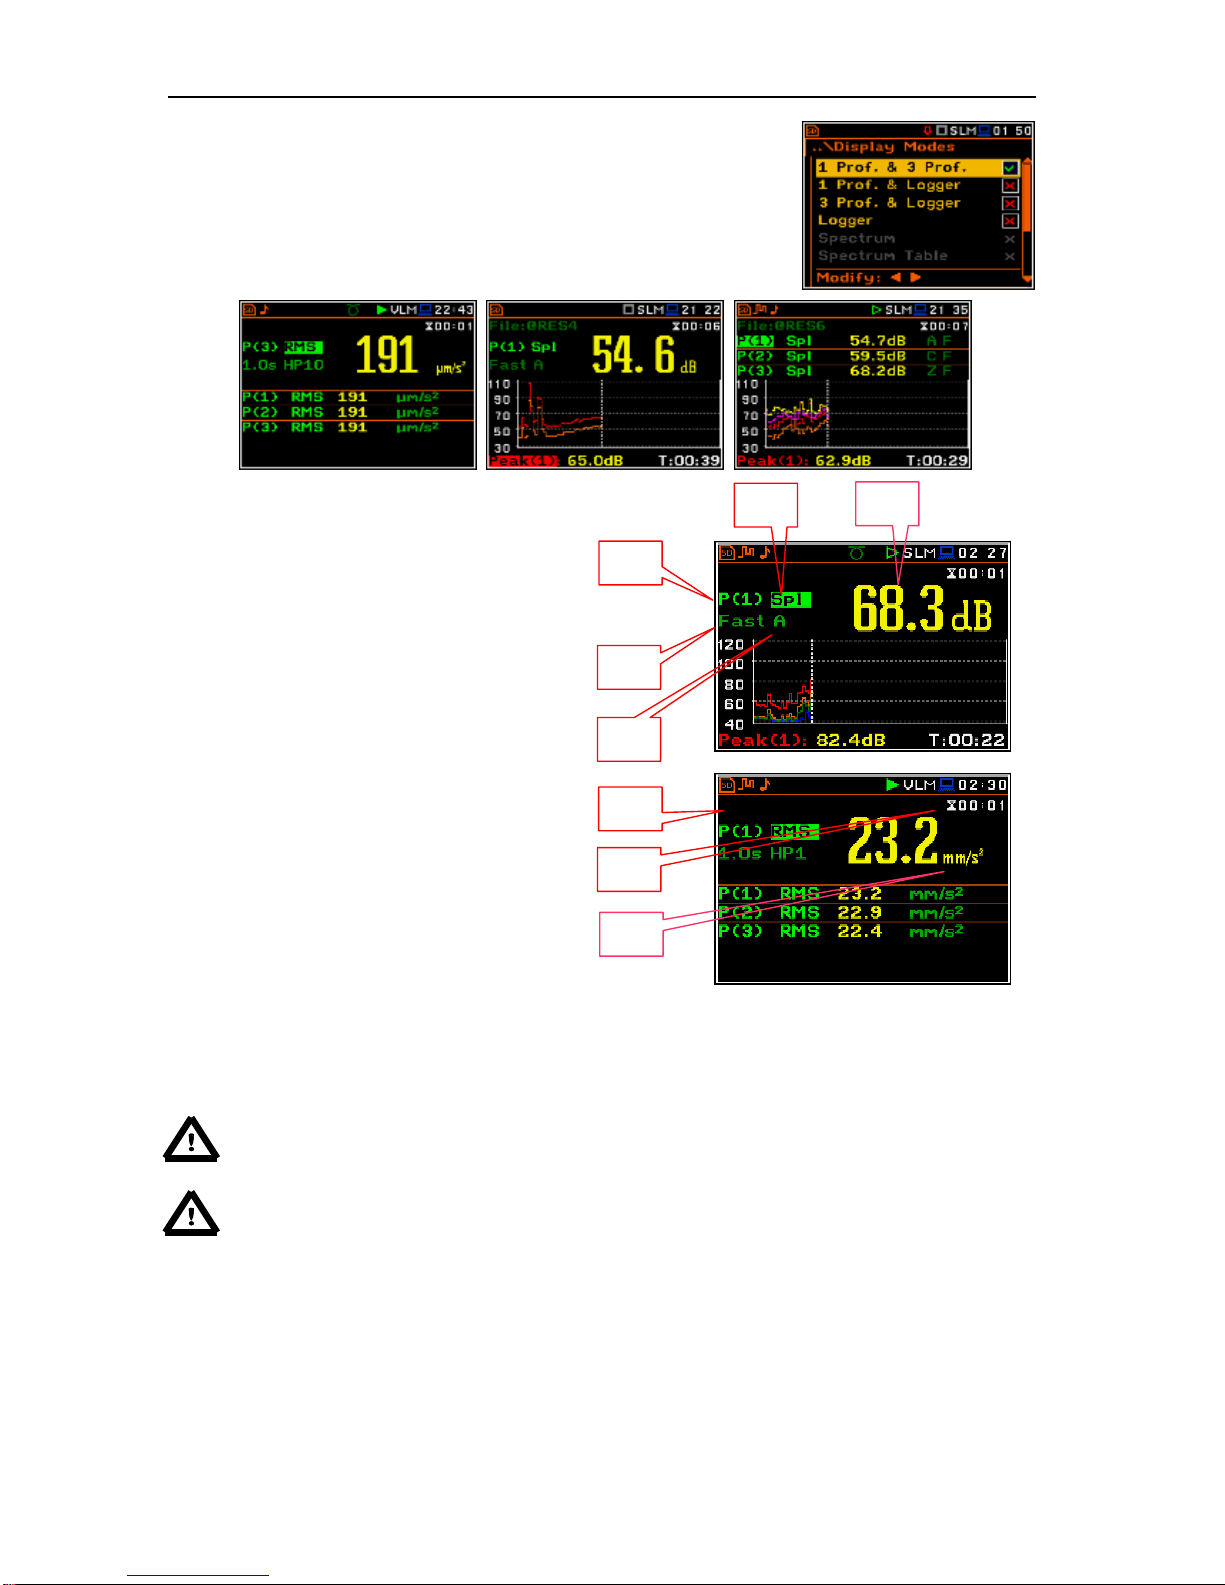
SVAN 979 USER'S MANUAL_______________________________________________ _49
Combined presentation modes
There are three presentation modes, which combine two views and can be
activated or not: 1 Prof. & 3 Prof., 1 Prof. & Logger, 3 Prof. & Logger.
These combined views allow the user to compare results for profiles and
to follow the history of measured results, saved in the logger file.
Fields description of the One Profile view
1. Profile number.
2. Function name: Spl, Leq, Sel, Lden,
LEPd, Ltm3, Ltm5, LN%, Ovl, Peak, Max,
Min in case of Sound measurements or
RMS, Ovl, Peak, P–P, MTVV in case of
Vibration measurements.
3. Detector time constant: in case of Sound
measurements when the detector is
exponential: IMP., FAST, SLOW or Lin
when the detector is linear and in case of
Vibration measurements: 100 ms, 125 ms,
.. 10.0 s, …
4. The name of the implemented filter: Z, A,
C, B, G in case of Sound measurements or
HP, HP1, HP3, HP10, Vel1, Vel3, Vel10,
VelMF, Dil1, Dil3, Dil10, Wh in case of
Vibration measurements.
5. The value of the measured function.
6. Units of the measured value.
7. Elapsed time shows the current second of
the measurement. The value presented
there belongs to the range [1,
Integration Period].
8. File name when Auto Save Function is
activated (path: <Menu> / File / Save
Options / Auto Save:)
Notice: In the case the RMS Integration is linear (path: <Menu> / Measurement /
General Settings / RMS Integration: Lin) for the Leq, Sel, Lden, LEPd and LN% results Lin.
text appears on the display instead of Imp., Fast or Slow detector time constant.
Notice: There is no displayed indication of the detector in the case of Peak and Ovl results.
8
6
7
2
1
3
5
4
Page 50
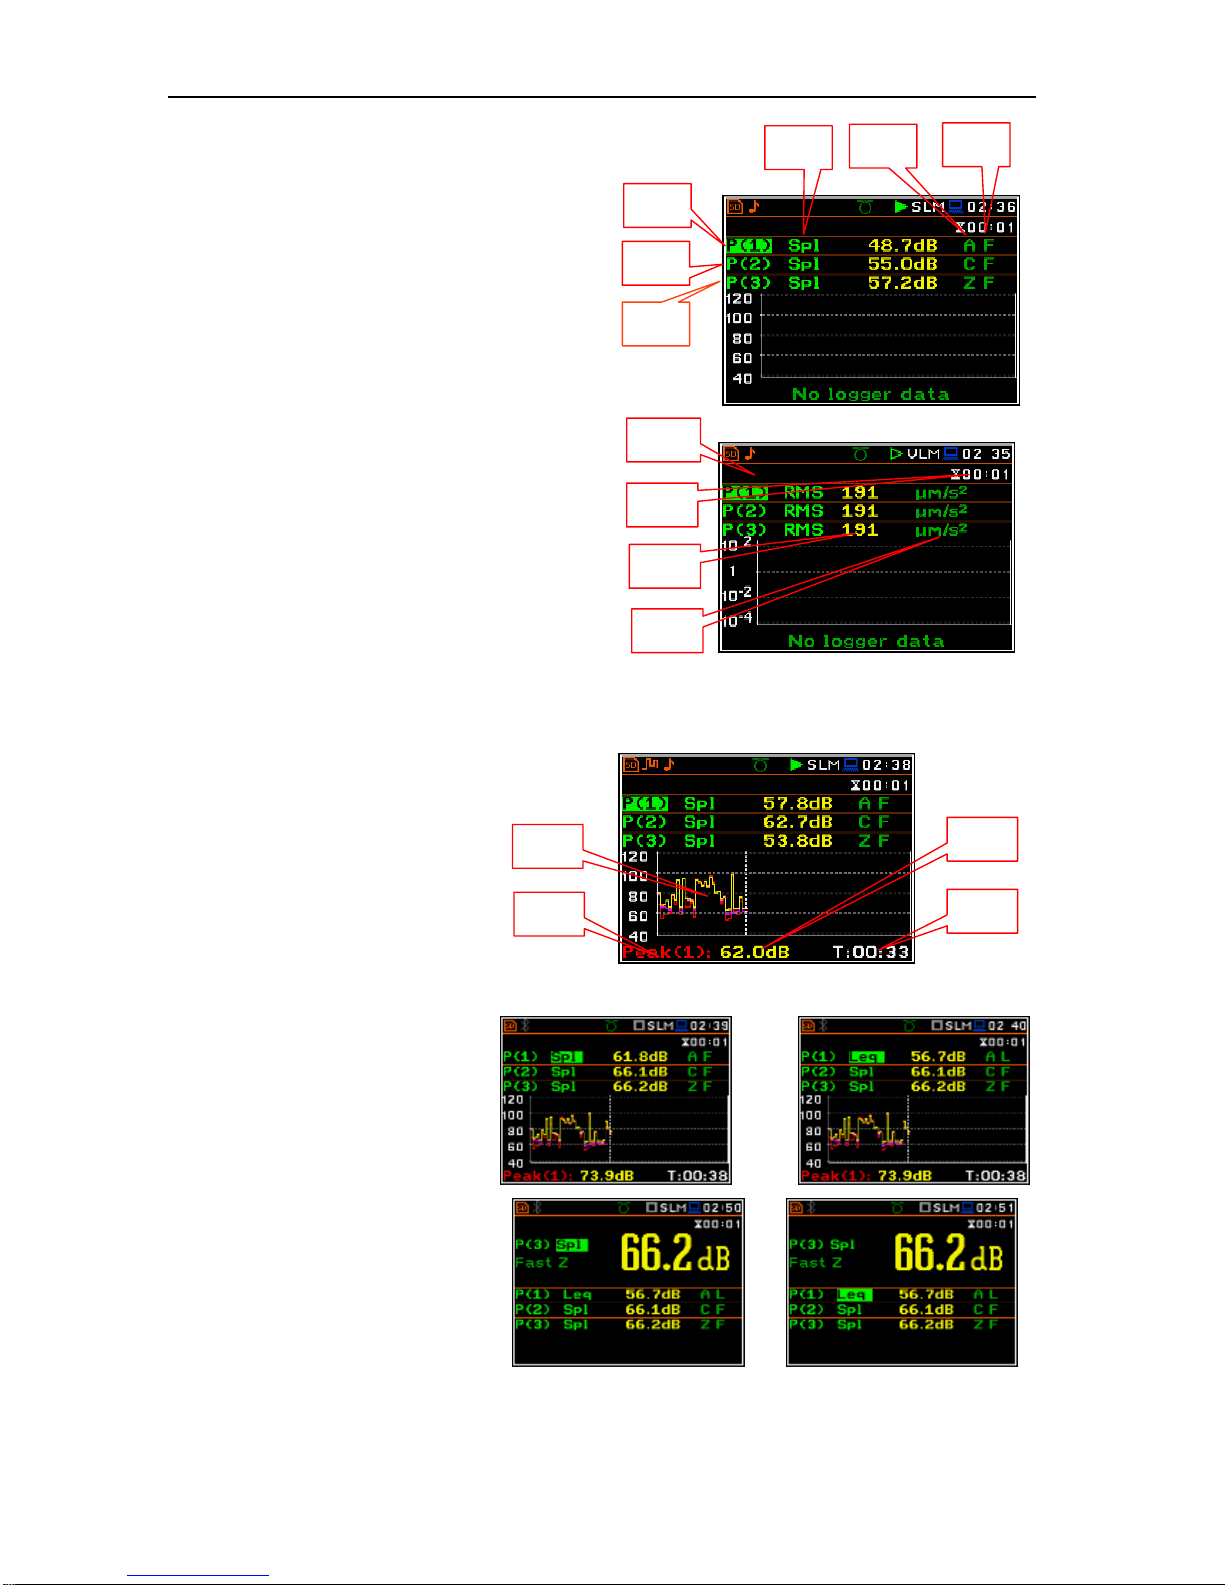
SVAN 979 USER'S MANUAL_______________________________________________ _50
Field description of the 3 Profiles view
1. Result line for Profile 1.
2. Result line for Profile 2.
3. Result line for Profile 3.
4. Function name: Spl, Leq, Sel, Lden, LEPd,
Ltm3, Ltm5, LN%, Ovl, Peak, Max, Min in the
case of Sound measurements or RMS, Ovl,
Peak, P–P, MTVV in the case of Vibration
measurements.
5. The name of the implemented filter: A, C, Z in
the case of Sound measurements. In the case
of Vibration measurements this field is
skipped.
6. Detector time constant: in the case of Sound
measurements when the detector is
exponential: IMP. (I), FAST (F), SLOW (S) or
Lin (L) when the detector is linear. In the case
of Vibration measurements this field is
skipped.
7. Units of the measured value.
8. The value of the measured function.
9. Elapsed time shows the current second of the
measurement. The value presented there
belongs to the range [1, Integration Period].
10. File name when Auto Save function is
activated (path: <Menu> / File / Save Options
/ Auto Save:)
Field description of the Logger
view
1. Logger Plot
2. Function name (Profile number)
3. Function value for cursor position
4. Cursor time position
Changing the field content
The content of some fields can be
changed after pressing the <> and
<> push-buttons together with
<Alt>.
<Alt/>
Changing the active fields
Changing the active field is made by
pressing the <> / <> (vertically)
or <> / <> (horizontally) pushbuttons.
<>
7
9
8
10
6
4
1 2 3
5
1
2
3
4
Page 51
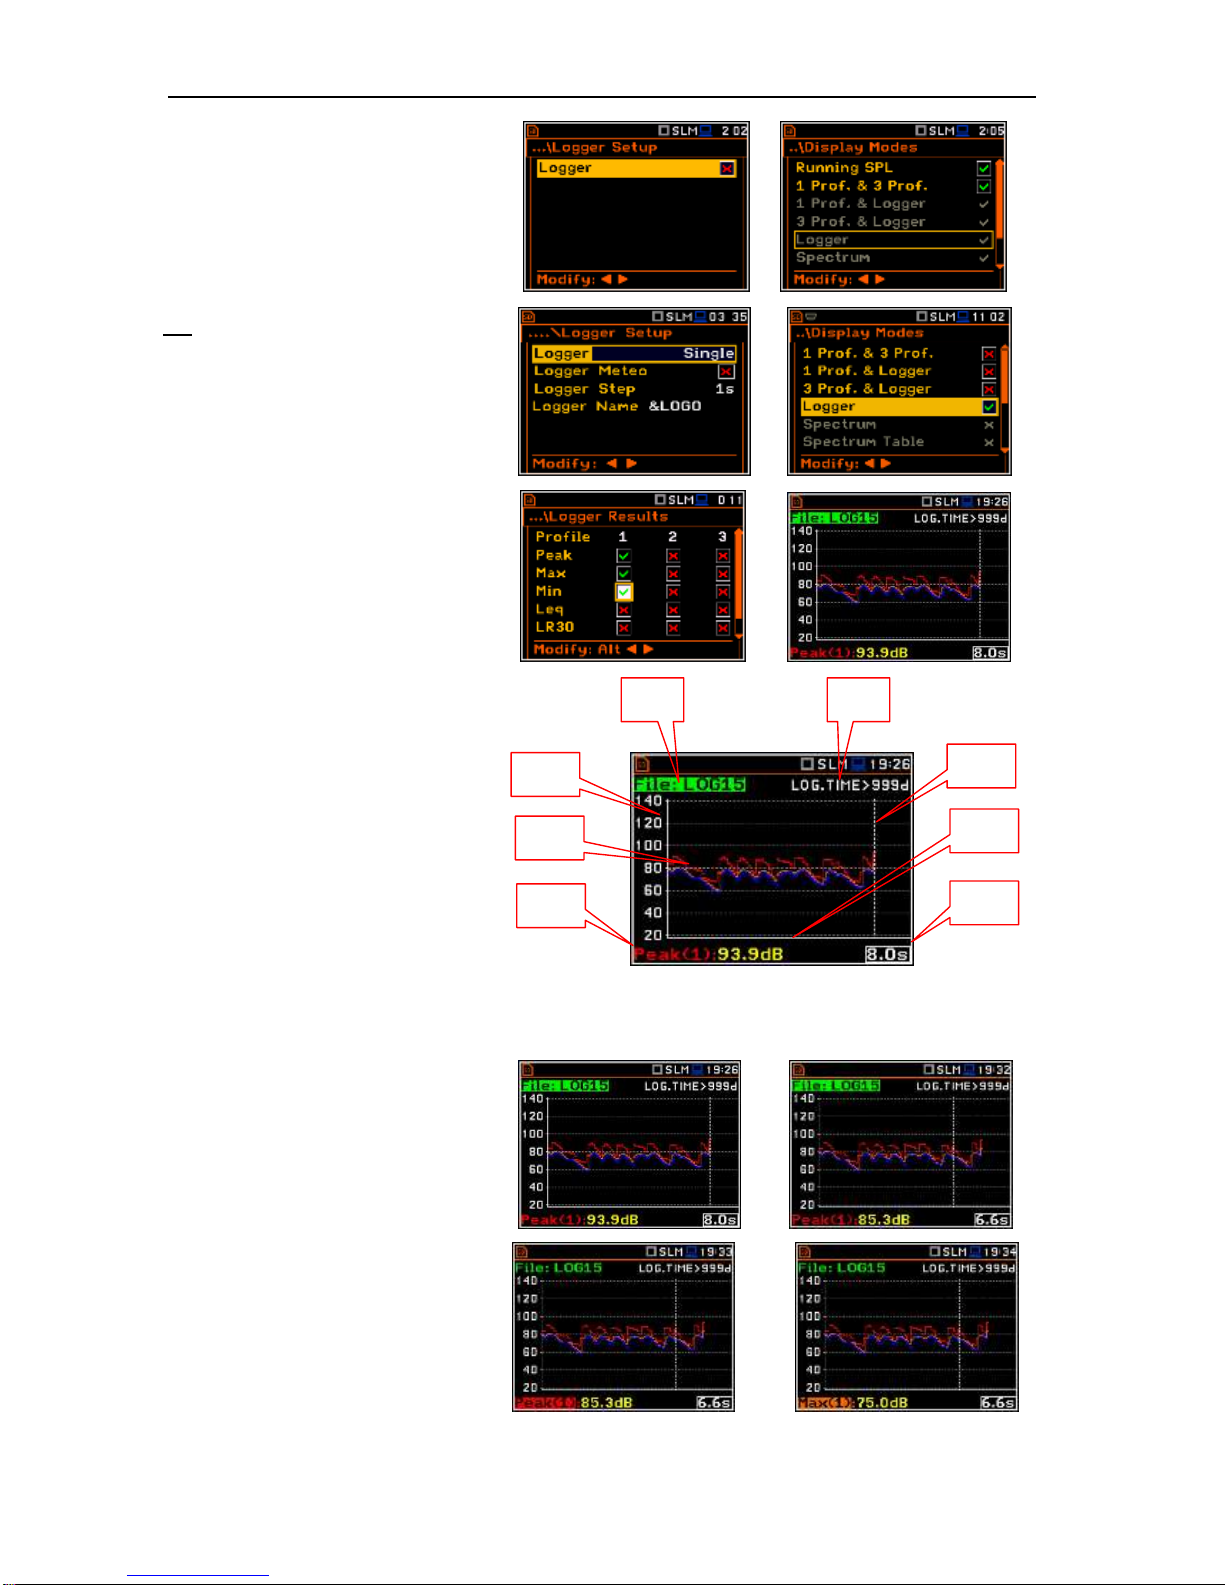
SVAN 979 USER'S MANUAL_______________________________________________ _51
Logger presentation mode
The Logger presentation mode
depends on the settings made in the
Logging list (path: <Menu> /
Measurement / Logging). If Logger
(path: <Menu> / Measurement /
Logging / Logger Setup) is switched
off the Logger presentation mode is
not active!
So, to have this presentation mode
active, the user has to switch the
Logger on!
=>
=>
When Logger is switched on and
there are results selected for logging
then the screen in one profile
visualisation mode is as shown here.
=>
Field description of the Logger
view
1. Y-scale
2. Logger plot
3. Name of the logged result and
profile number
4. Name of the logger file
5. Log. Time displays the time
available for recording the
logging results (limited by
available memory space)
6. Cursor position
7. Result value for the cursor
position
8. Cursor time position
The user may change the cursor
position by means of the <>, <>
push-buttons.
<>...
To switch the cursor from one curve
to another the user should select the
field in the bottom left corner of the
display by means of the <>, <>
push-buttons. Then select the
appropriate curve by means of the
<>, <> push-buttons pressed
together with <Alt>.
<Alt/>
2 3 7 8 1
6
4
5
Page 52
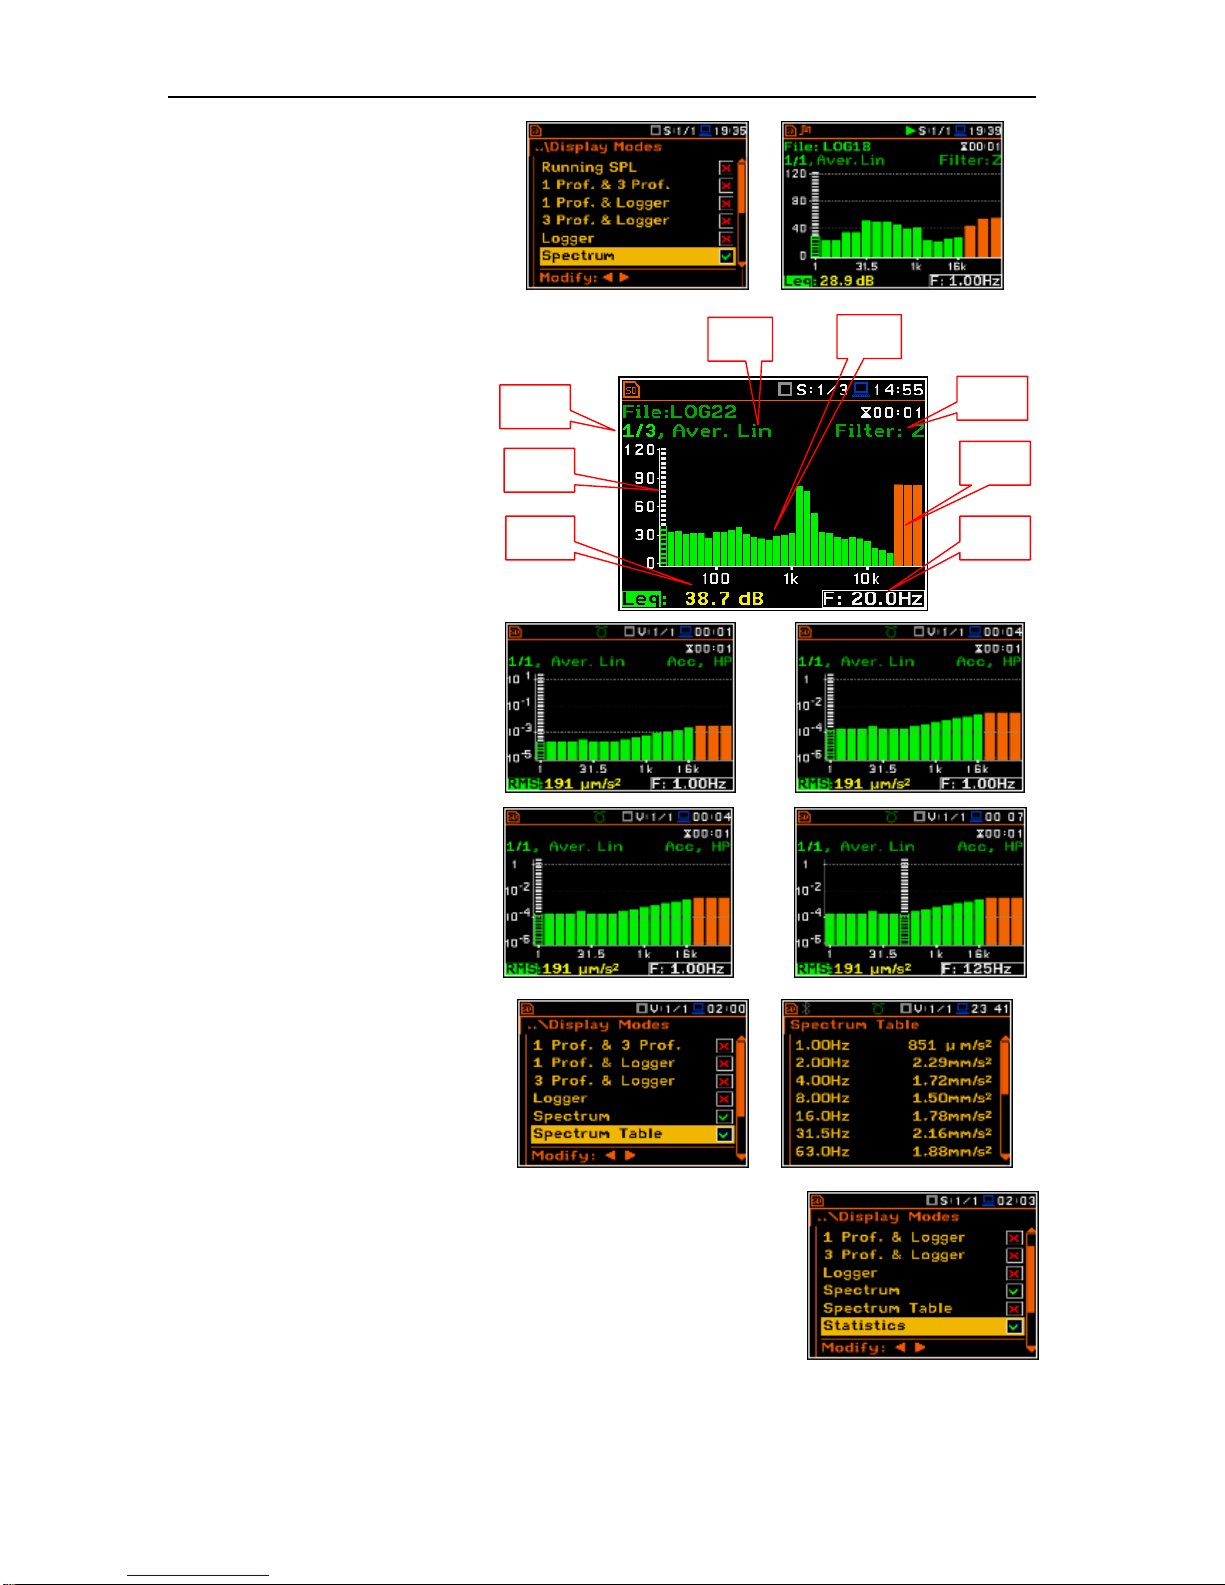
SVAN 979 USER'S MANUAL_______________________________________________ _52
Spectrum presentation mode
The Spectrum position is
accessible only for active
1/1 Octave, 1/3 Octave and FFT
functions (path: <Menu> / Function /
Measurement Function).
=>
Fields description of the
Spectrum view
1. Averaging type
2. Cursor position
3. Value for the cursor position
4. Averaging used (Lin or Exp)
5. Spectrum plot
6. Frequency weighting filter used
7. Total values
8. Central frequency for the cursor
position.
The user may shift the Y-axis during
the spectrum presentation after
pressing the <Shift> and <> (or
the <Shift> and <>) push-buttons.
<Sh/>
The user may change the cursor
position by means of the <>, <>
push-buttons. The frequency and
the appropriate value are presented
in the line below the plot. Press the
<>, <> push-buttons with
<Shift> to move straight to the first
or last displayed band on screen.
<> ...
Switching on/off spectrum table
view
The Spectrum Table position is
accessible in 1/1 Octave -
1/12 Octave function (path: <Menu>
/ Function / Measurement Function).
=>
Statistics presentation mode
The Statistics position is accessible only for Sound measurements.
Statistics is the cumulative probability density function of exceeding the
noise level during the measurement period. The X axis defines the
probability of exceeding the noise level, statistical level LN%, and the Y
axis defines the calculated noise level in dB.
2
3 7 8
1 6 4
5
Page 53
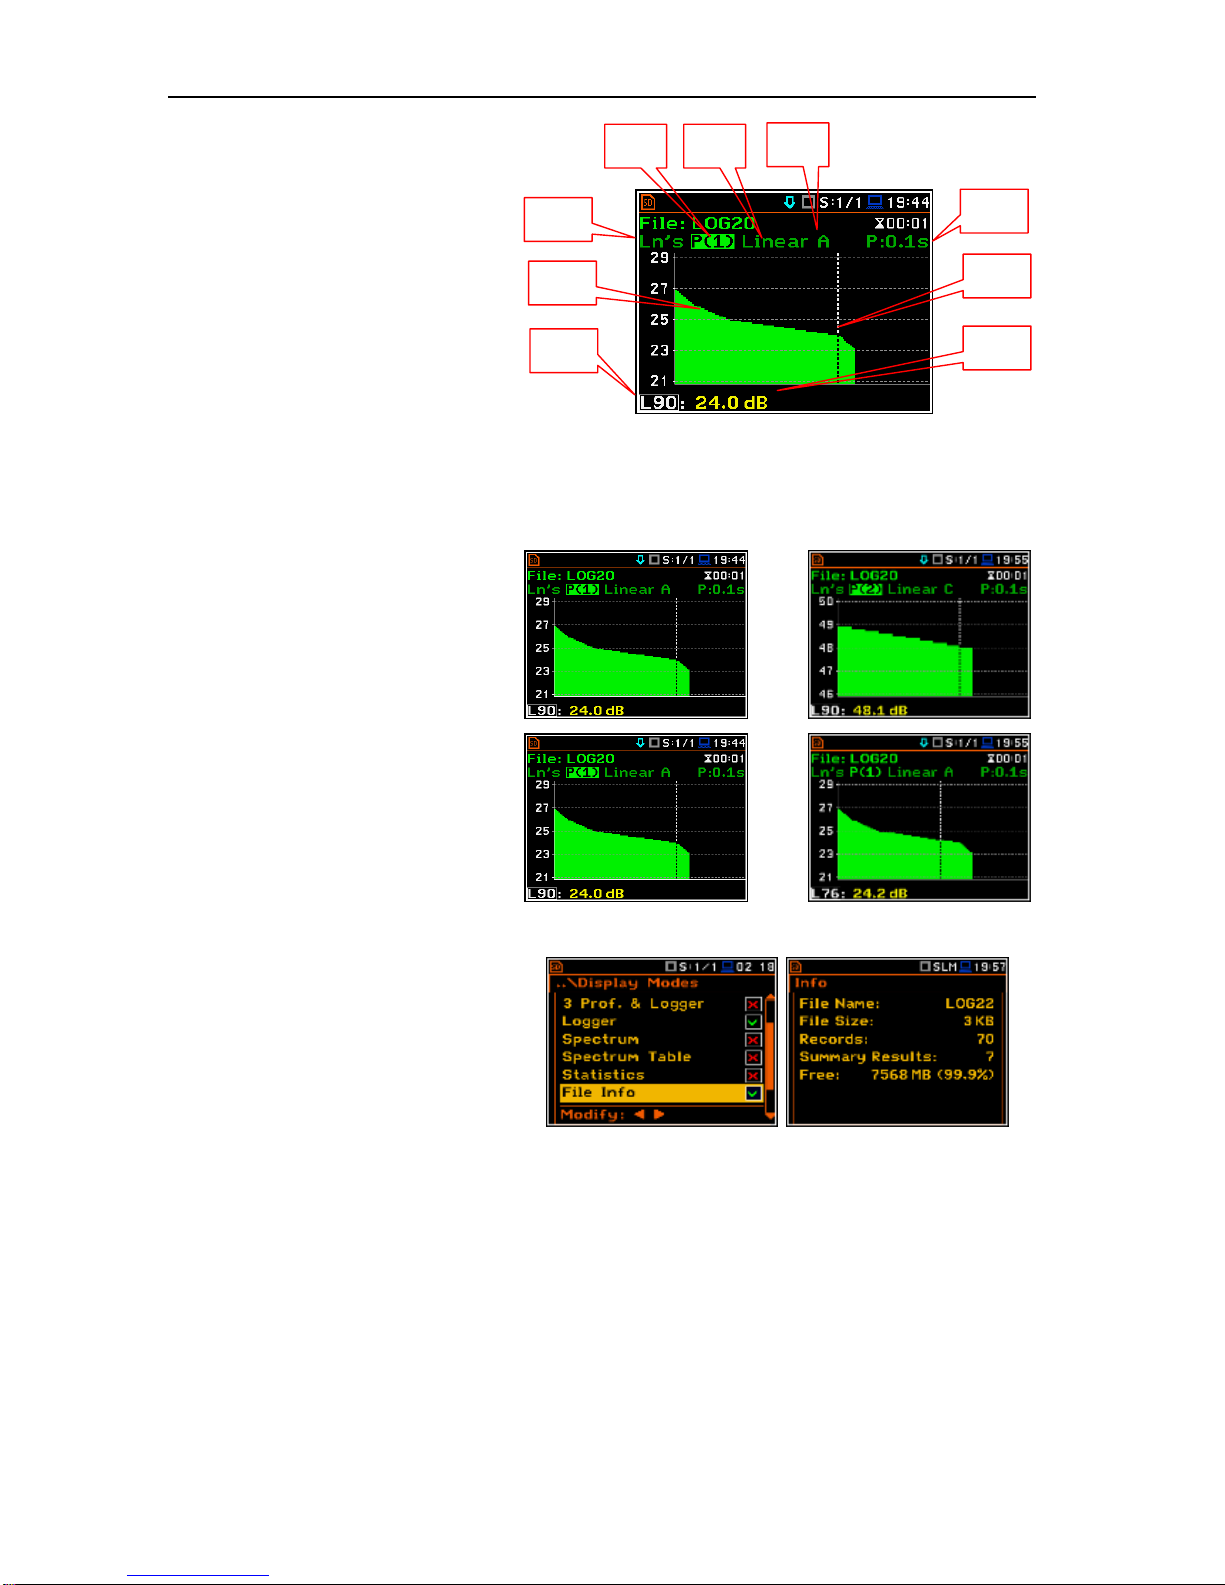
SVAN 979 USER'S MANUAL_______________________________________________ _53
Field description of the Statistics
view
1. Function name
2. Statistics plot
3. Statistical level (LN% percentile
value) for the active cursor
position
4. Active profile (P1, P2 or P3)
5. RMS detector (Lin., or Exp.: Fast,
Slow or Imp.)
6. Frequency filter used (A, C or Z)
7. The sampling interval for the LN%
values calculated by the meter
(0.1 s)
8. Cursor position
9. Value of the selected statistical
level LN% and units (dB)
The change between positions is made
by pressing the <> or <> pushbuttons.
When position is chosen, its value is
changed by pressing the <> and
<> push-buttons simultaneously with
<Alt>.
When the LN% field is active the user
may change the cursor position using
the <>, <> push-buttons. The
statistical level (%) and appropriate
(dB) value are presented in the line
below the plot.
Press the <>, <> push-buttons with
the <Shift> button to go straight to the
first or last LN% position on the screen.
<Alt/>
<> …
File information presentation mode
The File Info position switches on or off
the additional file information
description during the measurement.
The File Info window indicates the file
name, its size, date and time of the
recording of the main results (cf.
App. B) and time (Elapsed Time)
during which the main results saved in
the logger were measured. The value
presented there is in the range [1,
Integration Period] and depends on
the moment and the way the
measurements were stopped.
2 3 8 9 1
7
4 5 6
Page 54
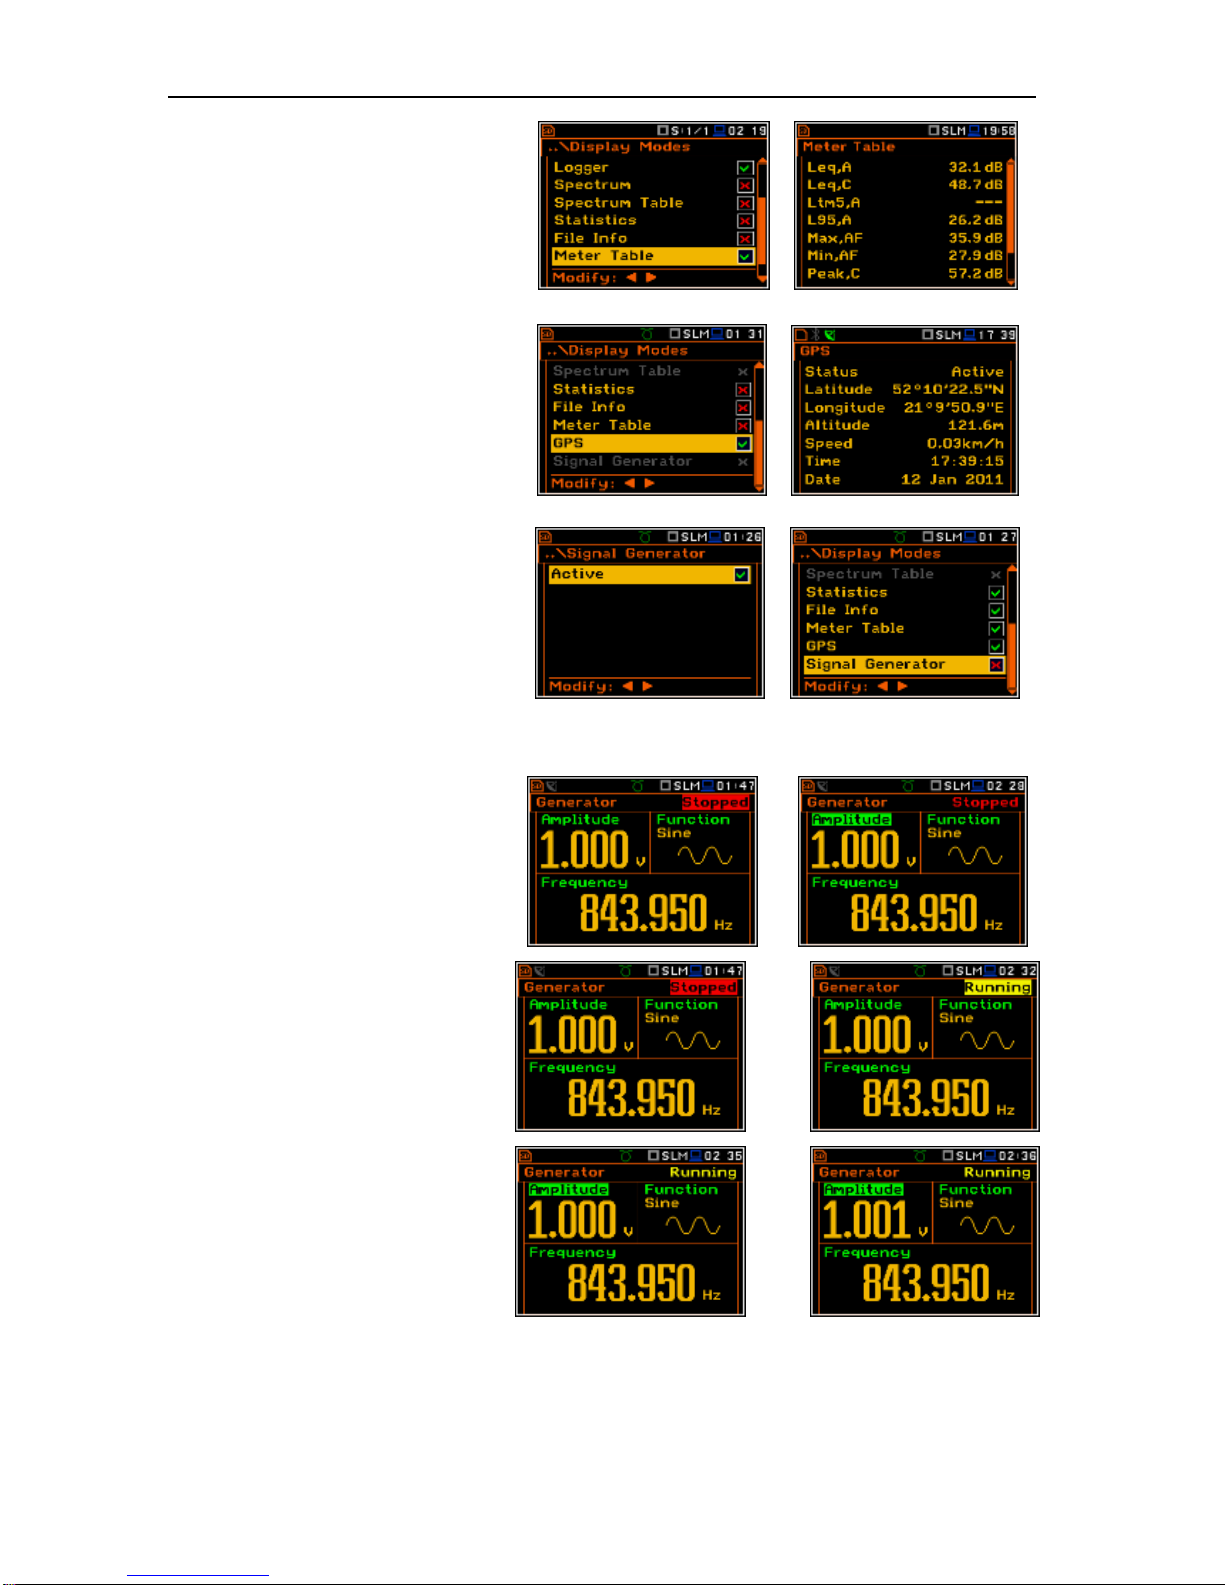
SVAN 979 USER'S MANUAL_______________________________________________ _54
View of the measurement results
The measured results may be also
displayed as a list of all measured
functions in profiles with assigned
frequency filters and time constants. In
case the same functions are set up in
two profiles the results for the first
profiles will be displayed.
View of the GPS information
The GPS view enables the user to
display the information from GPSdevice connected to the USB port of the
instrument. The GPS view will be active
only if options GPS - USB Host or
GPS - USB are active (path: <Menu> /
Instrument / Communication Ports).
Signal Generator
The Signal Generator view enables
the user to access the display screen,
which controls the signal generator
function of the instrument. This position
is active only when the
Signal Generator function is switched
on (Active) in the Instrument menu
(path: <Menu> / Instrument /
Signal Generator).
=>
In the Signal Generator view the user
may move from one field to another
with the use of the <> or <> pushbuttons and to change the field value
pressing the <> and <> pushbuttons pressed simultaneously with
<Alt>.
<>
To switch the Signal Generator on or
off the user has to select the Generator
field and change its value from
Stopped to Running by means of the
<> or <>, push-button, pressed
together with <Alt>.
<Alt/>
To change the amplitude of the
generated signal the user should select
the Amplitude field and to change its
value by means of the <> and <>
push-buttons pressed together with
<Alt>.
<Alt/>
Page 55
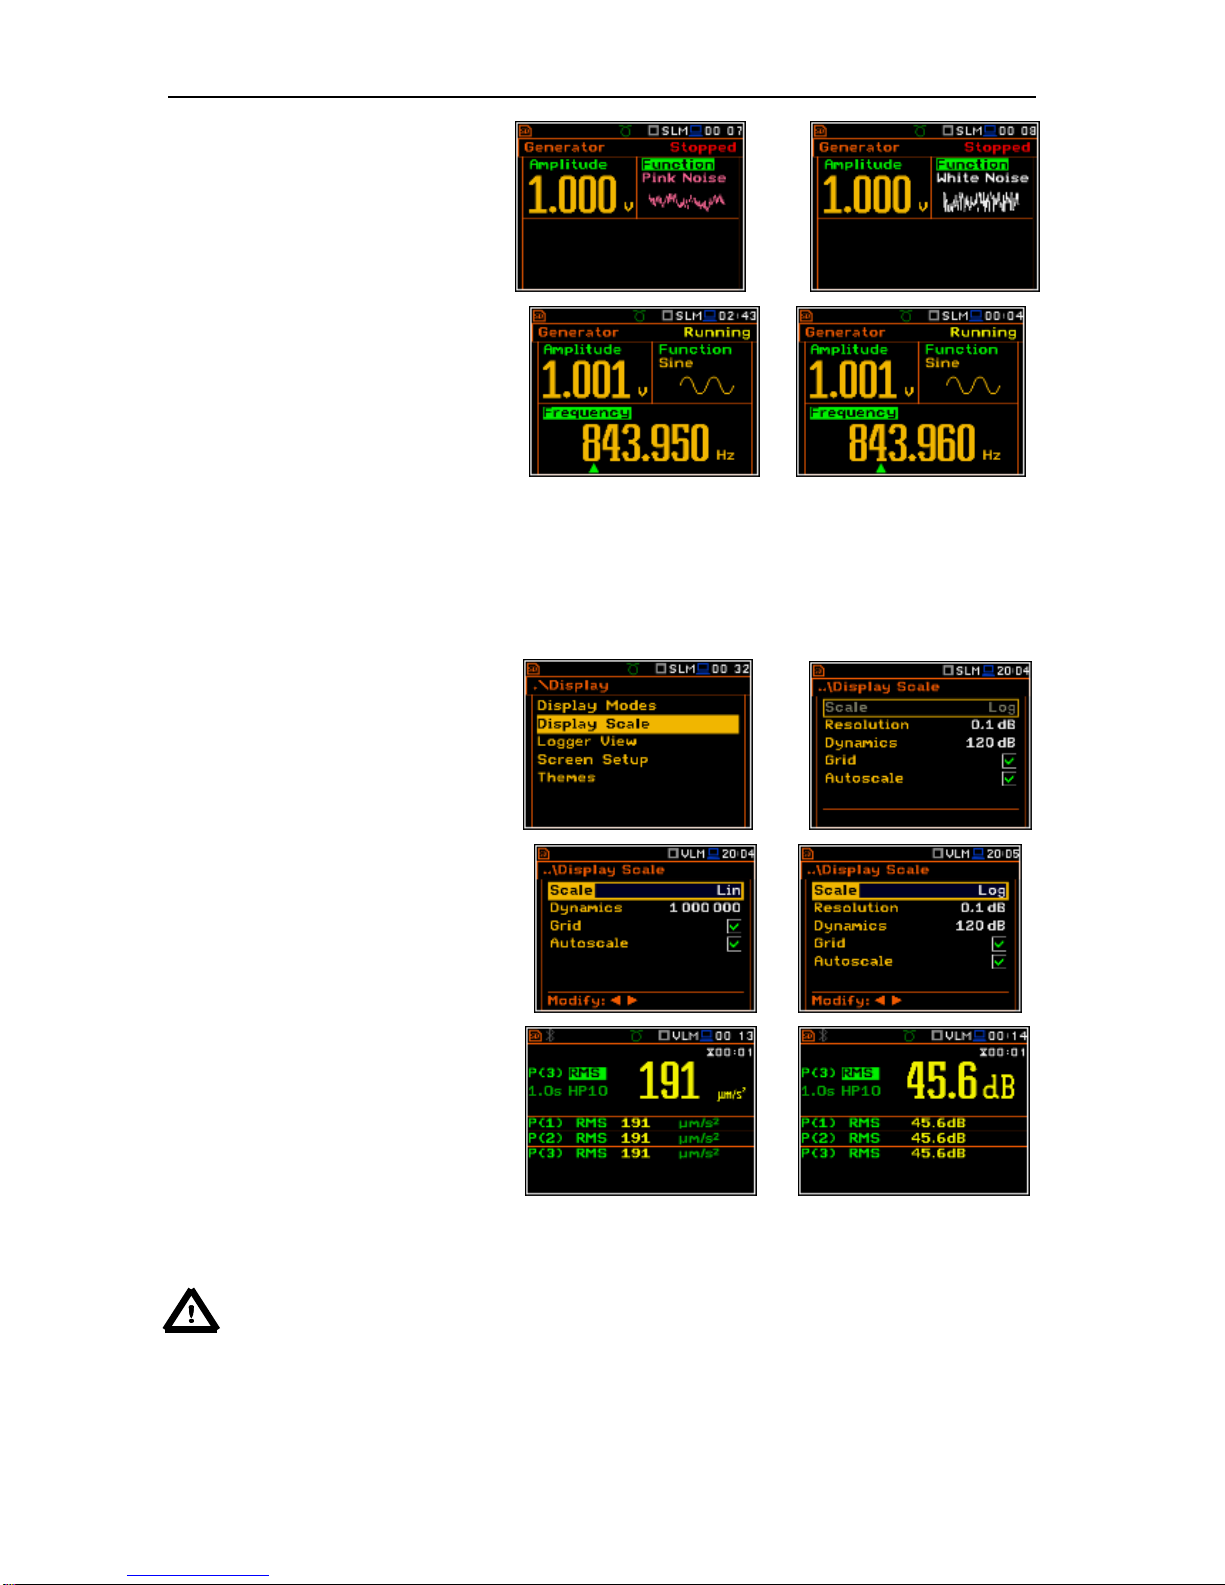
SVAN 979 USER'S MANUAL_______________________________________________ _55
To change the type of the generated
signal the user should select the
Function field and to change its value
by means of the <> and <> pushbuttons pressed together with <Alt>.
There are three available functions:
Sine, Pink Noise and White Noise.
<Alt/>
To change the frequency of the
generated signal the user should select
the Frequency field, then select the
digit to be changed by means of the
<> and <> push-buttons. The digit
selection will be marked by green
cursor (arrow) at the bottom line of the
screen. The user may change the value
of the selected digit by means of the
<> and <> push-buttons pressed
simultaneously with <Alt>.
<>
6.2 Setting scale and grid of the plot - Display Scale
The Display Scale sub-list enables the
user to change the displayed dynamic
scale in the available modes of
graphical presentation of the
measurement results and switch the
horizontal grid lines on or off.
<ENT>
Setting the scale of the
measurement results presentation
The Scale position is accessible only in
the case of Vibration measurement
modes. Two options are available: Lin
(linear) and Log (logarithmic). In case
of Lin the graphical presentation and
the units are linear. In case of Log the
graphical presentation is given in the
logarithmic scale and the measurement
results are expressed in decibels (the
result is related to the values set in the
Reference Levels window (path:
<Menu> / Auxiliary Setup /
Reference Levels).
In case of the sound measurements the
Scale position is not active. All results
are presented in dB.
<>
Notice: In the Vibration modes the parameters can be presented in logarithmic (decibels) or
linear (m/s2) units. It depends on the Display Scale position (path: <Menu> / Display /
Display Setup / Display Scale / Log or Lin), e.g. 10 m/s2 can be presented as 140 dB.
Page 56
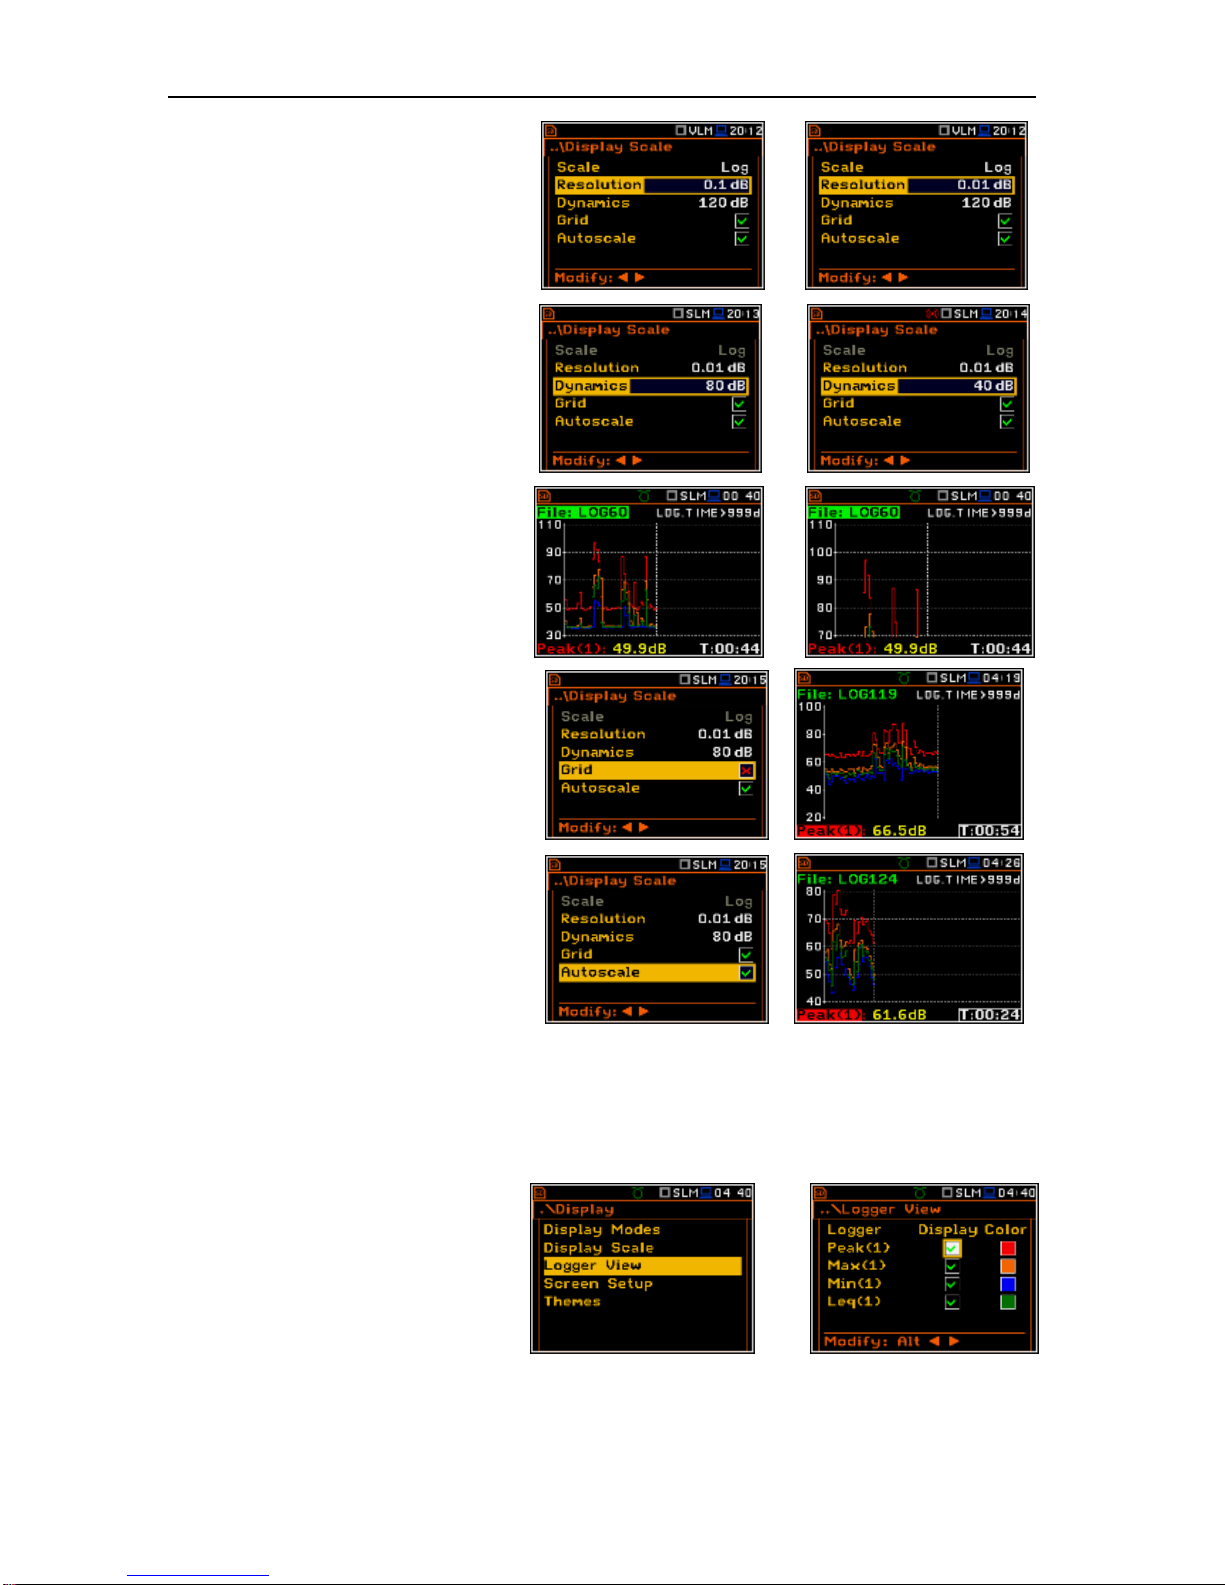
SVAN 979 USER'S MANUAL_______________________________________________ _56
The Resolution position defines the
number of digits after the decimal point in
the presented results: one digit after the
decimal point (0.1 dB) or two digits after
the decimal point (0.01 dB).
<>
Scaling the vertical axis
The Dynamic position enables the user
to select the required dynamic range
scaling of the graphical mode display
presentation. It is possible to select the
range from the set: 10dB, 20dB, 40dB,
60dB, 80dB, 100dB and 120dB.
<>
Switching the plot grid on/off
The Grid position enables the user to
switch on or off the horizontal plot grid
lines in any graphical presentation.
=>
Switching the automatic Y-scale
adjustment on/off
The Autoscale position switches on the
automatic adjustment of the Y axis. The
adjustment is performed once
automatically after the start of the
measurement to suit the initial level of the
input signal from the microphone or
accelerometer.
=>
6.3 Setting the parameters of the logger files presentation - Logger View
The Logger View position enables the
user to change the colour of the curves for
graphical presentation of the results
which are saved in the logger file.
<ENT>
Page 57
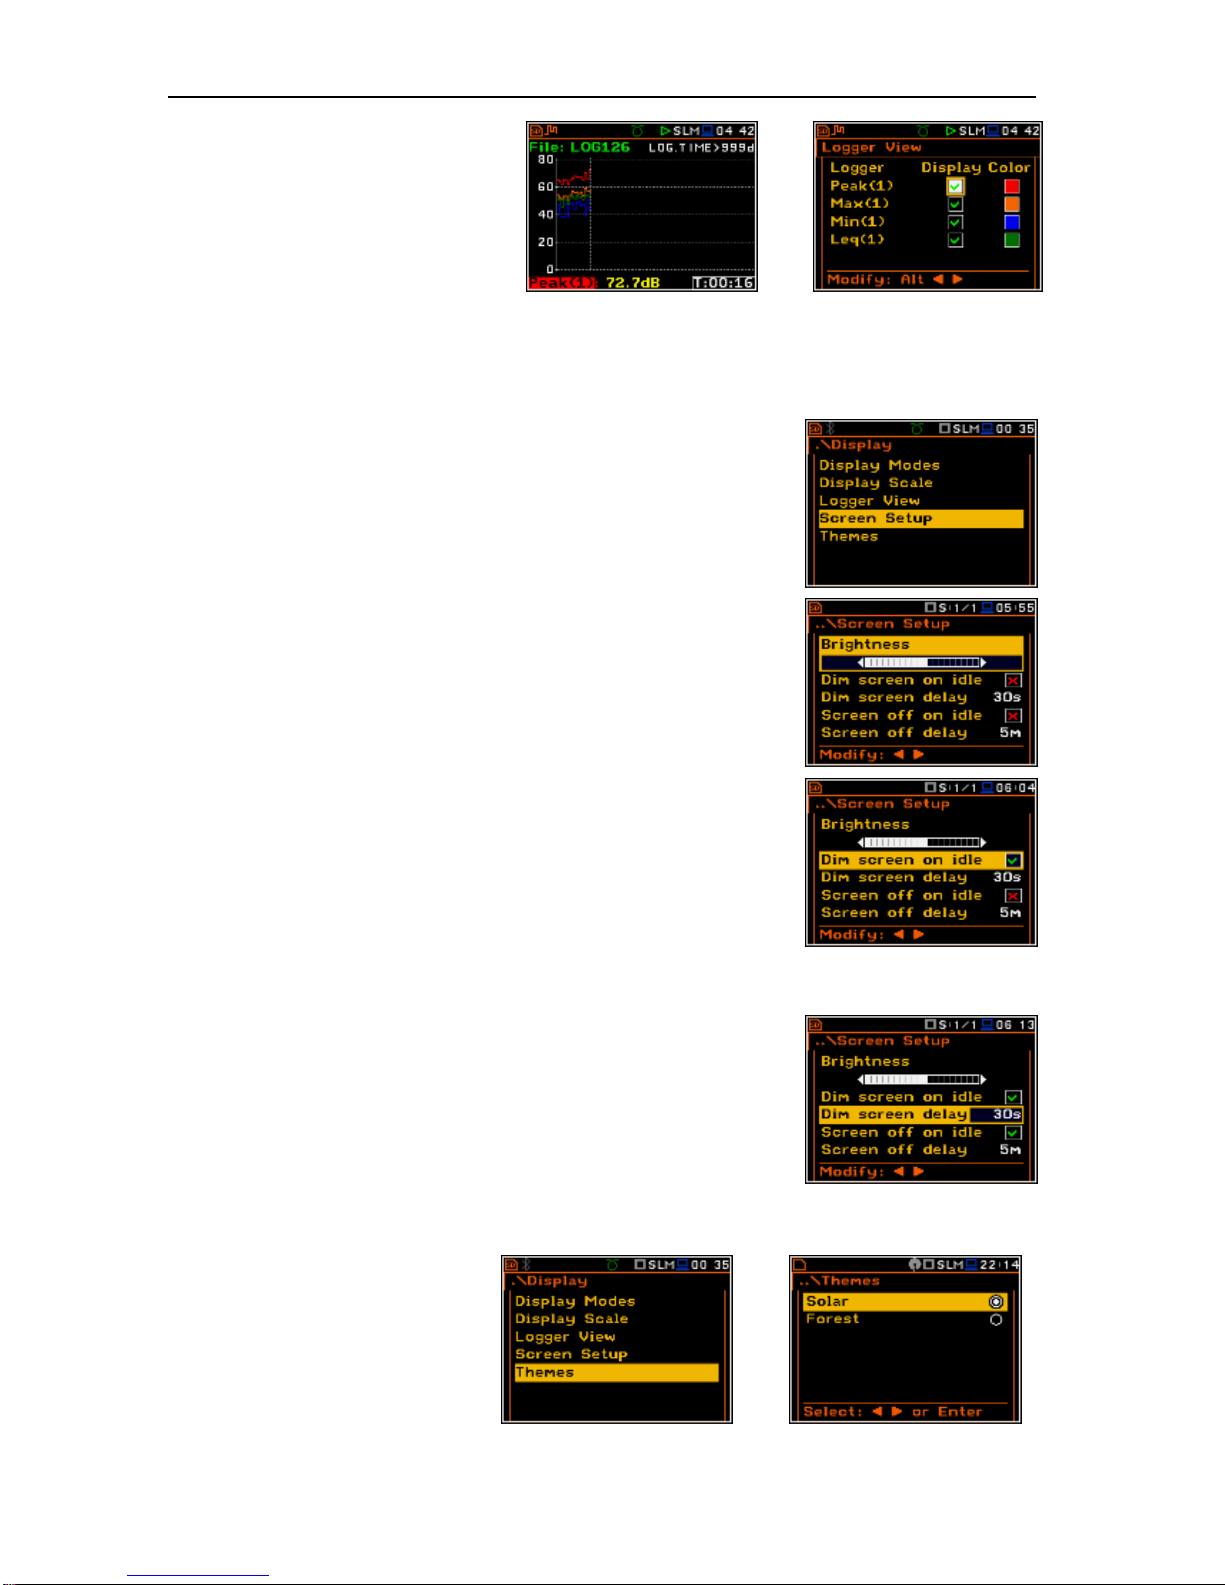
SVAN 979 USER'S MANUAL_______________________________________________ _57
The view of the logger screen can be
adjusted quickly without stopping the
measurement. Highlight the function label
in the bottom left hand corner then press
the <ENTER> push-button and the
Logger View list is displayed. The user
may make necessary adjustments and
return to the Logger view after
confirmation of the performed changes by
means of the <ENTER> push-button.
<ENT>
6.4 Setting the display brightness and power saver- Screen
The Screen Setup window enables the user to set the brightness of the
display and to switch on the screen saver mode to save battery power.
Setting the brightness of the display
The Brightness position enables the user to set the proper brightness of
the display by means of the <>, <> push-buttons. The user can select
20 different values of this parameter. The new value of the brightness level
is shown on screen after each press of the <> or <> push-buttons.
Setting the power saver function
Saving the internal source of the instrument’s power can be achieved by
reducing the brightness of the screen whenever possible.
There are two options for the power saver function. The screen may be
switched off (Screen off on idle) and/or dimmed (Dim screen on idle).
When either of these options is set, after a delay, set by the parameters
Dim screen delay or Screen off delay, from pressing any push-button the
screen is dimmed or switched off. If it happens while in use, the first press
of any push-button will cause the screen to switch back on again.
Setting the power saver delay
The power saver delay defines the delay period from last use of any pushbutton to the power saver mode. This delay period can be set for
Dim screen on idle from 5 s to 60 s and for Screen off on idle from 1 m
to 60 m. The <ENTER> push-button must be pressed for confirmation of
the selection, which then also closes the Screen Setup window. Press
<Esc> to exit the Screen Setup window without changing the settings.
6.5 Setting the colour theme of the display – Themes
The Themes window enables the
user to set the colour theme of the
display
It is possible to choose between
Solar and Forest themes. Solar
theme is presented in this Manual.
Forest theme is presented below.
<ENT>
Page 58
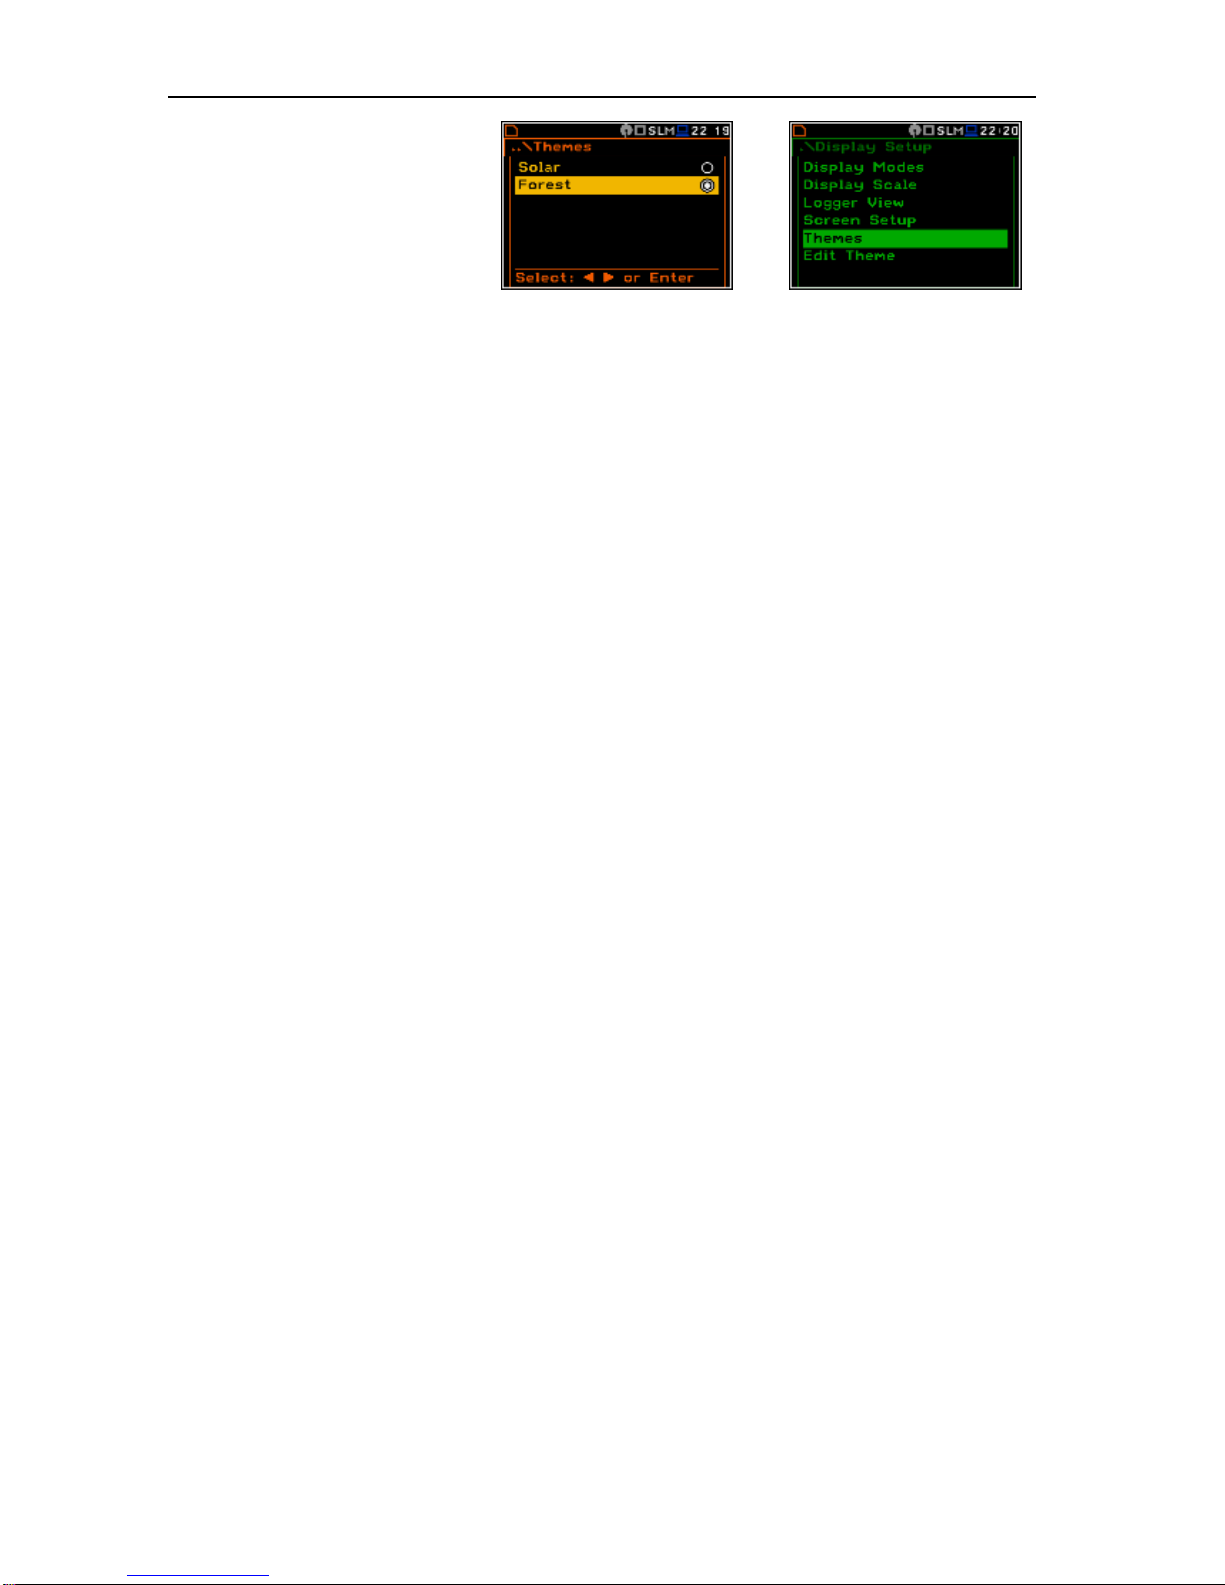
SVAN 979 USER'S MANUAL_______________________________________________ _58
The default colour themes (Solar
and Forest) are optimised to
decrease the energy consumption
of the OLED display.
<ENT>
Page 59
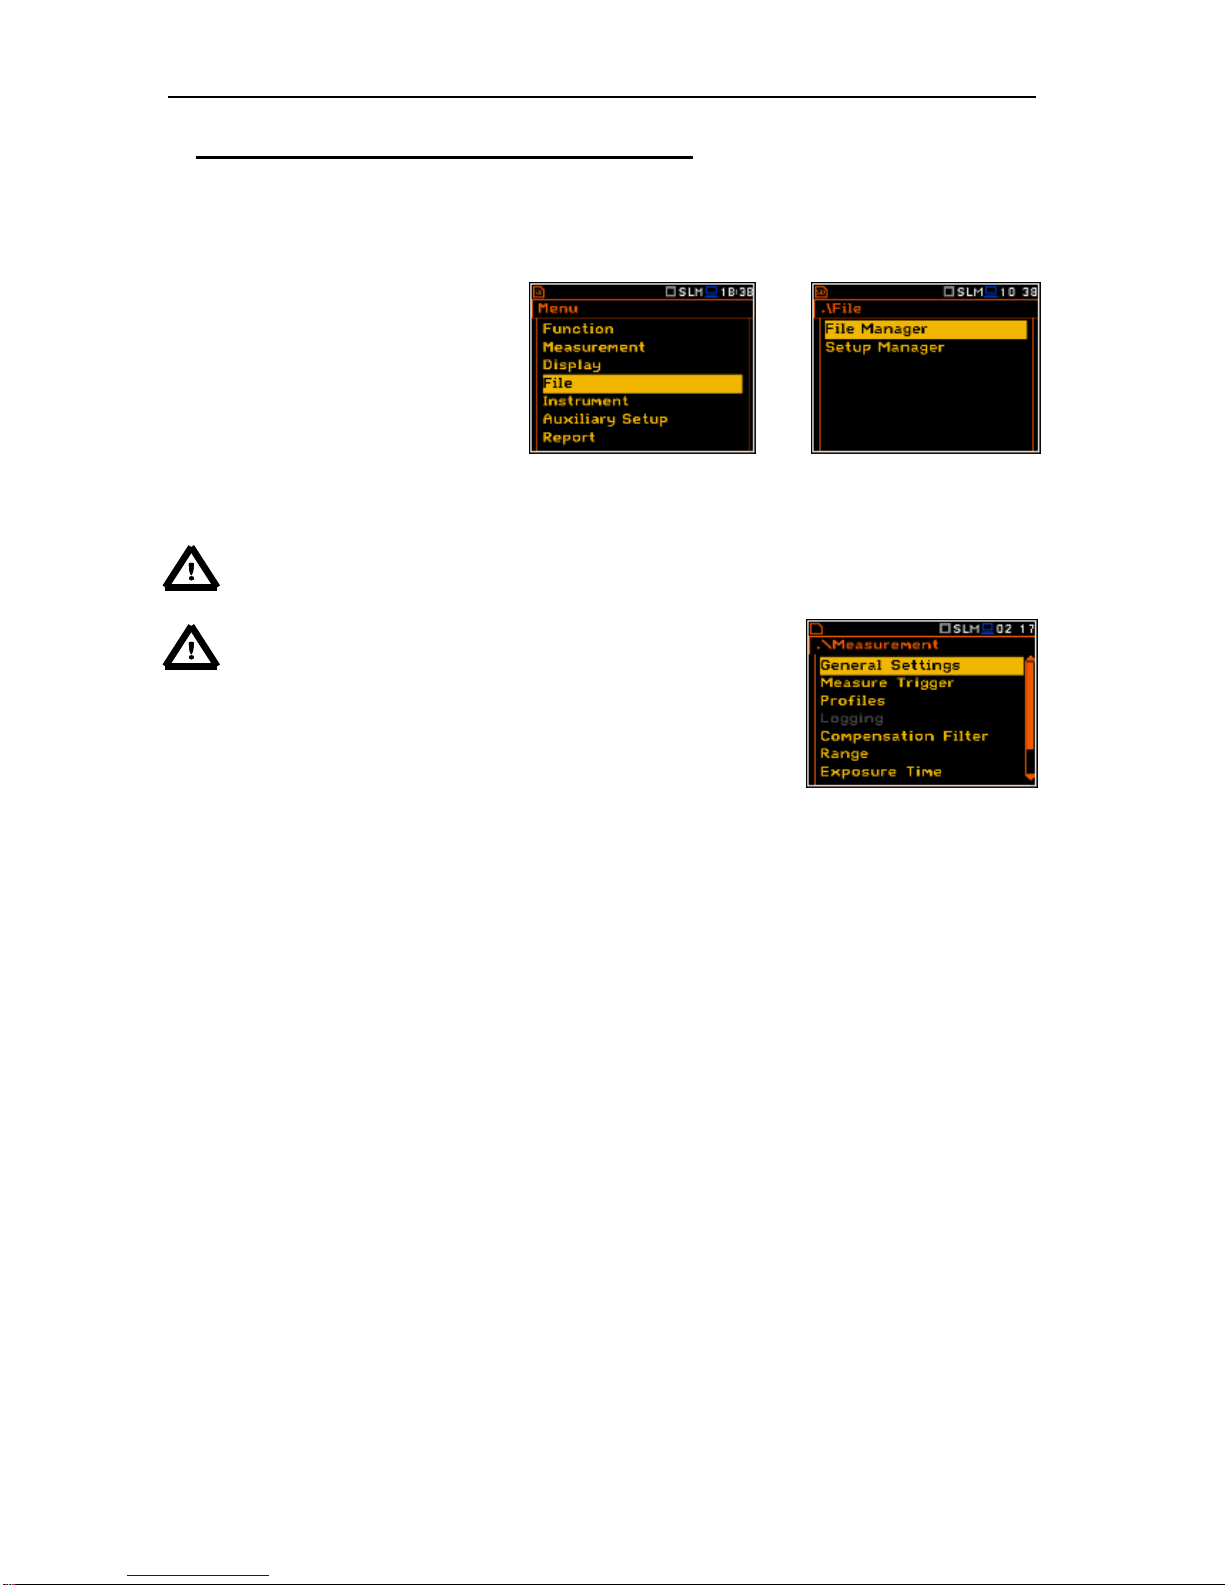
SVAN 979 USER'S MANUAL_______________________________________________ _59
7. SAVING THE MEASUREMENT RESULTS – File
Recording the measurement results is an essential task for the efficient use of the instrument. All available
measurement results and also the instrument's settings are stored as a file on the external memory – micro
SD Card or USB Disk.
The File list contains the elements that
enable the user to manage the data files,
created and saved in the external memory
media (micro SD card or USB carriers).
The File list contains the following items:
<ENT>
File Manager enables the user to manage the files saved on SD card;
Setup Manager enables the user to manage the Setup files saved on SD card;
Note: Positions in the File list are active only when an SD Card is inserted into the card slot
behind the bottom cover of the instrument or USB Disk is attached to the USB connector and
initialized.
Notice: Because of limited internal memory capacity of the
instrument data files can be saved on the external memory
only. So, if there is no SD Card or USB Disk connected to the
instrument then there is no possibility to create files. In such
cases the Logging position in the Measurement list is not
active.
Instrument's files may contain data:
• measurement and time history results, spectra, event and marker recording;
• time waveform recordings; (available as an option)
• measurement configuration setups.
The detailed description of all types of file structures is given in the Appendix B.
The elements of the file structure depend on the selected function (Level Meter, 1/1 Octave, 1/3 Octave,
etc.), logging settings. These elements are as follows:
• main results;
• histories of results,
• results of statistical analysis;
• audio time waveform recording,
• results of 1/1 Octave - 1/12 Octave analysis;
• results of FFT analysis;
• statistics for 1/1 - 1/12 octaves,
• results of RT60 analysis,
• results of tonality analysis,
• results of loudness analysis.
7.1 Manual saving of Summary Results
In chapter 3.5 it was briefly described that Summary Results may be saved manually in the independent
file. There are two options for saving files with Summary Results manually.
Page 60
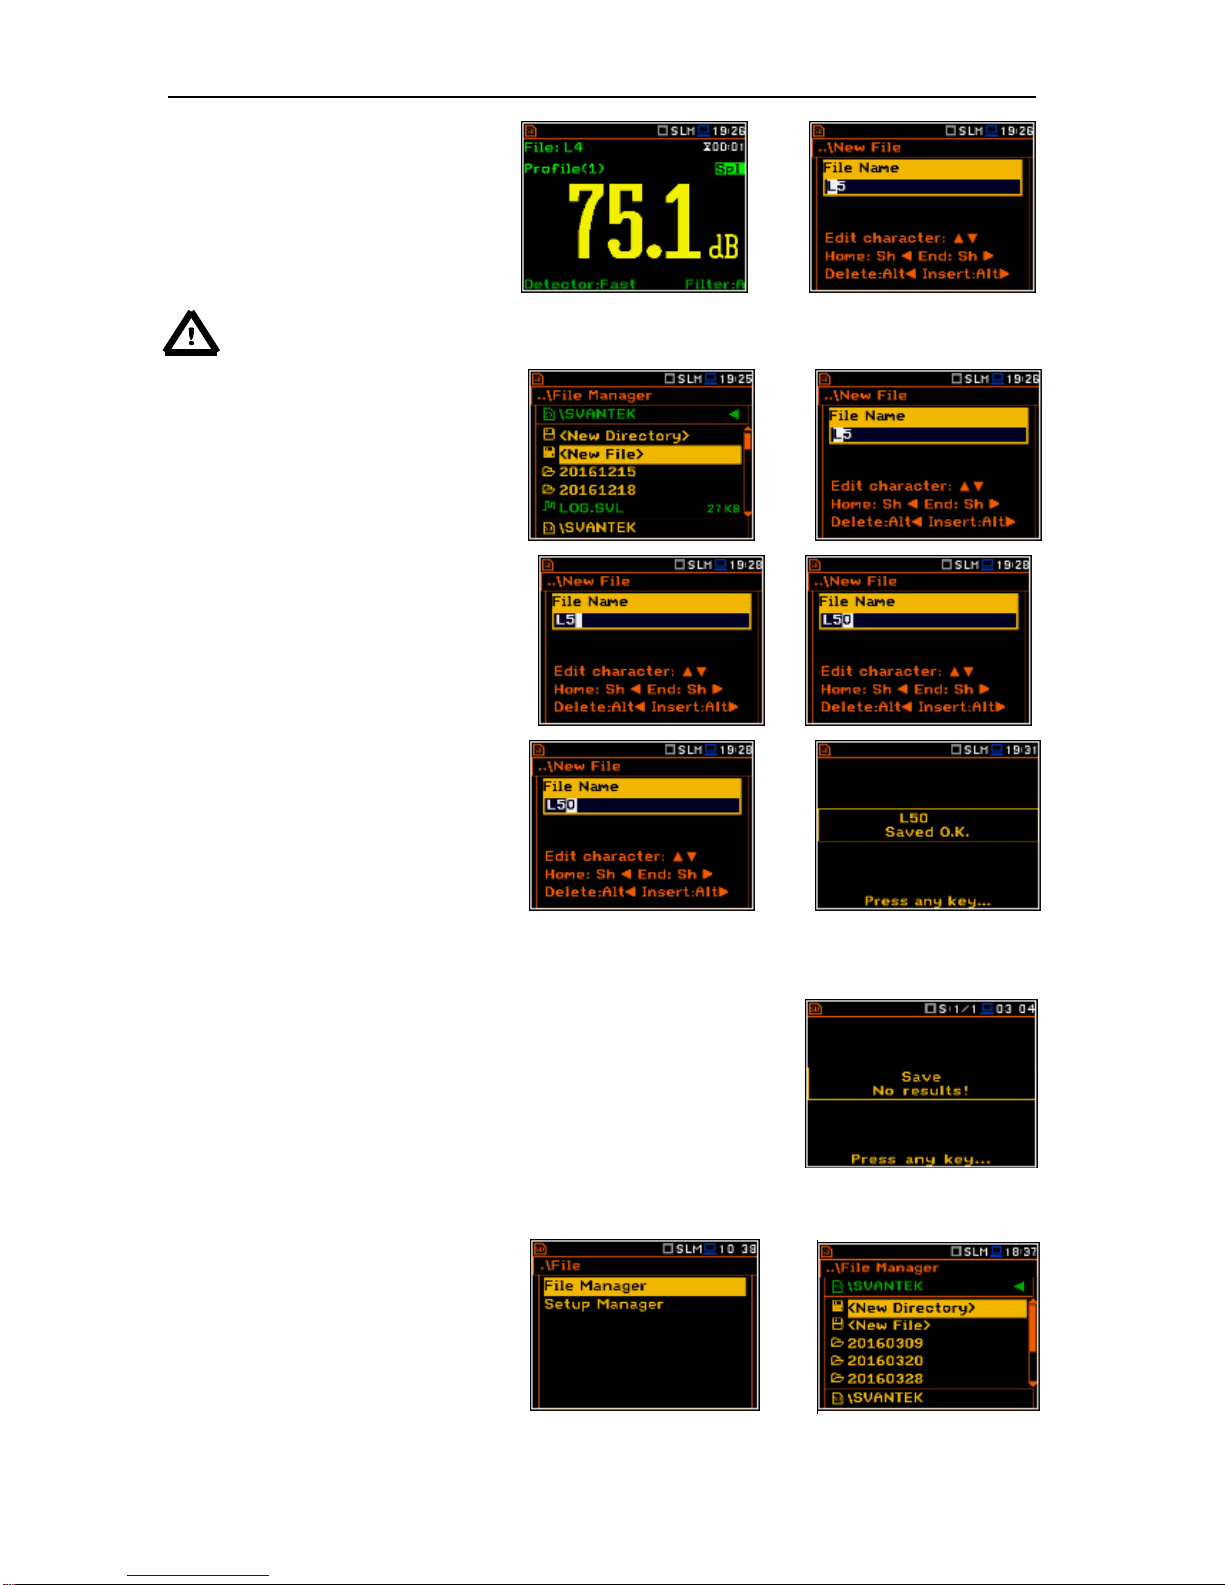
SVAN 979 USER'S MANUAL_______________________________________________ _60
One option is to press the <Save> pushbutton right after the measurement has
finished.
After pressing the <Save> push-button
the New File window appears.
<Save>
Notice: While saving file with the use of the <Save> push-button the file is always saved in the
predefined catalogue, which is set by the Set as Working Dir. command.
Another option is to open the
File Manager window, enter the
catalogue in which the new file will be
created and press the <ENTER> pushbutton at the <New File> position. The
New File window is then opened.
<ENT >
The editing of the file name is performed
in accordance with the help information in
the window.
All changes made to the file name during
editing are ignored after pressing the
<ESC> push-button and the instrument
returns to the File list.
<>
The edited name is accepted and the
instrument returns to the File Manager
window after pressing the <ENTER>
push-button. The second press of the
<ENTER> push-button saves the file in
the working directory. In case the file with
the edited name already exists in the
memory the instrument then rename it
and save as the file with the file number
higher by one than the highest file number
in this catalogue.
<ENT >
Saving is not possible when the instrument is measuring the signal. The
message “Measurement in progress!” is displayed for about 3 seconds.
When no measurements were performed and there are no results to be
saved the special message is displayed as shown here.
7.2 Managing files saved in the external memory – File Manager
The File Manager is used for checking
the contents of the memory and
performing operations on result and
logger files such as: open, delete, copy,
move, rename, create new files (data
files) or catalogues (directories) and
display useful file and catalogue
information.
<ENT>
Page 61
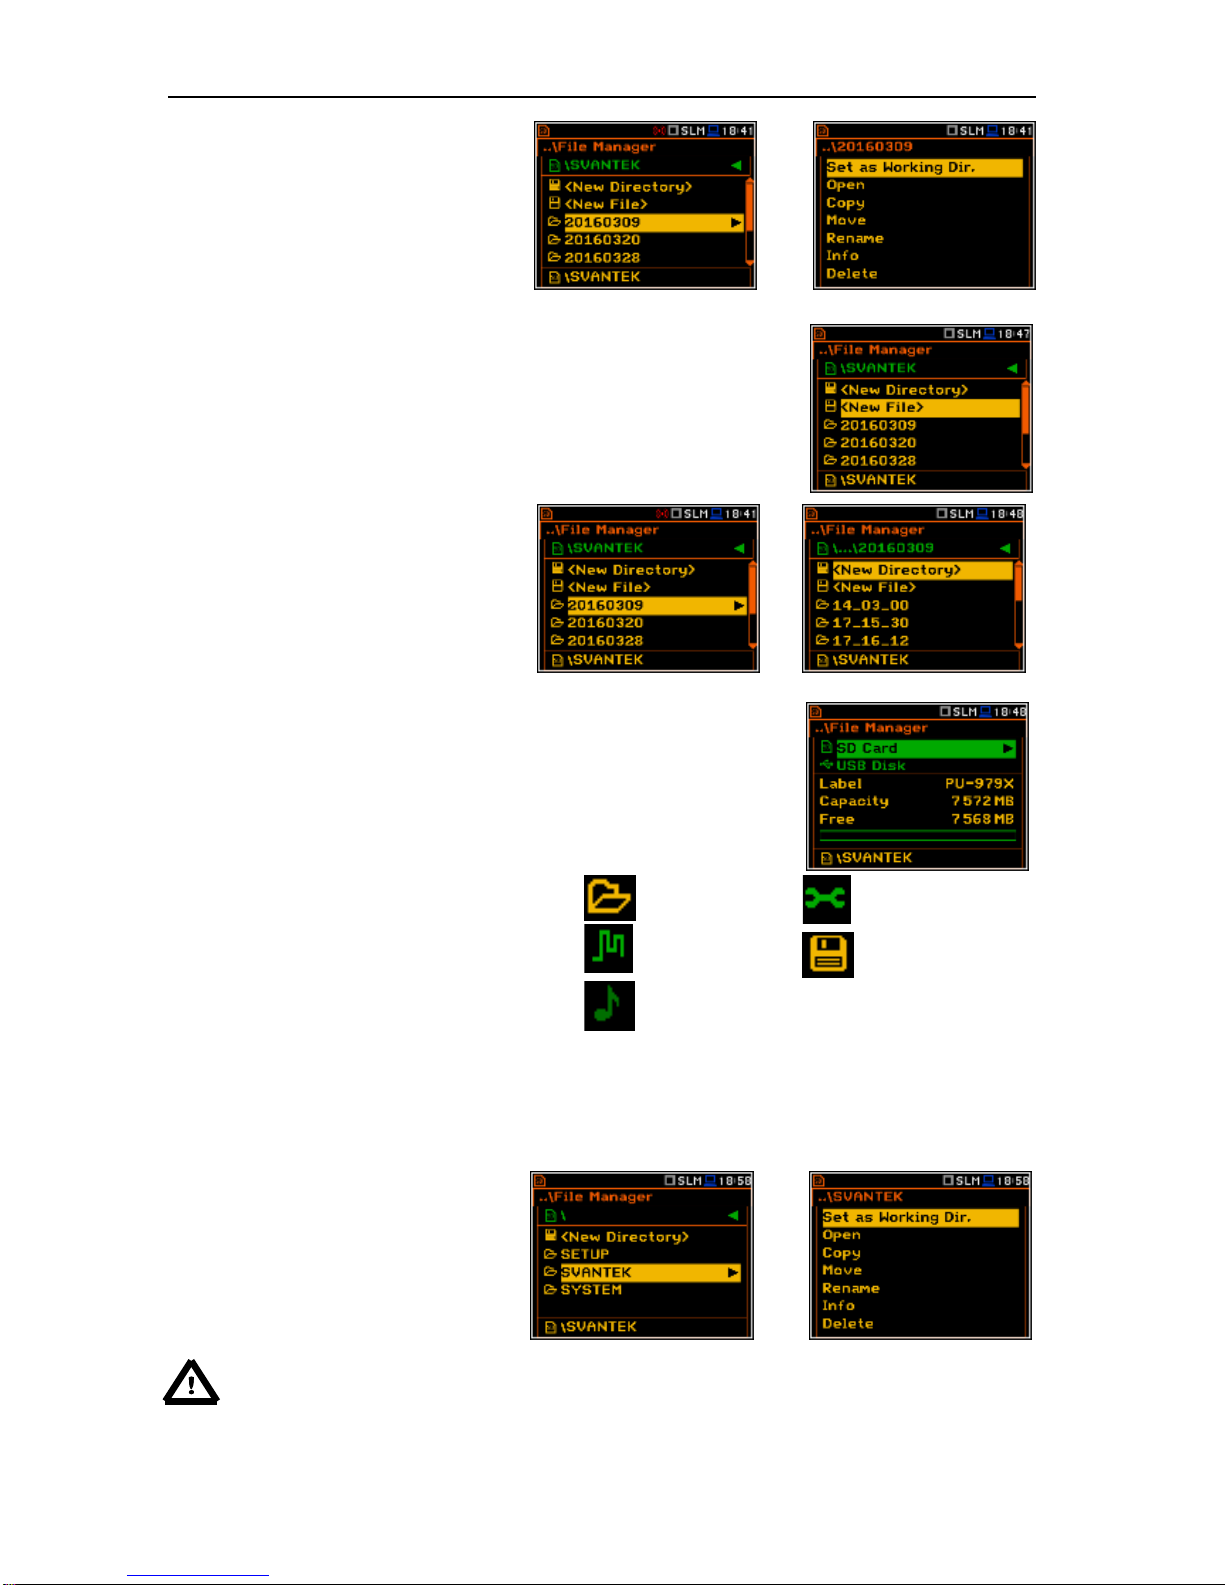
SVAN 979 USER'S MANUAL_______________________________________________ _61
The File Manager window consists of the
list of files, catalogues and memory
devices. Files are stored in catalogues,
which are organised hierarchically.
Catalogue names are of capital letters
and have no extensions. By pressing the
<ENTER> push-button the window with
the list of available operations is opened
at the marked (highlighted) position.
<ENT>
Creating new catalogue or file
The first two positions in the catalogue <New Directory> and <New File>
can be used to create new elements for the forthcoming measurements to
enable the user to create a suitable structure to hold their sets of
measurements in a logical manner.
When the memory or catalogue is
marked (highlighted) then the right arrow
icon appears at right side of the line. After
pressing the <> push-button the
marked memory or catalogue is opened.
To return to the upper (previous)
catalogue the user has to press the <>
push-button.
<>
The upper (highest) catalogue contains the names and icons of memories
available for files: SD Card and USB Disk. The description of the memory
is presented below the memories list: Label, Capacity (total memory
space) and Free memory.
In the File Manager window data files are
described by their file name with an extension
(SVL or WAV) as well as additional icon and
size (2 KB etc.). The table with the description
of icons is presented here.
Catalogue
Logger file
Wave file
Setup file
New file or catalogue
7.2.1 Setting the directory for saving files – Set Working Directory
It is possible to assign the catalogue for
automatically saving logger files. In order
to do this the user should choose the
required catalogue and press the
<ENTER> push-button. After opening the
list of operations the user should select
Set as Working Dir. and press the
<ENTER> push-button.
<ENT>
Notice: The working catalogue name is displayed on the bottom line of the screen.
Page 62
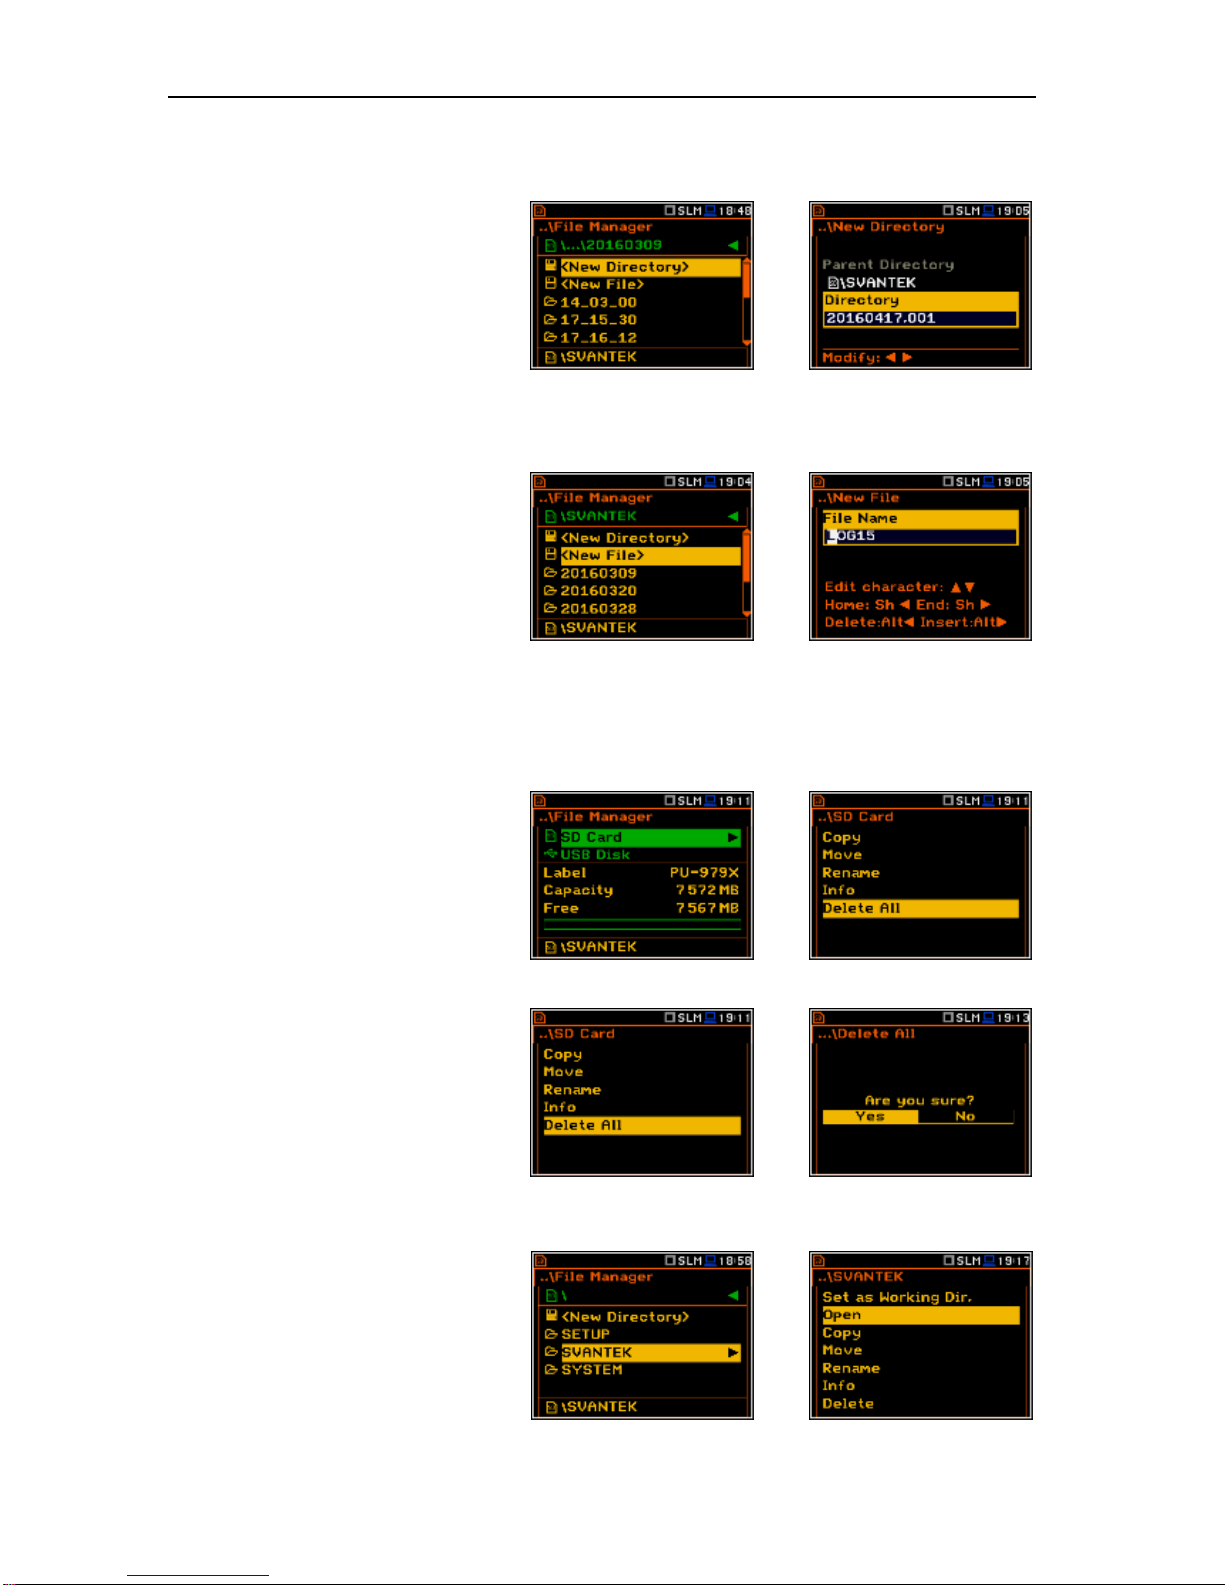
SVAN 979 USER'S MANUAL_______________________________________________ _62
7.2.2 Creating new catalogue and new file
It is possible to create a new catalogue in
the file system on the SD Card or
USB Disk. To do this the user should
select the catalogue in which the new one
will be created and press the <ENTER>
push-button at the <New Directory>
position. A new catalogue name will be
offered and appear at the bottom line of
the display. If a directory already exists
with the same name a warning message
will appear. Otherwise this operation will
be performed.
<ENT>
There are two options for storing result
data in the external memory. One option
is to press <Save> push-button right after
the measurement finishes. Another
option is to create <New File> in the
File Manager.
To perform this function the user should
enter the catalogue in which the new file
will be created and press the <ENTER>
push-button at the <New File> position.
<ENT>
7.2.3 Deleting all files from Internal memory – Delete All
It is possible to delete all result and/or
setup files from the instrument's memory.
To do this the user should select the
memory type and press the <ENTER>
push-button. After opening the list of
operations select the Delete All position
and press the <ENTER> push-button
again.
<ENT>
The user will be asked to confirm the
deletion of the selected file type. Select
Yes then press <ENTER> to delete
otherwise press <ESC> to continue
without deletion.
<ENT>
7.2.4 Opening file/catalogue – Open
It is possible to open any file or catalogue
from the file/catalogue list. The user
should select the file/catalogue and press
the <ENTER> push-button. After opening
the list of operations select the Open
position and press <ENTER> again. The
effect of such operation for the catalogue
is the same as opening the catalogue by
means of the <> push-button.
<ENT>
Page 63
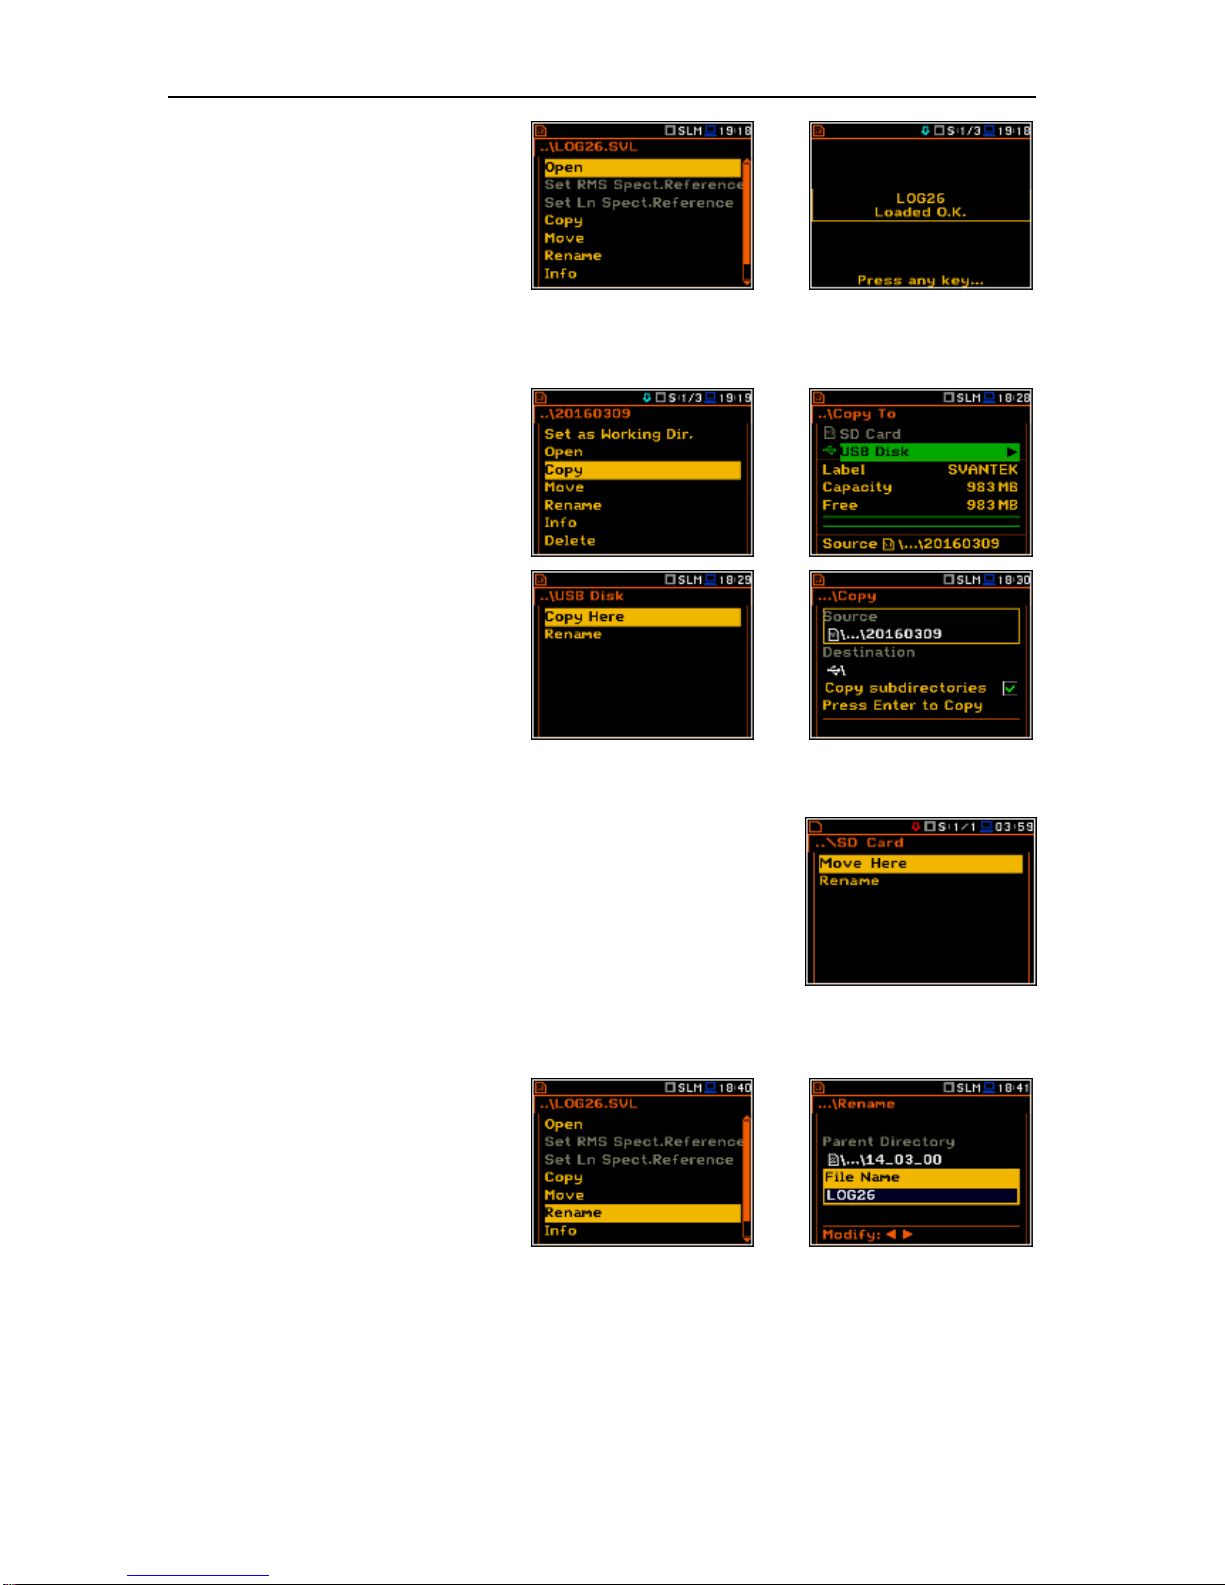
SVAN 979 USER'S MANUAL_______________________________________________ _63
Opening the file means that the
measurement results saved in this file will
be loaded to the instrument's operation
memory and may be reviewed on the
screen. The results are loading together
with Mode and Measurement Function
settings, but other measurement settings
are as before opening the measurement
file.
<ENT>
7.2.5 Copying file/catalogue – Copy
It is possible to copy a file or catalogue
from the file/catalogue list in one memory
type to another.
To perform this operation select the
file/catalogue and press the <ENTER>
push-button. After opening the list of
operations select the Copy position and
press the <ENTER> push-button again.
The instrument then will propose to
choose the target catalogue for copying.
After selection of the target catalogue the
user should press the <ENTER> pushbutton. The window with two options will
appear: Copy Here and Rename. In
case of cathalogue it is possible to select
option to copy all subdirectories.
<ENT>
<ENT>
7.2.6 Moving file/catalogue – Move
It is possible to move a file or catalogue from the file/catalogue list in one
memory type to another.
To perform this operation select the file/catalogue and press the <ENTER>
push-button. After opening the list of operations select the Move position
and press the <ENTER> push-button again. The instrument will propose to
choose the target catalogue for copying. After selection of the target
catalogue press the <ENTER> push-button. The window with two options
will appear: Move Here and Rename. In case of cathalogue it is possible
to select option to move all subdirectories.
7.2.7 Renaming file/catalogue – Rename
It is possible to rename a file or
catalogue. In order to do this the user
should select the file/catalogue and press
the <ENTER> push-button. After opening
the list of operations select the Rename
position and press the <ENTER> pushbutton again. The window with text editor
function will appear.
<ENT>
Page 64
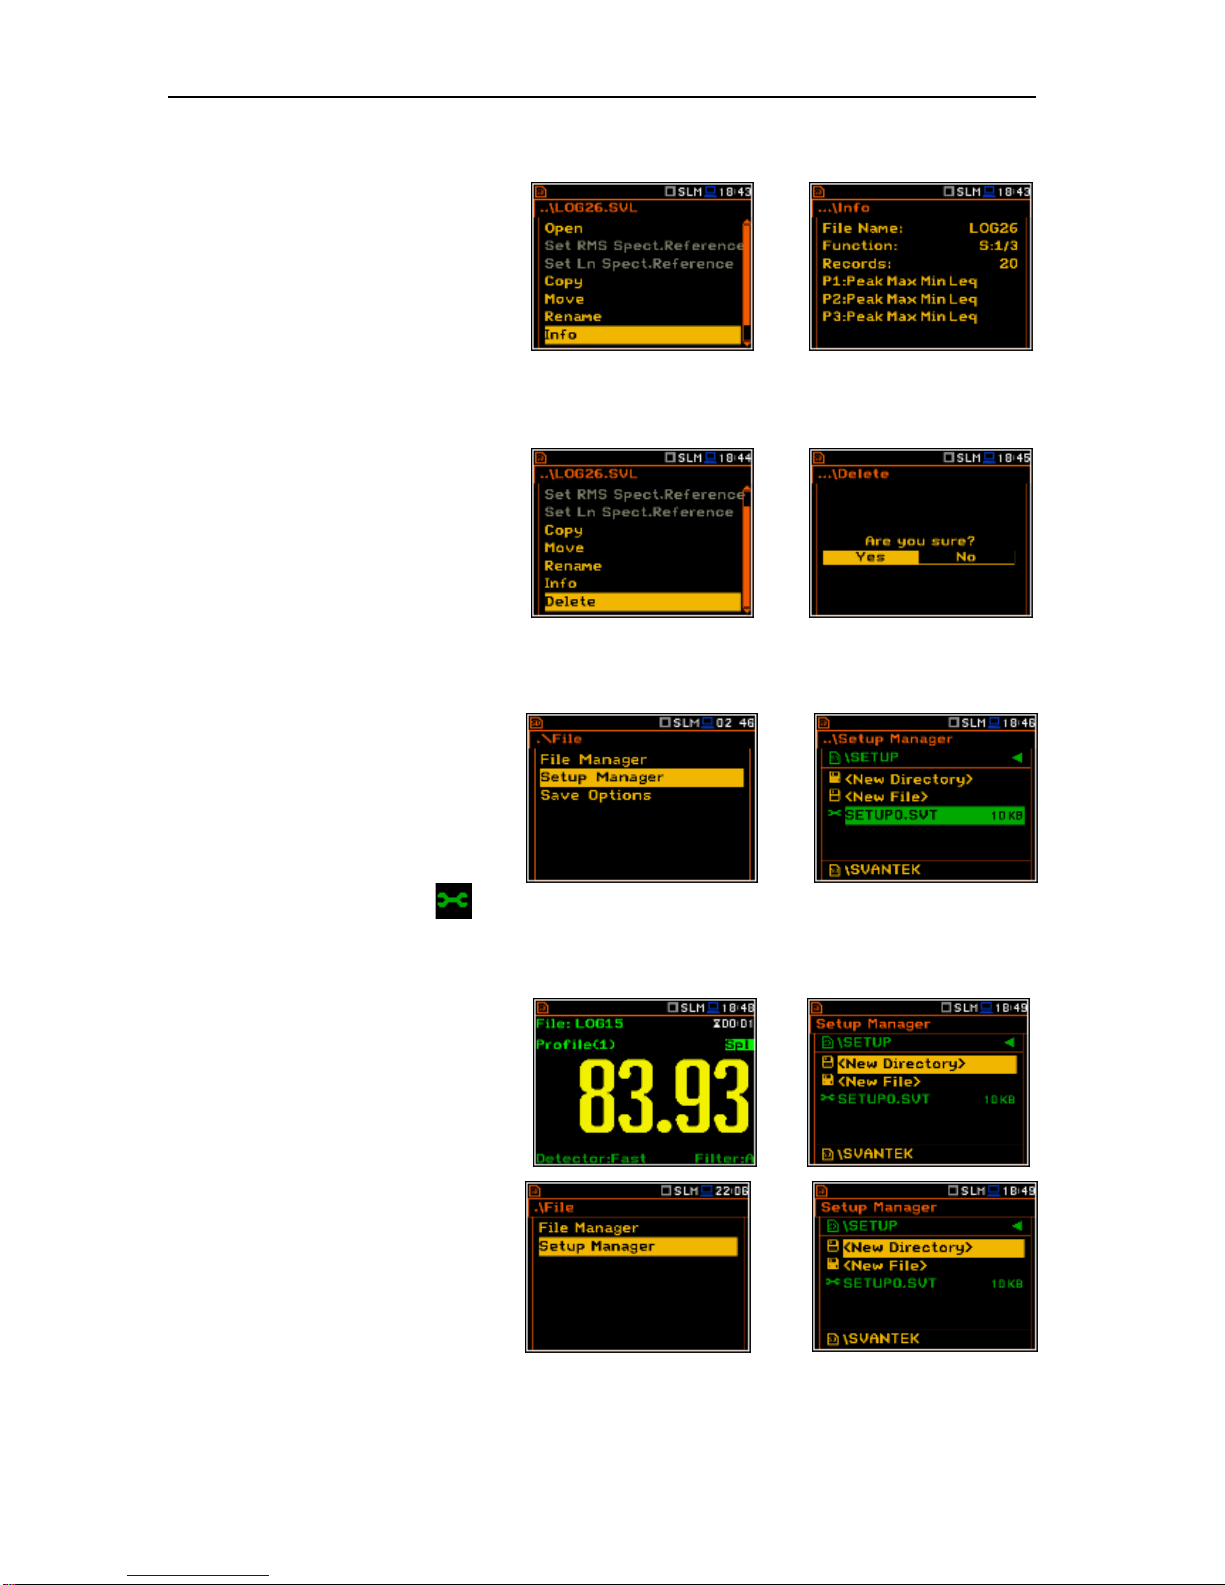
SVAN 979 USER'S MANUAL_______________________________________________ _64
7.2.8 Information about file/catalogue – Info
It is possible to get information about a
file or catalogue. The user should select
the file/catalogue and press the
<ENTER> push-button. After opening the
list of operations select the Info position
and press the <ENTER> push-button
again. The instrument then will display
the information about the selected
file/catalogue.
<ENT>
7.2.9 Deleting file/catalogue – Delete
It is possible to delete a file or catalogue
from the file/catalogue list. The user
should select the file/catalogue and press
the <ENTER> push-button. After opening
the list of operations select the Delete
position and press the <ENTER> pushbutton again.
<ENT>
7.3 Managing the setup files – Setup Manager
The Setup Manager is used for checking
the contents of the memory and
operating on Setup files such as: open,
delete, copy, move, rename files, create
new files and display file information.
In the Setup Manager window only setup
files are displayed. Setup files have
extension SVT and icon attribute .
<ENT>
7.3.1 Saving the setup files
There are two options to open the
Setup Manager window. One option is to
press <S/P> push-button (Alt + Esc)
when a measurement is not being
performed. Another option is to open the
Setup Manager position from the File
menu.
<S/P>
In order to save the setup file the user
should enter the catalogue in which the
new file will be created and press the
<ENTER> push-button at the
<New File> position. Save Setup
window is then opened.
<ENT >
Page 65
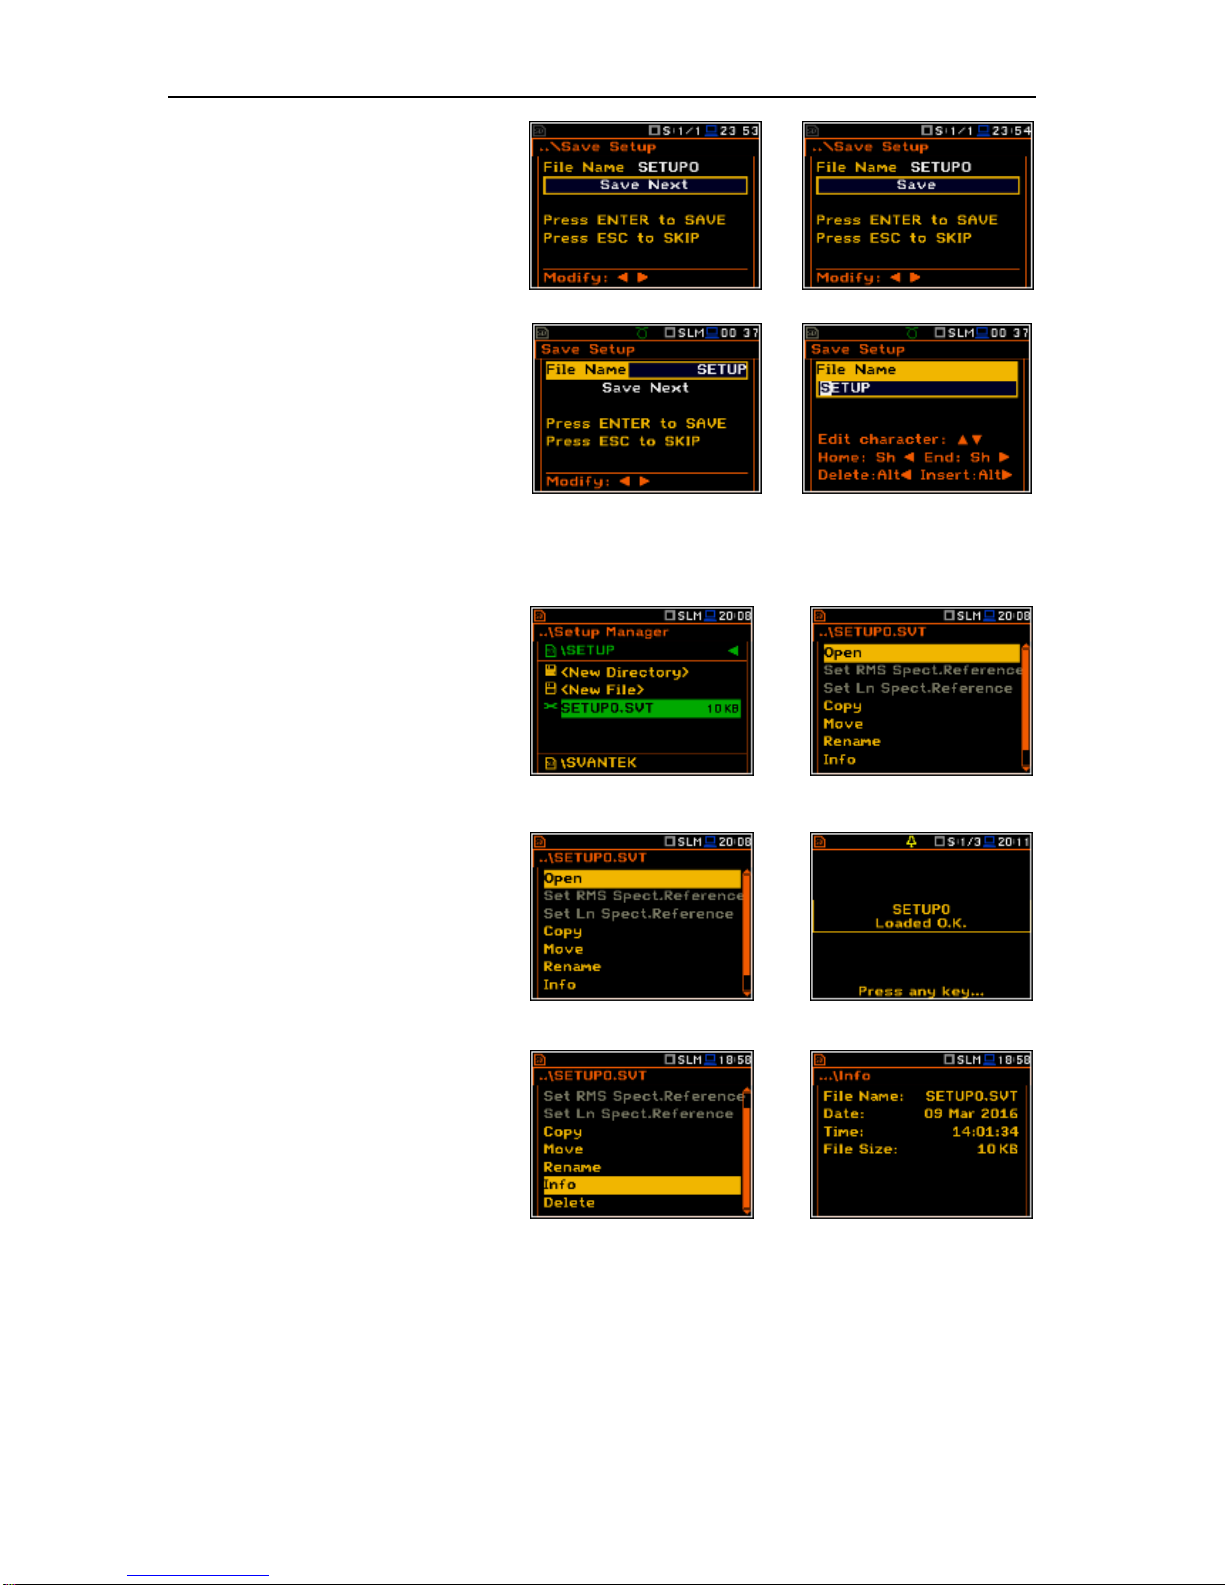
SVAN 979 USER'S MANUAL_______________________________________________ _65
There are two available functions: saving
a setup file with the name increased by
one (Save Next), and– saving a setup file
with an edited name (Save). The name
can be chosen to indicate the purpose of
the measurement configuration setup,
e.g. TRAFFIC or WORK.
<>
The editable name of the file, in which the
setup settings are to be saved, is
displayed in the File Name position. The
default file name for Setup settings is
SETUP.
To edit the file name the user has to press
the <> push-button. The text edition
window is opening.
<>
7.3.2 Operations on the setup files
The Setup Manager enables the user to
perform operations on the setup files in
the same way as it was described above
for the File Manager position. To perform
any of the operations like: Open, Copy,
Move, Rename, Info and Delete the
user should choose the file for which this
operation will be applied and press the
<ENTER> push-button. The list of
operations then will open.
<ENT>
Opening the setup file means that the
previously configured settings saved in
this file will be loaded to the instrument's
operation memory. So if the user presses
the <Start/Stop> push-button the
instrument will start the following
measurement with the newly loaded
settings.
<ENT>
To get information about the date and
time the setup file was created the user
should select the file and press the
<ENTER> push-button. After opening the
list of operations select the Info position
and press the <ENTER> push-button
again.
<ENT>
Page 66
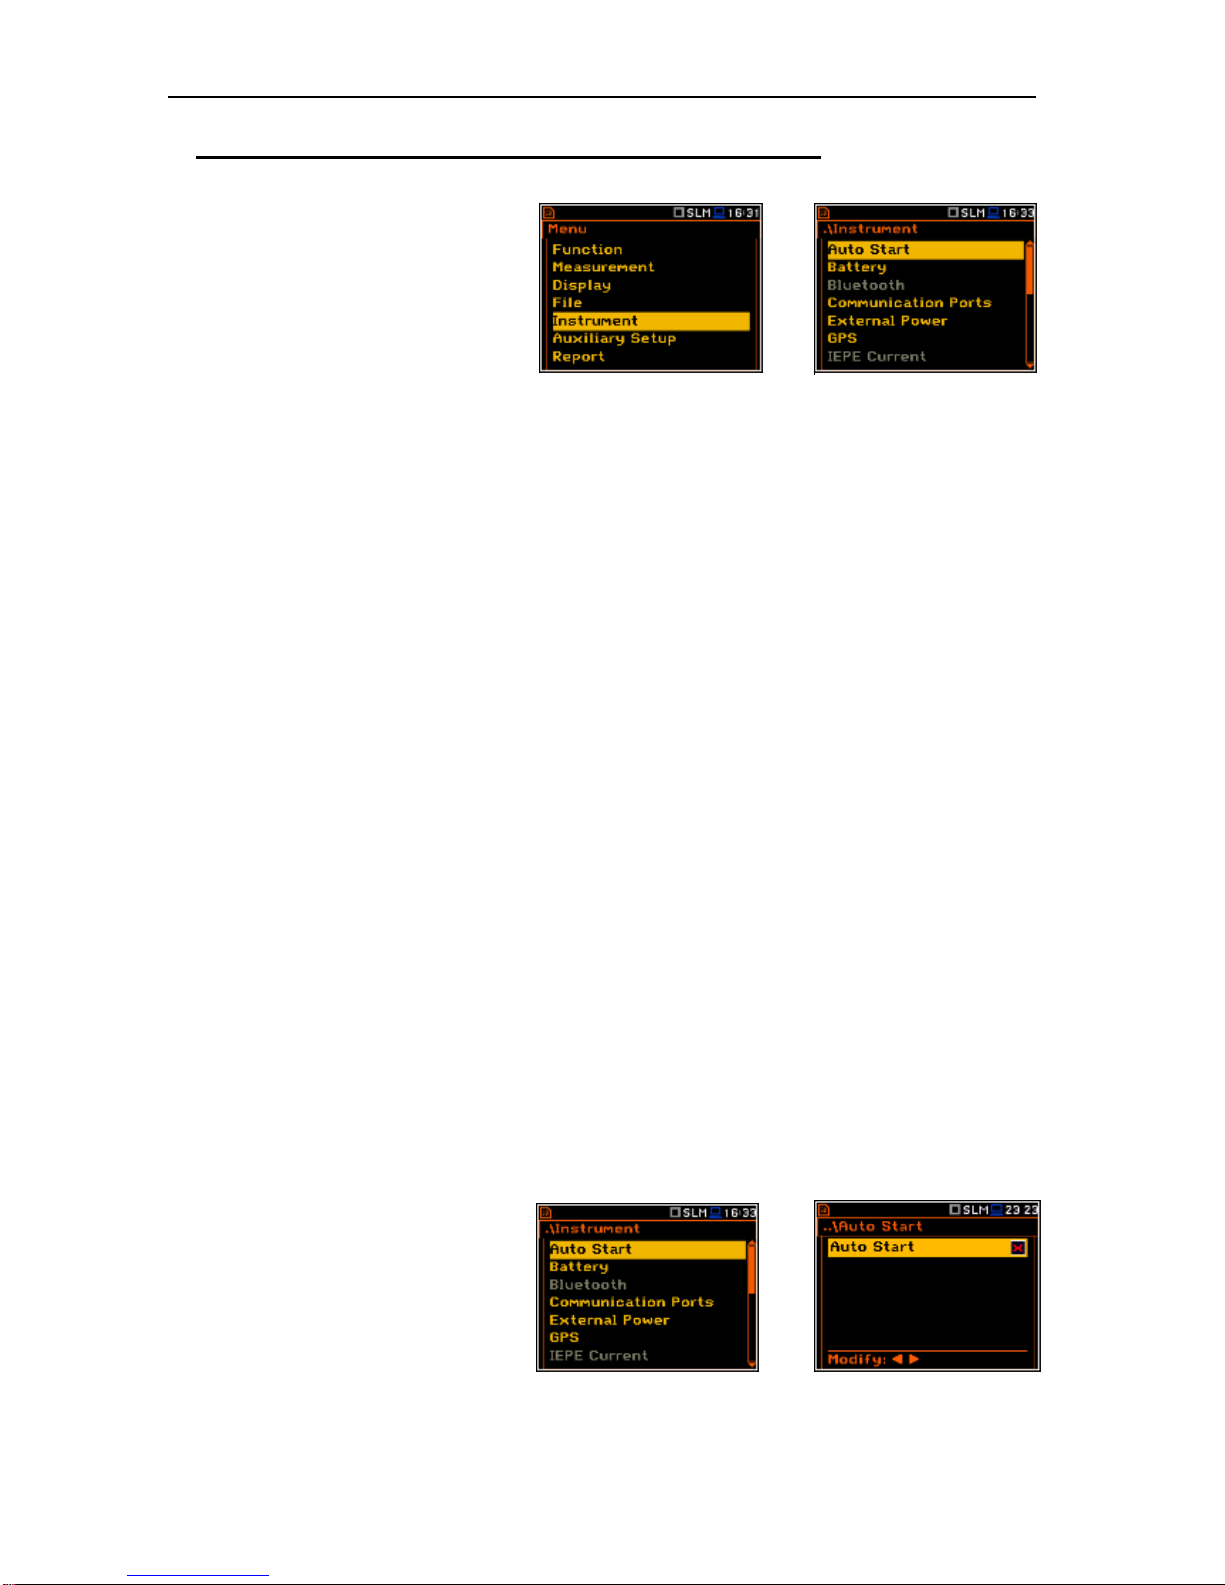
SVAN 979 USER'S MANUAL_______________________________________________ _66
8. SETTINGS THE INSTRUMENT PARAMETERS – Instrument
The Instrument list contains different sublists and positions, which are directly
related to the settings of the hardware
components of the instrument. In order to
open the Instrument list the user has to
press the <Menu> push-button, select the
Instrument position and press <ENTER>.
<ENT>
In the Instrument list, the following items are available:
Auto Start enables the user to start the measurement just after the switching the
instrument on;
Battery enables the user to get information about current power source.
Bluetooth enables the user to configure the Bluetooth® for communication.
Communication Ports enables the user to select the active port of the instrument.
External Power enables the user to select the minimum voltage of the external source, when
the instrument should be switched off automatically.
GPS enables the user to select the time zone and switch on/off the time
synchronization.
IEPE Current enables the user to choose the correct IEPE current supply.
Keyboard Settings enables the user to set the operating mode of the <Shift> and <Start/Stop>
push-buttons.
Modem Status enables the user to check the status of the modem (position becomes active
when the GPRS function is switched on).
Multifunction I/O enables the user to select the available functionality of the I/O port.
Polarisation Voltage enables the user to choose the polarisation voltage for the instrument's
microphone.
Remote Control Mode enables the user to configure the Remote Control mode.
RS232 enables the user to set the transmission speed and the timeout in the RS232
interface.
RTC enables the user to set the Real Time Clock.
Self Vibration enables the user to check the self vibration levels of the instrument.
Signal Generator enables the user to switch on the signal generator function.
Wireless Transfer enables the user to select the network type and set the parameters of the
data transmission.
Unit Label enables the user to check information about the type of the instrument, its
serial number, the current firmware versions installed in it and the standards
which the instrument complies with.
8.1. Measurement auto start - Auto Start
The Auto Start position enables the user
to start the measurement just after the
switching the instrument on.
<ENT>
Page 67
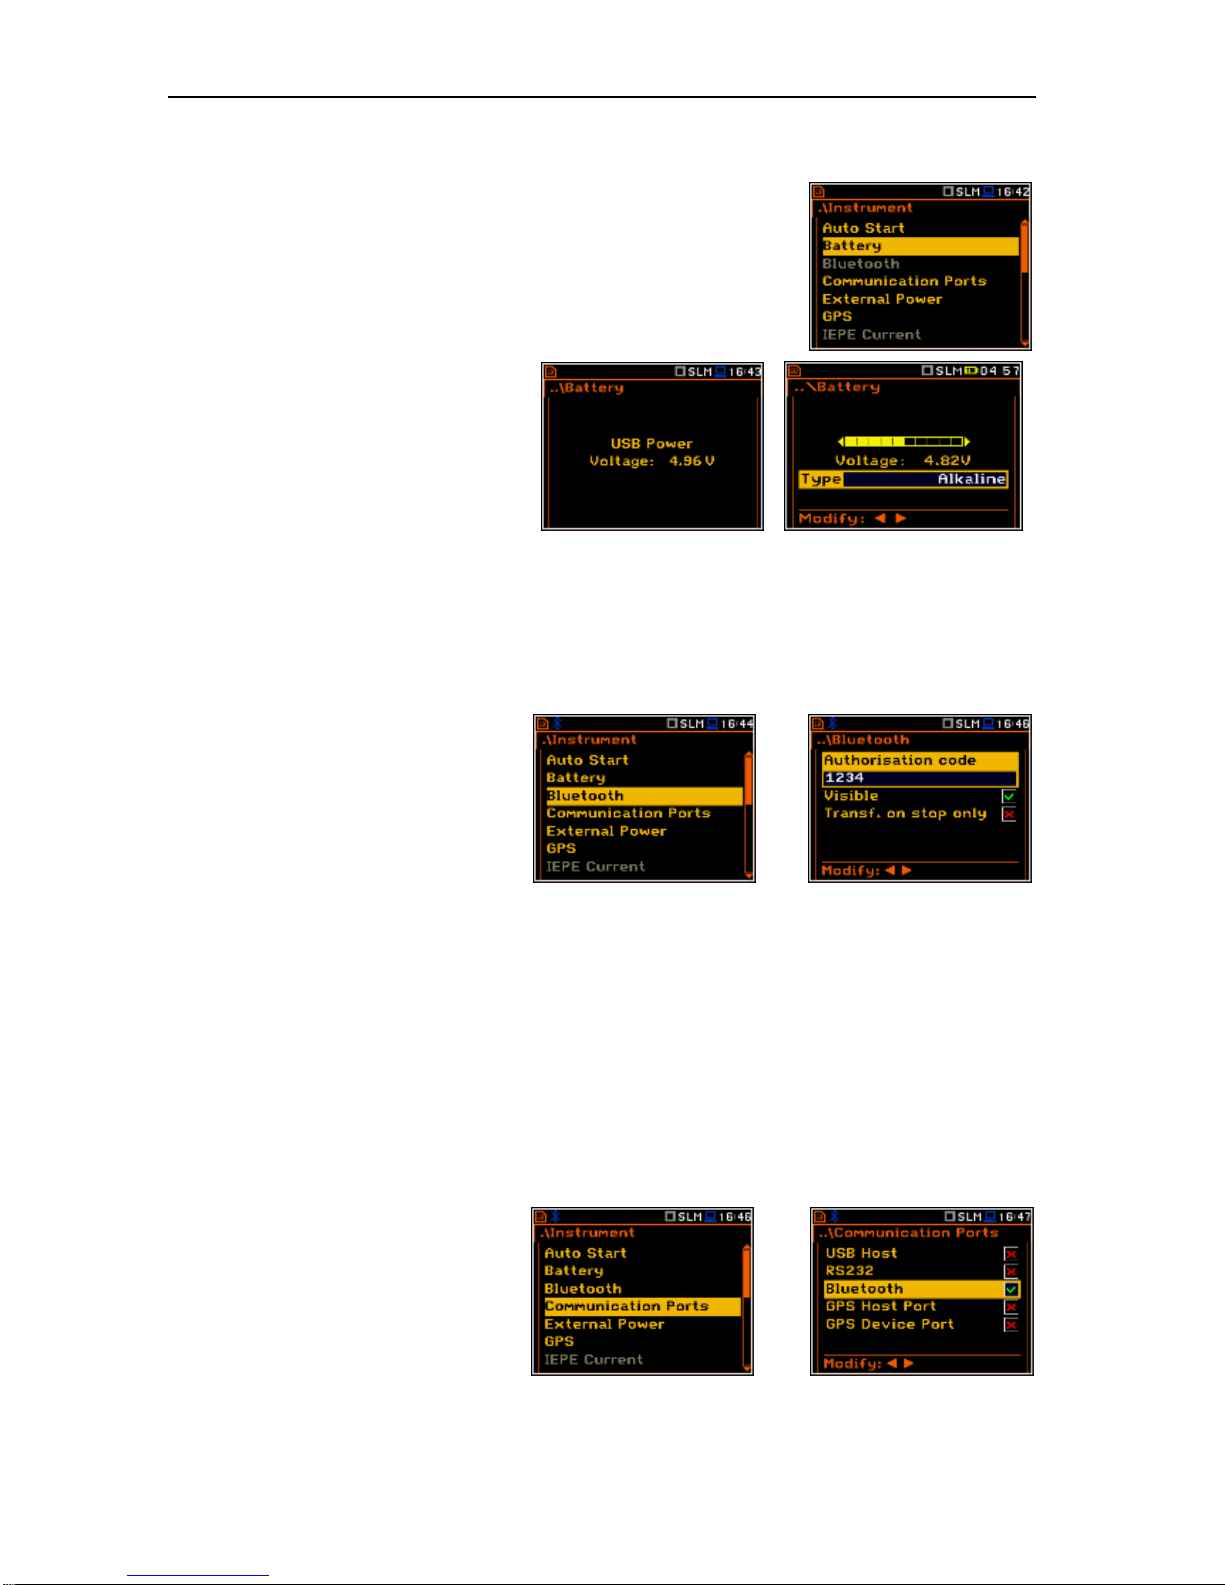
SVAN 979 USER'S MANUAL_______________________________________________ _67
8.2. Checking the state of the internal battery – Battery
The Battery position enables the user to check the power source of the
instrument: internal battery condition, source and voltage of the external
power supply; and also to set the battery type for checking their condition.
The instrument can be powered from an external DC power supply, from
the external battery pack, from four AA rechargeable or standard alkaline
batteries or from the USB interface when its USB Device socket is
connected by means of the SC 16 cable to a PC.
The view presented on the display for
each of three kinds of possible power
sources is different. The current battery
voltage is displayed together with its
approximate state (in graphical format).
When the instrument is powered from a
set of internal batteries the user should
select the correct type. It is essential for
the correct detection of the true capacity
of the battery pack. Two types are
available: Alkaline and Rechargeable.
8.3. Bluetooth
®
activation – Bluetooth
The Bluetooth position becames active
after activation of Bluetooth® in the
Communication Ports window and
enables the user to key in the
authorisation code to pair a PC (or
suitable tablet or smartphone) and the
instrument.
If the Visible parameter is switched on,
during searching of the Bluetooth unit by
the PC, the instrument will be visible and
it will be possible to pair the instrument
and the PC. The instrument can
communicate with the PC also with
inactive Visible parameter.
<ENT>
If Transf. on stop only is switched on then the Bluetooth function is switched off during the measurement.
Active Bluetooth® may be a source of additional internal electrical noise in very low acoustic environments.
8.4. Selection of the active port - Communication Ports
The Communication Ports position
enables the user to select the active
communication port of the instrument.
It is possible to select the following
combinations:
USB Host / Bluetooth / GPS - USB,
RS232 / GPS - USB,
GPS - USB Host / Bluetooth.
<ENT>
Page 68
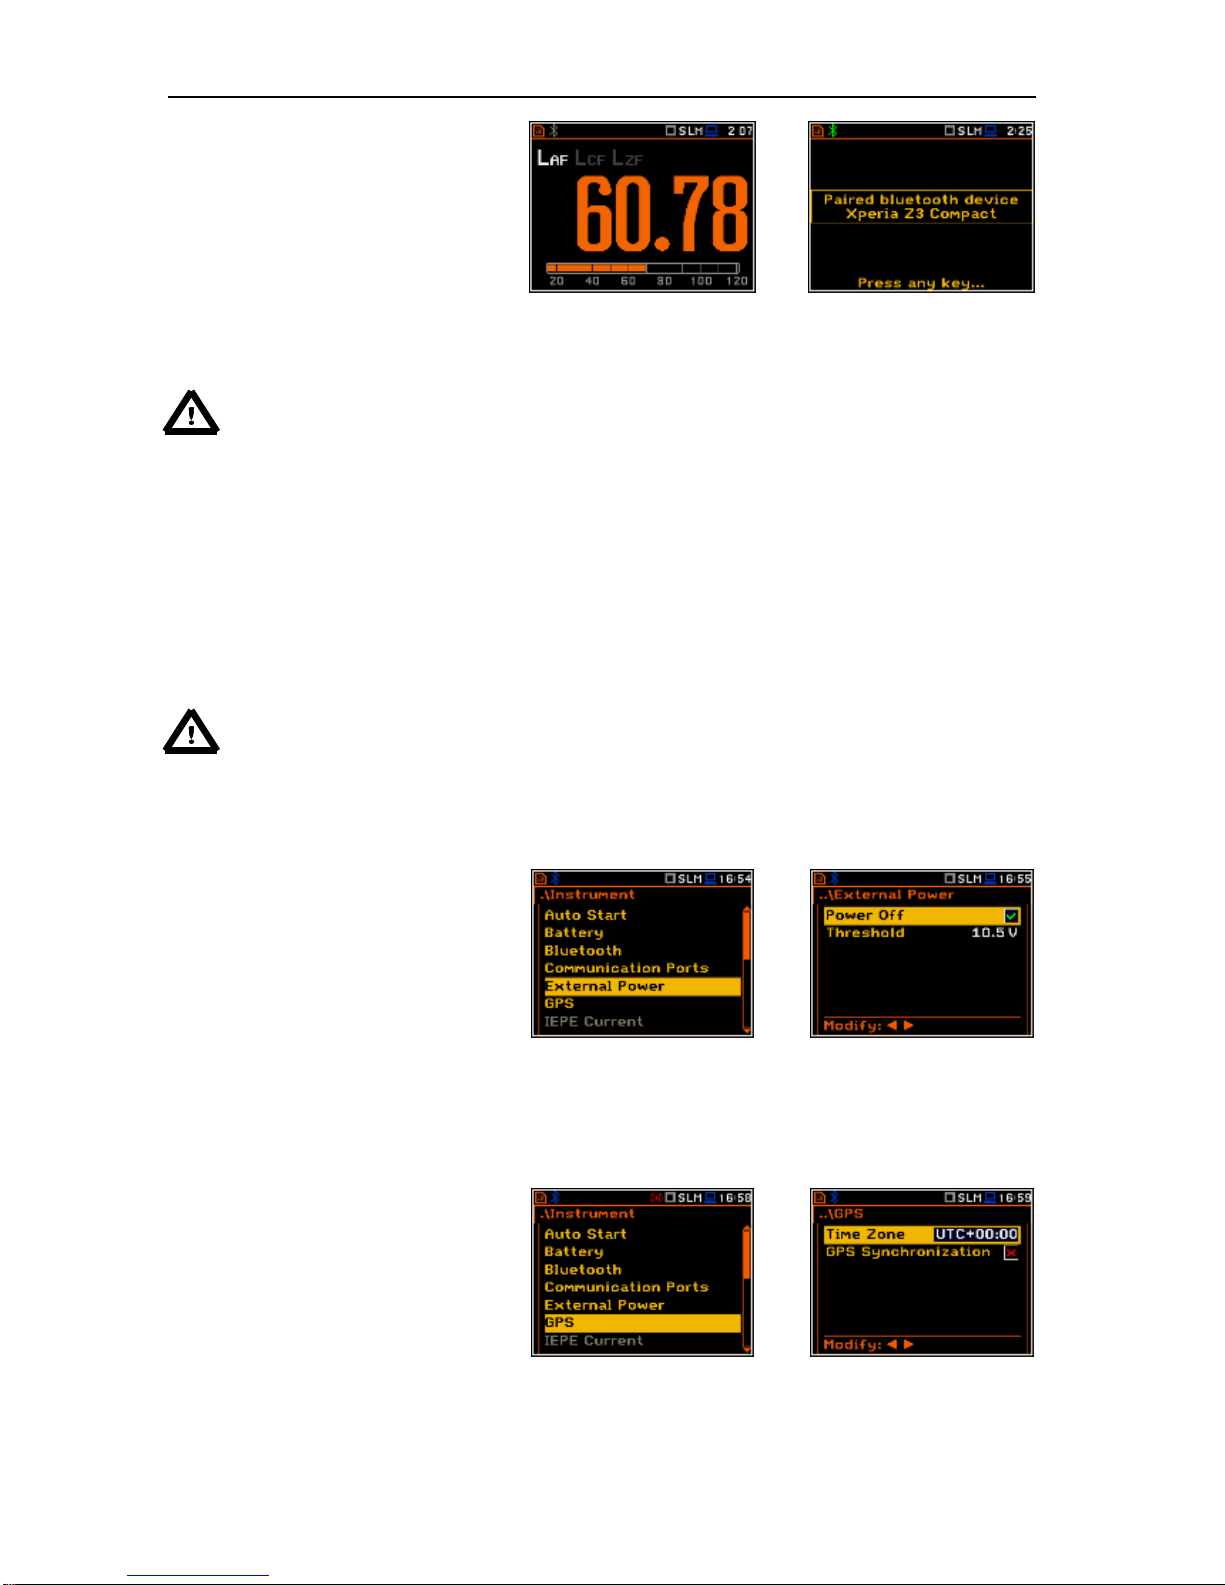
SVAN 979 USER'S MANUAL_______________________________________________ _68
When Bluetooth is selected the grey
“Bluetooth” icon is displayed as long as
there is no connection with another
Bluetooth device.
When devices are paired, the “Bluetooth”
icon changes it’s color to green.
=>
The socket USB Host can be used as the input of the different interfaces: RS 232 or USB. The RS 232
interface in the SVAN 97x instrument is available as a hardware option (a special interface (SV 55) with a
dedicated microprocessor has to be attached to the socket USB Host).
Notice: The converter SV 55 serves as the RS 232 interface. The SV 55 connection to the
USB Host socket is detected and after successful detection the RS232 icon changes its colour
to blue. Transmission with the SV 55 interface is only possible if the instrument is not connected
to a PC with the USB Device port.
The USB host interface can be used to control the external USB memory disk with the FAT16 or FAT32 file
systems. After USB disc connection the user must switch on the USB Host position for correct operation.
The USB disk can be disconnected when the measurements are not performed or working directory was set
up to Internal memory or SD card.
In the USB disk that is divided into partitions its first partition has to be reserved for FAT32 or FAT16 file
system. Only short file names (up to 8 characters, similar to DOS system) may be used. The existing longer
names are shortened automatically.
Notice: Disconnection of the USB disk during the data transmission can cause the loss of data
saved in the USB disk as well as in the instrument’s internal flash and should be avoided.
8.5. Setting the external power parameters - External Power
The External Power position enables the
user to select the minimum voltage
(Threshold) of the external dc power
source (SA 15/33), when the instrument
should be switched off automatically. This
window appears automatically after
switching on the instrument when the
instrument is connected to the external dc
power source (SA 15/33).
<ENT>
8.6. Setting the GPS parameters – GPS
The GPS position enables the user to
select the time zone and switch the time
synchronization on or off.
The Time Zone selection is made by
means of the <>, <> push-buttons.
<ENT>
Page 69
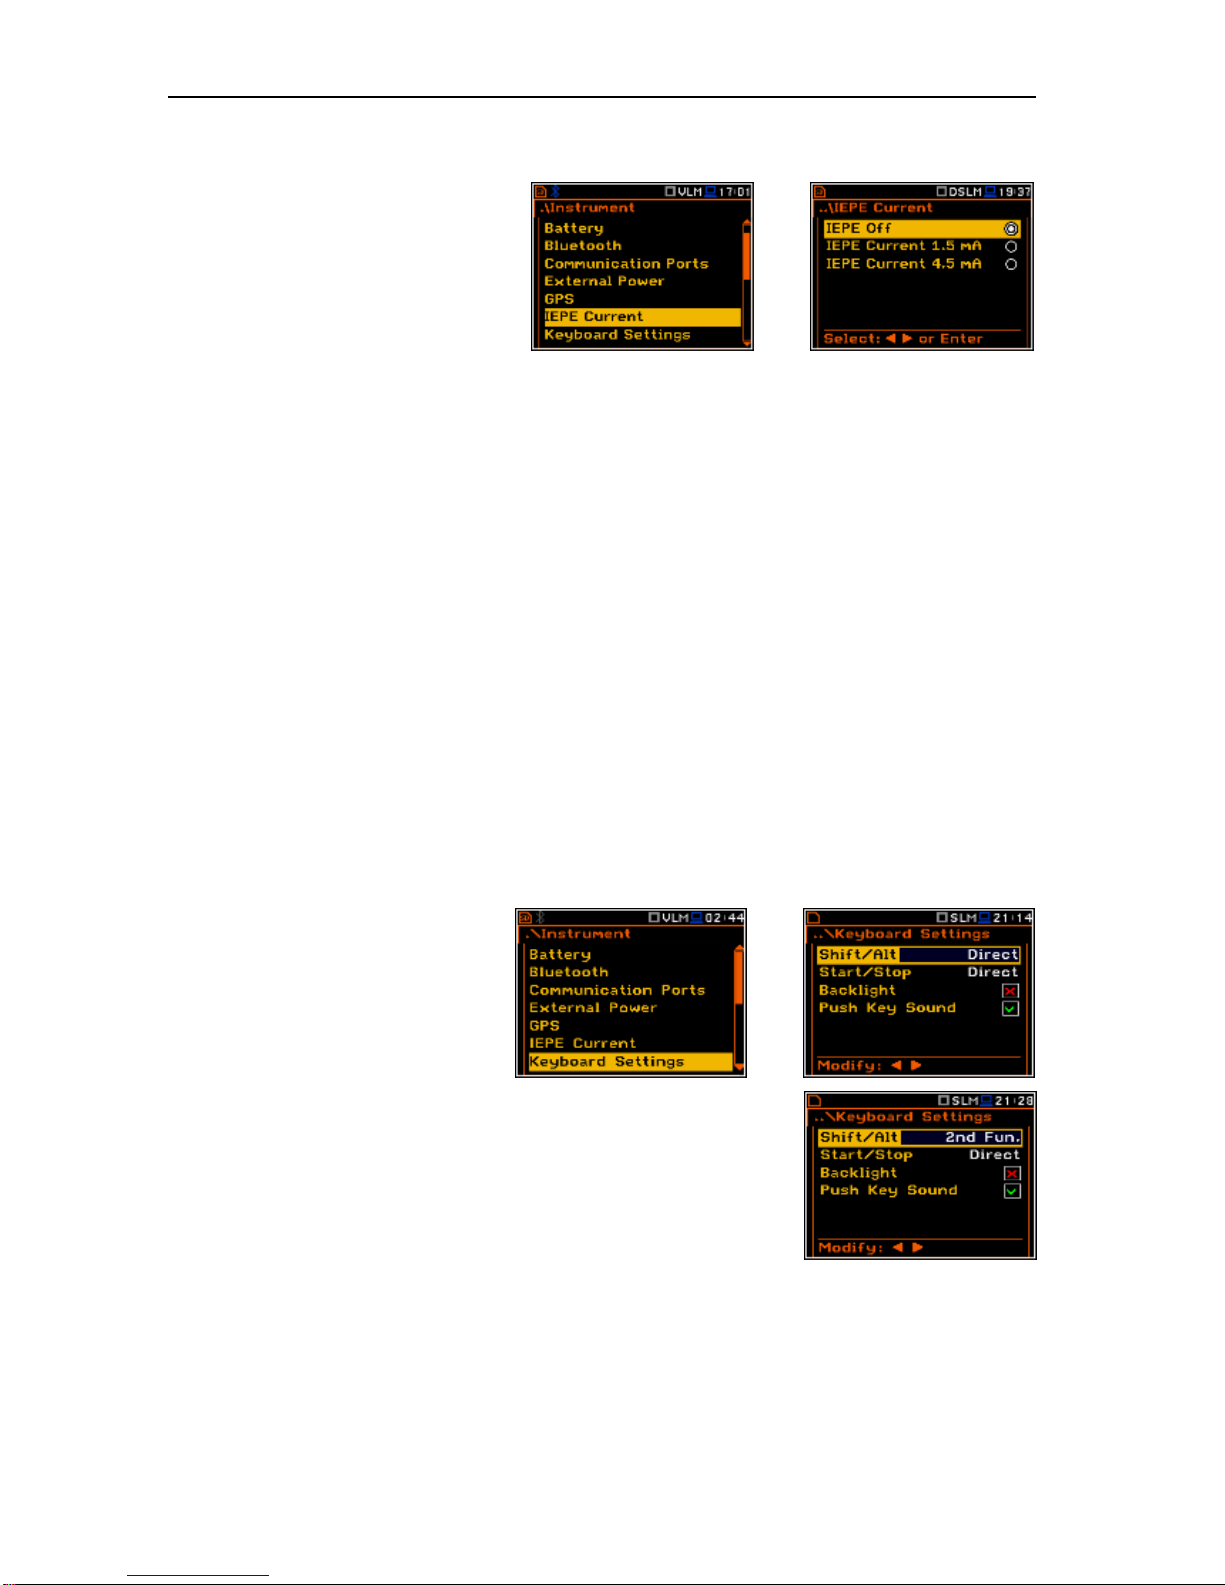
SVAN 979 USER'S MANUAL_______________________________________________ _69
8.7. Selection of the IEPE current supply - IEPE Current
The IEPE Current position became
active in Direct Sound and
Vibration Meter mode and enables the
user to choose the correct IEPE current
supply.
In Direct Sound mode it is possible to
switch IEPE current off (IEPE Off). In
Direct Sound and Vibration Meter
mode the user may select two options:
1.5 mA and 4.5 mA.
<ENT>
The selection of modes in the 979 device (Sound Meter / Direct Sound and Vibration Meter /
Direct Vibration) in conjunction with a choice of settings of IEPE Current is as follows:
- The Sound Meter mode is used to measure sound with the SVANTEK dedicated preamp SV17, because
only in this mode the device enables additional power supply on a separate Lemo input pin without which
the preamplifier SV17 can not work. Therefore, after selecting the Sound Meter mode IEPE Current is not
available.
- The Direct Sound mode is used to measure sound from with other than SV17 source. It can be a
microphone preamplifier with IEPE type power supply or other independent voltage source, for example,
signal generator. When using IEPE preamplifier the user in the IEPE Current window should select the
appropriate input current (in accordance with preamplifier specification). If voltage signal is from another
source, select IEPE Off. In both cases, to bring the signal, use an appropriate adapter (adapter cable).
- The Vibration Meter mode is used to measure vibration using IEPE transducers. In this case, the user
should also setthe the appropriate input current in the IEPE Current window and it is not possible to select
the position IEPE Off.
- The Direct Vibration mode is used to measure the vibration from a source other than the IEPE transducers.
Therefore, after selecting this mode position IEPE Current is not available.
8.8. Selection of keyboard modes – Keyboard Settings
The Keyboard Settings position
enables the user to programme the
operational mode of the <Shift>, <Alt>
and <Start/Stop> push-buttons and
switch backlight and sound options on
or off. The default settings are Direct for
both items shown on the display screen.
<ENT>
<Shift> / <Alt> push-button mode
In the Shift/Alt position the user can choose between 2nd Fun. and Direct.
When the Direct option is selected, the <Shift> and <Alt> push-buttons
operate as in the keyboard of a computer – in order to achieve the desired
result, the second push-button has to be pressed at the same time as
<Shift>/<Alt>. When the 2nd Fun. option is selected the <Shift>/<Alt>
push-button operate in sequence with the other one. This enables the user
to use only one hand to operate the instrument.
Page 70
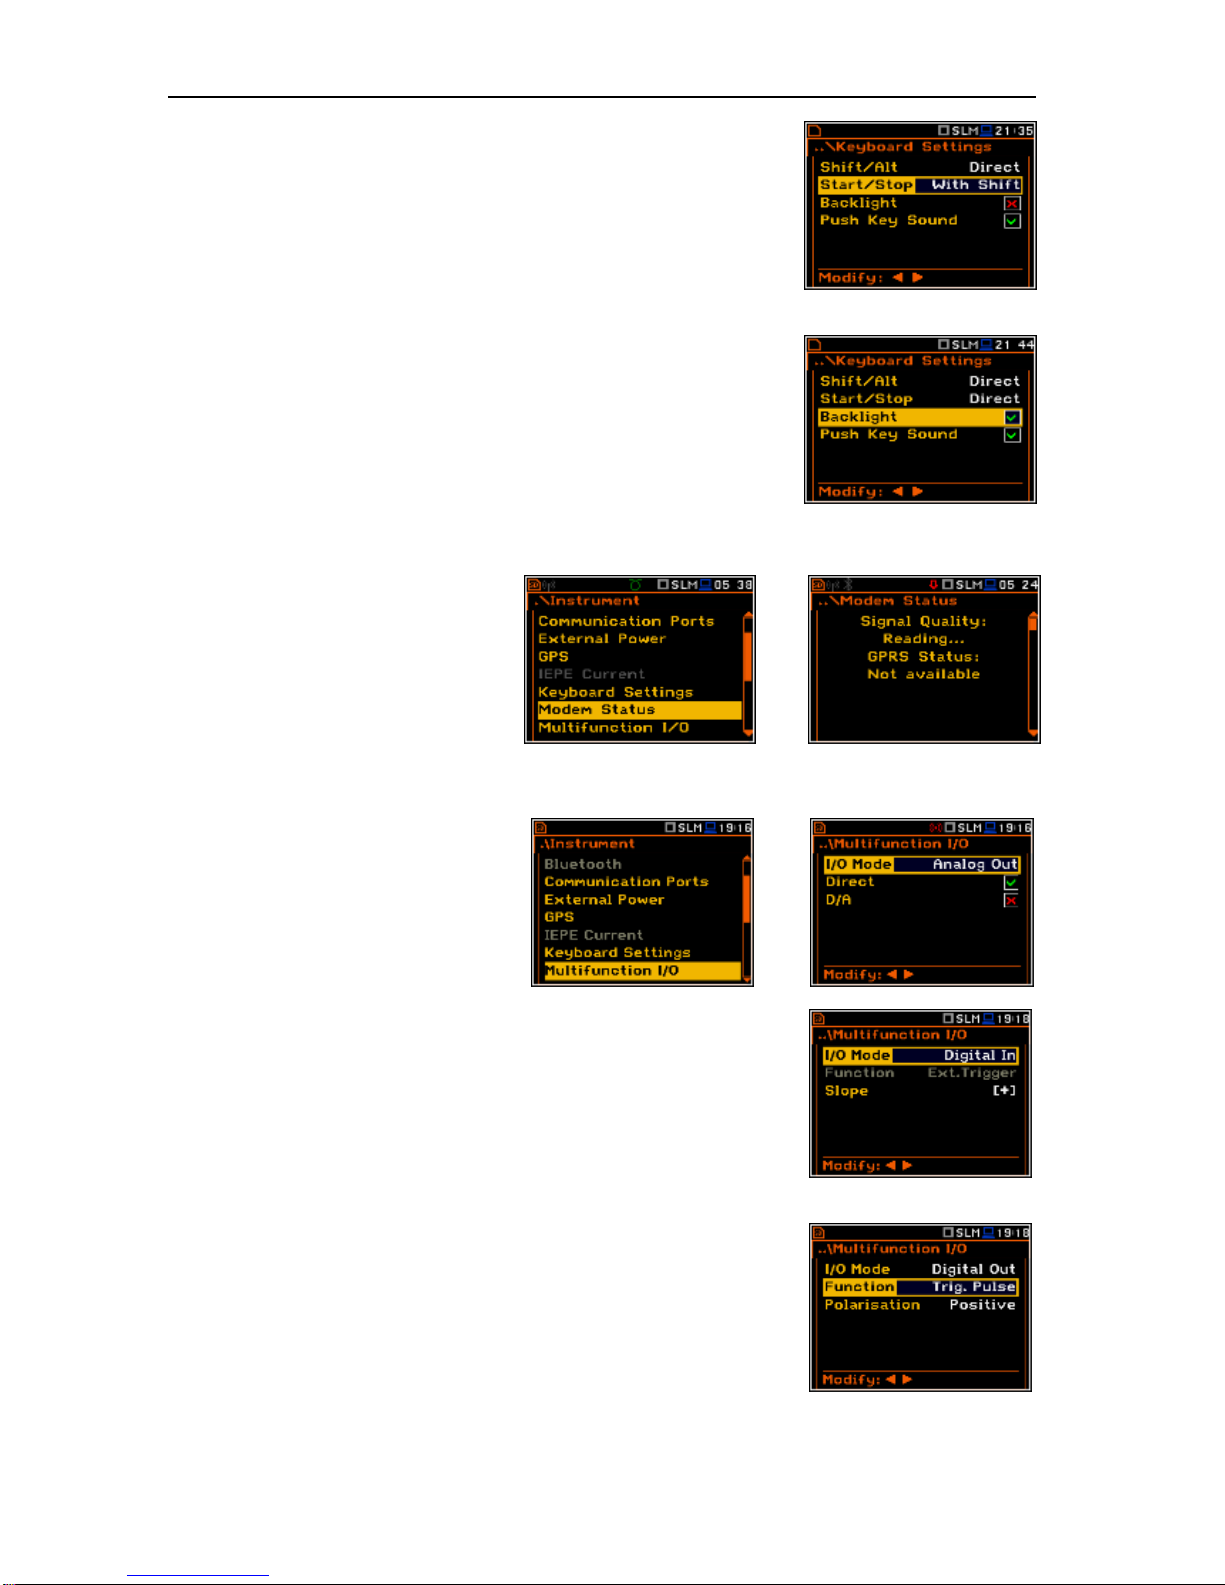
SVAN 979 USER'S MANUAL_______________________________________________ _70
<Start/Stop> push-button working mode selection
In the Start/Stop position the user can choose between Direct and
With Shift. When the Direct option is selected the instrument reacts on
each of the <Start/Stop> push-button press, starting or stopping the
measurements.
When the With Shift option is selected the <Start/Stop> push-button
operates at the same time as or in a sequence with <Shift>. The
measurements are started or stopped after pressing both push-buttons.
Backlight mode selection
In the Backlight position the user can switch keyboard backlight on or off.
Sound mode selection
In the Push Key Sound position the user can switch keyboard sound on or
off. During the actual measurement the key sound is not active even if it
was switched on in the Keyboard Settings window.
8.9. Checking the modem status – Modem Status
The Modem Status position is active
only when the Modbus function is
switched on (path: <Menu> / Instrument /
Wireless Transfer / Network / Modbus:
on). It enables the user to check the
status of the modem.
<ENT>
8.10. Setting parameters of the I/O port - Multifunction I/O
The Multifunction I/O enables the user
to select the available functionality of the
I/O port.
Selection of the mode of I/O port
In the I/O Mode, it is possible to select the
function of the instrument’s 2 pin Lemo
socket named as I/O.
<ENT>
The I/O jack socket can be used as:
• the output of the analogue signal (Analog Out) transmitted from the
input of the instrument to its output without any digital processing (i.e.
frequency filtering),
• the input of the digital signal used as an external trigger to start the
measurements (Digital In) in the instrument, acting in this case as a so
called “slave instrument”,
• the digital output (Digital Out) used for triggering other “slave
instrument(s)” (the instrument is acting in this case as a “master
instrument”), or as a source of any alarm signal in case of certain
circumstances occurred during the measurements (i.e. the level of the
input signal was higher than a user selected trigger alarm setting).
The more detailed description of the I/O socket is given in App. C.
<>
Page 71
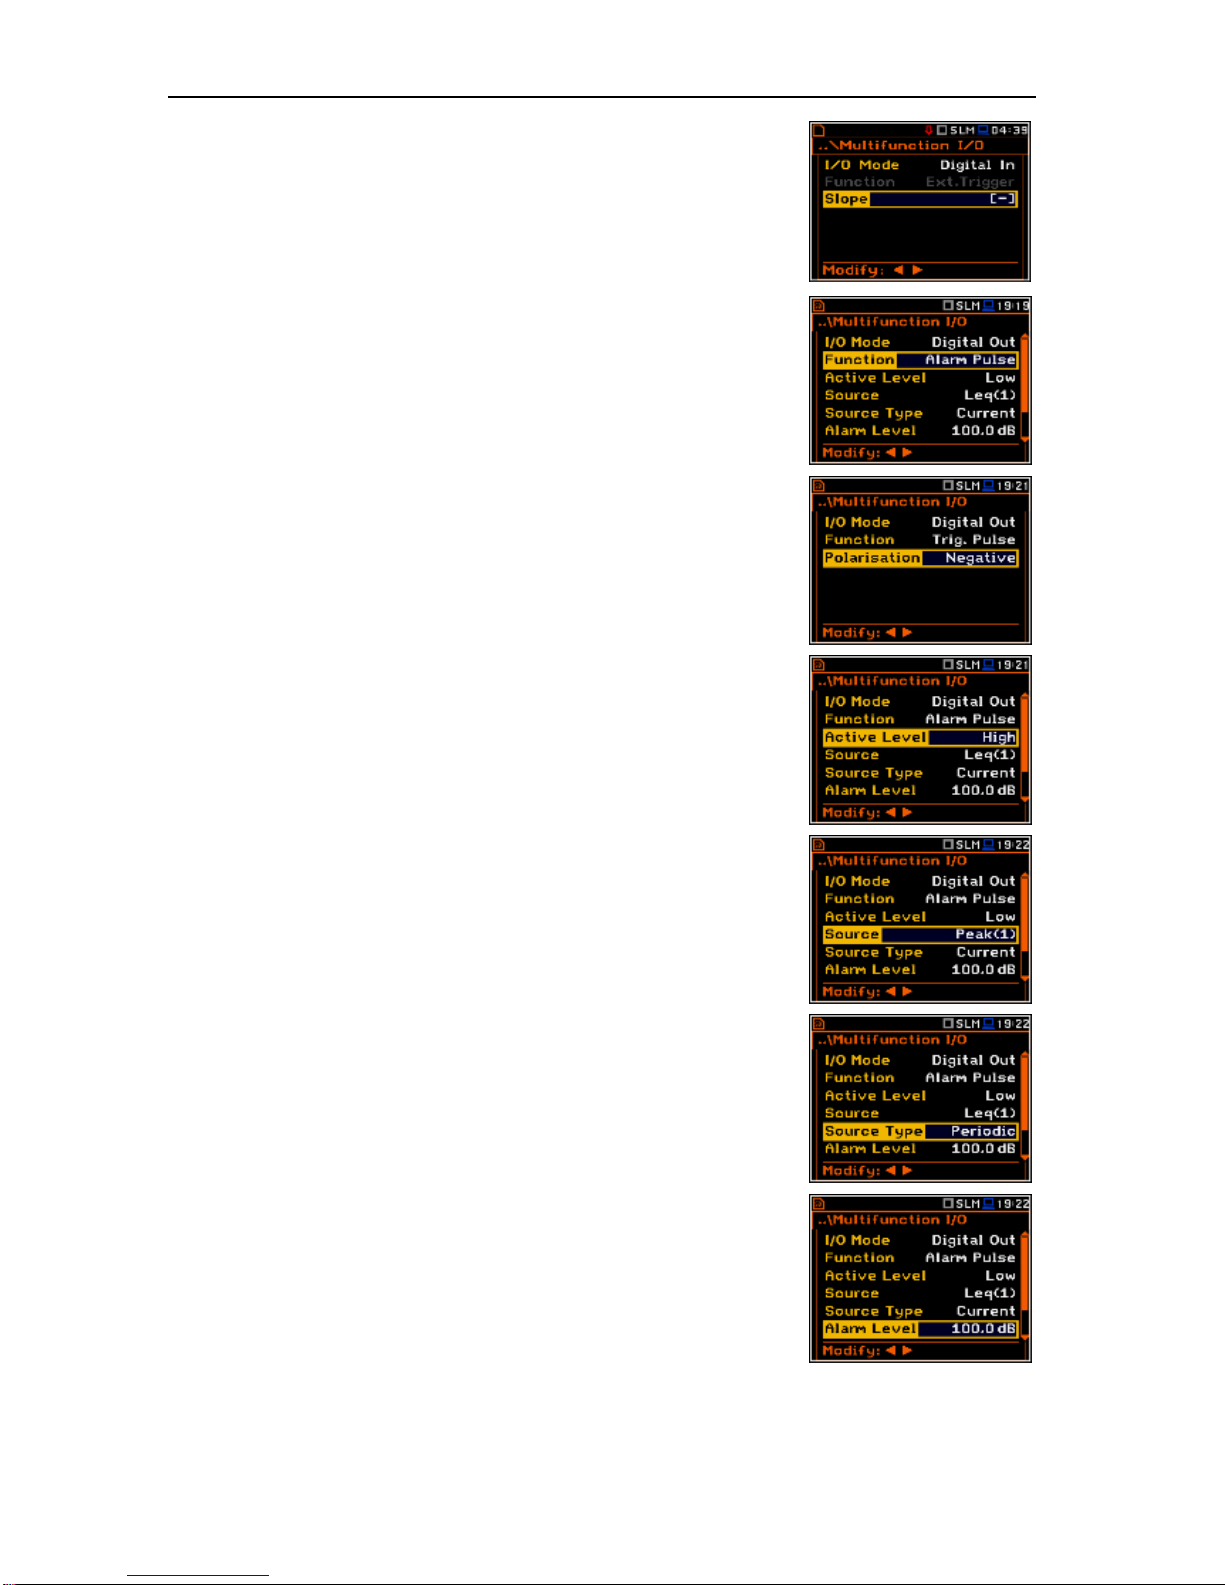
SVAN 979 USER'S MANUAL_______________________________________________ _71
Slope parameter selection for the Digital In mode (Trigger function)
In the case of Digital In selection the signal appearing on the I/O socket
will be treated as the external trigger if External is chosen as a trigger (path:
<Menu> / Measurement / Trigger / Measurement Trigger / Trigger /
External). For Digital In mode only the Ext.Trigger value is available for
the parameter Function. It is possible to set up Slope as positive [+] or
negative [-] by means of the <>, <> push-buttons.
Digital output function selection of the I/O socket
The Function position enables the user to set the function of the digital
output of the I/O instrument’s socket. The socket can be used as the source
of the trigger pulse (Trig. Pulse) which starts the measurement in another
“slave instrument” linked to the “master instrument” or the alarm signal,
which appears here after fulfilling certain measurement conditions
(Alarm Pulse).
Polarisation selection of the digital output signal
The Polarisation position enables the user to select which polarisation of
the signal (negative or positive going) will be applied to the output signal.
Active level selection of the digital output signal
The Active Level position enables the user to select which level of the
signal should be treated as a valid one (“negative” or “positive” logic): Low
or High.
Source signal selection for the alarm pulse generation
The Source position enables the user to select which measurement result
level should be checked. If the measured result level is greater than
selected alarm level, the instrument will generate alarm signal on the I/O
socket. The measurement results from the first profile: PEAK(1), SPL(1),
Max(1) or LEQ(1) can be used for the purpose described above.
Selection of the alarm source type
The Source Type position enables the user to select the type of alarm
source. Available types are: Current and Periodic.
Alarm level selection on the digital output of I/O
The Alarm Level enables the user to set the level of the result to be
monitored during the measurements. If the result is greater than the one
set in this line, the instrument will generate the alarm signal in the selected
logic. The available levels are within the range [30.0 dB, 140 dB].
The Alarm Level current value can be decreased / increased by 0.1 dB by
means of the <> / <> push-buttons. The step can be decreased /
increased up to 1 dB after simultaneously pressing the <> / <> pushbuttons together with <Shift>.
Page 72
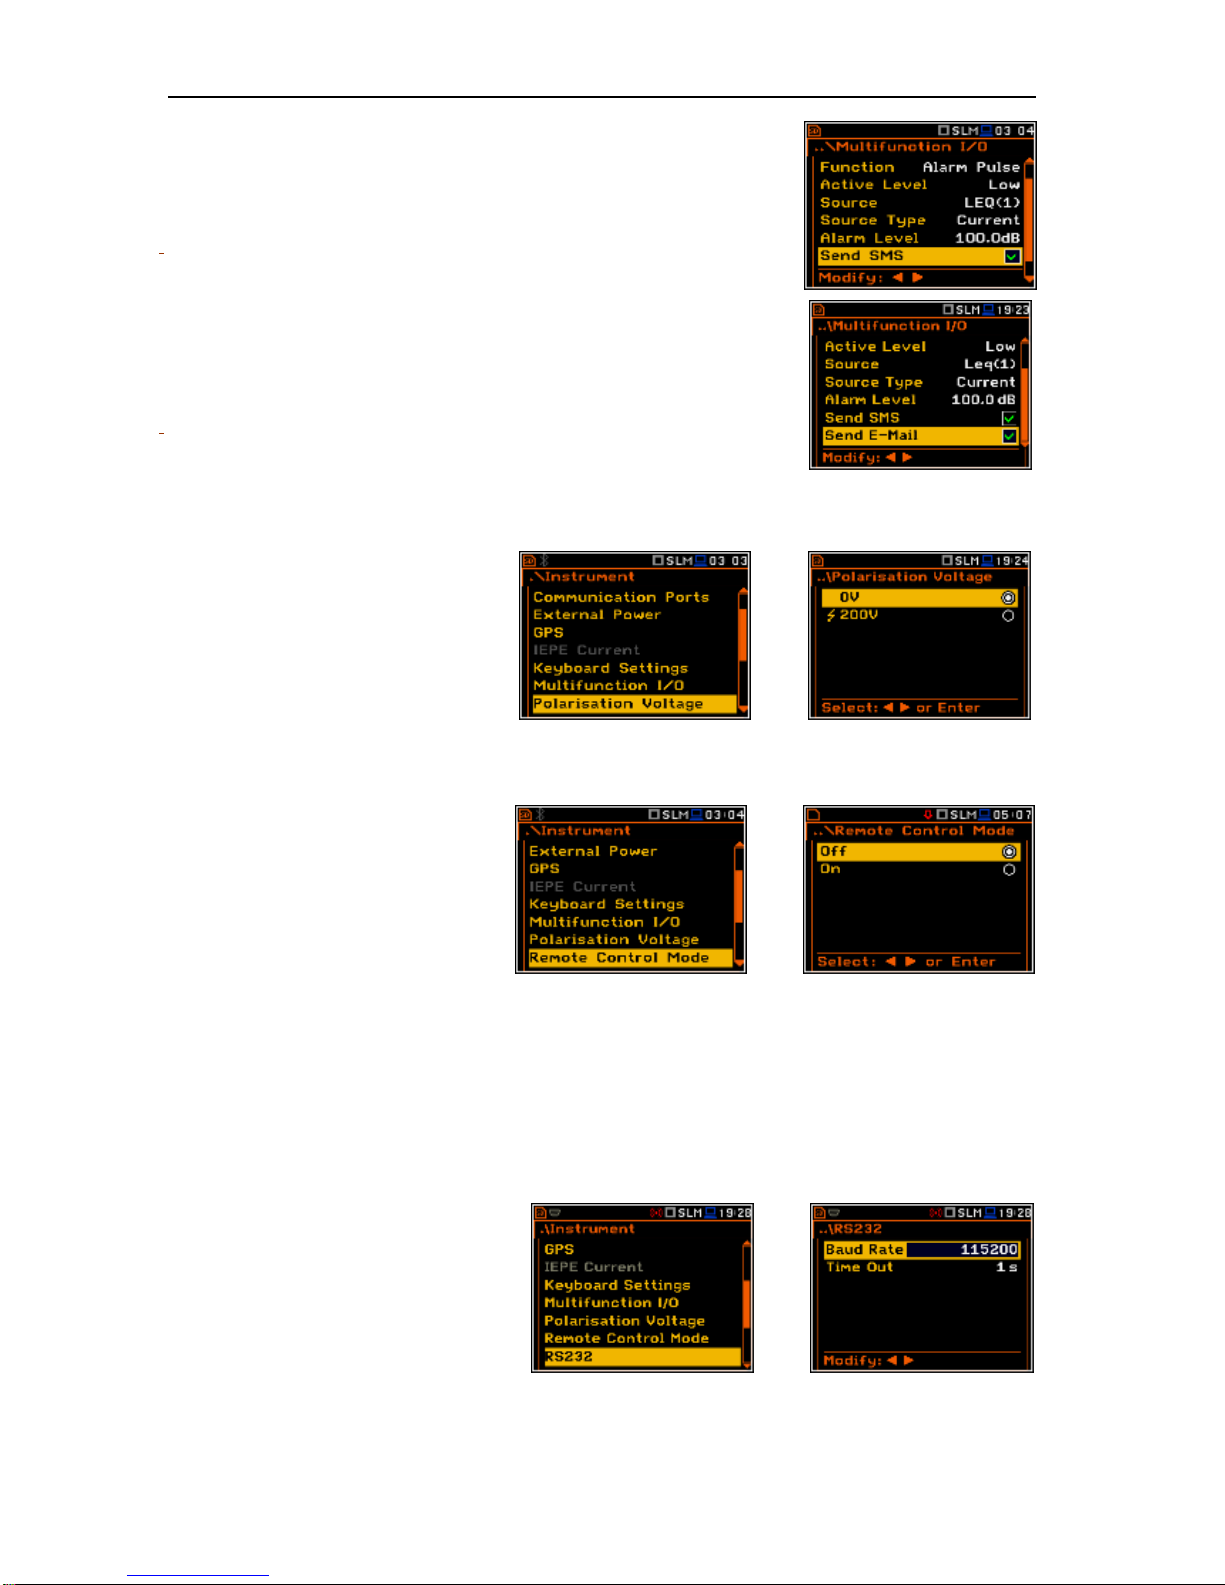
SVAN 979 USER'S MANUAL_______________________________________________ _72
Switch on or off the SMS message in case of alarm
When the alarm is generated during the measurement it is possible to send
an SMS message to the phone number, defined in the SMS Option window
(path: <Menu> / Instrument / Wireless Transfer / SMS Options).
Switch on or off the E-mail message in case of alarm
When the alarm is generated during the measurement it is possible to send
an E-mail message to the address, defined in the E-mail Settings window
(path: <Menu> / Instrument / Wireless Transfer / E-mail Settings).
8.11. Setting the microphone polarisation voltage – Polarisation Voltage
The Polarisation Voltage position
enables the user to choose polarisation
voltage of the instrument's microphone.
Two options are available: 0V and
200V. The selection is made by marking
the required position by means of the
<>, <> push-buttons.
<ENT>
8.12. Remote control mode configuration – Remote Control Mode
The Remote Control Mode position
enables the user to activate the Remote
Control mode. In this mode the
messages that require manual action
from the user will stop being shown
after 5 seconds. This mode is helpful
when the instrument is configured for
remote monitoring during which there is
usually nobody present who can control
the instrument manually. By enabling
the Remote Control mode, the
instrument's normal operations will not
be interrupted by displaying these
messages.
<ENT>
8.13. Setting the parameters of the serial interface - RS232
The RS232 position becames active after
activation of RS232 in the
Communication Ports window and
enables the user to programme the
RS 232 interface transmission speed
(Baud Rate) and to set the time limit
during which the communication
operation should be performed
(Time Out).
<ENT>
Page 73
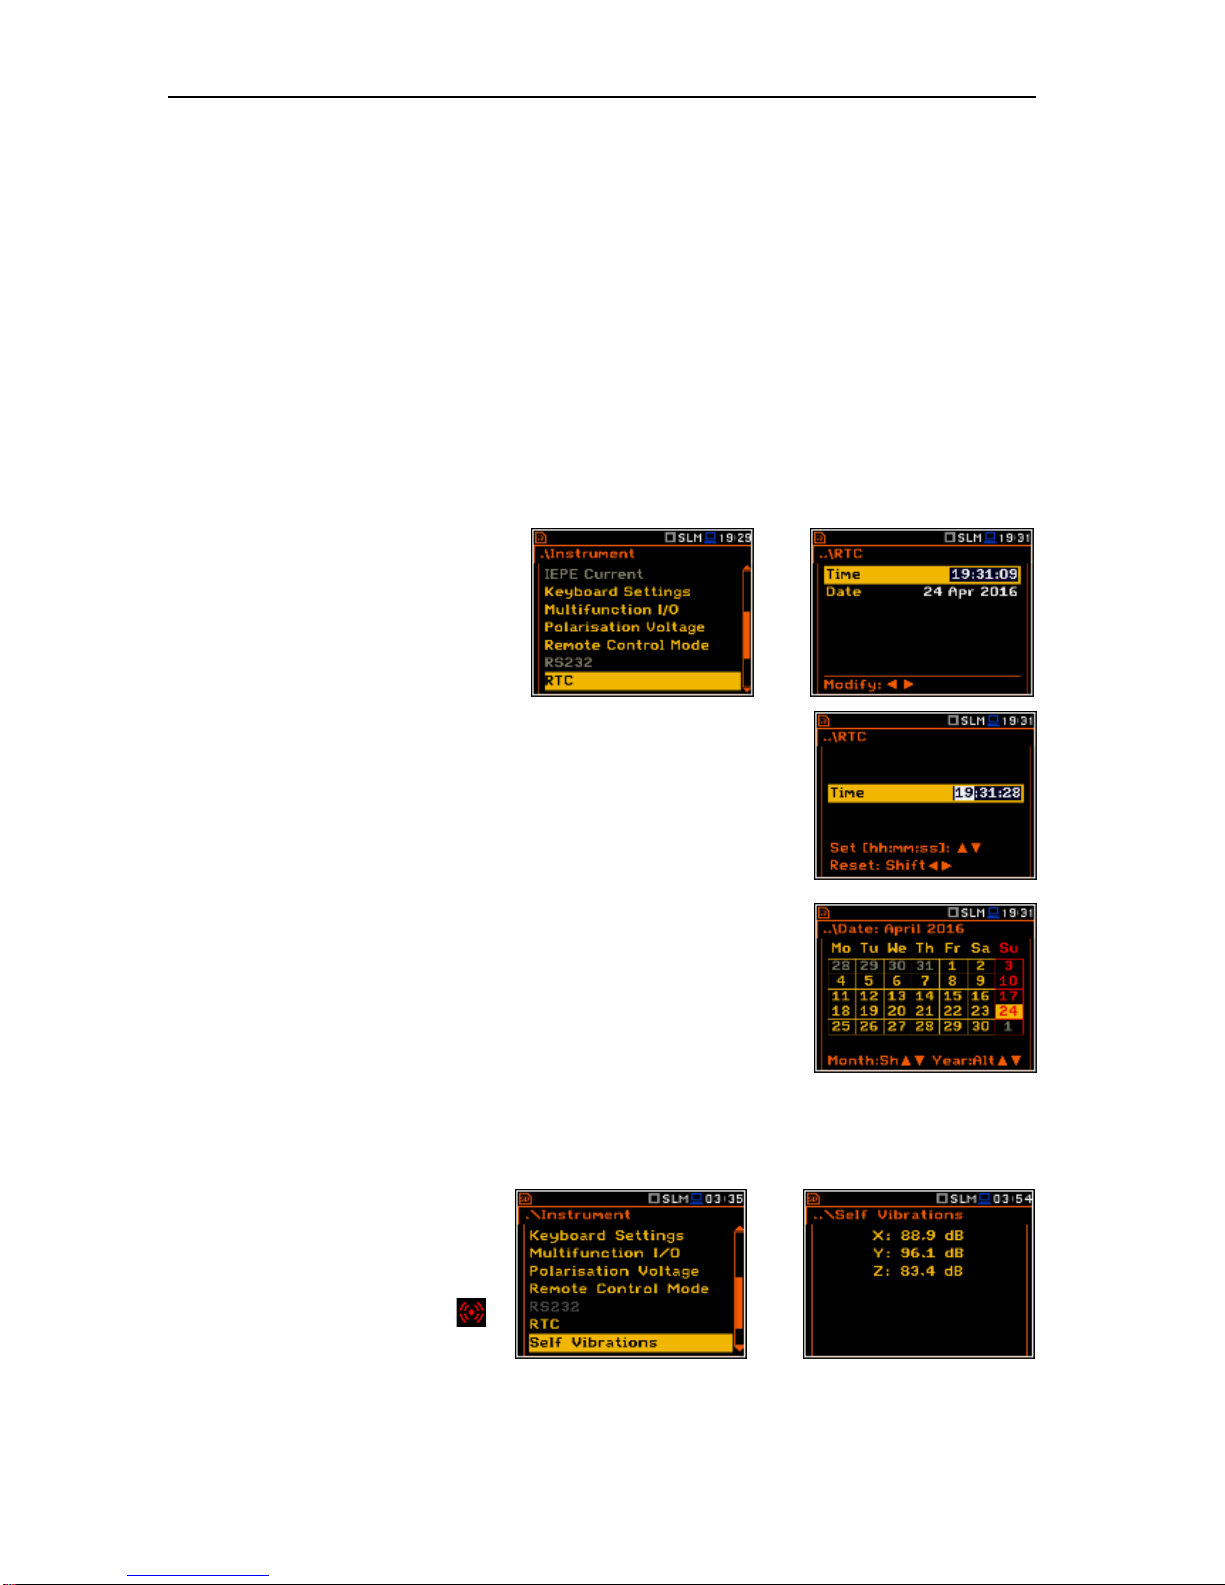
SVAN 979 USER'S MANUAL_______________________________________________ _73
Setting the transmission speed of the serial interface
The RS 232 interface transmission (Baud Rate) speed can be selected from the following available values:
1200 (bits / second), 2400 (bits / s), 4800 (bits / s), 9600 (bits / s), 19200 (bits / s), 38000 (bits / s),
57600 (bits / s) or 115200 (bits / s). The selection is made by means of the <>, <> push-buttons. The
setting here should be the same as in the connected instrument or computer to ensure successful data
transfer.
The other RS 232 transmission parameters are fixed to 8 bits for data, No parity & 1 Stop bit.
Setting time limit for the performance of serial interface operation
The default value of the parameter Time Out is equal to one second but this may be too short for some
slower printers, which may not be fast enough. In such cases, the Time Out parameter may have to be
increased to a higher value.
8.14. Programming the instrument’s internal Real Time Clock – RTC
The RTC enables the user to programme
the internal Real Time Clock. This clock
is displayed in the different places
depending on the selected presentation
mode.
<ENT>
The required hour, minute and second can be selected in a special window,
which is opened by means of the <>, <> push-buttons.
To set hours, minutes or seconds the user has to enter the correct field
position by pressing the <>, <> push button and then selecting the
correct value by means of the <>, <> push-buttons and then pressing
the <ENTER> push-button to set and confirm the chosen value.
The required date can be selected in a special window, which is opened after
pressing the <>, <> push-buttons when the Date text is displayed
inversely in the Timer sub-list.
In order to set the correct date the user has to select its position by means
of the <>, <> and <>, <> push buttons and then press the <ENTER>
push-button to set and confirm the chosen value.
8.15. Checking the instrument's vibration – Self Vibration
The Self Vibration position enables the
user to check the self vibration levels of
the instrument. The X direction is from
side to side, the Y direction is from top
to bottom and the Z direction is from
front to back. The self vibration
indicator will flash momentarily at the
top of the screen if the level in any
direction exceeds 100 dB.
<ENT>
Page 74
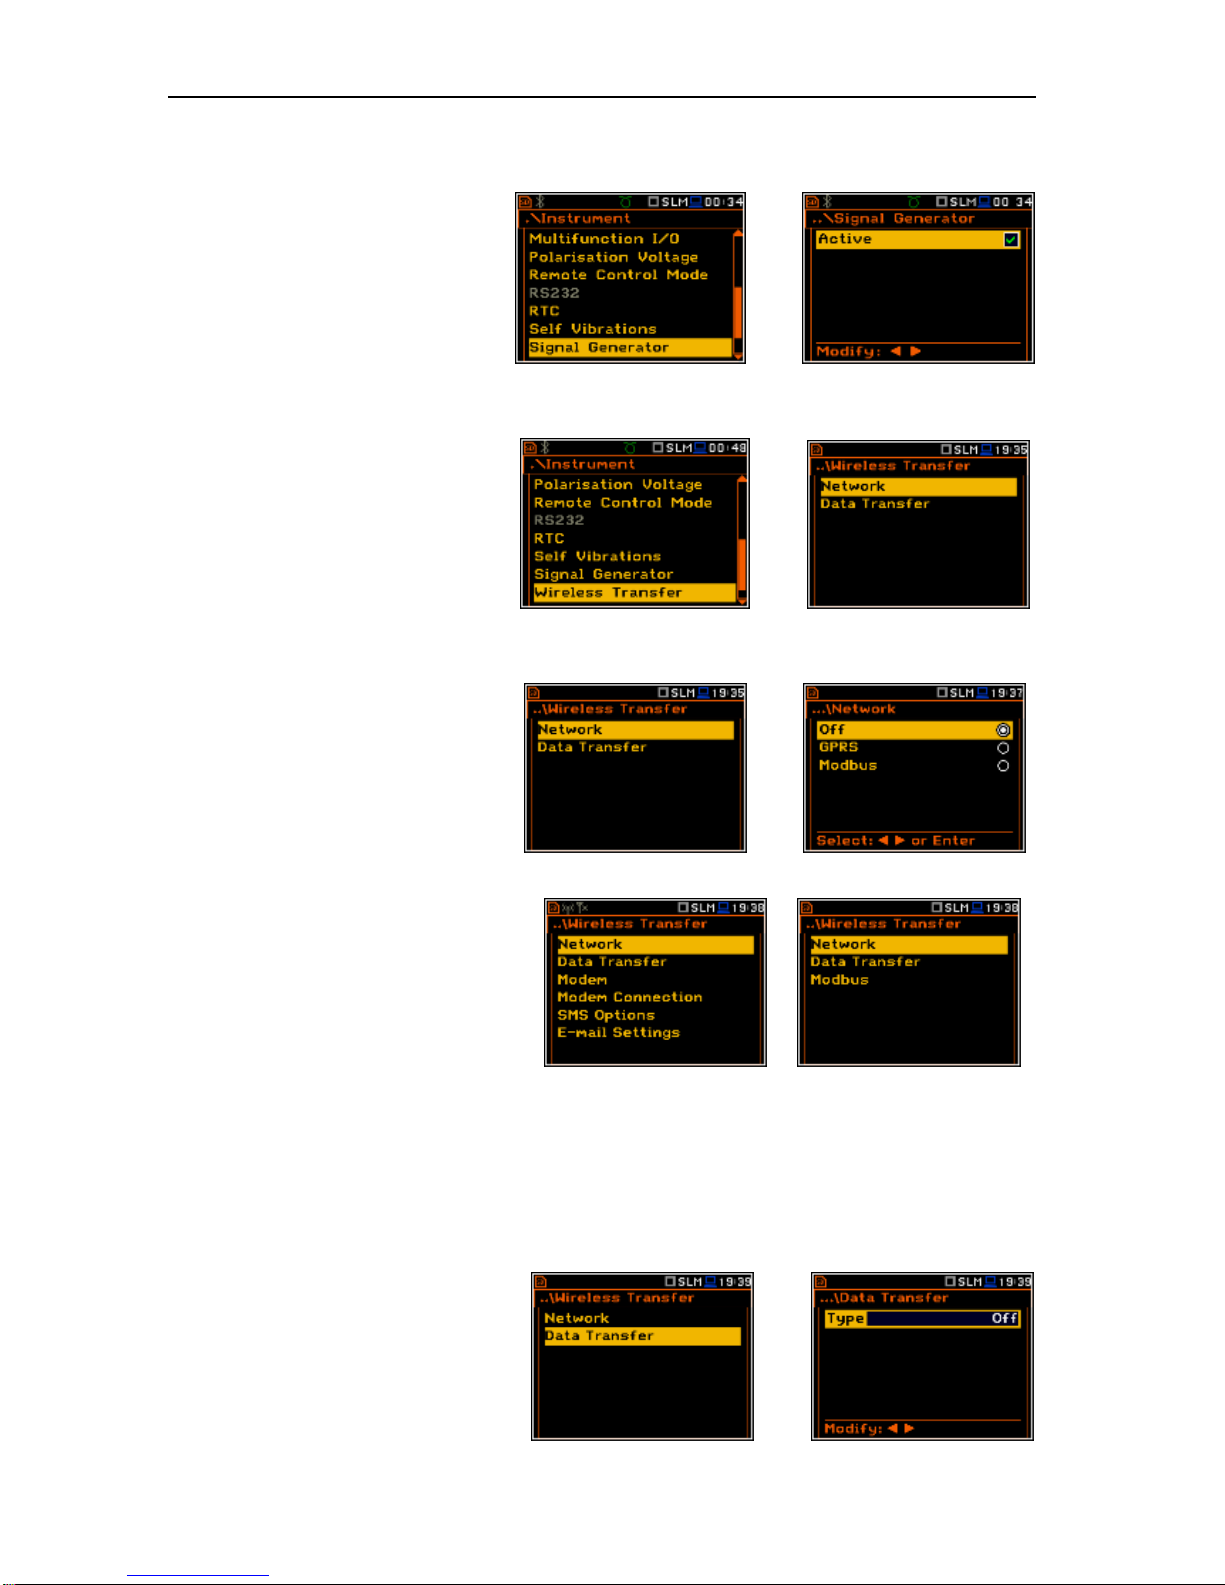
SVAN 979 USER'S MANUAL_______________________________________________ _74
8.16. Signal generator activation – Signal Generator
The Signal Generator position enables
the user to switch on the signal
generator function. The settings of the
generated signal are made in the
Signal Generator presentation mode
(see Display menu description).
<ENT>
8.17. Parameters of remote communication - Wireless Transfer
The Wireless Transfer position
enables the user to select the network
type and set the parameters of the data
transmission.
<ENT>
8.17.1. Selection of the network type – Network
It is possible to select one of three
options: Off, GPRS and Modbus.
Depending on the settings in the
Network list the Wireless Transfer
screen has different sets of positions.
If the Off parameter was selected the
Network window has two positions:
Network and Data Transfer.
<ENT>
If the GPRS network was selected the
Wireless Transfer window will have six
positions: Network, Data Transfer,
Modem, Modem Connection,
SMS Options and E-mail Settings.
If the Modbus network was selected the
Wireless Transfer window will have
three positions: Network, Data Transfer
and Modbus. Modbus protocol and its
implementation in SVAN instruments is
described in Appendix I.
Communication between modem and SVAN instruments is described in Appendix J.
8.17.2. Selection of the data transfer type - Data
In the Data Transfer window the user
can switch off or choose the data transfer
type. The Type parameter enables the
user to select the type of the
Wireless Transfer. Three options are
available: Off, Continuous and Packet.
<ENT>
Page 75
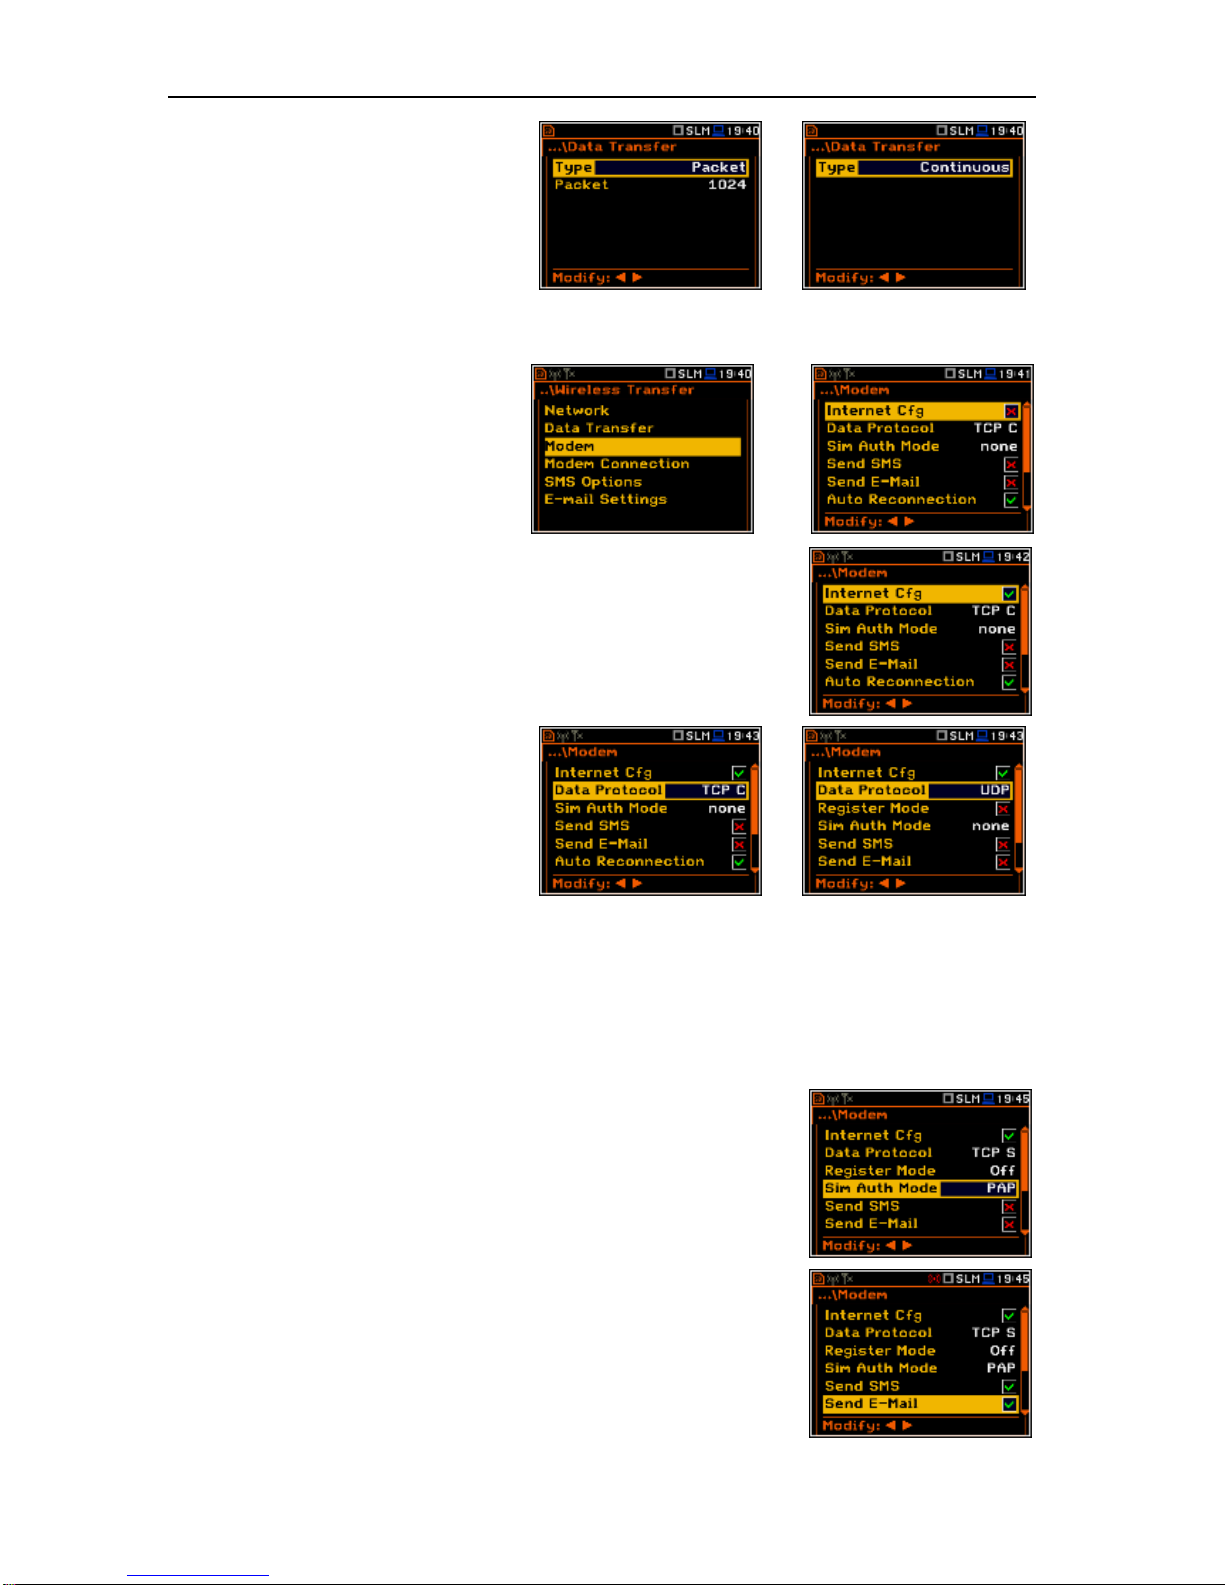
SVAN 979 USER'S MANUAL_______________________________________________ _75
In the case of the Packet type it is
possible to select the packet size in bits.
The available options are 1024, 512, 256,
128 and 64.
<>
8.17.3. Configuration of modem basic settings – Modem
The Modem position enables the user to
configure modem basic settings, such as
modem type and connection types.
The Modem window contains the
following options:
<ENT>
• Internet Cfg – selecting this option ensures that the device is set to
automatically configure the modem. When the device is turned off with
this option set, it will attempt to configure the modem after the next turn
on. More about this option is written in Appendix J (Configuration and
Registration).
• Data Protocol – defines connection
type for data exchange. Available
types are TCP S (server mode),
TCP C (client mode) and UDP.
<>
• Register Mode – selecting this option ensures that the device instantly attempts to register the station
provided the modem is already configured. More about the registration is written in Appendix J
(Configuration and Registration). Depending on selected Data Protocol type the values of this parameter
are different. In case when Data Protocol type is TCP S the values of this parameter are: Off, On
(registration using Connection Request Packets), AS (periodic registration on Svantek Server Address),
SMT.AS (registration on Svantek Server Address – performed each time internet connection is initialized
by the modem). In case when Data Protocol type is TCP C the Register Mode position does not appear.
In the case when Data Protocol type is UDP the Register Mode is limited to Off and On.
• Sim Auth Mode – defines the method of user verification by the SIM
card. Depending on the SIM card, several options are possible, some of
them are recognized by the modem:
• none – no verification required.
• PAP
• CHAP
• MsChap – denotes MsChap in version 1.
• Send SMS – selecting this option will configure SMS service by the
modem.
• Send E-Mail – selecting this option will configure e-mail service by the
modem.
Page 76
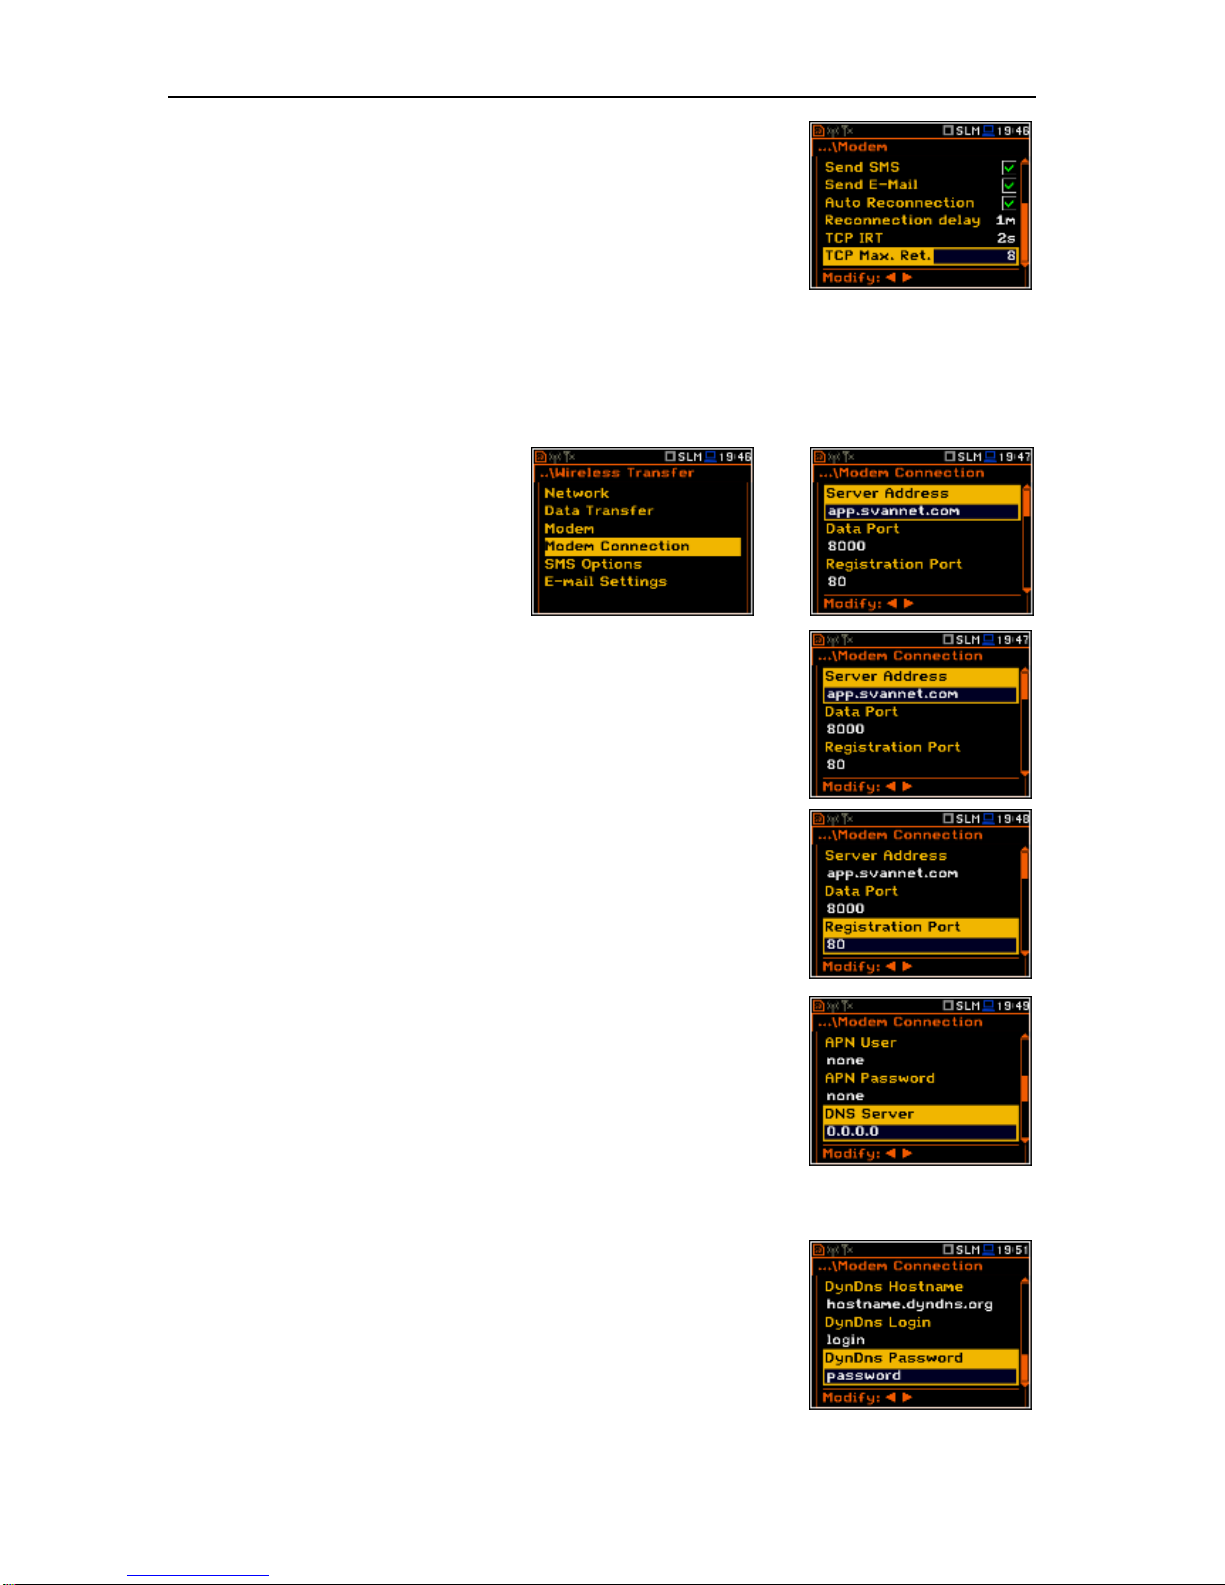
SVAN 979 USER'S MANUAL_______________________________________________ _76
• Auto Reconnection – selecting this option will make the device attempt
to reconnect the modem in the case of errors or sudden disconnection.
More about this option is written in Appendix J (Error handling).
• Reconnection Delay – time between each reconnection attempt.
• TCP IRT - initial timeout for TCP connections. In some cases, extending
this timeout may be helpful in case of slow connections, but the default
setting is recommended.
• TCP Max. Ret. - maximum reconnection attempts performed within a
simple connection cycle. In some cases, setting higher value may be
helpful in case of slow connections, but the default setting is
recommended.
8.17.4. Setting of support modem options - Modem Connection
The Modem Connection position
enables the user to configure several
supporting options required by SIEMENS
modem to establish internet connection.
More about this option is written in
Appendix J (Configuration and
Registration).
<ENT>
The Modem Connection window contains the following positions:
• Server Address – allows the user to enter up to 32 characters of either
IP or domain address, where the registration data will be sent during the
registration process (Data Protocol: TCP S or UDP) or to which the
modem will connect to (Data Protocol: TCP C).
• Data Port – allows the user to enter up to 5 characters for the port
number. This number denotes a port on which a communication socket
will be configured for data exchange between remote host and the
station.
• Registration Port – allows the user to enter up to 5 characters for the
port number. This number denotes a port on which a communication
socket will be configured to transmit registration packet (Register Mode:
On) or exchange Http data (Register Mode: AS or SMT. AS).
• APN – allows the user to enter up to 20 characters of APN name of the
SIM card used with the modem.
• APN User – allows the user to enter up to 20 characters of user name
used for verification by the SIM card used with the modem.
• APN Password – allows entering up to 20 characters of password used
for verification by the SIM card used with the modem.
• DNS Server – allows the user to enter up to 15 characters of IP address
of DNS server used for establishing connection with the internet. In most
cases, leaving the default value of “0.0.0.0” will be sufficient, but some
SIM cards may require a specific address to be entered.
Positions DynDns Server, DynDns Hostname, DynDns Login and
DynDns Password allow the user to define the server and login
information when using DynDNS service in case of dynamic IP address.
Edition of each position is performed in the special window with the text
editor function, which is opened after pressing the <>, <> pushbuttons.
Page 77
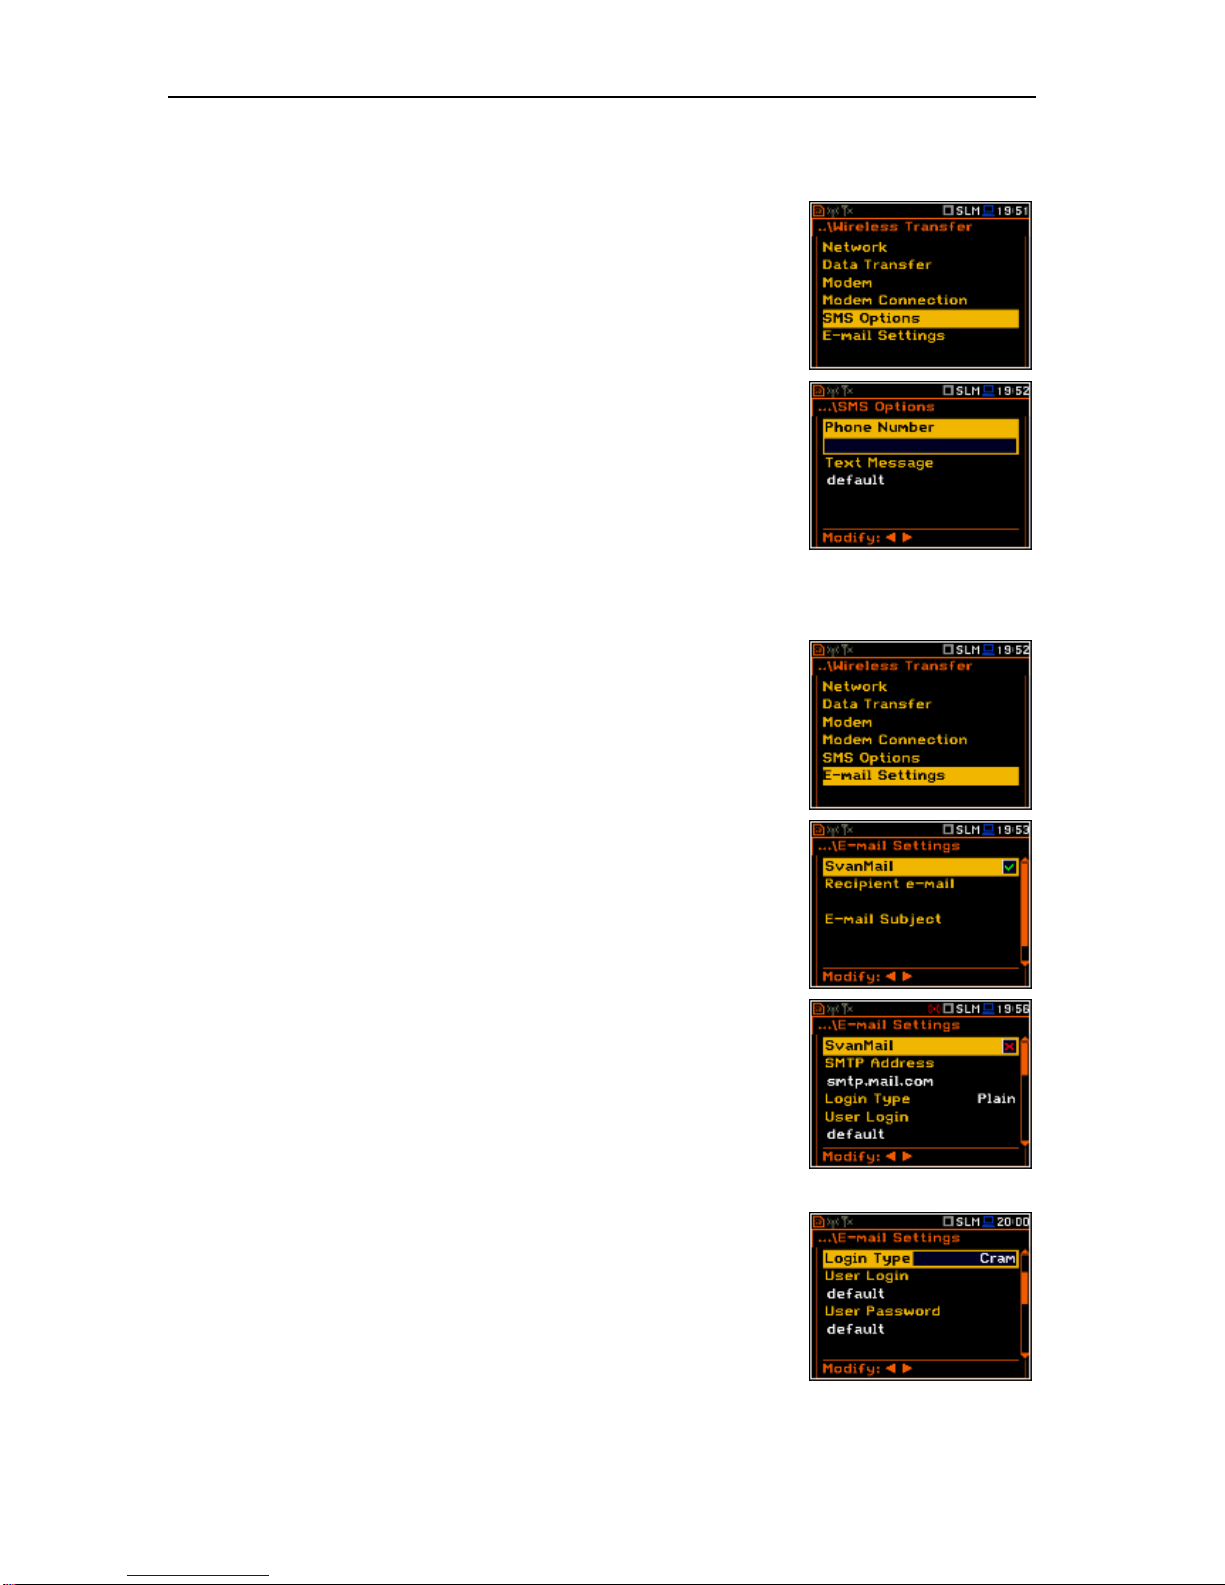
SVAN 979 USER'S MANUAL_______________________________________________ _77
8.17.5. Configuration of SMS service - SMS Option
The SMS Options position allows the user to configure SMS service used
for alarm notification. For more information about alarm notification see
Appendix J (Alarm notification).
The SMS Options window contains the following positions:
• Phone Number – allows the user to enter up to 20 characters of the
phone number where the text messages will be sent.
• Text Message – allows the user to enter up to 20 characters of
additional text, which will be appended into a standard alarm message
template.
Editing each position is performing in the special window with the text editor
function, which is opened after pressing the <>, <> push-buttons.
8.17.6. Configuration of e-mail service - E-mail
The E-mail Settings position allows the user to configure the e-mail service
used for alarm notification. For more information about alarm notification
see Appendix J (Alarm notification).
The E-mail Settings window contains the following positions:
If SvanMail position is swithed on the user should define only positions:
Recipient e-mail, E-mail Subject and E-mail Message. The SvanMail
option allows SvanNET compatible instruments to send e-mails without
additional parameters, simplifying the process of configuring alarm
notifications.
If SvanMail position is swithed off the user should define additional up to
five positions:
• SMTP Address – allows the user to enter up to 32 characters of SMTP
server address which will be used to send e-mail messages.
• Login Type – None, Login, Plain and Cram. These options define
authentication method, which is dependent on SMTP server used for
sending e-mails. In most cases Plain value is used.
• User Login – allows the user to enter up to 20 characters of user login
text used to establish verified connection with SMTP server.
• User Password – allows the user to enter up to 20 characters of user
password text used to establish verified connection with SMPT server.
Page 78
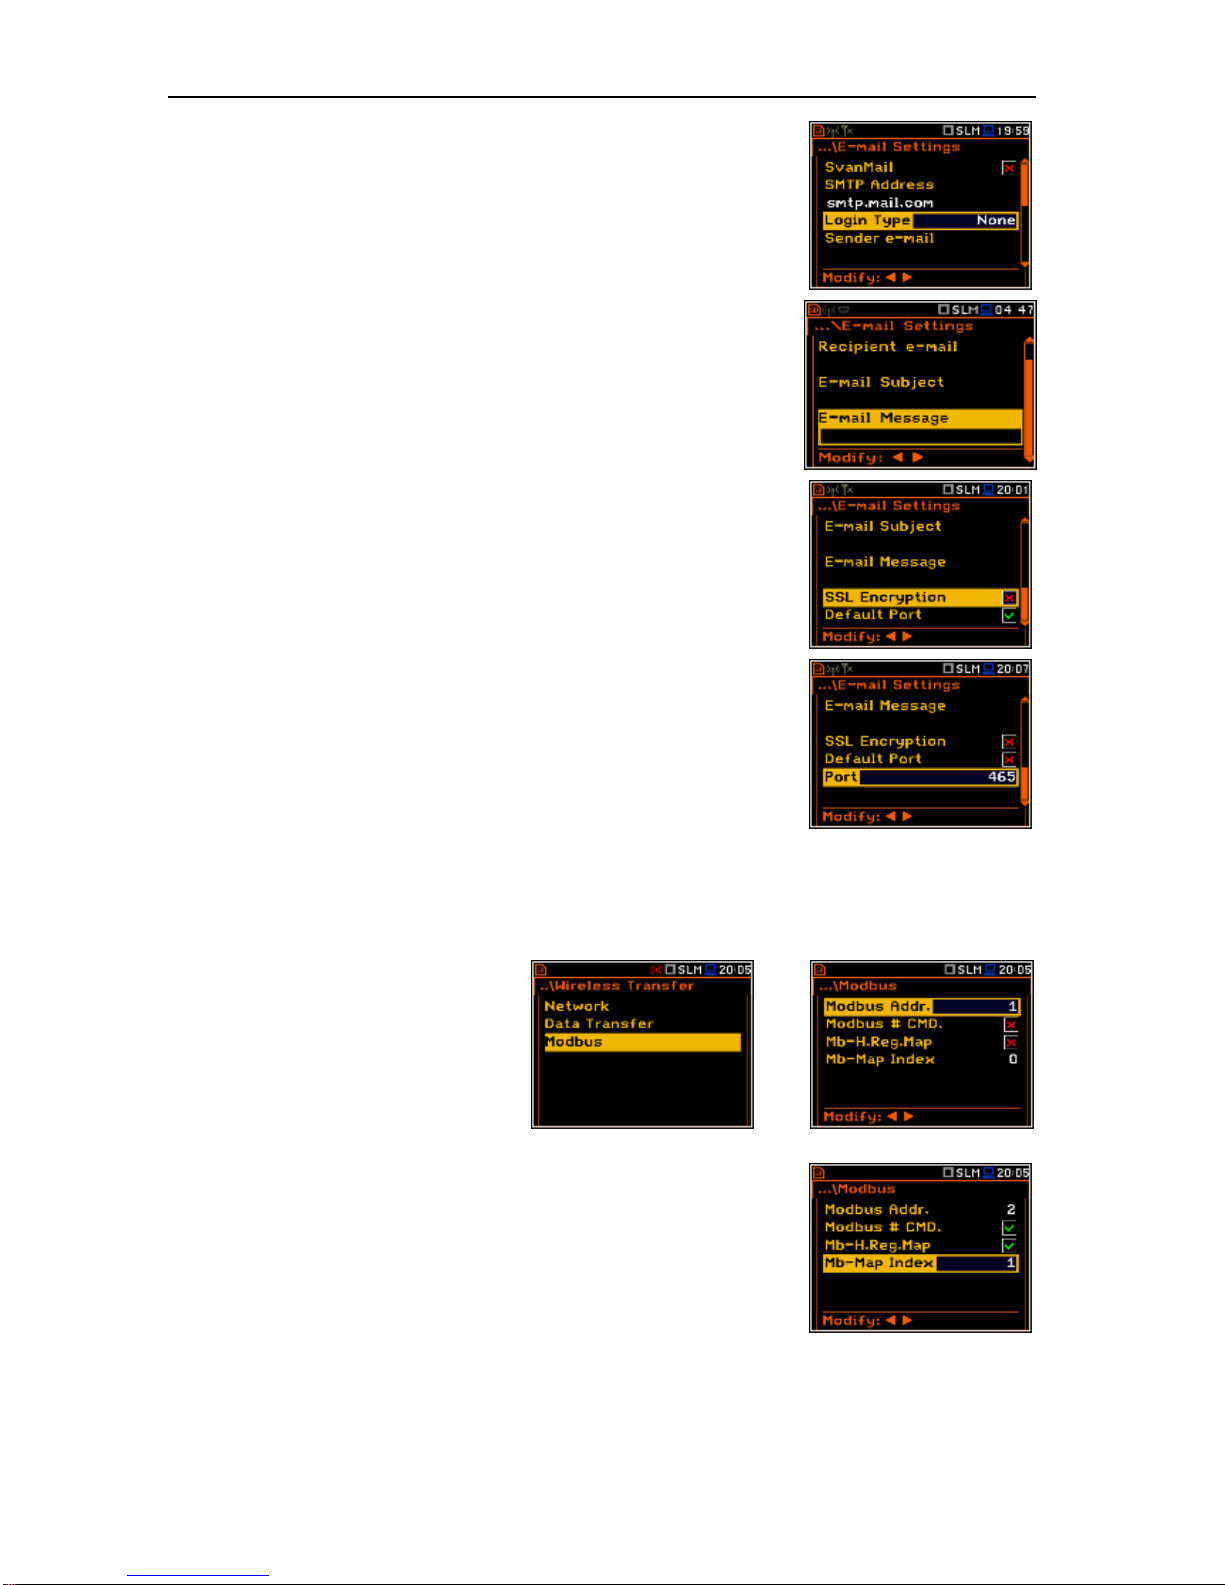
SVAN 979 USER'S MANUAL_______________________________________________ _78
If Login Type is None no User Login and User Password positions
appear. It should be used when SMTP server requires no authentication.
• Sender e-mail – allows the user to enter up to 48 characters of e-mail
address from which the e-mail message will be sent.
• Recipient e-mail – allows the user to enter up to 48 characters of e-mail
address to which the e-mail message will be sent.
• E-mail Subject – allows the user to enter up to 20 characters of the
message's subject.
• E-mail Message – allows the user to enter up to 20 characters of
additional text which will be appended to standard e-mail message
template used for alarm notification.
• SSL Encription – when swithed on means that the device will attempt
to configure the modem to connecting to the mail server used the
encryption protocol SSL.
• Default Port - when swithed on means that the device will try to
communicate with the mail server on the default port (25 for normal calls,
465 with SSL).
• Disabling of Default Port will initiate the Port position, where the user
will be able to set its own port.
Edition of each position is performing in the special window with the text editor function, which is opened
after pressing the <>, <> push-buttons.
8.17.7. Data transfer with the Modbus protocol – Modbus
If the Modbus network was selected the
Wireless Transfer window will have
three positions: Network, Data Transfer
and Modbus. Modbus protocol and its
implementation in SVAN instruments are
described in Appendix I.
The Modbus window contains the
following positions:
<ENT>
• Modbus Addr. - device Modbus address, ranging from 1 to 247.
• Modbus # CMD. - selecting this option, enables processing of Svantek
# functions via Modbus protocol. Upon entering a # command into
Modbus structures, it will be processed and any results will be placed in
Input Registers (and Discrete Inputs) structure. It is not recommended
to use this option alongside with Mb-H.Reg.Map option!
• Mb-H.Reg.Map - selecting this option enables result mapping. During
measurement, on-going results will be placed in Holding Registers
starting from appointed address. It is not recommended to use this
option alongside with Modbus # CMD. option!
• Mb-Map Index - denotes address from which result map will be placed
during measurements.
Page 79
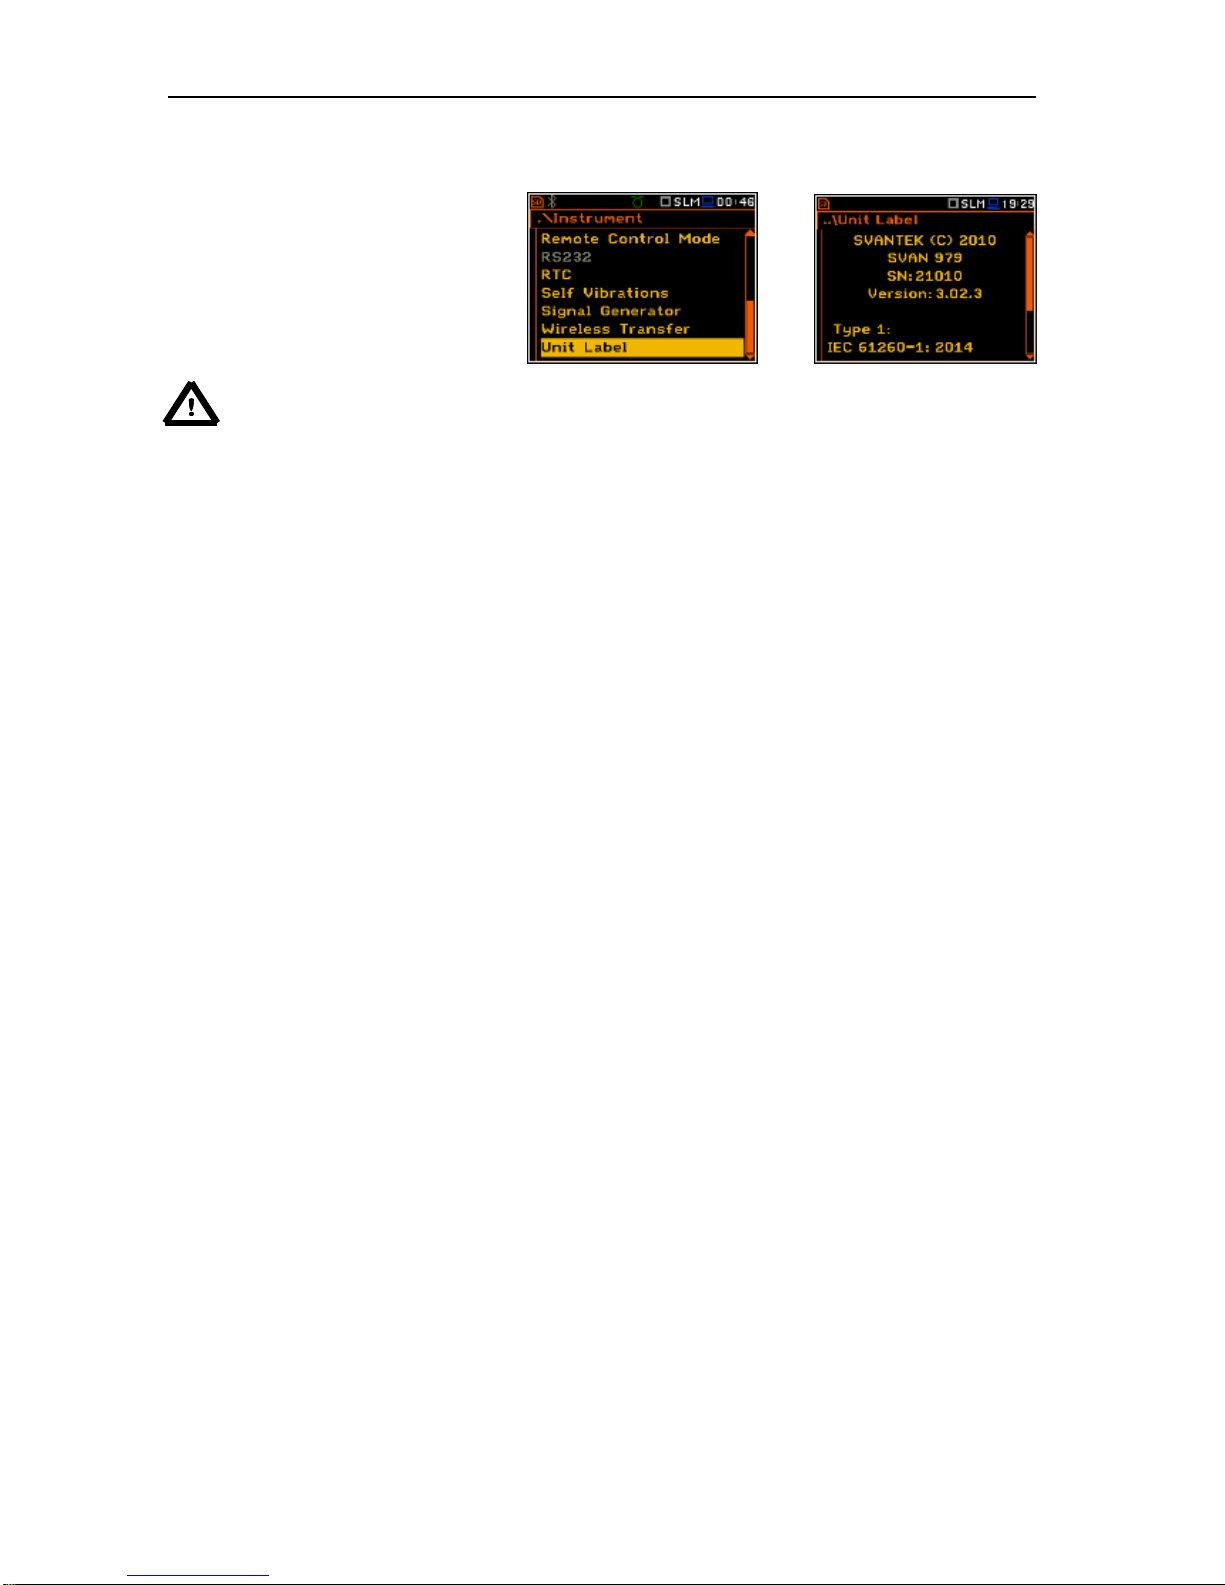
SVAN 979 USER'S MANUAL_______________________________________________ _79
8.18. Checking specification of the instrument - Unit Label
The Unit Label enables the user to check
information about the model number of
the instrument, its serial number, the
current firmware version installed in it and
the appropriate standards which the
instrument complies with.
<ENT>
Notice: The contents of the Unit Label screen should always sent to Svantek’s service
department or official representative in case of any problems faced by the user during the
instrument’s normal operation in the field.
Page 80
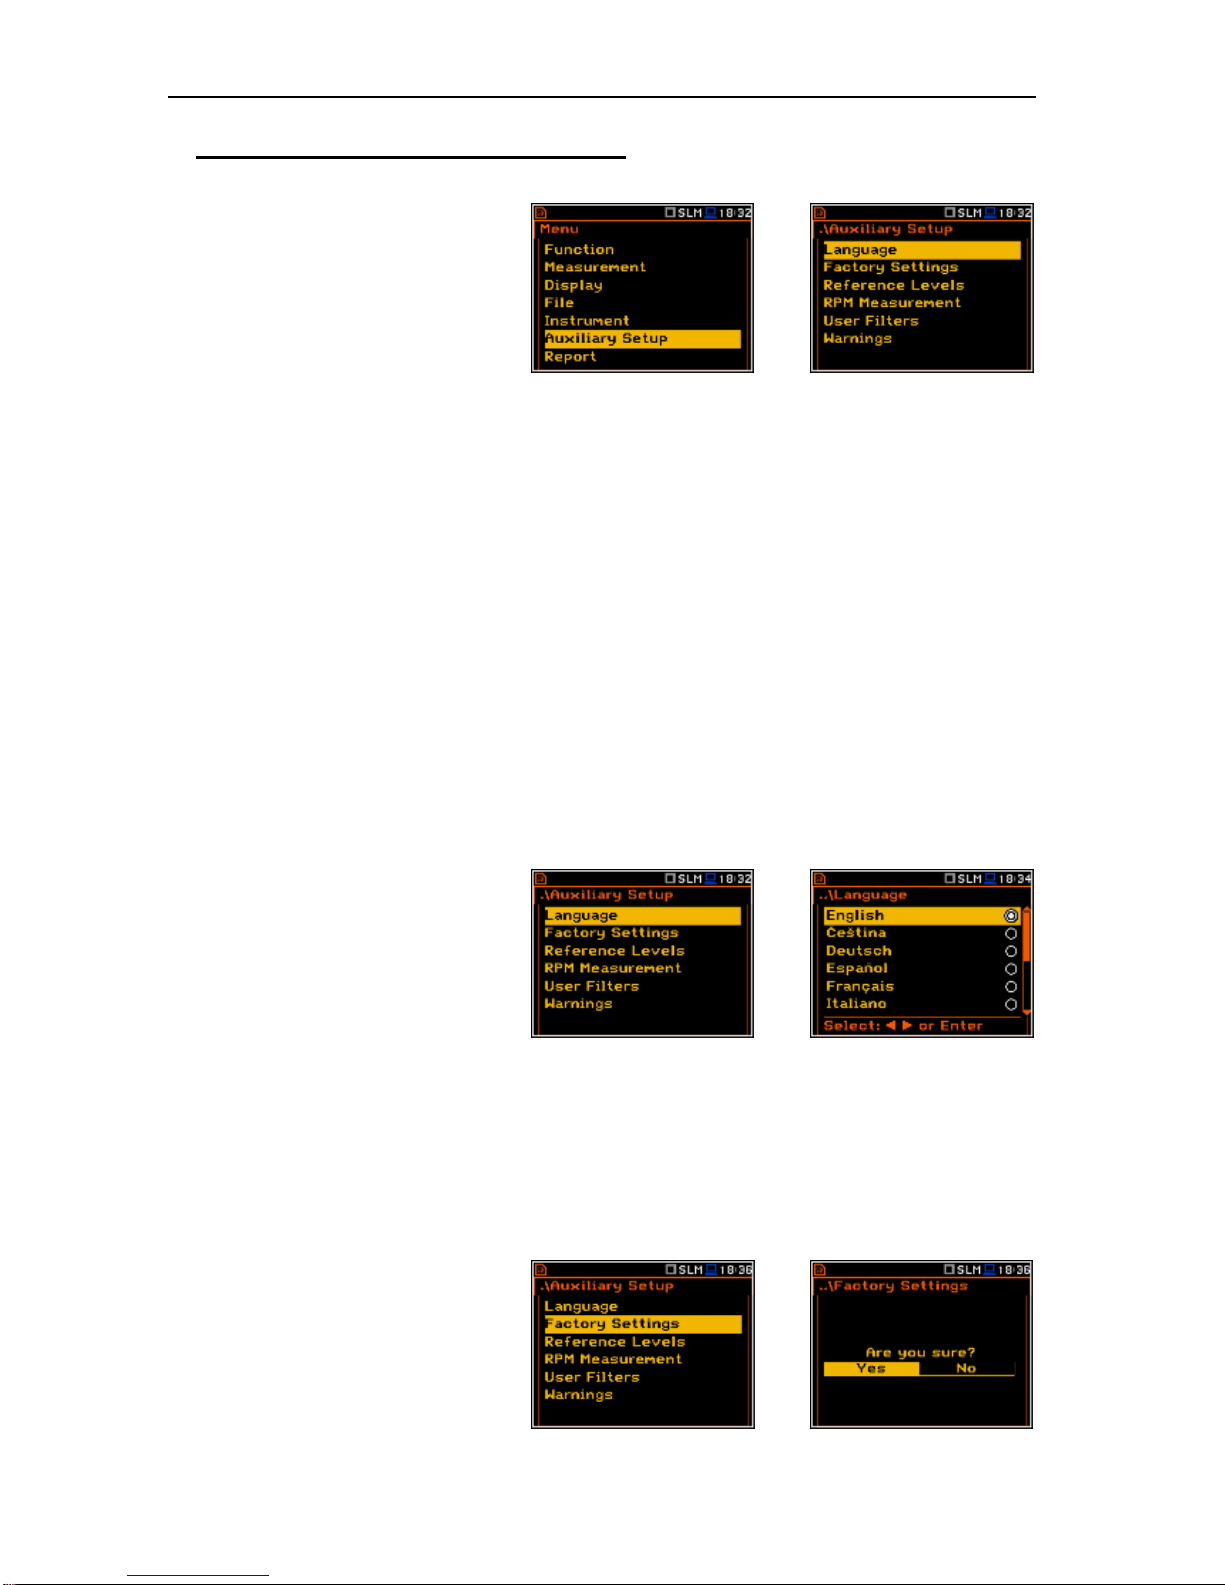
SVAN 979 USER'S MANUAL_______________________________________________ _80
9. AUXILIARY SETTINGS – Auxiliary Setup
The Auxiliary Setup list contains
positions directly related with sound or
vibration measurements and not related
to the hardware components of the
instrument. In order to view the
Auxiliary Setup list the user has to press
the <Menu> push-button, select the
Auxiliary Setup text and press
<ENTER>.
In the Auxiliary Setup list, the following
items are available:
<ENT>
Language enables the user to select the language of the user interface.
Factory Settings enables the user to return to the default, factory settings.
Reference Levels enables the user to select the reference level for the Vibration
measurements and it informs the user about the reference level in the Sound
measurements.
RPM Measurement enables the user to set the RPM measurements parameters.
User Filters enables the user to select and set the correcting values for all real-time and
the 1/1 - 1/12 octave filters.
Vibration Units enables the user to select the Vibration units in which the results
of the measurements are to be given. This position appears only in Vibration
modes.
Warnings enables the user to switch the warnings on or off that can be displayed
during the normal operation of the instrument.
9.1. Setting the language of the user interface – Language
The Language sub-list enables the user
to select the language of the user
interface. For activation of the Russian
version of the user interface, the special
code has to be entered.
If after power on unknown language
interface appears on the display the user
can reset the instrument by means of the
four <Shift/Enter/Alt/Start> pushbuttons pressed together. After this the
instrument will go back to the default
setup with the English interface.
<ENT>
9.2. Return to the factory settings – Factory Settings
The Factory Settings position enables
the user to return to the default setup of
the instrument.
The factory setup can also be installed by
means of the four <Shift/Enter/Alt/Start>
push-buttons pressed together.
<ENT>
Page 81
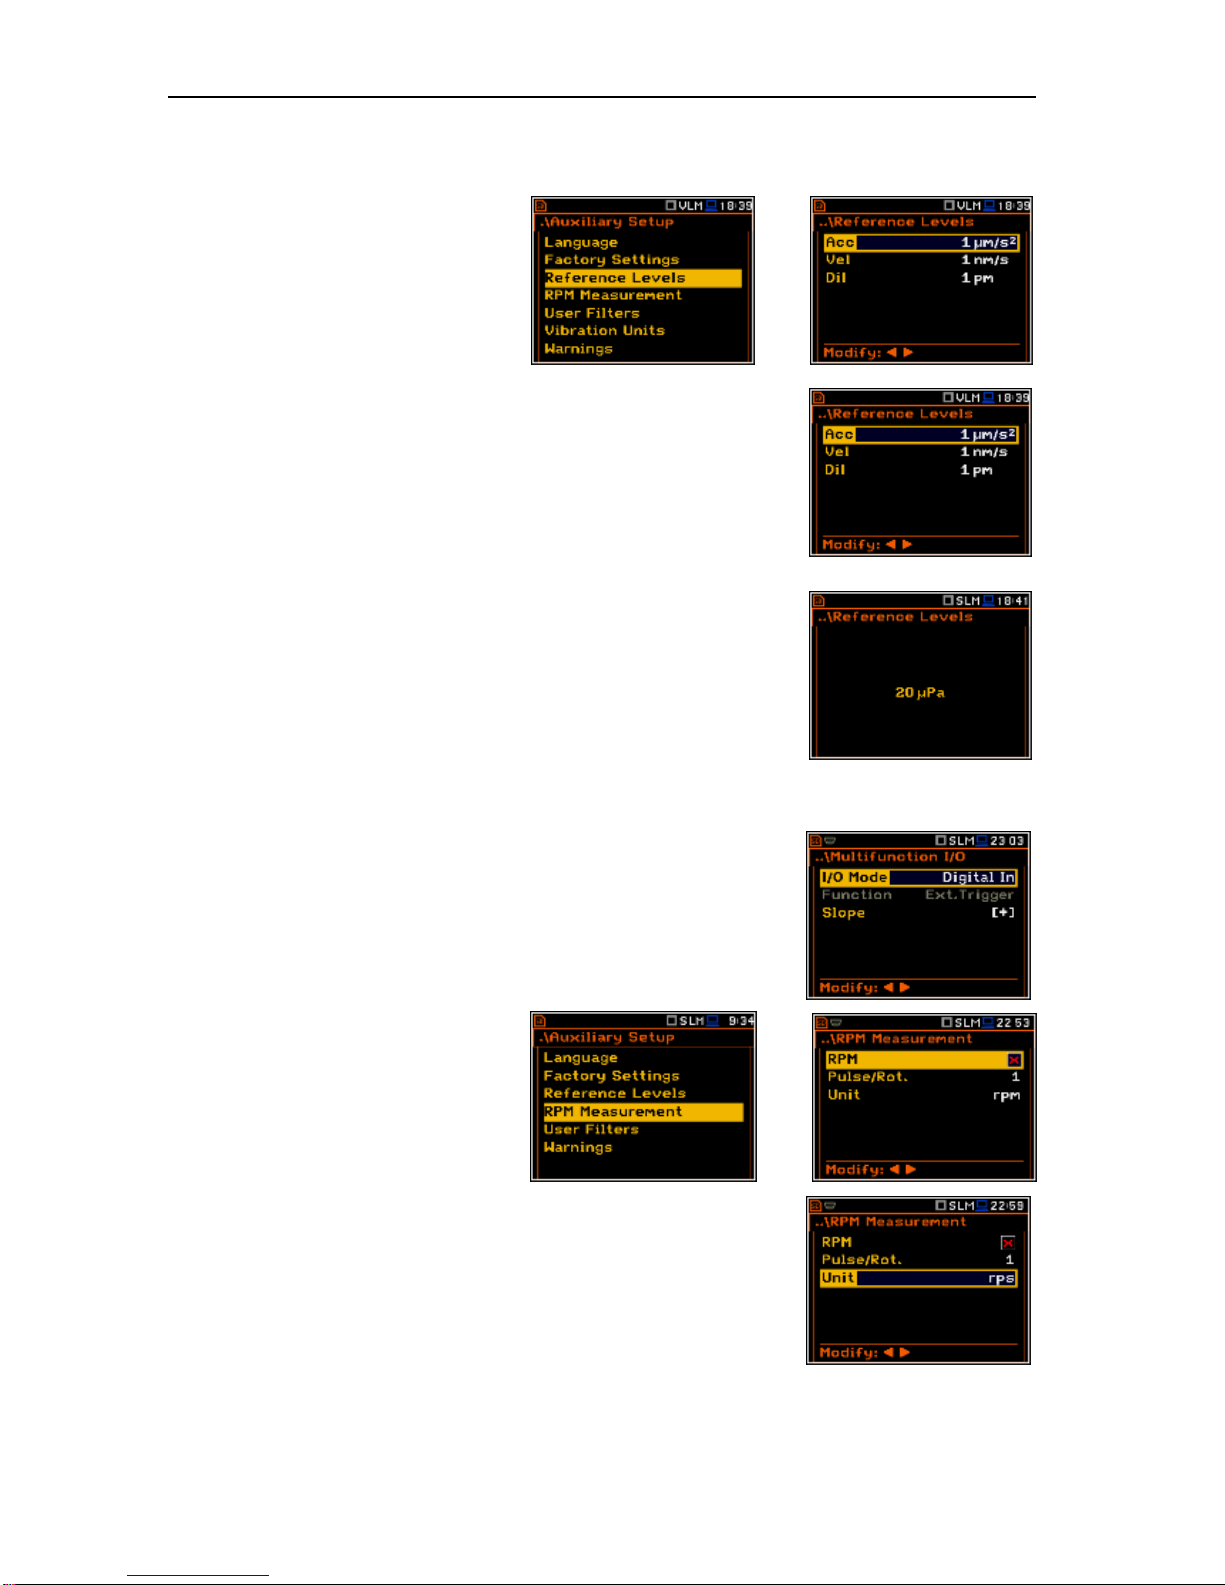
SVAN 979 USER'S MANUAL_______________________________________________ _81
9.3. Reference signal in vibration measurements - Reference Levels
The Reference Levels sub-list enables
the user to set the reference levels of the
vibration signal or to inform the user about
the reference level in case of sound
measurements. The values, which are set
here, are taken into account during the
calculations of the measurement results
expressed in the Logarithmic (dB) scale.
<ENT>
Reference level for vibration measurements
In the Acc position the user can set the reference level of the acceleration
signal. It is possible to set this level from 1 µms-2 to 100 µms-2.
In the Vel position, the user can set the reference level of the velocity signal.
It is possible to set this level from 1 nms-1 to 100 nms-1.
In the Dil position, the user can set the reference level of the displacement
signal. It is possible to set this level from 1 pm to 100 pm.
Reference level for sound measurements
In the case of sound measurements the Reference Levels sub-lists is used
only to inform the user that the reference level of the acoustic signal is equal
to 20 Pa. After pressing the <ESC> or <ENTER> push-buttons the sub-
list is closed.
9.4. RPM measurement setting – RPM Measurement
To perform the RPM measurement the RPM probe should be connected
to the I/O socket and the I/O Mode should be defined as Digital In (path:
<Menu> / Instrument / Multifunction I/O / I/O Mode).
The RPM position enables the user to
programme the measurements of
rotational speed, measured by tacho
probe. The RPM function usually is an
optional function and should be activated
during first attempt to switch it on.
<ENT>
The Pulse/Rot. enables the user to select the number of pulses / rotations
during rpm measurement. Available values are as follows: 1, 2, .. 360.
The Unit enables the user to select the unit of the measurement. In this
position two option are available rpm – revolutions per minute and rps –
revolutions per second.
Page 82
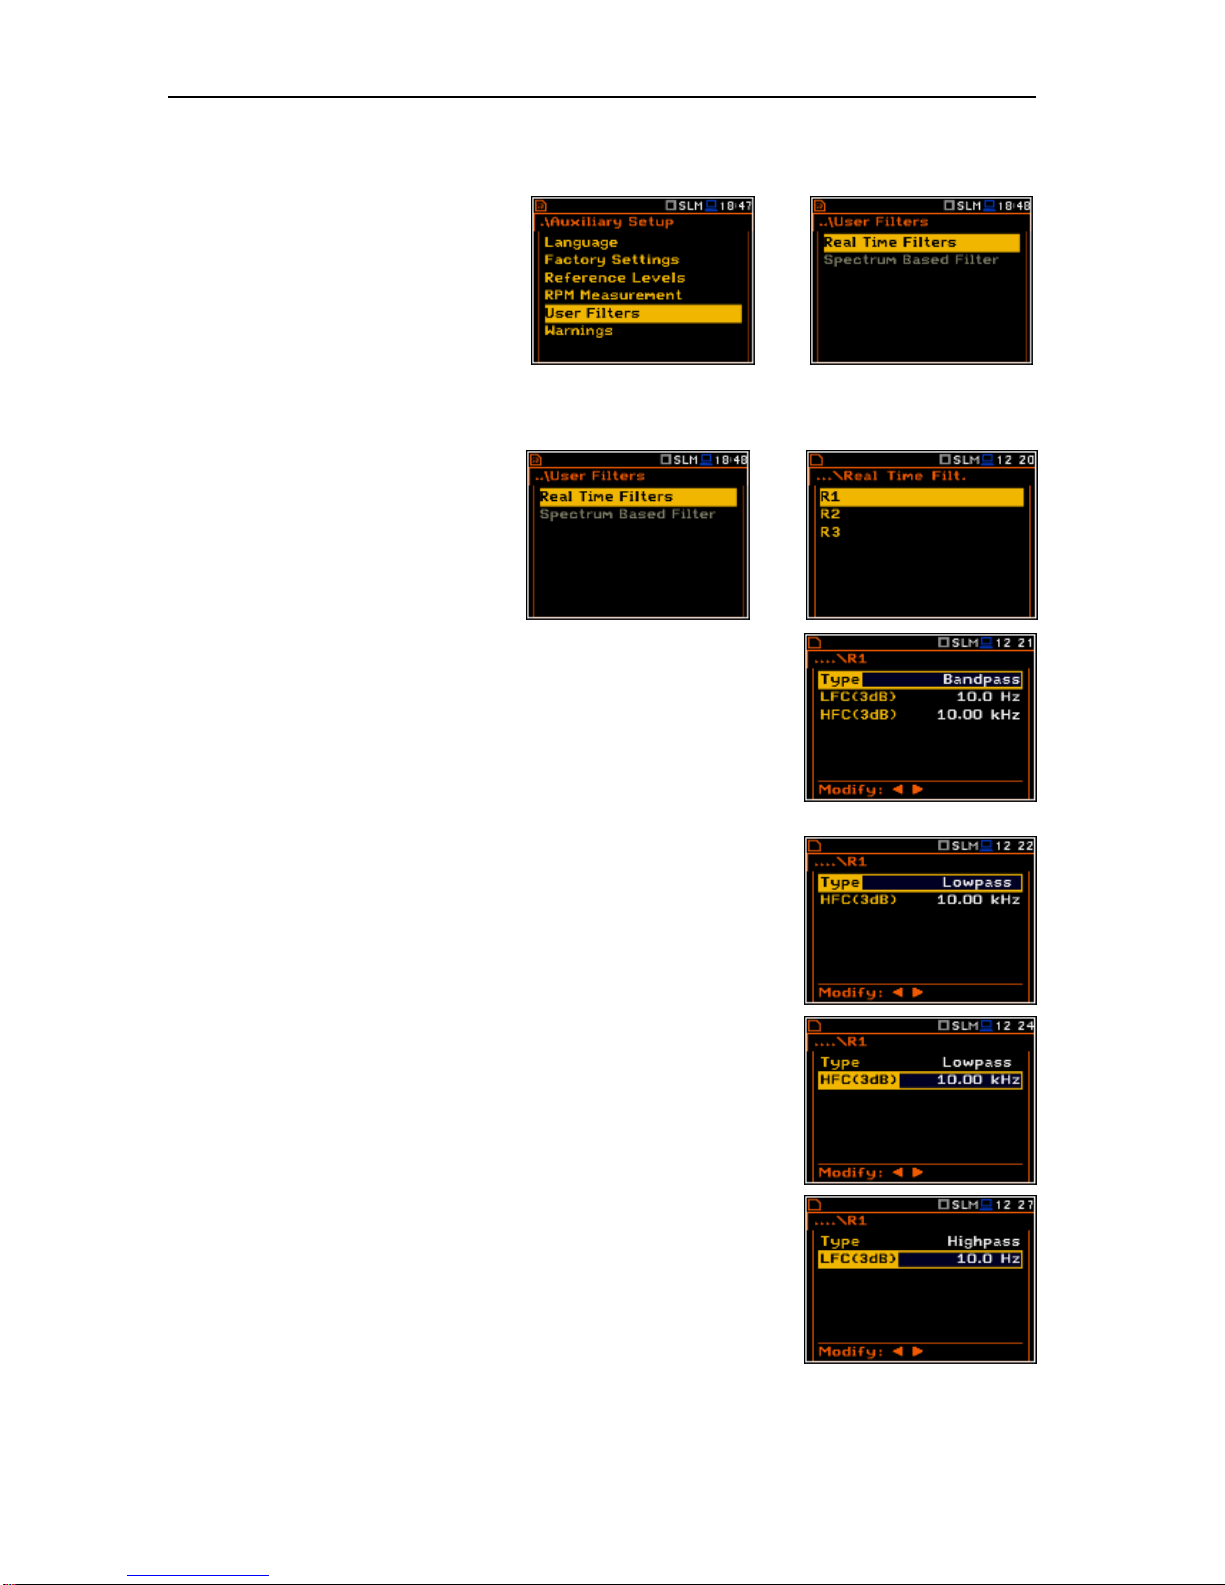
SVAN 979 USER'S MANUAL_______________________________________________ _82
9.5. Setting the coefficients of the user filters - User Filters
The User Filters position enables the
user to introduce the values of the
coefficients of the user defined filters.
<ENT>
9.5.1 Introduction the parameters of real time filters - Real Time Filters
The Real Time Filters sub-list enables
the user to introduce the values of the
correcting coefficients taken into account
in the real time measurements. The
Real Time Filters (sub-list) contains 3
positions: R1, R2, R3.
<ENT>
Selecting real time filter
The Rx (R1, R2, R3) window consists of three positions: Type, LFC(3dB),
HFC(3dB). In case of a band-pass filter the user has to determine two
frequencies: the LFC(3dB), which denotes the (Low Frequency Corner),
and the HFC(3dB), which denotes the (High Frequency Corner), of the Rx
filter. The amplitude of the input signal is attenuated by half at these
frequencies. The available values for LFC are from 10 Hz to 10.0 kHz, and
for HFC the available values are from 100 Hz to 10.00 kHz.
In the Type position three options are available: Highpass, Bandpass and
Lowpass. This parameter denotes the type of the digital filter, which has to
be implemented. All filters mentioned above, high-pass, band-pass and
low-pass, are the second order with the slope equal to 12 dB/octave.
In case of a low-pass filter the user has to determine the HFC(3dB)
parameter, which denotes the HFC (High Frequency Corner) of the Rx
filter. The amplitude of the input signal is attenuated by half at this
frequency. The available values are from 100 Hz to 10.0 kHz.
In case of a high-pass filter the user has to determine the LFC(3dB)
parameter, which denotes the LFC (Low Frequency Corner) of the Rx filter.
The amplitude of the input signal is attenuated by half at this frequency.
The available values of the LFC are from 10 Hz to 10.0 kHz.
Page 83
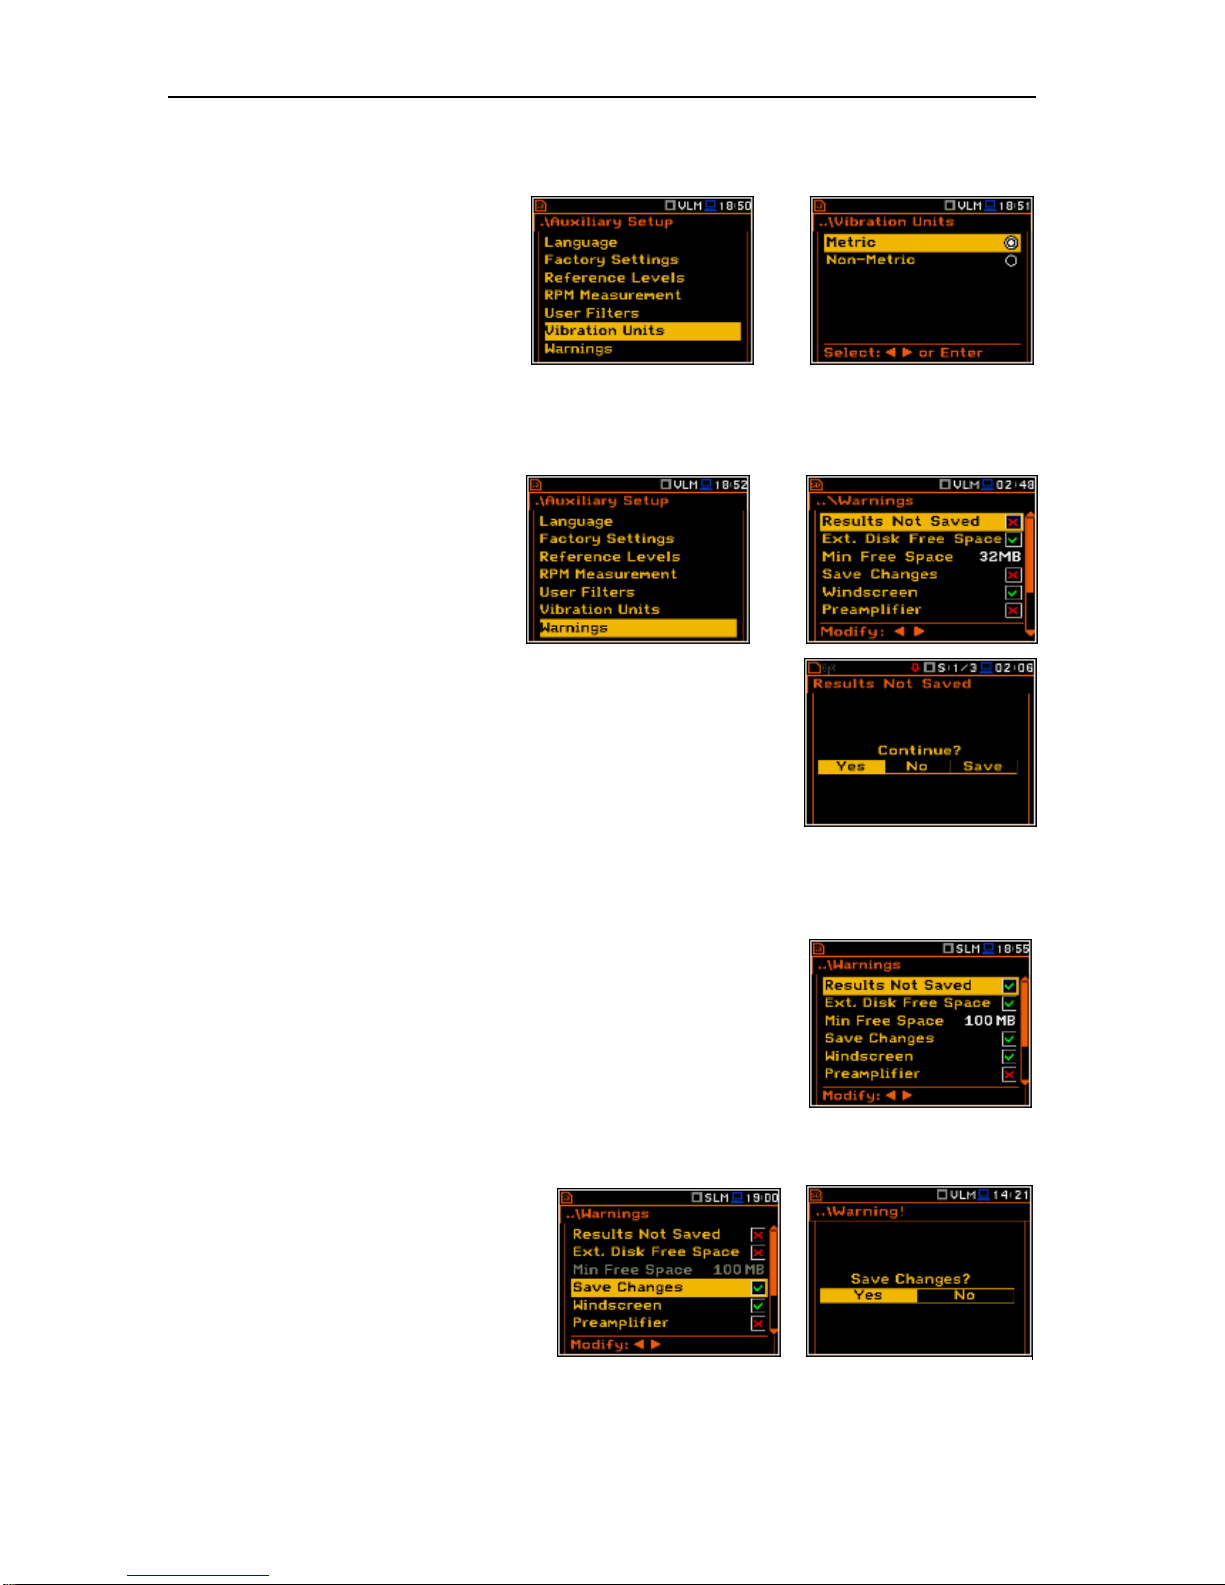
SVAN 979 USER'S MANUAL_______________________________________________ _83
9.6. Selection of the units for vibration measurements - Vibration Units
The Vibration Units position enables the
user to select the units for the Vibration
measurements (this position is available
only in the Vibration modes).
It is possible to select the Non-Metric
(e.g. g, ips, mil etc.) or Metric units (e.g.
m/s2, m/s, m etc.).
<ENT>
9.7. Warnings setup – Warnings
The Warnings sub-list enables the user
to select the messages, which may be
displayed during the normal operation of
the instrument.
<ENT>
Saving the measurement results in a file
When the Results Not Saved position is set to be active a special warning
can be displayed after pressing the <Start/Stop> push-button. It will
happen in a case when the result of the previous measurement was not
saved in the instrument.
The question Continue? appears with the warning message. There are
three options: Yes, No or Save. If Yes is chosen, the instrument returns to
the active mode of result presentation starting the new measurement
process. If No is chosen, the instrument returns to the active mode of
measurement result’s presentation without starting the new measurement
process. If Save option is chosen, then the measurement results are saved.
Checking free space on the external disk
The Ext. Disk free Space position switches on or off the checking of free
space on the external memory and generates the warning when the space
is lower than Min Free Space.
Minimum memory free space setting
In the line Min Free Space, the user can determine the amount of the
SD card or USB disk memory free space. The selected limit has to be
within the range [1 MB, 1024 MB]. If the available memory is not greater
than that limit, the warning will be displayed.
Confirmation of parameter changes
In the line Save changes the user can
switch on the option of confirmation of menu
parameter changes after exiting the screen
with the parameter list by means of the
<ESC> push-button.
=>
Page 84
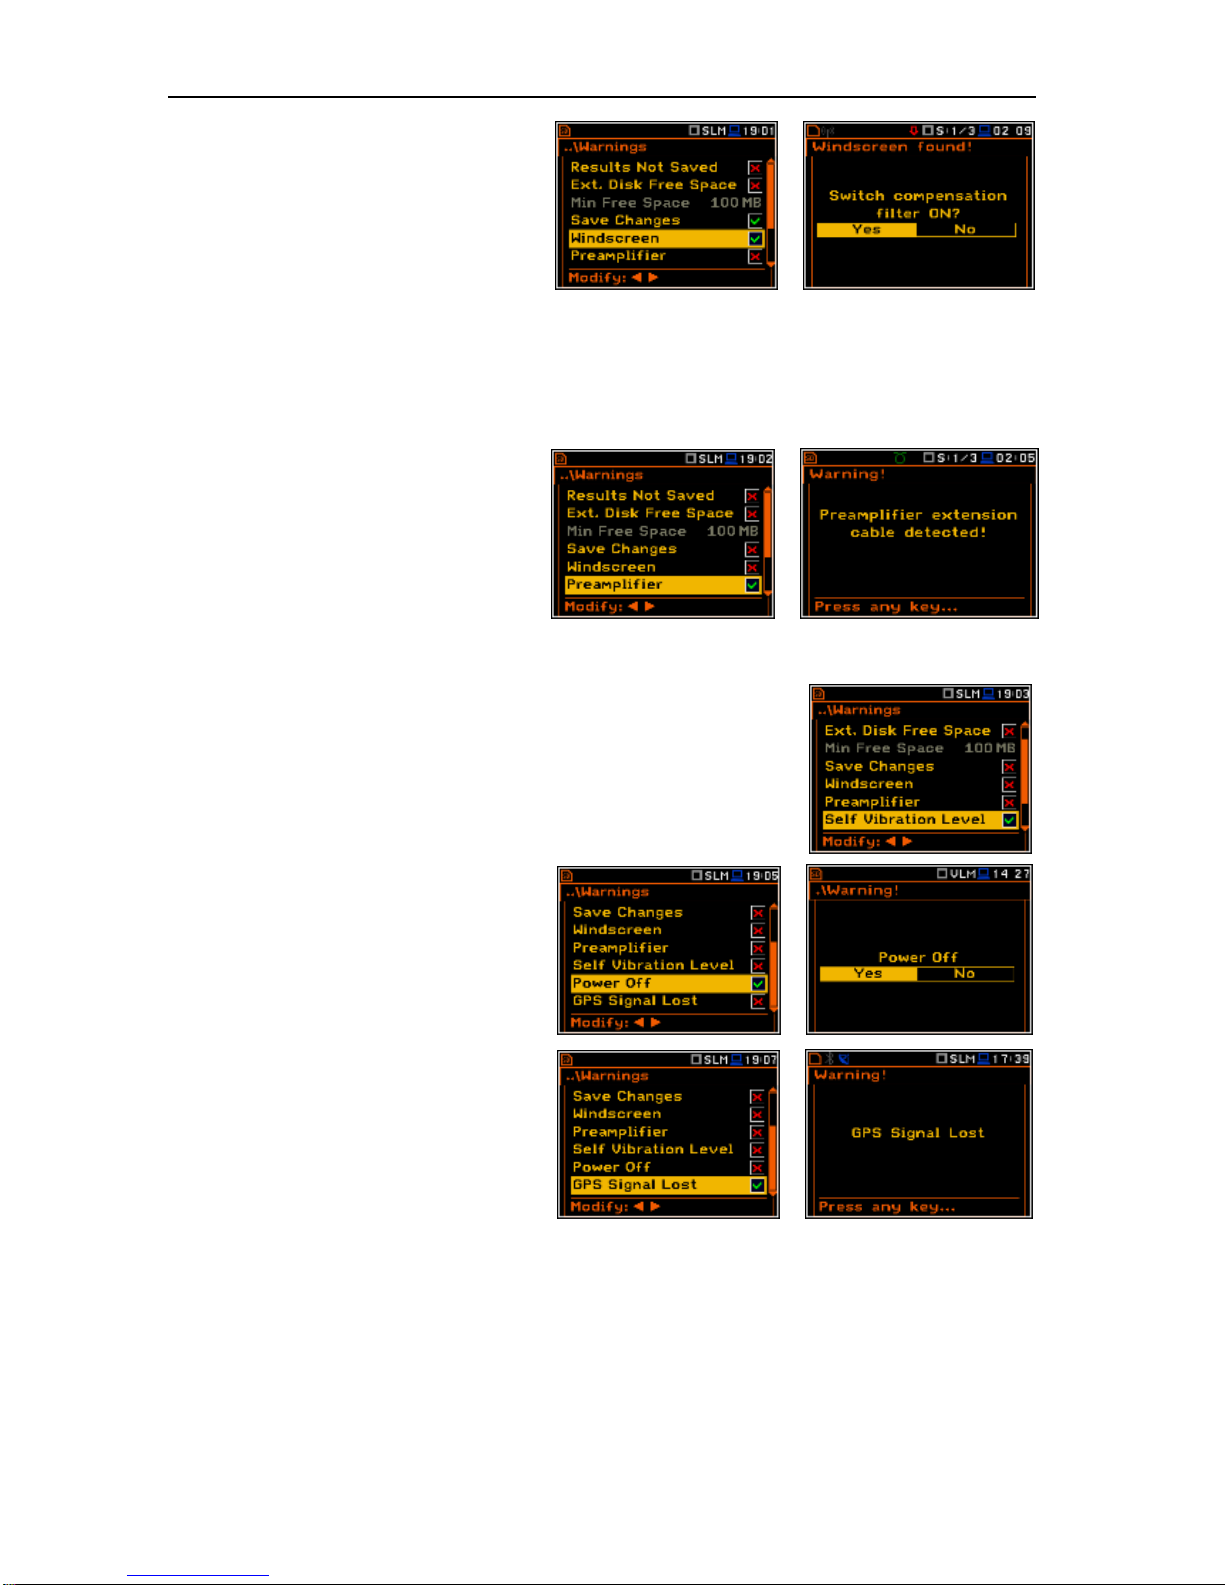
SVAN 979 USER'S MANUAL_______________________________________________ _84
Windscreen detection
If the Windscreen parameter is switched on
the instrument will ask to switch on or off the
compensation filter every time the
windscreen is removed or put on again. The
windscreen is detected automatically if the
Windscreen parameter is set on Auto (path:
<Menu> / Measurement / Compensation
Filter).
When Windscreen is switched on and the
instrument detects the windscreen the next
message appears. The user shall choose
Yes or No and press <Enter>.
=>
Preamplifier detection
If the Preamplifier parameter is switch on
then the instrument will show the message
in case the preamplifier is connected to the
instrument through the extension cable.
When Preamplifier is switched on and the
instrument detects the extension
preamplifier cable, then the message shown
here appears.
=>
Self-vibration warning
If the Self Vibration Level parameter is switched on then the instrument
will show the message in case self vibration level is high and can lead to
the loss of measurement accuracy.
Confirmation of the instrument switch off
If the Power Off parameter is switched on
then the instrument will show the message
in case the user is trying to switch the
instrument off.
=>
GPS signal lost warning
If the GPS Signal Lost parameter is
switched on then the instrument will show
the message in case the GPS signal was
lost.
=>
Page 85
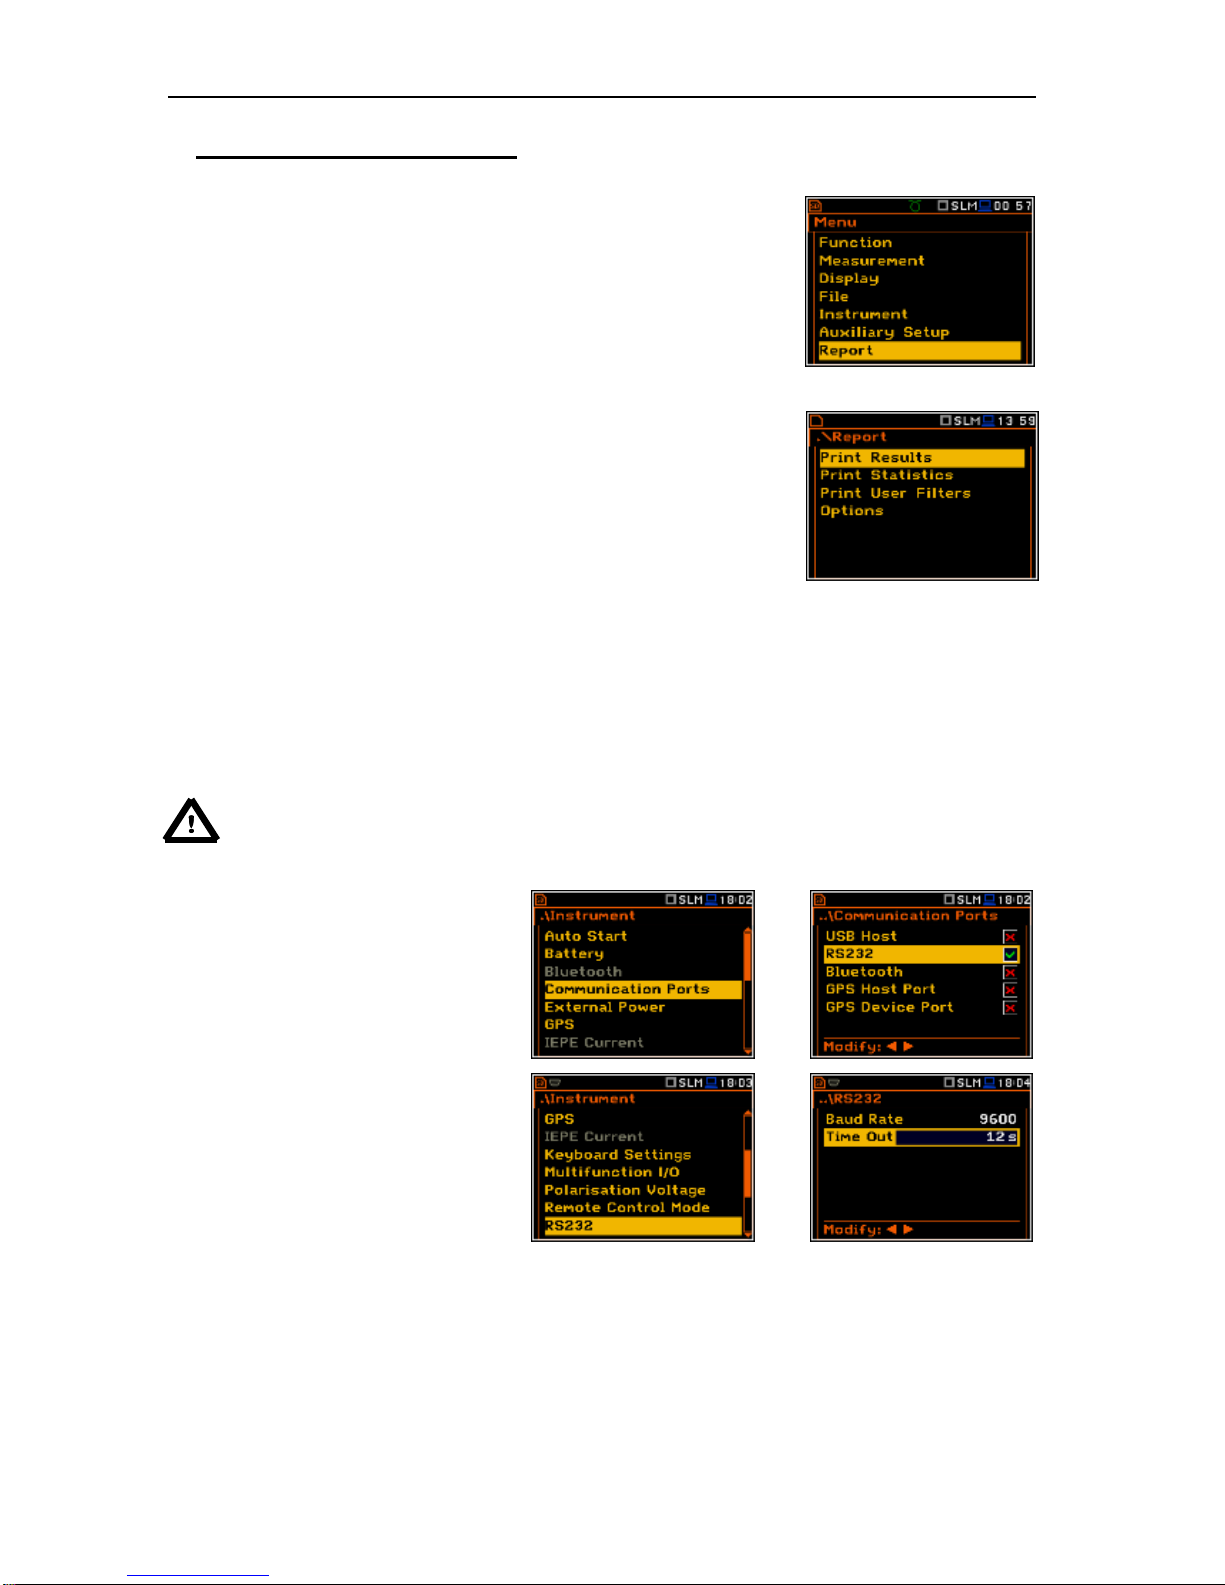
SVAN 979 USER'S MANUAL_______________________________________________ _85
10. REPORTS PRINTING – Report
The printed reports of the Sound or Vibration measurement results in the
predefined format can be obtained by means of the Report list. The Report
list contains the following elements:
Print Results enables the user to print out the measurement
results on the default printer or to send the
measurement results to a PC using SvanPC
software and USB interface;
Print Statistics enables the user to print out the statistics of the
measurement results; this position is not
available in the case of Vibration measurements;
Print User Filters enables the user to print out on a printer
connected directly to the instrument the values of
the user filters introduced in the instrument or to
send them to a PC using SvanPC software and
USB interface;
Options enables the user to determine the options of the
report.
<ENT>
In order to obtain the report the user has to connect the instrument to the printer’s RS 232 port using the
SV 55 RS 232 interface. This hardware interface is hidden in the Cannon type, 9-pin RS 232 plug-in. On the
other end of the SV 55 interface, which itself looks like a cable, there is the USB Host plug-in. This plug-in
should be placed in the USB Host socket of the instrument.
It is also possible to connect the instrument to the USB port of a PC using the proper cable. Measurement
results can be easy downloaded to any PC (using the SC 16 USB interface cable and SvanPC software) and
printed out on the printer attached to a PC.
Notice: The converter SV 55 serves as the RS 232 interface. The SV 55 connection to the
USB Host socket is detected and after successful detection the headphone icon is switched
on. The transmission with the use of SV 55 is possible only when the instrument is not
connected to a PC with the USB Device port.
The RS232 position is switched on by
default in the Communication Ports list
of the Instrument menu. Only with this
option the USB host controller is woken
up and the power consumption is at the
lowest level.
<ENT>
The user has to be sure that the RS232
port is activated (path: <Menu> /
Instrument / Communication Ports)
before starting printing reports.
Additionally, in the RS232 list (path:
<Menu> / Instrument / RS232) the user
has to select the proper speed of the
transmission (Baud Rate) and the
parameter called Time Out.
<ENT>
Page 86
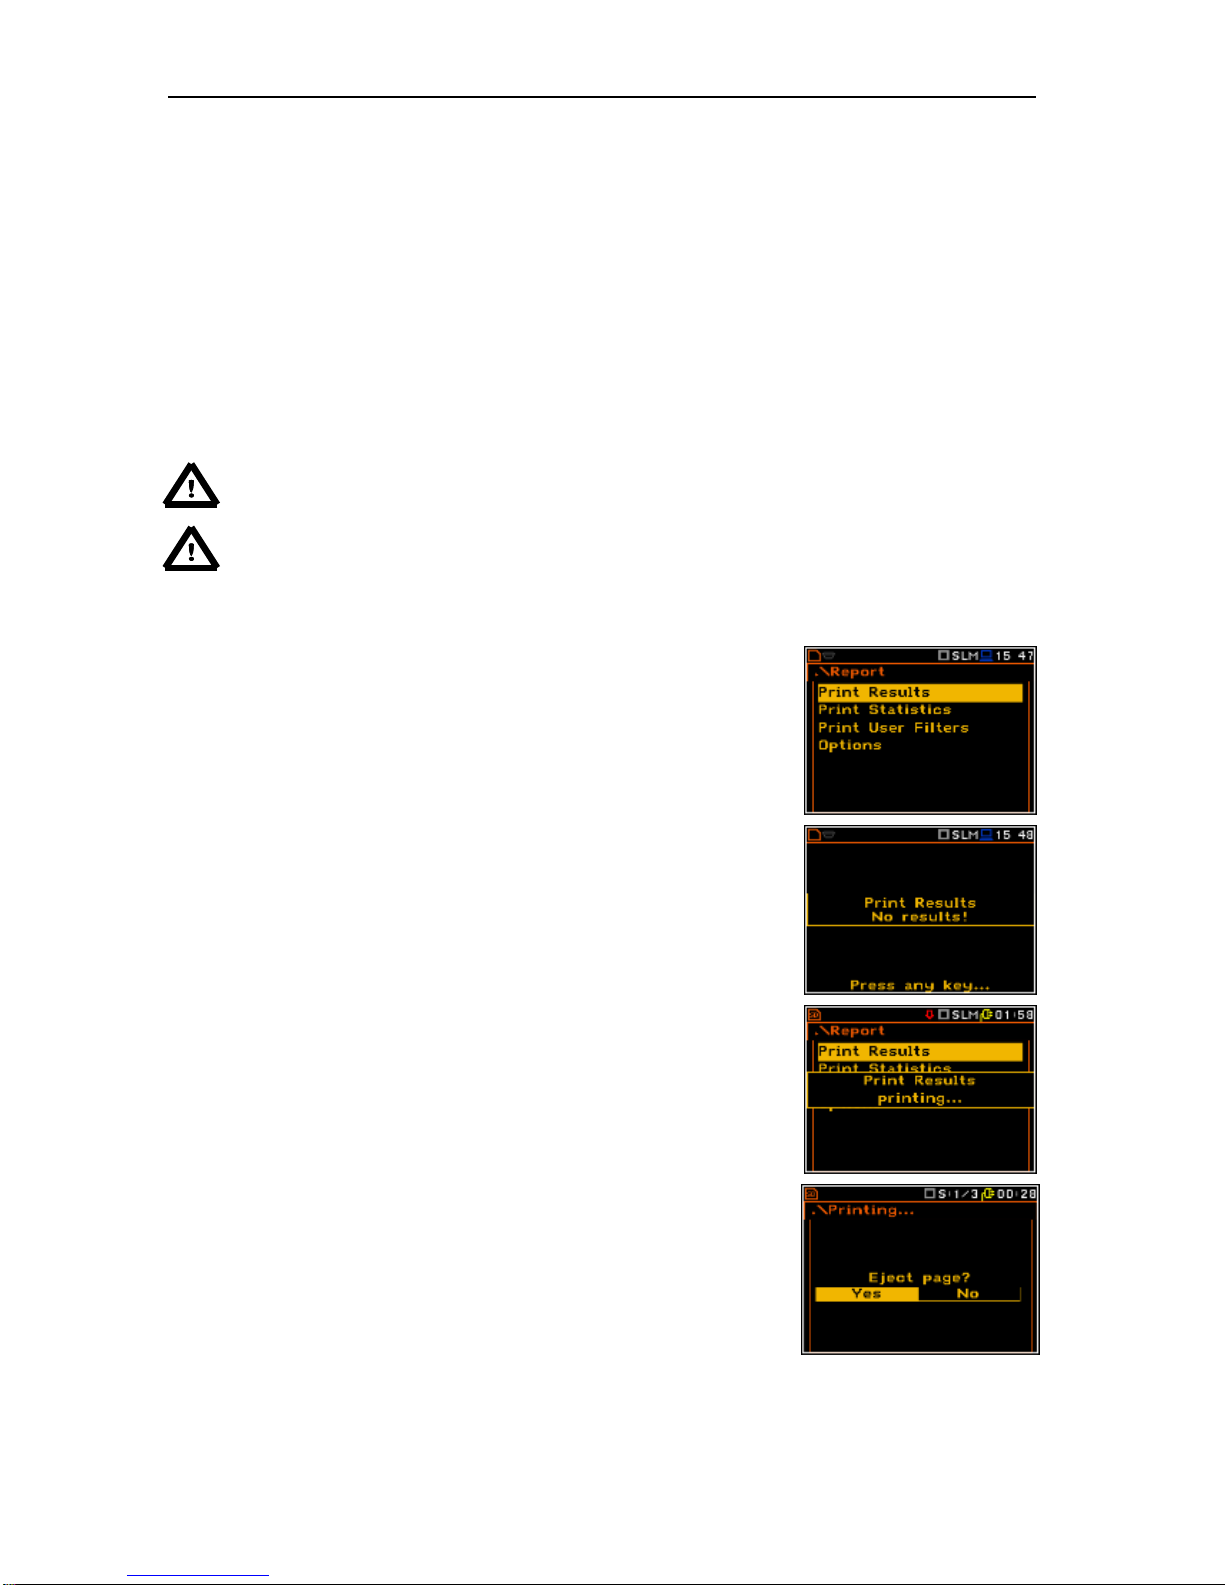
SVAN 979 USER'S MANUAL_______________________________________________ _86
The RS 232 interface transmission (Baud Rate) speed can be selected from the following available values:
1200 (bits / second), 2400 (bits / s), 4800 (bits / s), 9600 (bits / s), 19200 (bits / s), 38000 (bits / s),
57600 (bits / s) or 115200 (bits / s).
The transmission speed should correspond to the same one selected in a printer. The other RS 232
transmission parameters are fixed to 8 bits for data, No parity & 1 Stop bit. The default value
of the Time Out parameter is equal to one but it can be too short period for the printers, which are not fast
enough. In such cases this parameter may have to be increased.
The description of the SV 55 pin-outs is given in App. C. Printers with the different connections on the RS 232
socket require the special, individual RS 232 – RS 232 cable that should fulfil the suitable wiring crossover
connections.
Printers, in which only the Centronics interface is available instead of the RS 232, can be connected to the
instrument by means of the SV 52 RS 232 – Centronics interface.
Printers, which have only a USB interface, are currently not driven by the instrument.
Notice: Switch the power off before connecting the instrument to any external device (e.g. a
printer or a Personal Computer).
Notice: All reports are printed in the character format using the ASCII set on either A4 or A5
size paper.
10.1. Printing the measurement results - Print Results
The Print Results position enables the user to print the report on the
attached printer or to send out the report to a PC using the SvanPC software
and the USB interface.
After pressing the <Enter> push-button the instrument checks its current
state. If the measurements are running, printing is not possible and the
appropriate message is displayed. If no results were recorded the next
message is displayed.
If a measurement has been already performed and results are available,
the presented message is displayed.
The data are transferred from the instrument to the attached printer, while
the message is displayed. The instrument returns to the Report list after
transferring all data.
The following confirmation question is displayed after the printing, if the
Prompt parameter was selected in the Eject Page position (path: <Menu>
/ Report / Options). The user has to answer in this case if the paper in the
printer has to be ejected to the new page.
Page 87
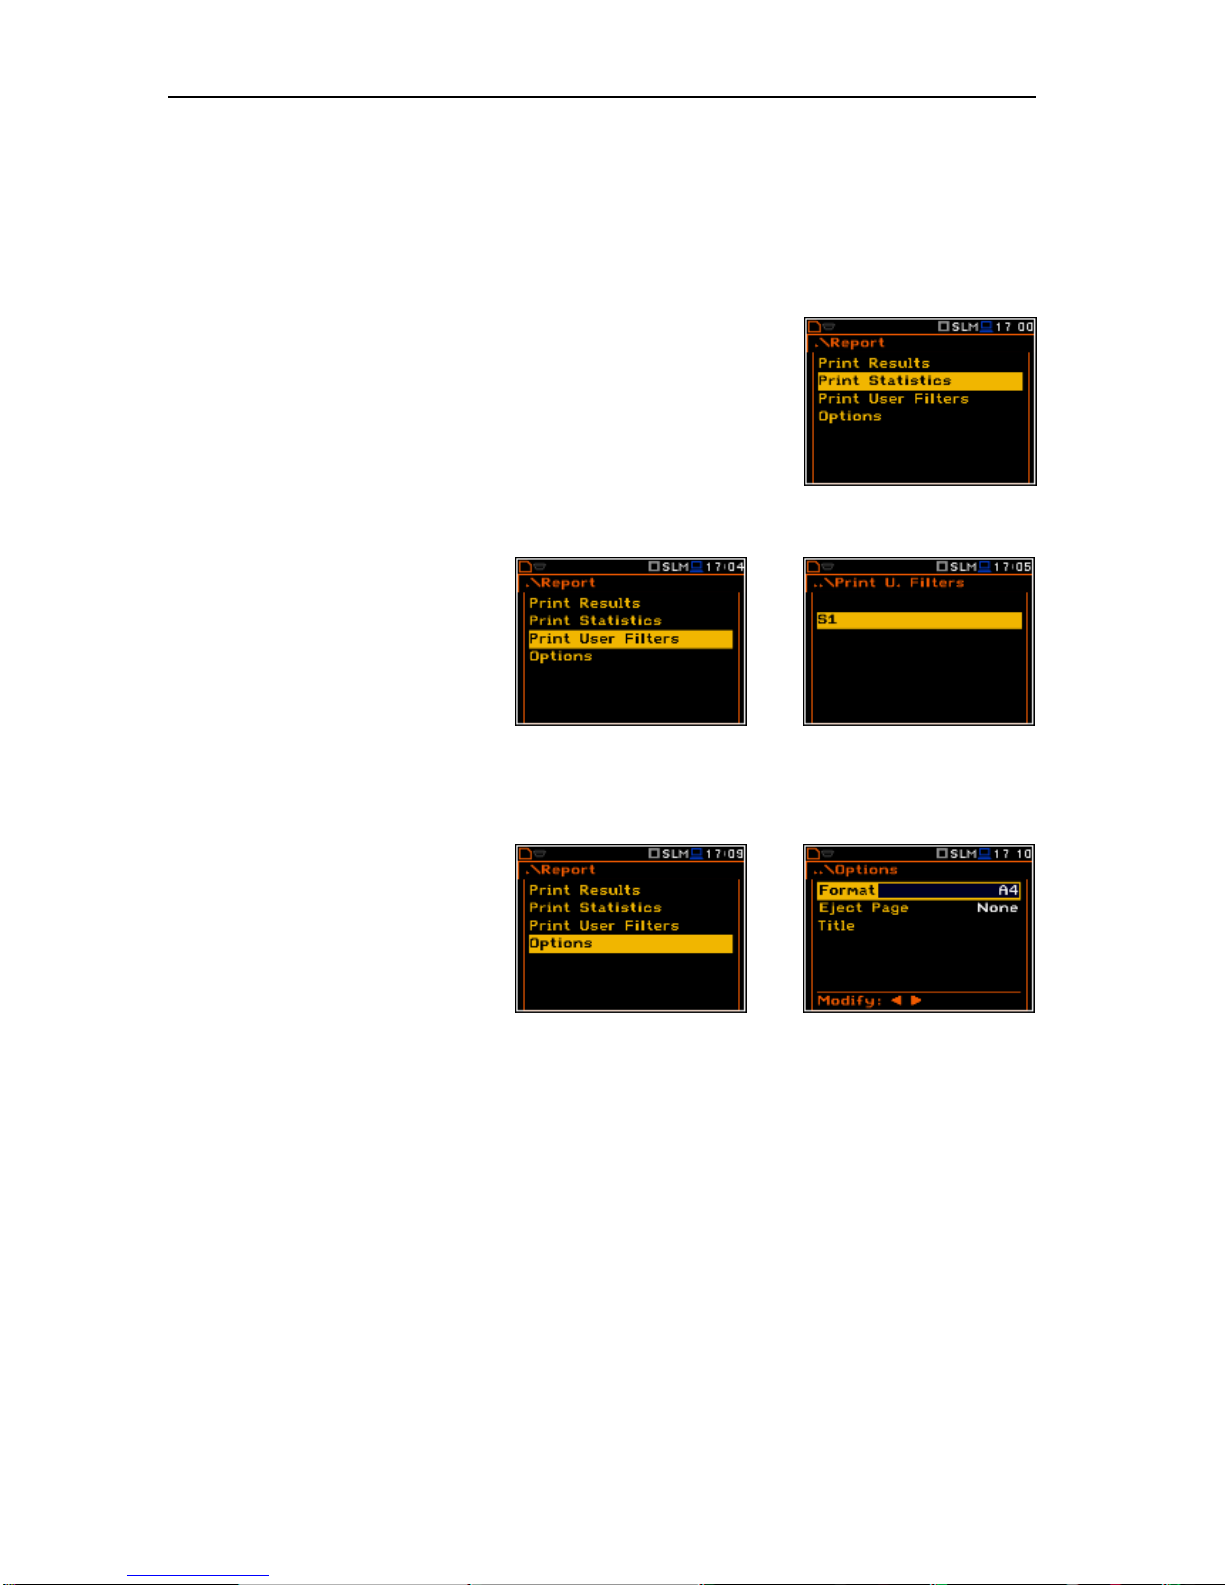
SVAN 979 USER'S MANUAL_______________________________________________ _87
The similar message is displayed after sending out the statistics of the results and user filters to the printer
(Print Statistics and Print User Filters).
The message about the time limit is displayed if the printer (or a PC) is not connected or there is any other
reason that it does not receive the data. The instrument waits for the reaction of the user (any push-button
should be pressed except <Shift> and <Alt>) and after pressing a push-button it returns to the Report list.
10.2. Printing the statistics of sound measurement results - Print Statistics
The Print Statistics position enables the user to print the results of the
statistics analysis on the attached printer. This position is not accessible for
the Vibration measurements.
10.3. Printing the coefficients of the user filters - Print User Filters
The Print User Filters position enables
the user to print out the values of the
user filters introduced in the instrument:
S1, S2, S3.
The contents of the selected file is sent
out to the attached printer (or to a PC)
after pressing the <ENTER> pushbutton. The following message is
displayed during the printing:
<ENT>
10.4. Selection the printing options – Options
The Options list enables the user to
select the format of the listing (Format),
the way the paper is ejected in the
printer (Eject Page) and to edit the title
of the report (Title).
<ENT>
Page 88

SVAN 979 USER'S MANUAL_______________________________________________ _88
Selection of the format of the print out
The Format position enables the user to select the format of the listing (A4 and A5 options are available).
Controlling the paper ejection after print out
The Eject Page position enables the user to control the ejection of the paper after the listing is done. The
following options are available: Prompt (the instrument asks whether to eject the page after printing report,
statistics or catalogue), Auto (after printing, the paper is ejected automatically) and None (the paper is not
ejected after printing). In particular, it is possible to have one result after another using the None or Prompt
options.
The request is displayed after printing the measurement results, statistics or filters (Print Results,
Print Statistics, Print User Filters) if the Prompt parameter was selected in the Eject Page position. The
user has to answer in this case if the paper in the printer has to be ejected to the new page. After pressing
<ENTER> the instrument returns to the Report list.
The message about the time limit is displayed if the printer is not connected or there is any other reason that
it does not eject a paper. The instrument waits for the reaction of the user (any push-button should be pressed
except <Shift>) and after pressing a push-button it returns to the Report list.
Editing the user text
The Title position enables the user to edit the text added to the file and to the report to be printed. The text
editing is performed in the special window which is opened by pressing the <>, <> push-buttons.
Page 89
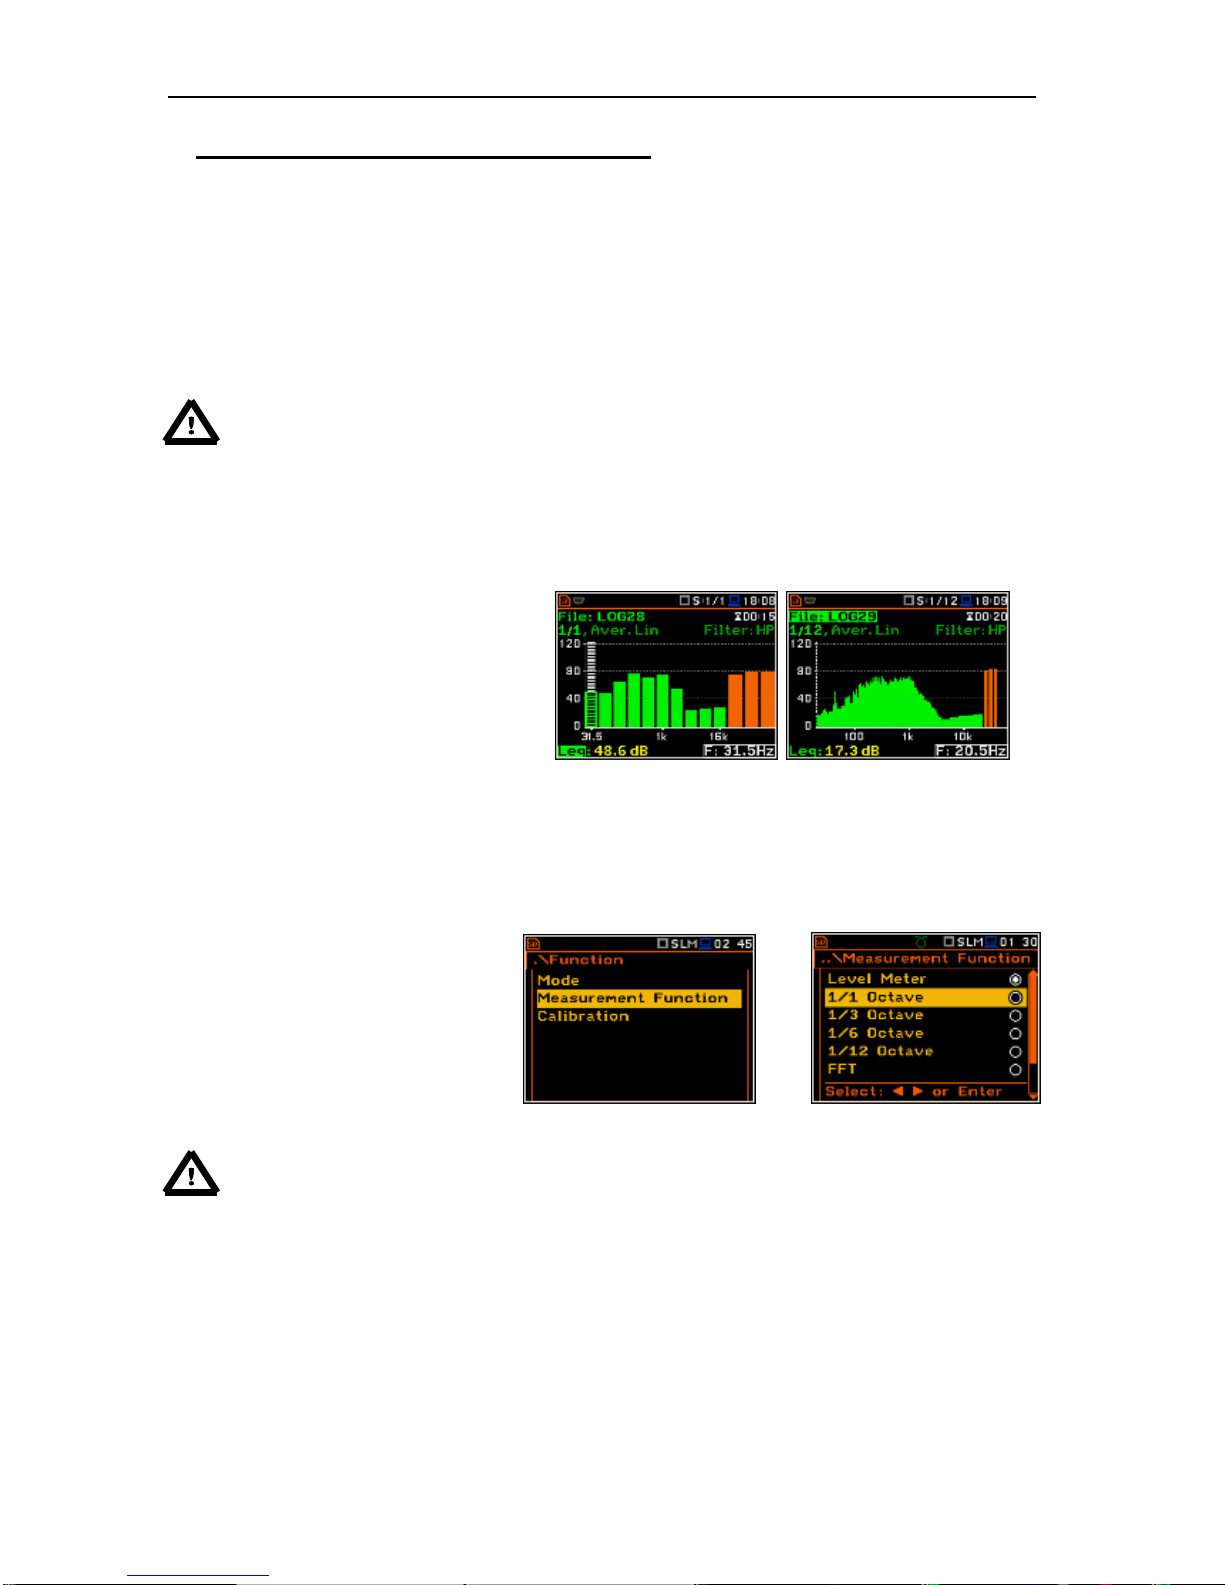
SVAN 979 USER'S MANUAL_______________________________________________ _89
11. 1/1, 1/3, 1/6 AND 1/12 OCTAVE ANALYSER
The instrument operates as a real time 1/1 Octave - 1/12 Octave analyser (RTA) in a very similar way to
the Level Meter mode and, in addition, 1/1 Octave - 1/12 Octave analysis is performed in parallel with the
SLM or VLM operations. All 1/1-octave, 1/3-octave, 1/6-jctave and 1/12-octave digital pass-band filters are
working in real-time with the weighting filters (HP, Z, A, B or C - in the case of sound analysis: HP - in the
case of vibration analysis) selected in the Spectrum (path: Menu / Measurement / Spectrum / Filter) and the
linear RMS (Leq) detector. This enables the user to pre-weight a spectrum with one of the selected
broadband frequency curves if required for a particular application such as the provision of hearing protectors
in the control of high workplace noise levels.
Notice: The TOTAL RMS results are measured with the weighting filters (A, C, Z or S1, S2,
S3 - in case of sound measurements; HP, HP3 and HP10 or S1, S2, S3 – in case of vibration
measurements) without taking into account the settings of the level meters for profiles. The
spectra are always linearly averaged. Thus, the Total values from 1/1 Octave - 1/12 Octave
analysis can be different from those obtained for the profiles (if the RMS Integration was set
as Exp).
The SVAN 979 instrument operates in two ranges, called Low and High, which can be selected in the Range
window (path: <Menu> / Measurement / Range).
The results of 1/1 Octave - 1/12 Octave
analysis (spectra) can be examined by
the user on a display in the Spectrum
presentation mode. The availability of this
mode can be switched on or off by the
user (path: <Menu> / Display /
Display Modes).
1/1 Octave - 1/12 Octave spectra for all centre frequencies of pass-band filters together with the Total
overall values measured with preselected frequency weighting filters are presented in the Spectrum mode
if selected in the spectrum display menu. The read-out of the value of interest in the spectrum can be done
using a vertical cursor on the screen using the <> or <> push-buttons.
11.1. Selection of 1/1 Octave - 1/12 Octave analysis mode
In order to select the 1/1 Octave 1/12 Octave analysis mode the user has
to enter the Function list by pressing the
<Menu> push-button, then select the
Function text and press <ENTER>.
Then, the user has to open the
Measurement Function window,
highlight the required analysis bandwidth
and press <ENTER>.
<ENT>
Notice: It is not possible to change the current function during live measurements.
In this case the instrument displays for about 2 seconds the text: “Measurement in Progress”.
In order to change the current measurement function the instrument must be stopped!
11.2. Selecting the parameters of 1/1 Octave - 1/12 Octave analysis
The execution of 1/1 Octave - 1/12 Octave analysis depends on a certain number of parameters, which can
be set in the different windows of the Measurement list. Namely, the user can set there the Range of the
measurements (path: <Menu> / Measurement / Range) and Filter (path: <Menu> / Measurement /
Spectrum). Additionally, the user can set or be informed about the Band of the analysis (path: <Menu> /
Measurement / Spectrum / Band) and switch on or off the recording of the spectra in the logger file (path:
<Menu> / Measurement / Logging / Logger Results).
Page 90
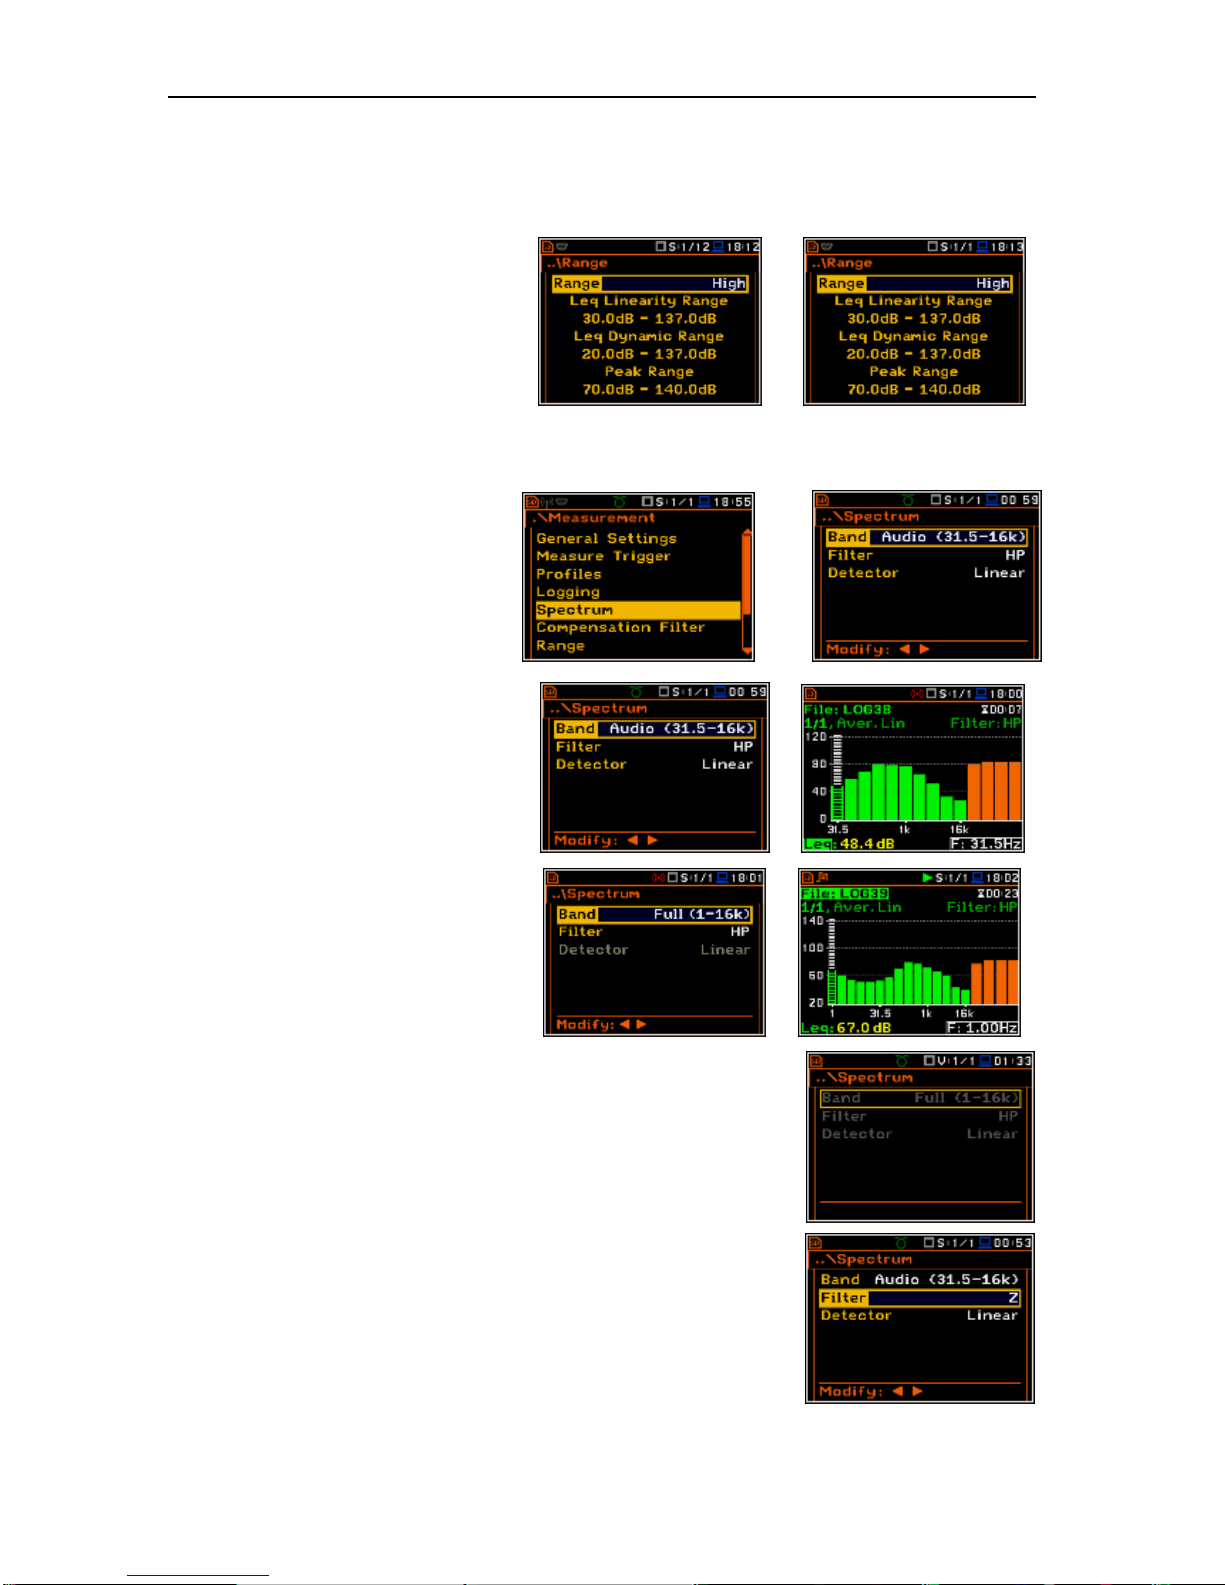
SVAN 979 USER'S MANUAL_______________________________________________ _90
The output of the selected 1/1 Octave - 1/12 Octave filter can be also used as the triggering signal in the
Logger Trigger window (path: <Menu> / Measurement / Logging / Logger Trigger).
11.3. Measurement range selection - Range
In the 1/1 Octave - 1/12 Octave analyser
the user can select the input ranges
specified in Appendix C, named as Low
and High. The selection of the input
range is possible after entering the
Range window of the Measurement list.
<>
11.4. Pre-weighting filter and frequency band selection - Spectrum
In the 1/1 Octave - 1/12 Octave modes a
context element (Spectrum) appears on
the Measurement list (path: <Menu> /
Measurement / Spectrum). In the
Spectrum window the user may select
the pre-weighting broadband frequency
filter and the band in the case of sound
measurements.
<ENT>
Selection the band
The Band position enables the user to
select the applied band of 1/1 Octave 1/12 Octave analysis. Available values of
the bands of the analysis are as follows:
- Sound 1/1 Octave analysis: Audio
(31.5-16k) and Full (1-16k);
- Sound 1/3 Octave analysis: Audio
(20-20k) and Full (0.8-20k);
- Sound 1/6 Octave analysis: Audio
(20-21.4k) and Full (0.73-21.4k);
- Sound 1/12 Octave analysis: Audio
(20.3-22k) and Full (0.71-22k);
=>
=>
- Vibration 1/1 Octave analysis: Full (1-16k);
- Vibration 1/3 Octave analysis: Full (0.8-20k);
- Vibration 1/6 Octave analysis: Full (0.73-21.4k);
- Vibration 1/12 Octave analysis: Full (0.71-22k).
Weighting filter selection
The Filter parameter influences the calculations of the 1/1 Octave -
1/12 Octave analysis. The frequency characteristics of those filters are
given in Appendix D.
The following pre-weighting filters are available in the case of the
1/1 Octave - 1/12 Octave analysis in sound modes:
• A type 1 according to the IEC 651 and IEC 61672-1 standards,
• C type 1 according to the IEC 651 and IEC 61672-1 standards,
Page 91
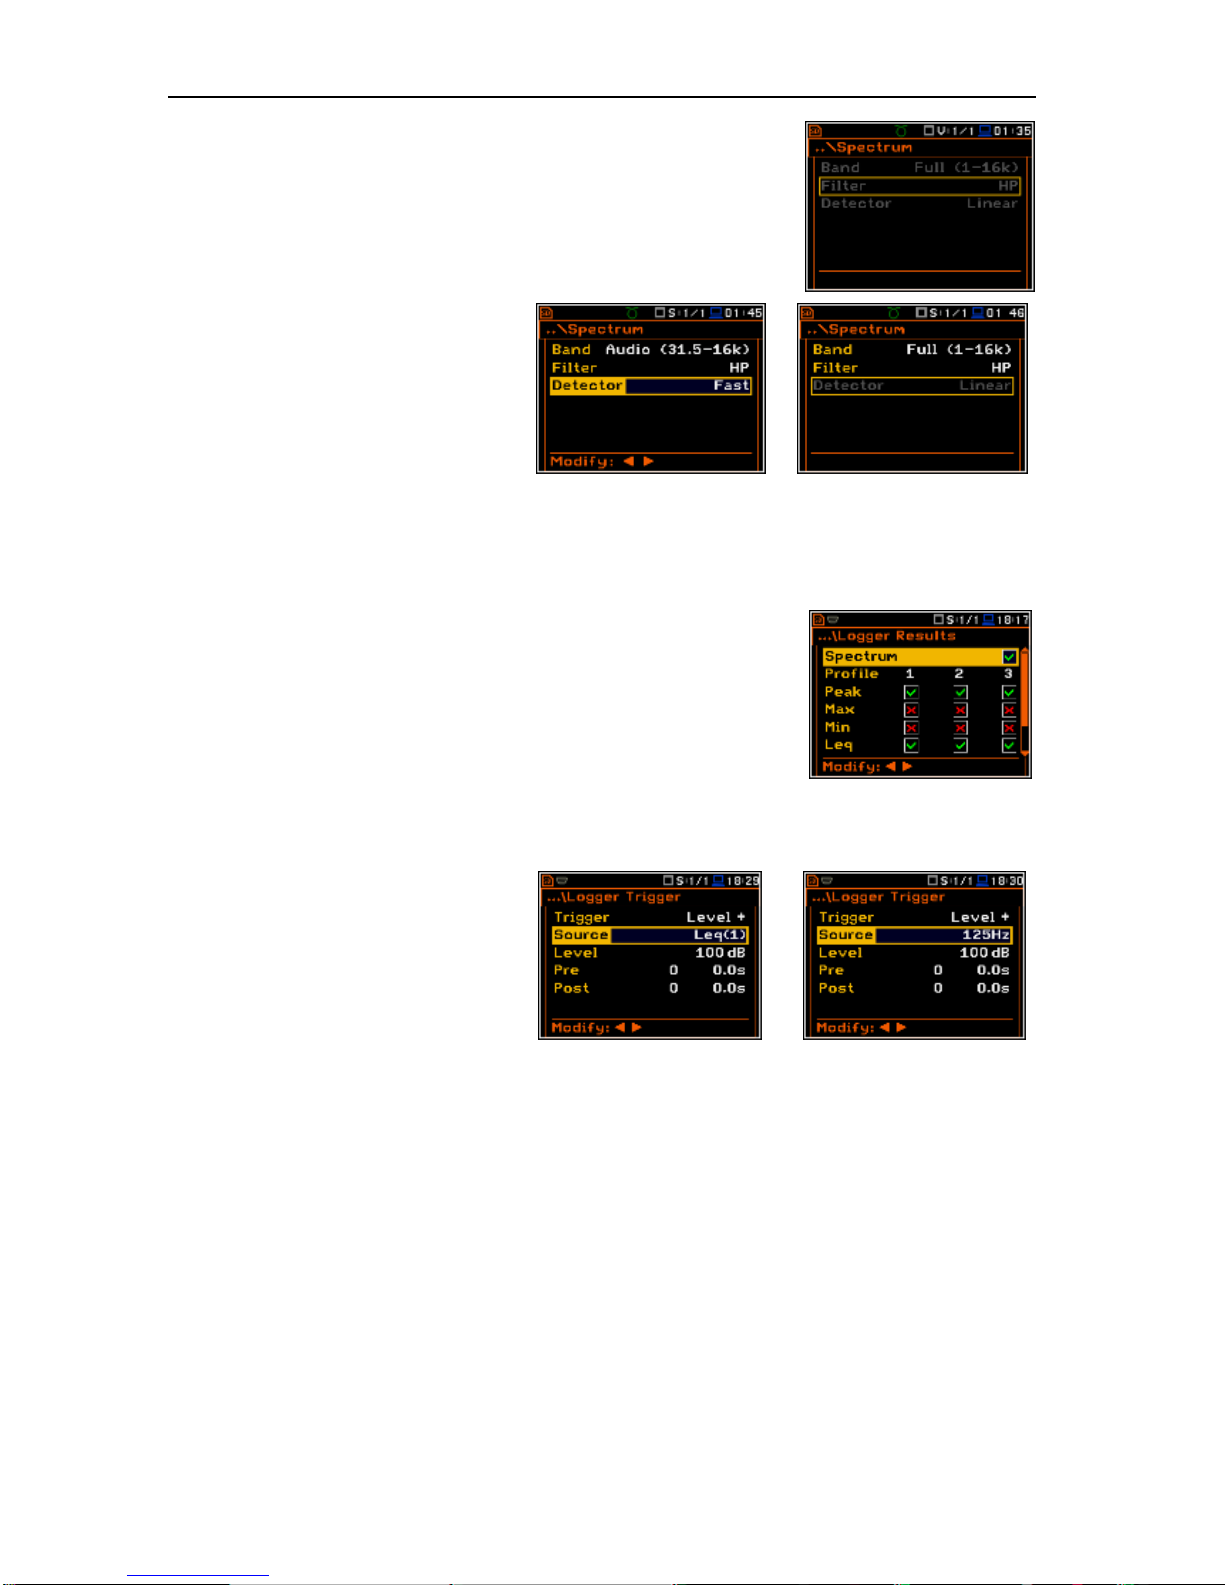
SVAN 979 USER'S MANUAL_______________________________________________ _91
• B type 1 according to the IEC 651 standard,
• Z type 1 according to the IEC 61672-1 standard
• HP type 1 according to the IEC 61672-1 standard (vibration only).
Only one HP pre-weighting filter is available in the 1/1 Octave 1/12 Octave analysis of vibration.
The characteristics of the filters are given in Appendix D.
Selection of the detector
The Detector position enables the user to
select the detector for the 1/1 Octave 1/12 Octave analysis. In case of Sound
measurements it is possible to select for
the Audio Band three types of detector:
Linear, Fast and Slow. For the Full Band
(and for all Vibration measurements) only
one Linear detector is available.
11.5. Saving of 1/1 Octave - 1/12 Octave analysis results - Logger Results
The RMS results from 1/1 Octave - 1/12 Octave analysis can be saved in
the logger’s file. The spectrum saving in the logger file is defined by
activation / deactivation the Spectrum position by means of the <>, <>
push-buttons.
11.6. Selecting the result for triggerring recording of 1/x Octave - Logger Trigger
In the Level Meter mode only the Leq
result for Sound and RMS for Vibration
measurements from the first profile
(Leq(1)/RMS(1)) is used for triggering the
measurement results recording for the
logger of the instrument. The Source
position in the Logger Trigger window is
not accessible in that mode. However, in
1/1 Octave - 1/12 Octave analysis it is
possible to access the above mentioned
position and to make a selection of a
specific filter band for triggering
purposes.
<>
For example, the results coming from the output of the 1/1 Octave filters (125 Hz, 250 Hz, 500 Hz,
1.00 kHz, 2.00 kHz, 4.00 kHz, 8.00 kHz and 16.0 kHz), are available as well as the Leq or RMS result
from the first profile.
11.7. Display options in 1/1 Octave - 1/12 Octave analysis mode
The Display list is used for setting the various parameters, which are mainly dedicated for the control of the
display. The following windows contain the elements that influence the presentation of the results of
1/1 Octave - 1/12 Octave analysis:
Page 92
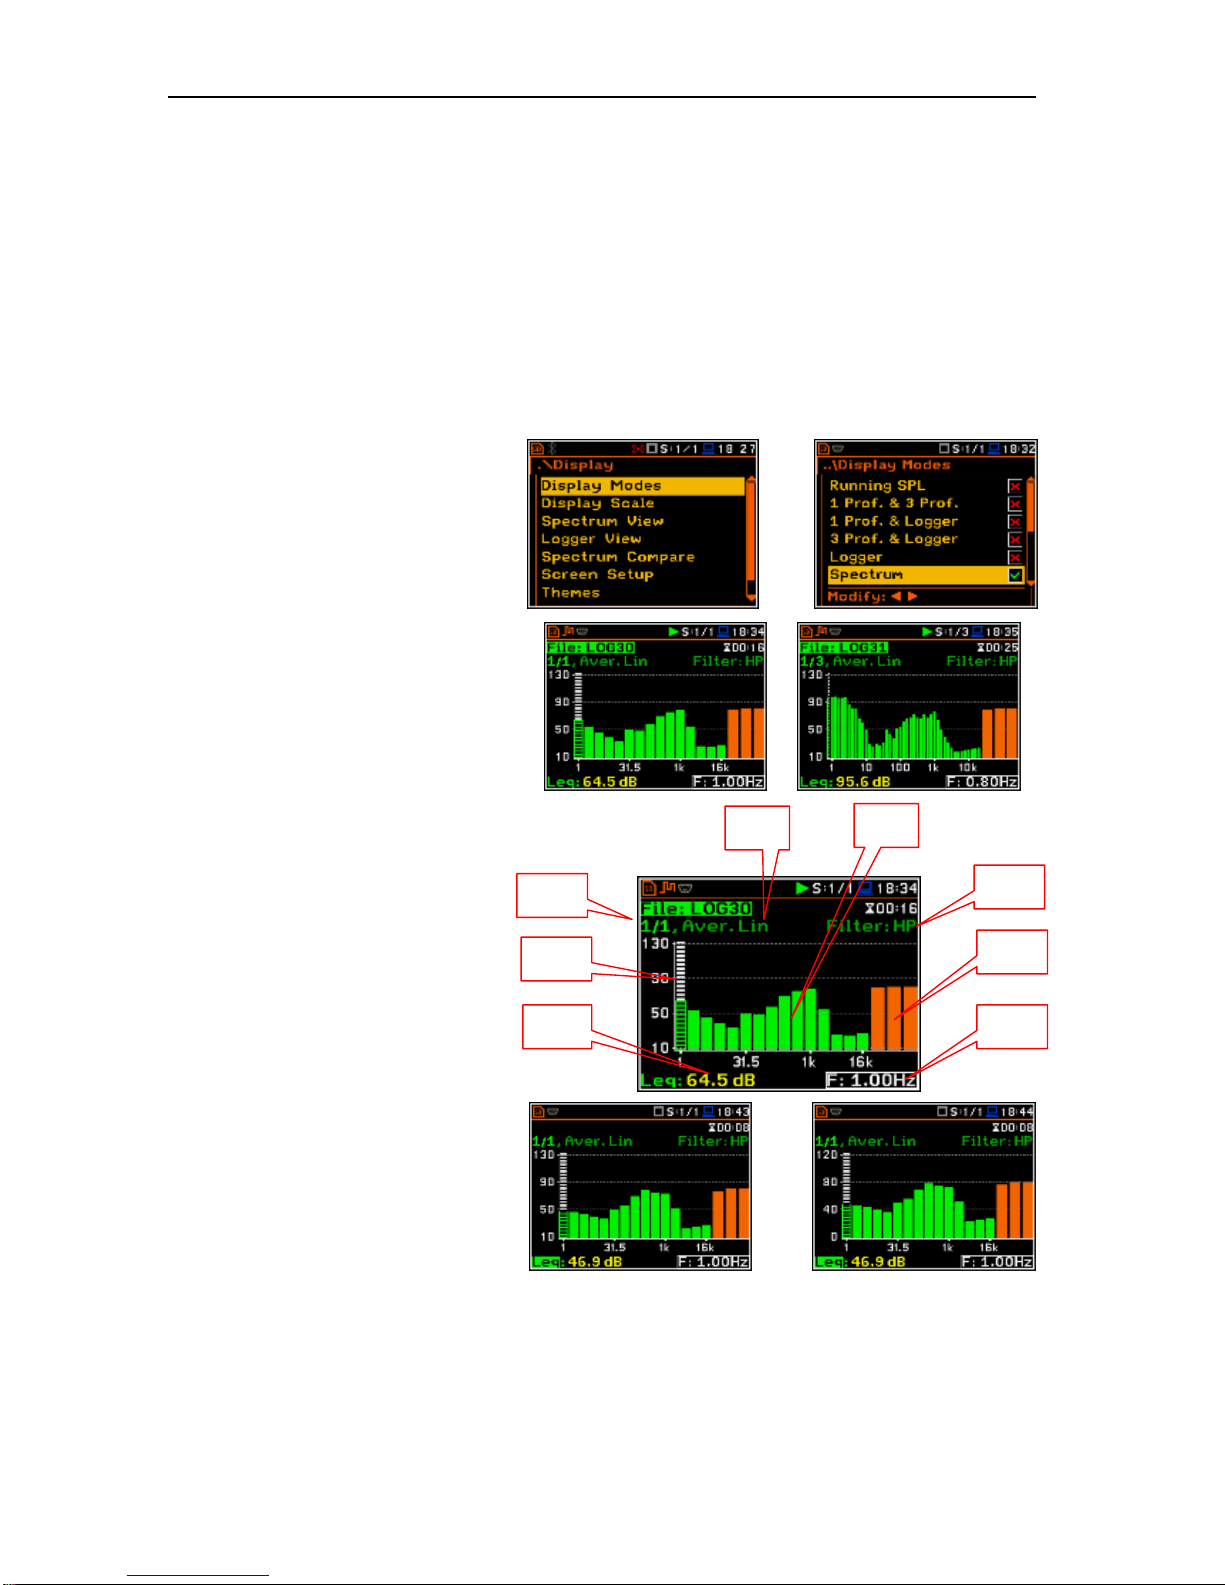
SVAN 979 USER'S MANUAL_______________________________________________ _92
Display Modes enables the user to select the mode of the presentation of the 1/1 Octave -
1/12 Octave spectra;
Display Scale enables the user to change the scale of the vertical and horizontal axis of the spectra
presentation and switch on or off the grid and autoscale;
Spectrum View enables the user to choose the type of the spectrum to be presented and to activate
the Max and Min spectrum;
Spectrum Type enables the user to change the spectrum type presented on the display: Acceleration,
Velocity and Displacement;
Logger View enables the user to select and present the spectra results stored in the logger files;
Spectrum Compare enables the user to compare the currently measured spectrum with the reference one.
11.8. Presentation of 1/1 Octave - 1/12 Octave analysis results
The Spectrum and Spectrum Table
positions of the Display Modes list are
accessible only for instruments fitted with
the 1/1 Octave - 1/12 Octave functions.
<ENT>
When the Spectrum mode is switched on
the measurement screen in the
Spectrum visualisation mode is shown
here for octave and third octave bands in
the sound mode.
Field description of the Spectrum view
1. Type of spectrum
2. Cursor position
3. Value for the cursor position
4. Averaging used
5. Spectrum plot
6. Frequency pre-weighting filter used
7. Total values
8. Central frequency for the cursor
position
The user may shift the Y-axis during the
spectrum presentation after pressing the
<Shift> and <> (or the <Shift> and
<>) push-buttons.
<Sh/>
2
3
7
8
1
6
4
5
Page 93
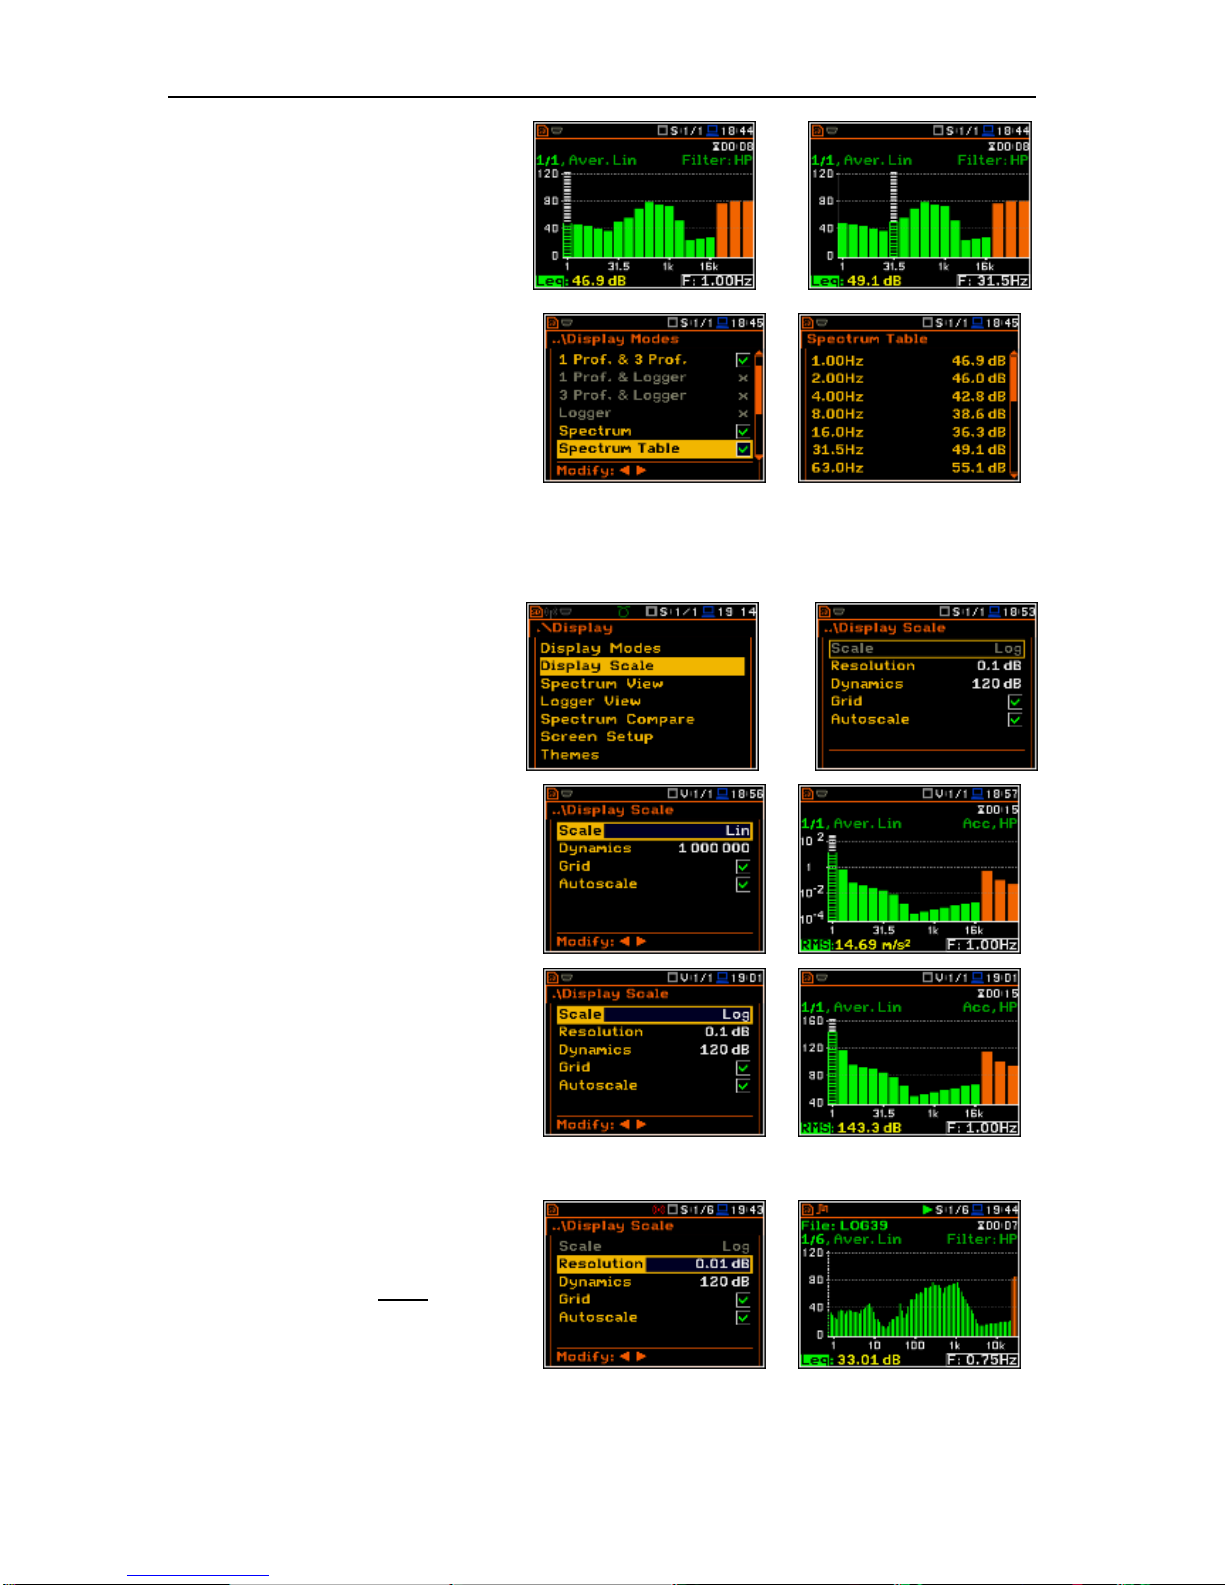
SVAN 979 USER'S MANUAL_______________________________________________ _93
The user may change the cursor position
by means of the <>, <> pushbuttons. The frequency and appropriate
value are presented in the line below the
plot. The user can change quickly to the
first or last spectrum line by
simultaneously pressing the <> or <>
buttons with <Shift>.
<> ..
Spectrum table view
The Spectrum Table position is
accessible with the 1/1 Octave -
1/12 Octave function (path: <Menu> /
Function / Measurement Function) and
switches on the table presentation of the
spectra.
=>
11.9. Setting the scale of spectrum presentation - Scale
The Display Scale sub-list enables the
user to change the scale in the available
modes of graphical presentation of the
measurement results and to switch the
grid on or off.
<ENT>
Setting the scale of the measurement
results presentation
The Scale position is accessible only in
case of Vibration measurement modes.
Two options are available: Lin (linear)
and Log (logarithmic). In case of Lin the
graphical presentation and the units are
linear. In case of Log graphical
presentation is given in the logarithmic
scale and the measurement results are
expressed in decibels (the result is
related to the values set in the
Reference Levels (path: <Menu> /
Auxiliary Setup / Reference Levels).
In case of the Sound measurements the
Scale position is not active. All results are
presented in dB.
=>
=>
Resolution
The Resolution position enables the
user to define how many digits after point
are to be presented in the field 3.
=>
Page 94
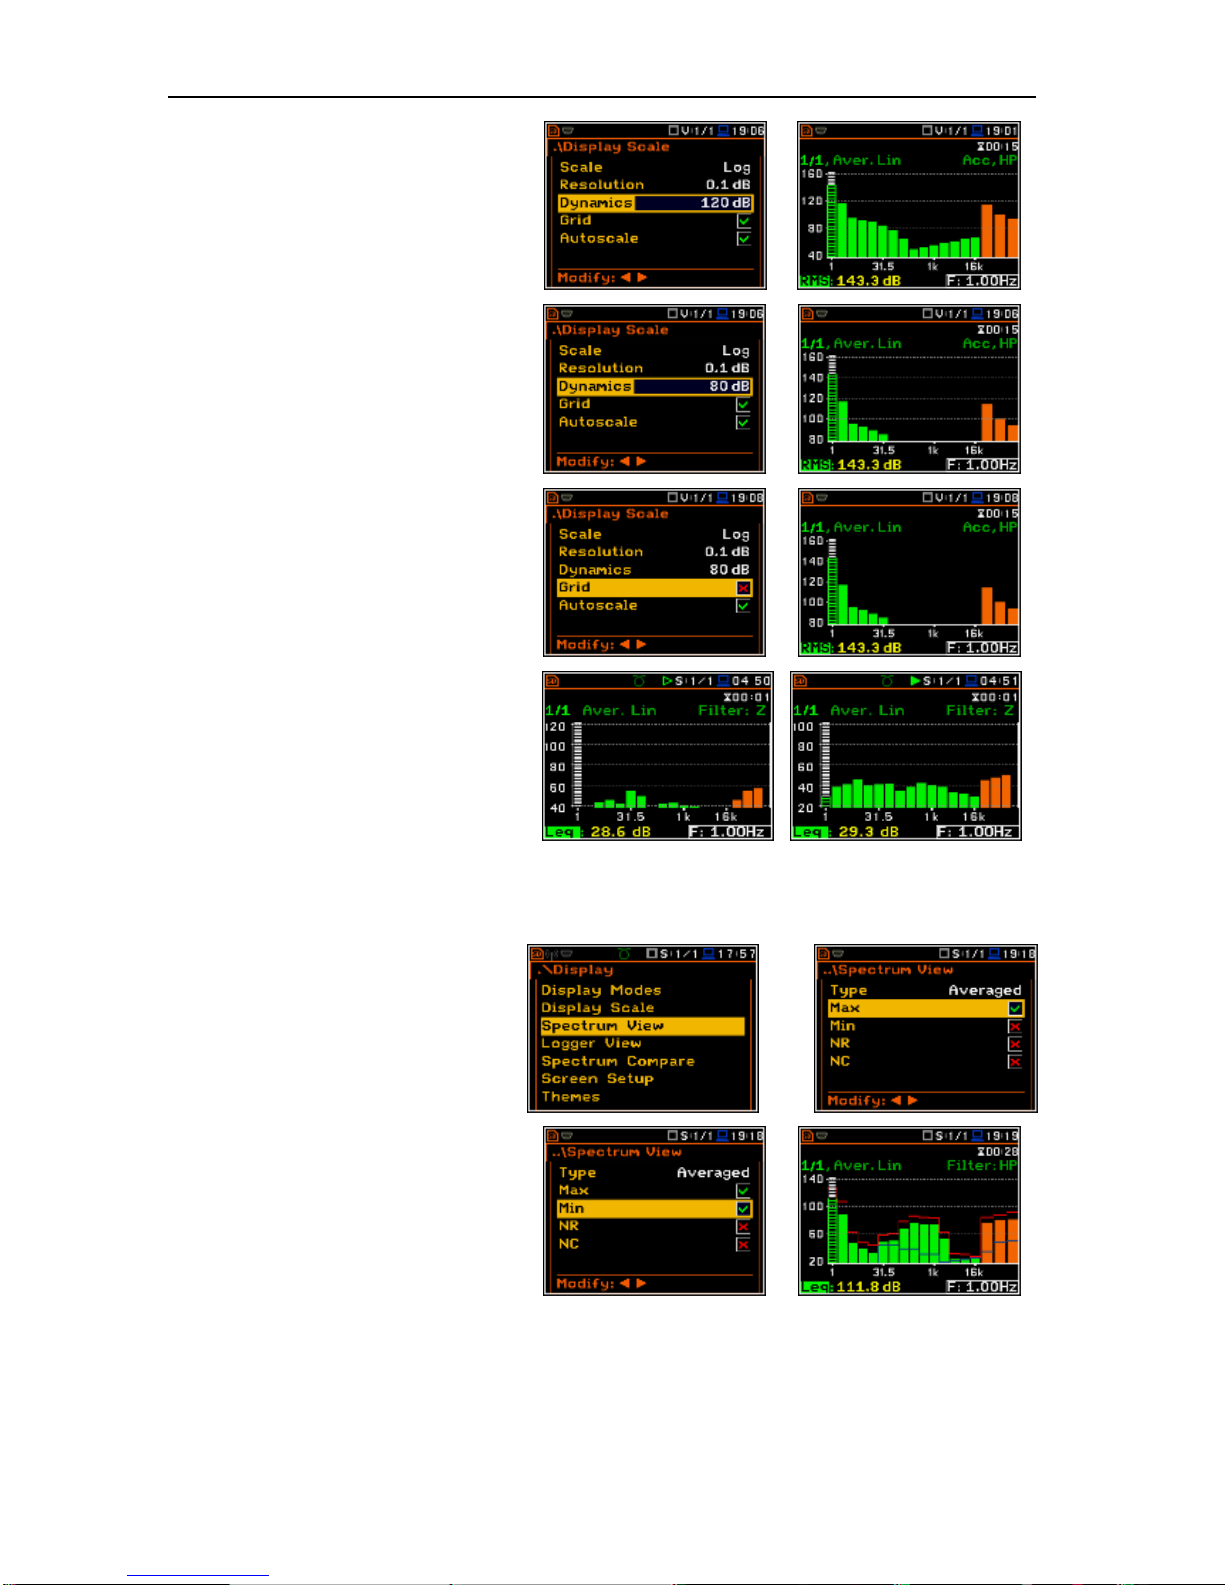
SVAN 979 USER'S MANUAL_______________________________________________ _94
Scaling the vertical axis of the plot
The Dynamics position enables the user
to select the required dynamic range
scaling of the plot in the graphical
presentation mode. The user can obtain
from two to twelve times expansion of the
vertical axis with the dynamic ranges:
120dB, 100dB, 80dB, 60dB, 40dB,
20dB and 10dB. Select the required
range using the <> and <> pushbuttons.
=>
=>
Switching the grid on/off
The Grid enables the user to switch on or
off the horizontal grid lines in the
spectrum presentation mode.
=>
Switching the automatic Y-scale
adjustment on/off
The Autoscale position switches on the
automatic adjustment of the Y scale. Auto
scaling is performed only once at the start
of the measurement to set the most
appropriate scaling for the display.
11.10. Setting the parameters of the spectrum presentation - Spectrum View
The user can select the different spectra
to be visible on the display in the
Spectrum View window (path: <Menu> /
Display / Spectrum View). In the
Spectrum View window the following
spectrum types may be selected:
Averaged, Instantaneous, Max or Min.
<ENT>
In case when the Averaged or
Instantaneous spectrum is selected the
user can additionally switch on or off the
presentation of the Max and/or Min
values for every displayed spectrum band
by placing or replacing the special
character in the displayed inversely line
with the Max or Min text by means of the
<>, <> push-buttons.
=>
Page 95
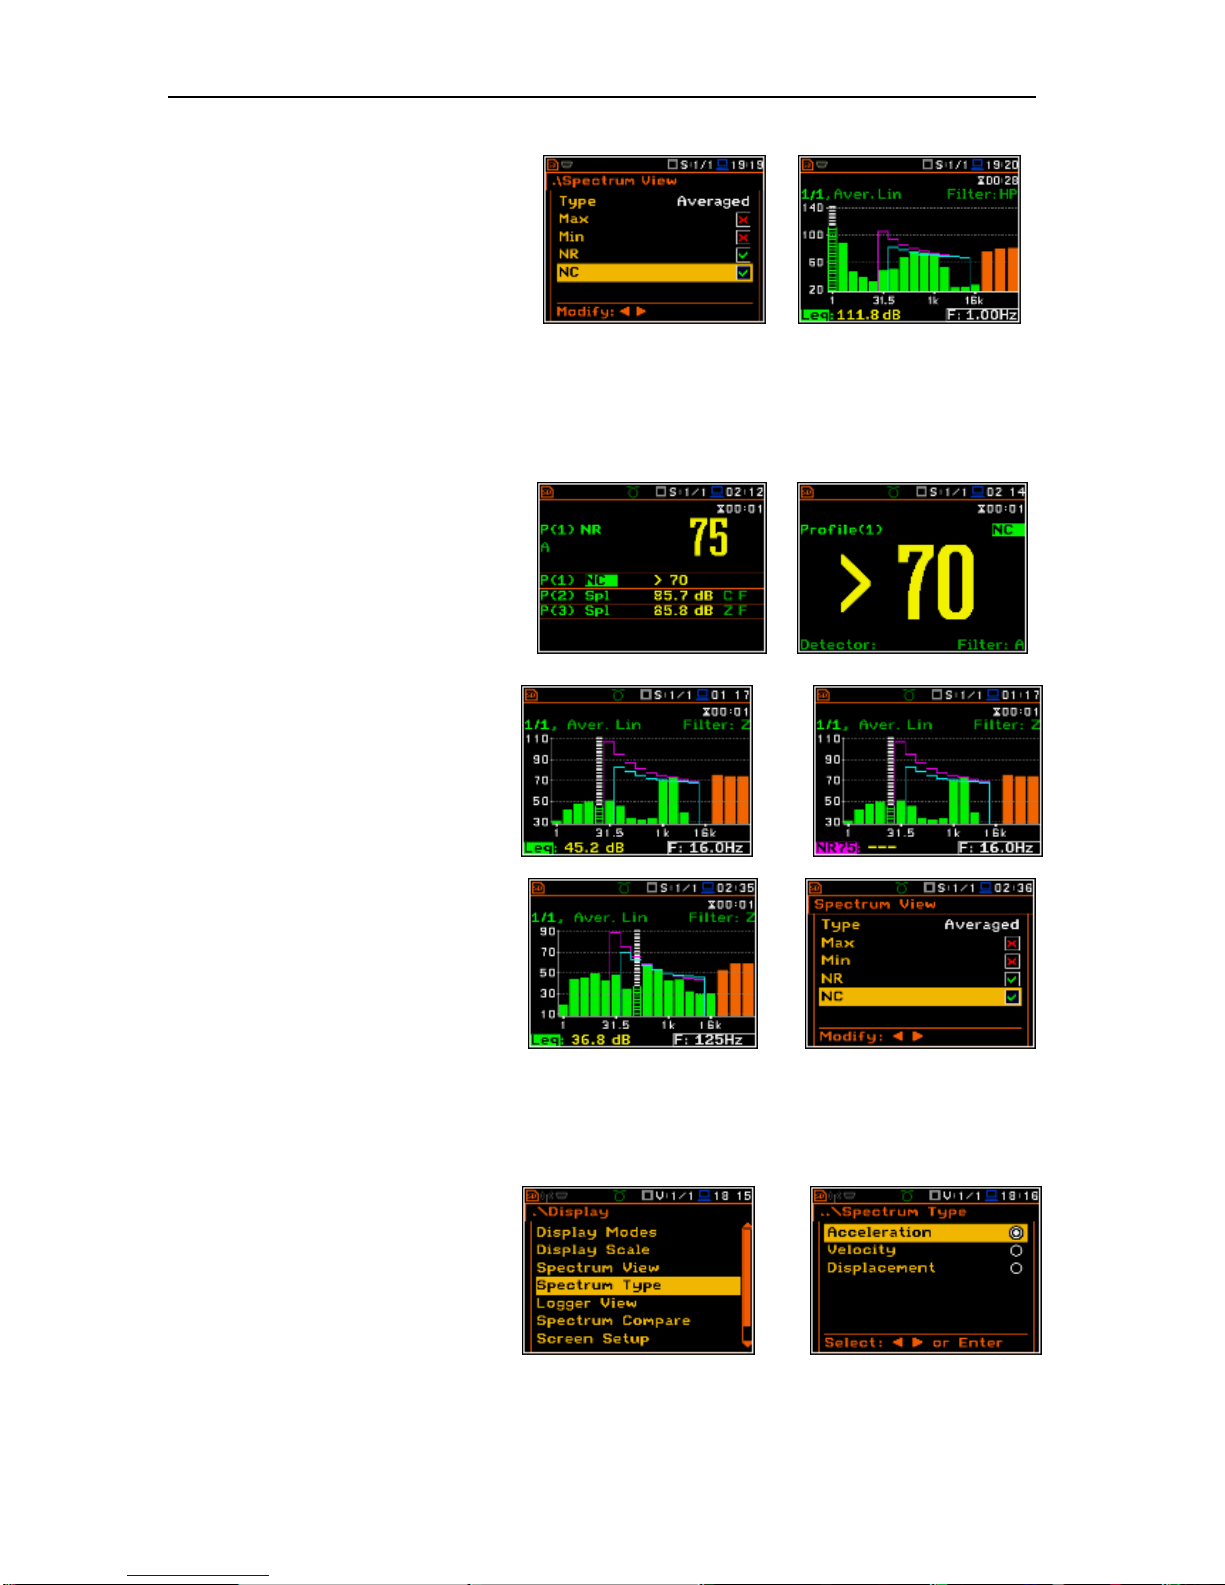
SVAN 979 USER'S MANUAL_______________________________________________ _95
NR and NC results view
In case of 1/1 octave Sound
measurements (S:1/1) noise rating (NR)
and noise criterion (NC) values can be
additionally presented in the same plot as
main spectrum when the NR or NC
parameter is switched on. A violet line
shows the NR results for the octave
bands with central frequencies: 31.5Hz,
63.0Hz, 125Hz, 250Hz, 500Hz, 1.00kHz,
2.00kHz, 4.00kHz and 8.00kHz. A blue
line shows the NC results for the octave
bands with central frequencies: 63.0Hz,
125Hz, 250Hz, 500Hz, 1.00kHz,
2.00kHz, 4.00kHz and 8.00kHz.
=>
The NR or NC results can be seen also in
the 1 Profile and/or 3 Profile modes.
If the NC or NR result exceeds the
maximum value for which the curves are
defined (NC=70 or NR=130) then before
the displayed result the character (>)
appears and the highest defined curve is
displayed.
To switch the cursor to read the Max,
Min, NR or NC values the user should
select the field in the left hand corner of
the display by means of the <>, <>
push-buttons. Then select the
appropriate value by means of the <>,
<> push-buttons pressed together with
<Alt>.
<Alt/>
The view of the spectrum screen can be
adjusted quickly without the
measurement to be stopped. After press
the <ENTER> push-button the
Spectrum View list is displayed. The
user may make necessary adjustments
and return to the Spectrum view after
confirmation of the changes by pressing
the <ENTER> push-button.
<ENT>
11.11. Selection of the Spectrum Type in the Vibration modes - Spectrum Type
The user can select the different type of
vibration spectrum to be presented on the
display in the Spectrum Type window
(path: <Menu> / Display /
Spectrum Type). The Spectrum Type
position is available only for Vibration
modes and the following spectrum types
can be selected in the Spectrum Type
window: Acceleration, Velocity or
Displacement.
<ENT>
Page 96
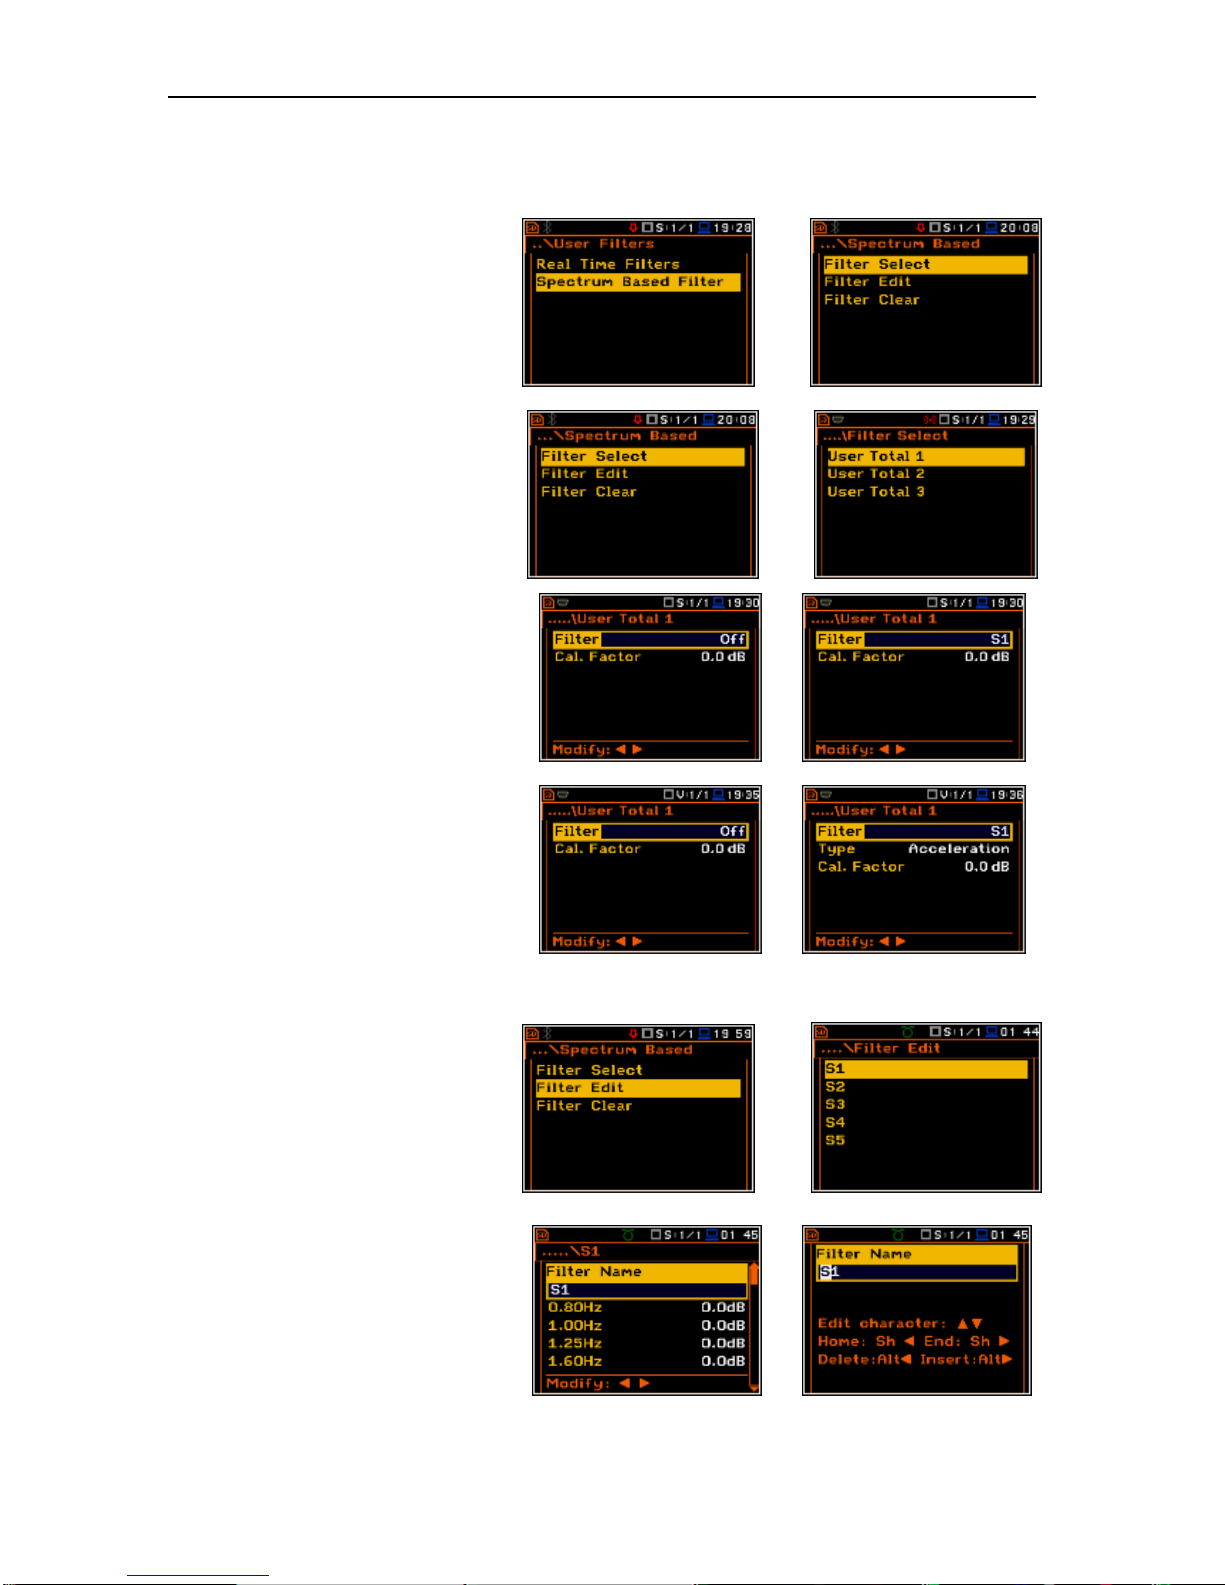
SVAN 979 USER'S MANUAL_______________________________________________ _96
11.12. Setting filter coefficients for 1/1 Octave - 1/12 Octave analysis - Spectrum
Based Filter
The Spectrum Based Filter sub-list
(path: <Menu> / Auxiliary Setup / User
Filters), enables the user to introduce the
values of the filter coefficients correcting
the results of the 1/1 Octave 1/12 Octave analysis. The results of the
analysis (the Total values) can be
modified by the introduced factors.
<ENT>
Filter Select
The Filter Select sub-list enables the
user to select the filter S1, S2, S3, S4 or
S5, used for calculation of the three Total
values.
<ENT>
Sound modes
In the Filter Select window the user may
select one of five above mentioned filters
(S1, S2, S3, S4 and S5) and set the
calibration factor applied to the Total
value calculation.
<>
Vibration modes
In the Filter Select window the user may
open three User Total window.
In the User Total window the user may
select one of five filters: S1, S2, S3, S4
and S5, set the calibration factor and type
of integration filter for measuring
Acceleration, Velocity and
Displacement.
<>
Setting the coefficients of the user
filters set
The Filter Edit sub-list enables the user
to select which filters should be edited;
the available options are as follows: S1,
S2, S3, S4 and S5 or any other
transmitted to the instrument from a PC
by means of the interface.
<ENT>
The filter name can be changed in the
edition window, which is opening by
means of the <>, <> push-buttons.
<>
Page 97
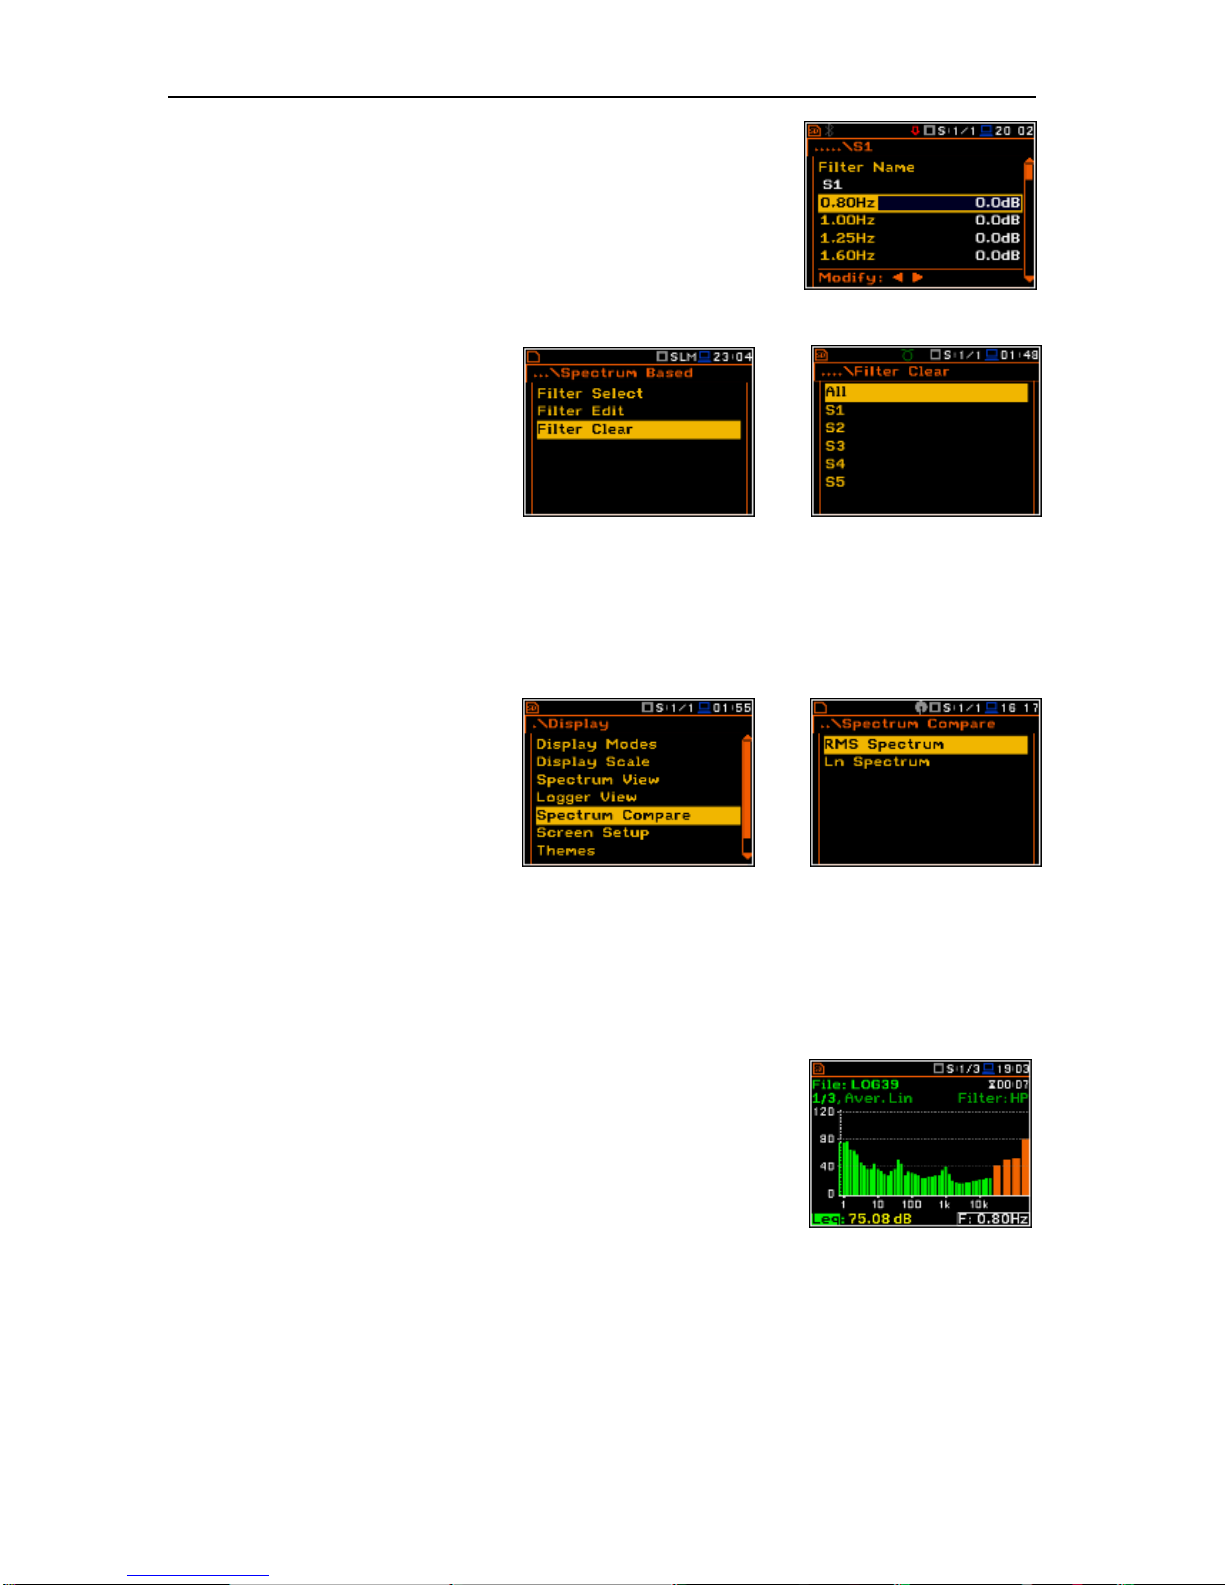
SVAN 979 USER'S MANUAL_______________________________________________ _97
The opened window contains the centre frequencies of the filters and their
coefficients:
• 0.80 Hz: available values for 0.8 Hz centre frequency filter: -100.0dB
... 100.0dB
• 1.00 Hz: available values for 1Hz centre frequency filter: -100.0dB ...
100.0dB
• ...
• 20.0kHz: available values for 20 kHz centre frequency filter: -
100.0dB ... 100.0dB
Clearing the coefficients of the user
filters
The Filter Clear position enables the
user to clear the values of the user
coefficients of octave or third octave
filters. It is possible to clear all sets of
coefficients (All), to clear the first set
(S1), to clear the second set (S2), to clear
the third one (S3) or any other transmitted
to the instrument from a PC by means of
the interface.
<ENT>
11.13. Setting the parameter for spectrum comparison – Spectrum Compare
The Spectrum Compare position
enables the user to compare spectrum
with the reference one.
The Spectrum Compare option is
available for 1/1 Octave - 1/12 Octave
and FFT analysis. It enables the user to
compare two spectra. Both spectra will be
presented on the display.
<ENT>
The file with the spectrum assumed as the reference one has to be saved in the instrument’s memory. Then
the Spectrum Compare function should be activated in the RMS Spectrum window or the LN Spectrum
window (if statistics in sound mode are to be taken into comparison) and a file with the reference spectrum
should be marked as reference one. Then the user has to start second measurement and the spectrum from
the reference file and the spectrum currently calculated will be compared.
Spectrum comparison may be performed in the following way:
1. Select the 1/1 Octave - 1/12- Octave measurement function (path:
<Menu> / Function / Measurement Function).
2. Make proper measurement settings like integration period,
measurement range, filter, band etc. (path: <Menu> / Measurement
/ General Settings).
If statistics are taken into comparison (LN Spectrum option
available for sound mode for the 1/1 Octave - 1/12 Octave analysis)
the user should activate the Save Statistics option for both
measurements (path: <Menu> / File / Save Options).
3. Perform a reference measurement and save the reference spectrum.
Page 98
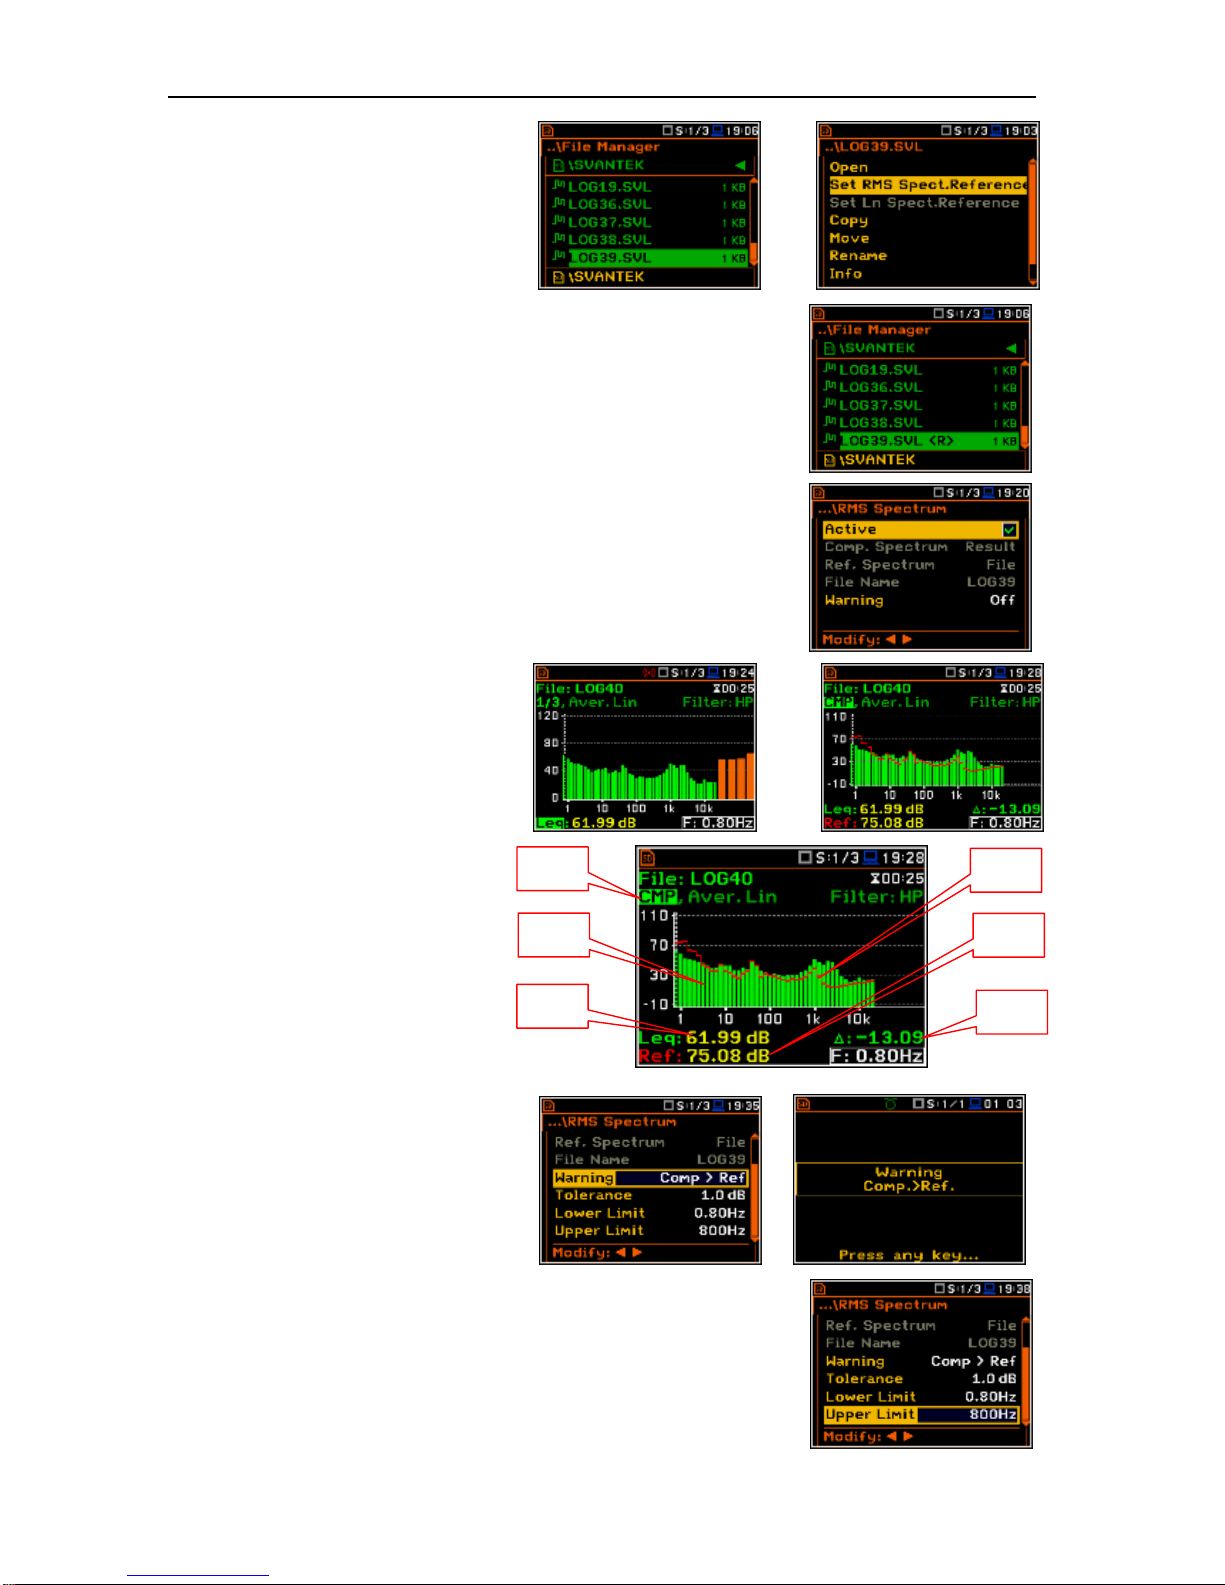
SVAN 979 USER'S MANUAL_______________________________________________ _98
4. Find the saved file, press <ENTER>
push-button and select
Set RMS Spect.Reference position
(or Set Ln Spect.Reference
position in case of Ln spectra) in the
command list and press <ENTER>.
<ENT>
5. The selected file will be marked as reference <R>. If there was
already reference spectrum defined the new reference spectrum
became active and the previous one losts it’s reference status.
6. Activate Spectrum Compare (<Menu> / Display /
Spectrum Compare / RMS (LN) Spectrum). The Active position
enables to switch on the spectrum comparison option.
The selected reference file name will be displayed in the File Name
position.
7. Start the second measurement.
Press the <Alt/> push-button to
see spectra comparison view mode.
<Alt/>
Field description:
1. Spectrum averaging, filer type
2. Compared spectrum
3. Value of the cursor position for
compared spectrum
4. Reference spectrum
5. Value of the cursor position for
reference spectrum
6. Difference between compared and
reference band value
It is possible to activate Warning, which
will appear on the display when the
results from the compared spectrum are
greater (at the value of Tolerance) than
the results from the reference spectrum
(Comp.>Ref.) or contrariwise
(Comp.<Ref.).
=>
The Tolerance can be set from 0.1 dB to 10.0 dB. It means that if the
Tolerance is set to 1 dB and Comp.>Ref. option is selected in the Warning
position, the message will appear when the calculated spectrum, in any
band or line, will be greater than the reference by more than 1 dB.
It is possible also to select the band of the 1/1 Octave and 1/3 Octave
spectrum for checking warning condition. It can be done by choosing proper
values in the Lower Limit and Upper Limit positions.
1
2
3 4 5
6
Page 99
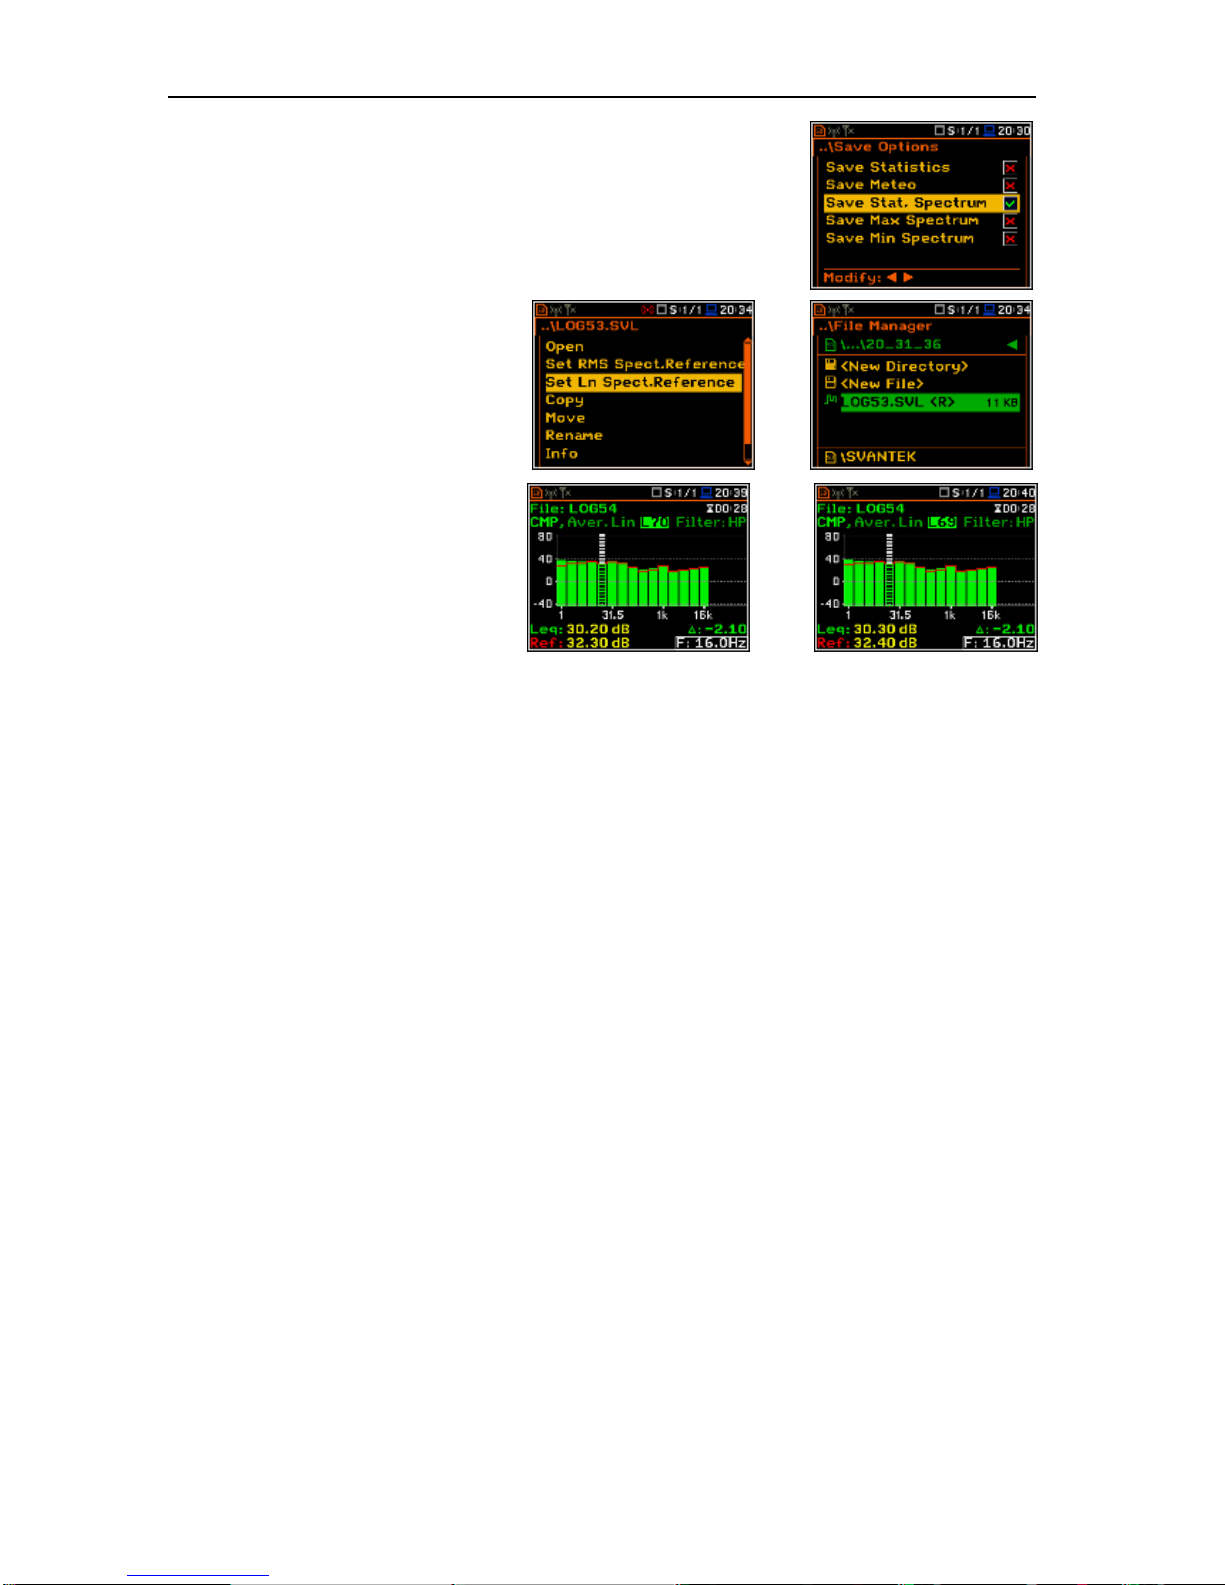
SVAN 979 USER'S MANUAL_______________________________________________ _99
To be able to compare LN Spectra the user should switch on the statistic
spectrum saving in the Save Options window (path: <MENU> / File /
Save Options).
Then the user should start the 1/1 Octave - 1/12 Octave measurement and
save the logger file with reference spectrum.
Find the reference file and mark it in the
command window as
“Set Ln Spect.Reference”.
<ENT>
When statistics are being compared
(LN Spectrum) the spectra comparison
for the L90 statistic level appears on the
display. Pressing <Alt/> or <Alt/>
enables one to view the comparison
result for lower or higher statistical levels.
<Alt/>
Page 100
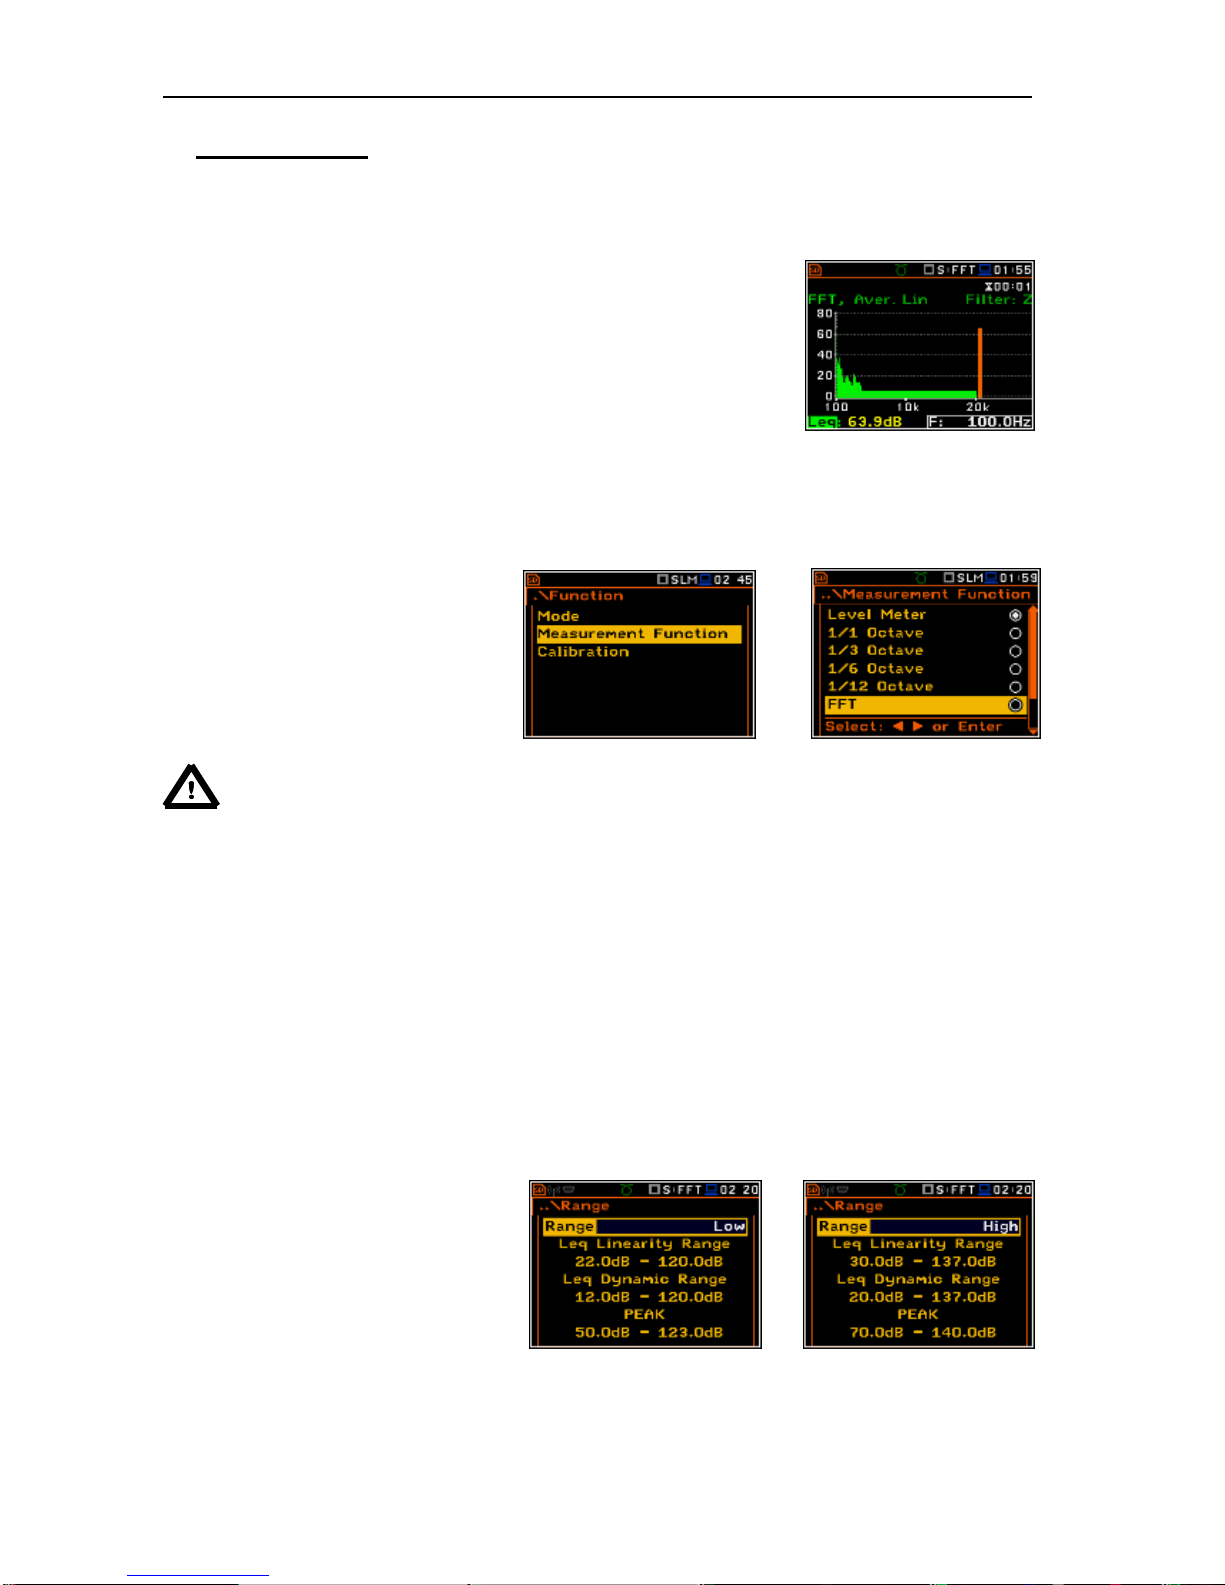
SVAN 979 USER'S MANUAL_______________________________________________ _100
12. FFT ANALYSER
The instrument operates as FFT analyser in a very similar way to the Level Meter mode and, in addition,
FFT analysis is performed in parallel with the SLM or VLM operations.
The results of FFT analysis (spectra) can be examined by the user on a
display in the Spectrum presentation mode. The availability of this mode
can be switched on or off by the user (path: <Menu> / Display /
Display Modes).
FFT spectra with the single Total overall value measured with preselected
frequency weighting filters and windows are presented in the Spectrum
mode if selected in the spectrum display menu. The read-out of the value
of interest in the spectrum can be done using a vertical cursor on the
screen.
12.1. Selection of FFT analysis mode
In order to select the FFT analysis mode
the user has to enter the Function list by
pressing the <Menu> push-button, then
select the Function text and press
<ENTER>. Then, the user has to open
the Measurement Function window
highlight the FFT line and press
<ENTER>.
<ENT>
Notice: It is not possible to change the current function during live measurements.
In this case the instrument displays for about 2 seconds the text: “Measurement in Progress”.
In order to change the current measurement function the instrument must be stopped!
12.2. Selecting the parameters of FFT analysis
The execution of FFT analysis depends on a certain number of the parameters, which can be set in the
different windows of the Measurement list. Namely, the user can set there the Range of the measurements
(path: Menu / Measurement / Range) and set the pre-weighting filter (Filter), frequency band (Band),
weighting window (Window) and number of lines (Lines) in the FFT window (path: <Menu> / Measurement
/ FFT). Additionally, the user can switch on or off the recording of the spectra in the logger file (path: <Menu>
/ Measurement / Logging / Logger Results).
12.3. Measurement range selection - Range
In the FFT analyser mode the user can
select the input ranges specified in
Appendix C, named as Low and High.
The selection of the input range is
possible after entering the Range window
of the Measurement list.
<>
 Loading...