


User Manual
CaLan N1776A
Network Profiler

CaLan N1776A
Network Profiler
User Manual
V
ersion 2.1
November 2003
Part number:
N1776A-M01

DISCLAIMER
Information in this document is subject to change without notice and does not
represent a commitment on the part of Sunrise Telecom Broadband, Inc. The
software and/or hardware described in this document are furnished under a
license agreement or nondisclosure agreement. The software may be used or
copied only in accordance with the terms of the agreement. It is against the law to
copy the software on any medium except as specifically allowed in the license or
nondisclosure agreement. The purchaser may make one copy of the software for
backup purposes. No part of this manual and/or hardware may be reproduced or
transmitted in any form or by any means, electronic or mechanical, including
photocopying, recording, or information storage and retrieval system, for any
purpose other than the purchaser’s personal use, without the express written
permission of Sunrise Telecom Broadband Inc.
Throughout this book, trademarked names are used in an editorial manner only
and to the benefit of the trademark owner, with no intention of infringement of the
trademark. Where such designations appear in this book, they have been printed
with initial capital letters.
SUNRISE, the SUNRISE logo, are registered trademarks of SUNRISE TELECOM
INC.
Windows®, W
are U.S. registered trademarks of Microsoft Corporation.
All other trademarks, copyrights, logos, brand names, etc. mentioned herein are
the property of their respective owners.
indows Explorer®, W
indows CE®, MS-DOS
®,
and Internet Explorer®
ii

Warning!
Changes or modifications to this unit not expressly approved by the party
responsible for compliance could void the user’s authority to operate the
equipment.
Safety Notices
Observe the following safety precautions whenever you operate the CaLan N1776A
Network Profiler. Failure to comply with these and other specific warnings and
cautions in this manual is a violation of Sunrise Telecom Broadband’s safety
standards of design, manufacturing, and intended use of the test module.
Sunrise Telecom Broadband assumes no liability for the operator’s failure to
comply with these precautions.
Product Damage
Danger!
been stored in unfavorable conditions, or has been subject to severe transportation
stresses. Make the product inoperative and secure it against any unintended
operation. Contact your Sunrise Telecom Broadband representative for assistance.
Do not use this product if it shows visible damage, fails to perform, has
Explosion Hazard
Danger!
fumes.
Do not operate the instrument in the presence of flammable gases or
Electric Shock Hazard
Danger!
precautions when using the N1776A CaLan Network Profiler:
Do not remove the system covers, and do not perform electrical tests if there are
signs of shipping damage to the outer enclosure.
When connecting test cables to a line, do not touch the cable’s metal contact
points, or allow the cable leads to touch each other.
To avoid the possibility of severe injury or death, observe the following
iii
Symbols
The following are general definitions of safety symbols used on equipment and in
manuals.
Dangerous voltage.
Protective ground.
Frame or chassis ground.
Alternating current.
Direct current.
Alternating or direct current.
!
Caution! Read the manual.
iv

W
arranty
Sunrise products are warranted against defects in materials and workmanship for
a period of 2 years from date of sale. Sunrise agrees to repair or replace any assembly or component found to be defective under normal use during this period. The
obligation under this warranty is limited solely to repairing the instrument that
proves to be defective within the scope of the warranty when returned to the fac
tory. Transport costs to the factory are to be prepaid by the customer.
Sunrise assumes no liability for secondary charges or consequential damages and,
in any event, Sunrise's liability for breach of contract, shall not exceed the pur
chase price of the products shipped and against which a claim is made.
Any application recommendation made by Sunrise for the use of its products are
based upon tests believed to be reliable and accurate, but Sunrise makes no war
ranty for the results to be obtained. This warranty is in lieu of all other warranties,
expressed or implied, and no representative or person is authorized to represent or
assume for Sunrise any liability in connection with the sale of our products other
than set forth herein.
Repairs and/or calibration is typically completed in 5 to 10 working days. Shipping
costs are paid by the factory only when returning equipment to a customer follow
ing warranty repair. It is the responsibility the customer to notify the factory technical support persons prior to shipping products for servicing, since many times
problems may be solved over the telephone, saving the user more precious time
and shipping costs. Sunrise maintains regular office hours from 8:00 AM to 5:00 PM
Eastern time, Monday through Friday. A toll free 800 number and e-mail address
for technical and sales support are provided below:
-
-
-
-
North America Toll Free: (800) 297-9726
International: 1-514-725-6652
E-mail address for Sales or Technical Support: catv@sunrisetelecom.com
Typical warranty on our products covers all parts and labor, as well as software
and required hardware updates. The warranty period starts from the day the equip
ment is delivered, however, Sunrise extends a grace period of 60 days after the end
of the official warranty period to cover any contingencies. Please note that the war
ranty period for rechargeable batteries is three months and the grace period does
not apply.
-
-
v

GETTING ST
ARTED
Receiving & Unpacking
The CaLan N1776A Network Profi
container specially designed to prevent damage during transportation.
The original Sunrise shipping container and packing materials should be saved
since they may be needed for long-term storage and for protecting the unit if it
must be moved long distances.
1. Inspect the shipping container prior to accepting delivery. If any exterior
damages are present, notify the transport carrier immediately. Sunrise is not
responsible for damage caused during shipping.
2. Carefully open the shipping container without destroying it. Verify the
contents of the package. Each container should have the following:
1 N1776A Network Profiler
1 AC/DC adapter with power cord
1 User’s Manual
1 Soft protective carrying case
1 Stylus
1 RS232 Null modem cable
3. Unpack the N1776A and inspect it for damage.
4. Test the operability of the N1776A. If you discover damage or operational
defects, notify your Sunrise representative for instructions on how to proceed.
ler is carefully packed at the factory in a shipping
vi

Note:
If the equipment has to be returned to an authorized Sunrise service center, carefully repackage it in the original shipping container and then contact Sunrise’s customer service department to obtain a Return Materials
Authorization (RMA) number and proper shipping instructions.
vii
DECLARATION OF CONFORMITY
DECLARATION OF CONFORMITY
Manufacturer’s Name: Sunrise Telecom Inc.
Manufacturer’s Name: Sunrise Telecom Inc.
Manufacturer’s Address: Corporate Head Office
Manufacturer’s Address: Corporate Head Office
Manufacturer’s Telephone Number: TEL: (408) 363-8000 FAX: (408) 363-8313
Manufacturer’s Telephone Number: TEL: (408) 363-8000 FAX: (408) 363-8313
Equipment Type/Environment: Measurement, Control and Laboratory Equipment
Equipment Type/Environment: Measurement, Control and Laboratory Equipment
Trade Name/Model Number: Calan Network Profiler N1776A
Trade Name/Model Number: Calan Network Profiler N1776A
Standard(s) to which Conformity is Declared:
Standard(s) to which Conformity is Declared:
Safety: IEC 1010-1:1990+A1/EN 61010-1:1993
Safety: IEC 1010-1:1990+A1/EN 61010-1:1993
EMC: CISPR 11:1990/EN 55011:1991 Group 1, Class A
EMC: CISPR 11:1990/EN 55011:1991 Group 1, Class A
Supplementary Information:
Supplementary Information:
The product herewith complies with the requirements of the Low Voltage Directive 73/23/EEC and the EMC Directive
The product herewith complies with the requirements of the Low Voltage Directive 73/23/EEC and the EMC Directive
89/336/EEC and carries the CE-marking accordingly.
89/336/EEC and carries the CE-marking accordingly.
I, the undersigned, hereby declare that the equipment specified above conforms to the above Directive and Standards.
I, the undersigned, hereby declare that the equipment specified above conforms to the above Directive and Standards.
Can/CSA-C22.2 No. 1010.1-92
Can/CSA-C22.2 No. 1010.1-92
IEC 801-2:1984/EN 50082-1:1992 4kV CD, 8 kV AD
IEC 801-2:1984/EN 50082-1:1992 4kV CD, 8 kV AD
IEC 801-3:1984/EN 50082-1:1992 3V/m, 27-500 MHz
IEC 801-3:1984/EN 50082-1:1992 3V/m, 27-500 MHz
IEC 801-4:1988/EN 50082-1:1992 0.5kV Signal Lines, 1kV Power Lines
IEC 801-4:1988/EN 50082-1:1992 0.5kV Signal Lines, 1kV Power Lines
IEC 1000-3-2:1995/EN 61000-3-2:1995
IEC 1000-3-2:1995/EN 61000-3-2:1995
IEC 1000-3-3:1994/EN 61000-3-3:1995
IEC 1000-3-3:1994/EN 61000-3-3:1995
302 Enzo Drive
302 Enzo Drive
San Jose, CA 95138 USA
San Jose, CA 95138 USA
According to ISO/IEC Guide 22 and EN 45014
According to ISO/IEC Guide 22 and EN 45014
viii
Company: Sunrise Telecom Inc.
Company: Sunrise Telecom Inc.
Address: 302 Enzo Drive
Address: 302 Enzo Drive
Telephone: (408) 363-8000
Telephone: (408) 363-8000
Facsimile: (408) 363-8313
Facsimile: (408) 363-8313
Date: 13 August 2002
Date: 13 August 2002
San Jose, CA 95138 USA
San Jose, CA 95138 USA

Table of Contents
About this book
Chapter
A functional and physical description of the Network Profi
and its components.
Chapter
A tutorial on using the touchscreen, with descriptions of dialog boxes, step con
trols, and the “soft” keyboards. Includes a brief discussion of the Start menu and
Windows CE taskbar.
Chapter
A tutorial on the Profi
data display; markers and how to use them; control tabs and controls.
Chapter
How to run the spectrum analyzer and interpret the results.
Chapter
How to run tests of signal levels, distortion, and hum on individual analog chan
nels.
Chapter
1,
The Network Profiler at a Glance
2,
Getting Started: Touchscreen Basics
3,
Getting Started: The Test Display
ler display, including the main menus, toolbar functions, the
4,
The Spectrum Analyzer
5,
Single-Channel Tests: Analog
6,
Single-Channel Tests: Digital
ler, including the display
-
-
How to run power
channels.
Chapter
How to run multi-channel level measurements, and scan levels of all channels in
any part of the spectrum.
Chapter
How to run forward and return sweep and return-spectrum tests, in conjunction
with a 3010H at the headend.
, QAM constellation, and Equalizer-tap tests on individual digital
7,
Multi-Channel and Channel Scan Tests
8,
Sweep and Return Spectrum Tests
ix

About this book
Chapter
How to store and review test data, make screen captures, back up data, and com
municate with other instruments and equipment.
Chapter
How to use the Channel Plan, T
Chapter
How to use essential components of the W
Windows Explorer, the Start menu, and the Taskbar.
Chapter
How to use the external power adapters, set power
delays, recharge the battery, and replace the battery.
Chapter
How to recalibrate the stylus, self-calibrate the Network Profi
the unit and its accessories.
9,
Maintaining and Managing Your Data
10,
Test points, Locations, and Channel Plans
est Point File, and Location File editors.
11,
Using Windows CE
indows CE operating system, including
12,
Power Management
-conservation (“idle-time”)
13,
Maintenance and Care
ler, and take care of
-
x

About this Version
About this Version
This version of the
Firmware Release 2 units only. Be sure to refer to any user’s manual supplements
or release notes that came with your unit. For assistance, call Sunrise Telecom
Customer Care: in North America at 1-800-297-9726; from other countries at
1-514-725-6652. You may also consult our website at www.sunrisetele
com.com/broadband
Printing history
Version
Sunrise edition 1.0
Release 2
2.1
CaLan N1776A Network Profiler User’s Manual
Release date
Notes
jmg
jmg
applies to
-
What you should know before you start
Y
ou should be familiar with the basic functions of the Windows interface: the
mouse and its pointer; directories and folders; menus; saving, opening, copying,
and moving files.
T
ypographic conventions used in this manual
Equipment labels, touchscreen and keypad button labels, and text displayed on the
screen are shown in
Menu item selection is shown in boldface as a sequence of steps separated by right
angle brackets. Example:
boldface
.
select
File > Open
means “touch the
File
menu heading, then touch
Open
”.
xi

About this Version
xii

Purpose and functions 1–2
Connectors and ports 1–5
Keypad controls and indicators 1–7
Touchscreen display 1–9
Other components and accessories 1–11
1
The Network Profiler
at a Glance
1–1

The Network Profiler at a Glance
Purpose and functions
Purpose and functions
Connectors and ports (top)
Speaker
Battery cover
The CaLan N1776A Network Profiler is a portable instrument that combines
the functions of a spectrum analyzer and a digital modulation analyzer for
measuring levels, distortion, and other aspects of both analog and digital
channels in a CATV network. It is powered by a lithium-ion “smart” battery,
and has a built-in battery charger. An external AC adapter supplies DC power
for Network Profiler operation and for the internal charger. (A 12 Vdc car
adapter is also available.)
To uc hscreen display
Keypad
Measurement Modules
The Network Profiler’s functions comprise a spectrum analyzer and two software modules for performing these additional measurements:
1–2

The Network Profiler at a Glance
Purpose and functions
CATV module:
•Analog channel signal levels, distortion, and hum
•Digital channel average power, QAM modulation, and equalizer taps
•Multi-channel carrier levels
•Channel scan of visual and aural carrier levels
Dual-path Sweep module (Option 052):
•Forward and reverse sweep
•Return spectrum
Note: The Dual-path Sweep module is now standard on the Network Profiler. If you have
an older unit on which this module is not enabled, you must return the unit to Sun
rise Telecom Broadband for recalibration, at which time the module will be enabled.
This can also be done on 3010H and 3010R units with firmware version 4.0 or later.
The channel-test measurements can use predefined or user-defined channel
plans, test point files, and location data. You can save test results at any point
to preserve a record of your work.
-
Digital IF Annex Options
The following three hardware options are available for the Network Profiler:
•Option 011Annex A
•Option 010 Annex B
•Option 012 Annex C
Supporting functions
The screen-capture utility allows the user to take a snapshot of the display at
any time, automatically saving it internally or on an inserted PC Card.
A serial link allows the Network Profiler to exchange files and data with a
computer.
Internet or LAN access allows the Network Profiler to exchange information
with other stations on a computer network.
Built-in editors allow the user to modify a channel plan and to create or modify test point files and location data.
Operating environment
The Network Profiler runs in the Windows CE® operating system. Channel
plans, test point files, location files, and test results are stored in an internal
memory, whose state is maintained by the battery between uses. Additional
1–3

The Network Profiler at a Glance
Purpose and functions
data files can be stored on a flash-memory card inserted in the PC card slot on
the top of the unit.
A selection of Windows CE applications is accessible from the
described in
Chapter 11, Using Windows CE.
START
menu, as
1–4
The Network Profiler at a Glance
Connectors and ports
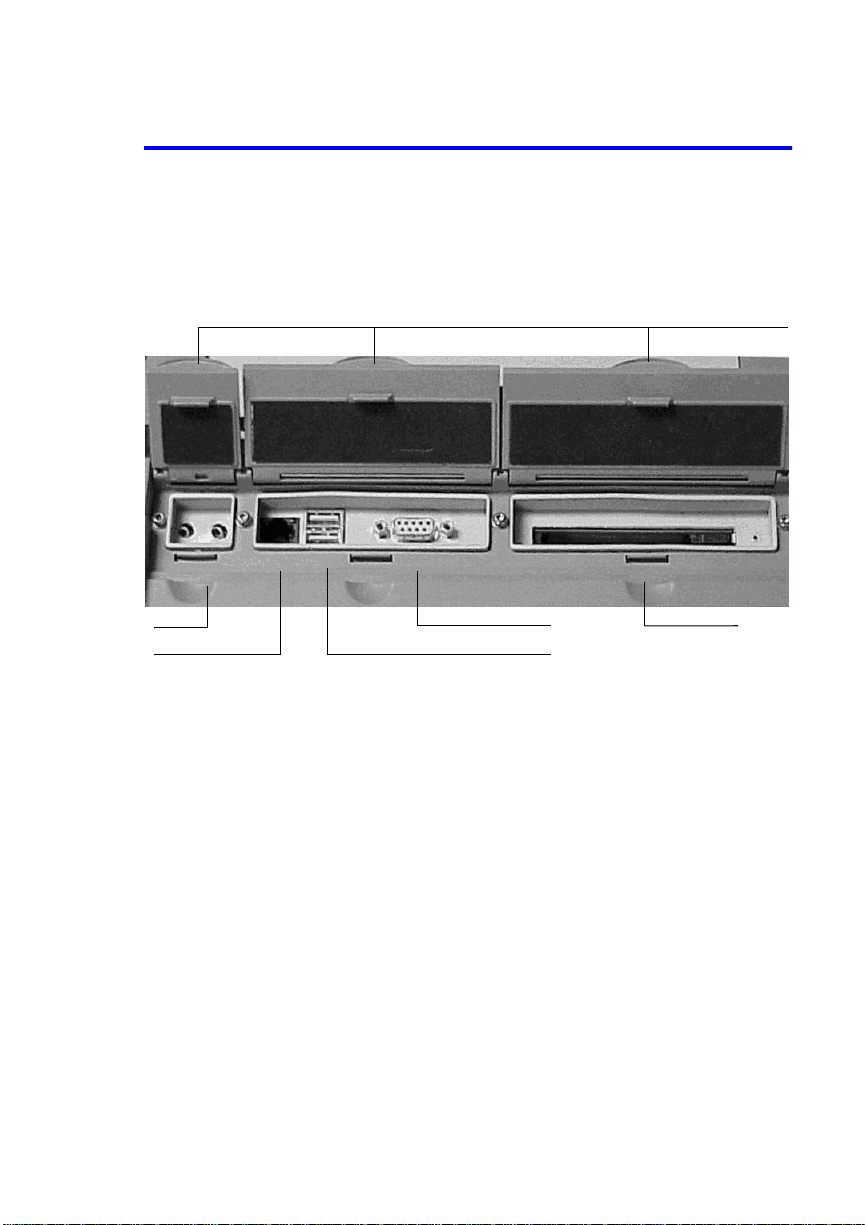
Connectors and ports
There are two rows of connectors on the top of the Network Profiler. Those in
front are protected by hinged, gasketed covers.
Front row
Connector covers
Audio jacks
RJ45 Ethernet port
DB-9 serial port
Dual USB ports
PC Card slot
Audio in and out
The audio jacks are under the left cover. Plug a set of headphones into the
Audio Out jack to monitor the aural carrier. (The Audio In jack is currently
in reserve.)
10baseT Ethernet connector (RJ-45)
This is the leftmost connector under the middle cover. It is used to connect to a
LAN or other network.
Dual USB port
Use these connectors for accessories such as a keyboard, mouse, external disk
drive, or printer.
RS-232 serial port (DB-9)
Use this to connect to a serial COM port on a PC.
1–5
The Network Profiler at a Glance
Connectors and ports
PC Card (PCMCIA) slot
Under the right cover is a Type II PC Card slot, which can hold a flash-memory card for storing test results, screen captures, and ordinary Windows files.
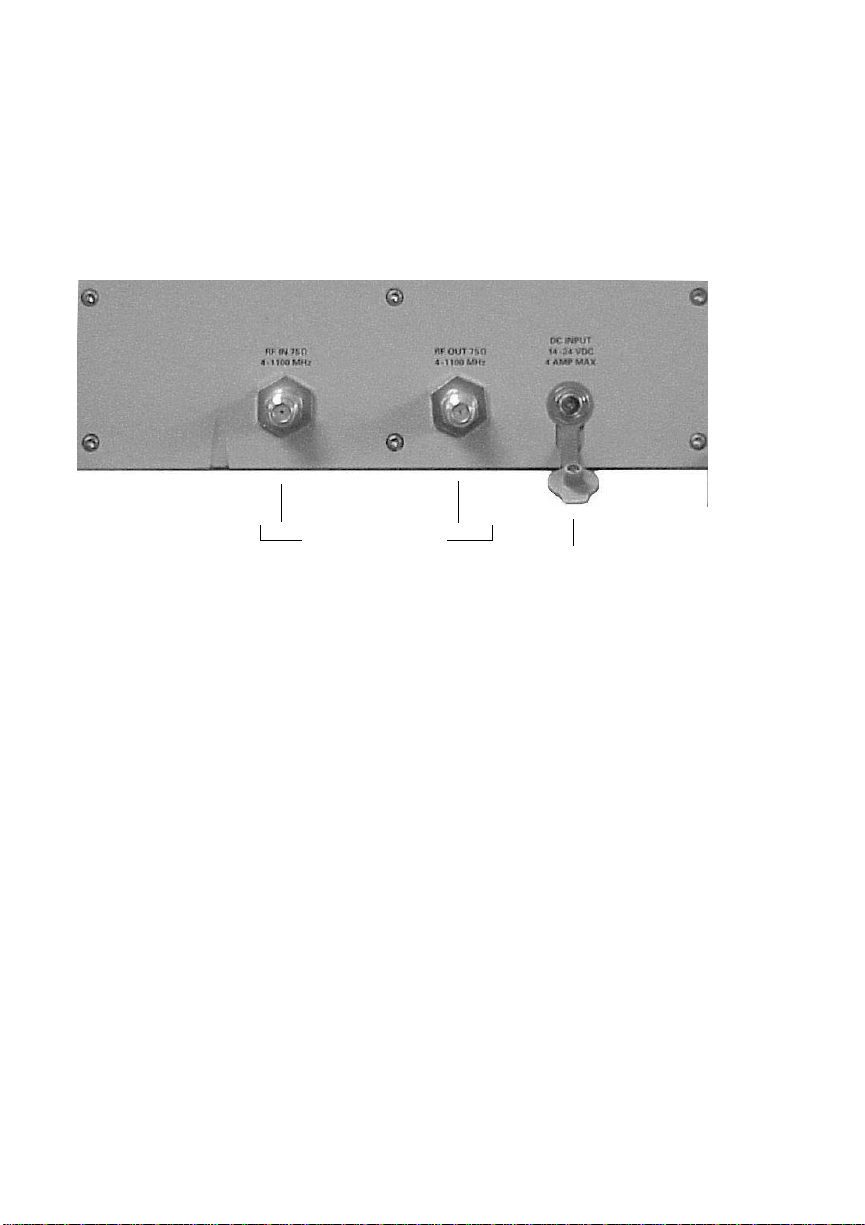
Back row
In
75-Ohm RF connectors
Out
DC input and cover
RF In and RF Out
These are the RF test connections. They accept standard 75-ohm Type F connectors. Field-replaceable 75-ohm BNC connectors (Part No. SB155) are available as an option.
DC Input
Plug a power adapter into this connector to recharge the battery or to operate
the unit from external power. An attached cover protects the connector when
it’s not in use.
1–6
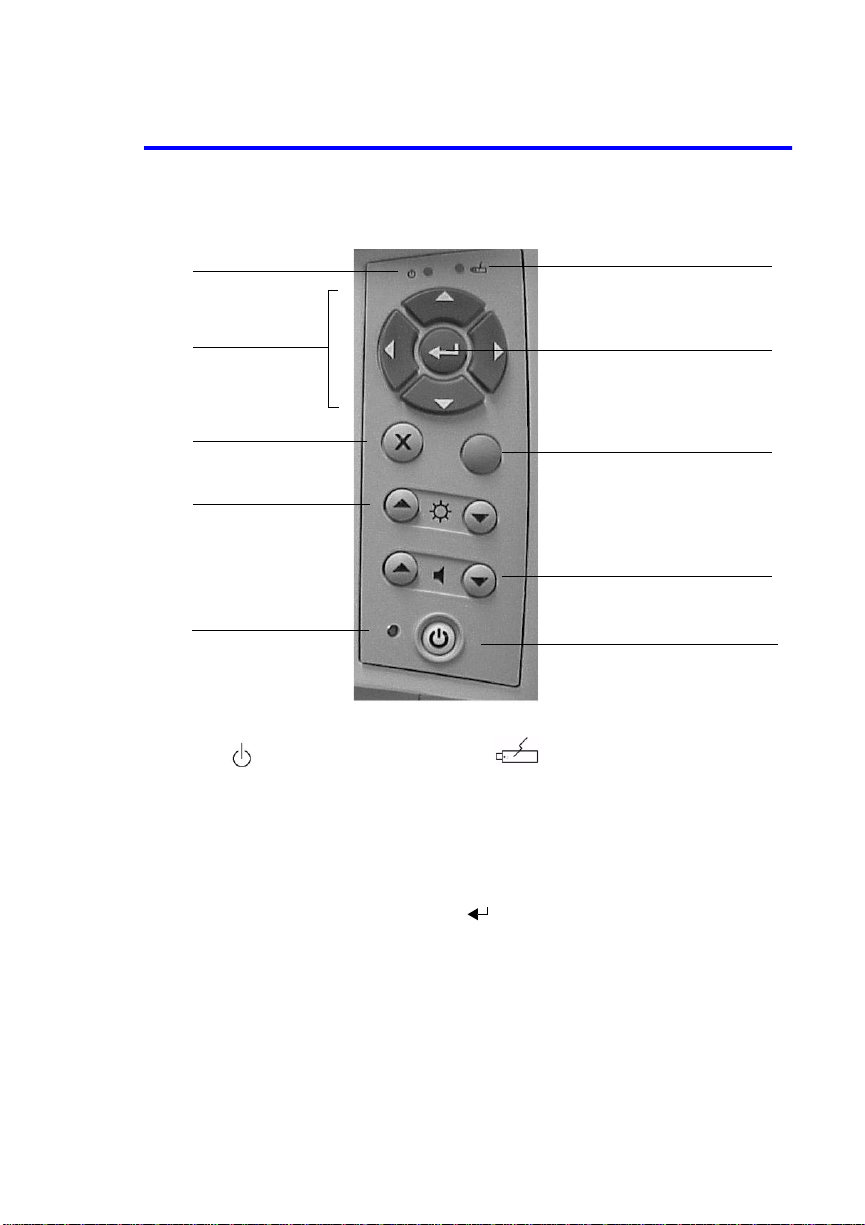
Keypad controls and indicators
These are to the right of the display screen.
The Network Profiler at a Glance
Keypad controls and indicators
Power on indicator
Arrow keys
Close Box button
Brightness controls
External temperature
sensor
Battery-charge indicator
START
menu and taskbar button
Speaker volume controls
Suspend button
ENTER
key
[not used]
Power ( ) and battery-charge ( ) indicators
The green Power indicator is lit when the unit is on. The red battery-charge
indicator is lit only when the unit is in Suspend mode. It flashes while the battery is being charged, and is steady when the battery is fully charged.
Maintaining the battery, page
See
12–9, for information.
Arrow (!"# $ ) and
ENTER
( ) keys
During a test, use the arrow keys to precisely position markers
Navigating with the keypad, page
(see
Use the ENTER key as an alternative whenever a box with an
2–3).
ENTER
or OK but-
ton is active.
In the Windows CE environment, use these keys as you would the arrow and
ENTER
keys on a PC keyboard.
1–7

The Network Profiler at a Glance
Keypad controls and indicators
Windows CE buttons
Start/Taskbar
Pressing this blue button brings up the Windows CE Start menu and, if it is
hidden, the taskbar. You can then use the stylus or the arrow and
to select and execute a Windows CE application. The taskbar and basic Win
dows CE operations are described in the section,
page 2–11.
Start Menu and Taskbar,
Close Window (×)
Pressing this button will close most Windows CE dialog boxes, and is equivalent to touching the × in the upper right corner of the box. (You can’t, however,
use this button to close an application window.)
ENTER
keys
-
Brightness
These buttons control the brightness level of the display.
Note: The Vol ume buttons (%), formerly used to control the loudness of demodulated
audio, are no longer functional. Volume is now controlled by a software slider on the
Spectrum Analyzer’s Marker tab.
Suspend button
In normal use, the Network Profiler never shuts off completely. Instead, pressing this button puts the unit into Suspend Mode: the backlight and power-supply board are turned off, but the battery continues to maintain the state of
internal RAM. This requires only a tiny bit of energy, so the Network Profiler
can remain in Suspend mode for up to 60 days before the battery needs to be
recharged. You may press Suspend at any time; it isn’t necessary to exit the
Profiler application.
When you press the Suspend button again, the Network Profiler automatically returns to its last previous state, usually the last test it was running.
adjustment
(!)
( )
See Other test controls, page 4–7
External temperature sensor
The external temperature is reported, along with the internal temperature of
the unit, in the About... box. See
About the N1776A, page
3–7.
1–8
The Network Profiler at a Glance
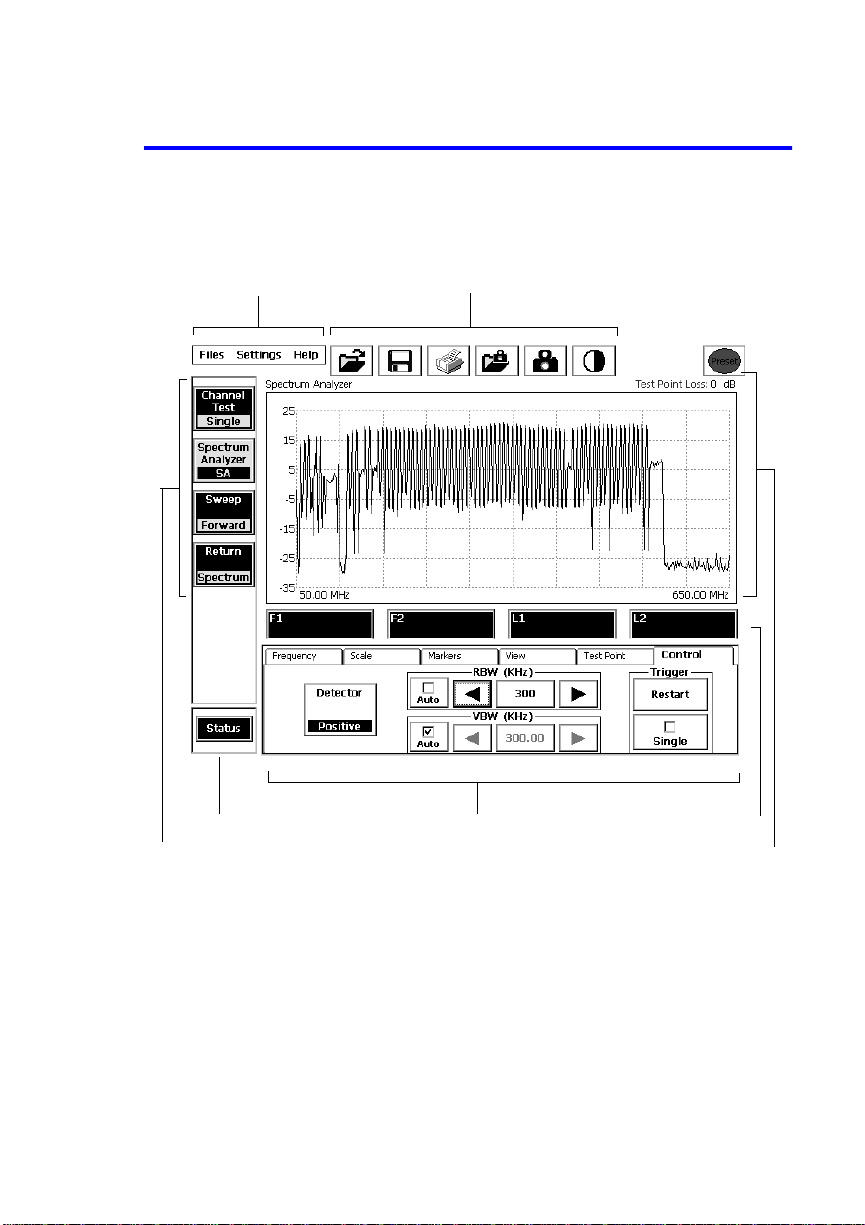
Touchscreen display
Touchscreen display
The backlit LCD display incorporates a resistive touchscreen that allows you
to use the included stylus, a finger, or any other suitable pointing tool to con
trol the Network Profiler’s operation.
Menu bar
To ol bar
-
Status button
Measurement selectors
Control tabs
Active marker selectors
Data display
Menus
The three menu headings at the top left of the screen give access to functions
that apply to the operations of the Network Profiler as a whole, rather than
just one test or measurement group. They are described in Chapter 3, Getting
Started: The Test Display
.
Toolbar
To the right of the menus are six buttons with icons. From the left, the first
five buttons let you view test results, save test results, print screen data, view
screen captures, and make a screen capture. The fifth button switches the
1–9

The Network Profiler at a Glance
Touchscreen display
data display between the normal white-on-black color palette and the
black-on-white “daylight” palette for use in bright sunlight.
Preset
Touching the red Preset button in the upper right corner of the screen
restores most test controls to their default state. For a detailed description,
When you have to start over, page
see
3–20.
Measurement selectors
The buttons at the left edge of the screen select the type of measurement:
Channel Tests, Spectrum Analyzer, Sweep, or Return Spectrum. The
Channel Test button gives you a menu of three choices: Single, Multi, and
Scan. The Sweep button gives you a menu of two choices: Forward or
Return.
All these measurements are described in Chapters 3, 4, and 5.
Status toggle
Touching this button clears a space below the data display for status information related to the current measurement.
Data display
The top line identifies the current measurement type (and channel, when
applicable) and test-point loss setting. If a test-point file is in use, its name
appears at the right.
The main display area consists of the current test data and results. The data
may be in the form of a signal trace, a digital QAM constellation, a bar graph,
or a carrier scan. Markers can be positioned to provide measurement data at
precise points in the display.
Active marker selectors
Each of the large buttons below the main data display selects one of the markers to make it active. A marker can be moved only when it is active.
Control tabs
These tabs provide controls for all test parameters, which vary according to
the test in progress. Their uses aredescribed in Chapters 3, 4, and 5.
Windows CE taskbar and Start menu
These (not shown in the figure) are described in
page 2–11, and in Chapter 11, Using Windows CE.
Start Menu and Taskbar,
1–10

The Network Profiler at a Glance
Other components and accessories
Other components and accessories
Speaker
The speaker is in the left front panel. It provides the “click” when you touch
the screen, and lets you hear the demodulated audio carrier when running the
spectrum analyzer.
Battery
The Network Profiler is powered by a 10.8V, 5000 mA-hr, Lithium-ion “Smart”
battery that fits into a compartment in the lower left side of the Network Profiler. See Chapter 12, Power Management, for instructions on charging, removing, and replacing the battery.
Desktop charger (optional)
A standalone charger and reconditioner that can accommodate two Network
Profiler batteries is available separately. Its use is described in Chapter 12,
Power Management
.
External power adapters
Two a dapt e rs fo r using external power are available:
AC adapter:
work Profiler.
Car (12V) adapter:
the accessory socket of an automobile or truck.
Use of these adapters is described in Chapter 12, Power Management.
This plugs into a 100-240 Vac outlet. It is supplied with the Net-
This optional adapter plugs into a 12 Vdc outlet, such as
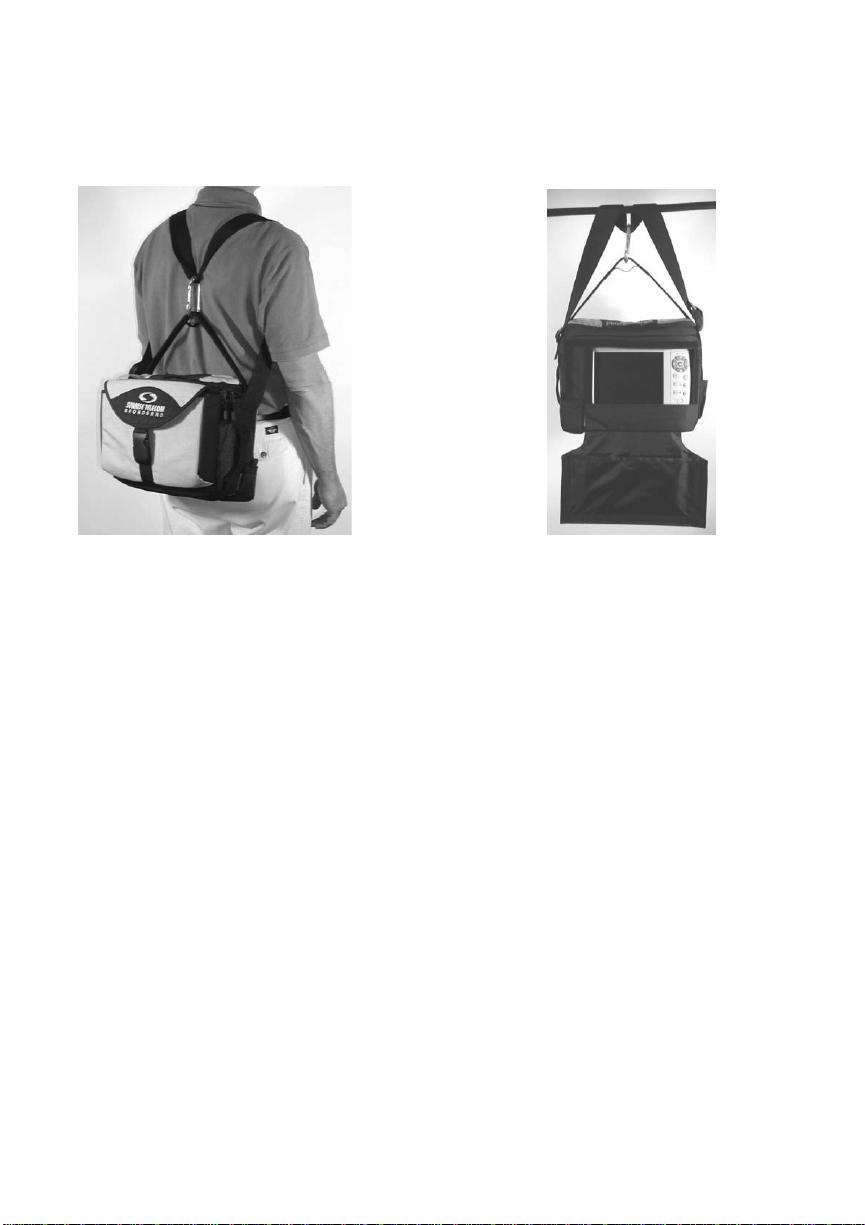
Carrying strap
Use the attached strap to remove the Network Profiler from its case and carry
it about.
1–11
The Network Profiler at a Glance
Other components and accessories
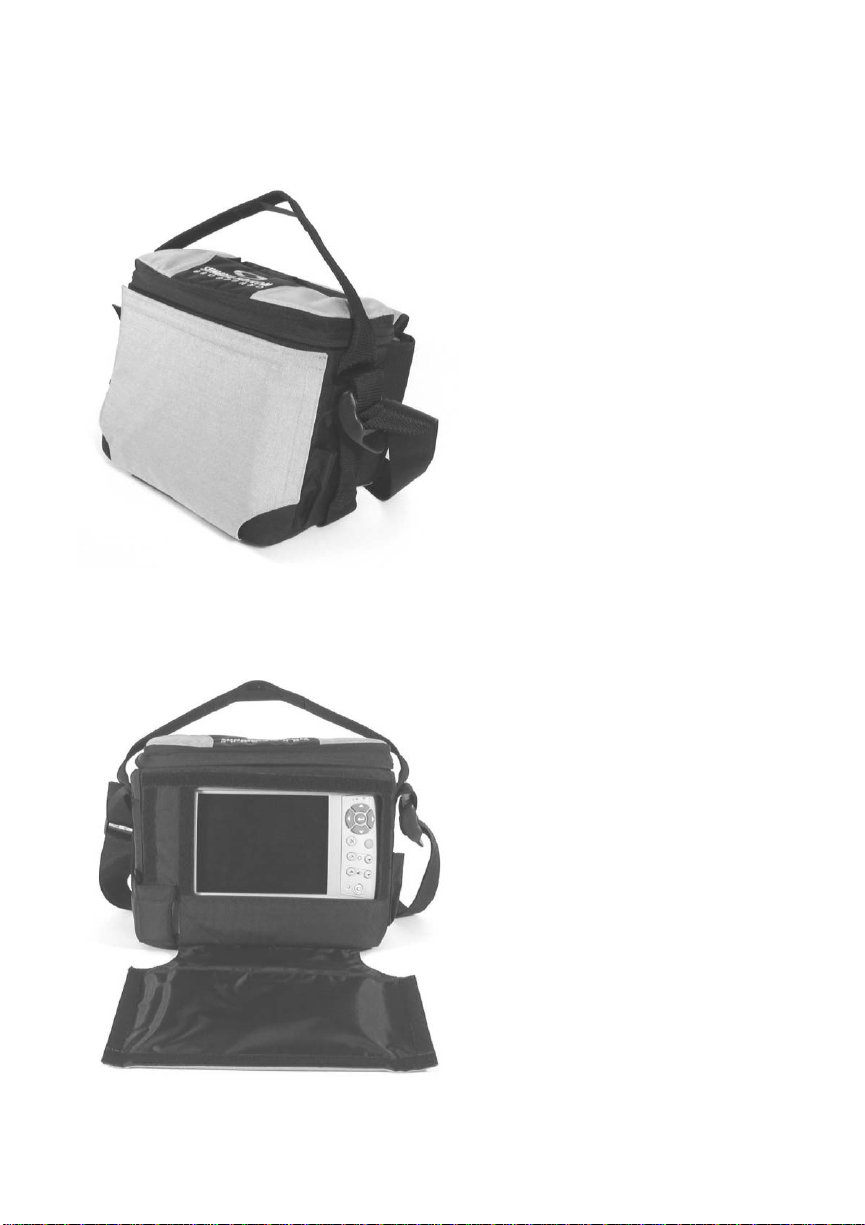
Carrying case
The carrying case is designed so that the Network Profiler can be used without removing it from the case. A drop-down panel, secured with hook-and-loop
fasteners, gives access to the front of the unit:
1–12
The Network Profiler at a Glance
Other components and accessories
An opening in the top of the case allows cables to be attached to the RF connectors and the AC adapter socket. The top itself may be unzipped to gain
access to the other I/O ports and PC Card slot, or to remove the unit from the
case:
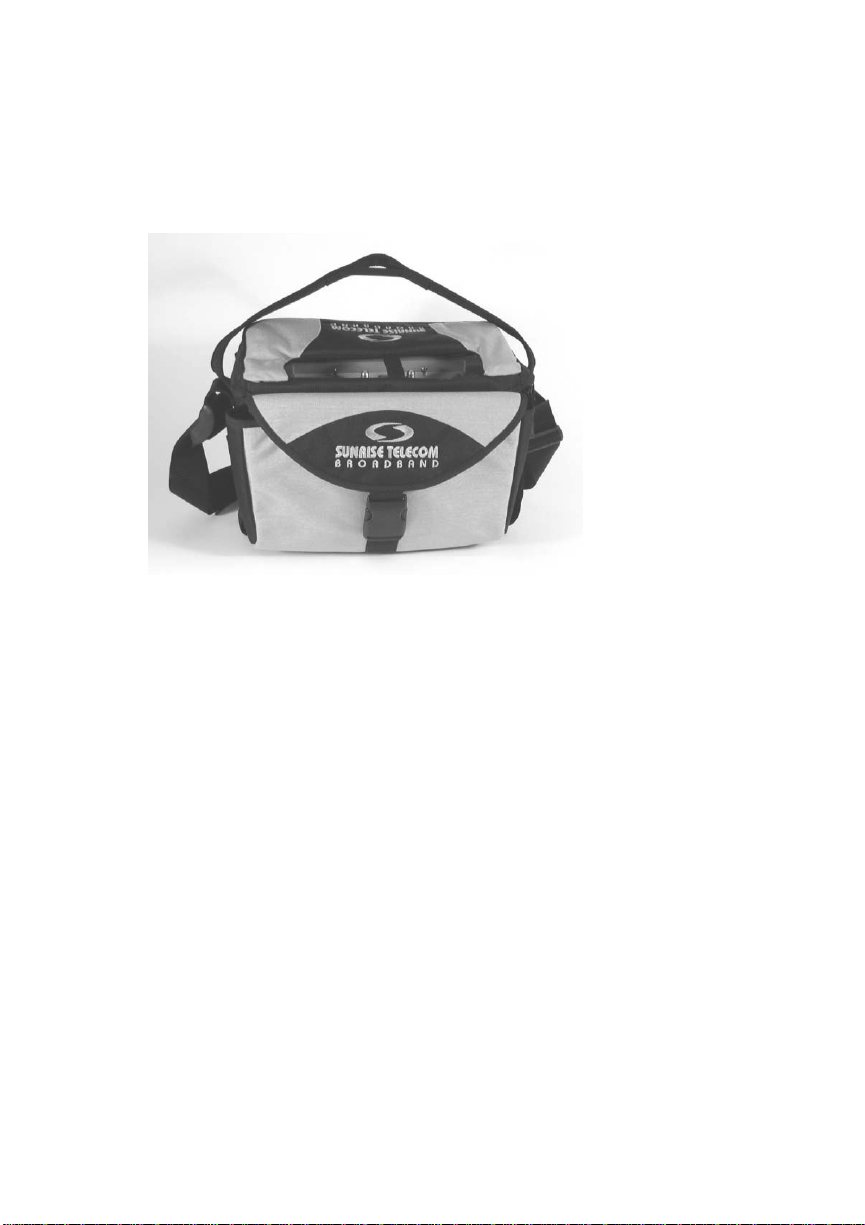
At the rear of the case is a large compartment with pockets for the external
charger, cables and connectors, papers, and other useful items:
On the lower left side of the case, a cover secured with hook-and-loop fasteners
drops down for access to the battery compartment.
There is a sheath for the stylus on the right side of the case.
1–13
The Network Profiler at a Glance
Other components and accessories
The included karrabiner (snap-link) makes it easy to carry the unit as a backpack or to hang it securely over a cable:
1–14

“Clicking” and navigating the screen 2–2
Dialog boxes 2–4
Check boxes and step controls 2–7
Using the “soft” keyboards 2–8
Start Menu and Taskbar 2–11
2
Getting Started:
Tou ch screen Basics
2–1

Getting Started: Touchscreen Basics
“Clicking” and navigating the screen
“Clicking” and navigating the screen
The Network Profiler’s touchscreen is resistive; you can use it when wearing
gloves, with the included stylus, or with any other suitable non-abrasive
pointing device, such as the eraser end of a pencil or even a toothpick. Keep in
mind, though, that a pointer with a smaller tip requires less pressure; take
care not to use anything that could damage or mark the face of the screen.
Caution: Do not use metal objects such as a ball point pen or a screwdriver as a pointing device.
These could damage the touchscreen.
You r p o in t i ng device, whether it’s a finger or a stylus, has some of the
properties of a computer’s mouse pointer (the little arrow that runs around
the screen as you move your mouse). Whenever and wherever you touch the
screen, you will hear a click from the speaker.
Touching a button, menu, or tab is equivalent to clicking a mouse button with
the pointer over that item. Examples:
•To select a control tab, touch its label.
•To select a menu item, touch the menu label, then the item. In the
following chapters, an instruction to select a menu item is shown in
boldface as a sequence of steps separated by right angle brackets, thus:
“select File > Open”
•This means “touch the File menu heading, then touch Open”.
•To reposition an active marker, touch the data display; the marker will
instantly move to that point.
To confirm the touch, a button will look as though it has been pressed, while a
menu item will be highlighted, that is, it changes appearance to show that it
has been selected. In most cases, this means that its colors will be reversed
(see example on
Almost all Network Profiler operations take effect with a single touch.
page 2–5).
The touchscreen in Windows CE
When you touch an icon, menu, or filename in a Windows CE application such
as Explorer, the item is highlighted. “Double-tapping” an item, that is,
touching it twice in quick succession, is equivalent to double-clicking a mouse
button – it executes the action associated with the item.
If the touchscreen fails to respond normally, you can recalibrate it. See
Chapter 13, Maintenance and Care, for instructions.
2–2

Navigating with the keypad
Getting Started: Touchscreen Basics
“Clicking” and navigating the screen
In a Windows CE application, the arrow and
ENTER
keys on the keypad
behave like those on a standard computer keyboard. Use the arrows to scroll
ENTER
through menus and other lists, and
to perform the action associated
with a highlighted item.
In the Network Profiler application, you can use the arrow keys to fine-tune
the position of the active marker, and to scroll through lists when using the
channel-plan, test point, and location editors. Use
ENTER
to execute the action
indicated by an Enter, Save, Close, Done, or OK button in a dialog box, as
described in the next section.
2–3

Getting Started: Touchscreen Basics
Dialog boxes
Dialog boxes
Many Network Profiler actions involve dialog boxes, small windows that may
contain lists, text boxes, buttons, and other controls.
List boxes and scrollbars
A List Box is just that – a dialog box that contains a list of items to choose
from. The following example shows the list of standard channel plans:
Scrollbar
Slider
Scroll arrow
Along the bottom and right side of the list are two scrollbars, each containing
a slider and two directional arrows. Use the right scrollbar to see the rest of
the list. (The bottom slider is useful only to see a filename that is too long to fit
in the box.) You can scroll through the list in several ways:
•by touching the up or down arrows to scroll the list one line at a time;
•by touching and holding a scrollbar arrow to make the list scroll
continuously;
•by dragging the slider, that is, by touching and holding the slider, then
moving your pointer—the slider will follow;
•by touching anywhere in the blank area between the slider and the
arrows. This will scroll the list one page (screenful) at a time.
In general, the right scrollbar will appear only when the list is too long to fit in
the list window.
2–4

Getting Started: Touchscreen Basics
Dialog boxes
To select an item in a list box, touch it; the item will be highlighted:
The two action buttons, OK and Cancel, appear in almost every dialog box.
Touch OK to carry out whatever action you have selected (in this example, to
open the highlighted file).
Note: In some boxes, this button is labeled Enter, Save, Done, or Close. Each performs
the indicated action, then closes the dialog box.
Touch Cancel to close the box without taking any action. (You can also cancel
and close a dialog box by touching the
cases, by pressing the × key on the keypad.)
in the upper right corner or, in most
×
2–5
Getting Started: Touchscreen Basics
Dialog boxes
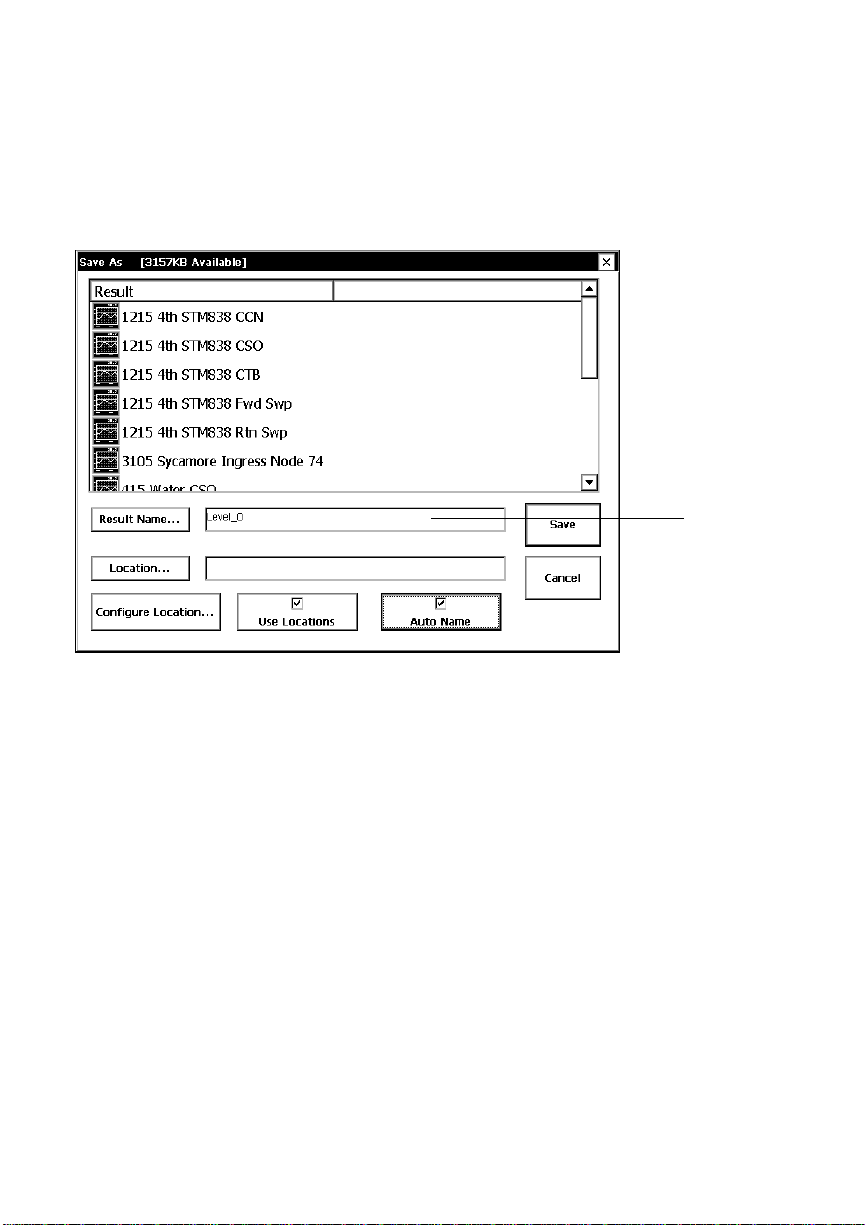
Text bo x es
Some dialog boxes contain one or more lines for entering text, such as a
filename or a channel identifier. For example, the Save as... dialog box
provides a line for entering the name of a new results file:
Text bo x
When you touch the Result name... button, a keyboard appears on the screen
Using the “soft” keyboards, page
(see
the text box.
2–8). The name you type will appear in
2–6

Check boxes and step controls
Getting Started: Touchscreen Basics
Check boxes and step controls
Check boxes and step controls appear on almost all control tabs (see
tabs, page
results.
3–15); use them to modify test parameters and the display of
Control
Using check boxes
A check box can turn a test function on or off, or enable a control. You can see
both uses on the View control tab:
To activate the Peak Hold function, touch the check box; a check mark will
appear in the empty white square:
Similarly, touch the On check box to enable the Number of Averages
control.
Using step controls
A step control is a group of three buttons, as shown in the following
illustration: a left!or down" arrow, a right # or up $ arrow, and between
them a button with a number on it:
Pressing ! or " will decrease the associated value; pressing# or $ will
increase it. Successive values appear on the center button. On certain buttons,
only those values that are valid for that control will appear. For example, only
four values are valid for the RBW control in the spectrum analyzer: 30, 100,
300, and 3000 KHz.
2–7

Getting Started: Touchscreen Basics
Using the “soft” keyboards
Using the “soft” keyboards
Stepping through a long list such as a channel plan can be tedious, so the
Network Profiler gives you a way to enter a value directly. If you press the
center button of a step control (the one with the number on it), you will bring
up a “soft keyboard”, which you can use to enter the desired value.
There are two soft keyboards: a number pad and an alphanumeric keyboard.
These have most of the features you find on a real keyboard. When you press
the middle step control button, only the keyboard appropriate to that
parameter is displayed; you won’t get an alphanumeric keyboard for a
numeric control.
Note: A separate alphanumeric keyboard for use with other Windows CE applications is
menu. See Chapter 11, Using Windows CE, for a
available from the
description of this keyboard.
Numeric keyboard (number pad)
When you touch the middle button on a numeric step control such as Full
Scale on the Scale tab, the following keyboard appears:
START
The title bar shows the limits of the value, while the current value appears
with the appropriate units in the text-entry box. To change the value, touch
the number keys (and the sign key if you want a negative value); your entry
will appear in the text box. Touch OK; the keypad disappears, and the new
value appears on the middle button.
2–8
Getting Started: Touchscreen Basics
Using the “soft” keyboards
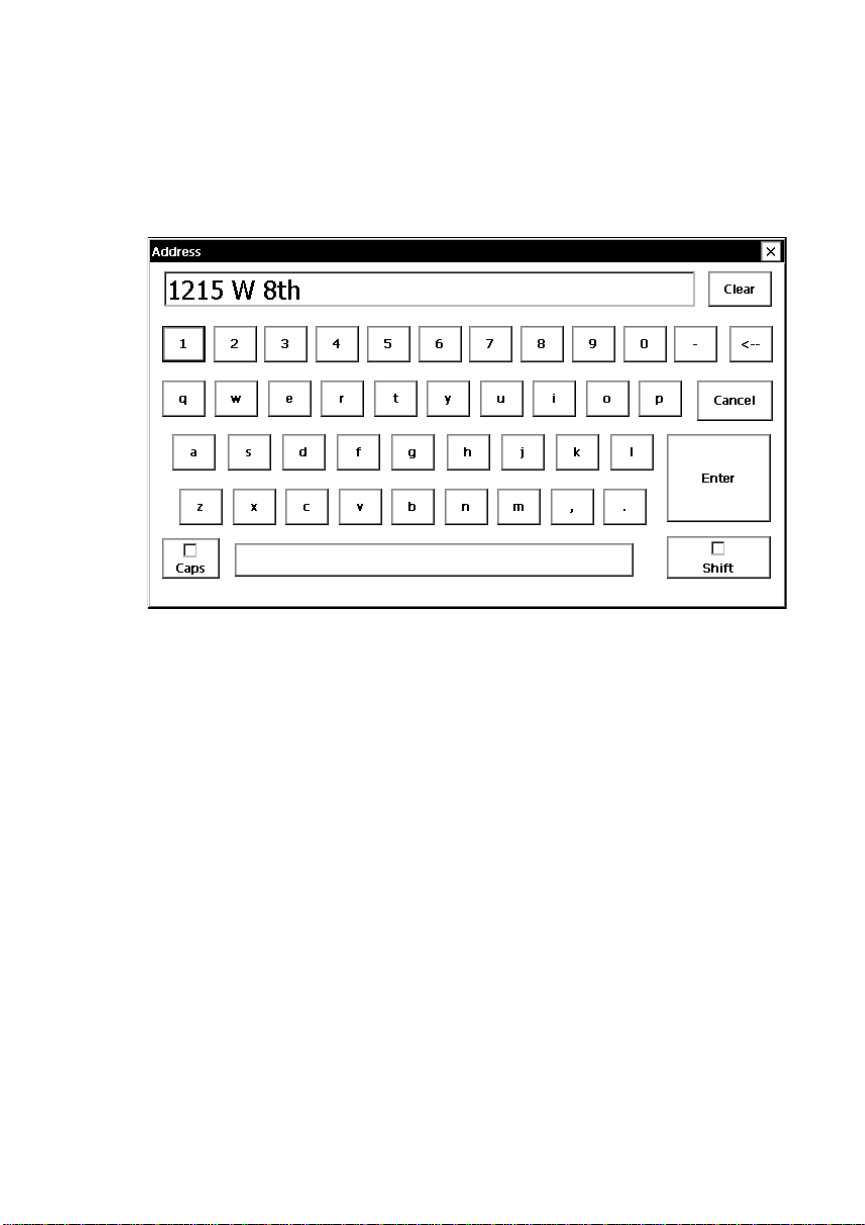
Alphanumeric keyboard
This keyboard is used primarily to edit Channel plans, test point files, and
location files:
A blinking vertical-line cursor in the text-entry box indicates the point at
which the next character will appear. Type your entry, then press Enter to
save the new entry and close the keyboard. If you make a mistake, you can
touch Clear and begin again, or you can use the left and right keypad arrows
to move the cursor to the point where you want to make a change.
The control buttons have the following functions:
Clear:
Backspace (<–):
Cancel:
Enter:
Erases whatever is in the text-entry box
deletes the character to the left of the cursor.
Closes the keyboard without making any changes
Saves the changes typed in the entry box, then closes the keyboard.
2–9
Getting Started: Touchscreen Basics
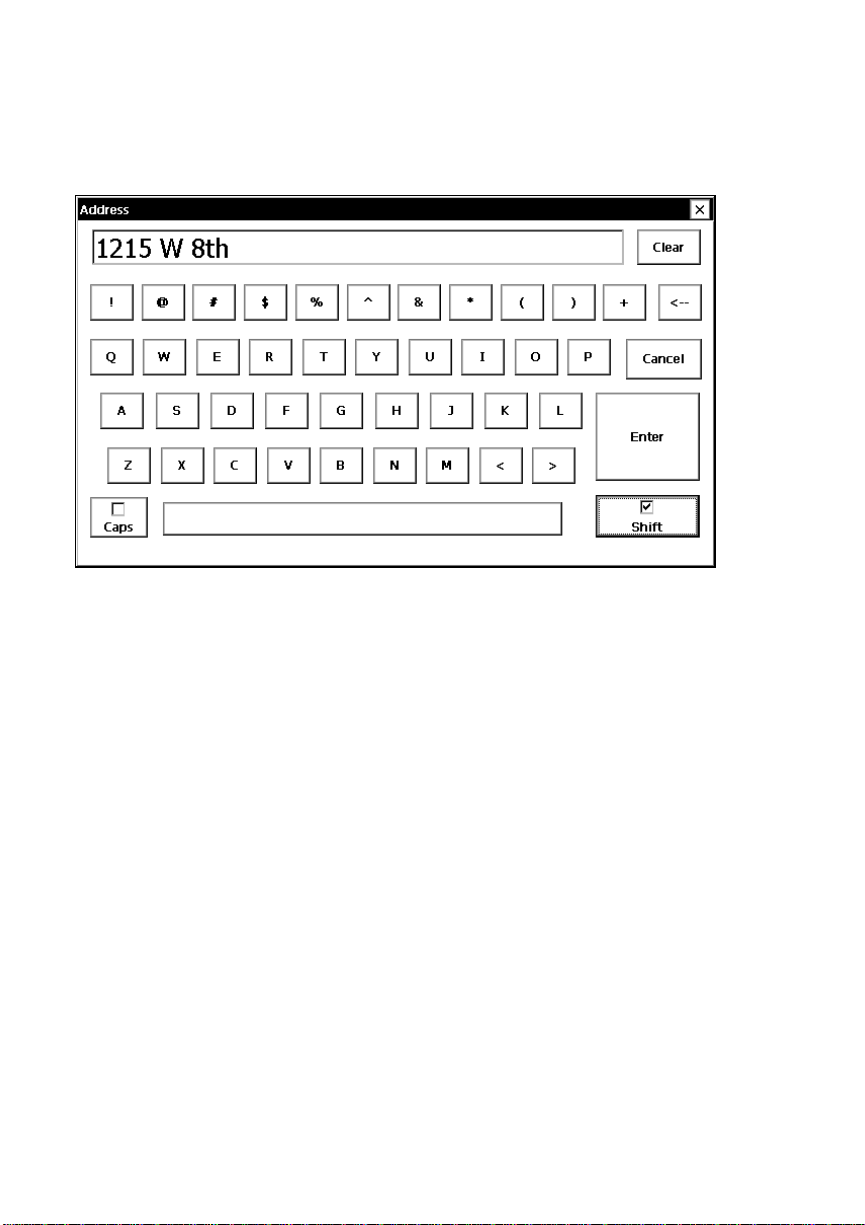
Using the “soft” keyboards
Shift:
Works like the “Shift” key on a normal keyboard. Touch it to change
the letter keys to capitals and the number keys to symbols:
As soon as you touch a key, the key caps return to lower case and numerals.
Caps Lock:
lower case until you touch Caps Lock again.
Works like the Shift button, except that the keys do not return to
2–10
Getting Started: Touchscreen Basics
Start Menu and Taskbar
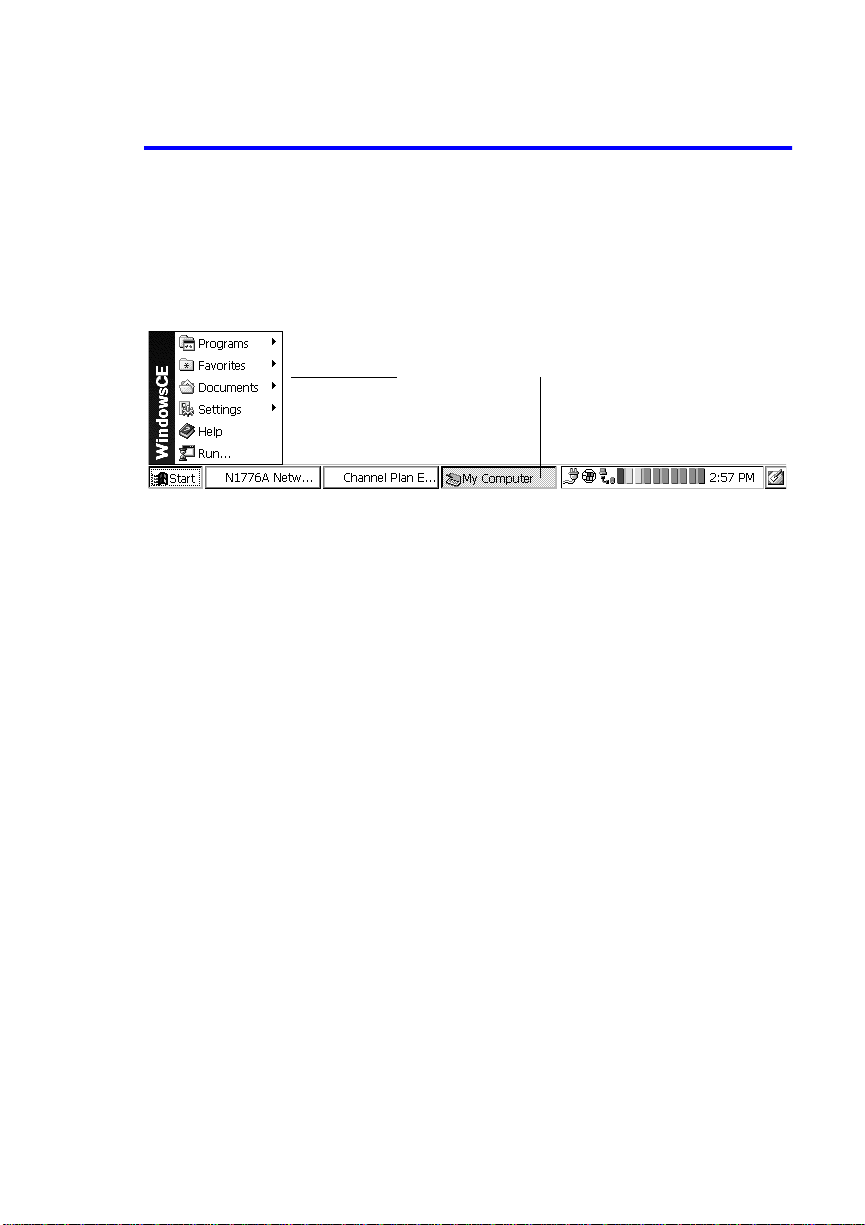
Start Menu and Taskbar
The Start Menu and Windows CE Applications
If the taskbar is visible, touch the Start button to bring up the menu. If the
taskbar is not visible, press the blue button on the keypad to bring the taskbar
and Start menu into view:
Start menu
The#arrow indicates that this item has a submenu. Touch the item to display
the submenu, from which you can choose an item to work with. The menus,
submenus, and programs are described in
Ta skbar
Chapter 11, Using Windows CE.
Programs
This submenu includes the Network Profiler, Windows Explorer, the Windows
CE “soft” keyboard, and Internet Explorer®.
Favorites and Documents
These are standard Windows CE menus listing “favorite” web sites and
recently-opened documents. Use Favorites to store the addresses of
frequently-used Internet connections. In normal use, Documents will likely
remain empty.
Settings
This submenu has two entries: Control Panel and Taskbar. The first is a
collection of utilities for configuring the Windows CE environment. The second
lets you set certain properties of the taskbar.
Help
Touch this item to display the Windows CE Help system.
Run...
Touch this menu item to display a list box containing several programs that
can be run directly.
2–11

Getting Started: Touchscreen Basics
Start Menu and Taskbar
The Taskbar
Start menu button Active application
Desktop icon
Clock
Battery-life gauge
System Tray
The Windows CE Taskbar appears at the bottom of the screen. The
START
button is at the left end. Next is the task space, containing buttons for
whatever Windows applications are open at the time. Most of the time, this
will show only the Network Profiler button.
At the right of the taskbar is the System Tray, containing icons representing
various Windows CE functions that are active; in the figure, these are the AC
power adapter and the serial port. To the right of these is a segmented
battery-life gauge and a digital clock.
The battery-life gauge shows how much charge is left in the main battery. As
the battery drains, the segments turn black one by one, starting from the
right.
Note: The last item on the taskbar is a small pad-and-pencil icon. When you touch this
icon, the Windows CE desktop appears. Touching the icon again (you may have to
double-tap) restores the previous application.
2–12

As easy as... 3–2
Menus 3–3
Toolbar 3–8
Test Selectors and Status Button 3–10
Data display 3–12
Markers 3–13
Control tabs 3–15
Enabling a test point file 3–17
Enabling a channel plan 3–19
When you have to start over 3–20
3
Getting Started:
The Test Display
3–1

Getting Started: The Test Display
As easy as...
As easy as...
It takes just three steps to begin any test:
1. Connect the RF signal leads to the RF input and output (if doing
return-path tests) of the Network Profiler.
2. Turn on the Network Profiler.
3. Select the test.
This chapter will get you familiar with the components of the test display common to all the Network Profiler’s tests and measurements. The special
requirements of each test are described in Chapters 4-8.
3–2

Getting Started: The Test Display
Menus
Menus
Files menu
From this menu, you can open, save, and export test results, create performance reports, back up and restore the data stored in memory, view screen
captures, control the screen contrast, and exit the Network Profiler. For
detailed instructions on using all these commands (except High Contrast
and Exit, described below), see
Data
.
Chapter 9, Maintaining and Managing Your
Note: Open, Save as..., View Screen shots... and High Contrast are also available as
icons on the toolbar. See Toolbar, page 3–8.
Open...
Displays a list of test results that you can select for viewing on the Network
Profiler screen.
Save as...
Displays a dialog box for saving the current test data in a named file.
Performance reports...
Allows you to create pass/fail and 24-hour performance reports from stored
channel-scan results.
3–3

Getting Started: The Test Display
Menus
View Screen Shots...
Displays a Windows Explorer screen showing the file names of any screen captures you have made.
Backup all
Makes a backup copy in flash memory of all test points, location files, test
results, and channel plans.
Restore all
Replaces the data currently in working memory with previously backed-up
data.
High Contrast
Toggles the display between the normal black-background data display and a
white background for better visibility in direct sun.
Exit
Closes the Network Profiler application and returns you to the Desktop or to
the previous Windows CE application.
Settings menu
This menu provides access to the channel plan, test point file, and location file
editors; tools for configuring the Network Profiler; and a screen for reviewing
and clearing error events.
Channel Plans
Displays the current channel plan and provides access to the editor. For each
channel, the number, name, type, and frequency boundaries are shown. Channel data are viewable from within the channel-plan editor. The Channel Plan
Editor is described in Chapter 10, Test points, Locations, and Channel Plans.
3–4

Getting Started: The Test Display
Menus
Test Point
Opens the Test Point Editor, allowing you to create and edit scale and
limit-line settings for a test point, and save them in a file.
tor is described in Chapter 10, Test points, Locations, and Channel Plans.
Test Point Edi-
The
Location Files
Displays information about a test site or device. Use this command also to
select a different location file, and to access the Location File Editor for modifying and creating location files. The Location File Editor is described in
Chapter 10, Test points, Locations, and Channel Plans.
Option Enabling
Displays a list of currently-enabled modules.
Instrument Configuration
Displays a dialog box containing tools for configuring the Network Profiler.
Use of these tools is described in Chapter 13, Maintenance and Care.
Event viewer
The Event Viewer displays diagnostic messages for use by a Sunrise Telecom
service representative or when discussing a problem with Sunrise Telecom
Customer Care.
Help menu
This menu gives access to information about your Network Profiler, and to
Sunrise Telecom’s on-line support when the Network Profiler is connected to
the Internet).
3–5

Getting Started: The Test Display
Menus
On-line support
Select Help > Online Support to see information on contacting Sunrise Telecom. You will see the two Customer support telephone numbers and a list of
other choices at the left:
email
Touch
Touch
If you are connected to the Internet, touching the address will take you
directly to the website.
To close the Online Support display, select File > Close.
to see the e-mail address:
Web
to see the address for the Sunrise Telecom website:
3–6

Getting Started: The Test Display
Menus
About the N1776A
Select Help > About... to display the “About” dialog box containing information about the currently installed options and versions of your Network Profiler’s hardware and software:
This box also shows the current internal (MCU) and external temperatures.
3–7

Getting Started: The Test Display
Toolbar
Toolbar
The toolbar comprises several buttons for frequently-used operations.
Open... ( ) and Save as... ( )
These two buttons perform the same functions as their equivalent commands
in the File menu: Open... and Save as..., described on
Print ( )
When a printer is connected to one of the USB ports, touching this button is
equivalent to sending a screen capture (see below) to the printer instead of
saving it in a file.
View screen shots ( )
Touch this button to open the Windows CE explorer in the Captures folder. If
any captures have been made, you will see them listed. For procedures,
Viewing a capture file, page
See
9–9.
page 3–3.
Make a screen capture ( )
Touch this button to save the current data display, marker selectors, and (if
displayed) the status panel, as a graphics file, either internally or on a Flash
Memory Card. Screen Capture is described in
Managing Your Data
.
3–8
Chapter 9, Maintaining and

Getting Started: The Test Display
Toolbar
High Contrast( )
The normal data display shows a white trace on a dark background. For greater visibility in bright sunlight, touch the High Contrast button. This changes the display to show a dark trace on a white background:
Touching the button again returns the display to normal colors.
Note: For clarity, all examples in this manual are shown in the high-contrast mode, using
the Windows CE color scheme “High Contrast White”. See A note on screen
contrast, page 11–13, for more information on Windows color schemes.
Preset ( )
Touching this button restores the control tab parameters to their default conditions. See
When you have to start over, page
3–20, for details.
3–9
Getting Started: The Test Display
Test Selectors and Status Button
Test Selectors and Status Button
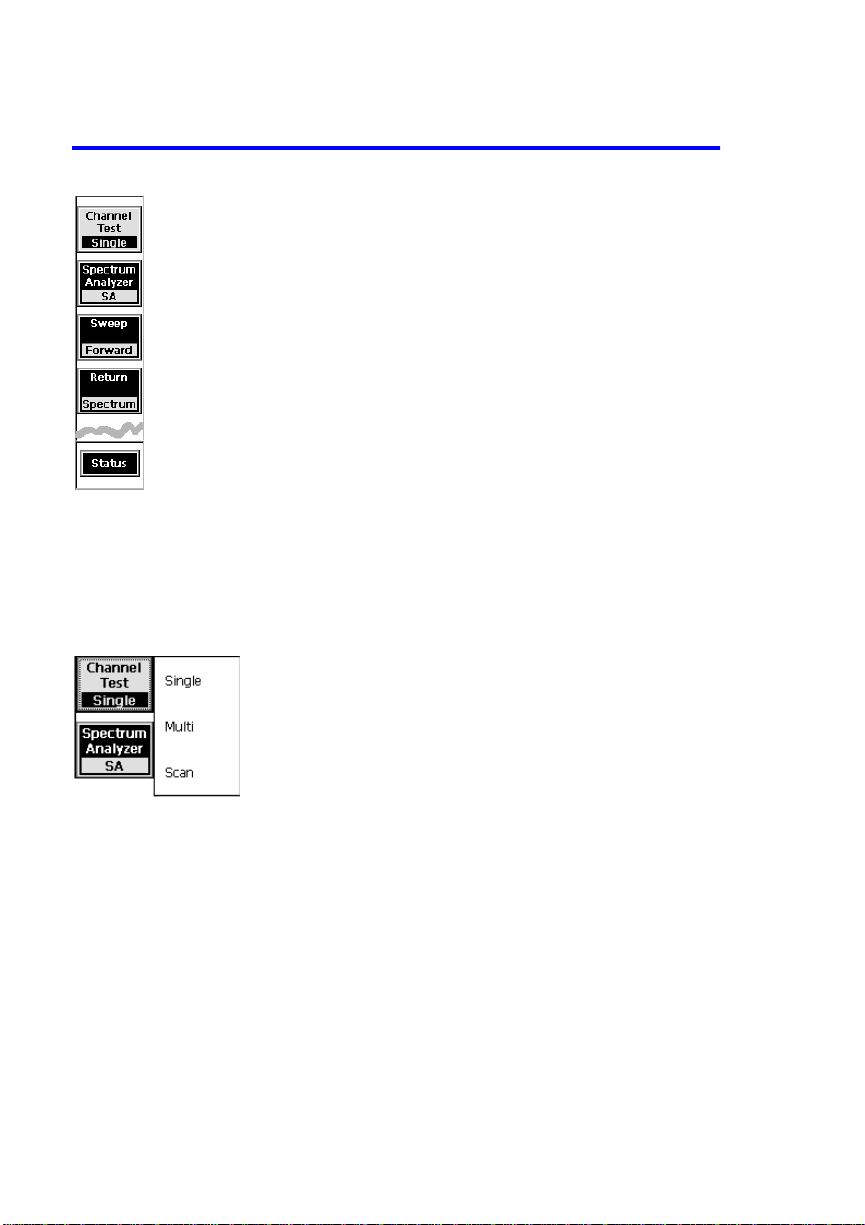
Test selectors
These buttons select the type of test to be performed.
Channel Test
When you touch this button, a menu of test choices appears to its right:
Touch one of the choices to begin. For analog channels, the Single channel
test can measure signal levels, distortion, and hum. For digital channels, this
test can measure average power and distortion performance, and display
QAM constellations and Equalizer taps. The Multi-channel test displays six
bars representing the visual carrier levels (analog channels) or channel power
(digital channels) of the designated channels. The Channel Scan test mea
sures the carrier levels or channel power of all channels in the currently
enabled channel plan. You may set the starting and ending channels to adjust
the range of channels displayed. The channel tests are described in Chapters
5, 6, and 7.
-
3–10

Getting Started: The Test Display
Test Selectors and Status Button
Spectrum Analyzer
The Spectrum Analyzer measures response over all or a portion of the spectrum, and provides controls for setting RBW and VBW, detector trigger, and
the range of measurement. This test is described in
Chapter 4.
Sweep
When you touch the Sweep button, two choices appear:
Touch Forward or Return to measure the frequency response of the forward
and return paths, respectively. Both tests require a Sunrise CaLan 3010H
Sweep/Ingress Analyzer installed at the headend. The Forward Sweep test
will also work with a CaLan 1777 Integrated Sweep Transmitter. These tests
are described in
Chapter 8, Sweep and Return Spectrum Tests.
Return Spectrum
This test requires a Sunrise CaLan 3010H Sweep/Ingress Analyzer installed
at the headend. The test displays the spectrum response measured by the
3010H. This test is described in
Chapter 8, Sweep and Return Spectrum Tests.
Status button
Pressing this button once displays the status panel. The control tabs collapse
to a single line and the marker buttons move downward:
Status panel
The measurement configuration for the current test appears in the resulting
space. The information displayed depends on the test; the status panel for the
single-channel level measurement is shown.
To close the status panel and restore the original view, touch the status button
again, or touch a control tab.
3–11
Getting Started: The Test Display
Data display
Data display
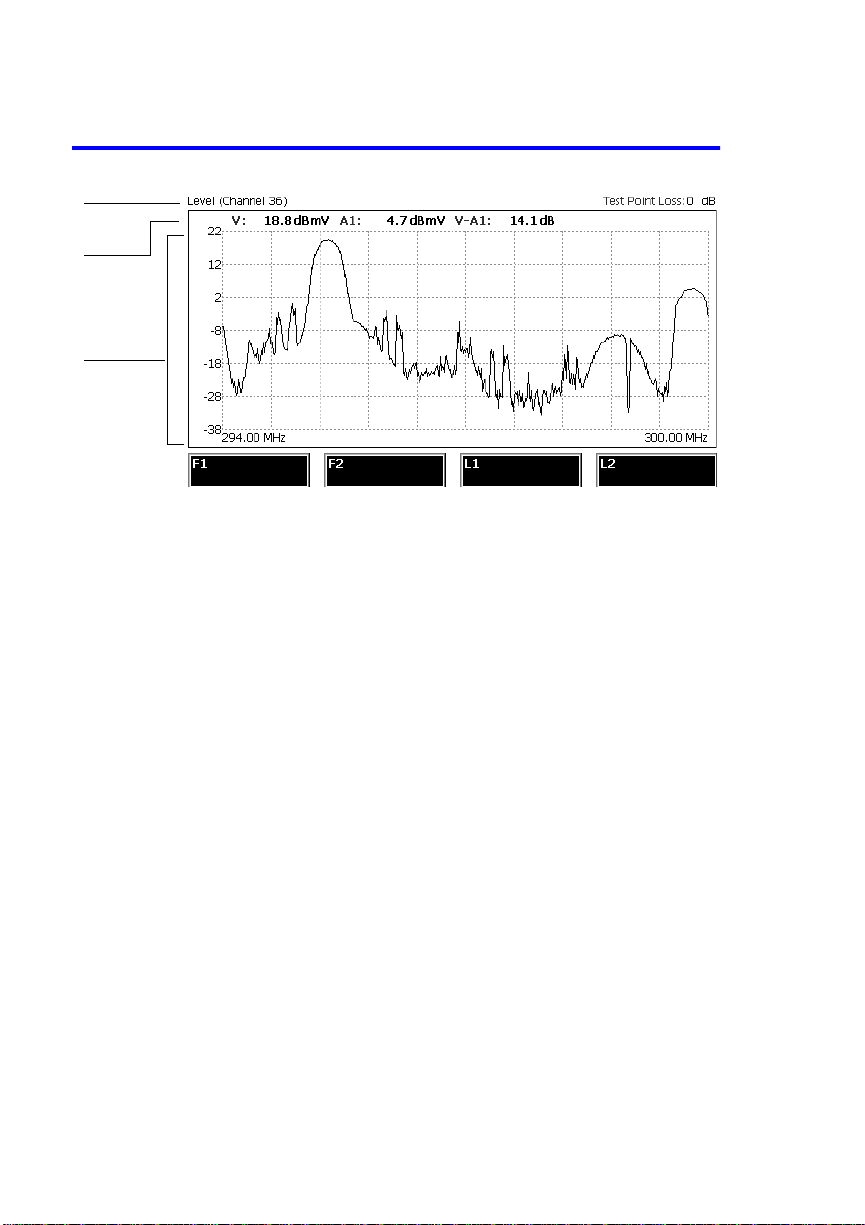
Title line
Results
area
Graphical
Display
The title line
The test or type of measurement is shown at the left. For a single channel test,
as in the illustration above, the type of measurement (examples: Level, CCN,
Constellation) is followed by the channel number in parentheses. For the
other tests, the title will read Multi Channel, Channel Scan, Spectrum
Analyzer, Forward or Reverse Sweep, or Return Spectrum.
The current setting of the Test Point Loss step control is shown at the right of
the title line. If a test-point file is enabled, its name appears at the right, with
its preset test-point loss in parentheses.
The results area
Where applicable, calculated measurement results are shown here, directly
below the title line. Examples include visual carrier level, CCN, hum percentage (for single-channel tests); design frequency levels (forward sweep test).
The graphic display
The information shown in the main part of the data display depends on the
measurement being made. Examples: Spectrum response of the channel, QAM
constellation, time-domain distortion response, forward sweep.
3–12

Getting Started: The Test Display
Markers
Markers
Two p airs of markers, one horizontal and one vertical, accompany most test
displays, as in this single-channel test:
L1
L2
F1
The first marker of each pair is a solid line, the second a dashed line. Markers
can be placed at any point on the display grid. The vertical markers, here F1
and F2, show the signal levels at the frequencies where they appear. The hori
zontal markers, L1 and L2, provide reference levels for interpreting the trace.
Markers in other tests will have different uses; please refer to the test descriptions for their functions.
F2
Active-marker selectors
When you first turn on the Network Profiler, you won’t see any markers, and
the active marker selector buttons will be blank. To display a marker and
make it active, touch its button; the button will turn yellow, and you will a yellow line will appear at a predefined position (see the test descriptions in Chapters 4-8 for specifics). At the same time, the pertinent data for that marker
appear on the button.
You c a n now move this active marker, either by touching the screen at the
desired location, or by pressing the arrow keys on the keypad. When you touch
the screen, the active marker moves instantly to that position. In general,
touch the screen to make a rough placement, then use the keys to fine-tune
the location. Use the left and right arrow keys to move the Frequency or Chan
nel markers, the up and down arrows to move the Level markers. If you press
3–13
-
-
Getting Started: The Test Display
Markers
and hold an arrow key, the marker will continue to move in that direction
until you release the key.
To remove a marker from the screen, first make it active, then touch it again.
The marker will disappear. The next time you activate that marker, it will
appear at its last previous location.
Marker tab controls
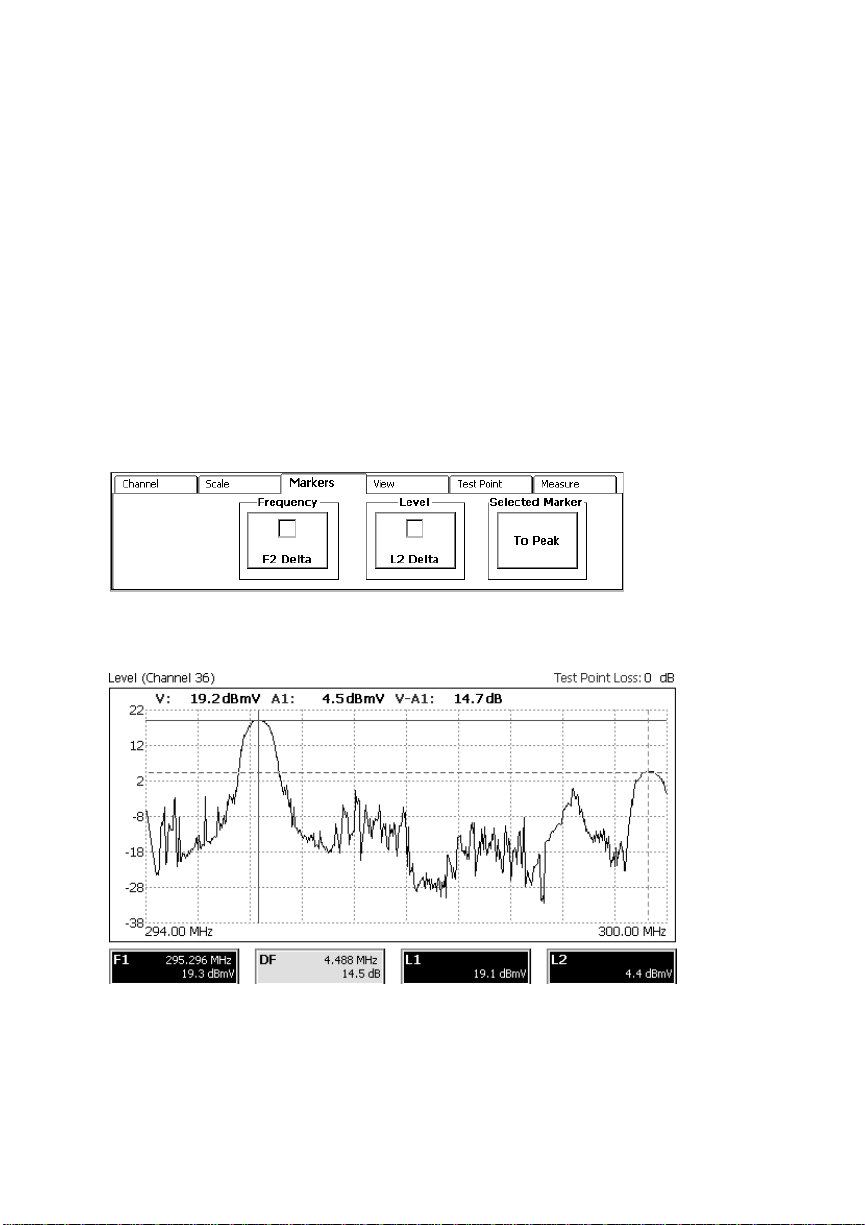
Absolute and delta settings
When first activated, the second marker of a pair (F2 and L2 in the example)
indicates the actual (absolute) value at that point on the display. You can set
the second marker (F2 and L2 in the figure) to show the “delta”, or difference
between it and the value at the first marker, as follows:
1. Touch the Marker control tab (see
Delta check boxes:
2. Touch either check box. The label on the associated marker changes to
show that the differential reading is enabled. In this example, F2 changes
to DF:
Control tabs, page
3–15) to display the
Notice that you can switch between delta and absolute indications at any
time; the marker does not have to be active.
Selected Marker to Peak
Touching this button sends the active marker to the peak level of the trace.
3–14
Getting Started: The Test Display
Control tabs
Control tabs
These panels at the bottom of the display provide controls for modifying the
measurement configuration of any test, for selecting types of measurements,
and for enabling channel plans and test points. Some control tabs vary from
test to test; their functions, summarized in the next sections, are described in
detail for each test in Chapters 4-8.
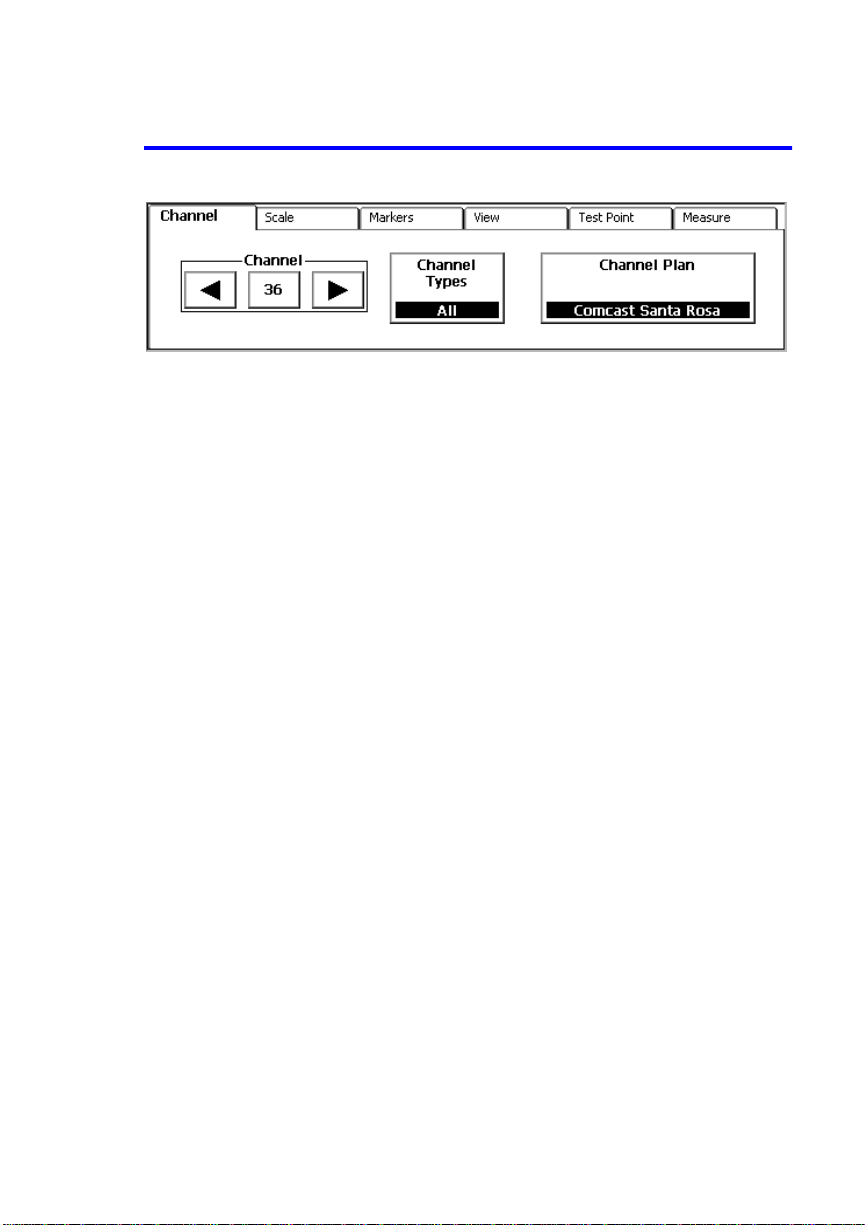
Channel
This tab, shown in the figure above, appears only when the Channel Test
group is selected. What it displays depends on the test selected:
Single-channel test:
selector
Multi-channel test:
plan selector
Channel scan test:
plan selector
Channel control, channel-type selector, channel plan
Active-bar and channel-assignment controls, channel
Starting and stopping channel-number controls, channel
Frequency
This tab appears when the Spectrum Analyzer, Sweep, or Return Spectrum
tests are selected. It contains selectors to control the frequency range of the
measurement, by setting either the start and stop frequencies or the center
and span frequencies. A center-stepping control allows you to set the incre
ment by whcih you can move the center frequency in either direction.
-
Scale
This tab provides controls for setting the vertical Full Scale reference and
scale interval of the graphical display. In the Spectrum Analyzer and Sweep
tests, the Scale tab includes a control for setting or auto-coupling the RF input
attenuator.
3–15

Getting Started: The Test Display
Control tabs
Markers
This tab, described in the previous section, contains the “delta” check boxes
and, where applicable, a To Peak button that moves the active marker to the
peak signal of the displayed trace.
View
This tab controls various visual aspects of the measurement, among them
peak hold, trace-averaging, and smoothing.
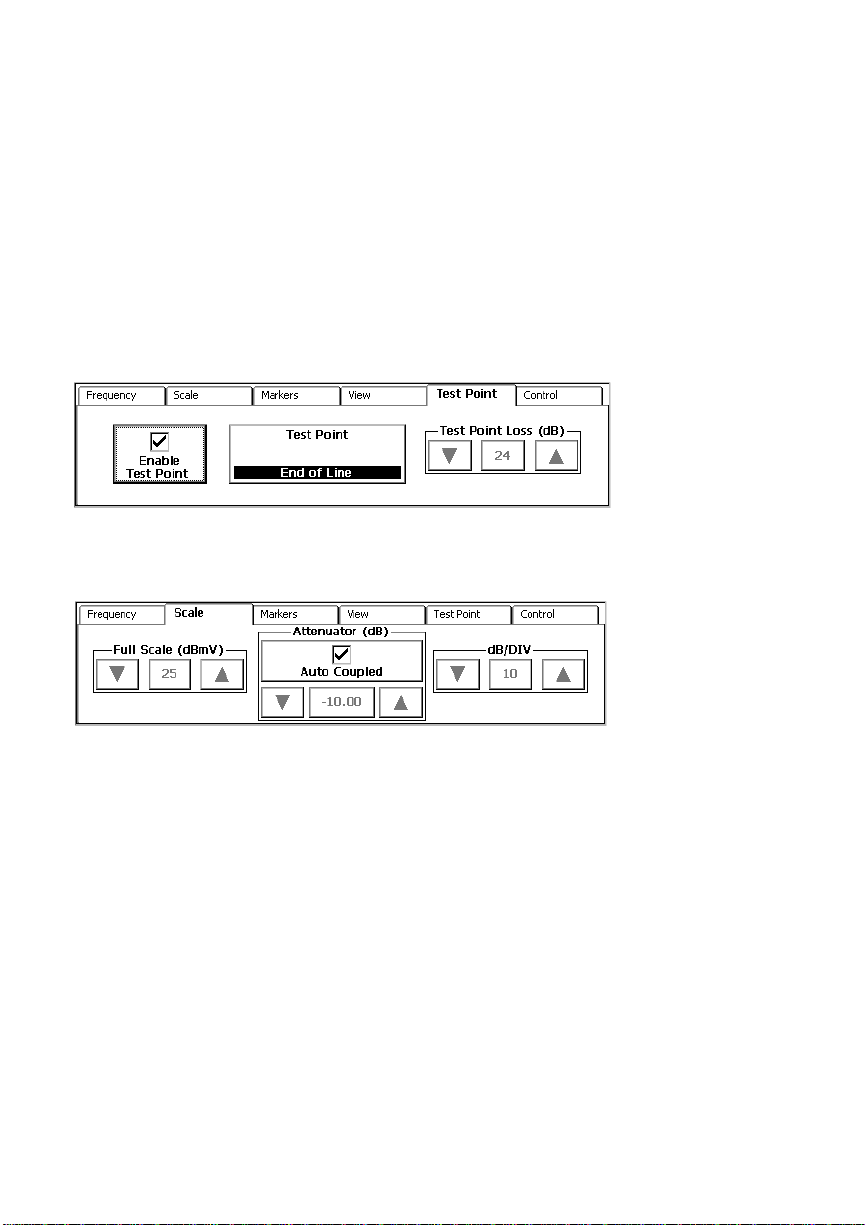
Test poi nt
This tab allows the user to set the level compensation at the test point, and to
select and enable a pre-defined test point file.
Measure
This tab appears only when the Single-Channel test is active. It contains the
buttons for selecting a measurement according to the channel type (analog or
digital). At the right on this tab are controls for making single traces, restarting a test, and gaining quick access to the channel plan so you can change test
parameters to suit the test conditions.
Control
This tab appears when the Spectrum Analyzer, Sweep, or Return Spectrum
tests are active. Its contents depend on the test:
Spectrum analyzer:
(RBW) and Video bandwidth (VBW), a selector for the type of detection, and
trigger controls for single sweep and sweep restart.
Forward sweep:
match that being transmitted), and to view and clear the sweep table.
Return sweep:
pilots, and view the sweep table.
Return spectrum:
tions pilots.
3–16
Step controls for setting the Resolution bandwidth
Buttons to set the communications pilot frequency (to
Controls to set up the forward and return communications
Controls to set up the forward and return communica-

Getting Started: The Test Display
Enabling a test point file
Enabling a test point file
A test point file is a convenient way to set up consistent measurements at a
frequently used test point. When you enable a test point file, the following val
ues are set automatically:
•the name of the test point
•the test point loss compensation in dB
•the Full Scale reference and verctical scale resolution in dB/Div (set
separately for each measurement). When auto-coupling is enabled, the
Full Scale reference also controls the RF input attenuation.
• limit-line settings and channel assignments for each bar of the
multi-channel test
•forward sweep design levels used for offset and slope compensation
•forward and return sweep peak-to-valley frequency limits
•return sweep forward pilot full scale reference
•return sweep insertion point loss and slope
To enable a test point file
1. Select the Test Point control tab.
-
3–17
Getting Started: The Test Display
Enabling a test point file
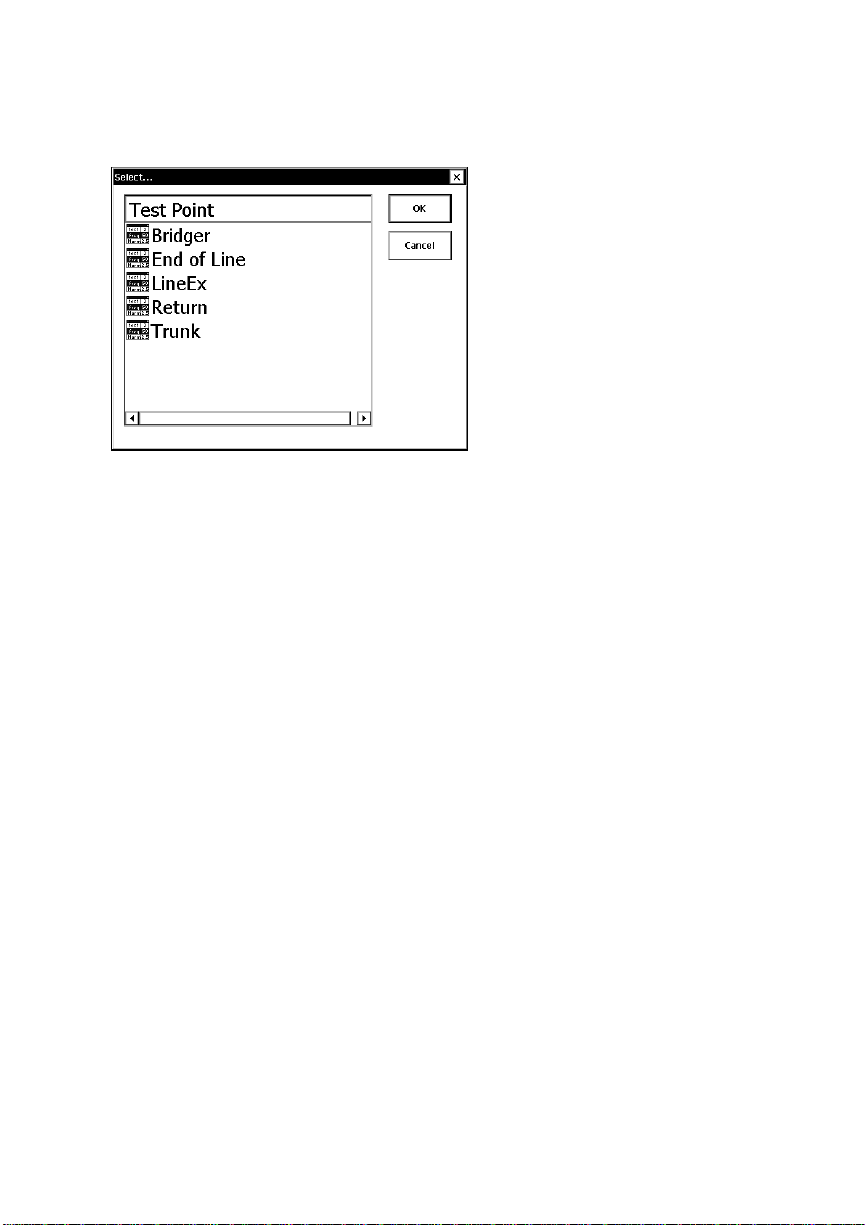
2. Touch the Test Point button to display a list of existing test point files:
3. Highlight the desired test point name, then touch OK to select it. Enable
Test Point will automatically be checked, enabling the test point. The
name appears on the Test Point button, and the loss-compensation value
on the middle button of the Test Point Loss control. The display will show
the full-scale and dB/Div values.
4. To disable the test point, touch the Enable Test Point button; the check
mark will disappear.
Creating and editing test point files are described in Chapter 10, Test points,
Locations, and Channel Plans
.
3–18

Getting Started: The Test Display
Enabling a channel plan
Enabling a channel plan
The Network Profiler comes with eight channel plans stored internally:
PAL U K
PAL I
Off-air PAL
Off-air NTSC
NTSC Standard
IRC
IRC EC
HRC
Normally, the appropriate channel plan will already be enabled; to verify this,
turn on the Network Profiler, select Channel > Single, and touch the Chan
nel tab. The name of the current plan appears on the Channel Plan button:
-
To select a different plan, touch the button to bring up a list of those available:
Touch the name of the desired plan to highlight it, then OK to enable it.
3–19

Getting Started: The Test Display
When you have to start over
When you have to start over
In normal use, stopping the Network Profiler means pressing the Suspend
button at the bottom of the keypad:
All your settings remain in active memory, so that when you press the Suspend button again, you can return to the exact point at which you left off.
There are times, however, when you will want to restore your instrument to a
known state, in which one or more sets of parameters are reset to their default
values. This can be as mild as restoring default measurement settings, or as
drastic as doing a “hard reset”. The following sections describe the results of
various ways to return the Network Profiler to an earlier known state.
Preset
When you first start the Network Profiler, the mea s urement controls have the
following default values:
Control Default setting
Channel Type All
Full Scale 25 dBmV
db/Div 10
Marker deltas disabled
Peak Hold disabled
Number of Averages Off; 10
Test Point Enable disabled
Test Point Loss 0 dB
Measurement Level (analog), Power (digital)
Single disabled
Aural Offsets off; 0 dB
3–20

Getting Started: The Test Display
When you have to start over
Control Default setting
Start and Stop frequencies 10 MHz, 100 MHz
Center and Span frequencies 55 MHz, 90 MHz
Attenuator Auto-coupled on; 10 dB
Detector Positive
RBW Auto on; 300 KHz
VBW Auto on; 300 KHz
In the course of making measurements, you are likely to change several of
these. If you then want to start a new set of tests using the default values,
touch the red Preset button in the upper right corner of the screen. All the
measurements listed above will revert to their default values, while leaving
all other settings (markers, channel plan, location file, channel assignments)
as they were. The Network Profiler returns to the single-channel test (a digi
tal channel returns to the average-power measurement). Test results, screen
captures, channel plans and test point assignments are unaffected, though the
test point is disabled.
-
Restarting the Network Profiler application
To reset all controls and most other parameters, exit and restart the Network
Profiler as follows:
1. Select Files > Exit.
2. Double-tap the N1776A icon on the Windows CE desktop:
or
From the Windows CE Start menu, select Programs
Telecom > N1776A.
> Sunrise
3–21

Getting Started: The Test Display
When you have to start over
When the Network Profiler restarts, the measurement controls return to
default values as listed above. The following user controls are also reset:
Control Default setting
Test Single channel
Channel lowest channel in the channel plan
Markers off
Test Point None
Multi-channel bars, each lowest channel in the channel plan
Channel-scan Start and Stop lowest channel in the channel plan
Test results and location data already in memory are not affected, and remain
available to the restarted session.
Rebooting WindowsCE (Soft Restart)
Because the Network Profiler gives you full access to the WindowsCE operating system, you have the flexibility not only to manage files, but also to install
applications unrelated to the Network Profiler or other software supplied by
Sunrise Telecom Broadband. As with any computer operating system, such
“third-party” applications can cause problems with the stability of Win
dowsCE, which could make it necessary to reboot WindowsCE.
-
Note: Sunrise Telecom Broadband cannot guarantee the performance of third-party
applications running on the Network Profiler.
If WindowsCE becomes unstable, do a “soft restart”. This reboots WindowsCE
but does not erase any data or user-installed programs stored in RAM.
1. Press the blue button on the keypad to bring up the Start menu.
2. Select Start > Run to display the program list box:
3. Press the keypad down arrow until the program “\Windows\restart.exe”
3–22

Getting Started: The Test Display
When you have to start over
appears:
4. Touch OK. WindowsCE will reboot to the desktop. To restart the Network
Profiler, double-click the N1776A icon.
Doing a Hard Reset
This is more drastic than simply rebooting Windows CE. Everything described
in the previous two sections takes place, but any data in active memory will be
lost. If possible, you should back up your data by selecting Files > Backup
All before doing a hard reset.
On the top of the Network Profiler, to the right of the PC Card slot, is a small
hole. Carefully insert a push pin or the end of a paper clip into this hole until
it stops, then withdraw it. The screen will go dark, and after a few seconds you
will see the Windows CE startup screen asking if you want to set the date and
time. Go to
Any results files in the “My Documents” folder will be lost after a hard reset.
You c a n recover previously saved data in several ways:
•To recover data backed up to the FlashFx disk, select Restore All from
the Network Profiler’s Files menu.
•To recover the last set of files backed up to a PC Card, follow the
procedure described in
•To restore files synchronized with a computer, follow the procedures
described in
Restarting Windows CE, page
Using a PC Card, page
Synchronizing files, page
11–10 , and follow the steps shown.
9–11.
9–15.
3–23

Getting Started: The Test Display
When you have to start over
3–24

Setting up the test 4–2
Detector, Bandwidth, and Trigger controls 4–5
Other test controls 4–7
A Note on Averaging 4–10
4
The Spectrum
Analyzer
4–1
The Spectrum Analyzer
Setting up the test
Setting up the test
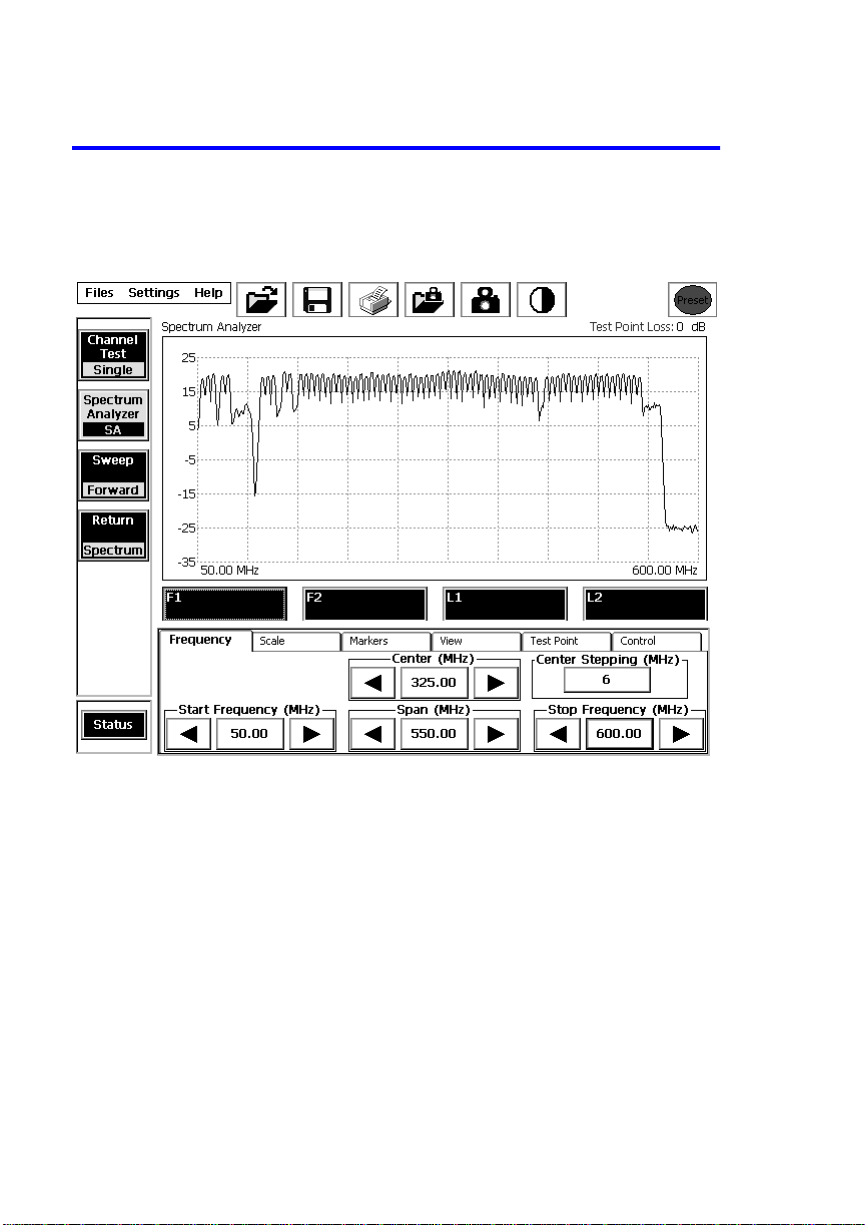
The Spectrum Analyzer shows a continuous trace of the RF spectrum between
the selected start and stop frequencies. To begin testing, touch the Spectrum
Analyzer selector:
Setting the frequency range
Select the Frequency tab, as shown in the figure above, then set the frequency range in one of the following ways:
•Set the range boundaries using the Start and Stop controls. Either
control may be set to any frequency between 0 and 1100 MHz.
or
•Set the center frequency and width of the sweep using the Center and
Span controls. Either may be set to a value between 0 and 1100 MHz.
When you change any of the four frequencies, the others automatically adjust.
Note: The range of either the Start or the Stop control is limited by the setting of the other;
if, for example, you set Start to 50 MHz you cannot set Stop below that value.
4–2

The Spectrum Analyzer
Setting up the test
Center Stepping
This button sets the interval by which the frequency changes when you touch
either arrow on the Center step control. For example, if the center frequency is
100 MHz and Center Stepping is set to 6 MHz, touching the Center right
arrow changes the frequency to 106 MHz, 112 MHz, and so on. Likewise,
touching the left arrow decreases the center frequency by 6 MHz. The step
ping frequency can be set between 1 and 100 MHz. The stepping control
makes it easy to move along the spectrum using only the center step control
arrows.
-
Using the Frequency controls
You c a n use the range controls to concentrate on either the analog or digital
portions of the spectrum, or to take measurements at zero span, as in the following examples:
Example 1: Analog channels
In this example, the range is 162-426 MHz, which contains only analog channels.
4–3

The Spectrum Analyzer
Setting up the test
Example 2: Digital channels
In this example, the range is 550-600 MHz, which includes only digital channels.
You c a n use the center-stepping control to quickly view adjacent channels
without having to set up the single-channel test:
Example 3: Channel-by-channel display
Because NTSC channels are 6 MHz wide, set the Center Stepping control to
6 MHz. Then set the start and stop frequencies to those of any channel. To
move from one channel to the next, just touch the right or left arrows on the
Center step control.
Using a test point file
To enable a test point file:
1. Select the Test Point tab;
2. touch the Test Point button to display the file list;
3. highlight a filename, then touch OK to select it; Enable Test Point will
automatically be checked, enabling the test point.
Enabling a test point file, page
See
4–4
3–17 for more information.
The Spectrum Analyzer
Detector, Bandwidth, and Trigger controls
Detector, Bandwidth, and Trigger controls
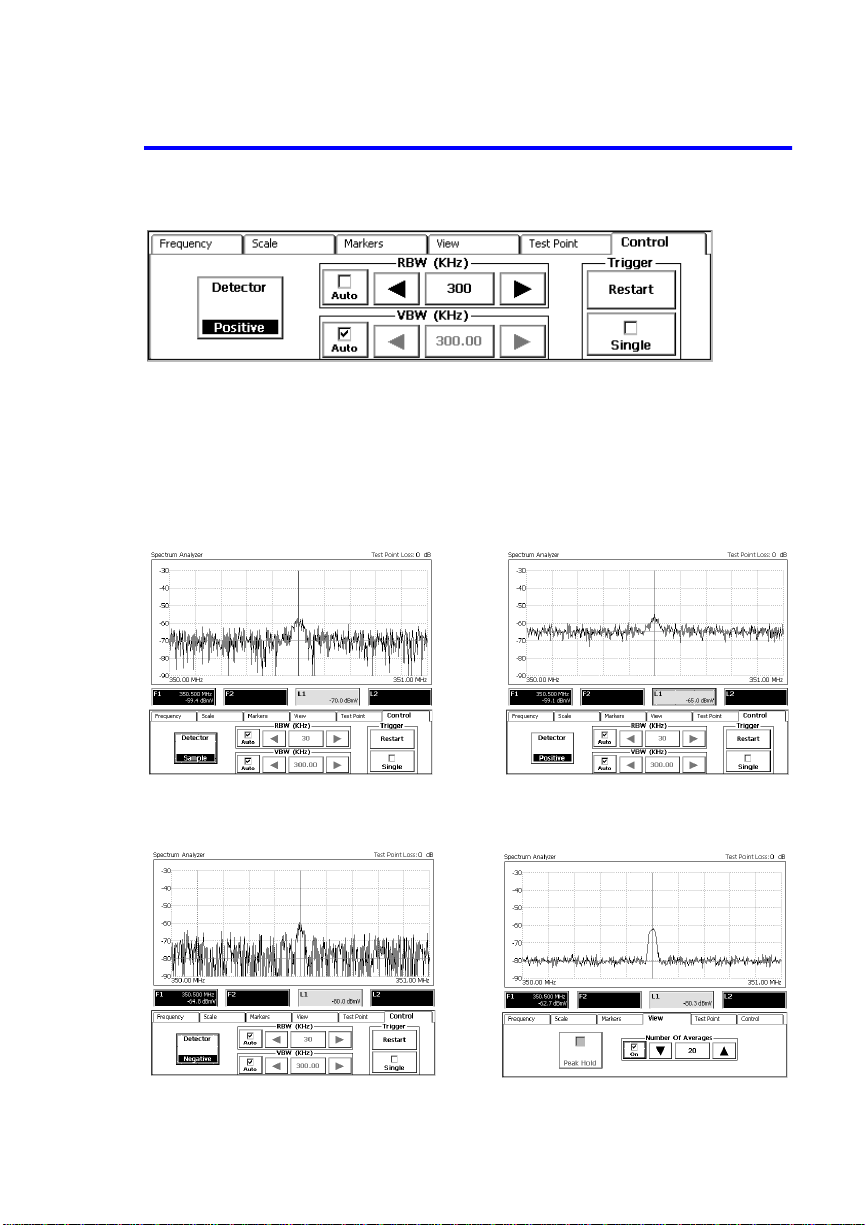
To use these measurement controls, select the Control tab:
Detector
The IF video detector can be set to one of three modes: Sample, Positive, or
Negative. Sample takes a random sample of each displayed data point. The
Positive and Negative peak detectors capture the positive or negative peak
of the signal over a pre-defined period of time. The following examples demon
strate the impact of using the different detectors when measuring a beat in
the noise floor:
-
Detector in Sample mode Detector in Positive mode
Detector in Negative mode
Negative mode with averaging
4–5

The Spectrum Analyzer
Detector, Bandwidth, and Trigger controls
Sample is used to make noise-like measurements. Positive is used for nor
mal analog level measurements. Negative is used for displaying low level sig-
nals in the presence of noise.
-
Bandwidth
These controls set the analyzer’s IF resolution bandwidth (RBW) and video
bandwidth (VBW). When you first use the Spectrum Analyzer, the controls are
set to Auto (as shown by the checked boxes next to the controls), to ensure
optimum sweep time and to minimize measurement errors; the controls are
disabled. To enable a bandwidth control, touch the Auto box next to it, then
set the bandwidth manually using the control.
Resolution Bandwidth (RBW):
one of four values: 30, 100, 300, and 3000 kHz.
Video Bandwidth (VBW):
values, depending on the Resolution Bandwidth. For RBW < 3000kHz, VBW
can be set to .01 or 300 kHz. At RBW=3000 kHz, VBW can be set to .01 or 1000
kHz.
You c a n set the Resolution Bandwidth to
You c a n set the Video Bandwidth to one of two
Trigger
To enable a single trace, touch the Single check box. Touch the Restart button for each successive trace. If averaging is enabled, the Network Profiler will
average the results of successive sweeps to produce the final trace.
4–6

Other test controls
The Spectrum Analyzer
Other test controls
Averaging: View tab. If Peak Hold is enabled, uncheck it, then touch the On check box
under Number of Averages. Use the Number of Averages step control to
set the number of trace results to be averaged. The allowable range is 1-100.
Peak hold:
View tab; if the On box is checked, touch it to disable averaging, then touch
Peak Hold. To restore the normal sweep, uncheck Peak Hold. To clear the
current peaks but continue the Peak Hold function, touch Restart on the
Control tab.
Markers:
and L2;
The Spectrum Analyzer’s Markers tab contains three additional controls: F1
Audio, a volume control slider, and To Peak.
To average the results of successive displayed traces, select the
To capture and hold peak values of successive traces, select the
At any time, you may activate and position the markers F1, F2, L1,
Markers, page
see
3–13, for instructions.
Volu me con trol slider
F1 Audio is a check box; if you check it to enable the control, you will hear the
demodulated audio signal present at the F1 marker’s location. Use the slider
to adjust the sound level. You can do this one of two ways:
1. Touch the slider bar to the right or left of the indicator to move it in that
direction a fixed amount. If you hold your pointer on the screen, the slider
will continue to move until it is under the pointer.
2. For finer control, touch and hold the indicator itself (which changes color),
then “drag” it to the desired point. When you lift your pointer, the
indicator returns to its normal color.
4–7
The Spectrum Analyzer
Other test controls
Note: The spectrum trace is not updated while F1 audio is enabled. If you move the F1
marker while audio is enabled, there is a brief but detectable delay before you hear
the audio at the new location.
If you touch the To Peak button, the active marker will move to the peak
level on the spectrum. You can move any marker to the peak as long as it is
active.
Note: To change any of the following settings, you must first disable the Test Point file.
Test Point Loss: set the loss using the Test Point Loss control.
Vertical Scale and dB/Div:
interval of the vertical axis, select the Scale tab, then use the Full Scale and
dB/Div controls to set the values:
Attenuator:
ting, as indicated by the checked Auto Coupled box. This ensures an optimum displayed dynamic range, and prevents overdriving the RF input section of the Network Profiler’s receiver. To set the attenuator manually, touch the Auto-coupled check box; the check will disappear, and the Attenuator control will be enabled.
To set the test-point loss, select the Test Point tab, then
To set the full-scale reference level and grid
Normally, the internal attenuator is coupled to the full-scale set-
4–8

The Spectrum Analyzer
Other test controls
Status panel – spectrum analyzer
You c a n see the following information at any time by touching the Status button:
•RF input attenuator setting
•State of Peak-hold and Averaging controls
•Resolution and Video bandwidths
•Video detector setting
4–9

The Spectrum Analyzer
A Note on Averaging
A Note on Averaging
When Averaging is selected for a test, the Network Profiler calculates the
average of measurement results of the N preceding traces, where N is the
number set by the Number of Averages step control on the View control
tab.
When Averaging is first enabled, the results of successive sweeps are averaged
according to the following formula:
M
−
A
=
A
M
where
A
= new average value
AVG
A
= average value from previous measurement
M-1
A
= current measured value
M
M = number of current sweep
M increases by 1 with each successive calculation, until M=N, at which point
M remains at that value, so that subsequent calculations include the current
and preceding N-1 sweeps, thus generating a weighted rolling average.
If N or any other measurement parameter (for example center span, full scale,
or test point loss) is changed, M resets to zero (it is incremented to 1 before the
calculation is made), and a new average is accumulated.
11
+
−
1
A
MMAVG
M
4–10

5
Setting up the tests 5–2
Signal levels 5–6
Composite Second Order (CSO), Discrete Frequency Interference (DFI) 5–7
Composite Triple Beat (CTB) 5–14
Carrier-to-Composite Noise (CCN) 5–20
Hum 5–27
Single-Channel
Tes ts: Analog
5–1

Single-Channel Tests: Analog
Setting up the tests
Setting up the tests
There are five analog single-channel measurements:
•Visual and aural carrier levels of a channel, using the peak detector dwell
times specified in the active channel plan.
•Composite Second-Order (CSO) and Discrete Frequency Interference
(DFI)
•Composite Triple Beat (CTB)
•Carrier-to-Composite Noise (CCN)
•Hum and low-frequency disturbance (HUM)
The following procedures apply to all these measurements.
1. Select Channel Test > Single to show the single-channel test screen:
2. Select the Channel tab. Check that the correct channel plan is enabled. If
not, touch Channel Plan, and select the appropriate plan from the list.
Enabling a channel plan, page
See
3–19, for more detailed instructions.
5–2

Single-Channel Tests: Analog
Setting up the tests
3. If you wish, select Channel Types > Analog only to skip over digital
channels:
4. Use the Channel step control to select the channel you want to test. The
arrows step up or down through the channels in the current plan. To
move to a non-adjacent channel, touch the middle button, enter the
channel number (as defined in the channel plan) in the text box of the
displayed keyboard, then touch Enter. The new channel’s number will
appear on the middle button of the control.
To see a single trace instead of a continuous scan, select the Measure tab,
then touch the Single check box:
Using a test point file
To enable a test point file:
1. Select the Test Point tab;
2. touch the Test Point button to display the file list;
3. highlight a filename, then touch OK to select it; Enable Test Point will
automatically be checked, enabling the test point.
For more information, see
Enabling a test point file, page
3–17.
Using the Channel Plan Quick-Edit
The Quick Edit Channel... button on the Measure tab takes you directly to
the channel-plan data for the current channel, so that you can change settings
quickly. For example, to turn the CSO video gate off, touch the Quick Edit
5–3

Single-Channel Tests: Analog
Setting up the tests
Channel... button. Scroll down the resulting list box until the line CSO
Video Gate appears:
To change the setting, touch anywhere on that line to highlight it and display
the list box at the bottom of the screen:
Touch the list box arrow and select Off, then OK to make the change and
return to your test.
For more detailed information on editing channel plans, see
page 10–11.
Channel plans,
5–4

Other controls
Single-Channel Tests: Analog
Setting up the tests
Averaging:
View tab, then touch the On check box. Use the Number of Averages step
control to set the number of measurements to be averaged. The allowable
range is 1-100.
A Note on Averaging, page
See
Peak hold:
Peak Hold check box. Note that averaging is disabled when Peak Hold is
activated. To restore the normal scan, uncheck Peak Hold. To clear the cur rent peaks but continue the Peak Hold function, touch Restart on the Mea
sure tab.
Markers:
any time;
When you first activate them, markers F1 and F2 will appear at the visual
and aural carrier frequencies, respectively.
Note: To change any of the following settings, you must first disable the Test Point file.
Test Point Loss:
Point Loss control.
To average the results of several successive traces, select the
4–10, for more information.
To capture and hold peak values, select View, then touch the
You m a y ac t i v ate and position the markers F1, F2, L1, and L2 at
Markers, page
see
Select the Test Point tab, then set the loss using the Test
3–13, for instructions.
-
-
Vertical scale and grid interval:
grid interval of the vertical axis, select Scale, then use the Full Scale and
dB/Div controls to set the values.
To enable auto-scaling, touch the Auto check box. The Network Profiler will
set the appropriate scale automatically.
To set the full-scale reference point and
5–5

Single-Channel Tests: Analog
Signal levels
Signal levels
On the Control tab, touch Level. The display shows the spectrum analyzer
response of the channel between its lower and upper frequencies. The visual
and aural carrier peak levels and the difference between them are reported in
the results area:
These carrier levels are measured during the retrace, using the peak detector
dwell times defined in the channel plan.
Note: Because auto-scaling is not used in this test, the control (on the Scale tab) is
grayed out.
Status panel – level measurement
To view the settings of the following test parameters, touch the Status button:
•Currently-enabled channel plan
•RF input attenuator setting
•State of Peak-hold and Averaging controls
•Visual and aural carrier dwell times
•Resolution bandwidth (RBW) and Video Bandwidth (VBW)
5–6

Single-Channel Tests: Analog
Composite Second Order (CSO), Discrete Frequency Interference (DFI)
Noise floor correction in distortion tests
At the beginning of a distortion measurement the RF input is disconnected
using an internal relay, and the noise floor of the instrument is measured. The
level of the measured distortion beat is compared to the noise floor and a cor
rection factor applied to the result to compensate for beats near the noise
floor. The maximum correction is 4.3 dB, corresponding to a beat (in CSO and
CTB tests) or to noise (in the CCN test) 2 dB above the noise floor. When the
measured beat or noise is within 2 dB of the noise floor, the CSO or DFI value
is only approximate; it’s shown as being greater than (">") the displayed value,
to indicate that the beat or noise is too close to the instrument noise floor to
get an accurate result. You may be able to improve the dynamic range by
entering a lower Full Scale reference value (on the Scale tab).
-
Composite Second Order (CSO),
Discrete Frequency Interference (DFI)
CSO and DFI are calculated as the ratio of the rms voltage level of the visual
carrier, measured during the sync pulse, divided by the rms amplitude of the
coherent disturbance. This ratio is expressed in dBc.
CSO can be measured with the Video Gate on or off, according to the type of
channel being tested. In both cases, the visual carrier level is measured using
these settings: 300 KHz RBW, positive peak detector, and dwell time as
defined in the channel plan. The two methods differ in how they measure the
undesired signals, giving the user flexibility in optimizing measurement accu
racy, dynamic range and interference.
For best results, set up the test as follows:
1. Enable trace averaging. Touch the View tab, then the On check box. Set
Number Of Averages to at least 10 to stabilize the results.
2. If auto-scaling has not been enabled (Auto check box on the Scale tab),
set the vertical scale (Scale tab, Full Scale step control) so that the
visual carrier peak is at the top of the display (the peak may even be a
little above the top—but by no more than 5 dB).
Video Gate On
This is the preferred (non-interfering) method for measuring CSO on modulated, non-scrambled channels.
-
The Video Gate setting is defined in the channel plan; its default state is On.
You c a n check this by touching the Quick Edit Channel... button on the
5–7

Single-Channel Tests: Analog
Composite Second Order (CSO), Discrete Frequency Interference (DFI)
Measure tab. Scroll down the resulting list box until the line CSO Video
Gate appears. Verify that this is set to On. If not, edit the line as described in
Using the Channel Plan Quick-Edit, page
5–3.
Select the desired channel; the spectrum analyzer will update the trace,
search for the maximum beat, and calculate the CSO result only during the
retrace. When averaging is enabled, the trace will gradually settle:
CSO marker
(When averaging is not enabled, the CSO calculation is made continuously.)
The results area displays the following:
V:
Visual carrier level
CSO:
Value in dBc of CSO, and the frequency, at the marker
BnN:
Beat-near-Noise correction, in dB, incorporated into the result.
The vertical marker (blue in the normal display palette, red in the bright-sunlight palette) is automatically positioned at the point of greatest CSO, within
15 KHz of the frequencies defined in the channel plan.
5–8
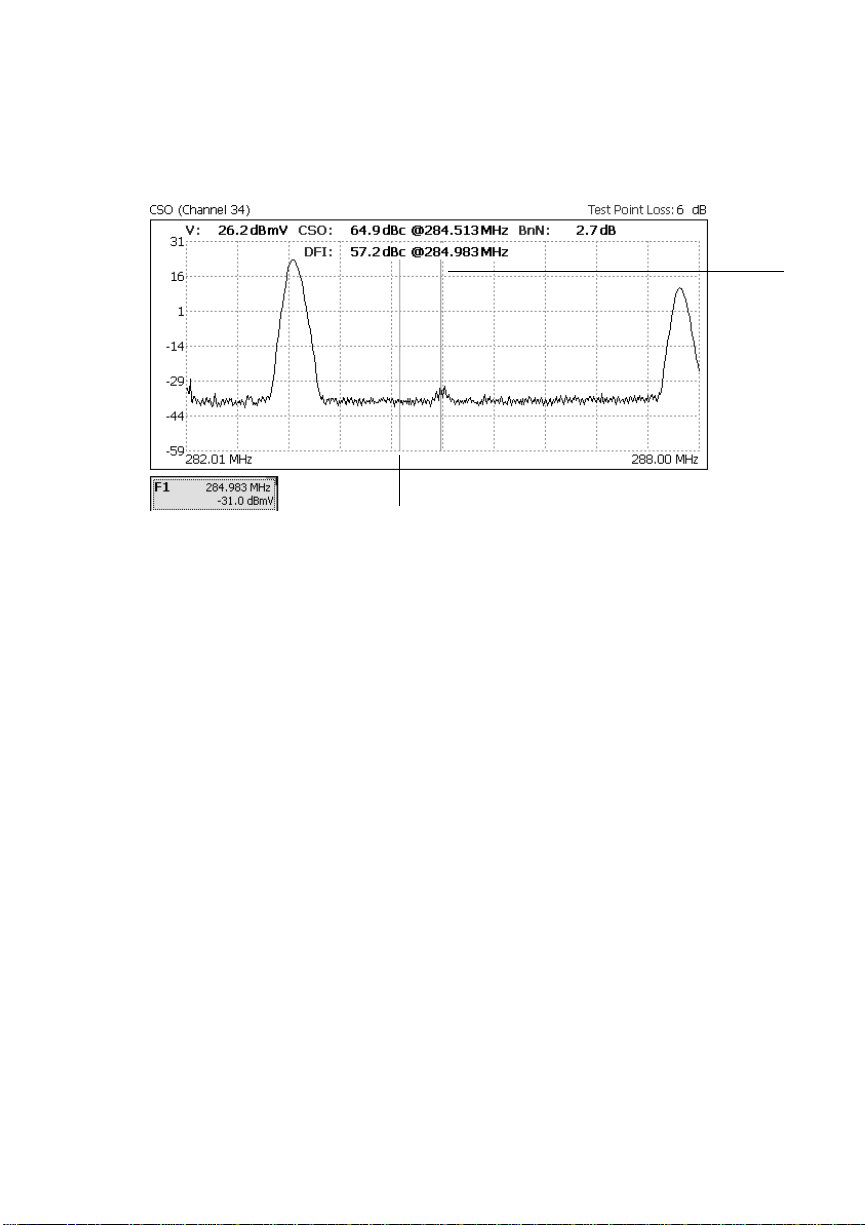
Single-Channel Tests: Analog
Composite Second Order (CSO), Discrete Frequency Interference (DFI)
Discrete Frequency Interference
To see the amount of DFI at any frequency, touch the F1 marker button:
F1 showing
DFI
CSO marker
The DFI at the marker’s location is read out at the top of the graph. You can
move the marker (yellow in normal view, blue in bright-sunlight view) in the
usual way to find the DFI at any point on the trace.
Video Gate Off
This method will produce the best dynamic range. It can be used when video
gating is not possible, and is the only method for testing a scrambled channel.
The test can be performed either in channel with the video modulation off, or
out-of-band in a quiet portion of the spectrum.
In-channel measurement
For this test, you must have an unmodulated carrier, or be able to temporarily
turn the modulation off at the headend.
1. Select the channel. If the video gate is on and the modulation is turned
off, you will see the message
Gating signal not found
2. Turn the video gate off as described in
Quick-Edit, page
will measure the visual carrier level using the peak detector dwell time
5–3. When you return to the test, the Network Profiler
Using the Channel Plan
5–9
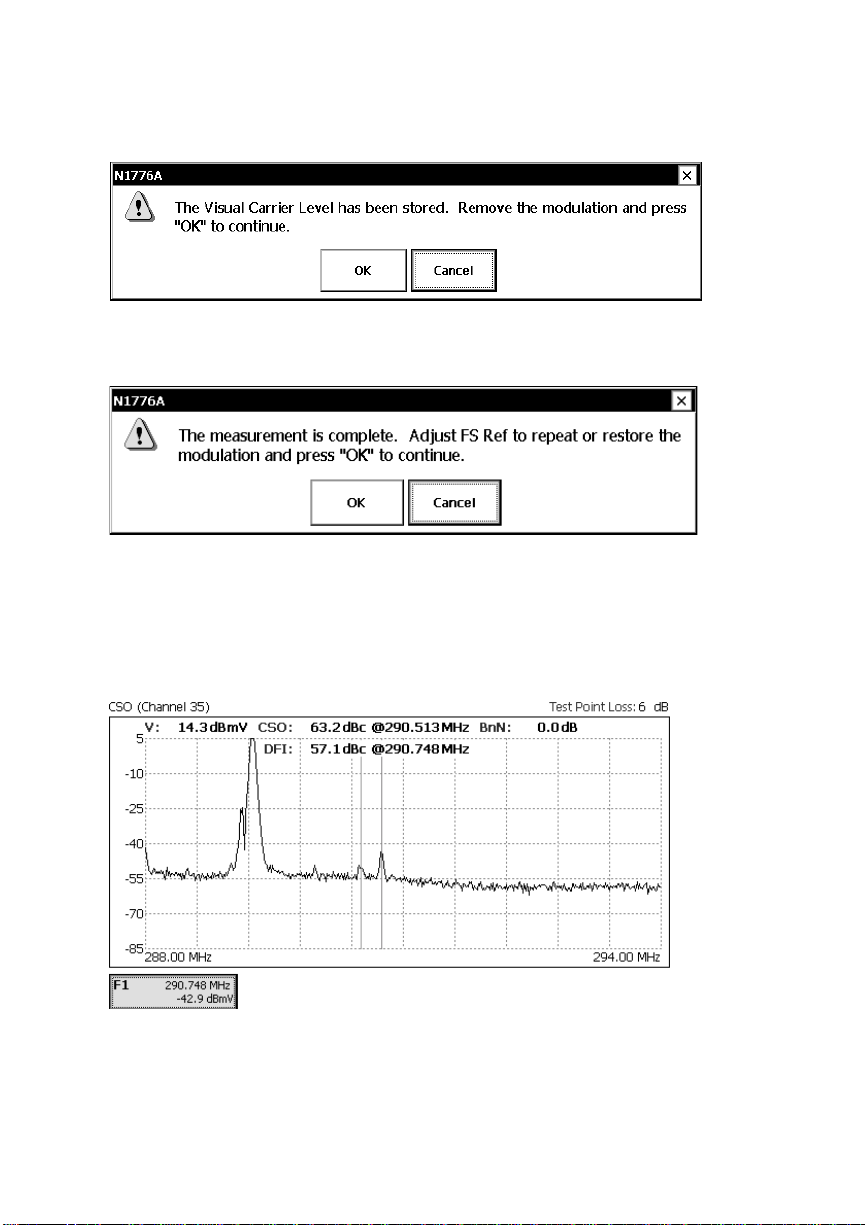
Single-Channel Tests: Analog
Composite Second Order (CSO), Discrete Frequency Interference (DFI)
defined in the channel plan, then display the following message
3. Turn the modulation off, then touch OK. The Network Profiler will run
the test for the selected number of averages, pause, then display the
message:
At this point, you may adjust the full scale reference to maximize the
dynamic range. If you do so, the Network Profiler will restart averaging.
4. When you have finished your measurements, restore the modulation,
then touch OK. The results of the test remain frozen on the screen so that
you can observe the data, save it in a test file, or make a screen capture
file:
5. Use the F1 marker to measure the level of DFI at any point.
6. Restart the measurement ny touching Restart on the Measure tab.
5–10
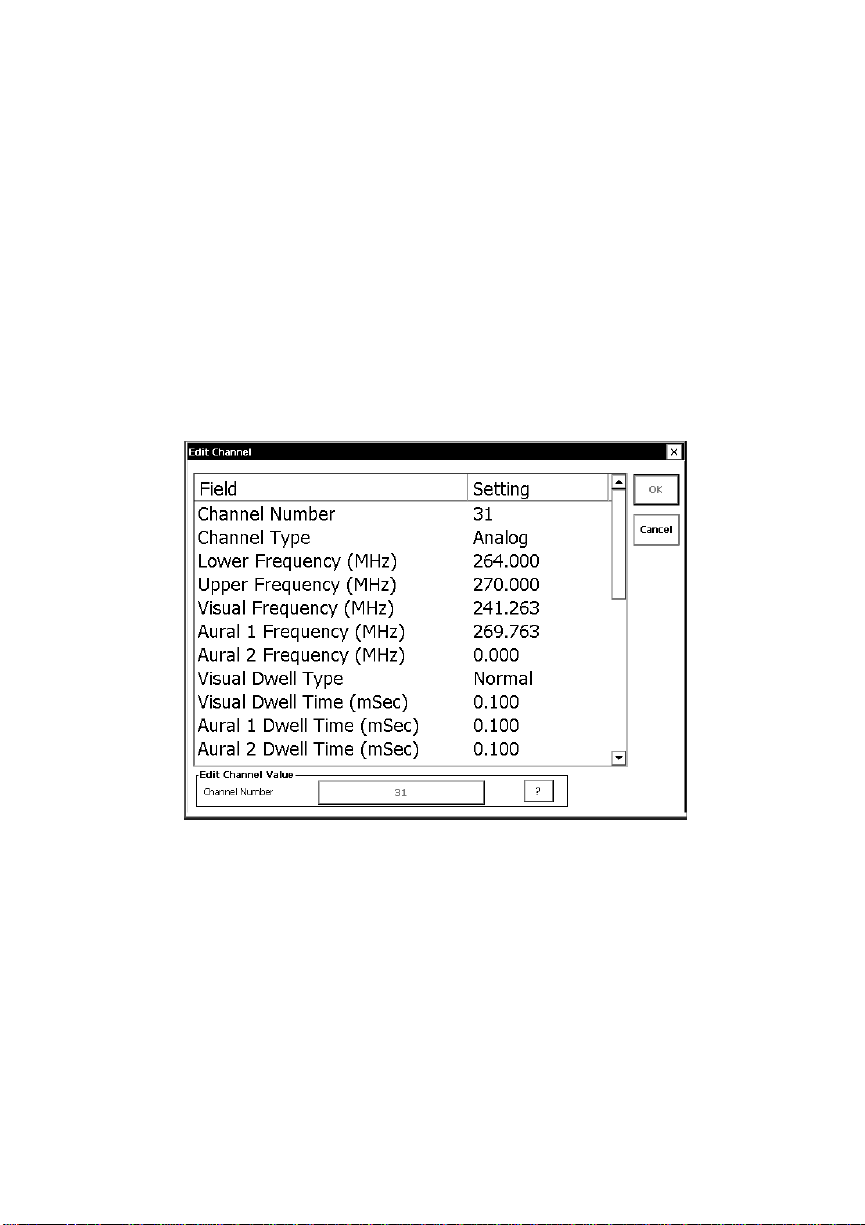
Single-Channel Tests: Analog
Composite Second Order (CSO), Discrete Frequency Interference (DFI)
Out-of-band measurement
This test measures the distortion products in a quiet part of the spectrum,
using the visual carrier from a nearby analog channel as a reference. Use this
method for a quick check of performance, or when turning off modulation is
not possible.
1. Using the Spectrum Analyzer or a copy of your channel plan, find a quiet
portion of the spectrum.
2. Select an analog reference channel not too far from the quiet portion
(adjacent is best).
3. On the Measure tab, touch Quick Edit to open the channel plan. Record
the Visual carrier frequency:
4. Close the editor.
5. On the Channel tab, select a channel in the quiet portion of the
spectrum.
6. On the Measure tab, touch Quick Edit to open the channel plan for the
quiet channel.
7. Set Visual Freq to that of the visual carrier in the reference channel.
8. Calculate an offset using this equation:
Offset = (Visual freq
quiet channel
– Visual freq
reference channel
) MHz
5–11

Single-Channel Tests: Analog
Composite Second Order (CSO), Discrete Frequency Interference (DFI)
9. Add this value to each of the quiet channel’s CSO Beat Frequency offsets
(if the quiet channel is below the reference channel, this value will be
negative).
Here’s an example using the NTSC Standard channel plan. The reference
channel is 27; the quiet channel 31. The difference between the two visual
frequencies is 265.35 – 241.25 = 24. This is your offset.
Add this offset to each of the CSO beat frequencies (all values are MHz):
CSO Beat Freq Offset 1:
CSO Beat Freq Offset 2:
CSO Beat Freq Offset 3:
CSO Beat Freq Offset 4:
–0.75 + 24.00 = 23.25
–0.75 + 24.00 = 23.25
0.75 + 24.00 = 24.75
1.25 + 24.00 = 25.25
10. Turn the video gate off as described in
Quick-Edit, page
will measure the visual carrier level using the peak detector dwell time
defined in the channel plan, then display the message
At this point, you can install a bandpass filter for the quiet channel.
11. Tou ch OK. The Network Profiler will run the test for the selected number
of averages, pause, then display the message:
You m a y no w a d j u s t the full scale reference to maximize the dynamic
range. If you do so, the Network Profiler will restart averaging.
12. When you have finished your measurements, remove the bandpass filter
if you have installed it, then touch OK. The results of the test remain
frozen on the screen so that you can observe the data, save it in a test file,
5–3. When you return to the test, the Network Profiler
Using the Channel Plan
5–12
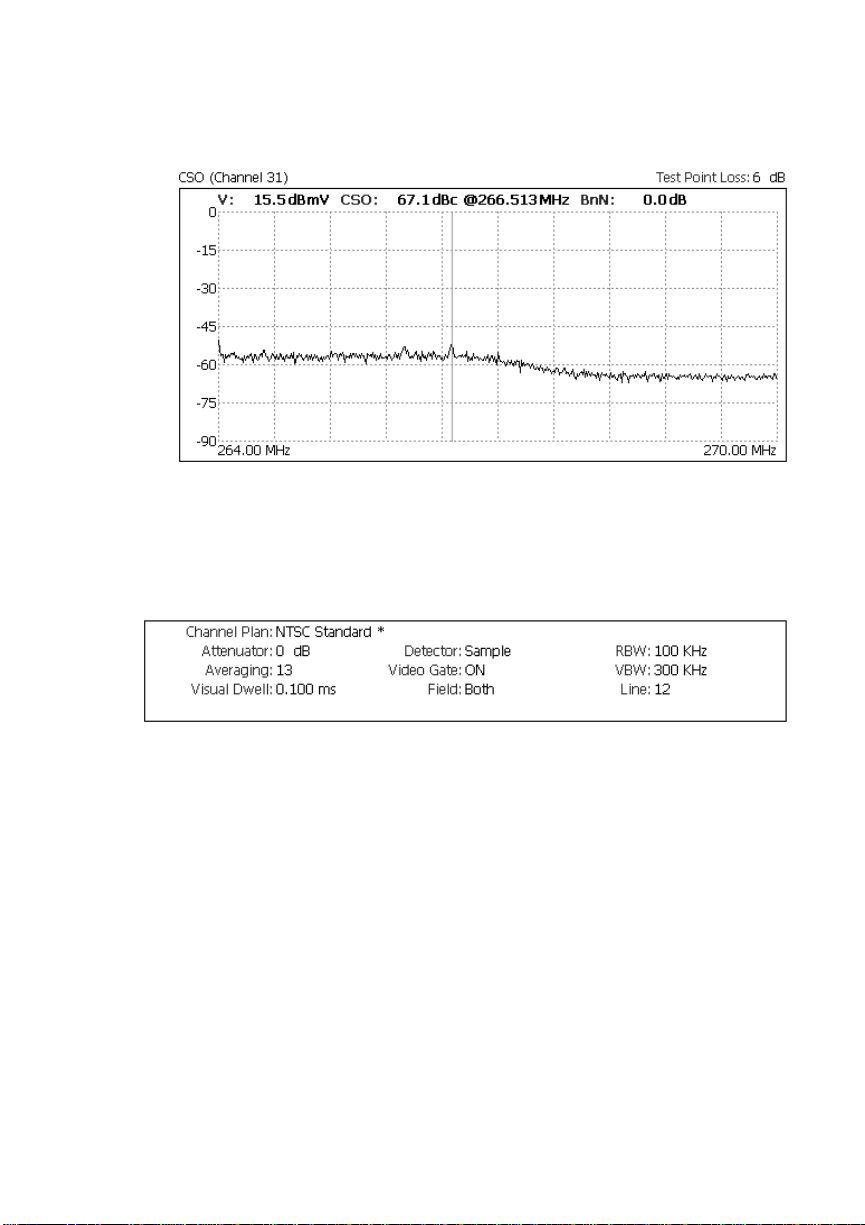
Single-Channel Tests: Analog
Composite Second Order (CSO), Discrete Frequency Interference (DFI)
or make a screen capture file:
13. Use the F1 marker to measure the level of DFI at any point.
14. Restart the measurement by touching Restart on the Measure tab.
Status panel – CSO and DFI tests
To view the settings of the following test parameters, touch the Status button:
•Currently-enabled channel plan
Note: An asterisk after the plan name indicates that data have been changed (as
when the Video Gate is turned off), but not saved.
•RF input attenuator setting
•Number of averages taken
•Detector and video gate settings
•Visual carrier dwell time
•Resolution bandwidth (RBW) and Video Bandwidth (VBW)
•Quiet Line Field (frame) used for test
•Quiet Line location
5–13

Single-Channel Tests: Analog
Composite Triple Beat (CTB)
Composite Triple Beat (CTB)
CTB is the ratio of the rms voltage level of the visual carrier, meas u r ed during
the sync pulse, divided by the rms amplitude of the coherent disturbance. This
ratio is expressed in dBc.
CTB can be measured with Synchronous on or off, according to the type of
channel being tested. In both cases, the visual carrier level is measured using
these settings: 300 KHz RBW, positive peak detector, and dwell time defined
in the channel plan. The two methods differ in how they measure the undes
ired signals, giving the user flexibility in optimizing measurement accuracy,
dynamic range and interference.
For best results, set up the test as follows:
1. Enable trace averaging. Touch the View tab, then the On check box. Set
Number Of Averages to at least 10 to stabilize the results.
2. If auto-scaling has not been enabled (Auto check box on the Scale tab),
set the vertical scale (Scale tab, Full Scale step control) so that the
visual carrier peak is at the top of the display (the peak may even be a
little above the top—but by no more than 5 dB).
-
Synchronous on
This measurement requires that an IF gate be installed at the headend to
blank the IF signal to the modulator or processor during the vertical interval.
This is the only available in-channel measurement that does not interrupt the
signal during the test.
Note: You c an find more information about IF gate signal processors at these web sites:
www.tvms.net/products/info 4200.htm (For TVMS Model 4200);
www.comsonics.com (for Comsonics Cybertek Examiner)
The Synchronous setting is defined in the channel plan; its default state is
On. You can check this by touching the Quick Edit Channel... button on the
Measure tab. Scroll down the resulting list box until the line CTB Synchro
nous appears. Verify that this is set to On. If not, edit the line as described in
Using the Channel Plan Quick-Edit, page
1. Turn the IF gate on at the headend to suppress the visual carrier during
the vertical interval.
2. Select the desired channel; the spectrum analyzer will update the trace,
search for the maximum beat, and calculate the CTB result only during
5–3.
5–14
-
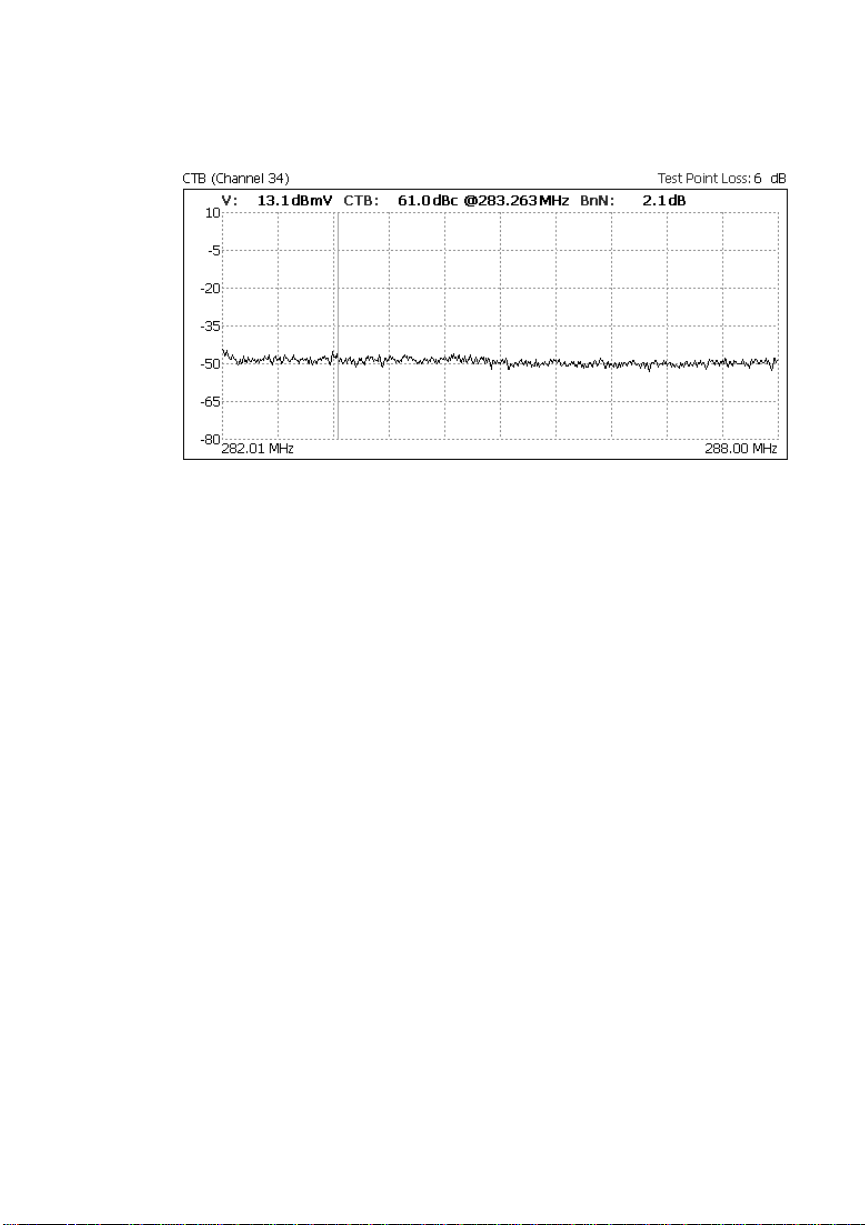
Single-Channel Tests: Analog
Composite Triple Beat (CTB)
the retrace. When averaging is enabled, the trace will gradually settle:
The results area shows
V:
Visual carrier level
CTB:
Value in dBc of CTB at the CTB Offset frequency
BnN:
Beat-near-Noise correction, in dB, incorporated into the measurement
The vertical marker (blue in the normal display palette, red in the bright-sunlight palette) is automatically positioned at the CTB offset frequency defined
in the channel plan. For most channels, this offset is 0, as in the example
above.
When averaging is enabled, the spectrum analyzer calculates the average and
refreshes the display only during the retrace.
Synchronous off
This test can be done with the visual carrier off or on; for most channels, it is
done in-channel with the carrier off.
Carrier off, in channel
For this test, you must be able to turn the visual carrier off.
1. Select the channel to be tested.
2. Touch the Quick edit button on the Measure tab to display the channel
5–15

Single-Channel Tests: Analog
Composite Triple Beat (CTB)
plan data, and scroll down until CTB Synchronous appears:
3. Touch that line to highlight it, then use the list box at the bottom to set
the value to Off:
4. Close the edit window. When you return to the test, the Network Profiler
will measure the visual carrier level using the peak detector dwell time
defined in the channel plan, then display the following message
5–16

Single-Channel Tests: Analog
Composite Triple Beat (CTB)
5. Turn the carrier off, then touch OK. The Network Profiler will run the
test for the number of averages you have specified, pause, then display
the request
At this point, you may adjust the full scale reference to maximize the
dynamic range. If you do so, the Network Profiler will restart averaging.
6. When you have finished your measurements, restore the carrier. The
results of the test are frozen on the screen so that you can observe the
data, save it in a test file, or make a screen capture file.
7. To restart the test, touch Restart on the Measure tab.
Carrier on – out-of-band
This test measures the distortion products in a quiet channel, using the visual
carrier from a nearby analog channel as a reference. Use this method for a
quick check of performance, or when turning off modulation is not possible.
1. From your channel plan, find a quiet channel with an analog channel not
far away (adjacent is best). The analog channel’s visual carrier is your
reference frequency.
2. On the Channel tab, select the quiet channel.
3. On the Measure tab, touch Quick Edit to open the channel plan for the
quiet channel. Make the following changes using the procedure described
Using the Channel Plan Quick-Edit, page
in
5–3.
Set Visual Freq to the value of the visual carrier in the reference
channel.
Set CTB Synchronous to Off.
Calculate the CTB Offset according to the location of the quiet channel
relative to the reference channel, using the equation
Offset = (Visual freq
quiet channel
– Visual freq
reference channel
) MHz
Here’s an example using the NTSC Standard channel plan. The reference
channel is 27; the quiet channel 31. The difference between the two visual
frequencies is 265.35 – 241.25 = 24. Set CTB Offset to this value.
5–17

Single-Channel Tests: Analog
Composite Triple Beat (CTB)
4. Close the Channel-plan editor. When you return to the test, the Network
Profiler will measure the visual carrier level using the peak detector
dwell time defined in the channel plan, then display the following
message
At this point, you can install a bandpass filter for the quiet channel.
5. Touch OK. The Network Profiler will run the test for the selected number
of averages, pause, then display:
You m a y no w a d j u s t the full scale reference to maximize the dynamic
range. If you do so, the Network Profiler will restart averaging.
When averaging is enabled, the spectrum analyzer calculates the average
and refreshes the display only during the retrace.
6. When you have finished your measurements, remove the bandpass filter
if you have installed it, then touch OK. The results of the test remain
frozen on the screen so that you can observe the data, save it in a test file,
5–18

Single-Channel Tests: Analog
Composite Triple Beat (CTB)
or make a screen capture file:
7. To restart the test, touch Restart on the Measure tab.
Status panel – CTB test
To view the settings of the following test parameters, touch the Status button:
•Currently-enabled channel plan
Note: An asterisk after the plan name indicates that data have been changed (as
when the Video Gate is turned off), but not saved.
•RF input attenuator setting
•Number of averages taken
•Visual carrier dwell time
•Detector setting
• RBW and VBW settings
5–19

Single-Channel Tests: Analog
Carrier-to-Composite Noise (CCN)
Carrier-to-Composite Noise (CCN)
The carrier-to-composite noise measurement is the ratio of the rms voltage
produced by the visual signal during the transmission of synchronizing pulses,
divided by the associated system composite noise power in a user-selected
noise bandwidth. This ratio is expressed in dBc.
Composite noise comprises thermal noise (CTN) and the noise-like intermodulation products created by beat products of analog and digital signals (CIN).
This combination has traditionally been called carrier-to-noise (C/N), but that
term is valid only for systems with no digital channels.
CCN can be measured with the Video Gate on or off, according to the type of
channel being tested. The two methods differ in how they measure the undes
ired signals, giving the user flexibility in optimizing measurement accuracy,
dynamic range and interference. With the gate off CCN can be measured in
channel or out-of-band.
In all tests, the visual carrier level is measured using these settings: 300 KHz
RBW, positive peak detector, and dwell time defined in the channel plan.
For best results, set up the test as follows:
-
1. Enable trace averaging. Touch the View tab, then the On check box. Set
Number Of Averages to at least 10 to stabilize the results.
2. If auto-scaling has not been enabled (Auto check box on the Scale tab),
set the vertical scale (Scale tab, Full Scale step control) so that the
visual carrier peak is at the top of the display (the peak may even be a
little above the top—but by no more than 5 dB).
Setting the noise parameters
To make an accurate CCN measurement, three channel plan parameters must
be configured properly: Noise Bandwidth, CCN measurement start offset, and
CCNmeasurement stop offset. You can set all three using the Quick Edit
Channel… function on the Measure tab.
Noise bandwidth
CCN Noise BW defines the reference video bandwidth used to calculate the
noise result. The default for this value is 4 MHz in NTSC systems and 5 MHz
in PAL systems.
5–20

CCN start and stop offsets
Single-Channel Tests: Analog
Carrier-to-Composite Noise (CCN)
CCN Meas Start Offset and CCN Meas Stop Offset define the noise mea
surement frequency range relative to the visual carrier frequency. The instrument will integrate the linear power across this frequency range after the
spectrum scan is complete and calculate the CCN result. If Video Gate is ON,
the offsets must not be set further from the visual carrier than -1.25 MHz or
+8.75 MHz.
-
Video Gate On
This is the preferred, non-interfering, method for measuring CCN on modulated, non-scrambled, channels. It measures the combined baseband signal
noise and broadband RF noise, which is what the viewer actually sees. This
test does not require modulation to be turned off
The Video Gate setting is defined in the channel plan; its default state is On.
You c a n check this by touching the Quick Edit Channel… button on the
Measure tab. Scroll down the resulting list box until the line CCN Video
Gate appears. Verify that this is set to On. If not, edit the line as described in
Using the Channel Plan Quick-Edit, page
To run the test:
1. Touch CCN on the Measure tab.
2. Select the desired channel; The Network Profiler will run the test for the
selected number of averages, at which time you will see a trace like the
following:
5–3.
When averaging is enabled, the Network Profiler updates the spectrum analyzer response and and measurement results only during retrace.
5–21

Single-Channel Tests: Analog
Carrier-to-Composite Noise (CCN)
The results area shows the values calculated for the following:
V:
Visual carrier level
CCN:
Value i n d B c o f C CN, as calculated by integrating the samples between
the CCN Measurement Start and Stop offset frequencies, which are indicated
by blue (orange in bright-sunlight display) vertical markers.
Note: It is important to visually check the displayed noise integration span for spurious
signals that can degrade the measurement. The effects of such signals can be
minimized by adjusting the CCN Measurement Start and Stop offset frequencies.
NnN:
Noise-near-Noise correction, in dB, incorporated into the measurement.
Video Gate Off
This test can be performed either in channel with the video modulation off, or
out-of-band in a quiet portion of the spectrum.
In-channel measurement
This will produce the highest absolute accuracy and the widest dynamic
range, but you must have an unmodulated carrier, or be able to temporarily
turn the carrier modulation off at the headend.
1. Turn the video gate off as described in
Quick-Edit, page
will measure the visual carrier level using the peak detector dwell time
defined in the channel plan, then display the following message:
2. Turn the video modulation off, then touch OK. The Network Profiler will
run the test for the specified number of averages, then display the
5–3. When you return to the test, the Network Profiler
Using the Channel Plan
5–22
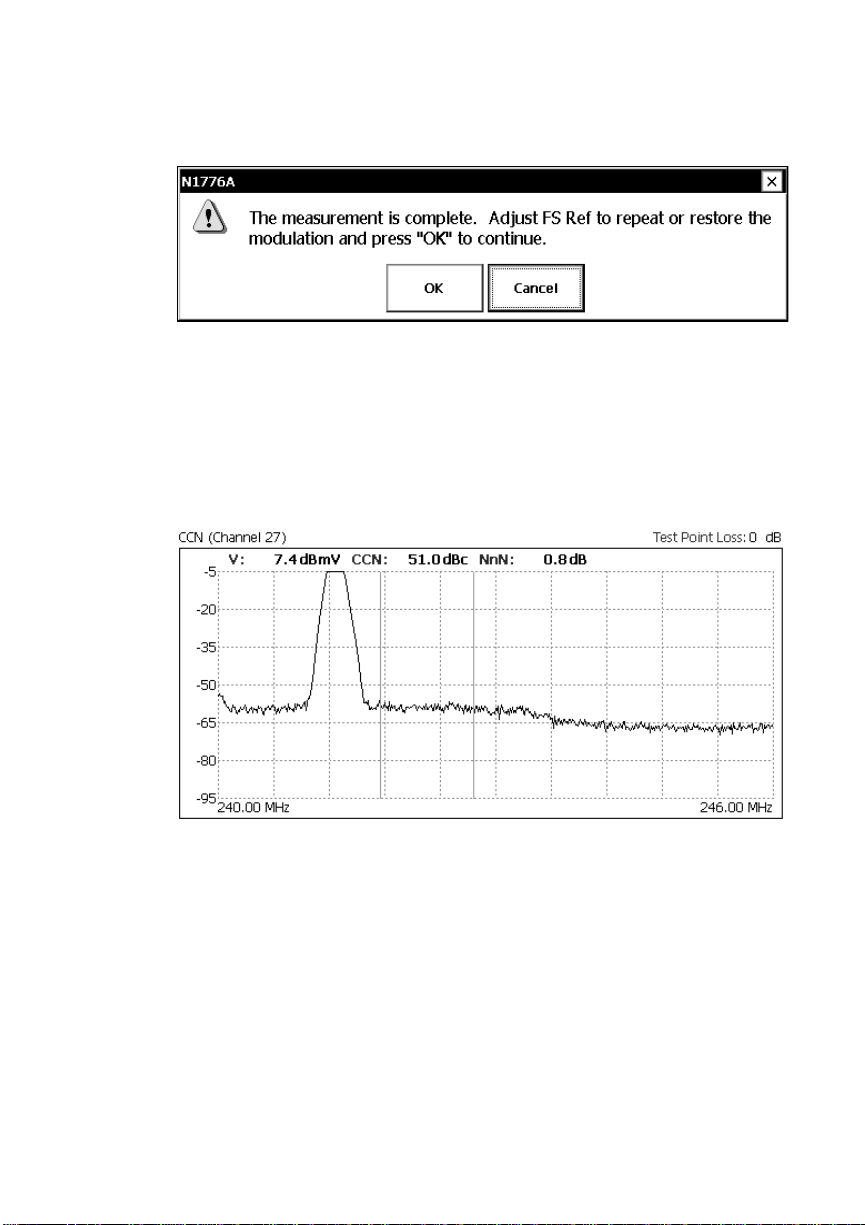
Single-Channel Tests: Analog
Carrier-to-Composite Noise (CCN)
request:
At this point, you may adjust the full scale reference to maximize the
dynamic range. If you do so, the Network Profiler will restart averaging.
When averaging is enabled, the spectrum analyzer calculates the average
and refreshes the display only during the retrace.
3. Restore the modulation, then touch OK. The results of the test remain
frozen on the screen so that you can observe the data, save it in a test file,
or make a screen capture file:
4. To restart the test, touch Restart on the Measure tab.
5–23
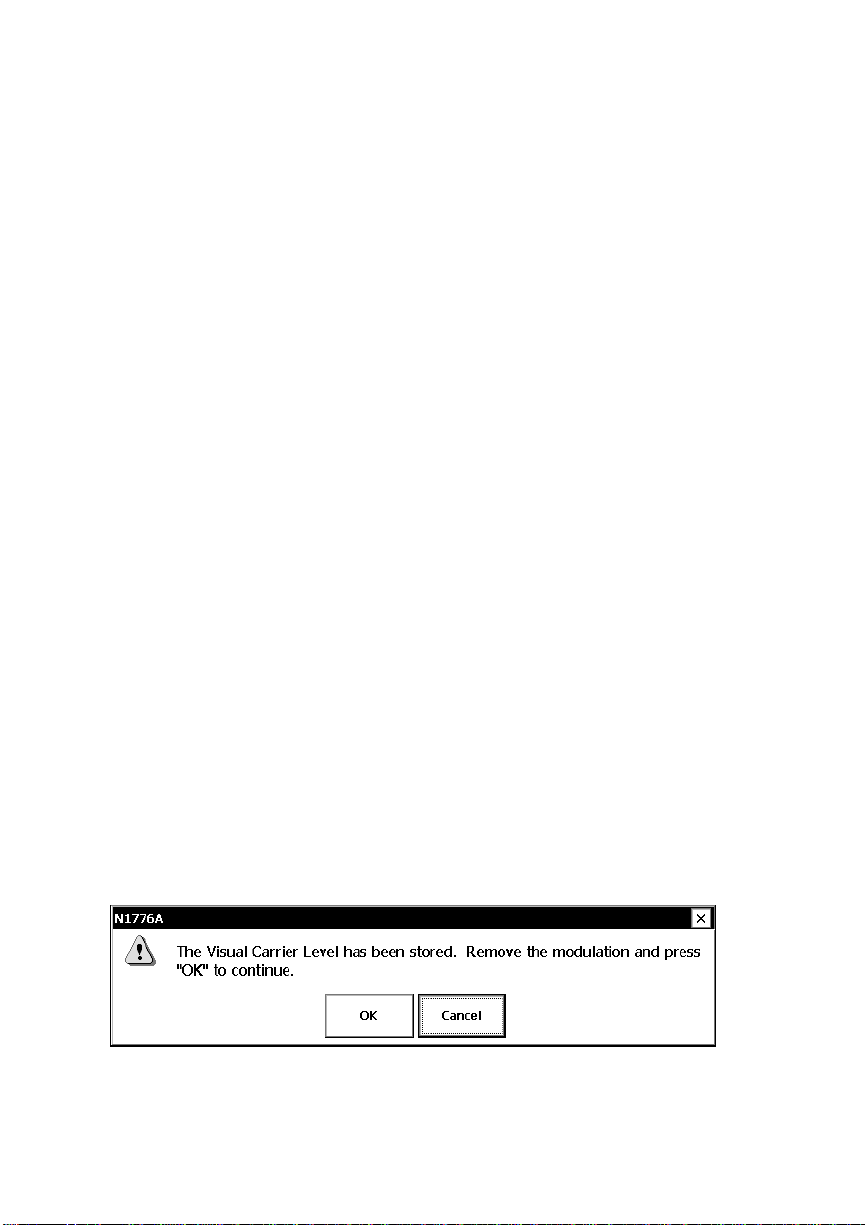
Single-Channel Tests: Analog
Carrier-to-Composite Noise (CCN)
Out-of-band measurement
This test measures the noise in a quiet part of the spectrum, using the visual
carrier from a nearby analog channel as a reference. Use this method for a
quick check of performance, or when turning off modulation is not possible.
1. From your channel plan, find a quiet channel with a modulated analog
channel not far away (adjacent is best). The analog channel’s visual
carrier frequency is your reference.
2. On the Channel tab, select the quiet channel.
3. On the Measure tab, touch Quick Edit to open the channel plan for the
quiet channel.
4. Following the steps described in
Using the Channel Plan Quick-Edit,
page 5–3, set Visual Freq to the value of the visual carrier in the
reference channel.
5. Set Video Gate to Off.
Calculate the CCN Meas Start and Stop according to the location of the
quiet channel relative to the reference channel, using the equation
Offset = (Visual freq
quiet channel
– Visual freq
reference channel
)
Add the result to the two parameters in the channel plan.
Here’s an example using the NTSC Standard channel plan. The reference
channel is 27; the quiet channel 31. The difference between the two visual
frequencies is 265.35 – 241.25 = 24. Set the two offsets as follows:
CCN Meas Start Offset (MHz): 1.0 + 24.00 = 25.00 MHz
CCN Meas Stop Offset (MHz): 3.0 + 24.00 = 27.00 MHz
6. Close the Channel-plan editor. When you return to the test, the Network
Profiler will measure the visual carrier level using the peak detector
dwell time defined in the channel plan, then display the following
message
:
At this point, you can install a bandpass filter for the quiet channel.
5–24

Single-Channel Tests: Analog
Carrier-to-Composite Noise (CCN)
7. Turn the modulation off, then touch OK. The Network Profiler will run
the test for the selected number of averages, then display the request:
You m a y no w a d j u s t the full scale reference to maximize the dynamic
range. If you do so, the Network Profiler will restart averaging. You may
also repeat the test by touching Restart on the Measure tab.
When averaging is enabled, the spectrum analyzer calculates the CCN
result and refreshes the display only during the retrace.
8. Remove the bandpass filter if you have installed it, then touch OK. The
results of the test remain frozen on the screen so that you can observe the
data, save it in a test file, or make a screen capture:
9. To restart the test, touch Restart on the Measure tab.
5–25

Single-Channel Tests: Analog
Carrier-to-Composite Noise (CCN)
Status panel – CCN test
To view the settings of the following test parameters, touch the Status button:
•Currently-enabled channel plan
Note: An asterisk after the plan name indicates that data have been changed (as
when the Video Gate is turned off), but not saved.
•RF input attenuator setting
•Number of averages taken
•Visual carrier dwell time
•Detector and video gate settings
• RBW and VBW settings
•Quiet Line Field (frame) used for test
•Quiet Line location
•Measurement range start and stop frequencies
•Noise bandwidth
5–26

Single-Channel Tests: Analog
Hum
Hum
Low frequency disturbance (“hum”) is the amplitude distortion of the signal
caused by components of the power source. The Network Profiler measures
hum as the ratio of the peak-to-peak interference to the peak level of the
desired picture carrier, and is expressed in percent.
Hum can be measured in either of two modes: Modulated or CW. The mode is
defined in the channel plan; the default is Modulated. Both modes sample
the signal at the horizontal sync rate and display a trace of the demodulated
AM signal, together with the AM result as a percentage of the peak-to-peak.
The only difference between the two modes is that in Modulated mode using
a modulated signal, the A/D sampling signal is generated from the video sync
strip circuitry and the sample occurs at the peak of the horizontal sync pulse.
In CW mode, using a CW signal, the A/D sampling signal (15.731 kHz for
NTSC or 15,620 kHz for PAL) is generated from the internal system clock.
In either mode, the Network Profiler displays a graphical response of the AM
time domain signal, with the calculated hum percentage from the
peak-to-peak detector of the AM signal presented in the results area.
Measuring hum
1. Select the channel to be tested.
2. To verify that the test mode is correct for the type singal being used, touch
the Quick Edit button on the Measure tab, and scroll down the list until
Hum Mode appears:
5–27
 Loading...