

Page 1

Sun GlassFish Enterprise Server
2.1 PerformanceTuning Guide
Sun Microsystems, Inc.
4150 Network Circle
Santa Clara, CA 95054
U.S.A.
Part No: 820–4343–10
January 2009
Page 2

Copyright 2009 SunMicrosystems, Inc. 4150 NetworkCircle, Santa Clara, CA 95054 U.S.A. All rights reserved.
Sun Microsystems, Inc. has intellectual property rights relating to technology embodied in the product that is described in this document. In particular, and without
limitation, these intellectual property rights may include one or more U.S. patents or pending patent applications in the U.S. and in other countries.
U.S. Government Rights – Commercial software. Government users are subject to the Sun Microsystems, Inc. standard license agreement and applicable provisions
of the FAR and its supplements.
This distribution may include materials developed by third parties.
Parts of the product may be derived from Berkeley BSD systems, licensed from the University of California. UNIX is a registered trademark in the U.S. and other
countries, exclusively licensed through X/Open Company, Ltd.
Sun, Sun Microsystems, the Sun logo, the Solaris logo, the Java Coee Cup logo, docs.sun.com, OpenSolaris, Java, and Solaris are trademarks or registered
trademarks of Sun Microsystems, Inc. or its subsidiaries in the U.S. and other countries. All SPARC trademarks are used under license and are trademarks or
registered trademarks of SPARC International, Inc. in the U.S. and other countries. Products bearing SPARC trademarks are based upon an architecture developed
by Sun Microsystems, Inc.
The OPEN LOOK and Sun
of Xerox in researching and developing the concept of visual or graphical user interfaces for the computer industry. Sun holds a non-exclusive license from Xerox to
the Xerox Graphical User Interface, which license also covers Sun's licensees who implement OPEN LOOK GUIs and otherwise comply with Sun's written license
agreements.
Products covered by and information contained in this publication are controlled by U.S. Export Control laws and may be subject to the export or import laws in
other countries. Nuclear, missile, chemical or biological weapons or nuclear maritime end uses or end users, whether direct or indirect, are strictly prohibited. Export
or reexport to countries subject to U.S. embargo or to entities identied on U.S. export exclusion lists, including, but not limited to, the denied persons and specially
designated nationals lists is strictly prohibited.
DOCUMENTATION IS PROVIDED “AS IS” AND ALL EXPRESS OR IMPLIED CONDITIONS, REPRESENTATIONS AND WARRANTIES, INCLUDINGANY
IMPLIED WARRANTY OF MERCHANTABILITY, FITNESS FOR A PARTICULAR PURPOSE OR NON-INFRINGEMENT, ARE DISCLAIMED, EXCEPT TO
THE EXTENT THATSUCH DISCLAIMERS ARE HELD TO BE LEGALLY INVALID.
TM
Graphical User Interface was developed by Sun Microsystems, Inc. for its users and licensees. Sun acknowledges the pioneering eorts
Copyright 2009 Sun Microsystems, Inc. 4150 Network Circle, Santa Clara, CA 95054 U.S.A. Tous droits réservés.
Sun Microsystems, Inc. détient les droits de propriété intellectuelle relatifs à la technologie incorporée dans le produit qui est décrit dans ce document. En particulier,
et ce sans limitation, ces droits de propriété intellectuelle peuvent inclure un ou plusieurs brevets américains ou des applications de brevet en attente aux Etats-Unis
et dans d'autres pays.
Cette distribution peut comprendre des composants développés par des tierces personnes.
Certaines composants de ce produit peuvent être dérivées du logiciel Berkeley BSD,licenciés par l'Université de Californie. UNIX est une marque déposée aux
Etats-Unis et dans d'autres pays; elle est licenciée exclusivement par X/Open Company, Ltd.
Sun, Sun Microsystems, le logo Sun, le logo Solaris, le logo Java Coee Cup, docs.sun.com, OpenSolaris, Java et Solaris sont des marques de fabrique ou des marques
déposées de Sun Microsystems, Inc., ou ses liales, aux Etats-Unis et dans d'autres pays. Toutes les marques SPARC sont utilisées sous licence et sont des marques de
fabrique ou des marques déposées de SPARC International, Inc. aux Etats-Unis et dans d'autres pays. Les produits portant les marques SPARCsont basés sur une
architecture développée par Sun Microsystems, Inc.
L'interface d'utilisation graphique OPEN LOOK et Sun a été développée par Sun Microsystems, Inc. pour ses utilisateurs et licenciés. Sun reconnaît les eorts de
pionniers de Xerox pour la recherche et le développement du concept des interfaces d'utilisation visuelle ou graphique pour l'industrie de l'informatique. Sun détient
une licence non exclusive de Xerox sur l'interface d'utilisation graphique Xerox, cette licence couvrant également les licenciés de Sun qui mettent en place l'interface
d'utilisation graphique OPEN LOOK et qui, en outre, se conforment aux licences écrites de Sun.
Les produits qui font l'objet de cette publication et les informations qu'il contient sont régis par la legislation américaine en matière de contrôle des exportations et
peuvent être soumis au droit d'autres pays dans le domaine des exportations et importations. Les utilisations nales, ou utilisateurs naux, pour des armes nucléaires,
des missiles, des armes chimiques ou biologiques ou pour le nucléaire maritime, directement ou indirectement, sont strictement interdites. Les exportations ou
réexportations vers des pays sous embargo des Etats-Unis, ou vers des entités gurant sur les listes d'exclusion d'exportation américaines, y compris, mais de manière
non exclusive, la liste de personnes qui font objet d'un ordre de ne pas participer, d'une façon directe ou indirecte, aux exportations des produits ou des services qui
sont régis par la legislation américaine en matière de contrôle des exportations et la liste de ressortissants spéciquement designés, sont rigoureusement interdites.
LA DOCUMENTATIONEST FOURNIE "EN L'ETAT"ET TOUTES AUTRESCONDITIONS, DECLARATIONS ET GARANTIES EXPRESSES OU TACITES
SONT FORMELLEMENT EXCLUES, DANS LA MESURE AUTORISEE PAR LA LOI APPLICABLE, Y COMPRIS NOTAMMENT TOUTE GARANTIE
IMPLICITE RELATIVE A LA QUALITE MARCHANDE, A L'APTITUDE A UNE UTILISATIONPARTICULIERE OU A L'ABSENCE DE CONTREFACON.
090304@21990
Page 3

Contents
Preface ...................................................................................................................................................13
1 Overview of Enterprise Server PerformanceTuning ..................................................................... 17
Process Overview ................................................................................................................................ 17
▼ Performance Tuning Sequence .................................................................................................. 18
Understanding Operational Requirements ..................................................................................... 19
Application Architecture ............................................................................................................ 19
Security Requirements ................................................................................................................ 21
Hardware Resources .................................................................................................................... 22
Administration ............................................................................................................................. 23
General Tuning Concepts .................................................................................................................. 23
Capacity Planning ........................................................................................................................ 24
User Expectations ........................................................................................................................ 25
Further Information ............................................................................................................................ 26
2 TuningYour Application .....................................................................................................................27
Java Programming Guidelines ........................................................................................................... 27
AvoidSerialization and Deserialization .................................................................................... 27
Java Server Page and Servlet Tuning ................................................................................................. 29
Suggested Coding Practices ........................................................................................................30
EJB Performance Tuning .................................................................................................................... 32
Goals .............................................................................................................................................. 32
Monitoring EJB Components .................................................................................................... 32
General Guidelines ...................................................................................................................... 35
Using Local and Remote Interfaces ........................................................................................... 36
Improving Performance of EJB Transactions .......................................................................... 38
Using Special Techniques ........................................................................................................... 39
3
Page 4

Contents
Tuning Tips for Specic Types of EJB Components ............................................................... 42
JDBC and Database Access ......................................................................................................... 46
Tuning Message-Driven Beans .................................................................................................. 47
3 Tuningthe Enterprise Server ............................................................................................................. 49
Deployment Settings ........................................................................................................................... 49
Disable Auto-deployment ........................................................................................................... 50
Use Pre-compiled JavaServer Pages ........................................................................................... 50
Disable Dynamic Application Reloading .................................................................................. 50
Logger Settings ..................................................................................................................................... 50
General Settings ........................................................................................................................... 51
Log Levels ...................................................................................................................................... 51
Web Container Settings ...................................................................................................................... 51
Session Properties: Session Timeout ......................................................................................... 51
Manager Properties: Reap Interval ............................................................................................ 52
Disable Dynamic JSP Reloading ................................................................................................ 52
EJB Container Settings ........................................................................................................................ 53
Monitoring the EJB Container ................................................................................................... 53
Tuning the EJB Container ...........................................................................................................53
Java Message Service Settings ............................................................................................................. 58
Transaction Service Settings .............................................................................................................. 58
Monitoring the Transaction Service .......................................................................................... 58
Tuning the Transaction Service ................................................................................................. 59
HTTP Service Settings ........................................................................................................................ 60
Monitoring the HTTP Service .................................................................................................... 60
Connection Queue ....................................................................................................................... 64
Tuning the HTTP Service ........................................................................................................... 64
Tuning HTTP Listener Settings ................................................................................................. 69
ORB Settings ........................................................................................................................................ 70
Overview ....................................................................................................................................... 70
How a Client Connects to the ORB ............................................................................................ 70
Monitoring the ORB .................................................................................................................... 70
Tuning the ORB ........................................................................................................................... 71
Thread Pool Sizing ....................................................................................................................... 74
Examining IIOP Messages .......................................................................................................... 74
Sun GlassFish Enterprise Server 2.1 PerformanceTuning Guide • January 20094
Page 5

Contents
Improving ORB Performance with Java Serialization ............................................................. 75
Thread Pool Settings ........................................................................................................................... 76
Tuning Thread Pools (Unix /Linux only) ................................................................................. 76
Resources .............................................................................................................................................. 77
JDBC Connection Pool Settings ................................................................................................. 77
Connector Connection Pool Settings ........................................................................................ 80
4 Tuningthe Java Runtime System ......................................................................................................83
Java Virtual Machine Settings ............................................................................................................ 83
Managing Memory and Garbage Collection .................................................................................... 84
Tuning the Garbage Collector .................................................................................................... 84
Tracing Garbage Collection ........................................................................................................86
Other Garbage Collector Settings .............................................................................................. 86
Tuning the Java Heap .................................................................................................................. 87
Rebasing DLLs on Windows ...................................................................................................... 89
Further Information ............................................................................................................................ 91
5 Tuningthe Operating Systemand Platform ................................................................................... 93
Server Scaling ....................................................................................................................................... 93
Processors ..................................................................................................................................... 93
Memory ......................................................................................................................................... 94
Disk Space ..................................................................................................................................... 94
Networking ................................................................................................................................... 94
Solaris 10 Platform-Specic Tuning Information ........................................................................... 95
Tuning for the Solaris OS ................................................................................................................... 95
Tuning Parameters ...................................................................................................................... 95
File Descriptor Setting ................................................................................................................. 97
Linux Conguration ........................................................................................................................... 97
Tuning for Solaris on x86 ................................................................................................................... 98
File Descriptors ............................................................................................................................ 99
IP Stack Settings ........................................................................................................................... 99
Tuning for Linux platforms ............................................................................................................. 100
File Descriptors .......................................................................................................................... 100
Virtual Memory ......................................................................................................................... 101
Network Interface ...................................................................................................................... 102
5
Page 6

Contents
Disk I/O Settings ........................................................................................................................ 102
TCP/IP Settings .......................................................................................................................... 102
Tuning UltraSPARCT1–Based Systems ........................................................................................ 103
Tuning Operating System and TCP Settings .......................................................................... 103
Disk Conguration .................................................................................................................... 105
Network Conguration ............................................................................................................. 105
Start Options ............................................................................................................................... 105
6 Tuningfor High-Availability ............................................................................................................107
Tuning HADB .................................................................................................................................... 107
Disk Use ...................................................................................................................................... 107
Memory Allocation .................................................................................................................... 109
Performance ............................................................................................................................... 110
Operating System Conguration ............................................................................................. 116
Tuning the Enterprise Server for High-Availability ...................................................................... 116
Tuning Session Persistence Frequency .................................................................................... 117
Session Persistence Scope .......................................................................................................... 118
Session Size ................................................................................................................................. 118
Checkpointing Stateful Session Beans ..................................................................................... 119
Conguring the JDBC Connection Pool ................................................................................. 119
Conguring the Load Balancer ........................................................................................................ 120
Enabling the Health Checker .................................................................................................... 120
Index ................................................................................................................................................... 123
Sun GlassFish Enterprise Server 2.1 PerformanceTuning Guide • January 20096
Page 7

Figures
FIGURE 1–1 Java EE Application Model ....................................................................................... 20
7
Page 8

8
Page 9

Tables
TABLE 1–1 PerformanceTuning Roadmap ............................................................................... 17
TABLE 1–2 Factors That Aect Performance ............................................................................. 24
TABLE 3–1 Bean Type Pooling or Caching ................................................................................ 53
TABLE 3–2 EJB Cache and Pool Settings .................................................................................... 56
TABLE 3–3 Tunable ORB Settings ...............................................................................................71
TABLE 3–4 Connection PoolSizing ............................................................................................ 78
TABLE 4–1 Maximum Address Space Per Process .................................................................... 87
TABLE 5–1 Tuning Parameters for Solaris .................................................................................95
TABLE 5–2 Tuning 64–bit Systems for Performance Benchmarking ...................................104
9
Page 10

10
Page 11

Examples
EXAMPLE 4–1 Heap Conguration on Solaris ................................................................................89
EXAMPLE 4–2 Heap Conguration on Windows ........................................................................... 90
11
Page 12

12
Page 13

Preface
The Performance Tuning Guide describes how to get the best performance with Enterprise
Server.
This preface contains information about and conventions for the entire Sun GlassFish
TM
Enterprise Server documentation set.
Sun GlassFish Enterprise Server Documentation Set
TABLE P–1 Books in the Enterprise Server Documentation Set
Book Title Description
Documentation Center Enterprise Server documentation topics organized by task and subject.
Release Notes Late-breaking information about the software and the documentation. Includes a
comprehensive, table-based summary of the supported hardware, operating system, Java
Development Kit (JDKTM), and database drivers.
Quick Start Guide How to get started with the Enterprise Server product.
Installation Guide Installing the software and its components.
Application Deployment Guide Deployment of applications and application components to the Enterprise Server. Includes
information about deployment descriptors.
Developer’s Guide Creating and implementing Java Platform, Enterprise Edition (Java EE platform) applications
intended to run on the Enterprise Server that follow the open Java standards model for Java
EE components and APIs. Includes information about developer tools, security, debugging,
and creating lifecycle modules.
TM
Java EE 5 Tutorial Using Java EE 5 platform technologies and APIs to develop Java EE applications.
Java WSIT Tutorial Developing web applications using the Web Service Interoperability Technologies (WSIT).
Describes how, when, and why to use the WSIT technologies and the features and options
that each technology supports.
Administration Guide System administration for the Enterprise Server, including conguration, monitoring,
security, resource management, and web services management.
13
Page 14

Preface
TABLE P–1 Books in the Enterprise Server Documentation Set (Continued)
Book Title Description
High Availability Administration
Guide
Administration Reference Editing the Enterprise Server conguration le, domain.xml.
Performance Tuning Guide Tuning the Enterprise Server to improve performance.
Reference Manual Utility commands available with the Enterprise Server; written in man page style. Includes
Setting up clusters, working with node agents, and using load balancers.
the asadmin command line interface.
Default Paths and File Names
The following table describes the default paths and le names that are used in this book.
TABLE P–2 Default Pathsand File Names
Placeholder Description Default Value
as-install Represents the base installation directory for
Enterprise Server.
SolarisTMand Linux installations, non-root user:
user’s-home-directory/SUNWappserver
Solaris and Linux installations, root user:
/opt/SUNWappserver
Windows, all installations:
SystemDrive:\Sun\AppServer
domain-root-dir Represents the directory containing all
domains.
domain-dir Represents the directory for a domain.
In conguration les, you might see
domain-dir represented as follows:
${com.sun.aas.instanceRoot}
instance-dir Represents the directory for a server instance. domain-dir/instance-dir
samples-dir Represents the directory containing sample
applications.
docs-dir Represents the directory containing
documentation.
Sun GlassFish Enterprise Server 2.1 PerformanceTuning Guide • January 200914
All installations:
as-install/domains/
domain-root-dir/domain-dir
as-install/samples
as-install/docs
Page 15

Typographic Conventions
The following table describes the typographic changes that are used in this book.
TABLE P–3 TypographicConventions
Typeface Meaning Example
Preface
AaBbCc123 Thenames of commands, les, and
directories, and onscreen computer
output
AaBbCc123 Whatyou type, contrasted with onscreen
computer output
AaBbCc123 A placeholder to be replaced with a real
name or value
AaBbCc123 Book titles, new terms, and terms to be
emphasized (note that some emphasized
items appear bold online)
Symbol Conventions
The following table explains symbols that might be used in this book.
TABLE P–4 SymbolConventions
Symbol Description Example Meaning
[] Contains optional arguments
and command options.
Edit your .login le.
Use ls -a to list all les.
machine_name% you have mail.
machine_name% su
Password:
The command to remove a le is rm lename.
Read Chapter 6 in the User's Guide.
A cache is a copy that is stored locally.
Do not save the le.
ls [-l] The -l option is not required.
{|} Contains a set of choices for a
required command option.
${ } Indicates a variable
reference.
- Joins simultaneous multiple
keystrokes.
+ Joins consecutive multiple
keystrokes.
-d {y|n} The -d option requires that you use
either the y argument or the n
argument.
${com.sun.javaRoot} References the value of the
com.sun.javaRoot variable.
Control-A Press the Control key while you press
the A key.
Ctrl+A+N Press the Control key, release it, and
then press the subsequent keys.
15
Page 16

Preface
TABLE P–4 SymbolConventions (Continued)
Symbol Description Example Meaning
→ Indicates menu item
selection in a graphical user
interface.
File → New → Templates From the File menu, choose New.
Documentation, Support, andTraining
The Sun web site provides information about the following additional resources:
■
Documentation (http://www.sun.com/documentation/)
■
Support (http://www.sun.com/support/)
■
Training (http://www.sun.com/training/)
Third-PartyWeb Site References
Third-party URLs are referenced in this document and provide additional, related information.
Note – Sun is not responsible for the availability of third-party web sites mentioned in this
document. Sun does not endorse and is not responsible or liable for any content, advertising,
products, or other materials that are available on or through such sites or resources. Sun will not
be responsible or liable for any actual or alleged damage or loss caused or alleged to be caused by
or in connection with use of or reliance on any such content, goods, or services that are available
on or through such sites or resources.
From the New submenu, choose
Templates.
Sun WelcomesYour Comments
Sun is interested in improving its documentation and welcomes your comments and
suggestions.
To share your comments, go to
provide the document title and part number. The part number is a seven-digit or nine-digit
number that can be found on the title page of the book or at the top of the document.
Sun GlassFish Enterprise Server 2.1 PerformanceTuning Guide • January 200916
http://docs.sun.com and click Feedback. In the online form,
Page 17

CHAPTER 1
1
Overview of Enterprise Server Performance Tuning
You can signicantly improve performance of the Sun GlassFish Enterprise Server and of
applications deployed to it by adjusting a few deployment and server conguration settings.
However, it is important to understand the environment and performance goals. An optimal
conguration for a production environment might not be optimal for a development
environment.
This chapter discusses the following topics:
■
“Process Overview” on page 17
■
“Understanding Operational Requirements” on page 19
■
“General Tuning Concepts” on page 23
■
“Further Information” on page 26
Process Overview
The following table outlines the overall administration process, and shows where performance
tuning ts in the sequence.
TABLE 1–1 PerformanceTuning Roadmap
Step Description of Task Location of Instructions
1 Design: Decide on the high-availability topology
and set up the Application Server and, if you are
using HADBfor session persistence,
high-availability database (HADB)systems.
2 Capacity Planning: Make sure the systems have
sucient resources to perform well.
Deployment Planning Guide
Deployment Planning Guide
17
Page 18

Process Overview
TABLE 1–1 PerformanceTuning Roadmap (Continued)
Step Description of Task Location of Instructions
3 Installation: If you are using HADB for session
persistence, ensure that the HADB software is
installed.
4 Deployment: Install and run your applications.
Familiarize yourself with how to congure and
administer the Enterprise Server.
5 Tuning: Tune the following items:
■
Applications
■
Enterprise Server
■
Java Runtime System
■
Operating system and platform
■
High availability features
▼
PerformanceTuningSequence
Application developers should tune applications prior to production use. Tuning applications
often produces dramatic performance improvements. System administrators perform the
remaining steps in the following list after tuning the application, or when application tuning
has to wait and you want to improve performance as much as possible in the meantime.
Ideally, follow this sequence of steps when you are tuning performance:
1
Tuneyour application, described in
Installation Guide
Application Deployment Guide
Administration Guide
The following chapters:
■
Chapter 2, “Tuning Your Application”
■
Chapter 3, “Tuning the Enterprise Server”
■
Chapter 4, “Tuning the Java Runtime System”
■
Chapter 5, “Tuning the Operating System and Platform”
■
Chapter 6, “Tuning for High-Availability”
Chapter 2,“TuningYourApplication”
Tunethe server, described in Chapter 3,“Tuning the Enterprise Server”Chapter 3,“Tuning the
2
Enterprise Server”
Tunethe high availability database, described in Chapter 6,“Tuning for High-Availability”
3
Tunethe Java runtime system, described in Chapter 4,“Tuning the Java Runtime System”
4
Tunethe operating system, described in Chapter 5,“Tuningthe Operating System and Platform”
5
Sun GlassFish Enterprise Server 2.1 PerformanceTuning Guide • January 200918
Page 19

Understanding Operational Requirements
Before you begin to deploy and tune your application on the Application Server, it is important
to clearly dene the operational environment. The operational environment is determined by
high-level constraints and requirements such as:
■
“Application Architecture” on page 19
■
“Security Requirements” on page 21
■
“Hardware Resources” on page 22
Application Architecture
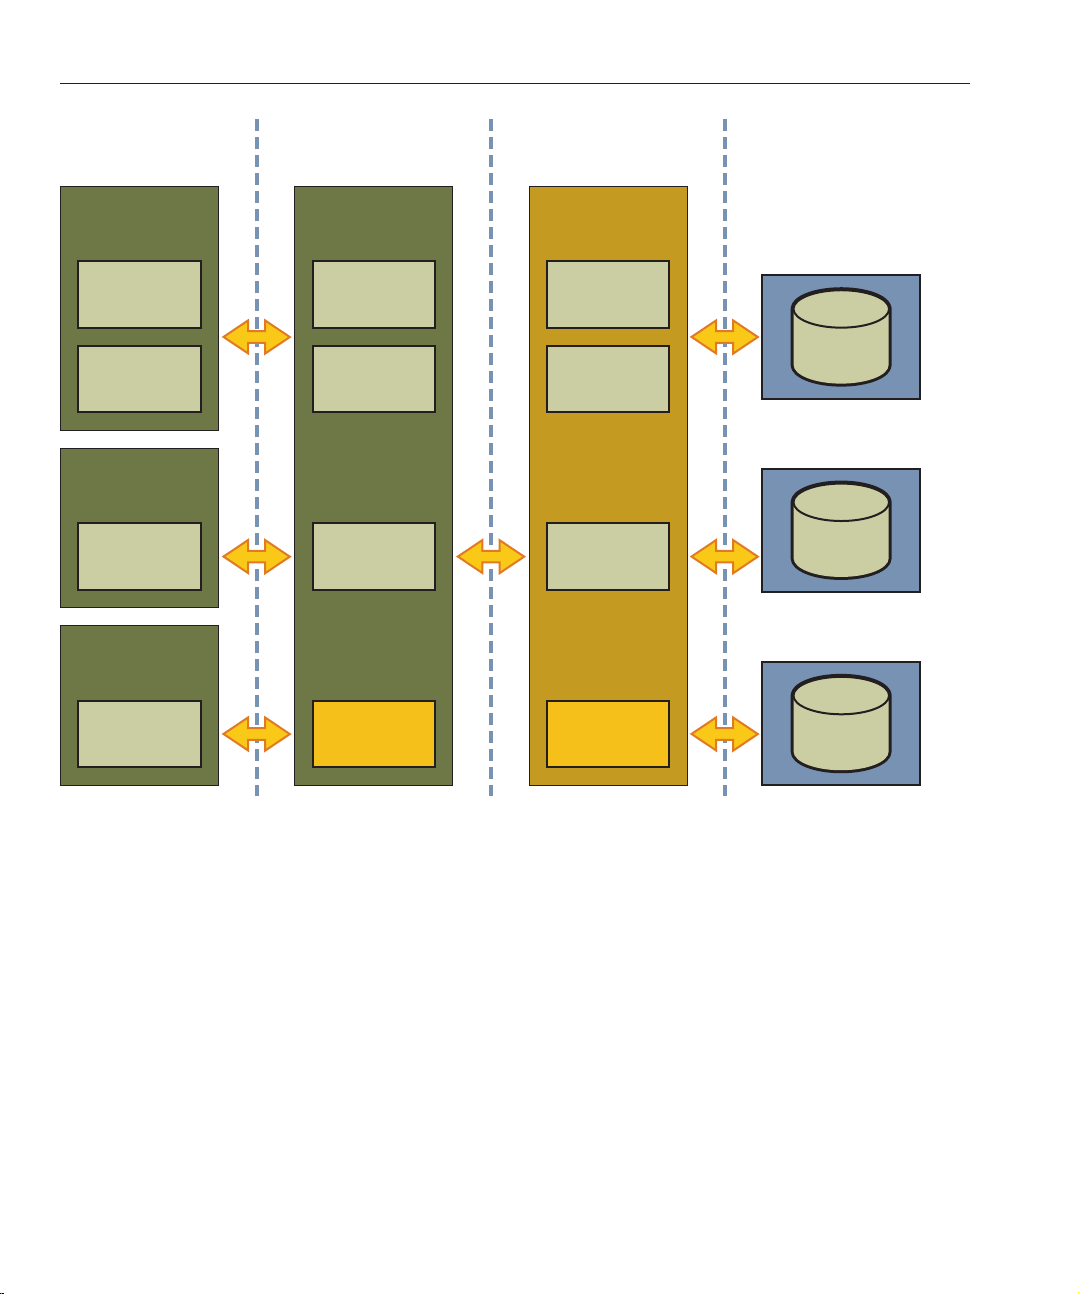
The Java EE Application model, as shown in the following gure, is very exible; allowing the
application architect to split application logic functionally into many tiers. The presentation
layer is typically implemented using servlets and JSP technology and executes in the web
container.
Understanding Operational Requirements
Chapter 1 • Overview of Enterprise Server Performance Tuning 19
Page 20
Understanding Operational Requirements
Client-Side
Presentation
Browser
Pure
HTML
Java
Applet
Desktop
Java
Application
Other
Device
Server-Side
Presentation
Web
Server
JSP
JSP
Java
Servlet
Server-Side
Business Logic
EJB
Container
EJB
EJB
EJB
Enterprise
Information
System
J2EE
Client
FIGURE 1–1 Java EE Application Model
Moderately complex enterprise applications can be developed entirely using servlets and JSP
technology. More complex business applications often use Enterprise JavaBeans (EJB)
components. The Application Server integrates the web and EJB containers in a single process.
Local access to EJB components from servlets is very ecient. However, some application
deployments may require EJB components to execute in a separate process; and be accessible
from standalone client applications as well as servlets. Based on the application architecture, the
server administrator can employ the Application Server in multiple tiers, or simply host both
the presentation and business logic on a single tier.
It is important to understand the application architecture before designing a new Application
Server deployment, and when deploying a new business application to an existing application
server deployment.
Sun GlassFish Enterprise Server 2.1 PerformanceTuning Guide • January 200920
J2EE
Platform
J2EE
Platform
Page 21

Understanding Operational Requirements
Security Requirements
Most business applications require security. This section discusses security considerations and
decisions.
User Authentication and Authorization
Application users must be authenticated. The Application Server provides three dierent
choices for user authentication: le-based, LDAP, and Solaris.
The default le based security realm is suitable for developer environments, where new
applications are developed and tested. At deployment time, the server administrator can choose
between the Lighweight Directory Access Protocol (LDAP) or Solaris security realms. Many
large enterprises use LDAP-based directory servers to maintain employee and customer
proles. Small to medium enterprises that do not already use a directory server may nd it
advantageous to leverage investment in Solaris security infrastructure.
For more information on security realms, see
GlassFish Enterprise Server 2.1 Administration Guide.
The type of authentication mechanism chosen may require additional hardware for the
deployment. Typically a directory server executes on a separate server, and may also require a
backup for replication and high availability. Refer to Sun Java System Directory Server
documentation for more information on deployment, sizing, and availability guidelines.
An authenticated user’saccess to application functions may also need authorization checks. If
the application uses the role-based Java EE authorization checks, the application server
performs some additional checking, which incurs additional overheads. When you perform
capacity planning, you must take this additional overhead into account.
Chapter 9, “Conguring Security,” in Sun
Encryption
For security reasons, sensitive user inputs and application output must be encrypted. Most
business-oriented web applications encrypt all or some of the communication ow between the
browser and Application Server. Online shopping applications encrypt trac when the user is
completing a purchase or supplying private data. Portal applications such as news and media
typically do not employ encryption. Secure Sockets Layer (SSL) is the most common security
framework, and is supported by many browsers and application servers.
The Application Server supports SSL 2.0 and 3.0 and contains software support for various
cipher suites. It also supports integration of hardware encryption cards for even higher
performance. Security considerations, particularly when using the integrated software
encryption, will impact hardware sizing and capacity planning.
Consider the following when assessing the encryption needs for a deployment:
Chapter 1 • Overview of Enterprise Server Performance Tuning 21
Page 22

Understanding Operational Requirements
■
What is the nature of the applications with respect to security? Do they encrypt all or only a
part of the application inputs and output? What percentage of the information needs to be
securely transmitted?
■
Are the applications going to be deployed on an application server that is directly connected
to the Internet? Will a web server exist in a demilitarized zone (DMZ) separate from the
application server tier and backend enterprise systems?
A DMZ-style deployment is recommended for high security. It is also useful when the
application has a signicant amount of static text and image content and some business
logic that executes on the Application Server, behind the most secure rewall. Application
Server provides secure reverse proxy plugins to enable integration with popular web servers.
The Application Server can also be deployed and used as a web server in DMZ.
■
Is encryption required between the web servers in the DMZ and application servers in the
next tier? The reverse proxy plugins supplied with Application Server support SSL
encryption between the web server and application server tier. If SSL is enabled, hardware
capacity planning must be take into account the encryption policy and mechanisms.
■
If software encryption is to be employed:
■
What is the expected performance overhead for every tier in the system, given the
security requirements?
■
What are the performance and throughput characteristics of various choices?
For information on how to encrypt the communication between web servers and Application
Server, please refer to
Administration Guide
Chapter 9, “Conguring Security,” in Sun GlassFish Enterprise Server 2.1
.
Hardware Resources
The type and quantity of hardware resources available greatly inuence performance tuning
and site planning.
The Application Server provides excellent vertical scalability. It can scale to eciently utilize
multiple high-performance CPUs, using just one application server process. A smaller number
of application server instances makes maintenance easier and administration less expensive.
Also, deploying several related applications on fewer application servers can improve
performance, due to better data locality, and reuse of cached data between co-located
applications. Such servers must also contain large amounts of memory, disk space, and network
capacity to cope with increased load.
The Application Server can also be deployed on large “farms” of relatively modest hardware
units. Business applications can be partitioned across various server instances. Using one or
more external load balancers can eciently spread user access across all the application server
instances. A horizontal scaling approach may improve availability, lower hardware costs and is
suitable for some types of applications. However, this approach requires administration of
more application server instances and hardware nodes.
Sun GlassFish Enterprise Server 2.1 PerformanceTuning Guide • January 200922
Page 23

General Tuning Concepts
Administration
A single Application Server installation on a server can encompass multiple instances. A group
of one or more instances that are administered by a single Administration Server is called a
domain. Grouping server instances into domains permits dierent people to independently
administer the groups.
You can use a single-instance domain to create a “sandbox” for a particular developer and
environment. In this scenario, each developer administers his or her own application server,
without interfering with other application server domains. A small development group may
choose to create multiple instances in a shared administrative domain for collaborative
development.
In a deployment environment, an administrator can create domains based on application and
business function. For example, internal Human Resources applications may be hosted on one
or more servers in one Administrative domain, while external customer applications are hosted
on several administrative domains in a server farm.
The Application Server supports virtual server capability for web applications. For example, a
web application hosting service provider can host dierent URL domains on a single
Application Server process for ecient administration.
For detailed information on administration, see
Administration Guide
.
GeneralTuning Concepts
Some key concepts that aect performance tuning are:
■
User load
■
Application scalability
■
Margins of safety
The following table describes these concepts, and how they are measured in practice. The left
most column describes the general concept, the second column gives the practical ramications
of the concept, the third column describes the measurements, and the right most column
describes the value sources.
Chapter 1 • Overview of Enterprise Server Performance Tuning 23
Sun GlassFish Enterprise Server 2.1
Page 24

General Tuning Concepts
TABLE 1–2 Factors That Aect Performance
Concept In practice Measurement Value sources
User Load Concurrent
sessions at
peak load
Application
Scalability
Vertical
scalability
Horizontal
scalability
Safety Margins High
Transaction
rate measured
on one CPU
Increase in
performance
from
additional
CPUs
Increase in
performance
from
additional
servers
availability
requirements
Transactions Per Minute (TPM)
Web Interactions Per Second
(WIPS)
TPM or WIPS Measured from workload benchmark. Perform at each tier.
Percentage gain per additional
CPU
Percentage gain per additional
server process and/or hardware
node.
If the system must cope with
failures, size the system to meet
performance requirements
assuming that one or more
application server instances are
non functional
(Max. number of concurrent users) * (expected response time) /
(time between clicks)
Example:
(100 users*2sec)/10sec=20
Based on curve tting from benchmark. Perform tests while
gradually increasing the number of CPUs. Identify the “knee” of
the curve, where additional CPUs are providing uneconomical
gains in performance. Requires tuning as described in this guide.
Perform at each tier and iterate if necessary. Stop here if this
meets performance requirements.
Use a well-tuned single application server instance, as in
previous step. Measure how much each additional server
instance and hardware node improves performance.
Dierent equations used if high availability is required.
Excess capacity
for unexpected
peaks
It is desirable to operate a server
at less than its benchmarked
peak, for some safety margin
80% system capacity utilization at peak loads may work for most
installations. Measure your deployment under real and
simulated peak loads.
Capacity Planning
The previous discussion guides you towards dening a deployment architecture. However, you
determine the actual size of the deployment by a process called capacity planning. Capacity
planning enables you to predict:
■
The performance capacity of a particular hardware conguration.
■
The hardware resources required to sustain specied application load and performance.
You can estimate these values through careful performance benchmarking, using an
application with realistic data sets and workloads.
Sun GlassFish Enterprise Server 2.1 PerformanceTuning Guide • January 200924
Page 25

General Tuning Concepts
▼
To Determine Capacity
Determine performance on a single CPU.
1
First determine the largest load that a single processor can sustain. You can obtain this gure by
measuring the performance of the application on a single-processor machine. Either leverage
the performance numbers of an existing application with similar processing characteristics or,
ideally, use the actual application and workload in a testing environment. Make sure that the
application and data resources are tiered exactly as they would be in the nal deployment.
2
Determine vertical scalability.
Determine how much additional performance you gain when you add processors. That is, you
are indirectly measuring the amount of shared resource contention that occurs on the server for
a specic workload. Either obtain this information based on additional load testing of the
application on a multiprocessor system, or leverage existing information from a similar
application that has already been load tested.
Running a series of performance tests on one to eight CPUs, in incremental steps, generally
provides a sense of the vertical scalability characteristics of the system. Be sure to properly tune
the application, Application Server, backend database resources, and operating system so that
they do not skew the results.
3
Determine horizontal scalability.
If suciently powerful hardware resources are available, a single hardware node may meet the
performance requirements. However for better availability, you can cluster two or more
systems. Employing external load balancers and workload simulation, determine the
performance benets of replicating one well-tuned application server node, as determined in
step (2).
User Expectations
Application end-users generally have some performance expectations. Often you can
numerically quantify them. To ensure that customer needs are met, you must understand these
expectations clearly, and use them in capacity planning.
Consider the following questions regarding performance expectations:
■
What do users expect the average response times to be for various interactions with the
application? What are the most frequent interactions? Are there any extremely time-critical
interactions? What is the length of each transaction, including think time? In many cases,
you may need to perform empirical user studies to get good estimates.
■
What are the anticipated steady-state and peak user loads? Are there are any particular times
of the day, week, or year when you observe or expect to observe load peaks? While there may
be several million registered customers for an online business, at any one time only a
Chapter 1 • Overview of Enterprise Server Performance Tuning 25
Page 26

Further Information
fraction of them are logged in and performing business transactions. A common mistake
during capacity planning is to use the total size of customer population as the basis and not
the average and peak numbers for concurrent users. The number of concurrent users also
may exhibit patterns over time.
■
What is the average and peak amount of data transferred per request? This value is also
application-specic. Good estimates for content size, combined with other usage patterns,
will help you anticipate network capacity needs.
■
What is the expected growth in user load over the next year? Planning ahead for the future
will help avoid crisis situations and system downtimes for upgrades.
Further Information
■
For more information on Java performance, see Java Performance Documentation and Java
Performance BluePrints
■
For details on optimizing EJB components, see Seven Rules for Optimizing Entity Beans
■
For details on proling, see “Proling Tools” in Sun GlassFish Enterprise Server 2.1
Developer’s Guide
■
For more details on the domain.xml le see Sun GlassFish Enterprise Server 2.1
Administration Reference.
.
Sun GlassFish Enterprise Server 2.1 PerformanceTuning Guide • January 200926
Page 27

CHAPTER 2
2
TuningYour Application
This chapter provides information on tuning applications for maximum performance. A
complete guide to writing high performance Java and Java EE applications is beyond the scope
of this document.
This chapter discusses the following topics:
■
“Java Programming Guidelines” on page 27
■
“Java Server Page and Servlet Tuning” on page 29
■
“EJB Performance Tuning” on page 32
Java Programming Guidelines
This section covers issues related to Java coding and performance. The guidelines outlined are
not specic to Enterprise Server, but are general rules that are useful in many situations. For a
complete discussion of Java coding best practices, see the
Avoid Serialization and Deserialization
Serialization and deserialization of objects is a CPU-intensive procedure and is likely to slow
down your application. Use the transient keyword to reduce the amount of data serialized.
Additionally, customized readObject() and writeObject() methods may be benecial in
some cases.
Use StringBuer to Concatenate Strings
To improve performance, instead of using string concatenation, use StringBuffer.append().
String objects are immutable—they never change after creation. For example, consider the
following code:
Java Blueprints.
27
Page 28

Java Programming Guidelines
String str = "testing";
str = str + "abc";
The compiler translates this code as:
String str = "testing";
StringBuffer tmp = new StringBuffer(str);
tmp.append("abc");
str = tmp.toString();
Therefore, copying is inherently expensive and overusing it can reduce performance
signicantly.
Assign null toVariablesThat Are No Longer Needed
Explicitly assigning a null value to variables that are no longer needed helps the garbage
collector to identify the parts of memory that can be safely reclaimed. Although Java provides
memory management, it does not prevent memory leaks or using excessive amounts of
memory.
An application may induce memory leaks by not releasing object references. Doing so prevents
the Java garbage collector from reclaiming those objects, and results in increasing amounts of
memory being used. Explicitly nullifying references to variables after their use allows the
garbage collector to reclaim memory.
One way to detect memory leaks is to employ proling tools and take memory snapshots after
each transaction. A leak-free application in steady state will show a steady active heap memory
after garbage collections.
Declare Methods as nal Only If Necessary
Modern optimizing dynamic compilers can perform inlining and other inter-procedural
optimizations, even if Java methods are not declared final. Use the keyword final as it was
originally intended: for program architecture reasons and maintainability.
Only if you are absolutely certain that a method must not be overridden, use the final
keyword.
Declare Constants as static nal
The dynamic compiler can perform some constant folding optimizations easily, when you
declare constants as static final variables.
AvoidFinalizers
Adding nalizers to code makes the garbage collector more expensive and unpredictable. The
virtual machine does not guarantee the time at which nalizers are run. Finalizers may not
always be executed, before the program exits. Releasing critical resources in finalize()
methods may lead to unpredictable application behavior.
Sun GlassFish Enterprise Server 2.1 PerformanceTuning Guide • January 200928
Page 29

Java Server Page and Servlet Tuning
Declare Method Arguments nal
Declare method arguments final if they are not modied in the method. In general, declare all
variables final if they are not modied after being initialized or set to some value.
Synchronize Only When Necessary
Do not synchronize code blocks or methods unless synchronization is required. Keep
synchronized blocks or methods as short as possible to avoid scalability bottlenecks. Use the
Java Collections Framework for unsynchronized data structures instead of more expensive
alternatives such asjava.util.HashTable.
Use DataHandlers for SOAP Attachments
Using a javax.activation.DataHandler for a SOAP attachment will improve performance.
JAX-RPC species:
■
A mapping of certain MIME types to Java types.
■
Any MIME type is mappable to a javax.activation.DataHandler .
As a result, send an attachment (.gif or XML document) as a SOAP attachment to an RPC style
web service by utilizing the Java type mappings. When passing in any of the mandated Java type
mappings (appropriate for the attachment’s MIME type) as an argument for the web service, the
JAX-RPC runtime handles these as SOAP attachments.
For example, to send out an image/gif attachment, use java.awt.Image, or create a
DataHandler wrapper over your image. The advantages of using the wrapper are:
■
Reduced coding: You can reuse generic attachment code to handle the attachments because
the DataHandler determines the content type of the contained data automatically. This
feature is especially useful when using a document style service. Since the content is known
at runtime, there is no need to make calls to attachment.setContent(stringContent,
"image/gif"), for example.
■
Improved Performance: Informal tests have shown that using DataHandler wrappers
doubles throughput for image/gif MIME types, and multiplies throughput by
approximately 1.5 for text/xml or java.awt.Image for image/* types.
Java Server Page and Servlet Tuning
Many applications running on the Enterprise Server use servlets or JavaServer Pages (JSP)
technology in the presentation tier. This section describes how to improve performance of such
applications, both through coding practices and through deployment and conguration
settings.
Chapter 2 • TuningYour Application 29
Page 30

Java Server Page and Servlet Tuning
Suggested Coding Practices
This section provides some tips on coding practices that improve servlet and JSP application
performance.
General Guidelines
Follow these general guidelines to increase performance of the presentation tier:
■
Minimize Java synchronization in servlets.
■
Don’t use the single thread model for servlets.
■
Use the servlet’sinit() method to perform expensive one-time initialization.
■
Avoidusing System.out.println() calls.
AvoidShared Modied Class Variables
In the servlet multithread model (the default), a single instance of a servlet is created for each
application server instance. All requests for a servlet on that application instance share the same
servlet instance. This can lead to thread contention if there are synchronization blocks in the
servlet code. So, avoid using shared modied class variables, since they create the need for
synchronization.
HTTP Session Handling
Follow these guidelines when using HTTP sessions:
■
Create sessions sparingly. Session creation is not free. If a session is not required, do not
create one.
■
Use javax.servlet.http.HttpSession.invalidate() to release sessions when they are
no longer needed.
■
Keep session size small, to reduce response times. If possible, keep session size below seven
KB.
■
Use the directive <%page session="false"%> in JSP les to prevent the Enterprise Server
from automatically creating sessions when they are not necessary.
■
Avoidlarge object graphs in an HttpSession . They force serialization and add
computational overhead. Generally, do not store large objects as HttpSession variables.
■
Don’t cache transaction data in HttpSession. Access to data in an HttpSession is not
transactional. Do not use it as a cache of transactional data, which is better kept in the
database and accessed using entity beans. Transactions will rollback upon failures to their
original state. However, stale and inaccurate data may remain in HttpSession objects. The
Enterprise Server provides “read-only” bean-managed persistence entity beans for cached
access to read-only data.
Sun GlassFish Enterprise Server 2.1 PerformanceTuning Guide • January 200930
Page 31

Java Server Page and Servlet Tuning
Conguration and Deployment Tips
Follow these conguration tips to improve performance. These tips are intended for production
environments, not development environments.
■
To improve class loading time, avoid having excessive directories in the server CLASSPATH.
Put application-related classes into JAR les.
■
HTTP response times are dependent on how the keep-alive subsystem and the HTTP server
is tuned in general. For more information, see
■
Cache servlet results when possible. For more information, see Chapter 8, “Developing Web
and SIP Applications,” in Sun GlassFish Enterprise Server 2.1 Developer’s Guide
■
If an application does not contain any EJB components, deploy the application as a WAR
le, not an EAR le.
Optimize SSL
“HTTP Service Settings” on page 60.
.
Optimize SSL by using routines in the appropriate operating system library for concurrent
access to heap space. The library to use depends on the version of the Solaris
TM
Operating
System (SolarisOS) that you are using. To ensure that you use the correct library, set the
LD_PRELOAD environment variable to specify the correct library le. For mor information, see
the following table.
Solaris OS Version Library Setting of LD_PRELOAD Environment Variable
10 libumem–3LIB /usr/lib/libumem.so
9 libmtmalloc-3LIB /usr/lib/libmtmalloc.so
To set the LD_PRELOAD environment variable, edit the entry for this environment variable in the
startserv script. The startserv script is located is located in the bin/startserv directory of
your domain.
The exact syntax to dene an environment variable depends on the shell that you are using.
Disable Security Manager
The security manager is expensive because calls to required resources must call the
doPrivileged() method and must also check the resource with the server.policy le. If you
are sure that no malicious code will be run on the server and you do not use authentication
within your application, then you can disable the security manager.
To disable use of the server.policy le, use the Admin Console. Under Congurations >
cong-name > JVM Settings (JVM Options) delete the option that contains the following text:
-Djava.security.manager
Chapter 2 • TuningYour Application 31
Page 32

EJB PerformanceTuning
EJB PerformanceTuning
The Enterprise Server’shigh-performance EJB container has numerous parameters that aect
performance. Individual EJB components also have parameters that aect performance. The
value of individual EJB component’s parameter overrides the value of the same parameter for
the EJB container. The default values are designed for a single-processor computer
system—change them to optimize for other system congurations.
This section covers the following topics:
■
“Goals” on page 32
■
“Monitoring EJB Components” on page 32
■
“General Guidelines” on page 35
■
“Using Local and Remote Interfaces” on page 36
■
“Improving Performance of EJB Transactions” on page 38
■
“Using Special Techniques” on page 39
■
“Tuning Tips for Specic Types of EJB Components” on page 42
■
“JDBC and Database Access” on page 46
■
“Tuning Message-Driven Beans” on page 47
Goals
The goals of EJB performance tuning are:
■
Increased speed - Cache as many beans in the EJB caches as possible to increase speed
(equivalently, decrease response time). Caching eliminates CPU-intensive operations.
However, since memory is nite, as the caches become larger, housekeeping for them
(including garbage collection) takes longer.
■
Decreased memory consumption - Beans in the pools or caches consume memory from
the Java virtual machine heap. Very large pools and caches degrade performance because
they require longer and more frequent garbage collection cycles.
■
Improved functional properties - Functional properties such as user time-out, commit
options, security, and transaction options, are mostly related to the functionality and
conguration of the application. Generally, they do not compromise functionality for
performance. In some cases, you might be forced to make a “trade-o” decision between
functionality and performance. This section oers suggestions in such cases.
Monitoring EJB Components
When the EJB container has monitoring enabled, you can examine statistics for individual
beans based on the bean pool and cache settings.
For example, the monitoring command below gives the Bean Cache statistics for a stateful
session bean.
Sun GlassFish Enterprise Server 2.1 PerformanceTuning Guide • January 200932
Page 33

EJB PerformanceTuning
asadmin get --user admin --host e4800-241-a --port 4848
-m specjcmp.application.SPECjAppServer.ejb-module.
supplier_jar.stateful-session-bean.BuyerSes.bean-cache.*
The following is a sample of the monitoring output:
resize-quantity = -1
cache-misses = 0
idle-timeout-in-seconds = 0
num-passivations = 0
cache-hits = 59
num-passivation-errors = 0
total-beans-in-cache = 59
num-expired-sessions-removed = 0
max-beans-in-cache = 4096
num-passivation-success = 0
The monitoring command below gives the bean pool statistics for an entity bean:
asadmin get --user admin --host e4800-241-a --port 4848
-m specjcmp.application.SPECjAppServer.ejb-module.
supplier_jar.stateful-entity-bean.ItemEnt.bean-pool.*
idle-timeout-in-seconds = 0
steady-pool-size = 0
total-beans-destroyed = 0
num-threads-waiting = 0
num-beans-in-pool = 54
max-pool-size = 2147483647
pool-resize-quantity = 0
total-beans-created = 255
The monitoring command below gives the bean pool statistics for a stateless bean.
asadmin get --user admin --host e4800-241-a --port 4848
-m test.application.testEjbMon.ejb-module.slsb.stateless-session-bean.slsb.bean-pool.*
idle-timeout-in-seconds = 200
steady-pool-size = 32
total-beans-destroyed = 12
num-threads-waiting = 0
num-beans-in-pool = 4
max-pool-size = 1024
pool-resize-quantity = 12
total-beans-created = 42
Tuning the bean involves charting the behavior of the cache and pool for the bean in question
over a period of time.
If too many passivations are happening and the JVM heap remains fairly small, then the
max-cache-size or the cache-idle-timeout-in-seconds can be increased. If garbage
Chapter 2 • TuningYour Application 33
Page 34

EJB PerformanceTuning
collection is happening too frequently, and the pool size is growing, but the cache hit rate is
small, then the pool-idle-timeout-in-seconds can be reduced to destroy the instances.
Note – Specifying a max-pool-size of zero (0) means that the pool is unbounded. The pooled
beans remain in memory unless they are removed by specifying a small interval for
pool-idle-timeout-in-seconds. For production systems, specifying the pool as unbounded is
NOT recommended.
Monitoring Individual EJB Components
To gather method invocation statistics for all methods in a bean, use this command:
asadmin get -m monitorableObject.*
where monitorableObject is a fully-qualied identier from the hierarchy of objects that can be
monitored, shown below.
serverInstance.application.applicationName.ejb-module.moduleName
where moduleName is x_jar for module x.jar.
■
.stateless-session-bean.beanName
.bean-pool
.bean-method.methodName
■
.stateful-session-bean.beanName
.bean-cache
.bean-method.methodName
■
.entity-bean.beanName
.bean-cache
.bean-pool
.bean-method.methodName
■
.message-driven-bean.beanName
.bean-pool
.bean-method.methodName (methodName = onMessage)
For standalone beans, use this pattern:
serverInstance.application.applicationName.standalone-ejb-module.moduleName
The possible identiers are the same as for ejb-module.
For example, to get statistics for a method in an entity bean, use this command:
asadmin get -m serverInstance.application.appName.ejb-module.moduleName
.entity-bean.beanName.bean-method.methodName.*
Sun GlassFish Enterprise Server 2.1 PerformanceTuning Guide • January 200934
Page 35

EJB PerformanceTuning
To nd the possible objects (applications, modules, beans, and methods) and object attributes
that can be monitored, use the Admin Console. For more information, see Chapter 18,
“Monitoring Components and Services,” in Sun GlassFish Enterprise Server 2.1 Administration
. Alternatively, use the asadmin list command. For more information, see list(1).
Guide
For statistics on stateful session bean passivations, use this command:
asadmin get -m serverInstance.application.appName.ejb-module.moduleName
.stateful-session-bean.beanName.bean-cache.*
From the attribute values that are returned, use this command:
num-passivationsnum-passivation-errorsnum-passivation-success
General Guidelines
The following guidelines can improve performance of EJB components. Keep in mind that
decomposing an application into many EJB components creates overhead and can degrade
performance. EJB components are not simply Java objects. They are components with
semantics for remote call interfaces, security, and transactions, as well as properties and
methods.
Use High Performance Beans
Use high-performance beans as much as possible to improve the overall performance of your
application. For more information, see “Tuning Tips for Specic Types of EJB Components” on
page 42
The types of EJB components are listed below, from the highest performance to the lowest:
1. Stateless Session Beans and Message Driven Beans
2. Stateful Session Beans
3. Container Managed Persistence (CMP) entity beans congured as read-only
4. Bean Managed Persistence (BMP) entity beans congured as read-only
5. CMP beans
6. BMP beans
Use Caching
Caching can greatly improve performance when used wisely. For example:
■
Cache EJB references: To avoid a JNDI lookup for every request, cache EJB references in
servlets.
■
Cache home interfaces: Since repeated lookups to a home interface can be expensive, cache
references to EJBHomes in the init() methods of servlets.
Chapter 2 • TuningYour Application 35
Page 36

EJB PerformanceTuning
■
Cache EJB resources: Use setSessionContext() or ejbCreate() to cache bean resources.
This is again an example of using bean lifecycle methods to perform application actions only
once where possible. Remember to release acquired resources in the ejbRemove() method.
Use the Appropriate Stubs
The stub classes needed by EJB applications are generated dynamically at runtime when an EJB
client needs them. This means that it is not necessary to generate the stubs or retrieve the client
JAR le when deploying an application with remote EJB components. When deploying an
application, it is no longer necessary to specify the --retrieve option, which can speed up
deployment.
If you have a legacy rich-client application that directly uses the CosNaming service (not a
recommended conguration), then you must generate the stubs for your application explicitly
using RMIC. For more information, see
for more details.
Guide
Sun GlassFish Enterprise Server 2.1 Troubleshooting
Remove Unneeded Stateful Session Beans
Removing unneeded stateful session beans avoids passivating them, which requires disk
operations.
Cache and Pool TuningTips
Follow these tips when using the EJB cache and pools to improve performance:
■
Explicitly call remove(): Allow stateful session EJB components to be removed from the
container cache by explicitly calling of the remove() method in the client.
■
Tune the entity EJB component’s pool size: Entity Beans use both the EJB pool and cache
settings. Tune the entity EJB component’s pool size to minimize the creation and
destruction of beans. Populating the pool with a non-zero steady size before hand is useful
for getting better response for initial requests.
■
Cache bean-specic resources: Use the setEntityContext() method to cache bean specic
resources and release them using the unSetEntityContext() method.
■
Load related data eciently for container-managed relationships (CMRs). For more
information, see
■
Identify read-only beans: Congure read-only entity beans for read only operations. For
more information, see
“Pre-fetching Container Managed Relationship (CMR) Beans” on page 44
“Read-Only Entity Beans” on page 43
Using Local and Remote Interfaces
This section describes some considerations when EJB components are used by local and remote
clients.
Sun GlassFish Enterprise Server 2.1 PerformanceTuning Guide • January 200936
Page 37

EJB PerformanceTuning
Prefer Local Interfaces
An EJB component can have remote and local interfaces. Clients not located in the same
application server instance as the bean (remote clients) use the remote interface to access the
bean. Calls to the remote interface require marshalling arguments, transportation of the
marshalled data over the network, un-marshaling the arguments, and dispatch at the receiving
end. Thus, using the remote interface entails signicant overhead.
If an EJB component has a local interface, then local clients in the same application server
instance can use it instead of the remote interface. Using the local interface is more ecient,
since it does not require argument marshalling, transportation, and un-marshalling.
If a bean is to be used only by local clients then it makes sense to provide only the local interface.
If, on the other hand, the bean is to be location-independent, then you should provide both the
remote and local interfaces so that remote clients use the remote interface and local clients can
use the local interface for eciency.
Using Pass-By-Reference Semantics
By default, the Enterprise Server uses pass-by-value semantics for calling the remote interface of
a bean, even if it is co-located. This can be expensive, since clients using pass-by-value
semantics must copy arguments before passing them to the EJB component.
However, local clients can use pass-by-reference semantics and thus the local and remote
interfaces can share the passed objects. But this means that the argument objects must be
implemented properly, so that they are shareable. In general, it is more ecient to use
pass-by-reference semantics when possible.
Using the remote and local interfaces appropriately means that clients can access EJB
components eciently. That is, local clients use the local interface with pass-by-reference
semantics, while remote clients use the remote interface with pass-by-value semantics.
However, in some instances it might not be possible to use the local interface, for example
when:
■
The application predates the EJB 2.0 specication and was written without any local
interfaces.
■
There are bean-to-bean calls and the client beans are written without making any
co-location assumptions about the called beans.
For these cases, the Enterprise Server provides a pass-by-reference option that clients can use to
pass arguments by reference to the remote interface of a co-located EJB component.
You can specify the pass-by-reference option for an entire application or a single EJB
component. When specied at the application level, all beans in the application use
pass-by-reference semantics when passing arguments to their remote interfaces. When
specied at the bean level, all calls to the remote interface of the bean use pass-by-reference
Chapter 2 • TuningYour Application 37
Page 38

EJB PerformanceTuning
semantics. See “Value Added Features” in Sun GlassFish Enterprise Server 2.1 Developer’s Guide
for more details about the pass-by-reference ag.
To specify that an EJB component will use pass by reference semantics, use the following tag in
the sun-ejb-jar.xml deployment descriptor:
<pass-by-reference>true</pass-by-reference>.
This avoids copying arguments when the EJB component’s methods are invoked and avoids
copying results when methods return. However, problems will arise if the data is modied by
another source during the invocation.
Improving Performance of EJB Transactions
This section provides some tips to improve performance when using transactions.
Use Container-Managed Transactions
Container-managed transactions are preferred for consistency, and provide better
performance.
Don’tEncompass User Input Time
To avoid resources being held unnecessarily for long periods, a transaction should not
encompass user input or user think time.
Identify Non-Transactional Methods
Declare non-transactional methods of session EJB components with NotSupported or Never
transaction attributes. These attributes can be found in the ejb-jar.xml deployment descriptor
le. Transactions should span the minimum time possible since they lock database rows.
UseTX_REQUIRED for Long Transaction Chains
For very large transaction chains, use the transaction attribute TX_REQUIRED. To ensure EJB
methods in a call chain, use the same transaction.
Use Lowest Cost Database Locking
Use the lowest cost locking available from the database that is consistent with any transaction.
Commit the data after the transaction completes rather than after each method call.
Use XA-Capable Data Sources Only When Needed
When multiple database resources, connector resources or JMS resources are involved in one
transaction, a distributed or global transaction needs to be performed. This requires XA capable
resource managers and data sources. Use XA capable data sources, only when two or more data
Sun GlassFish Enterprise Server 2.1 PerformanceTuning Guide • January 200938
Page 39

EJB PerformanceTuning
source are going to be involved in a transaction. If a database participates in some distributed
transactions, but mostly in local or single database transactions, it is advisable to register two
separate JDBC resources and use the appropriate resource in the application.
Congure JDBC Resources as One-Phase Commit Resources
To improve performance of transactions involving multiple resources, the Application Server
uses last agent optimization (LAO), which allows the conguration of one of the resources in a
distributed transaction as a one-phase commit (1PC) resource. Since the overhead of
multiple-resource transactions is much higher for a JDBC resource than a message queue, LAO
substantially improves performance of distributed transactions involving one JDBC resource
and one or more message queues. To take advantage of LAO, congure a JDBC resource as a
1PC resource. Nothing special needs to be done to congure JMS resources.
In global transactions involving multiple JDBC resources, LAO will still improve performance,
however, not as much as for one JDBC resource. In this situation, one of the JDBC resources
should be congured as 1PC, and all others should be congured as XA.
Use the Least ExpensiveTransaction Attribute
Set the following transaction attributes in the EJB deployment descriptor le (ejb-jar.xml).
Options are listed from best performance to worst. To improve performance, choose the least
expensive attribute that will provide the functionality your application needs:
1. NEVER
2. TX_NOTSUPPORTED
3. TX_MANDATORY
4. TX_SUPPORTS
5. TX_REQUIRED
6. TX_REQUIRESNEW
Using Special Techniques
Special performance-enhancing techniques are discussed in the following sections:
■
“Version Consistency” on page 39
■
“Request Partitioning” on page 41
VersionConsistency
Note – The technique in section applies only to the EJB 2.1 architecture. In the EJB 3.0
architecture, use the Java Persistence API (JPA).
Chapter 2 • TuningYour Application 39
Page 40

EJB PerformanceTuning
Use version consistency to improve performance while protecting the integrity of data in the
database. Since the application server can use multiple copies of an EJB component
simultaneously, an EJB component’s state can potentially become corrupted through
simultaneous access.
The standard way of preventing corruption is to lock the database row associated with a
particular bean. This prevents the bean from being accessed by two simultaneous transactions
and thus protects data. However, it also decreases performance, since it eectively serializes all
EJB access.
Version consistency is another approach to protecting EJB data integrity. To use version
consistency, you specify a column in the database to use as a version number. The EJB lifecycle
then proceeds like this:
■
The rst time the bean is used, the ejbLoad() method loads the bean as normal, including
loading the version number from the database.
■
The ejbStore() method checks the version number in the database versus its value when
the EJB component was loaded.
■
If the version number has been modied, it means that there has been simultaneous
access to the EJB component and ejbStore() throws a
ConcurrentModificationException.
■
Otherwise, ejbStore() stores the data and completes as normal.
The ejbStore() method performs this validation at the end of the transaction regardless of
whether any data in the bean was modied.
Subsequent uses of the bean behave similarly, except that the ejbLoad() method loads its initial
data (including the version number) from an internal cache. This saves a trip to the database.
When the ejbStore() method is called, the version number is checked to ensure that the
correct data was used in the transaction.
Version consistency is advantageous when you have EJB components that are rarely modied,
because it allows two transactions to use the same EJB component at the same time. Because
neither transaction modies the data, the version number is unchanged at the end of both
transactions, and both succeed. But now the transactions can run in parallel. If two transactions
occasionally modify the same EJB component, one will succeed and one will fail and can be
retried using the new values—which can still be faster than serializing all access to the EJB
component if the retries are infrequent enough (though now your application logic has to be
prepared to perform the retry operation).
To use version consistency, the database schema for a particular table must include a column
where the version can be stored. You then specify that table in the sun-cmp-mapping.xml
deployment descriptor for a particular bean:
<entity-mapping>
<cmp-field-mapping>
Sun GlassFish Enterprise Server 2.1 PerformanceTuning Guide • January 200940
Page 41

EJB PerformanceTuning
...
</cmp-field-mapping>
<consistency>
<check-version-of-accessed-instances>
<column-name>OrderTable.VC_VERSION_NUMBER</column-name>
</check-version-of-accessed-instances>
</consistency>
</entity-mapping>
In addition, you must establish a trigger on the database to automatically update the version
column when data in the specied table is modied. The Application Server requires such a
trigger to use version consistency. Having such a trigger also ensures that external applications
that modify the EJB data will not conict with EJB transactions in progress.
For example, the following DDL illustrates how to create a trigger for the Order table:
CREATE TRIGGER OrderTrigger
BEFORE UPDATE ON OrderTable
FOR EACH ROW
WHEN (new.VC_VERSION_NUMBER = old.VC_VERSION_NUMBER)
DECLARE
BEGIN
:NEW.VC_VERSION_NUMBER := :OLD.VC_VERSION_NUMBER + 1;
END;
Request Partitioning
Request partitioning enables you to assign a request priority to an EJB component. This gives
you the exibility to make certain EJB components execute with higher priorities than others.
An EJB component which has a request priority assigned to it will have its requests (services)
executed within an assigned threadpool. By assigning a threadpool to its execution, the EJB
component can execute independently of other pending requests. In short, request partitioning
enables you to meet service-level agreements that have diering levels of priority assigned to
dierent services.
Request partitioning applies only to remote EJB components (those that implement a remote
interface). Local EJB components are executed in their calling thread (for example, when a
servlet calls a local bean, the local bean invocation occurs on the servlet’s thread).
▼
To enable request partitioning
Congure additional threadpools for EJB execution using the Admin Console.
1
2
Add the additional threadpool IDs to the Application Server’sORB.
You can do this by editing the domain.xml le or through the Admin Console.
Chapter 2 • TuningYour Application 41
Page 42

EJB PerformanceTuning
3
4
For example, enable threadpools named priority-1 and priority-2 to the <orb> element as
follows:
<orb max-connections="1024" message-fragment-size="1024"
use-thread-pool-ids="thread-pool-1,priority-1,priority-2">
Include the threadpool ID in the use-thread-pool-id element of the EJB component’s
sun-ejb-jar.xml deployment descriptor.
For example, the following sun-ejb-jar.xml deployment descriptor for an EJB component
named “TheGreeter” is assigned to a thread pool named priority-2:
<sun-ejb-jar>
<enterprise-beans>
<unique-id>1</unique-id>
<ejb>
<ejb-name>TheGreeter</ejb-name>
<jndi-name>greeter</jndi-name>
<use-thread-pool-id>priority-1</use-thread-pool-id>
</ejb>
</enterprise-beans>
</sun-ejb-jar>
Restart the Application Server.
Tuning Tips for SpecicTypes of EJB Components
This section provides tips for tuning various specic types of EJB components:
■
“Entity Beans” on page 42
■
“Stateful Session Beans” on page 42
■
“Stateless Session Beans” on page 43
■
“Read-Only Entity Beans” on page 43
■
“Pre-fetching Container Managed Relationship (CMR) Beans” on page 44
Entity Beans
Depending on the usage of a particular entity bean, one should tune max-cache-size so that
beans that are used less (for example, an order that is created and never used after the
transaction is over) are cached less, and beans that are used frequently (for example, an item in
the inventory that gets referenced very often), are cached more in numbers.
Stateful Session Beans
When a stateful bean represents a user, a reasonable max-cache-size of beans is the expected
number of concurrent users on the application server process. If this value is too low (in relation
Sun GlassFish Enterprise Server 2.1 PerformanceTuning Guide • January 200942
Page 43

EJB PerformanceTuning
to the steady load of users), beans would be frequently passivated and activated, causing a
negative impact on the response times, due to CPU intensive serialization and deserialization as
well as disk I/O.
Another important variable for tuning is cache-idle-timeout-in-seconds where at periodic
intervals of cache-idle-timeout-in-seconds, all the beans in the cache that have not been
accessed for more than cache-idle-timeout-in-seconds time, are passivated. Similar to an
HTTP session time-out, the bean is removed after it has not been accessed for
removal-timeout-in-seconds. Passivated beans are stored on disk in serialized form. A large
number of passivated beans could not only mean many les on the disk system, but also slower
response time as the session state has to be de-serialized before the invocation.
Checkpoint only when needed
In high availability mode, when using stateful session beans, consider checkpointing only those
methods that alter the state of the bean signicantly. This reduces the number of times the bean
state has to be checkpointed into the persistent store.
Stateless Session Beans
Stateless session beans are more readily pooled than entity or the stateful session beans. Valid
values for steady-pool-size, pool-resize-quantity and max-pool-size are the best
tunables for these type of beans. Set the steady-pool-size to greater than zero if you want to
pre-populate the pool. This way, when the container comes up, it creates a pool with
steady-pool-size number of beans. By pre-populating the pool it is possible to avoid the
object creation time during method invocations.
Setting the steady-pool size to a very large value can cause unwanted memory growth and
can result in large garbage collection times. pool-resize-quantity determines the rate of
growth as well as the rate of decay of the pool. Setting it to a small value is better as the decay
behaves like an exponential decay. Setting a small max-pool-size can cause excessive object
destruction (and as a result excessive object creation) as instances are destroyed from the pool if
the current pool size exceeds max-pool-size.
Read-Only Entity Beans
Read-only entity beans cache data from the database. Application Server supports read-only
beans that use both bean-managed persistence (BMP) and container-managed persistence
(CMP). Of the two types, CMP read-only beans provide signicantly better performance. In the
EJB lifecycle, the EJB container calls the ejbLoad() method of a read-only bean once. The
container makes multiple copies of the EJB component from that data, and since the beans do
not update the database, the container never calls the ejbStore() method. This greatly reduces
database trac for these beans.
If there is a bean that never updates the database, use a read-only bean in its place to improve
performance. A read-only bean is appropriate if either:
Chapter 2 • TuningYour Application 43
Page 44

EJB PerformanceTuning
■
Database rows represented by the bean do not change.
■
The application can tolerate using out-of-date values for the bean.
For example, an application might use a read-only bean to represent a list of best-seller books.
Although the list might change occasionally in the database (say, from another bean entirely),
the change need not be reected immediately in an application.
The ejbLoad() method of a read-only bean is handled dierently for CMP and BMP beans. For
CMP beans, the EJB container calls ejbLoad() only once to load the data from the database;
subsequent uses of the bean just copy that data. For BMP beans, the EJB container calls
ejbLoad() the rst time a bean is used in a transaction. Subsequent uses of that bean within the
transaction use the same values. The container calls ejbLoad() for a BMP bean that doesn’t run
within a transaction every time the bean is used. Therefore, read-only BMP beans still make a
number of calls to the database.
To create a read-only bean, add the following to the EJB deployment descriptor
sun-ejb-jar.xml:
<is-read-only-bean>true</is-read-only-bean>
<refresh-period-in-seconds>600</refresh-period-in-seconds>
Refresh period
An important parameter for tuning read-only beans is the refresh period, represented by the
deployment descriptor entity refresh-period-in-seconds . For CMP beans, the rst access to
a bean loads the bean’s state. The rst access after the refresh period reloads the data from the
database. All subsequent uses of the bean uses the newly refreshed data (until another refresh
period elapses). For BMP beans, an ejbLoad() method within an existing transaction uses the
cached data unless the refresh period has expired (in which case, the container calls ejbLoad()
again).
This parameter enables the EJB component to periodically refresh its “snapshot” of the database
values it represents. If the refresh period is less than or equal to 0, the bean is never refreshed
from the database (the default behavior if no refresh period is given).
Pre-fetching Container Managed Relationship (CMR) Beans
If a container-managed relationship (CMR) exists in your application, loading one bean will
load all its related beans. The canonical example of CMR is an order-orderline relationship
where you have one Order EJB component that has related OrderLine EJB components. In
previous releases of the application server, to use all those beans would require multiple
database queries: one for the Order bean and one for each of the OrderLine beans in the
relationship.
In general, if a bean has n relationships, using all the data of the bean would require n+1
database accesses. Use CMR pre-fetching to retrieve all the data for the bean and all its related
beans in one database access.
Sun GlassFish Enterprise Server 2.1 PerformanceTuning Guide • January 200944
Page 45

EJB PerformanceTuning
For example, you have this relationship dened in the ejb-jar.xml le:
<relationships>
<ejb-relation>
<description>Order-OrderLine</description>
<ejb-relation-name>Order-OrderLine</ejb-relation-name>
<ejb-relationship-role>
<ejb-relationship-role-name>
Order-has-N-OrderLines
</ejb-relationship-role-name>
<multiplicity>One</multiplicity>
<relationship-role-source>
<ejb-name>OrderEJB</ejb-name>
</relationship-role-source>
<cmr-field>
<cmr-field-name>orderLines</cmr-field-name>
<cmr-field-type>java.util.Collection</cmr-field-type>
</cmr-field>
</ejb-relationship-role>
</ejb-relation>
</relationships>
When a particular Order is loaded, you can load its related OrderLines by adding this to the
sun-cmp-mapping.xml le for the application:
<entity-mapping>
<ejb-name>Order</ejb-name>
<table-name>...</table-name>
<cmp-field-mapping>...</cmp-field-mapping>
<cmr-field-mapping>
<cmr-field-name>orderLines</cmr-field-name>
<column-pair>
<column-name>OrderTable.OrderID</column-name>
<column-name>OrderLineTable.OrderLine_OrderID</column-name>
</column-pair>
<fetched-with>
<default>
</fetched-with>
</cmr-field-mapping>
</entity-mappping>
Now when an Order is retrieved, the CMP engine issues SQL to retrieve all related OrderLines
with a SELECT statement that has the following WHERE clause:
OrderTable.OrderID = OrderLineTable.OrderLine_OrderID
This clause indicates an outer join. These OrderLines are pre-fetched.
Chapter 2 • TuningYour Application 45
Page 46

EJB PerformanceTuning
Pre-fetching generally improves performance because it reduces the number of database
accesses. However, if the business logic often uses Orders without referencing their OrderLines,
then this can have a performance penalty, that is, the system has spent the eort to pre-fetch the
OrderLines that are not actually needed.
Avoidpre-fetching for specic nder methods; this can often avoid that penalty. For example,
consider an order bean has two nder methods: a findByPrimaryKey method that uses the
orderlines, and a findByCustomerId method that returns only order information and hence
doesn’t use the orderlines. If you’ve enabled CMR pre-fetching for the orderlines, both nder
methods will pre-fetch the orderlines. However, you can prevent pre-fetching for the
findByCustomerId method by including this information in the sun-ejb-jar.xml descriptor:
<ejb>
<ejb-name>OrderBean</ejb-name>
...
<cmp>
<prefetch-disabled>
<query-method>
<method-name>findByCustomerId</method-name>
</query-method>
</prefetch-disabled>
</cmp>
</ejb>
JDBC and Database Access
Here are some tips to improve the performance of database access.
Use JDBC Directly
When dealing with large amounts of data, such as searching a large database, use JDBC directly
rather than using Entity EJB components.
Encapsulate Business Logic in Entity EJB Components
Combine business logic with the Entity EJB component that holds the data needed for that logic
to process.
Close Connections
To ensure that connections are returned to the pool, always close the connections after use.
Minimize the Database Transaction Isolation Level
Use the default isolation level provided by the JDBC driver rather than calling
setTransactionIsolationLevel(), unless you are certain that your application behaves
correctly and performs better at a dierent isolation level.
Sun GlassFish Enterprise Server 2.1 PerformanceTuning Guide • January 200946
Page 47

EJB PerformanceTuning
Reduce the database transaction isolation level when appropriate. Reduced isolation levels
reduce work in the database tier, and could lead to better application performance. However,
this must be done after carefully analyzing the database table usage patterns.
Set the database transaction isolation level with the Admin Console on the Resources > JDBC >
Connection Pools > PoolName page. For more information on tuning JDBC connection pools,
“JDBC Connection Pool Settings” on page 77 .
see
Tuning Message-Driven Beans
This section provides some tips to improve performance when using JMS with message-driven
beans (MDBs).
Use getConnection()
JMS connections are served from a connection pool. This means that calling getConnection()
on a Queue connection factory is fast.
Caution – Previous to version 8.1, it was possible to reuse a connection with a servlet or EJB
component. That is, the servlet could call getConnection() in its init() method and then
continually call getSession() for each servlet invocation. If you use JMS within a global
transaction, that no longer works: applications can only call getSession() once for each
connection. After than, the connection must be closed (which doesn’t actually close the
connection; it merely returns it to the pool). This is a general feature of portable Java EE 1.4
applications; the Sun Java System Application Server enforces that restriction where previous
(Java EE 1.3-based) application servers did not.
Tunethe Message-Driven Bean’s Pool Size
The container for message-driven beans (MDB) is dierent than the containers for entity and
session beans. In the MDB container, sessions and threads are attached to the beans in the MDB
pool. This design makes it possible to pool the threads for executing message-driven requests in
the container.
Tune the Message-Driven bean’spool size to optimize the concurrent processing of messages.
Set the size of the MDB pool to, based on all the parameters of the server (taking other
applications into account). For example, a value greater than 500 is generally too large.
You can congure MDB pool settings in the Admin Console at Congurations > cong-name >
EJB Container (MDB Settings). You can also set it with asadmin as follows:
asadmin set server.mdb-container.max-pool-size = value
Chapter 2 • TuningYour Application 47
Page 48

EJB PerformanceTuning
Cache Bean-Specic Resources
Use the setMessageDrivenContext() or ejbCreate() method to cache bean specic
resources, and release those resources from the ejbRemove() method.
Limit Use of JMS Connections
When designing an application that uses JMS connections make sure you use a methodology
that sparingly uses connections, by either pooling them or using the same connection for
multiple sessions.
The JMS connection uses two threads and the sessions use one thread each. Since these threads
are not taken from a pool and the resultant objects aren’t pooled, you could run out of memory
during periods of heavy usage.
One workaround is to move createTopicConnection into the init of the servlet.
Make sure to specically close the session, or it will stay open, which ties up resources.
Sun GlassFish Enterprise Server 2.1 PerformanceTuning Guide • January 200948
Page 49

CHAPTER 3
3
Tuning the Enterprise Server
This chapter describes some ways to tune the Enterprise Server for optimum performance,
including the following topics:
■
“Deployment Settings” on page 49
■
“Logger Settings” on page 50
■
“Web Container Settings” on page 51
■
“EJB Container Settings” on page 53
■
“Java Message Service Settings” on page 58
■
“Transaction Service Settings” on page 58
■
“HTTP Service Settings” on page 60
■
“ORB Settings” on page 70
■
“Thread Pool Settings” on page 76
■
Resources:
■
“JDBC Connection Pool Settings” on page 77
■
“Connector Connection Pool Settings” on page 80
Deployment Settings
Deployment settings can have signicant impact on performance. Follow these guidelines when
conguring deployment settings for best performance:
■
“Disable Auto-deployment” on page 50
■
“Use Pre-compiled JavaServer Pages” on page 50
■
“Disable Dynamic Application Reloading” on page 50
49
Page 50

Logger Settings
Disable Auto-deployment
Enabling auto-deployment will adversely aect deployment, though it is a convenience in a
development environment. For a production system, disable auto-deploy to optimize
performance. If auto-deployment is enabled, then the Reload Poll Interval setting can have a
signicant performance impact.
Disable auto-deployment with the Admin Console under Stand-Alone Instances > server
(Admin Server) on the Advanced/Applications Conguration tab.
Use Pre-compiled JavaServer Pages
Compiling JSP les is resource intensive and time consuming. Pre-compiling JSP les before
deploying applications on the server will improve application performance. When you do so,
only the resulting servlet class les will be deployed.
You can specify to precompile JSP les when you deploy an application through the Admin
Console or DeployTool. You can also specify to pre-compile JSP les for a deployed application
with the Admin Console under Stand-Alone Instances > server (Admin Server) on the
Advanced/ApplicationsConguration tab.
Disable Dynamic Application Reloading
If dynamic reloading is enabled, the server periodically checks for changes in deployed
applications and automatically reloads the application with the changes. Dynamic reloading is
intended for development environments and is also incompatible with session persistence. To
improve performance, disable dynamic class reloading.
Disable dynamic class reloading for an application that is already deployed with the Admin
Console under Stand-Alone Instances > server (Admin Server) on the Advanced/Applications
Conguration tab.
Logger Settings
The Application Server produces writes log messages and exception stack trace output to the log
le in the logs directory of the instance, appserver-root/domains/domain-name/logs. Naturally,
the volume of log activity can impact server performance; particularly in benchmarking
situations.
Sun GlassFish Enterprise Server 2.1 PerformanceTuning Guide • January 200950
Page 51

Web Container Settings
General Settings
In general, writing to the system log slows down performance slightly; and increased disk access
(increasing the log level, decreasing the le rotation limit or time limit) also slows down the
application.
Also, make sure that any custom log handler doesn’t log to a slow device like a network le
system since this can adversely aect performance.
Log Levels
Set the log level for the server and its subsystems in the Admin Console Logger Settings page,
Log Levels tab. The page enables you to specify the default log level for the server (labeled Root),
the default log level for javax.enterprise.system subsystems (labeled Server) such as the EJB
Container, MDB Container, Web Container, Classloader, JNDI naming system, and Security,
and for each individual subsystem.
Log levels vary from FINEST, which provides maximum log information, through SEVERE,
which logs only events that interfere with normal program execution. The default log level is
INFO. The individual subsystem log level overrides the Server setting, which in turn overrides
the Root setting.
For example, the MDB container can produce log messages at a dierent level than server
default. To get more debug messages, set the log level to FINE, FINER, or FINEST. For best
performance under normal conditions, set the log level to WARNING. Under benchmarking
conditions, it is often appropriate to set the log level to SEVERE.
WebContainer Settings
Set Web container properties with the Admin Console at Congurations > cong-name > Web
Container.
■
“Session Properties: Session Timeout” on page 51
■
“Manager Properties: Reap Interval” on page 52
■
“Disable Dynamic JSP Reloading” on page 52
Session Properties: Session Timeout
Session timeout determines how long the server maintains a session if a user does not explicitly
invalidate the session. The default value is 30 minutes. Tune this value according to your
application requirements. Setting a very large value for session timeout can degrade
performance by causing the server to maintain too many sessions in the session store. However,
setting a very small value can cause the server to reclaim sessions too soon.
Chapter 3 • Tuningthe Enterprise Server 51
Page 52

Web Container Settings
Manager Properties: Reap Interval
Modifying the reap interval can improve performance, but setting it without considering the
nature of your sessions and business logic can cause data inconsistency, especially for
time-based persistence-frequency.
For example, if you set the reap interval to 60 seconds, the value of session data will be recorded
every 60 seconds. But if a client accesses a servlet to update a value at 20 second increments,
then inconsistencies will result.
For example, consider an online auction scenario as follows:
■
Bidding starts at $5, in 60 seconds the value recorded will be $8 (three 20 second intervals).
■
During the next 40 seconds, the client starts incrementing the price. The value the client sees
is $10.
■
During the client’s20 second rest, the Application Server stops and starts in 10 seconds. As a
result, the latest value recorded at the 60 second interval ($8) is be loaded into the session.
■
The client clicks again expecting to see $11; but instead sees is $9, which is incorrect.
■
So, to avoid data inconsistencies, take into the account the expected behavior of the
application when adjusting the reap interval.
Disable Dynamic JSP Reloading
On a production system, improve web container performance by disabling dynamic JSP
reloading. To do so, edit the default-web.xml le in the config directory for each instance.
Change the servlet denition for a JSP le to look like this:
<servlet>
<servlet-name>jsp</servlet-name>
<servlet-class>org.apache.jasper.servlet.JspServlet</servlet-class>
<init-param>
<param-name>development</param-name>
<param-value>false</param-value>
</init-param>
<init-param>
<param-name>xpoweredBy</param-name>
<param-value>true</param-value>
</init-param>
<init-param>
<param-name>genStrAsCharArray</param-name>
<param-value>true</param-value>
</init-param> <load-on-startup>3</load-on-startup>
</servlet>
Sun GlassFish Enterprise Server 2.1 PerformanceTuning Guide • January 200952
Page 53

EJB Container Settings
The EJB Container has many settings that aect performance. As with other areas, use monitor
the EJB Container to track its execution and performance.
Monitoring the EJB Container
Monitoring the EJB container is disabled by default. Enable monitoring with the Admin
Console under Congurations > cong-name > Monitoring. Set the monitoring level to LOW
for to monitor all deployed EJB components, EJB pools, and EJB caches. Set the monitoring
level to HIGH to also monitor EJB business methods.
Tuning the EJB Container
The EJB container caches and pools EJB components for better performance. Tuning the cache
and pool properties can provide signicant performance benets to the EJB container. Set EJB
cache and pool settings in the Admin Console Congurations > cong-name > EJB Container
(EJB Settings).
The pool settings are valid for stateless session and entity beans while the cache settings are
valid for stateful session and entity beans.
EJB Container Settings
Overview of EJB Pooling and Caching
Both stateless session beans and entity beans can be pooled to improve server performance. In
addition, both stateful session beans and entity beans can be cached to improve performance.
TABLE 3–1 Bean Type Poolingor Caching
Bean Type Pooled Cached
Stateless Session Yes No
Stateful Session No Yes
Entity Yes Yes
The dierence between a pooled bean and a cached bean is that pooled beans are all equivalent
and indistinguishable from one another. Cached beans, on the contrary, contain conversational
state in the case of stateful session beans, and are associated with a primary key in the case of
entity beans. Entity beans are removed from the pool and added to the cache on ejbActivate()
and removed from the cache and added to the pool on ejbPassivate(). ejbActivate() is
called by the container when a needed entity bean is not in the cache. ejbPassivate() is called
by the container when the cache grows beyond its congured limits.
Chapter 3 • Tuningthe Enterprise Server 53
Page 54

EJB Container Settings
Note – If you develop and deploy your EJB components using Sun Java Studio, then you need to
edit the individual bean descriptor settings for bean pool and bean cache. These settings might
not be suitable for production-level deployment.
Tuningthe EJB Pool
A bean in the pool represents the pooled state in the EJB lifecycle. This means that the bean does
not have an identity. The advantage of having beans in the pool is that the time to create a bean
can be saved for a request. The container has mechanisms that create pool objects in the
background, to save the time of bean creation on the request path.
Stateless session beans and entity beans use the EJB pool. Keeping in mind how you use stateless
session beans and the amount of trac your server handles, tune the pool size to prevent
excessive creation and deletion of beans.
EJB Pool Settings
An individual EJB component can specify cache settings that override those of the EJB
container in the <bean-pool> element of the EJB component’s sun-ejb-jar.xml deployment
descriptor.
The EJB pool settings are:
■
Initial and Minimum Pool Size: the initial and minimum number of beans maintained in
the pool. Valid values are from 0 to MAX_INTEGER, and the default value is 8. The
corresponding EJB deployment descriptor attribute is steady-pool-size.
Set this property to a number greater than zero for a moderately loaded system. Having a
value greater than zero ensures that there is always a pooled instance to process an incoming
request.
■
Maximum Pool Size: the maximum number of connections that can be created to satisfy
client requests. Valid values are from zero to MAX_INTEGER., and the default is 32. A value of
zero means that the size of the pool is unbounded. The potential implication is that the JVM
heap will be lled with objects in the pool. The corresponding EJB deployment descriptor
attribute is max-pool-size.
Set this property to be representative of the anticipated high load of the system. An very
large pool wastes memory and can slow down the system. A very small pool is also
inecient due to contention.
■
Pool Resize Quantity: the number of beans to be created or deleted when the cache is being
serviced by the server. Valid values are from zero to MAX_INTEGER and default is 16. The
corresponding EJB deployment descriptor attribute is resize-quantity.
Be sure to re-calibrate the pool resize quantity when you change the maximum pool size, to
maintain an equilibrium. Generally, a larger maximum pool size should have a larger pool
resize quantity.
Sun GlassFish Enterprise Server 2.1 PerformanceTuning Guide • January 200954
Page 55

EJB Container Settings
■
Pool Idle Timeout: the maximum time that a stateless session bean, entity bean, or
message-driven bean is allowed to be idle in the pool. After this time, the bean is destroyed if
the bean in case is a stateless session bean or a message driver bean. This is a hint to server.
The default value is 600 seconds. The corresponding EJB deployment descriptor attribute is
pool-idle-timeout-in-seconds.
If there are more beans in the pool than the maximum pool size, the pool drains back to
initial and minimum pool size, in steps of pool resize quantity at an interval specied by the
pool idle timeout. If the resize quantity is too small and the idle timeout large, you will not
see the pool draining back to steady size quickly enough.
Tuningthe EJB Cache
A bean in the cache represents the ready state in the EJB lifecycle. This means that the bean has
an identity (for example, a primary key or session ID) associated with it.
Beans moving out of the cache have to be passivated or destroyed according to the EJB lifecycle.
Once passivated, a bean has to be activated to come back into the cache. Entity beans are
generally stored in databases and use some form of query language semantics to load and store
data. Session beans have to be serialized when storing them upon passivation onto the disk or a
database; and similarly have to be deserialized upon activation.
Any incoming request using these “ready” beans from the cache avoids the overhead of
creation, setting identity, and potentially activation. So, theoretically, it is good to cache as
many beans as possible. However, there are drawbacks to caching:
■
Memory consumed by all the beans aects the heap available in the Virtual Machine.
■
Increasing objects and memory taken by cache means longer, and possibly more frequent,
garbage collection.
■
The application server might run out of memory unless the heap is carefully tuned for peak
loads.
Keeping in mind how your application uses stateful session beans and entity beans, and the
amount of trac your server handles, tune the EJB cache size and time-out settings to minimize
the number of activations and passivations.
EJB Cache Settings
An individual EJB component can specify cache settings that override those of the EJB
container in the <bean-cache> element of the EJB component’s sun-ejb-jar.xml deployment
descriptor.
The EJB cache settings are:
Chapter 3 • Tuningthe Enterprise Server 55
Page 56

Max Cache Size
Max Cache Size Maximum number of beans in the cache. Make this setting greater than one. The default value is 512. A
value of zero indicates the cache is unbounded, which means the size of the cache is governed by Cache
Idle Timeout and Cache Resize Quantity. The corresponding EJB deployment descriptor attribute is
max-cache-size.
Cache Resize
Quantity
Number of beans to be created or deleted when the cache is serviced by the server. Valid values are from
zero to MAX_INTEGER, and the default is 16. The corresponding EJB deployment descriptor attribute is
resize-quantity.
Removal Timeout Amount of time that a stateful session bean remains passivated (idle in the backup store). If a bean was not
accessed after this interval of time, then it is removed from the backup store and will not be accessible to
the client. The default value is 60 minutes. The corresponding EJB deployment descriptor attribute is
removal-timeout-in-seconds.
Removal Selection
Policy
Cache Idle
Timeout
Algorithm used to remove objects from the cache. The corresponding EJB deployment descriptor
attribute is victim-selection-policy.Choices are:
■
NRU (not recently used). This is the default, and is actually pseudo-random selection policy.
■
FIFO (rst in, rst out)
■
LRU (least recently used)
Maximum time that a stateful session bean or entity bean is allowed to be idle in the cache. After this time,
the bean is passivated to the backup store. The default value is 600 seconds. The corresponding EJB
deployment descriptor attribute is cache-idle-timeout-in-seconds.
Refresh period Rate at which a read-only-bean is refreshed from the data source. Zero (0) means that the bean is never
refreshed. The default is 600 seconds. The corresponding EJB deployment descriptor attribute is
refresh-period-in-seconds. Note: this setting does not have a custom eld in the Admin Console. To
set it, use the Add Property button in the Additional Properties section.
Pool and Cache Settings for Individual EJB Components
Individual EJB pool and cache settings in the sun-ejb-jar.xml deployment descriptor override
those of the EJB container. The following table lists the cache and pool settings for each type of
EJB component.
TABLE 3–2 EJB Cache and Pool Settings
Cache Settings Pool Settings
cacheidletimeoutinseconds
Typeof
Bean
Stateful
cacheresizequantity
max- cachesize
XXXXX
Session
Stateless
Session
Sun GlassFish Enterprise Server 2.1 PerformanceTuning Guide • January 200956
removaltimeout- inseconds
victimselectionpolicy
refreshperiodinseconds
steadypool-size
poolresizequantity
maxpoolsize
pool-idletimeout-inseconds
XXXX
Page 57

Refresh period
TABLE 3–2 EJB Cache and Pool Settings (Continued)
Cache Settings Pool Settings
cache-
Typeof
Bean
cacheresizequantity
max- cachesize
idletimeoutinseconds
removaltimeout- inseconds
victimselectionpolicy
refreshperiodinseconds
steadypool-size
poolresizequantity
maxpoolsize
pool-idletimeout-inseconds
Entity XXXXX XXXX
Entity
Readonly
Message
Driven
Bean
XXXXXXXXXX
XXX
Commit Option
The commit option controls the action taken by the EJB container when an EJB component
completes a transaction. The commit option has a signicant impact on performance.
There are two possible values for the commit option:
■
Commit option B: When a transaction completes, the bean is kept in the cache and retains
its identity. The next invocation for the same primary key can use the cached instance. The
EJB container will call the bean’s ejbLoad() method before the method invocation to
synchronize with the database.
■
Commit option C: When a transaction completes, the EJB container calls the bean’s
ejbPassivate() method, the bean is disassociated from its primary key and returned to the
free pool. The next invocation for the same primary key will have to get a free bean from the
pool, set the PrimaryKey on this instance, and then call ejbActivate() on the instance.
Again, the EJB container will call the bean’s ejbLoad() before the method invocation to
synchronize with the database.
Option B avoids ejbAcivate() and ejbPassivate() calls. So, in most cases it performs better
than option C since it avoids some overhead in acquiring and releasing objects back to pool.
However, there are some cases where option C can provide better performance. If the beans in
the cache are rarely reused and if beans are constantly added to the cache, then it makes no
sense to cache beans. With option C is used, the container puts beans back into the pool (instead
of caching them) after method invocation or on transaction completion. This option reuses
instances better and reduces the number of live objects in the JVM, speeding garbage collection.
Determining the best commit option
To determine whether to use commit option B or commit option C, rst take a look at the
cache-hits value using the monitoring command for the bean. If the cache hits are much higher
Chapter 3 • Tuningthe Enterprise Server 57
Page 58

Java Message Service Settings
than cache misses, then option B is an appropriate choice. You might still have to change the
max-cache-size and cache-resize-quantity to get the best result.
If the cache hits are too low and cache misses are very high, then the application is not reusing
the bean instances and hence increasing the cache size (using max-cache-size) will not help
(assuming that the access pattern remains the same). In this case you might use commit option
C. If there is no great dierence between cache-hits and cache-misses then tune
max-cache-size, and probably cache-idle-timeout-in-seconds.
Java Message Service Settings
The Type attribute that determines whether the Java Message Service (JMS) is on local or
remote system aects performance. Local JMS performance is better than remote JMS
performance. However, a remote cluster can provide failover capabilities and can be
administrated together, so there may be other advantages of using remote JMS. For more
information on using JMS, see
GlassFish Enterprise Server 2.1 Administration Guide
Chapter 4, “Conguring Java Message Service Resources,” in Sun
Transaction Service Settings
.
The transaction manager makes it possible to commit and roll back distributed transactions.
A distributed transactional system writes transactional activity into transaction logs so that they
can be recovered later. But writing transactional logs has some performance penalty.
Monitoring the Transaction Service
Transaction Manager monitoring is disabled by default. Enable monitoring of the transaction
service with the Admin Console at Congurations > cong-name > Monitoring.
You can also enable monitoring with these commands:
set serverInstance.transaction-service.monitoringEnabled=true
reconfig serverInstance
Viewing Monitoring Information
When you have enabled monitoring of the transaction service, view results
■
With Admin Console at Standalone Instances > server-name (Monitor | Monitor). Select
transaction-service from the View dropdown.
■
With this command:
Sun GlassFish Enterprise Server 2.1 PerformanceTuning Guide • January 200958
Page 59

asadmin get -m serverInstance.transaction-service.*
The following statistics are gathered on the transaction service:
■
total-tx-completed Completed transactions.
■
total-tx-rolled-back Total rolled back transactions.
■
total-tx-inflight Total inight (active) transactions.
■
isFrozen Whether transaction system is frozen (true or false)
■
inflight-tx List of inight (active) transactions.
Here is a sample of the output using asadmin:
********** Stats for JTS ************
total-tx-completed = 244283
total-tx-rolled-back = 2640
total-tx-inflight = 702
isFrozen = False
inflight-tx =
Transaction Id , Status, ElapsedTime(msec)
000000000003C95A_00, Active, 999
Tuning the Transaction Service
Transaction Service Settings
This property can be used to disable the transaction logging, where the performance is of
utmost importance more than the recovery. This property, by default, won’t exist in the server
conguration.
Disable Distributed Transaction Logging
To disable distributed transaction logging with the Admin Console, go to Congurations >
cong-name > Transaction Service. Click on Add Property, and specify:
■
Name: disable-distributed-transaction-logging
■
Value: true
You can also set this property with asadmin, for example:
asadmin set
server1.transaction-service.disable-distributed-transaction-logging=true
Setting this attribute to true disables transaction logging, which can improve performance.
Setting it to false (the default), makes the transaction service write transactional activity to
transaction logs so that transactions can be recovered. If Recover on Restart is checked, this
property is ignored.
Set this property to true only if performance is more important than transaction recovery.
Chapter 3 • Tuningthe Enterprise Server 59
Page 60

HTTP Service Settings
Recover On Restart (AutomaticRecovery)
To set the Recover on Restart attribute with the Admin Console, go to Congurations >
cong-name > Transaction Service. Click the Recover check box to set it to true (checked, the
default) or false (un-checked).
You can also set automatic recovery with asadmin, for example:
asadmin set server1.transaction-service.automatic-recovery=false
When Recover on Restart is true, the server will always perform transaction logging, regardless
of the Disable Distributed Transaction Logging attribute.
If Recover on Restart is false, then:
■
If Disable Distributed Transaction Logging is false (the default), then the server will write
transaction logs.
■
If Disable Distributed Transaction Logging is true, then the server will not write transaction
logs.
Not writing transaction logs will give approximately twenty percent improvement in
performance, but at the cost of not being able to recover from any interrupted transactions.
The performance benet applies to transaction-intensive tests. Gains in real applications
may be less.
Keypoint Interval
The keypoint interval determines how often entries for completed transactions are removed
from the log le. Keypointing prevents a process log from growing indenitely.
Frequent keypointing is detrimental to performance. The default value of the Keypoint Interval
is 2048, which is sucient in most cases.
HTTP Service Settings
Monitoring and tuning the HTTP server instances that handle client requests are important
parts of ensuring peak Enterprise Server performance.
■
“Monitoring the HTTP Service” on page 60
■
“Tuning the HTTP Service” on page 64
■
“Tuning HTTP Listener Settings” on page 69
Monitoring the HTTP Service
Enable monitoring statistics for the HTTP service using either Admin Console or asadmin.In
the Admin Console, the monitoring level (LOW or HIGH) has no eect on monitoring the
HTTP Service.
Sun GlassFish Enterprise Server 2.1 PerformanceTuning Guide • January 200960
Page 61

HTTP Service Settings
With asadmin, use the following command to list the monitoring parameters available:
list --user admin --port 4848
-m server-instance-name.http-service.*
where server-instance-name is the name of the server instance.
Use the following command to get the values:
get --user admin --port 4848 -m server.http-service.parameter-name.*
where parameter-name is the name of the parameter to monitor.
Statistics collection is enabled by default. Disable it by adding the following property to
domain.xml and restart the server:
<property name="statsProfilingEnabled" value="false" />
Disabling statistics collection will increase performance.
You can also view monitoring statistics with the Admin Console. The information is divided
into the following categories:
■
“DNS Cache Information (dns)” on page 61
■
“File Cache Information (le-cache)” on page 63
■
“Keep Alive (keep-alive)” on page 63
DNS Cache Information (dns)
The DNS cache caches IP addresses and DNS names. Your server’s DNS cache is disabled by
default. In the DNS Statistics for Process ID All page under Monitor in the web-based
Administration interface the following statistics are displayed:
Enabled
If the DNS cache is disabled, the rest of this section is not displayed.
By default, the DNS cache is o. Enable DNS caching with the Admin Console by setting the
DNS value to “Perform DNS lookups on clients accessing the server”.
CacheEntries (CurrentCacheEntries / MaxCacheEntries)
The number of current cache entries and the maximum number of cache entries. A single cache
entry represents a single IP address or DNS name lookup. Make the cache as large as the
maximum number of clients that access your web site concurrently. Note that setting the cache
size too high is a waste of memory and degrades performance.
Set the maximum size of the DNS cache by entering or changing the value in the Size of DNS
Cache eld of the Performance Tuning page.
Chapter 3 • Tuningthe Enterprise Server 61
Page 62

HTTP Service Settings
HitRatio
The hit ratio is the number of cache hits divided by the number of cache lookups.
This setting is not tunable.
Note – If you turn o DNS lookups on your server, host name restrictions will not work and IP
addresses will appear instead of host names in log les.
Caching DNS Entries
It is possible to also specify whether to cache the DNS entries. If you enable the DNS cache, the
server can store hostname information after receiving it. If the server needs information about
the client in the future, the information is cached and available without further querying.
specify the size of the DNS cache and an expiration time for DNS cache entries. The DNS cache
can contain 32 to 32768 entries; the default value is 1024. Values for the time it takes for a cache
entry to expire can range from 1 second to 1 year specied in seconds; the default value is 1200
seconds (20 minutes).
Limit DNS Lookups to Asynchronous
Do not use DNS lookups in server processes because they are resource-intensive. If you must
include DNS lookups, make them asynchronous.
Enabled
If asynchronous DNS is disabled, the rest of this section will not be displayed.
NameLookups
The number of name lookups (DNS name to IP address) that have been done since the server
was started. This setting is not tunable.
AddrLookups
The number of address loops (IP address to DNS name) that have been done since the server
was started. This setting is not tunable.
LookupsInProgress
The current number of lookups in progress.
Sun GlassFish Enterprise Server 2.1 PerformanceTuning Guide • January 200962
Page 63

HTTP Service Settings
File Cache Information (le-cache)
The le cache caches static content so that the server handles requests for static content quickly.
The le-cache section provides statistics on how your le cache is being used.
For information on tuning the le cache, see
■
Number of Hits on Cached File Content
■
Number of Cache Entries
■
Number of Hits on Cached File Info
■
Heap Space Used for Cache
■
Number of Misses on Cached File Content
■
Cache Lookup Misses
■
Number of Misses on Cached File Content
■
Max Age of a Cache Entry: The maximum age displays the maximum age of a valid cache
“HTTP File Cache” on page 67.
entry.
■
Max Number of Cache Entries
■
Max Number of Open Entries
■
Is File Cached Enabled?: If the cache is disabled, the other statistics are not displayed. The
cache is enabled by default.
■
Maximum Memory Map to be Used for Cache
■
Memory Map Used for cache
■
Cache Lookup Hits
■
Open Cache Entries: The number of current cache entries and the maximum number of
cache entries are both displayed. A single cache entry represents a single URI. This is a
tunable setting.
■
Maximum Heap Space to be Used for Cache
Keep Alive (keep-alive)
The Admin Console provides the following performance-related keep-alive statistics:
■
Connections Terminated Due to ClientConnection Timed Out
■
Max Connection Allowed in Keep-alive
■
Number of Hits
■
Connections in Keep-alive Mode
■
Connections not Handed to Keep-alive Thread Due to too Many Persistent Connections
■
The Time in Seconds Before Idle Connections are Closed
■
Connections Closed Due to Max Keep-alive Being Exceeded
Chapter 3 • Tuningthe Enterprise Server 63
Page 64

HTTP Service Settings
Connection Queue
■
Total Connections Queued: Total connections queued is the total number of times a
connection has been queued. This includes newly accepted connections and connections
from the keep-alive system.
■
AverageQueuing Delay: Average queueing delay is the average amount of time a connection
spends in the connection queue. This represents the delay between when a request
connection is accepted by the server, and a request processing thread (also known as a
session) begins servicing the request.
Tuning the HTTP Service
The settings for the HTTP service are divided into the following categories in the Admin
Console:
■
“Access Log” on page 64
■
“Request Processing” on page 64
■
“Keep Alive” on page 66
■
“HTTP Protocol” on page 67
■
“HTTP File Cache” on page 67
Access Log
When performing benchmarking, ensure that access logging is disabled.
If you need to disable access logging, in HTTP Service click Add Property, and add the
following property:
■
name: accessLoggingEnabled
■
value: false
You can set the following access log properties:
■
Rotation (enabled/disabled). Enable rotation to ensure that the logs don’t run out of disk
space.
■
Rotation Policy:ime-based or size-based. Size-based is the default.
■
Rotation Interval.
Request Processing
On the Request Processing tab of the HTTP Service page, tune the following HTTP request
processing settings:
■
Thread Count
■
Initial Thread Count
Sun GlassFish Enterprise Server 2.1 PerformanceTuning Guide • January 200964
Page 65

HTTP Service Settings
■
Request Timeout
■
Buer Length
Thread Count
The Thread Count parameter species the maximum number of simultaneous requests the
server can handle. The default value is 5. When the server has reached the limit or request
threads, it defers processing new requests until the number of active requests drops below the
maximum amount. Increasing this value will reduce HTTP response latency times.
In practice, clients frequently connect to the server and then do not complete their requests. In
these cases, the server waits a length of time specied by the Request Timeout parameter.
Also, some sites do heavyweight transactions that take minutes to complete. Both of these
factors add to the maximum simultaneous requests that are required. If your site is processing
many requests that take many seconds, you might need to increase the number of maximum
simultaneous requests.
Adjust the thread count value based on your load and the length of time for an average request.
In general, increase this number if you have idle CPU time and requests that are pending;
decrease it if the CPU becomes overloaded. If you have many HTTP 1.0 clients (or HTTP 1.1
clients that disconnect frequently), adjust the timeout value to reduce the time a connection is
kept open.
Suitable Request Thread Count values range from 100 to 500, depending on the load. If your
system has extra CPU cycles, keep incrementally increasing thread count and monitor
performance after each incremental increase. When performance saturates (stops improving),
then stop increasing thread count.
Initial Thread Count
The Initial Thread Count property species the minimum number of threads the server
initiates upon start-up. The default value is 2. Initial Thread Count represents a hard limit for
the maximum number of active threads that can run simultaneously, which can become a
bottleneck for performance.
Request Timeout
The Request Timeout property species the number of seconds the server waits between
accepting a connection to a client and receiving information from it. The default setting is 30
seconds. Under most circumstances, changing this setting is unnecessary. By setting it to less
than the default 30 seconds, it is possible to free up threads sooner. However, disconnecting
users with slower connections also helps.
Chapter 3 • Tuningthe Enterprise Server 65
Page 66

HTTP Service Settings
Buer Length
The size (in bytes) of the buer used by each of the request processing threads for reading the
request data from the client.
Adjust the value based on the actual request size and observe the impact on performance. In
most cases the default should suce. If the request size is large, increase this parameter.
Keep Alive
Both HTTP 1.0 and HTTP 1.1 support the ability to send multiple requests across a single
HTTP session. A server can receive hundreds of new HTTP requests per second. If every
request was allowed to keep the connection open indenitely, the server could become
overloaded with connections. On Unix/Linux systems, this could easily lead to a le table
overow.
The Application Server’s Keep Alive system addresses this problem. A waiting keep alive
connection has completed processing the previous request, and is waiting for a new request to
arrive on the same connection. The server maintains a counter for the maximum number of
waiting keep-alive connections. If the server has more than the maximum waiting connections
open when a new connection waits for a keep-alive request, the server closes the oldest
connection. This algorithm limits the number of open waiting keep-alive connections.
If your system has extra CPU cycles, incrementally increase the keep alive settings and monitor
performance after each increase. When performance saturates (stops improving), then stop
increasing the settings.
The following HTTP keep alive settings aect performance:
■
Thread Count
■
Max Connections
■
Time Out
■
Keep Alive Query Mean Time
■
Keep Alive Query Max Sleep Time
Max Connections
Max Connections controls the number of requests that a particular client can make over a
keep-alive connection. The range is any positive integer, and the default is 256.
Adjust this value based on the number of requests a typical client makes in your application. For
best performance specify quite a large number, allowing clients to make many requests.
The number of connections specied by Max Connections is divided equally among the keep
alive threads. If Max Connections is not equally divisible by Thread Count, the server can allow
slightly more than Max Connections simultaneous keep alive connections.
Sun GlassFish Enterprise Server 2.1 PerformanceTuning Guide • January 200966
Page 67

HTTP Service Settings
Time Out
Time Out determines the maximum time (in seconds) that the server holds open an HTTP keep
alive connection. A client can keep a connection to the server open so that multiple requests to
one server can be serviced by a single network connection. Since the number of open
connections that the server can handle is limited, a high number of open connections will
prevent new clients from connecting.
The default time out value is 30 seconds. Thus, by default, the server will close the connection if
idle for more than 30 seconds. The maximum value for this parameter is 300 seconds (5
minutes).
The proper value for this parameter depends upon how much time is expected to elapse
between requests from a given client. For example, if clients are expected to make requests
frequently then, set the parameter to a high value; likewise, if clients are expected to make
requests rarely, then set it to a low value.
HTTP Protocol
The only HTTP Protocol attribute that signicantly aects performance is DNS Lookup
Enabled.
DNS Lookup Enabled
This setting species whether the server performs DNS (domain name service) lookups on
clients that access the server. When DNS lookup is not enabled, when a client connects, the
server knows the client’s IP address but not its host name (for example, it knows the client as
198.95.251.30, rather than www.xyz.com). When DS lookup is enabled, the server will resolve
the client’s IP address into a host name for operations like access control, common gateway
interface (CGI) programs, error reporting, and access logging.
If the server responds to many requests per day, reduce the load on the DNS or NIS (Network
Information System) server by disabling DNS lookup. Enabling DNS lookup will increase the
latency and load on the system—do so with caution.
HTTP File Cache
The Enterprise Server uses a le cache to serve static information faster. The le cache contains
information about static les such as HTML, CSS, image, or text les. Enabling the HTTP le
cache will improve performance of applications that contain static les.
Set the le cache attributes in the Admin Console under Congurations > cong-name > HTTP
Service (HTTP File Cache).
Chapter 3 • Tuningthe Enterprise Server 67
Page 68

HTTP Service Settings
Max Files Count
Max Files Count determines how many les are in the cache. If the value is too big, the server
caches little-needed les, which wastes memory. If the value is too small, the benet of caching
is lost. Try dierent values of this attribute to nd the optimal solution for specic
applications—generally, the eects will not be great.
Hash Init Size
Hash Init Size aects memory use and search time, but rarely will have a measurable eect on
performance.
Max Age
This parameter controls how long cached information is used after a le has been cached. An
entry older than the maximum age is replaced by a new entry for the same le.
If your web site’scontent changes infrequently, increase this value for improved performance.
Set the maximum age by entering or changing the value in the Maximum Age eld of the File
Cache Conguration page in the web-based Admin Console for the HTTP server node and
selecting the File Caching Tab.
Set the maximum age based on whether the content is updated (existing les are modied) on a
regular schedule or not. For example, if content is updated four times a day at regular intervals,
you could set the maximum age to 21600 seconds (6 hours). Otherwise, consider setting the
maximum age to the longest time you are willing to serve the previous version of a content le
after the le has been modied.
Small/Medium File Size and File Size Limit
The cache treats small, medium, and large les dierently. The contents of medium les are
cached by mapping the le into virtual memory (Unix/Linux platforms). The contents of small
les are cached by allocating heap space and reading the le into it. The contents of large les
are not cached, although information about large les is cached.
The advantage of distinguishing between small les and medium les is to avoid wasting part of
many pages of virtual memory when there are lots of small les. So the Small File Size Limit is
typically a slightly lower value than the VM page size.
FileTransmission
When File Transmission is enabled, the server caches open le descriptors for les in the le
cache, rather than the le contents. Also, the distinction normally made between small,
medium, and large les no longer applies since only the open le descriptor is being cached.
By default, File Transmission is enabled on Windows, and disabled on UNIX. On UNIX, only
enable File Transmission for platforms that have the requisite native OS support: HP-UX and
AIX. Don’t enable it for other UNIX/Linux platforms.
Sun GlassFish Enterprise Server 2.1 PerformanceTuning Guide • January 200968
Page 69

HTTP Service Settings
Tuning HTTP Listener Settings
Change HTTP listener settings in the Admin Console under Congurations > cong-name >
HTTP Service > HTTP Listeners > listener-name.
Network Address
For machines with only one network interface card (NIC), set the network address to the IP
address of the machine (for example, 192.18.80.23 instead of default 0.0.0.0). If you specify an IP
address other than 0.0.0.0, the server will make one less system call per connection. Specify an
IP address other than 0.0.0.0 for best possible performance. If the server has multiple NIC cards
then create multiple listeners for each NIC.
AcceptorThreads
The Acceptor Threads setting species how many threads you want in accept mode on a listen
socket at any time. It is a good practice to set this to less than or equal to the number of CPUs in
your system.
In the Enterprise Server, acceptor threads on an HTTP Listener accept connections and put
them onto a connection queue. Session threads then pick up connections from the queue and
service the requests. The server posts more session threads if required at the end of the request.
The policy for adding new threads is based on the connection queue state:
■
Each time a new connection is returned, the number of connections waiting in the queue
(the backlog of connections) is compared to the number of session threads already created.
If it is greater than the number of threads, more threads are scheduled to be added the next
time a request completes.
■
The previous backlog is tracked, so that n threads are added (n is the HTTP Service’s Thread
Increment parameter) until one of the following is true:
■
The number of threads increases over time.
■
The increase is greater than n.
■
The number of session threads minus the backlog is less than n.
To avoid creating too many threads when the backlog increases suddenly (such as the
startup of benchmark loads), the server makes the decision whether more threads are
needed only once every 16 or 32 connections, based on how many session threads already
exist.
Chapter 3 • Tuningthe Enterprise Server 69
Page 70

ORB Settings
ORB Settings
The Enterprise Server includes a high performance and scalable CORBA Object Request Broker
(ORB). The ORB is the foundation of the EJB Container on the server.
Overview
The ORB is primarily used by EJB components via:
■
■
■
■
When a server instance makes a connection to another server instance ORB, the rst instance
acts as a client ORB. SSL over IIOP uses a fast optimized transport with high-performance
native implementations of cryptography algorithms.
It is important to remember that EJB local interfaces do not use the ORB. Using a local interface
passes all arguments by reference and does not require copying any objects.
RMI/IIOP path from an application client (or rich client) using the application client
container.
RMI/IIOP path from another Enterprise Server instance ORB.
RMI/IIOP path from another vendor’s ORB.
In-process path from the Web Container or MDB (message driven beans) container.
How a Client Connects to the ORB
A rich client Java program performs a new initialContext() call which creates a client side
ORB instance. This in turn creates a socket connection to the Enterprise Server IIOP port. The
reader thread is started on the server ORB to service IIOP requests from this client. Using the
initialContext, the client code does a lookup of an EJB deployed on the server. An IOR which
is a remote reference to the deployed EJB on the server is returned to the client. Using this
object reference, the client code invokes remote methods on the EJB.
InitialContext lookup for the bean and the method invocations translate the marshalling
application request data in Java into IIOP message(s) that are sent on the socket connection that
was created earlier on to the server ORB. The server then creates a response and sends it back on
the same connection. This data in the response is then un-marshalled by the client ORB and
given back to the client code for processing. The Client ORB shuts down and closes the
connection when the rich client application exits.
Monitoring the ORB
ORB statistics are disabled by default. To gather ORB statistics, enable monitoring with this
asadmin command:
Sun GlassFish Enterprise Server 2.1 PerformanceTuning Guide • January 200970
Page 71

set serverInstance.iiop-service.orb.system.monitoringEnabled=true
reconfig serverInstance
Connection Statistics
The following statistics are gathered on ORB connections:
■
total-inbound-connections Total inbound connections to ORB.
■
total-outbound-connections Total outbound connections from ORB.
Use this command to get ORB connection statistics:
asadmin get --monitor
serverInstance.iiop-service.orb.system.orb-connection.*
Thread Pools
The following statistics are gathered on ORB thread pools:
■
thread-pool-size Number of threads in ORB thread pool.
■
waiting-thread-count Number of thread pool threads waiting for work to arrive.
Use this command to get ORB thread pool statistics:
ORB Settings
asadmin get --monitor
serverInstance.iiop-service.orb.system.orb-thread-pool.*
Tuning the ORB
Tune ORB performance by setting ORB parameters and ORB thread pool parameters. You can
often decrease response time by leveraging load-balancing, multiple shared connections, thread
pool and message fragment size. You can improve scalability by load balancing between
multiple ORB servers from the client, and tuning the number of connection between the client
and the server.
The following table summarizes the tunable ORB parameters.
TABLE 3–3 Tunable ORB Settings
Path ORB modules Server settings
RMI/ IIOP from application client to application
server
Chapter 3 • Tuningthe Enterprise Server 71
communication
infrastructure, thread
pool
steady-thread-pool-size, max-thread-pool-size,
idle-thread-timeout-in-seconds
Page 72

ORB Settings
TABLE 3–3 Tunable ORB Settings (Continued)
RMI/ IIOP from ORB to Enterprise Server communication
infrastructure, thread
pool
steady-thread-pool-size, max-thread-pool-size,
idle-thread-timeout-in-seconds
RMI/ IIOP from a vendor ORB parts of communication
infrastructure, thread
pool
In-process thread pool steady-thread-pool-size, max-thread-pool-size,
steady-thread-pool-size, max-thread-pool-size,
idle-thread-timeout-in-seconds
idle-thread-timeout-in-seconds
TunableORB Parameters
Tune the following ORB parameters using the Admin Console:
■
Thread Pool ID: Name of the thread pool to use.
■
Max Message Fragment Size: Messages larger than this number of bytes will be fragmented.
In CORBA GIOPv1.2, a Request, Reply, LocateRequest and LocateReply message can be
broken into multiple fragments. The rst message is a regular Request or Reply message
with more fragments bit in the ags eld set to true. If inter-ORB messages are for the most
part larger than the default size (1024 bytes), increase the fragment size to decrease latencies
on the network.
■
Total Connections: Maximum number of incoming connections at any time, on all listeners.
Protects the server state by allowing nite number of connections. This value equals the
maximum number of threads that will actively read from the connection.
■
IIOP Client Authentication Required (true/false)
ORB Thread Pool Parameters
The ORB thread pool contains a task queue and a pool of threads. Tasks or jobs are inserted into
the task queue and free threads pick tasks from this queue for execution. Do not set a thread
pool size such that the task queue is always empty. It is normal for a large application’sMax Pool
Size to be ten times the size of the current task queue.
The Enterprise Server uses the ORB thread pool to:
■
Execute every ORB request.
■
Trim EJB pools and caches.
Thus, even when one is not using ORB for remote-calls (via RMI/ IIOP), set the size of the
threadpool to facilitate cleaning up the EJB pools and caches.
Set ORB thread pool attributes under Congurations > cong-name > Thread Pools >
thread-pool-ID, where thread-pool-ID is the thread pool ID selected for the ORB. Thread pools
have the following attributes that aect performance.
Sun GlassFish Enterprise Server 2.1 PerformanceTuning Guide • January 200972
Page 73

ORB Settings
■
Minimum Pool Size: The minimum number of threads in the ORB thread pool. Set to the
average number of threads needed at a steady (RMI/ IIOP) load.
■
Maximum Pool Size: The maximum number of threads in the ORB thread pool.
■
Idle Timeout: Number of seconds to wait before removing an idle thread from pool. Allows
shrinking of the thread pool.
■
Number of Work Queues
In particular, the maximum pool size is important to performance. For more information, see
“Thread Pool Sizing” on page 74.
Client ORB Properties
Specify the following properties as command-line arguments when launching the client
program. You do this by using the following syntax when starting the Java VM:
-Dproperty=value
Controlling connections between client and server ORB
When using the default JDK ORB on the client, a connection is established from the client ORB
to the application server ORB every time an initial context is created. To pool or share these
connections when they are opened from the same process by adding to the conguration on the
client ORB.
-Djava.naming.factory.initial=com.sun.appserv.naming.S1ASCtxFactory
Using multiple connections
Note – The property com.sun.appserv.iiop.orbconnections is not supported in Sun
GlassFish Enterprise Server, version 8.x.
When using the context factory, (com.sun.appserv.naming.S1ASCtxFactory), you can specify
the number of connections to open to the server from the client ORB with the property
com.sun.appserv.iiop.orbconnections.
The default value is one. Using more than one connection may improve throughput for
network-intense applications. The conguration changes are specied on the client ORB(s) by
adding the following jvm-options:
-Djava.naming.factory.initial=com.sun.appserv.naming.S1ASCtxFactory
-Dcom.sun.appserv.iiop.orbconnections=value
Chapter 3 • Tuningthe Enterprise Server 73
Page 74

ORB Settings
Load Balancing
For information on how to congure RMI/IIOP for multiple application server instances in a
cluster,
Server 2.1 High AvailabilityAdministration Guide
When tuning the client ORB for load-balancing and connections, consider the number of
connections opened on the server ORB. Start from a low number of connections and then
increase it to observe any performance benets. A connection to the server translates to an ORB
thread reading actively from the connection (these threads are not pooled, but exist currently
for the lifetime of the connection).
Chapter 9, “RMI-IIOP Load Balancing and Failover,” in Sun GlassFish Enterprise
.
Thread Pool Sizing
After examining the number of inbound and outbound connections as explained above, tune
the size of the thread pool appropriately. This can aect performance and response times
signicantly.
The size computation takes into account the number of client requests to be processed
concurrently, the resource (number of CPUs and amount of memory) available on the machine
and the response times required for processing the client requests.
Setting the size to a very small value can aect the ability of the server to process requests
concurrently, thus aecting the response times since requests will sit longer in the task queue.
On the other hand, having a large number of worker threads to service requests can also be
detrimental because they consume system resources, which increases concurrency. This can
mean that threads take longer to acquire shared structures in the EJB container, thus aecting
response times.
The worker thread pool is also used for the EJB container’shousekeeping activity such as
trimming the pools and caches. This activity needs to be accounted for also when determining
the size. Having too many ORB worker threads is detrimental for performance since the server
has to maintain all these threads. The idle threads are destroyed after the idle thread timeout
period.
Examining IIOP Messages
It is sometimes useful to examine the IIOP messages passed by the Enterprise Server. To make
the server save IIOP messages to the server.log le, set the JVM option
-Dcom.sun.CORBA.ORBDebug=giop. Use the same option on the client ORB.
The following is an example of IIOP messages saved to the server log. Note: in the actual output,
each line is preceded by the timestamp, such as [29/Aug/2002:22:41:43] INFO (27179):
CORE3282: stdout.
Sun GlassFish Enterprise Server 2.1 PerformanceTuning Guide • January 200974
Page 75

ORB Settings
++++++++++++++++++++++++++++++
Message(Thread[ORB Client-side Reader, conn to 192.18.80.118:1050,5,main]):
createFromStream: type is 4 <
MessageBase(Thread[ORB Client-side Reader, conn to 192.18.80.118:1050,5,main]):
Message GIOP version: 1.2
MessageBase(Thread[ORB Client-side Reader, conn to 192.18.80.118:1050,5,main]):
ORB Max GIOP Version: 1.2
Message(Thread[ORB Client-side Reader, conn to 192.18.80.118:1050,5,main]):
createFromStream: message construction complete.
com.sun.corba.ee.internal.iiop.MessageMediator
(Thread[ORB Client-side Reader, conn to 192.18.80.118:1050,5,main]): Received message:
----- Input Buffer -----
Current index: 0
Total length : 340
47494f50010200040000014800000005GIOP.......H....
Note – The ag -Dcom.sun.CORBA.ORBdebug=giop generates many debug messages in the logs.
This is used only when you suspect message fragmentation.
In this sample output above, the createFromStream type is shown as 4. This implies that the
message is a fragment of a bigger message. To avoid fragmented messages, increase the
fragment size. Larger fragments mean that messages are sent as one unit and not as fragments,
saving the overhead of multiple messages and corresponding processing at the receiving end to
piece the messages together.
If most messages being sent in the application are fragmented, increasing the fragment size is
likely to improve eciency. On the other hand, if only a few messages are fragmented, it might
be more ecient to have a lower fragment size that requires smaller buers for writing
messages.
Improving ORB Performance with Java Serialization
It is possible to improve ORB performance by using Java Serialization instead of standard
Common Data Representation (CDR) for data for transport over the network. This capability is
called Java Serialization over GIOP (General Inter-ORB Protocol), or JSG.
In some cases, JSG can provide better performance throughput than CDR. The performance
dierences depend highly on the application. Applications with remote objects having small
amounts data transmitted between client and server will most often perform better using JSG.
Chapter 3 • Tuningthe Enterprise Server 75
Page 76

Thread Pool Settings
▼
To Enable Java Serialization
You must set this property on all servers that you want to use JSG.
In the tree component, expand the Congurations node.
1
Expand the desired node.
2
Select the JVM Settings node
3
In the JVM Settings page, choose the JVM Options tab.
4
Click Add JVM Option, and enter the following value:
5
-Dcom.sun.CORBA.encoding.ORBEnableJavaSerialization=true
Click Save
6
Restart the Application Server.
7
Using JSG for Application Clients
If an application uses standalone non-web clients (application clients), and you want to use JSG,
you must also set a system property for the client applications. A common way to do this is to
add the property to the Java command line used to start the client application, for example:
java -Dcom.sun.CORBA.encoding.ORBEnableJavaSerialization=true
-Dorg.omg.CORBA.ORBInitialHost=gollum
-Dorg.omg.CORBA.ORBInitialPort=35309
MyClientProgram
Thread Pool Settings
You can both monitor and tune thread pool settings through the Admin Console. To congure
monitoring with the Admin Console, open the page Congurations > cong-name >
Monitoring. To view monitoring information with the Admin Console, open the page
Stand-Alone Instances > instance-name (Monitor).
Tuning Thread Pools (Unix /Linux only)
Congure thread pool settings through the Admin Console at Congurations > cong-name >
Thread Pools.
Since threads on Unix/Linux are always operating system (OS)-scheduled, as opposed to
user-scheduled, Unix/Linux users do not need to use native thread pools. Therefore, this option
Sun GlassFish Enterprise Server 2.1 PerformanceTuning Guide • January 200976
Page 77

Resources
Resources
is not oered in a Unix/Linux user interface. However, it is possible to edit the OS-scheduled
thread pools and add new thread pools, if needed, using the Admin Console.
■
“JDBC Connection Pool Settings” on page 77
■
“Connector Connection Pool Settings” on page 80
JDBC Connection Pool Settings
For optimum performance of database-intensive applications, tune the JDBC Connection Pools
managed by the Enterprise Server. These connection pools maintain numerous live database
connections that can be reused to reduce the overhead of opening and closing database
connections. This section describes how to tune JDBC Connection Pools to improve
performance.
J2EE applications use JDBC Resources to obtain connections that are maintained by the JDBC
Connection Pool. More than one JDBC Resource is allowed to refer to the same JDBC
Connection Pool. In such a case, the physical connection pool is shared by all the resources.
Monitoring JDBC Connection Pools
Statistics-gathering is enabled by default for JDBC Connection Pools. The following attributes
are monitored:
■
numConnFailedValidation (count)Number of connections that failed validation.
■
numConnUsed (range)Number of connections that have been used.
■
numConnFree (count)Number of free connections in the pool.
■
numConnTimedOut (bounded range)Number of connections in the pool that have timed
out.
To get the statistics, use these commands:
asadmin get --monitor=true
serverInstance.resources.jdbc-connection-pool.*asadmin get
--monitor=true serverInstance.resources.jdbc-connection-pool. poolName.* *
TuningJDBC Connection Pools
Set JDBC Connection Pool attributes with the Admin Console under Resources > JDBC >
Connection Pools > PoolName. The following attributes aect performance:
■
“Pool Size Settings” on page 78
Chapter 3 • Tuningthe Enterprise Server 77
Page 78

Initial and Mimimum Pool Size
■
■
■
Pool Size Settings
The following settings control the size of the connection pool:
“Timeout Settings” on page 78
“Isolation Level Settings” on page 79
“Connection Validation Settings” on page 79
Initial and
Size of the pool when created, and its minimum allowable size.
Mimimum Pool
Size
Maximum Pool
Upper limit of size of the pool.
Size
Pool Resize
Quantity
Number of connections to be removed when the idle timeout expires. Connections that have idled for
longer than the timeout are candidates for removal. When the pool size reaches the initial and minimum
pool size, removal of connections stops.
The following table summarizes pros and cons to consider when sizing connection pools.
TABLE 3–4 Connection PoolSizing
Connection pool Pros Cons
Small Connection pool Faster access on the connection table. May not have enough connections to
satisfy requests.
Requests may spend more time in the
queue.
Large Connection pool More connections to fulll requests.
Requests will spend less (or no) time in the
queue
Slower access on the connection table.
Timeout Settings
There are two timeout settings:
■
Max Wait Time: Amount of time the caller (the code requesting a connection) will wait
before getting a connection timeout. The default is 60 seconds. A value of zero forces caller
to wait indenitely.
To improve performance set Max Wait Time to zero (0). This essentially blocks the caller
thread until a connection becomes available. Also, this allows the server to alleviate the task
of tracking the elapsed wait time for each request and increases performance.
Sun GlassFish Enterprise Server 2.1 PerformanceTuning Guide • January 200978
Page 79

Pool Resize Quantity
■
Idle Timeout: Maximum time in seconds that a connection can remain idle in the pool.
After this time, the pool can close this connection. This property does not control
connection timeouts on the database server.
Keep this timeout shorter than the database server timeout (if such timeouts are congured
on the database), to prevent accumulation of unusable connection in Enterprise Server.
For best performance, set Idle Timeout to zero (0) seconds, so that idle connections will not
be removed. This ensures that there is normally no penalty in creating new connections and
disables the idle monitor thread. However, there is a risk that the database server will reset a
connection that is unused for too long.
Isolation Level Settings
Two settings control the connection pool’s transaction isolation level on the database server:
■
Transaction Isolation Level: species the transaction isolation level of the pooled database
connections. If this parameter is unspecied, the pool uses the default isolation level
provided by the JDBC Driver.
■
Isolation Level Guaranteed: Guarantees that every connection obtained from the pool has
the isolation specied by the Transaction Isolation Level parameter. Applicable only when
the Transaction Isolation Level is specied. The default value is true.
This setting can have some performance impact on some JDBC drivers. Set to false when
certain that the application does not change the isolation level before returning the
connection.
Avoidspecifying Transaction Isolation Level. If that is not possible, consider setting Isolation
Level Guaranteed to false and make sure applications do not programmatically alter the
connections’ isolation level.
If you must specify isolation level, specify the best-performing level possible. The isolation
levels listed from best performance to worst are:
1. READ_UNCOMMITTED
2. READ_COMMITTED
3. REPEATABLE_READ
4. SERIALIZABLE
Choose the isolation level that provides the best performance, yet still meets the concurrency
and consistency needs of the application.
Connection ValidationSettings
The following settings determine whether and how the pool performs connection validation.
Chapter 3 • Tuningthe Enterprise Server 79
Page 80

Connection Validation Required
Connection
Validation
Required
Validation Method Typeof connection validation to perform. Must be one of:
Table Name Table name to query when Validation Method is “table.”
Close All
Connections On
Any Failure
If true, the pool validates connections (checks to nd out if they are usable) before providing them to an
application.
If possible, keep the default value, false. Requiring connection validation forces the server to apply the
validation algorithm every time the pool returns a connection, which adds overhead to the latency of
getConnection(). If the database connectivity is reliable, you can omit validation.
■
auto-commit: attempt to perform an auto-commit on the connection.
■
metadata: attempt to get metadata from the connection.
■
table (performing a query on a specied table). Must also set Table Name. You may have to use this method
if the JDBC driver caches calls to setAutoCommit() and getMetaData().
Whether to close all connections in the pool if a single validation check fails. The default is false. One
attempt will be made to re-establish failed connections.
Connector Connection Pool Settings
From a performance standpoint, connector connection pools are similar to JDBC connection
pools. Follow all the recommendations in the previous section,
Pools” on page 77
“Tuning JDBC Connection
Transaction Support
You may be able to improve performance by overriding the default transaction support
specied for each connector connection pool.
For example, consider a case where an Enterprise Information System (EIS) has a connection
factory that supports local transactions with better performance than global transactions. If a
resource from this EIS needs to be mixed with a resource coming from another resource
manager, the default behavior forces the use of XA transactions, leading to lower performance.
However, by changing the EIS’s connector connection pool to use LocalTransaction transaction
support and leveraging the Last Agent Optimization feature previously described, you could
leverage the better-performing EIS LocalTransaction implementation. For more information
on LAO, see
In the Admin Console, specify transaction support when you create a new connector
connection pool, and when you edit a connector connection pool at Resources > Connectors >
Connector Connection Pools.
Also set transaction support using asadmin. For example, the following asadmin command
could be used to create a connector connection pool “TESTPOOL” with the
transaction-support as “LOCAL”.
Sun GlassFish Enterprise Server 2.1 PerformanceTuning Guide • January 200980
“Congure JDBC Resources as One-Phase Commit Resources” on page 39
Page 81

asadmin> create-connector-connection-pool --raname jdbcra
--connectiondefinition javax.sql.DataSource
-transactionsupport LocalTransaction
TESTPOOL
Close All Connections On Any Failure
Chapter 3 • Tuningthe Enterprise Server 81
Page 82

82
Page 83

CHAPTER 4
4
Tuning the Java Runtime System
This chapter discusses the following topics:
■
“Java Virtual Machine Settings” on page 83
■
“Managing Memory and Garbage Collection” on page 84
■
“Further Information” on page 91
JavaVirtual Machine Settings
J2SE 5.0 provides two implementations of the HotSpot Java virtual machine (JVM):
■
The client VM is tuned for reducing start-up time and memory footprint. Invoke it by using
the -client JVM command-line option.
■
The server VM is designed for maximum program execution speed. Invoke it by using the
-server JVM command-line option.
By default, the Application Server uses the JVM setting appropriate to the purpose:
■
Developer Prole, targeted at application developers, uses the -client JVM ag to optimize
startup performance and conserve memory resources.
■
Enterprise Prole, targeted at production deployments, uses the default JVM startup mode.
By default, Application Server uses the client Hotspot VM. However, if a server VM is
needed, it can be specied by creating a <jvm-option> named “-server.”
You can override the default by changing the JVM settings in the Admin Console under
Congurations > cong-name > JVM Settings (JVM Options).
For more information on server-class machine detection in J2SE 5.0, see
Detection .
For more information on JVMs, see
JavaTM Virtual Machines.
Server-Class Machine
83
Page 84

Managing Memory and Garbage Collection
Managing Memory and Garbage Collection
The eciency of any application depends on how well memory and garbage collection are
managed. The following sections provide information on optimizing memory and allocation
functions:
■
“Goals” on page 32
■
“Tracing Garbage Collection” on page 86
■
“Other Garbage Collector Settings” on page 86
■
“Tuning the Java Heap” on page 87
■
“Rebasing DLLs on Windows” on page 89
■
“Further Information” on page 91
Tuning the Garbage Collector
Garbage collection (GC) reclaims the heap space previously allocated to objects no longer
needed. The process of locating and removing the dead objects can stall any application and
consume as much as 25 percent throughput.
Almost all Java Runtime Environments come with a generational object memory system and
sophisticated GC algorithms. A generational memory system divides the heap into a few
carefully sized partitions called generations. The eciency of a generational memory system is
based on the observation that most of the objects are short lived. As these objects accumulate, a
low memory condition occurs forcing GC to take place.
The heap space is divided into the old and the new generation. The new generation includes the
new object space (eden), and two survivor spaces. The JVM allocates new objects in the eden
space, and moves longer lived objects from the new generation to the old generation.
The young generation uses a fast copying garbage collector which employs two semi-spaces
(survivor spaces) in the eden, copying surviving objects from one survivor space to the second.
Objects that survive multiple young space collections are tenured, meaning they are copied to
the tenured generation. The tenured generation is larger and lls up less quickly. So, it is
garbage collected less frequently; and each collection takes longer than a young space only
collection. Collecting the tenured space is also referred to as doing a full generation collection.
The frequent young space collections are quick (a few milliseconds), while the full generation
collection takes a longer (tens of milliseconds to a few seconds, depending upon the heap size).
Other GC algorithms, such as the Concurrent Mark Sweep (CMS) algorithm, are incremental.
They divide the full GC into several incremental pieces. This provides a high probability of
small pauses. This process comes with an overhead and is not required for enterprise web
applications.
Sun GlassFish Enterprise Server 2.1 PerformanceTuning Guide • January 200984
Page 85

Managing Memory and Garbage Collection
When the new generation lls up, it triggers a minor collection in which the surviving objects
are moved to the old generation. When the old generation lls up, it triggers a major collection
which involves the entire object heap.
Both HotSpot and Solaris JDK use thread local object allocation pools for lock-free, fast, and
scalable object allocation. So, custom object pooling is not often required. Consider pooling
only if object construction cost is high and signicantly aects execution proles.
Choosing the Garbage Collection Algorithm
Pauses during a full GC of more than four seconds can cause intermittent failures in persisting
session data into HADB.
While GC is going on, the Application Server isn’t running. If the pause is long enough, the
HADB times out the existing connections. Then, when the application server resumes its
activities, the HADB generates errors when the application server attempts to use those
connections to persist session data. It generates errors like, “Failed to store session data,”
“Transaction Aborted,” or “Failed to connect to HADB server.”
To prevent that problem, use the CMS collector as the GC algorithm. This collector can cause a
drop in throughput for heavily utilized systems, because it is running more or less constantly.
But it prevents the long pauses that can occur when the garbage collector runs infrequently.
▼
To use the CMS collector
Make sure that the system is not using 100 percent of its CPU.
1
2
Congure HADB timeouts, as described in the AdministrationGuide.
3
Congure the CMS collector in the server instance.
To do this, add the following JVM options:
■
-XX:+UseConcMarkSweepGC
■
-XX:SoftRefLRUPolicyMSPerMB=1
Additional Information
Use the jvmstat utility to monitor HotSpot garbage collection. (See “Further Information” on
page 91
For detailed information on tuning the garbage collector, see Tuning Garbage Collection with
the 5.0 Java Virtual Machine
Chapter 4 • Tuningthe Java Runtime System 85
.
Page 86

Managing Memory and Garbage Collection
Tracing Garbage Collection
The two primary measures of garbage collection performance are throughput and pauses.
Throughput is the percentage of the total time spent on other activities apart from GC. Pauses
are times when an application appears unresponsive due to GC.
Two other considerations are footprint and promptness. Footprint is the working size of the
JVM process, measured in pages and cache lines. Promptness is the time between when an
object becomes dead, and when the memory becomes available. This is an important
consideration for distributed systems.
A particular generation size makes a trade-o between these four metrics. For example, a large
young generation likely maximizes throughput, but at the cost of footprint and promptness.
Conversely, using a small young generation and incremental GC will minimize pauses, and thus
increase promptness, but decrease throughput.
JVM diagnostic output will display information on pauses due to garbage collection. If you start
the server in verbose mode (use the command asadmin start-domain --verbose domain),
then the command line argument -verbose:gc prints information for every collection. Here is
an example of output of the information generated with this JVM ag:
[GC 50650K->21808K(76868K), 0.0478645 secs]
[GC 51197K->22305K(76868K), 0.0478645 secs]
[GC 52293K->23867K(76868K), 0.0478645 secs]
[Full GC 52970K->1690K(76868K), 0.54789968 secs]
On each line, the rst number is the combined size of live objects before GC, the second number
is the size of live objects after GC, the number in parenthesis is the total available space, which is
the total heap minus one of the survivor spaces. The nal gure is the amount of time that the
GC took. This example shows three minor collections and one major collection. In the rst GC,
50650 KB of objects existed before collection and 21808 KB of objects after collection. This
means that 28842 KB of objects were dead and collected. The total heap size is 76868 KB. The
collection process required 0.0478645 seconds.
Other useful monitoring options include:
■
-XX:+PrintGCDetails for more detailed logging information
■
-Xloggc:file to save the information in a log le
Other Garbage Collector Settings
For applications that do not dynamically generate and load classes, the size of the permanent
generation has no eect on GC performance. For applications that dynamically generate and
load classes (for example, JSP applications), the size of the permanent generation does aect GC
performance, since lling the permanent generation can trigger a Full GC. Tune the maximum
permanent generation with the -XX:MaxPermSize option.
Sun GlassFish Enterprise Server 2.1 PerformanceTuning Guide • January 200986
Page 87

Managing Memory and Garbage Collection
Although applications can explicitly invoke GC with the System.gc() method, doing so is a
bad idea since this forces major collections, and inhibits scalability on large systems. It is best to
disable explicit GC by using the ag -XX:+DisableExplicitGC.
The Enterprise Server uses RMI in the Administration module for monitoring. Garbage cannot
be collected in RMI-based distributed applications without occasional local collections, so RMI
forces a periodic full collection. Control the frequency of these collections with the property
-sun.rmi.dgc.client.gcInterval. For example, - java
-Dsun.rmi.dgc.client.gcInterval=3600000 species explicit collection once per hour
instead of the default rate of once per minute.
To specify the attributes for the Java virtual machine, use the Admin Console and set the
property under cong-name > JVM settings (JVM options).
Tuning the Java Heap
This section discusses topics related to tuning the Java Heap for performance.
■
“Guidelines for Java Heap Sizing” on page 87
■
“Heap Tuning Parameters” on page 88
Guidelines for Java Heap Sizing
Maximum heap size depends on maximum address space per process. The following table
shows the maximum per-process address values for various platforms:
TABLE 4–1 Maximum Address Space Per Process
Operating System Maximum Address Space
Per Process
Redhat Linux 32 bit 2 GB
Redhat Linux 64 bit 3 GB
Windows 98/2000/NT/Me/XP 2 GB
Solaris x86 (32 bit) 4 GB
Solaris 32 bit 4 GB
Solaris 64 bit Terabytes
Maximum heap space is always smaller than maximum address space per process, because the
process also needs space for stack, libraries, and so on. To determine the maximum heap space
that can be allocated, use a proling tool to examine the way memory is used. Gauge the
maximum stack space the process uses and the amount of memory taken up libraries and other
Chapter 4 • Tuningthe Java Runtime System 87
Page 88

Managing Memory and Garbage Collection
memory structures. The dierence between the maximum address space and the total of those
values is the amount of memory that can be allocated to the heap.
You can improve performance by increasing your heap size or using a dierent garbage
collector. In general, for long-running server applications, use the J2SE throughput collector on
machines with multiple processors (-XX:+AggressiveHeap) and as large a heap as you can t in
the free memory of your machine.
Heap TuningParameters
You can control the heap size with the following JVM parameters:
■
-Xmsvalue
■
-Xmxvalue
■
-XX:MinHeapFreeRatio=minimum
■
-XX:MaxHeapFreeRatio=maximum
■
-XX:NewRatio=ratio
■
-XX:NewSize=size
■
-XX:MaxNewSize=size
■
-XX:+AggressiveHeap
The -Xms and -Xmx parameters dene the minimum and maximum heap sizes, respectively.
Since GC occurs when the generations ll up, throughput is inversely proportional to the
amount of the memory available. By default, the JVM grows or shrinks the heap at each GC to
try to keep the proportion of free space to the living objects at each collection within a specic
range. This range is set as a percentage by the parameters -XX:MinHeapFreeRatio= minimum
and -XX:MaxHeapFreeRatio=maximum; and the total size bounded by -Xms and -Xmx.
Set the values of -Xms and -Xmx equal to each other for a xed heap size. When the heap grows
or shrinks, the JVM must recalculate the old and new generation sizes to maintain a predened
NewRatio.
The NewSize and MaxNewSize parameters control the new generation’s minimum and
maximum size. Regulate the new generation size by setting these parameters equal. The bigger
the younger generation, the less often minor collections occur. The size of the young generation
relative to the old generation is controlled by NewRatio. For example, setting -XX:NewRatio=3
means that the ratio between the old and young generation is 1:3, the combined size of eden and
the survivor spaces will be fourth of the heap.
By default, the Enterprise Server is invoked with the Java HotSpot Server JVM. The default
NewRatio for the Server JVM is 2: the old generation occupies 2/3 of the heap while the new
generation occupies 1/3. The larger new generation can accommodate many more short-lived
objects, decreasing the need for slow major collections. The old generation is still suciently
large enough to hold many long-lived objects.
To size the Java heap:
Sun GlassFish Enterprise Server 2.1 PerformanceTuning Guide • January 200988
Page 89

Managing Memory and Garbage Collection
■
Decide the total amount of memory you can aord for the JVM. Accordingly, graph your
own performance metric against young generation sizes to nd the best setting.
■
Make plenty of memory available to the young generation. The default is calculated from
NewRatio and the -Xmx setting.
■
Larger eden or younger generation spaces increase the spacing between full GCs. But young
space collections could take a proportionally longer time. In general, keep the eden size
between one fourth and one third the maximum heap size. The old generation must be
larger than the new generation.
For up-to-date defaults, see
EXAMPLE 4–1 Heap Conguration on Solaris
Java HotSpot VM Options.
This is an exmple heap conguration used by Enterprise Server on Solaris for large applications:
-Xms3584m
-Xmx3584m
-verbose:gc
-Dsun.rmi.dgc.client.gcInterval=3600000
Survivor Ratio Sizing
The SurvivorRatio parameter controls the size of the two survivor spaces. For example,
-XX:SurvivorRatio=6 sets the ratio between each survivor space and eden to be 1:6, each
survivor space will be one eighth of the young generation. The default for Solaris is 32. If
survivor spaces are too small, copying collection overows directly into the old generation. If
survivor spaces are too large, they will be empty. At each GC, the JVM determines the number
of times an object can be copied before it is tenured, called the tenure threshold. This threshold
is chosen to keep the survivor space half full.
Use the option -XX:+PrintTenuringDistribution to show the threshold and ages of the
objects in the new generation. It is useful for observing the lifetime distribution of an
application.
Rebasing DLLs on Windows
When the JVM initializes, it tries to allocate its heap using the -Xms setting. The base addresses
of Application Server DLLs can restrict the amount of contiguous address space available,
causing JVM initialization to fail. The amount of contiguous address space available for Java
memory varies depending on the base addresses assigned to the DLLs. You can increase the
amount of contiguous address space available by rebasing the Application Server DLLs.
Chapter 4 • Tuningthe Java Runtime System 89
Page 90

Managing Memory and Garbage Collection
To prevent load address collisions, set preferred base addresses with the rebase utilty that comes
with Visual Studio and the Platform SDK. Use the rebase utility to reassign the base addresses of
the Application Server DLLs to prevent relocations at load time and increase the available
process memory for the Java heap.
There are a few Application Server DLLs that have non-default base addresses that can cause
collisions. For example:
■
The nspr libraries have a preferred address of 0x30000000.
■
The icu libraries have the address of 0x4A?00000.
Move these libraries near the system DLLs (msvcrt.dll is at 0x78000000) to increase the
available maximum contiguous address space substantially. Since rebasing can be done on any
DLL, rebase to the DLLs after installing the Application Server.
▼
To rebase the Application Server’s DLLs
BeforeYouBegin
To perform rebasing, you need:
■
Windows 2000
■
Visual Studio and the Microsoft Framework SDK rebase utility
Make install_dir\ bin the default directory.
1
cd install_dir\bin
Example 4–2
See Also
Enter this command:
2
rebase -b 0x6000000 *.dll
Use the dependencywalker utility to make sure the DLLs wererebased correctly.
3
For more information, see the
Increase the size for the Java heap,and set the JVM Option accordinglyon the JVM Settings
4
Dependency Walker website.
page in the Admin Console.
Restart the Application Server.
5
Heap Conguration on Windows
This is an example heap conguration used by Sun GlassFish Enterprise Server for heavy
server-centric applications, on Windows, as set in the domain.xml le.
<jvm-options> -Xms1400m </jvm-options>
<jvm-options> -Xmx1400m </jvm-options>
For more information on rebasing, see MSDN documentation for rebase utility.
Sun GlassFish Enterprise Server 2.1 PerformanceTuning Guide • January 200990
Page 91

Further Information
For more information on tuning the JVM, see:
■
Java HotSpot VM Options
■
Frequently Asked Questions About the Java HotSpot Virtual Machine
■
Performance Documentation for the Java HotSpot VM
■
Java performance web page
■
Monitoring and Management for the Java Platform (J2SE 5.0)
■
The jvmstat monitoring utility
Further Information
Chapter 4 • Tuningthe Java Runtime System 91
Page 92

92
Page 93

CHAPTER 5
5
Tuning the Operating System and Platform
This chapter discusses tuning the operating system (OS) for optimum performance. It discusses
the following topics:
■
“Server Scaling” on page 93
■
“Solaris 10 Platform-Specic Tuning Information” on page 95
■
“Tuning for the Solaris OS” on page 95
■
“Linux Conguration” on page 97
■
“Tuning for Solaris on x86” on page 98
■
“Tuning for Linux platforms” on page 100
■
“Tuning UltraSPARCT1–Based Systems” on page 103
Server Scaling
This section provides recommendations for optimal performance scaling server for the
following server subsystems:
■
“Processors” on page 93
■
“Memory” on page 94
■
“Disk Space” on page 94
■
“Networking” on page 94
Processors
The Enterprise Server automatically takes advantage of multiple CPUs. In general, the
eectiveness of multiple CPUs varies with the operating system and the workload, but more
processors will generally improve dynamic content performance.
Static content involves mostly input/output (I/O) rather than CPU activity. If the server is
tuned properly, increasing primary memory will increase its content caching and thus increase
93
Page 94

Server Scaling
the relative amount of time it spends in I/O versus CPU activity. Studies have shown that
doubling the number of CPUs increases servlet performance by 50 to 80 percent.
Memory
See the section Hardware and Software Requirements in the Sun Java System Application Server
Release Notes for specic memory recommendations for each supported operating system.
Disk Space
It is best to have enough disk space for the OS, document tree, and log les. In most cases 2GB
total is sucient.
Put the OS, swap/paging le, Enterprise Server logs, and document tree each on separate hard
drives. This way, if the log les ll up the log drive, the OS does not suer. Also, its easy to tell if
the OS paging le is causing drive activity, for example.
OS vendors generally provide specic recommendations for how much swap or paging space to
allocate. Based on Sun testing, Enterprise Server performs best with swap space equal to RAM,
plus enough to map the document tree.
Networking
To determine the bandwidth the application needs, determine the following values:
■
The number of peak concurrent users (N
■
The average request size on your site, r. The average request can include multiple
documents. When in doubt, use the home page and all its associated les and graphics.
■
Decide how long, t, the average user will be willing to wait for a document at peak
utilization.
Then, the bandwidth required is:
r / t
N
peak
For example, to support a peak of 50 users with an average document size of 24 Kbytes, and
transferring each document in an average of 5 seconds, requires 240 Kbytes (1920 Kbit/s). So
the site needs two T1 lines (each 1544 Kbit/s). This bandwidth also allows some overhead for
growth.
The server’s network interface card must support more than the WAN to which it is connected.
For example, if you have up to three T1 lines, you can get by with a 10BaseT interface. Up to a
T3 line (45 Mbit/s), you can use 100BaseT. But if you have more than 50 Mbit/s of WAN
bandwidth, consider conguring multiple 100BaseT interfaces, or look at Gigabit Ethernet
technology.
Sun GlassFish Enterprise Server 2.1 PerformanceTuning Guide • January 200994
) the server needs to handle.
peak
Page 95

Solaris 10 Platform-SpecicTuning Information
SolarisTMDynamic Tracing (DTrace) is a comprehensive dynamic tracing framework for the
Solaris Operating System (OS). You can use the DTrace Toolkit to monitor the system. The
DTrace Toolkit is available through the OpenSolaris
TM
project from the DTraceToolkit page
(http://www.opensolaris.org/os/community/dtrace/dtracetoolkit/)
Tuning for the Solaris OS
■
“Tuning Parameters” on page 95
■
“File Descriptor Setting” on page 97
Tuning Parameters
Tuning Solaris TCP/IP settings benets programs that open and close many sockets. Since the
Enterprise Server operates with a small xed set of connections, the performance gain might
not be signicant.
Tuningfor the Solaris OS
.
The following table shows Solaris tuning parameters that aect performance and scalability
benchmarking. These values are examples of how to tune your system for best performance.
TABLE 5–1 Tuning Parameters for Solaris
Parameter Scope Default TunedValue Comments
rlim_fd_max /etc/system 65536 65536 Limit of process open le
descriptors. Set to account for
expected load (for associated
sockets, les, and pipes if any).
rlim_fd_cur /etc/system 1024 8192
sq_max_size /etc/system 2 0 Controls streams driver queue size;
setting to 0 makes it innite so the
performance runs won’t be hit by
lack of buer space. Set on clients
too. Note that setting sq_max_size
to 0 might not be optimal for
production systems with high
network trac.
tcp_close_wait_interval ndd /dev/tcp 240000 60000 Set on clients too.
tcp_time_wait_interval ndd /dev/tcp 240000 60000 Set on clients too.
Chapter 5 • Tuningthe Operating System and Platform 95
Page 96

Tuningfor the Solaris OS
TABLE 5–1 Tuning Parametersfor Solaris (Continued)
Parameter Scope Default TunedValue Comments
tcp_conn_req_max_q ndd /dev/tcp 128 1024
tcp_conn_req_max_q0 ndd /dev/tcp 1024 4096
tcp_ip_abort_interval ndd /dev/tcp 480000 60000
tcp_keepalive_interval ndd /dev/tcp 7200000 900000 For high trac web sites, lower this
value.
tcp_rexmit_interval_initial ndd /dev/tcp 3000 3000 Ifretransmission is greater than
30-40%, you should increase this
value.
tcp_rexmit_interval_max ndd /dev/tcp 240000 10000
tcp_rexmit_interval_min ndd /dev/tcp 200 3000
tcp_smallest_anon_port ndd /dev/tcp 32768 1024 Set on clients too.
tcp_slow_start_initial ndd /dev/tcp 1 2 Slightly faster transmission of small
amounts of data.
tcp_xmit_hiwat ndd /dev/tcp 8129 32768 Size of transmit buer.
tcp_recv_hiwat ndd /dev/tcp 8129 32768 Size of receive buer.
tcp_conn_hash_size ndd /dev/tcp 512 8192 Sizeof connection hash table. See
“Sizing the Connection Hash Table”
on page 96
.
Sizing the Connection Hash Table
The connection hash table keeps all the information for active TCP connections. Use the
following command to get the size of the connection hash table:
ndd -get /dev/tcp tcp_conn_hash
This value does not limit the number of connections, but it can cause connection hashing to
take longer. The default size is 512.
To make lookups more ecient, set the value to half of the number of concurrent TCP
connections that are expected on the server. You can set this value only in /etc/system, and it
becomes eective at boot time.
Use the following command to get the current number of TCP connections.
netstat -nP tcp|wc -l
Sun GlassFish Enterprise Server 2.1 PerformanceTuning Guide • January 200996
Page 97

Linux Conguration
File Descriptor Setting
On the Solaris OS, setting the maximum number of open les property using ulimit has the
biggest impact on eorts to support the maximum number of RMI/IIOP clients.
To increase the hard limit, add the following command to /etc/system and reboot it once:
set rlim_fd_max = 8192
Verify this hard limit by using the following command:
ulimit -a -H
Once the above hard limit is set, increase the value of this property explicitly (up to this limit)
using the following command:
ulimit -n 8192
Verify this limit by using the following command:
ulimit -a
For example, with the default ulimit of 64, a simple test driver can support only 25 concurrent
clients, but with ulimit set to 8192, the same test driver can support 120 concurrent clients. The
test driver spawned multiple threads, each of which performed a JNDI lookup and repeatedly
called the same business method with a think (delay) time of 500 ms between business method
calls, exchanging data of about 100 KB. These settings apply to RMI/IIOP clients on the Solaris
OS.
Linux Conguration
The following parameters must be added to the /etc/rc.d/rc.local le that gets executed
during system start-up.
<-- begin
#max file count updated ~256 descriptors per 4Mb.
Specify number of file descriptors based on the amount of system RAM.
echo "6553" > /proc/sys/fs/file-max
#inode-max 3-4 times the file-max
#file not present!!!!!
#echo"262144" > /proc/sys/fs/inode-max
#make more local ports available
echo 1024 25000 > /proc/sys/net/ipv4/ip_local_port_range
#increase the memory available with socket buffers
echo 2621143 > /proc/sys/net/core/rmem_max
Chapter 5 • Tuningthe Operating System and Platform 97
Page 98

Tuningfor Solaris on x86
echo 262143 > /proc/sys/net/core/rmem_default
#above configuration for 2.4.X kernels
echo 4096 131072 262143 > /proc/sys/net/ipv4/tcp_rmem
echo 4096 13107262143 > /proc/sys/net/ipv4/tcp_wmem
#disable "RFC2018 TCP Selective Acknowledgements," and
"RFC1323 TCP timestamps" echo 0 > /proc/sys/net/ipv4/tcp_sack
echo 0 > /proc/sys/net/ipv4/tcp_timestamps
#double maximum amount of memory allocated to shm at runtime
echo "67108864" > /proc/sys/kernel/shmmax
#improve virtual memory VM subsystem of the Linux
echo "100 1200 128 512 15 5000 500 1884 2" > /proc/sys/vm/bdflush
#we also do a sysctl
sysctl -p /etc/sysctl.conf
-- end -->
Additionally, create an /etc/sysctl.conf le and append it with the following values:
<-- begin
#Disables packet forwarding
net.ipv4.ip_forward = 0
#Enables source route verification
net.ipv4.conf.default.rp_filter = 1
#Disables the magic-sysrq key
kernel.sysrq = 0
fs.file-max=65536
vm.bdflush = 100 1200 128 512 15 5000 500 1884 2
net.ipv4.ip_local_port_range = 1024 65000
net.core.rmem_max= 262143
net.core.rmem_default = 262143
net.ipv4.tcp_rmem = 4096 131072 262143
net.ipv4.tcp_wmem = 4096 131072 262143
net.ipv4.tcp_sack = 0
net.ipv4.tcp_timestamps = 0
kernel.shmmax = 67108864
For further information on tuning Solaris system see the Solaris Tunable Parameters Reference
Manual.
Tuning for Solaris on x86
The following are some options to consider when tuning Solaris on x86 for Application Server
and HADB:
■
“File Descriptors” on page 100
■
“IP Stack Settings” on page 99
Sun GlassFish Enterprise Server 2.1 PerformanceTuning Guide • January 200998
Page 99

Tuningfor Solaris on x86
Some of the values depend on the system resources available. After making any changes to
/etc/system, reboot the machines.
File Descriptors
Add (or edit) the following lines in the /etc/system le:
set rlim_fd_max=65536
set rlim_fd_cur=65536
set sq_max_size=0
set tcp:tcp_conn_hash_size=8192
set autoup=60
set pcisch:pci_stream_buf_enable=0
These settings aect the le descriptors.
IP Stack Settings
Add (or edit) the following lines in the /etc/system le:
set ip:tcp_squeue_wput=1
set ip:tcp_squeue_close=1
set ip:ip_squeue_bind=1
set ip:ip_squeue_worker_wait=10
set ip:ip_squeue_profile=0
These settings tune the IP stack.
To preserve the changes to the le between system reboots, place the following changes to the
default TCP variables in a startup script that gets executed when the system reboots:
ndd -set /dev/tcp tcp_time_wait_interval 60000
ndd -set /dev/tcp tcp_conn_req_max_q 16384
ndd -set /dev/tcp tcp_conn_req_max_q0 16384
ndd -set /dev/tcp tcp_ip_abort_interval 60000
ndd -set /dev/tcp tcp_keepalive_interval 7200000
ndd -set /dev/tcp tcp_rexmit_interval_initial 4000
ndd -set /dev/tcp tcp_rexmit_interval_min 3000
ndd -set /dev/tcp tcp_rexmit_interval_max 10000
ndd -set /dev/tcp tcp_smallest_anon_port 32768
ndd -set /dev/tcp tcp_slow_start_initial 2
ndd -set /dev/tcp tcp_xmit_hiwat 32768
ndd -set /dev/tcp tcp_recv_hiwat 32768
Chapter 5 • Tuningthe Operating System and Platform 99
Page 100

Tuningfor Linux platforms
Tuning for Linux platforms
To tune for maximum performance on Linux, you need to make adjustments to the following:
■
“File Descriptors” on page 100
■
“Virtual Memory” on page 101
■
“Network Interface” on page 102
■
“Disk I/O Settings” on page 102
■
“TCP/IP Settings” on page 102
File Descriptors
You may need to increase the number of le descriptors from the default. Having a higher
number of le descriptors ensures that the server can open sockets under high load and not
abort requests coming in from clients.
Start by checking system limits for le descriptors with this command:
cat /proc/sys/fs/file-max
8192
The current limit shown is 8192. To increase it to 65535, use the following command (as root):
echo "65535" > /proc/sys/fs/file-max
To make this value to survive a system reboot, add it to /etc/sysctl.conf and specify the
maximum number of open les permitted:
fs.file-max = 65535
Note: The parameter is not proc.sys.fs.file-max, as one might expect.
To list the available parameters that can be modied using sysctl:
sysctl -a
To load new values from the sysctl.conf le:
sysctl -p /etc/sysctl.conf
To check and modify limits per shell, use the following command:
limit
The output will look something like this:
Sun GlassFish Enterprise Server 2.1 PerformanceTuning Guide • January 2009100
 Loading...