

Page 1

SARK-110
This document is licensed under a Creative Commons Attribution-NonCommercial-ShareAlike 3.0 Unported License.
© Melchor Varela – EA4FRB 2011-2014
Vector Impedance Antenna Analyzer
User’s Manual
Revision 1.1.7
Page 2

SteppIR SARK-110 User’s Manual
Updated to Firmware Version 0.8.x
Rev 1.1.7 October 29th, 2014 - 2 - © Melchor Varela – EA4FRB 2011-2014
Page 3

SteppIR SARK-110 User’s Manual
Contents
1 INTRODUCTION ....................................................................................................................... 5
2 MAIN FEATURES ..................................................................................................................... 6
3 OVERVIEW OF FUNCTIONS ................................................................................................... 7
4 OPERATING THE STEPPIR SARK-110 .................................................................................. 8
4.1 SCREEN LAYOUT .................................................................................................................. 8
4.2 STATUS SYMBOLS MEANING ............................................................................................... 10
4.3 MEANS OF INPUT ................................................................................................................ 10
4.4 CHANGING THE FREQUENCY ............................................................................................... 11
4.5 CHANGING THE SPAN ......................................................................................................... 12
4.6 FREQUENCY PRESETS ........................................................................................................ 13
4.7 USING MARKERS ................................................................................................................ 13
4.8 CHANGING THE VERTICAL AXIS PARAMETER ........................................................................ 16
4.9 SAVING AND RECALLING MEASUREMENTS ........................................................................... 17
4.10 TAKING SCREENSHOTS ................................................................................................... 20
4.11 CHANGING THE OPERATING MODE .................................................................................. 20
4.12 CHANGING THE SETTINGS ............................................................................................... 21
5 SCALAR CHART MODE ........................................................................................................ 32
6 SMITH CHART MODE ............................................................................................................ 34
7 SINGLE FREQUENCY MODE ............................................................................................... 36
8 CABLE TEST MODE (TDR) ................................................................................................... 38
9 FIELD MODE .......................................................................................................................... 42
10 MULTI-BAND MODE .......................................................................................................... 44
11 SIGNAL GENERATOR MODE ........................................................................................... 46
Rev 1.1.7 October 29th, 2014 - 3 - © Melchor Varela – EA4FRB 2011-2014
Page 4

SteppIR SARK-110 User’s Manual
12 COMPUTER CONTROL MODE ......................................................................................... 51
13 TRANSMISSION LINE ADD/SUBTRACT .......................................................................... 53
14 SPECIFICATIONS ............................................................................................................... 56
15 PRECAUTIONS ................................................................................................................... 60
16 REGULATORY WARNING ................................................................................................. 60
17 ACKNOWLEDGMENTS ..................................................................................................... 61
APPENDIX A: THEORY OF OPERATION .............................................................................. 62
APPENDIX B: FUNDAMENTAL PARAMETERS .................................................................... 65
APPENDIX C: UPGRADING THE FIRMWARE ...................................................................... 67
APPENDIX D: OSL CALIBRATION ........................................................................................ 68
APPENDIX E: FREQUENCY CALIBRATION ......................................................................... 71
APPENDIX F: DETECTOR CALIBRATION ............................................................................ 72
APPENDIX G: FREQUENCY PRESETS FILE ........................................................................ 75
APPENDIX H: SCALE PRESETS ........................................................................................... 76
APPENDIX I: CUSTOM CABLE SETTINGS ............................................................................. 78
Rev 1.1.7 October 29th, 2014 - 4 - © Melchor Varela – EA4FRB 2011-2014
Page 5

SteppIR SARK-110 User’s Manual
1 Introduction
The SteppIR SARK-110 Antenna Analyzer is a pocket size instrument providing fast and accurate
measurement of the vector impedance, VSWR, vector reflection coefficient, return loss, and R-L-C
(as series or parallel equivalent circuits). Additionally, the analyzer features a TDR (Time Domain
Reflectometer) mode which is intended for fault location and length determination in coaxial cables
as well as a programmable RF signal generator.
The SteppIR SARK-110 is intended for standalone operation but also operates connected to a
personal computer in combination with the SteppIR SARK Plots client software for Windows, further
enhancing the capabilities of the instrument.
Typical applications include checking and tuning antennas, impedance matching, component
testing, cable fault location, measuring coaxial cable losses and cutting coaxial cables to precise
electrical lengths. As a signal generator it is ideal for receiver calibration, sensitivity tests,and signal
tracing.
The SteppIR SARK-110 features a Direct Digital Synthesis (DDS) generator with a range of 0.1 to
230 MHz and a frequency resolution of 1 Hz. The instrument has full vector measurement capability
and accurately resolves the resistive, capacitive and inductive components of a load. The
measurement reference plane is automatically adjusted via the Open/Short/Load calibration
standard for higher measurement accuracy. Also, the analyzer implements a transmission line
addition or subtraction feature in order to make antenna measurements while discounting the effect
of the feed line.
The user interface, based on a color display, has been designed to be intuitive and easy to use. The
graphical impedance displays provide a quick view of the antenna impedance characteristics on a
user-selected sweep range. This includes the graphical plot of two user-selectable parameters in a
scalar chart or the complex reflection coefficient in Smith chart form. To help speed up
measurements, two markers are available, both of which are user positionable or can operate in
automatic tracking mode.
The Multiband mode is a unique feature of the SteppIR SARK-110 whereby it is able to display
simultaneously the plot of an impedance parameter in four scalar charts. This feature is ideal for
tuning multiband antennas.
Also included is a single frequency measurement mode which presents a complete impedance
parameter analysis at a user selectable frequency and displays diagrams of equivalent circuits.
The analyzer uses an internal 2MB flash disk for the storage and recall of measured parameters,
screenshots, analyzer configuration and firmware updates. This disk is accessible via USB so the
Rev 1.1.7 October 29th, 2014 - 5 - © Melchor Varela – EA4FRB 2011-2014
Page 6

SteppIR SARK-110 User’s Manual
measured parameters can be downloaded to a PC for analysis using the ZPLOTS spreadsheet
program or with SteppIR SARK Plots client software for Windows.
Please let us have your suggestions through the website http://www.sark110.com as we are highly
motivated to extend this device’s functionality based on community requests.
2 Main Features
Pocket size and lightweight
Solid aluminum case
Intuitive and easy to use
Operating modes: Scalar Chart, Smith Chart, Single Frequency, Cable Test (TDR), Field
Mode, Multi-band, Signal Generator, and Computer Control
Good accuracy over a broad range of impedances
Resolves the sign of the impedance
Manual and automatic positioning tracking markers
Internal 2MB USB disk for the storage of measurements, screenshots, configuration and
firmware upgrade
Exports data in ZPLOTS-compatible format for further analysis on a PC
SARK Plots client software for Windows
Lifetime free firmware upgrades
Open to community requested features
Open source Software Development Kit (SDK) including a device simulator for development
of user applications
Rev 1.1.7 October 29th, 2014 - 6 - © Melchor Varela – EA4FRB 2011-2014
Page 7
SteppIR SARK-110 User’s Manual
Power Switch
Mini USB Port
Navigator A
Navigator B
Run/Hold
Select
Save Screen
Save Conf.
Test Port
3" TFT LCD
SARK-110
é
••• ê
-•••+
Ø
||
USB
ON
Test
Port
3 Overview of Functions
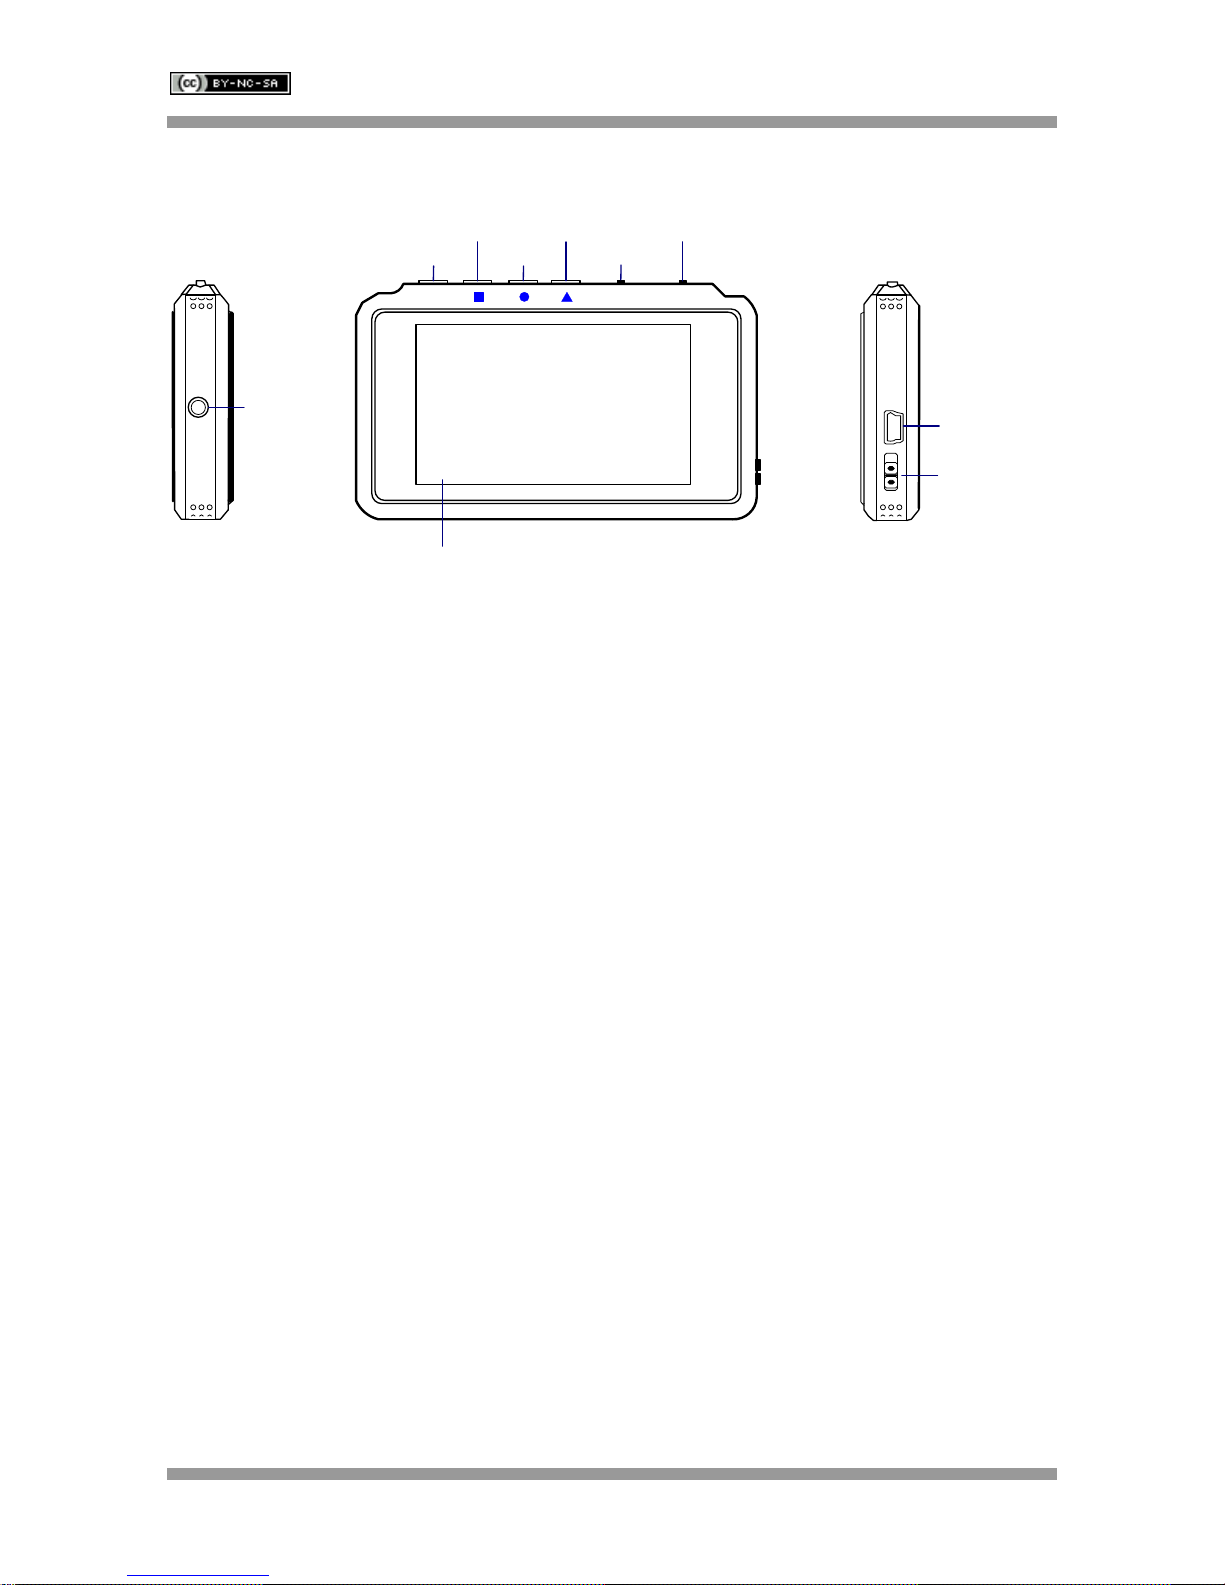
The unit has a Test Port located on the left side to connect to the device under test. This receptacle
accepts straight MCX plug connector types. The product pack includes a MCX plug to BNC female
cable adapter.
The USB port located on the right side allows connecting the unit to a personal computer for
communication and internal battery charging using a compatible mini-USB cable (not included). The
unit charges the internal battery when connected to USB. The internal battery charger manages
automatically the charge cycle and stops the process when battery is fully charged. The complete
charge cycle takes around 3.5 hours.
Slide the Power Switch button located on the right side to the ON position for turning on the unit. An
automatic power-off feature can be set for power-saving after a user specified period of inactivity.
Operation is controlled by four buttons and two navigation keys located on the top side of the unit. A
3” TFT color LCD is used for display diagrams.
Rev 1.1.7 October 29th, 2014 - 7 - © Melchor Varela – EA4FRB 2011-2014
Page 8

SteppIR SARK-110 User’s Manual
1
Diagram
11
Markers information
2
Traces
12
Detailed measurements
3
Markers
13
Frequency and span settings
4
Vertical axis labeling
14
Transmission Line length setting
5
Horizontal axis labeling
15
Reference impedance setting
6
Main menu
16
Loaded data file name
7
Highlighted menu option
17
Disk write operation in progress
8
Submenu
18
Calibration status
4 Operating the SteppIR SARK-110
This chapter provides information about the SteppIR SARK-110’s basic functionality and user
interface.
4.1 Screen Layout
The following figure shows the screen layout in Scalar Chart mode. It shows diagram areas that are
the same for all operating modes of the SteppIR SARK-110. Screen layouts that show specifics for
each operating mode are provided in corresponding sections of this manual.
Rev 1.1.7 October 29th, 2014 - 8 - © Melchor Varela – EA4FRB 2011-2014
Page 9

SteppIR SARK-110 User’s Manual
9
Highlighted submenu option
19
Run/Hold status
10
Currently selected submenu option
20
USB/Battery status
Rev 1.1.7 October 29th, 2014 - 9 - © Melchor Varela – EA4FRB 2011-2014
Page 10
SteppIR SARK-110 User’s Manual
Calibration status
Calibrated
Non-calibrated
Run/Hold status
Measurements in progress
Measurements on hold
USB/Battery status
Device operating from USB
Charge status of the battery when the device is operating from the
battery
Disk
Disk write operation in progress
Navigator A
Navigator B
Run/Hold
Select
Save Screen
Save Conf.
é
••• ê
-•••+
Ø
||
SARK-110
4.2 Status Symbols Meaning
4.3 Means of Input
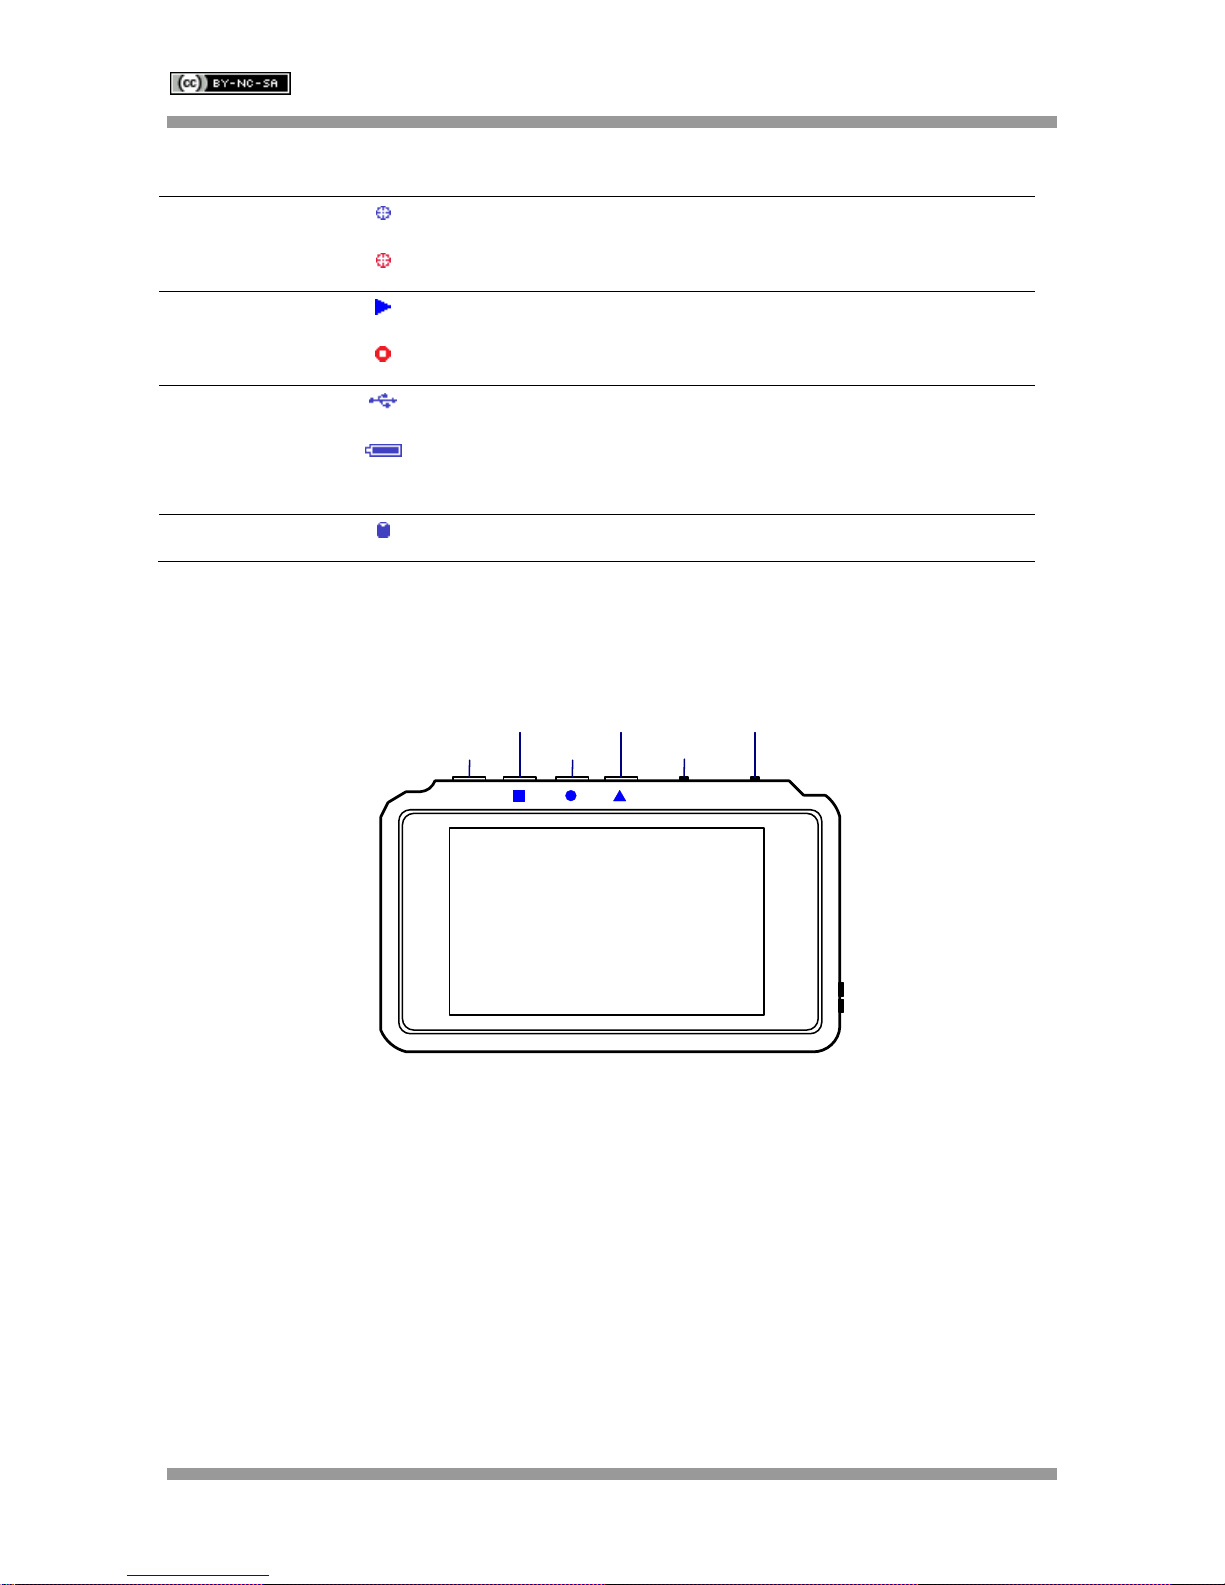
There are four buttons and two navigation keys on the SteppIR SARK-110.
Navigator A
Navigator A is used to navigate within the main menu (left side of the screen). The active option is
highlighted with a green background color.
Navigator B
Navigator B is used for changing the value of the highlighted option in the main menu (for Freq,
Span, Marker1, Marker2, LeftY and RightY) and to navigate within the popup submenus.
Run/Hold [►||]
Rev 1.1.7 October 29th, 2014 - 10 - © Melchor Varela – EA4FRB 2011-2014
Page 11

SteppIR SARK-110 User’s Manual
The Run/Hold button is used to control the operating state of the SteppIR SARK-110: Working or
Paused. In the paused state the signal generator and measurement circuits are inactive.
Ø Note: when loading a stored data file the analyzer is automatically placed in a paused
state.
Select [■]
The button is used to activate the popup submenu associated with the highlighted option and for
selecting the desired option within the popup submenu.
Ø Note: Pressing any other button will cancel a selection.
Save Screen [●]
The Save Screen button is used to take a screenshot of the current screen. The screenshot is
stored on the internal flash disk.
Save Conf. [▲]
The Save Conf. button is used to store the complete analyzer state and settings. The stored state is
restored automatically after the device is powered on.
4.4 Changing the Frequency
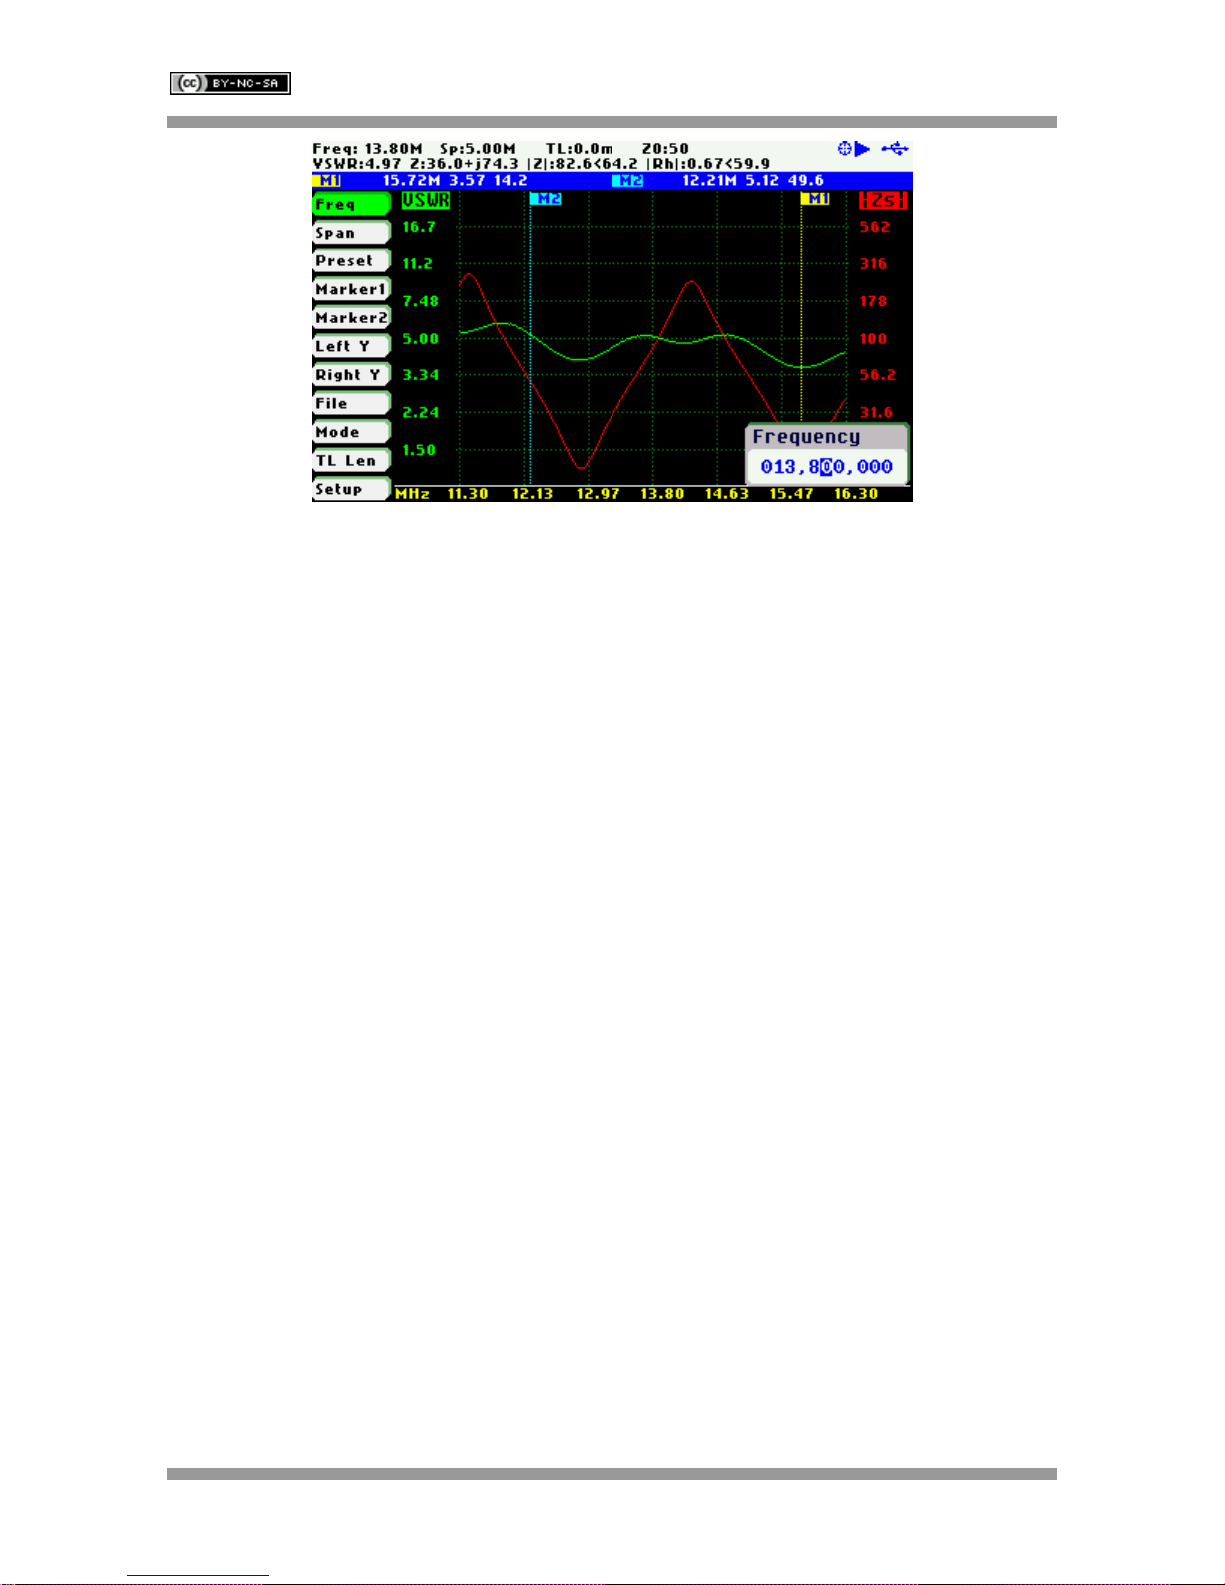
There are two methods of editing the frequency (centre frequency for sweep modes):
(i) Use Navigator A to highlight «Freq» in the main menu on the left side of the display. Press the
Select [■] button to display the popup dialog associated with «Freq». Then use Navigator B to
change the frequency. The frequency will change according to the current frequency multiplier that is
highlighted in reverse video. Use Navigator A to change the frequency multiplier position if needed.
Press the Select [■] button to validate the frequency selection. Press any other button to cancel the
operation.
The screenshot below is of the frequency edit dialog, showing the highlighted frequency multiplier
positioned over digit 5 (frequency increments of 10 KHz).
Rev 1.1.7 October 29th, 2014 - 11 - © Melchor Varela – EA4FRB 2011-2014
Page 12
SteppIR SARK-110 User’s Manual
(ii) Use Navigator A to highlight «Freq» in the main menu on the left side of the display. Then use
Navigator B to change the frequency. The frequency will change according to the current frequency
multiplier. The frequency multiplier can be changed from the popup dialog, see (i) above.
Ø Note: the span range will be adjusted automatically if the resultant upper or lower
frequency entry causes it to fall outside operational limits.
4.5 Changing the Span
There are two methods of editing the Span:
(i) Use Navigator A to highlight «Span» in the main menu on the left side of the display. Press the
Select [■] button to display the popup dialog associated with «Span». Then use Navigator B to
change the span. The span will change according to the current span frequency multiplier that is
highlighted in reverse video. Use Navigator A to change the span frequency multiplier position if
needed. Press the Select [■] button to validate the span selection. Press any other button to cancel
the operation.
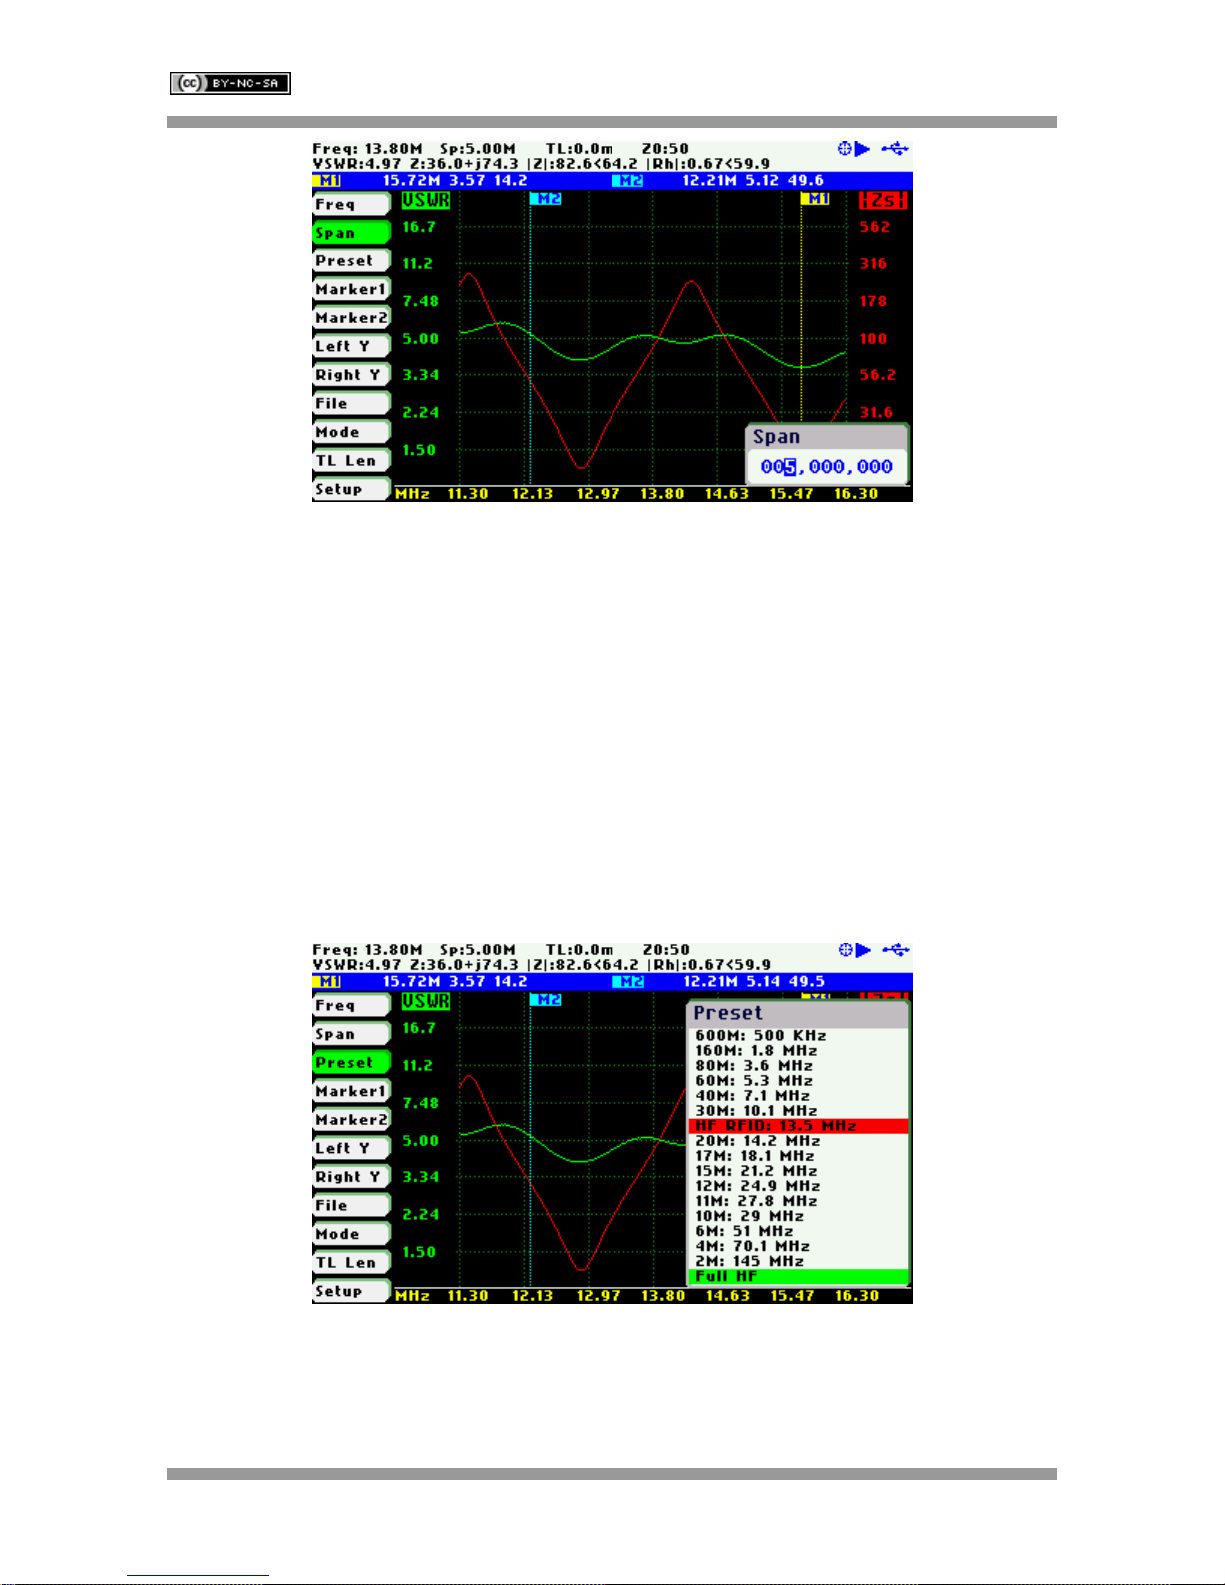
The screenshot below is of the span edit dialog, showing the span frequency multiplier positioned
over digit 7 (frequency increments of 1 MHz).
Rev 1.1.7 October 29th, 2014 - 12 - © Melchor Varela – EA4FRB 2011-2014
Page 13
SteppIR SARK-110 User’s Manual
(ii) Use Navigator A to highlight «Span» in the main menu on the left side of the display. Then use
Navigator B to change the span. The span will change according to the current span frequency
multiplier. The span frequency multiplier can be changed from the popup dialog, see (i) above.
4.6 Frequency Presets
The analyzer provides predetermined frequency and span settings including the amateur radio
bands and other suitable settings. Use Navigator A to highlight «Preset» in the main menu.
Press the Select [■] button to activate the Preset popup submenu. Use Navigator B to highlight the
desired preset. Press the Select [■] button to validate the preset selection. Press any other button
to cancel the operation.
See in the screenshot below the available presets:
4.7 Using Markers
The SteppIR SARK-110 has two markers that can either be manually positioned by the user or set
to operate in automatic tracking mode. The markers indicate the horizontal and vertical position of
Rev 1.1.7 October 29th, 2014 - 13 - © Melchor Varela – EA4FRB 2011-2014
Page 14
SteppIR SARK-110 User’s Manual
the point they are positioned on. The horizontal position of a marker is shown by a dotted vertical
line which extends from the top to the bottom of the measurement diagram. The markers
information window, in blue background, shows the frequency or distance (in cable test mode) and
the two values that correspond to the plotted values at each of the markers.
Use Navigator A to highlight either «Marker1» or «Marker2» in the main menu.
Press the Select [■] button to activate the Marker popup submenu. Available options are: «Enable»
for activating or deactivating the marker, «Select» for selecting or deselecting the marker, and
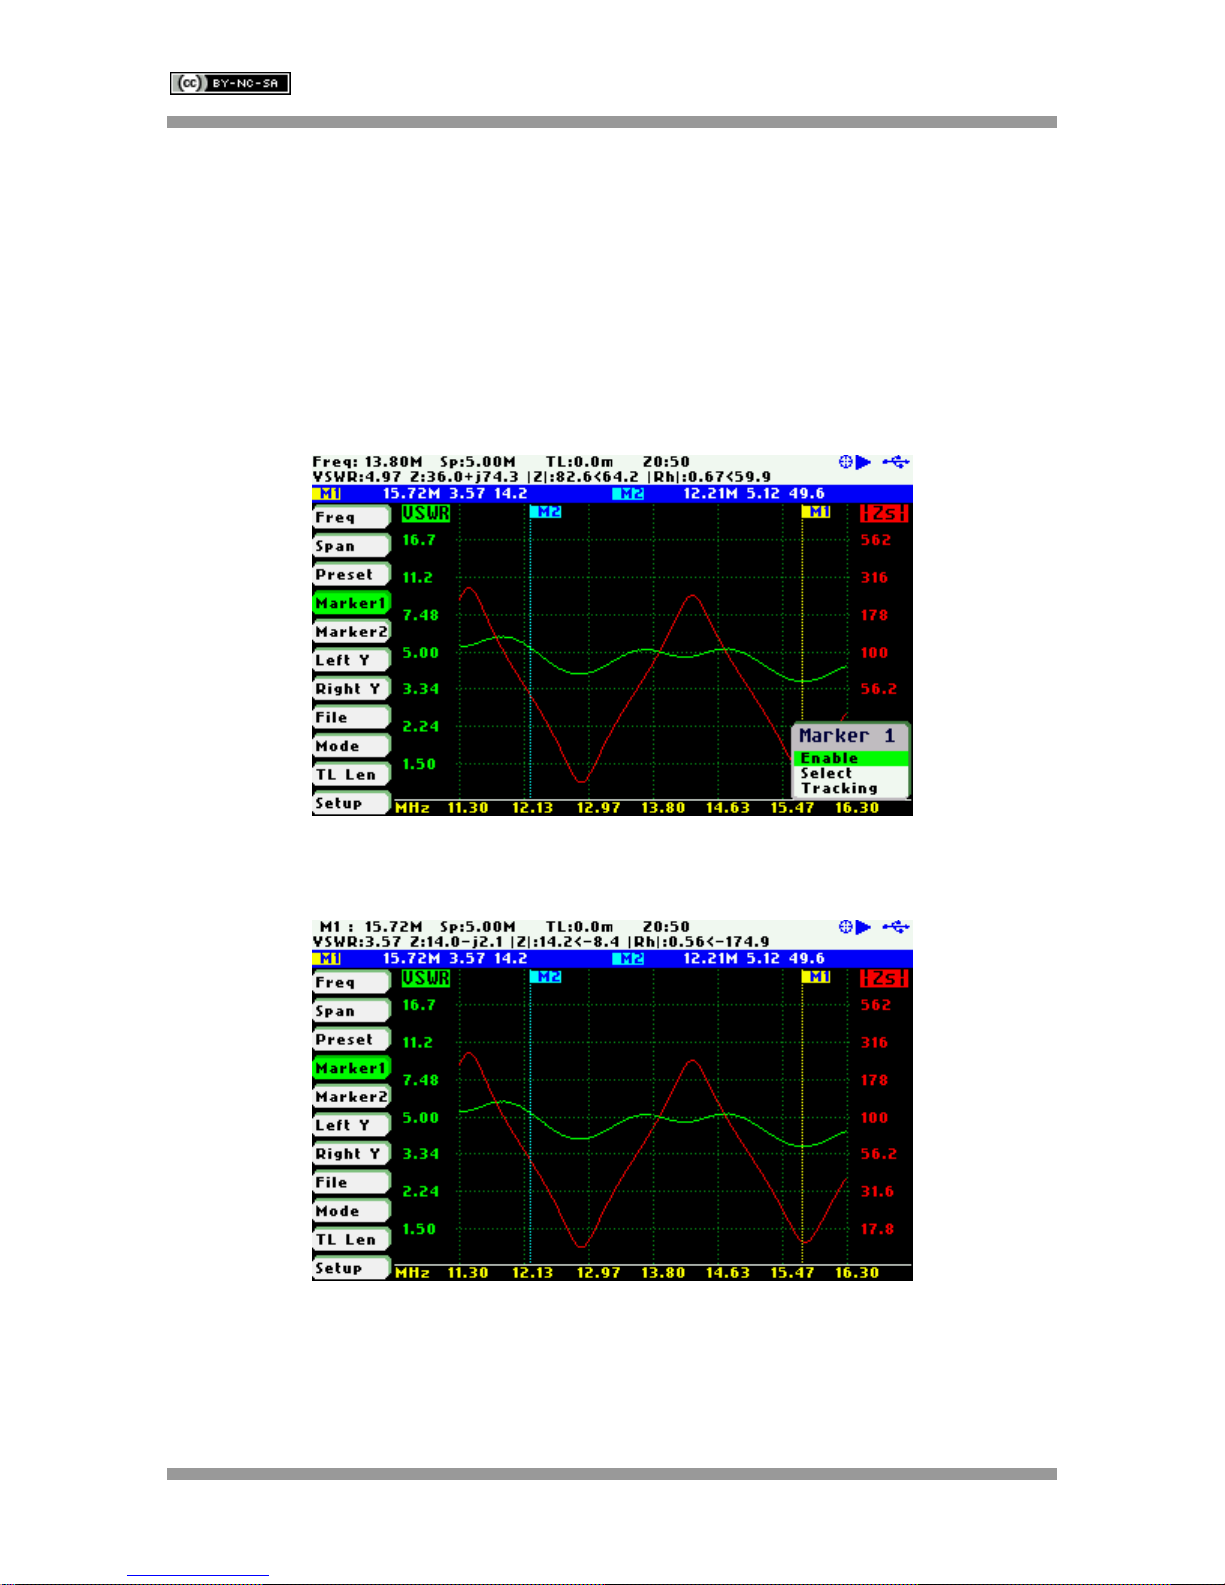
«Tracking» for selecting the tracking mode; see screenshot below:
The «Select» option activates or deactivates the display of detailed parameters at the marker
position. The screenshot below shows Marker1 in the selected state:
The automatic tracking feature makes positioning of the markers easier, thus helping the user to
speed up measurements.
The following tracking modes are available:
Rev 1.1.7 October 29th, 2014 - 14 - © Melchor Varela – EA4FRB 2011-2014
Page 15
SteppIR SARK-110 User’s Manual
Peak Min (p)
Peak Max (P)
Absolute Min (m)
Absolute Max (M)
Value Cross Any (X)
Value Cross Up (^)
Value Cross Down (v)
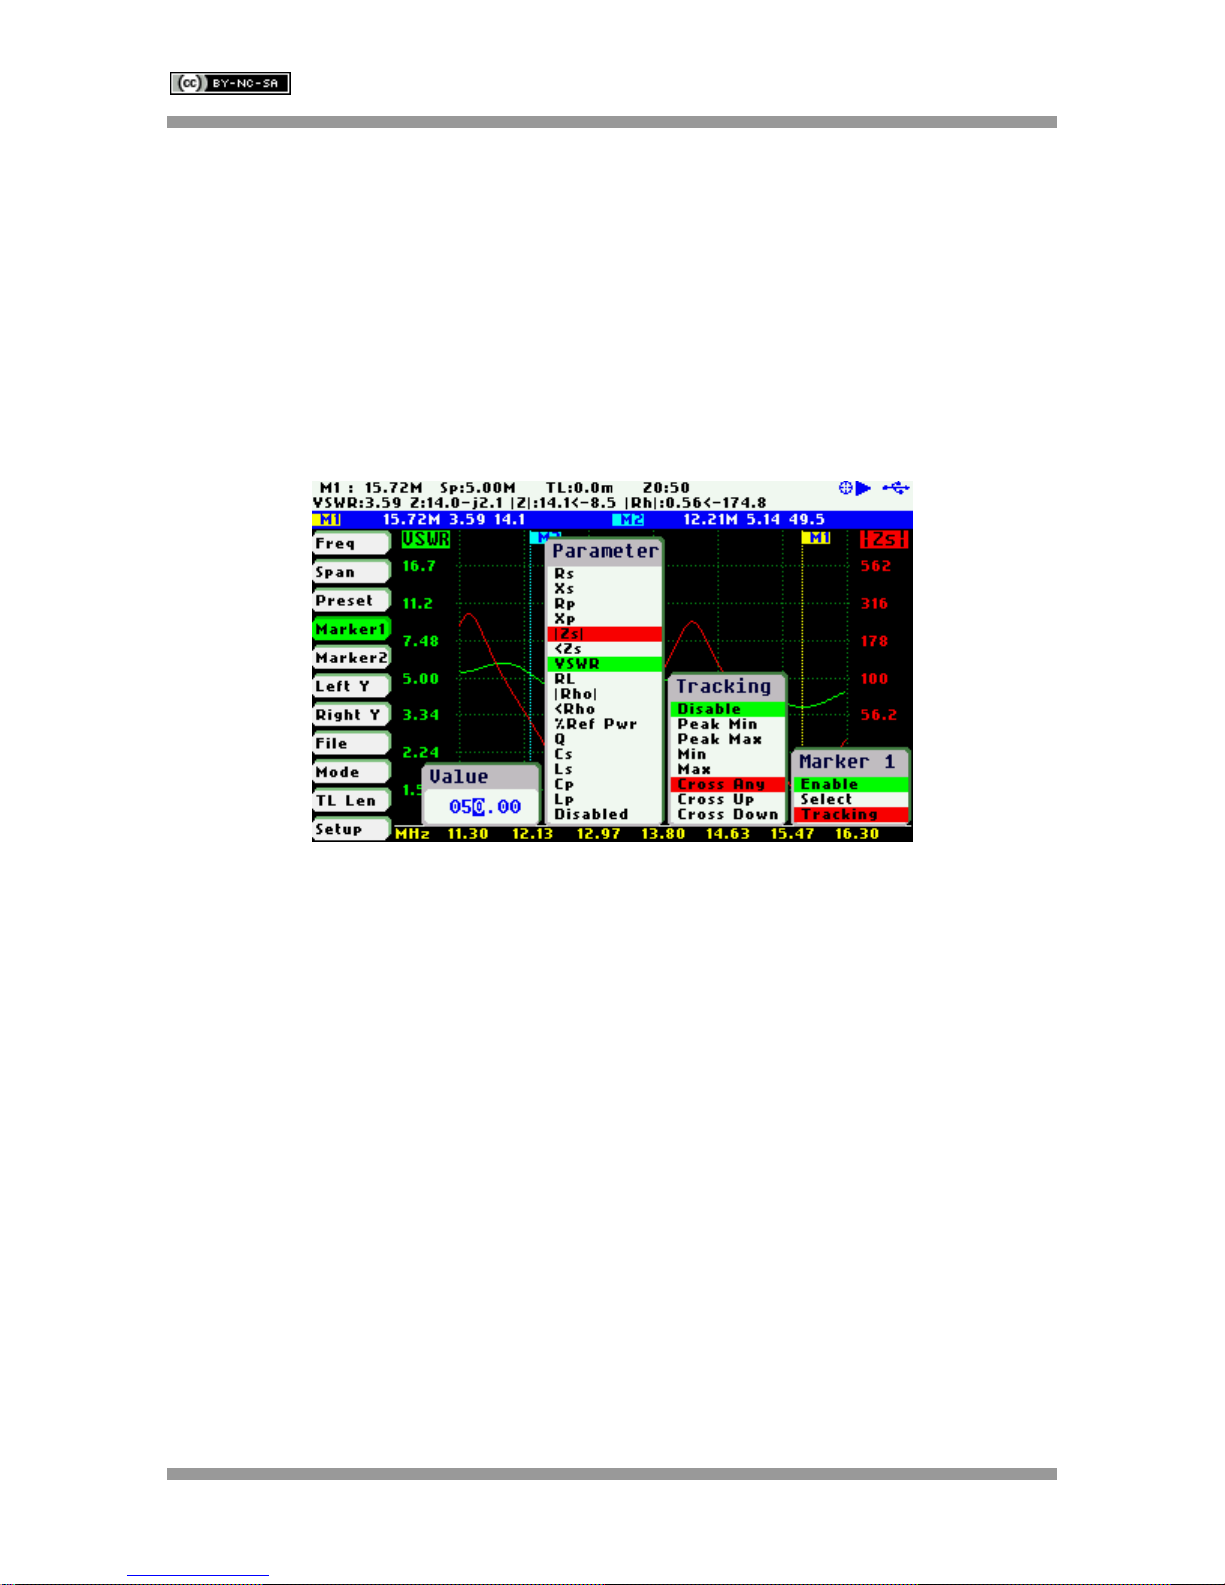
The automatic positioning of markers is activated in the «Tracking» sub-option. Select the tracking
mode from any of the modes above and then the applicable parameter to track. In addition, a
detection value must be specified for the Cross detection modes.
For example, you could set Marker 1 to track automatically the minimum VSWR values in the trace:
«Marker1» «Tracking» «Peak Min» «VSWR»; and Marker 2 to track the crossovers on the 50-ohm
impedance value: «Marker2» «Tracking» «Cross Any» «Z» «50.0».
You could also program the unit to detect the bandwidth by setting «Marker1» «Tracking» «Cross
Down» «VSWR» «2.0»; and «Marker2» «Tracking» «Cross Up» «VSWR» «2.0».
Navigator B will be used to move to the different detection points, except for the Max and Min
tracking modes where logically there is only a single detection point.
The tracking mode for each marker is shown in the markers information window. This information is
displayed in red if either the data is not available or if the tracking condition cannot be resolved;
otherwise it is displayed in green.
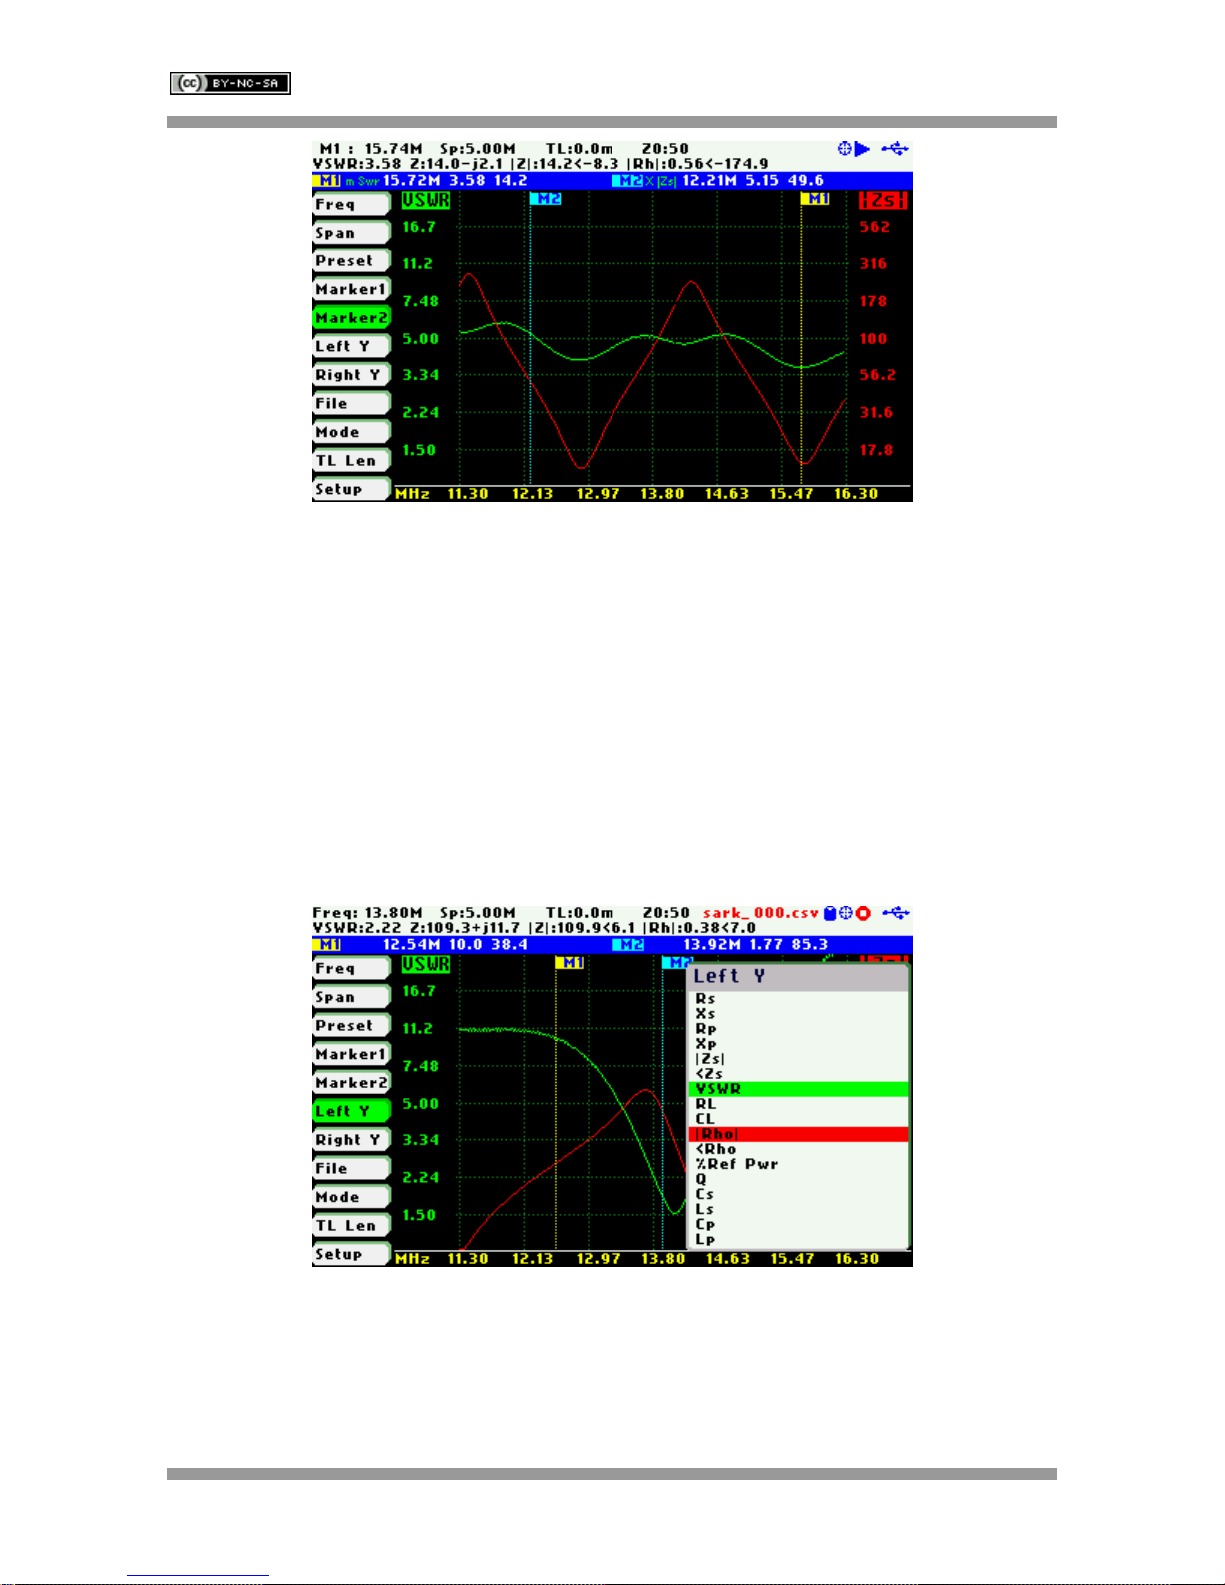
The screenshot below shows Marker1 tracking the minimum value of VSWR and Marker 2, tracking
all |Z| crossing at 50-ohms:
Rev 1.1.7 October 29th, 2014 - 15 - © Melchor Varela – EA4FRB 2011-2014
Page 16
SteppIR SARK-110 User’s Manual
4.8 Changing the Vertical Axis Parameter
In Scalar Chart mode, the SteppIR SARK-110 can display two traces from any of the available
parameters for the vertical axis. Use Navigator A to highlight either «LeftY» or «RightY» in the main
menu.
There are two methods of changing the selected vertical axis parameter:
(i) Press the Select [■] button to activate the LeftY or RightY popup submenu. Use Navigator B to
highlight the desired submenu parameter option. Press the Select [■] button to validate the
selection. Press any other button to cancel the operation.
The screenshot below show the available parameters for the vertical axis:
(ii) Use Navigator B when either the «LeftY» or «RightY» option is highlighted. Options are
selected sequentially.
Rev 1.1.7 October 29th, 2014 - 16 - © Melchor Varela – EA4FRB 2011-2014
Page 17
SteppIR SARK-110 User’s Manual
4.9 Saving and Recalling Measurements
The SteppIR SARK-110 has the capability to store measurements to the internal disk and recall
them either to review the data later in the analyzer screen or to download the data from the USB
disk to a PC for further analysis using SARK Plots or the ZPLOTS Excel application, available from
http://www.ac6la.com/zplots.html.
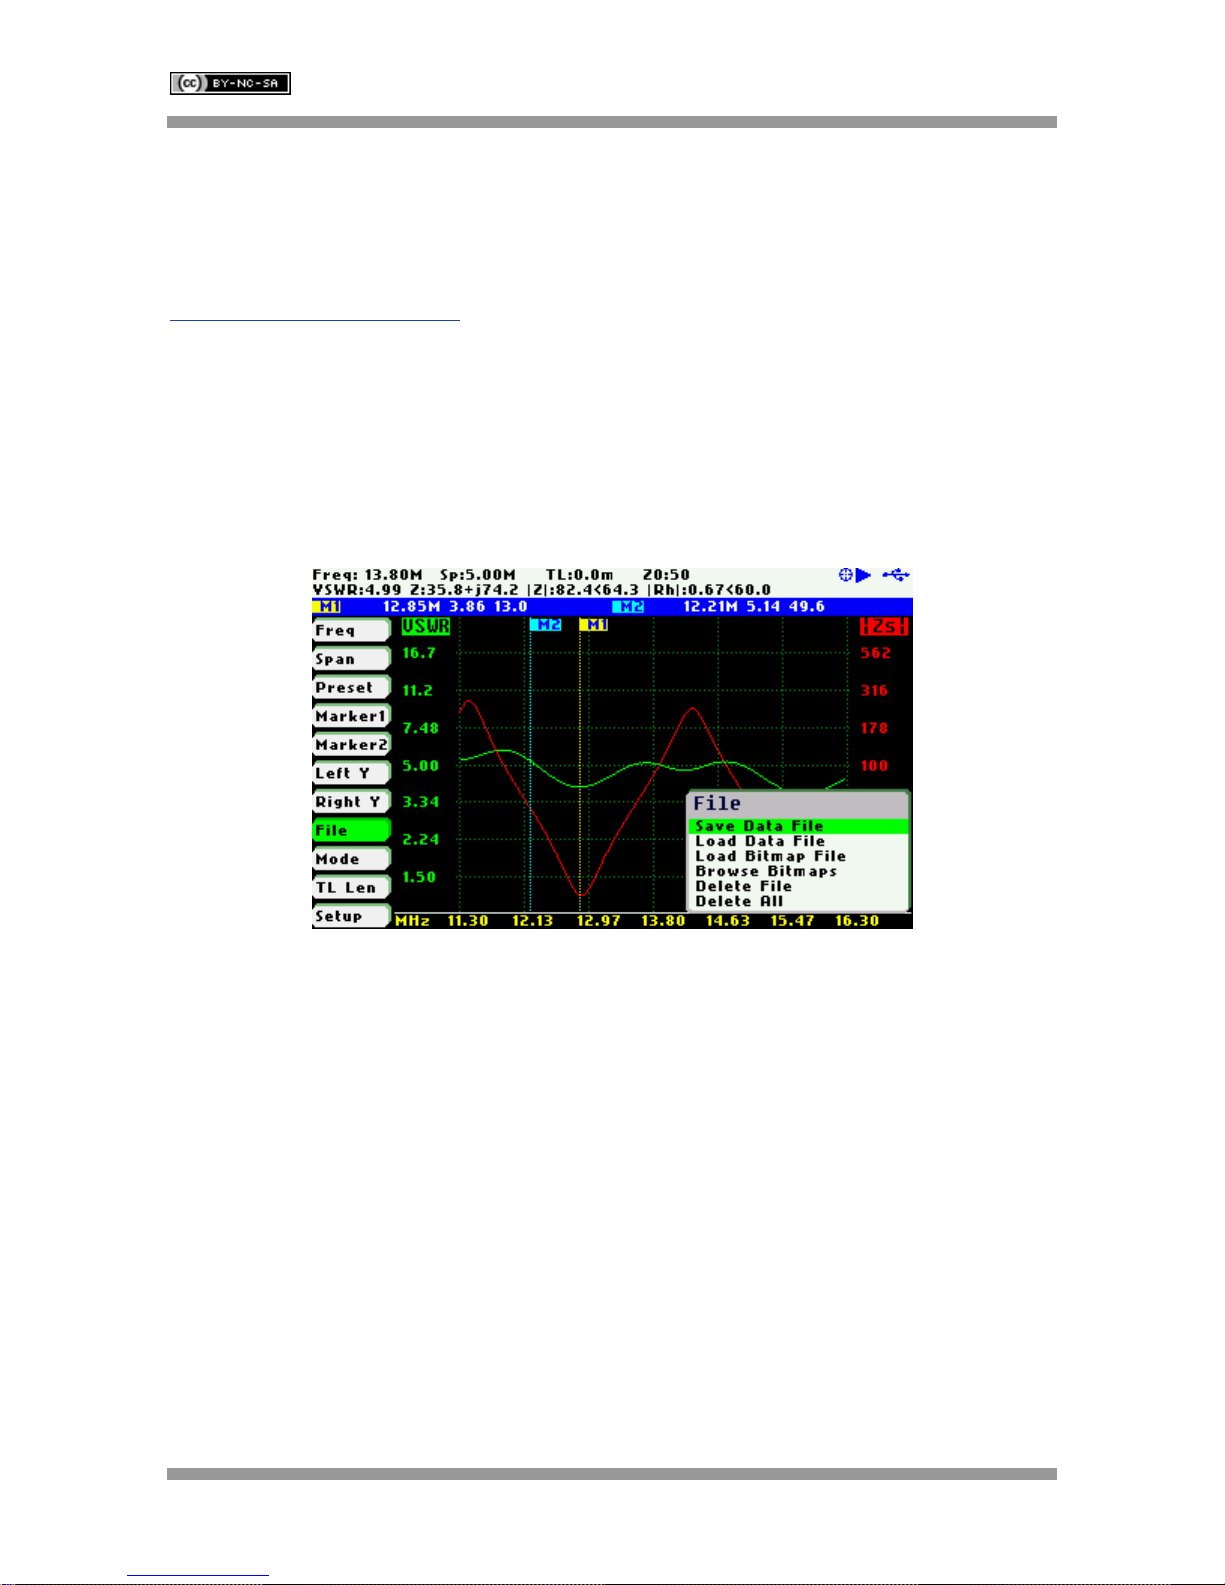
Use Navigator A to highlight «File» in the main menu for data file operations.
Press the Select [■] button to activate the File popup submenu. Use Navigator B to highlight the
desired submenu File option.
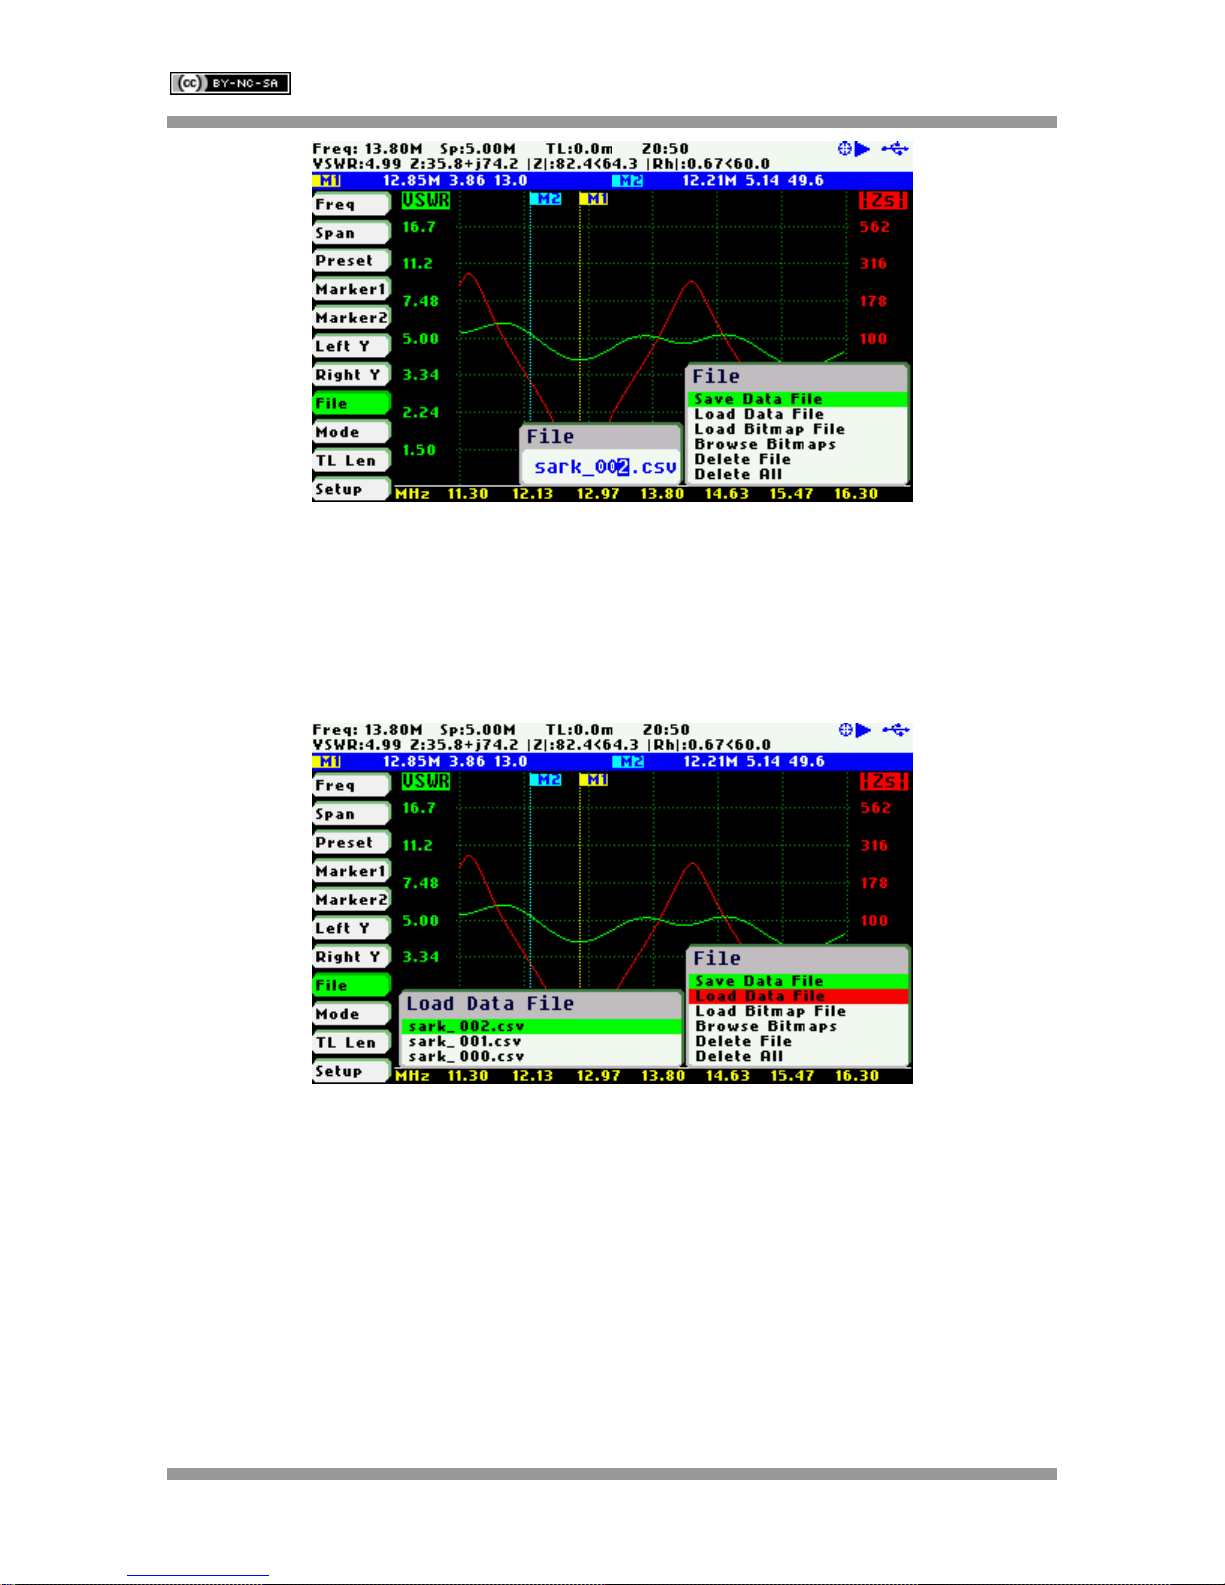
«Save Data File»
The Save Data File option allows saving the current measured data for further review:
After selecting the «Save File» submenu option, enter the file name. By default, the file name has
the format “sark_xxx.csv” (or “sark_xxx.tdr” for Cable Test mode), where xxx is an automatically
assigned number. To change the file name, use Navigator B to change the character value and
Navigator A to change the character position highlighted in inverse video. Press the Select [■]
button to validate the selection. Press any other button to cancel the operation.
Rev 1.1.7 October 29th, 2014 - 17 - © Melchor Varela – EA4FRB 2011-2014
Page 18
SteppIR SARK-110 User’s Manual
«Load Data File»
To retrieve the stored data, select the «Load Data File» submenu option. A second popup submenu
is displayed with a list of available files. Use Navigator B to highlight the desired file. Press the
Select [■] button to validate the selection. Press any other button to cancel the operation. Once the
file is selected, the data is loaded and plotted.
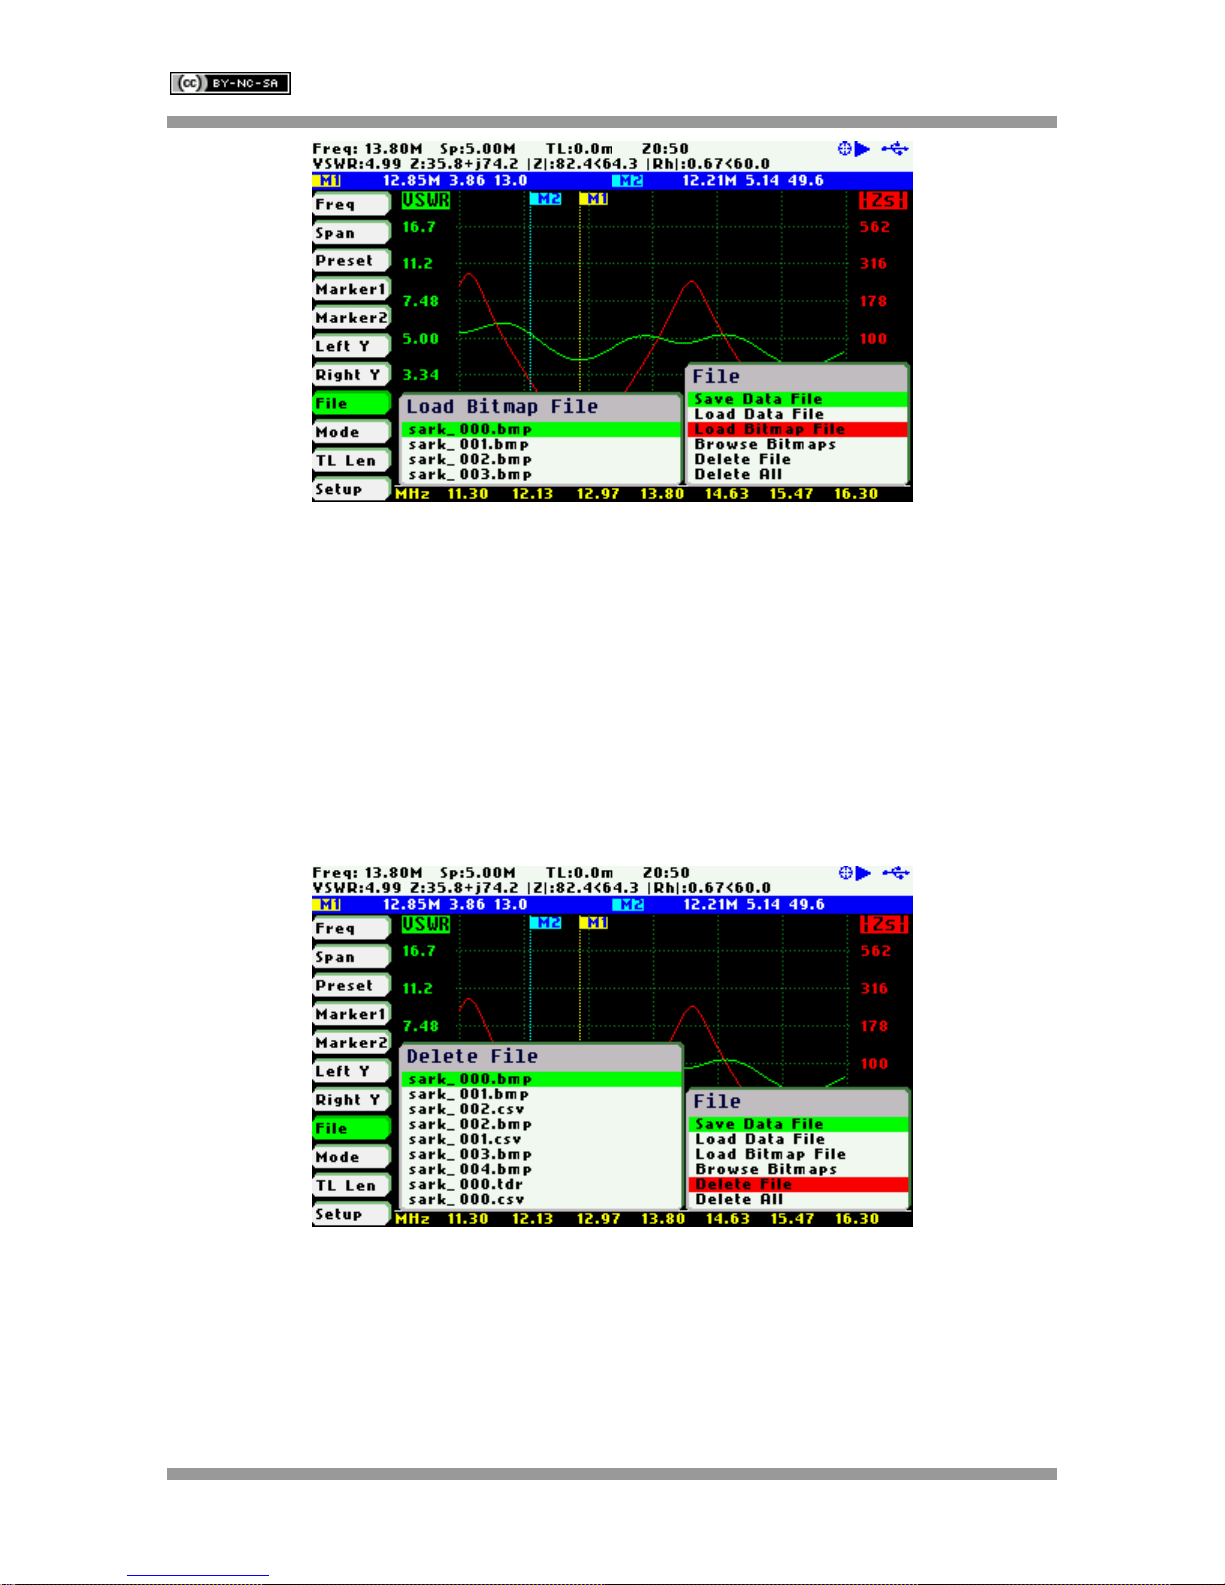
«Load Bitmap File»
Use the «Load Bitmap File» option to display a captured screenshot. Press the Select [■] button to
finalize the operation.
Rev 1.1.7 October 29th, 2014 - 18 - © Melchor Varela – EA4FRB 2011-2014
Page 19
SteppIR SARK-110 User’s Manual
«Browse Bitmaps»
Select the option «Browse Bitmaps» from the «File» menu to review the captured screenshots. Use
Navigator B to select the different bitmaps. Press the Select [■] button to finalize the operation.
«Delete File»
Use the «Delete file» option to delete a single file on the device disk.
When selecting the «Delete File» option a popup submenu will be displayed with the list of available
files. Use Navigator B to highlight the desired file. Press the Select [■] button to validate the
selection. Press any other button to cancel the operation.
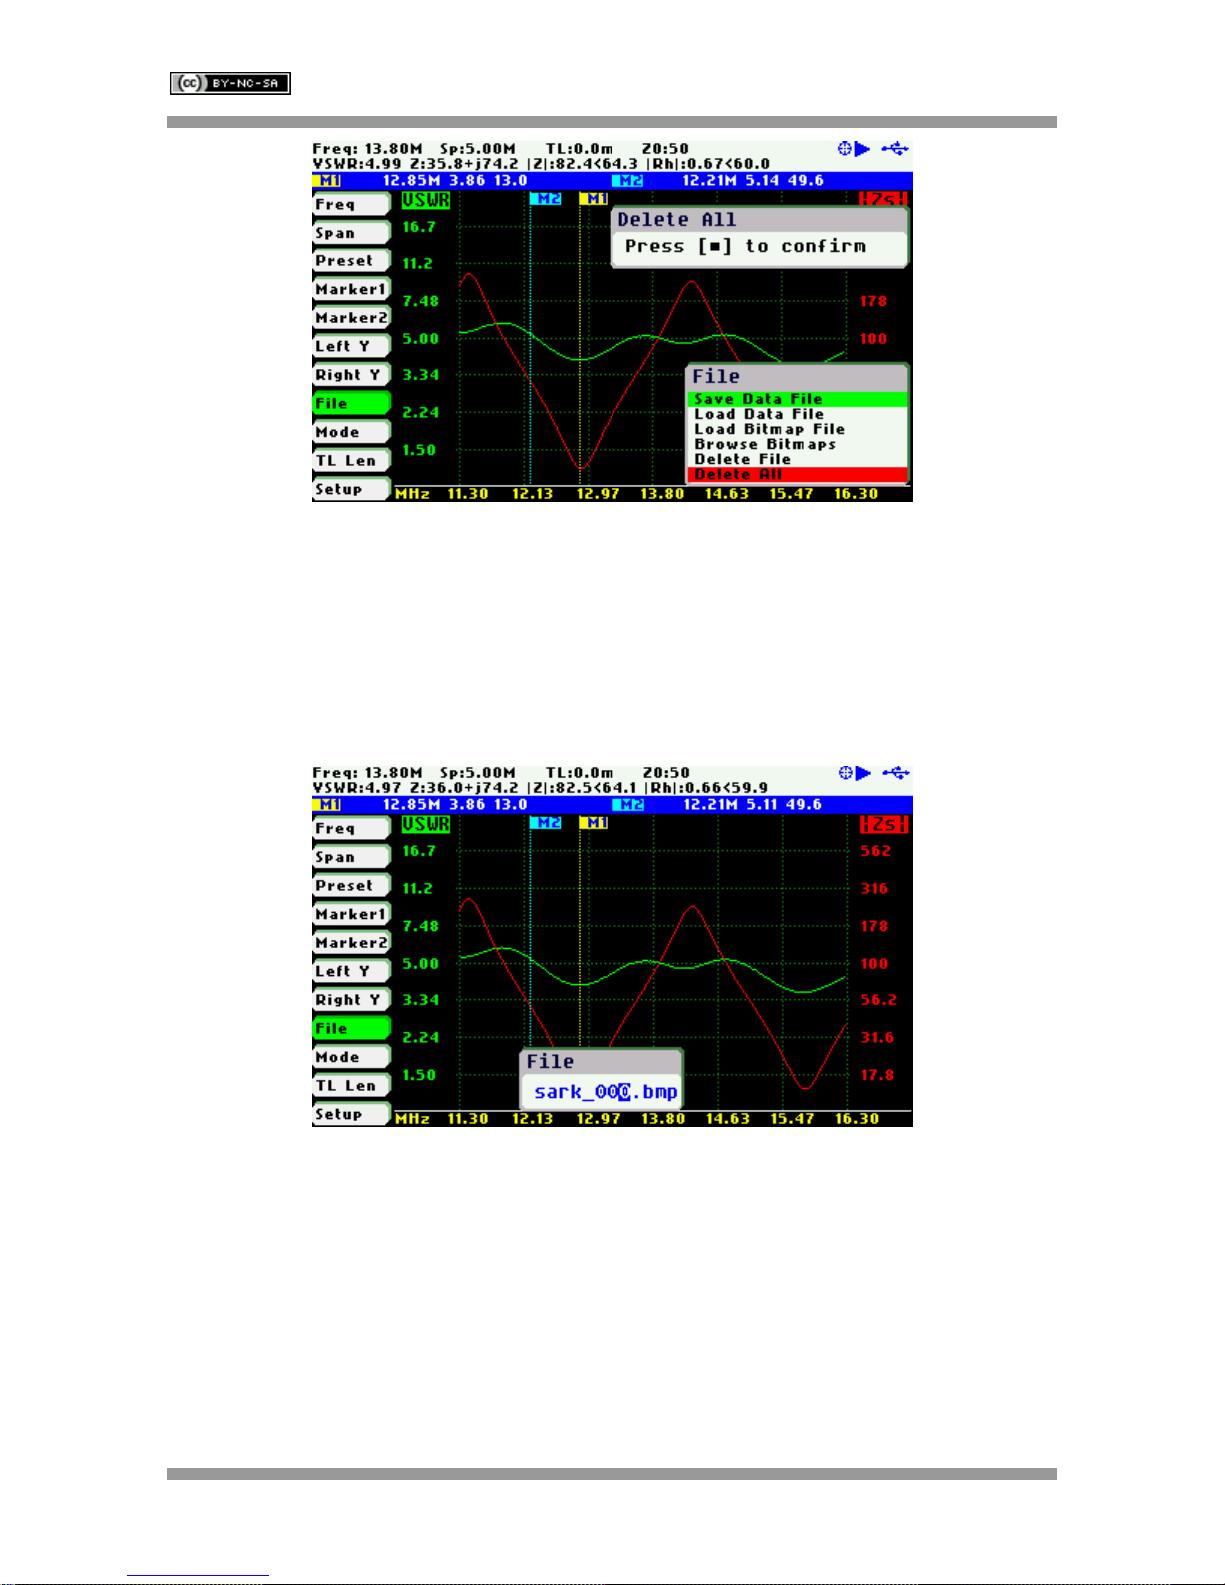
«Delete All»
Use the «Delete All» option to delete all user files.
When selecting the «Delete All» option, a confirmation dialog box is activated to prevent an
accidental deletion.
Rev 1.1.7 October 29th, 2014 - 19 - © Melchor Varela – EA4FRB 2011-2014
Page 20
SteppIR SARK-110 User’s Manual
4.10 Taking Screenshots
Press the Save Screen [●] button to capture the current screen. Then enter the file name. By default
the file name has the format “sark_xxx.bmp”, where xxx is an automatically assigned number. To
change the file name, use Navigator B to change the character value and Navigator A to change the
character position highlighted in inverse video. Press the Select [■] button to validate the selection.
Press any other button to cancel the operation.
Select the options «Load Bitmap File» or «Browse Bitmaps» from the «File» menu to review the
captured screenshots. Also, they can be reviewed on a PC because they are in Windows bitmap
compatible format.
Ø Note: the bitmap files use a significant amount of disk (188KB per screenshot)
4.11 Changing the Operating Mode
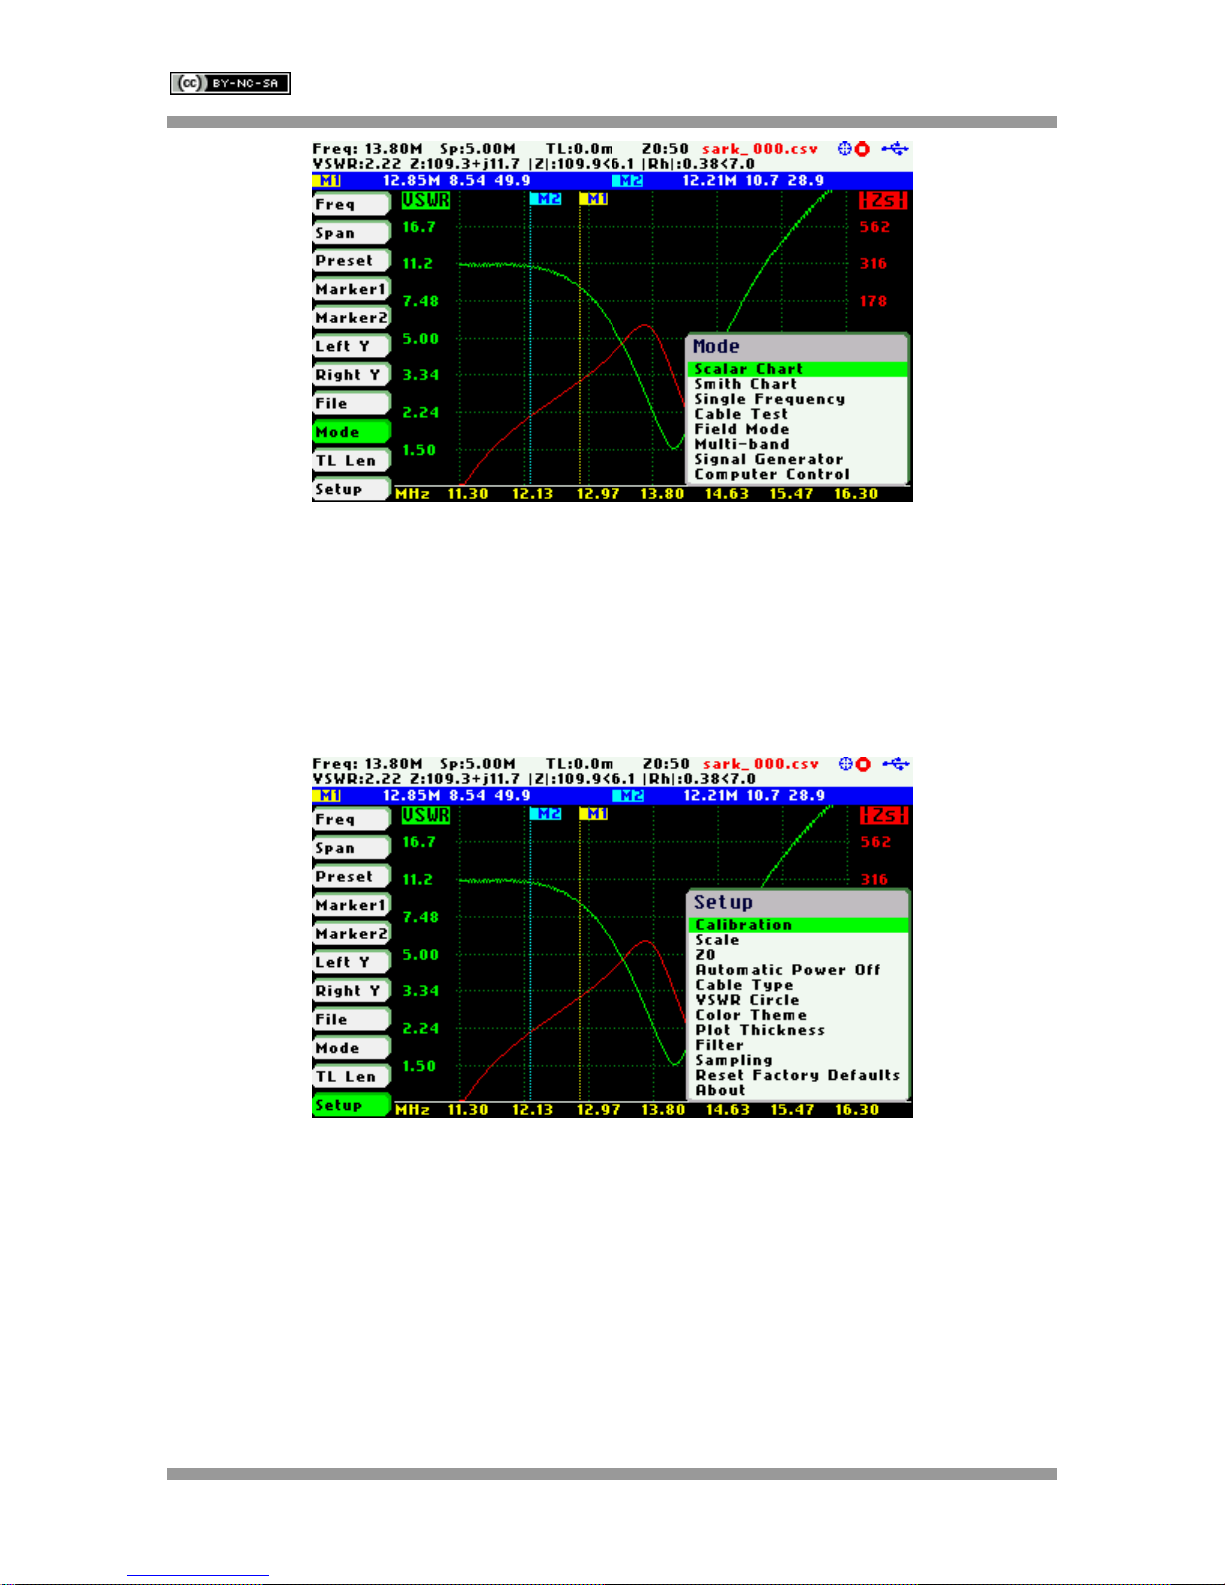
Use Navigator A to highlight «Mode» in the main menu.
Press the Select [■] button to activate the Mode popup submenu; see the screenshot below:
Rev 1.1.7 October 29th, 2014 - 20 - © Melchor Varela – EA4FRB 2011-2014
Page 21
SteppIR SARK-110 User’s Manual
Use Navigator B to highlight the desired submenu mode option. Press the Select [■] button to
validate the selection. Press any other button to cancel the operation.
4.12 Changing the Settings
Use Navigator A to highlight «Setup» in the main menu.
Press the Select [■] button to activate the Setup popup submenu; see the screenshot below:
Use Navigator B to highlight the desired submenu setup option. Press the Select [■] button to
validate the selection. Press any other button to cancel the operation.
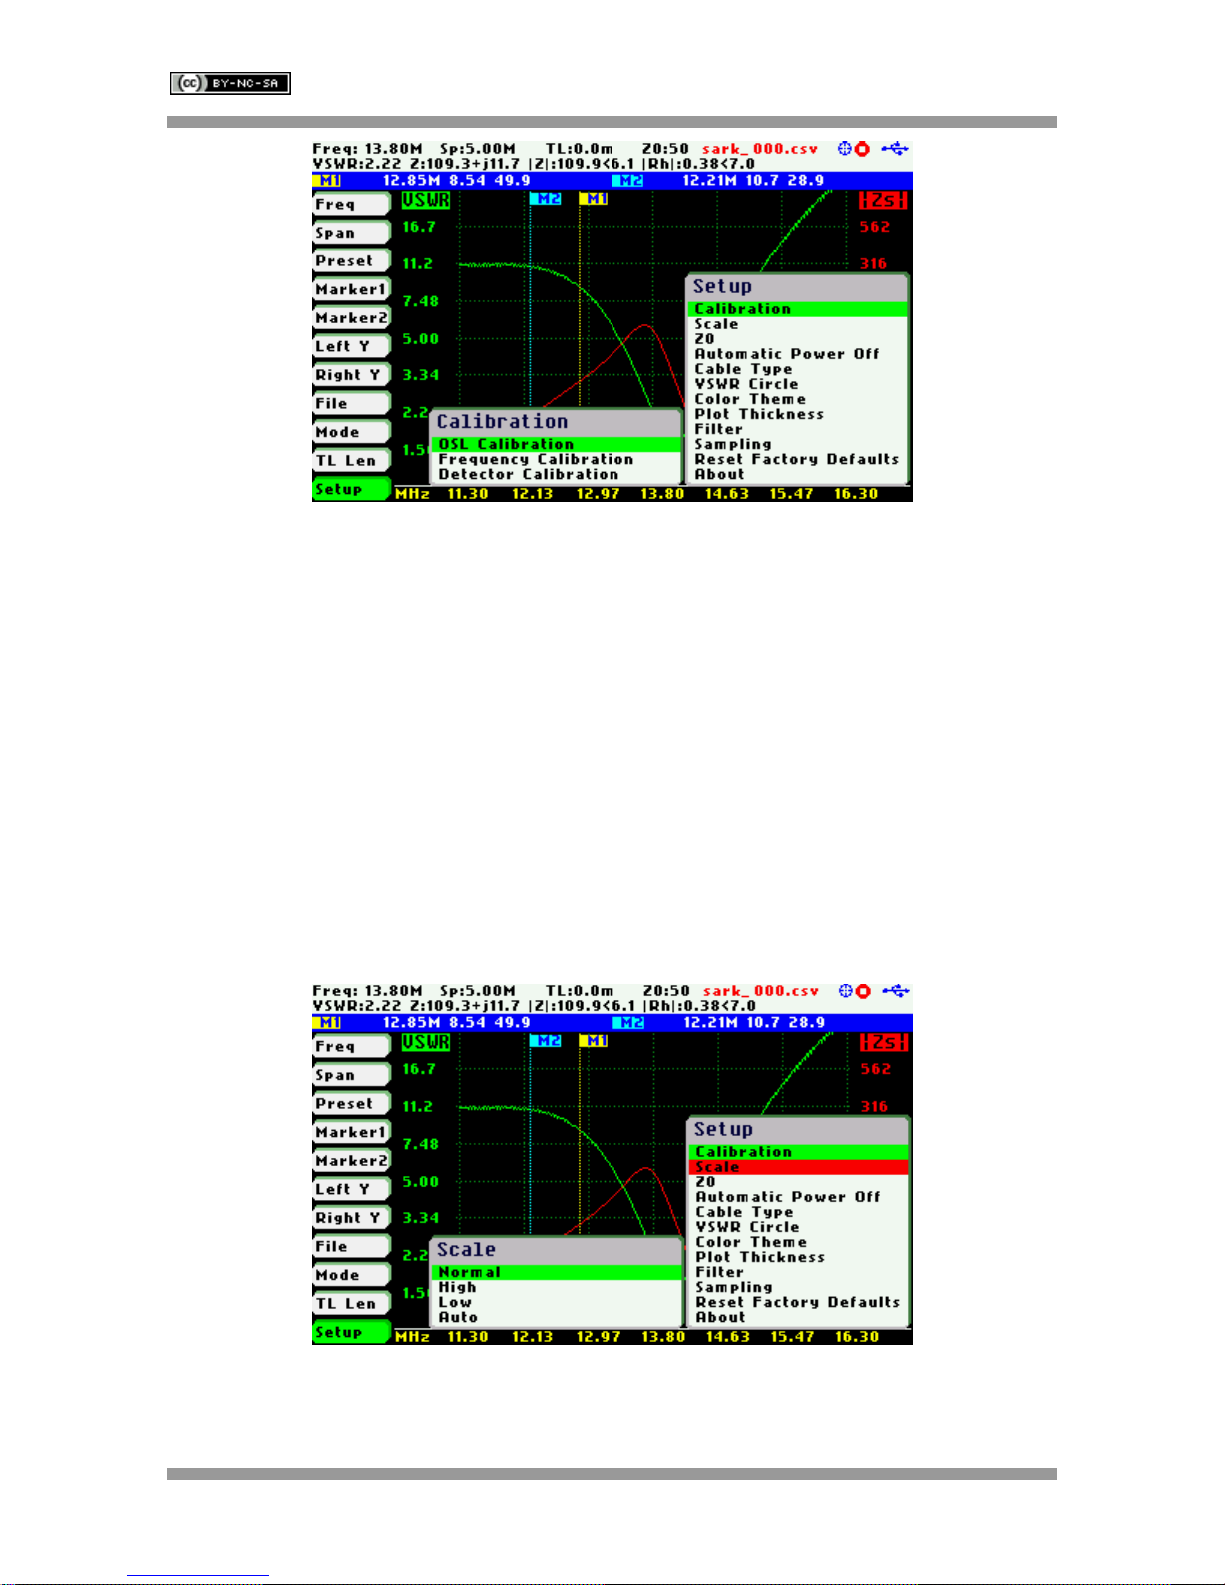
Setup –Calibration
The calibration features are accessible through the Calibration submenu:
Rev 1.1.7 October 29th, 2014 - 21 - © Melchor Varela – EA4FRB 2011-2014
Page 22
SteppIR SARK-110 User’s Manual
Setup – Calibration - OSL Calibration
See Appendix D:
Setup – Calibration - Frequency Calibration
See Appendix E:
Setup – Detector Calibration
See Appendix F:
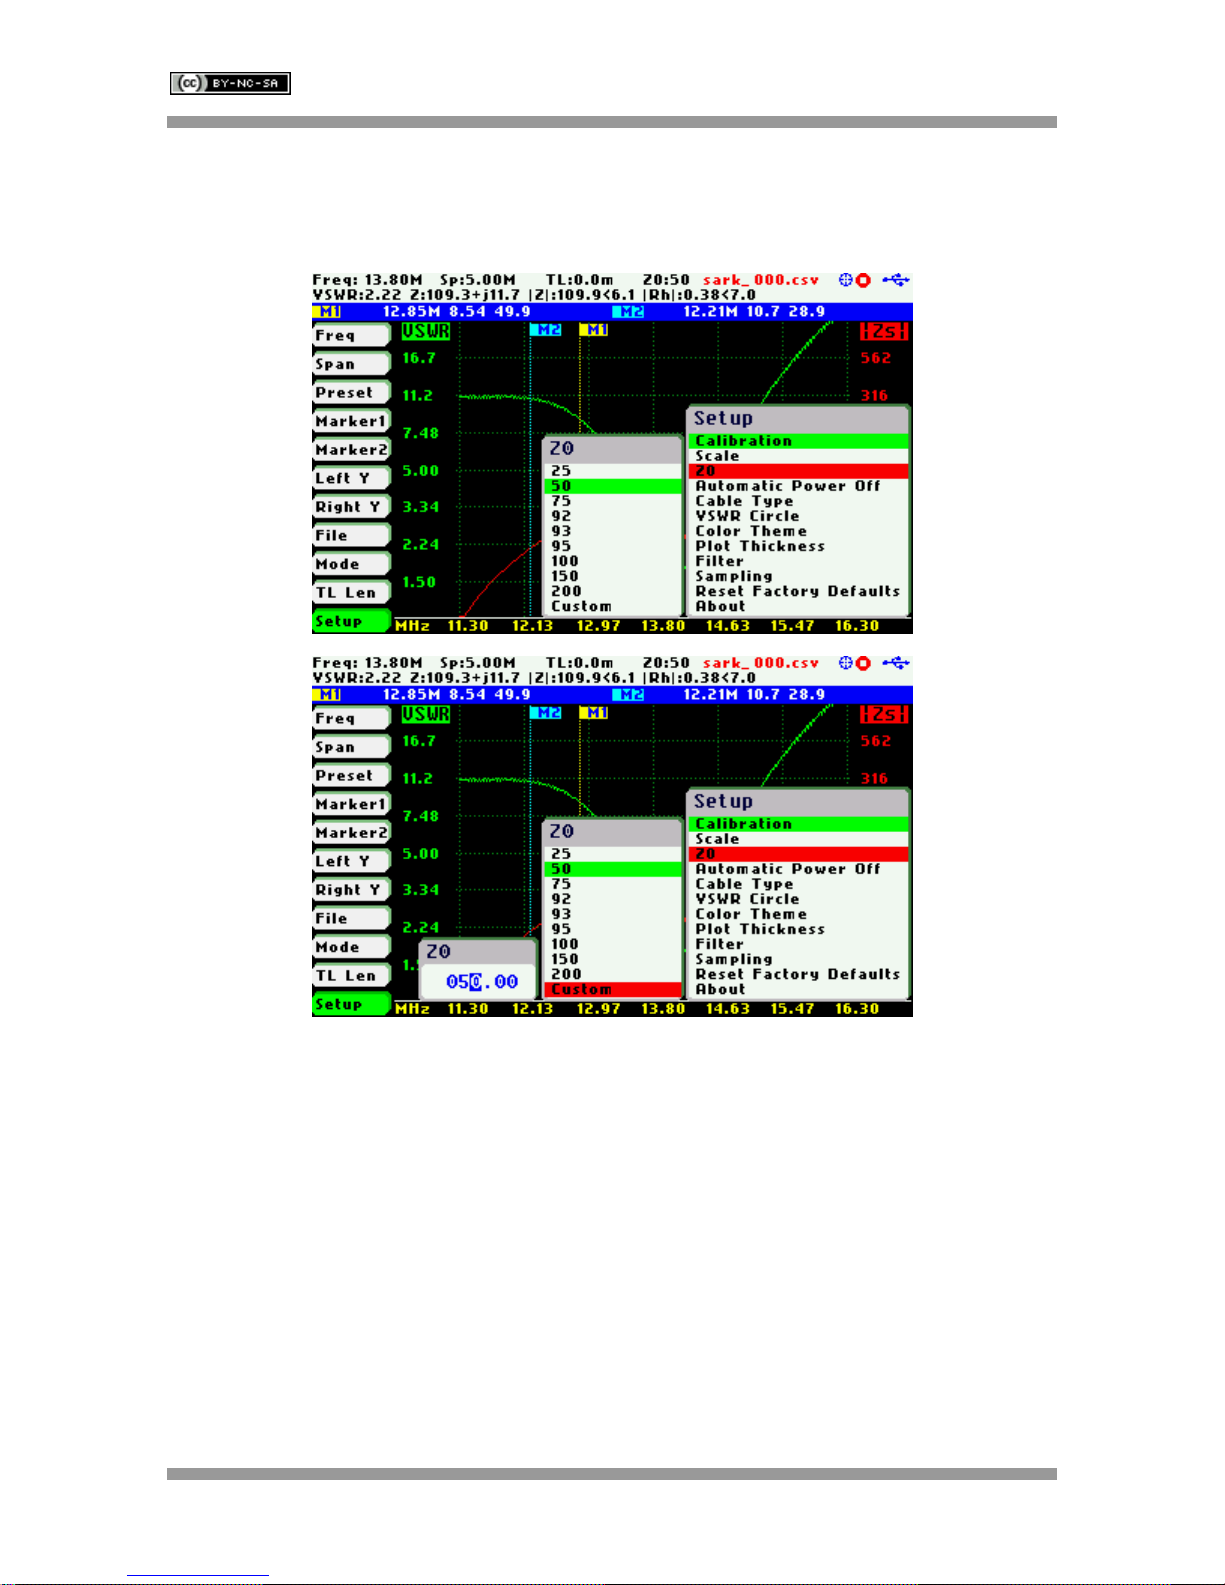
Setup - Scale
The SteppIR SARK-110 provides three pre-defined scale values: Normal, High, and Low as well as
automatic scaling. This setting defines the maximum and minimum values for each parameter on
the Y axis, see Appendix H:. This setup is valid for the Scalar Chart, Field, and Multi-band modes.
Rev 1.1.7 October 29th, 2014 - 22 - © Melchor Varela – EA4FRB 2011-2014
Page 23
SteppIR SARK-110 User’s Manual
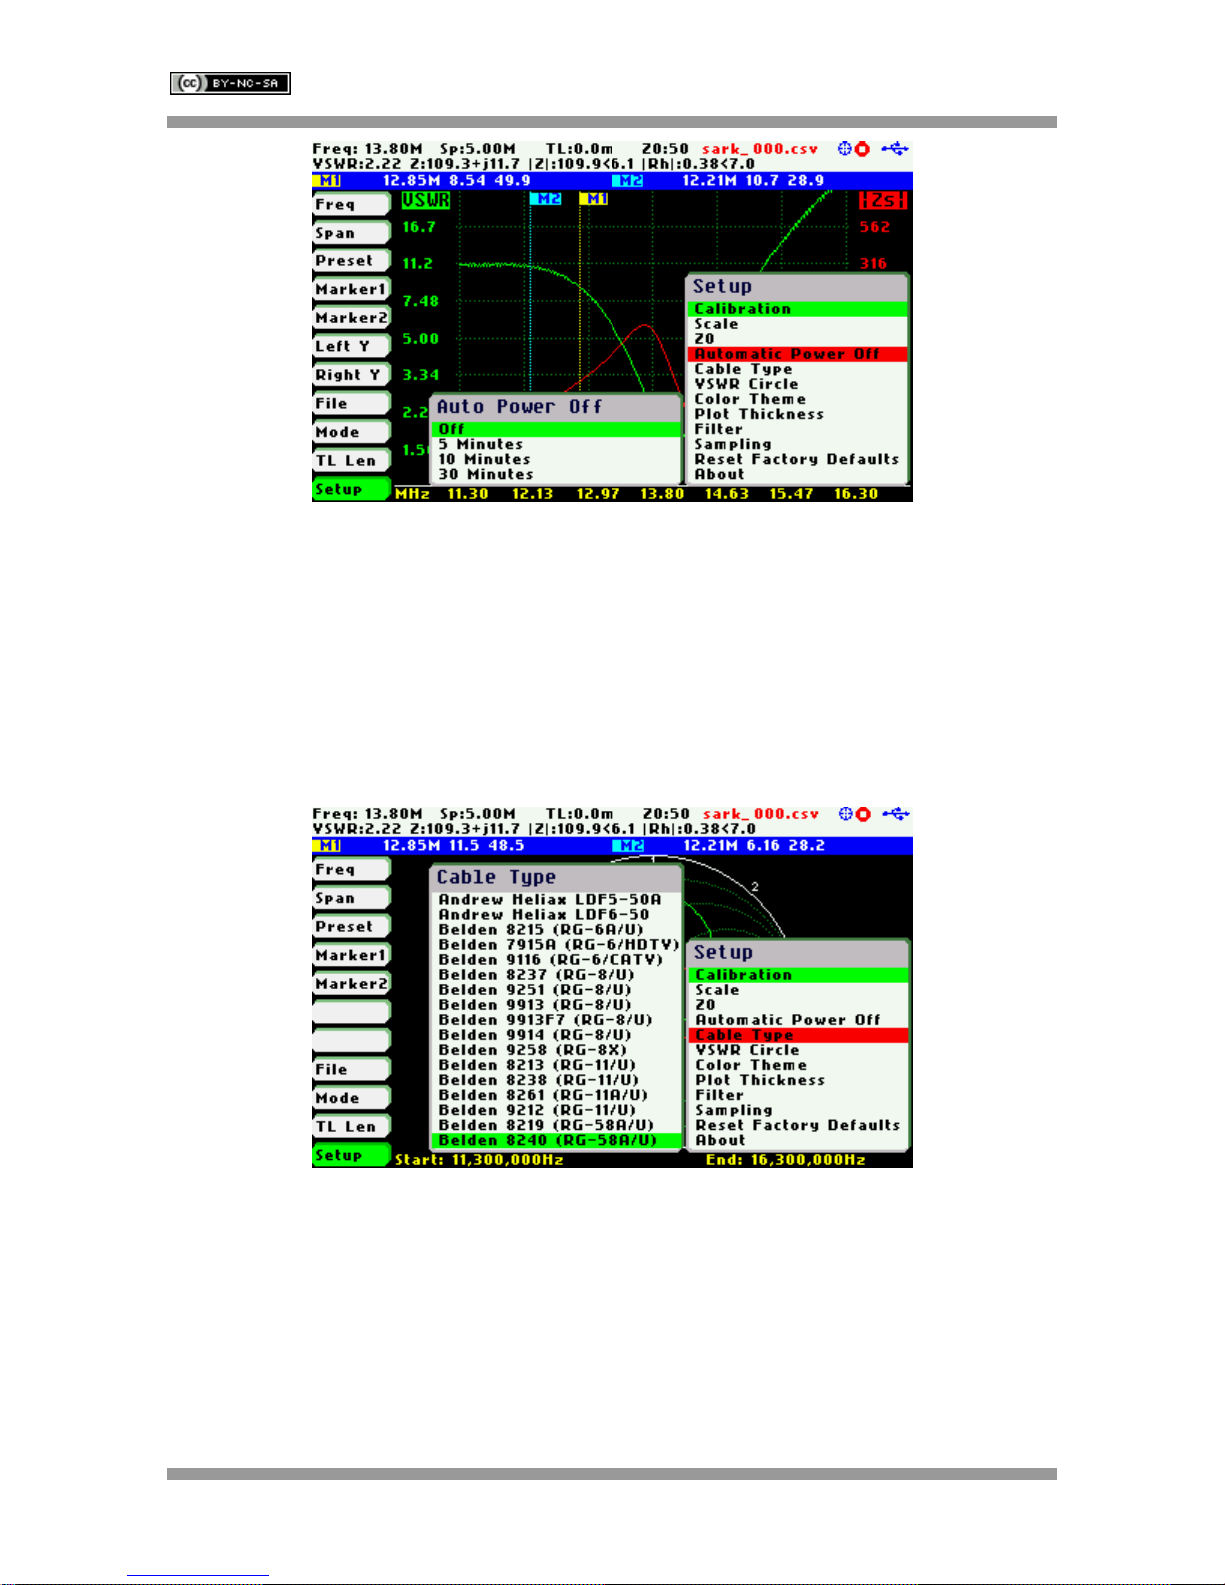
Setup - Z0
This setting allows the reference characteristic impedance to be changed. The value can be
selected from a set of predetermined values or it can be user-specified selecting the Custom option.
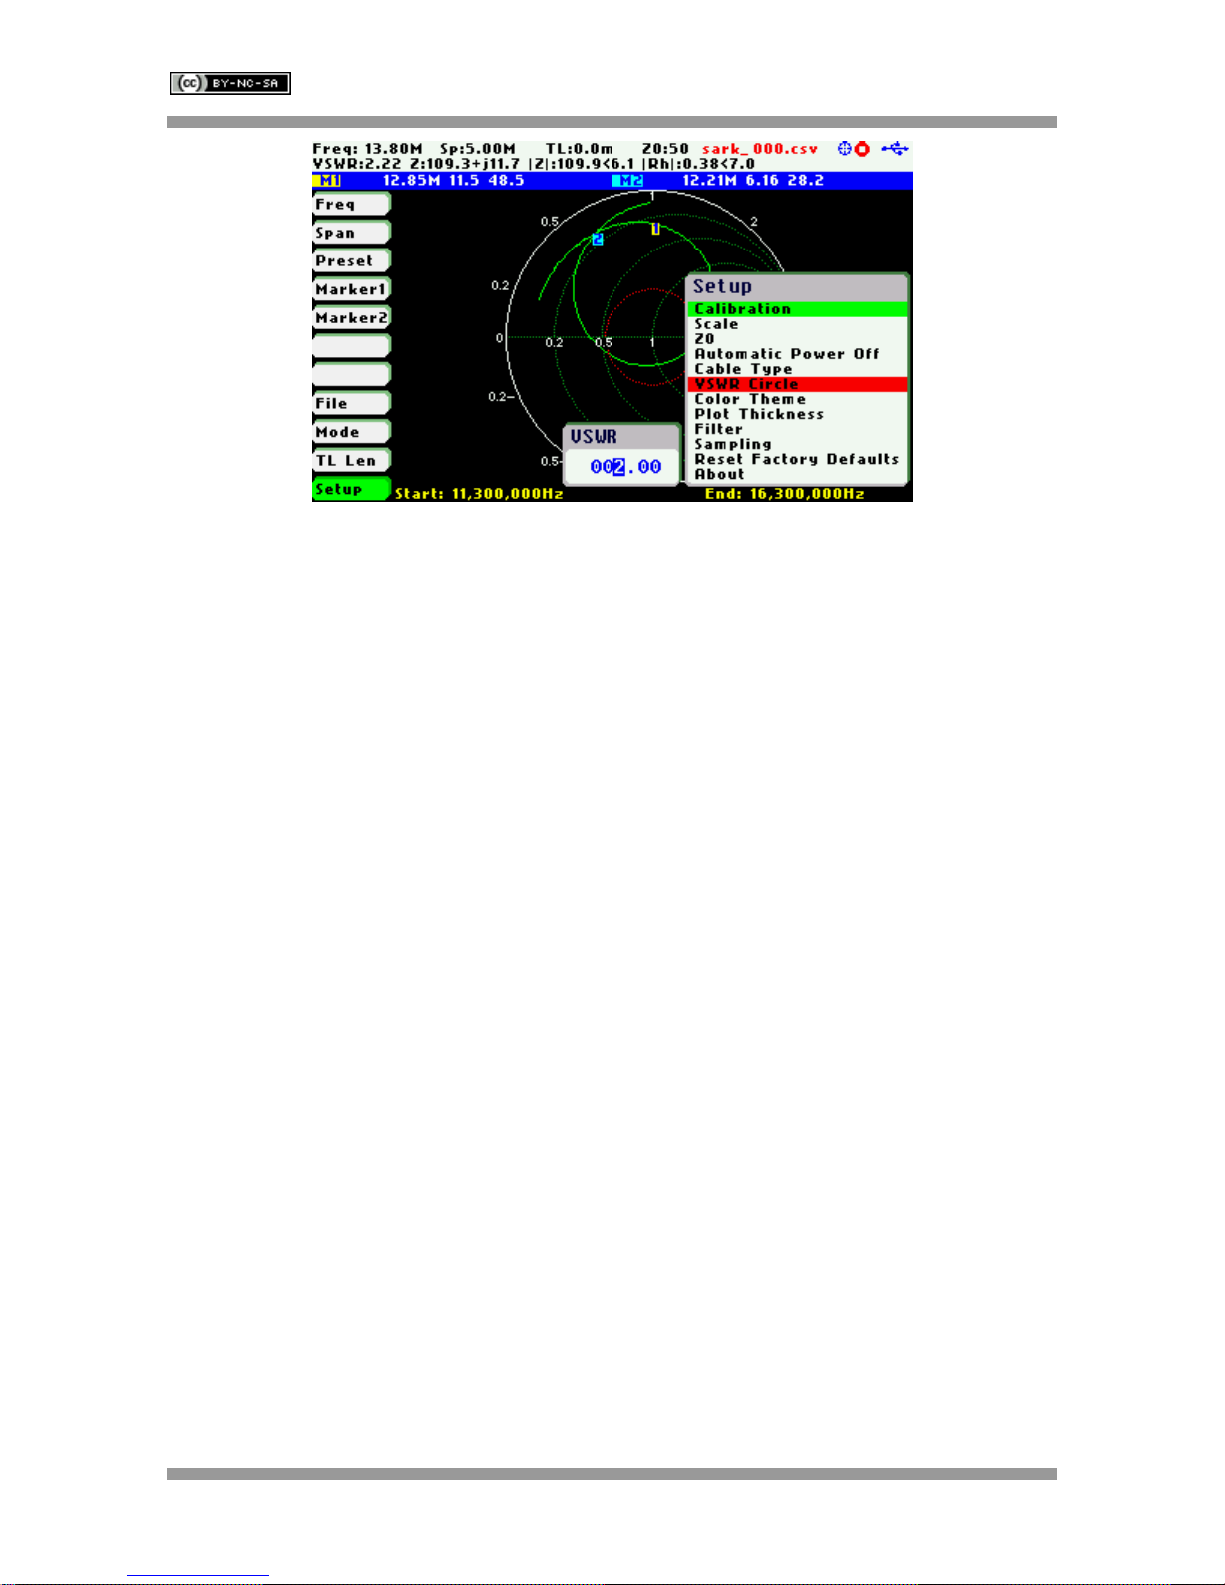
Setup - Automatic Power Off
This setting allows the automatic power off delay to be selected from a set of predefined times.
Rev 1.1.7 October 29th, 2014 - 23 - © Melchor Varela – EA4FRB 2011-2014
Page 24
SteppIR SARK-110 User’s Manual
After power-off, press the Select [■] button to resume the operation. Alternatively, power off and
power on the device using the Power Switch.
Setup - Cable Type
The length measurements in the cable test mode and transmission line operations require the
proper setting of the cable type. This setup allows selection of the cable parameters from a set of
predetermined values for most popular coaxial cables. In addition, the user can specify three custom
cable settings; see Appendix I:
Setup – VSWR Circle
This setup allows changing the value of the constant impedance circle in the Smith Chart. The circle
diameter is defined by the VSWR value.
Rev 1.1.7 October 29th, 2014 - 24 - © Melchor Varela – EA4FRB 2011-2014
Page 25
SteppIR SARK-110 User’s Manual
Rev 1.1.7 October 29th, 2014 - 25 - © Melchor Varela – EA4FRB 2011-2014
Page 26
SteppIR SARK-110 User’s Manual
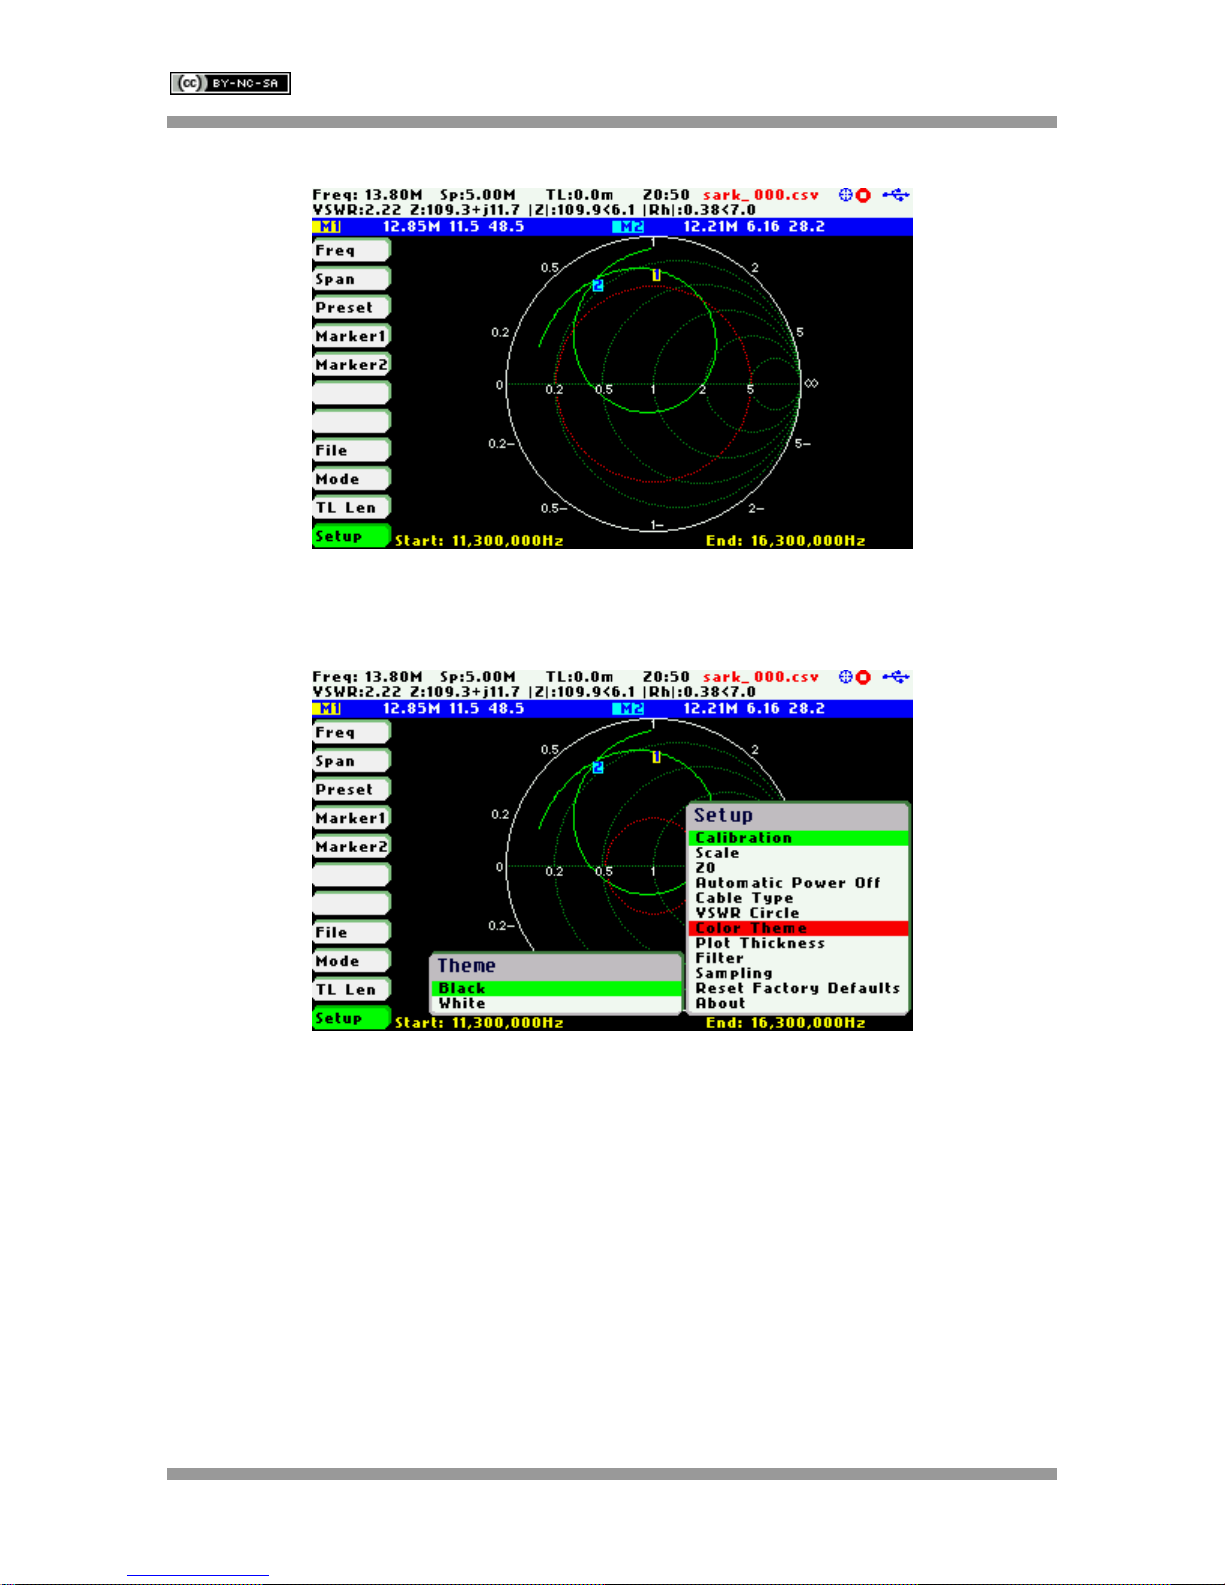
In the screenshot below the circle has been changed to a VSWR of 5.0
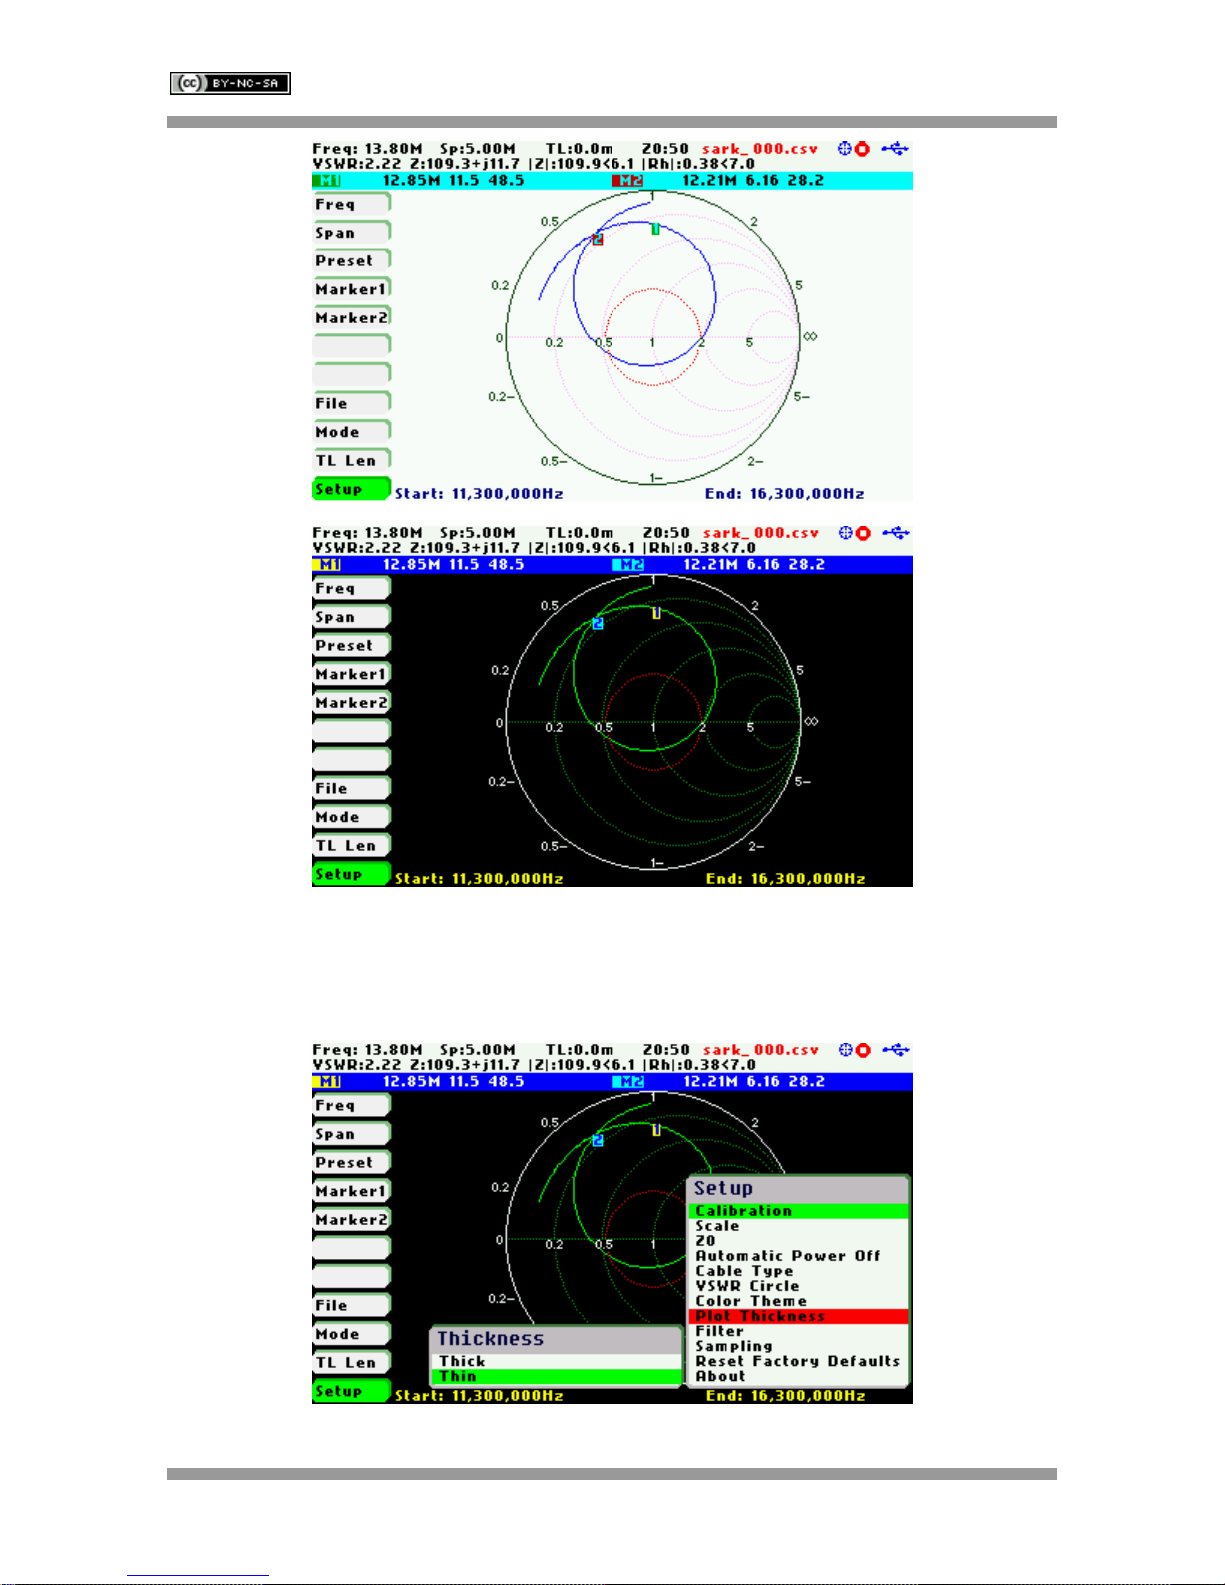
Setup – Color Theme
This setup permits the choice from two color theme options: «Black» or «White».
The screenshots below shows graphs with color theme set to «White» and «Black»:
Rev 1.1.7 October 29th, 2014 - 26 - © Melchor Varela – EA4FRB 2011-2014
Page 27
SteppIR SARK-110 User’s Manual
Setup – Plot Thickness
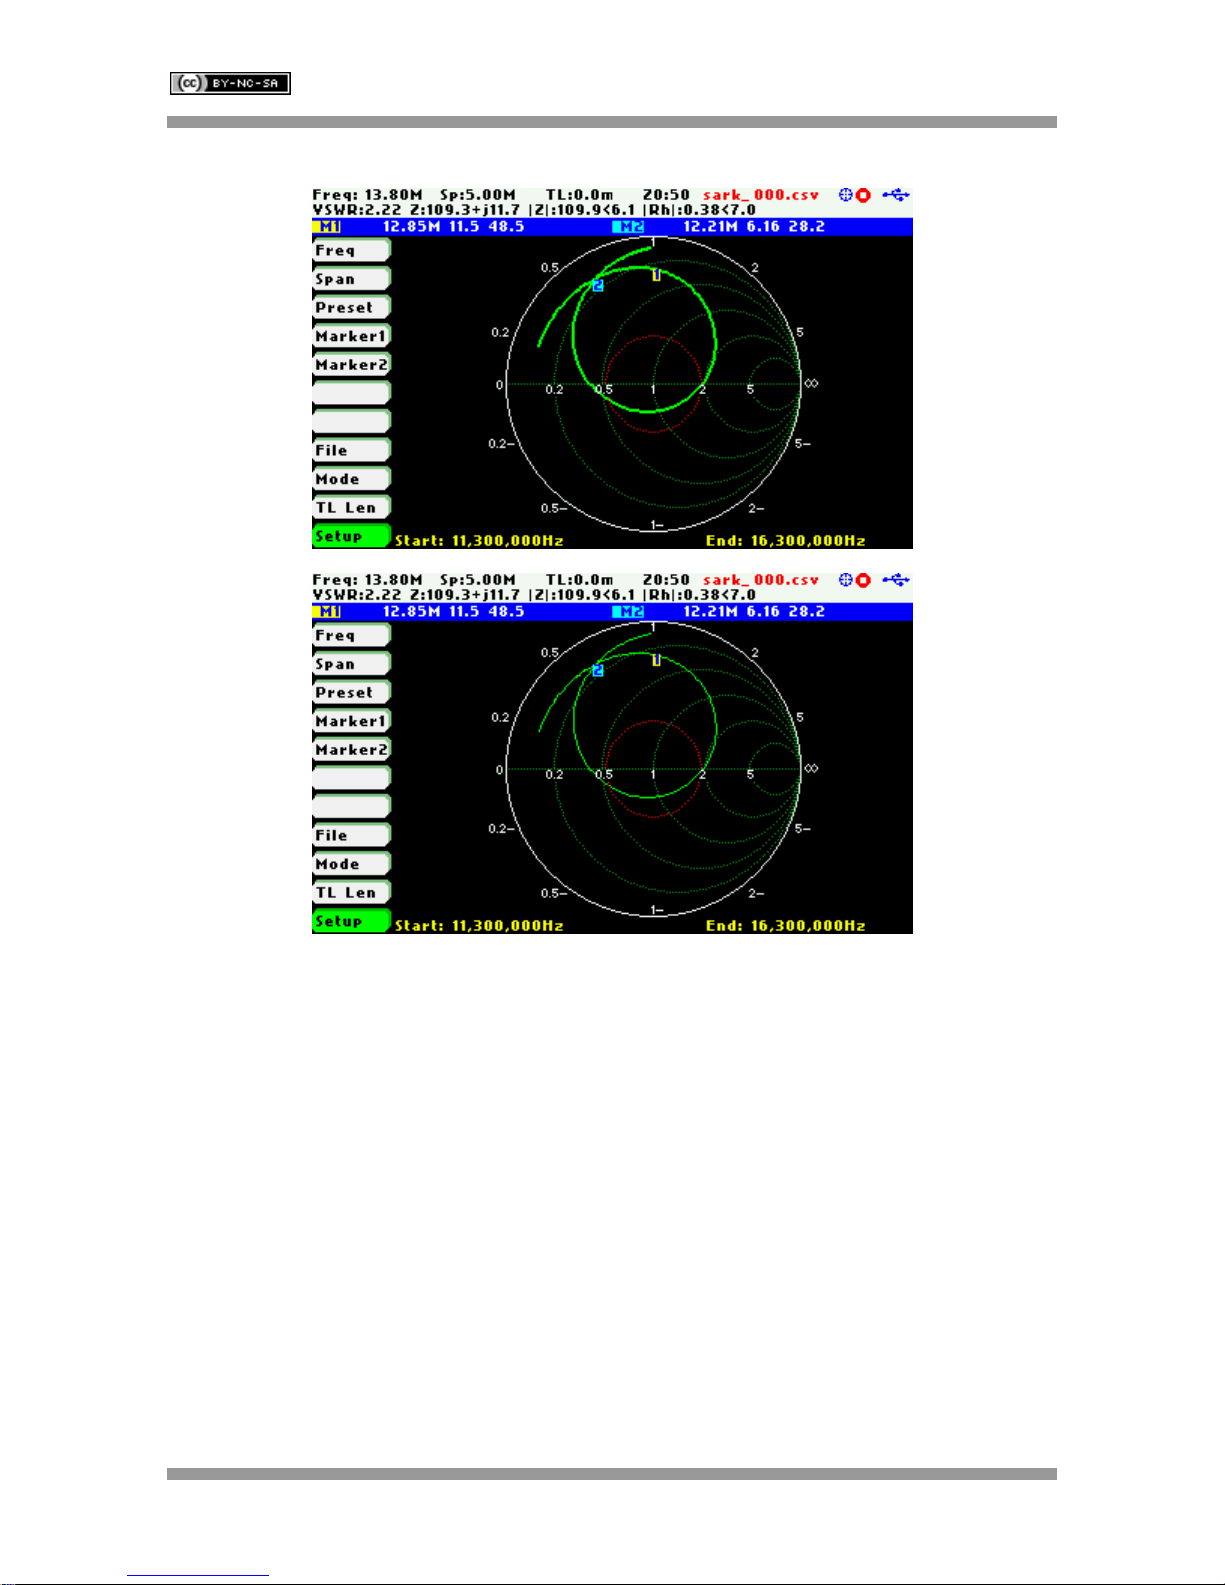
This setup allows choice of thickness of the diagram’s traces from two options: «Thick» and «Thin».
This option is unavailable in the Field Mode graph, where traces are always set to thick.
Rev 1.1.7 October 29th, 2014 - 27 - © Melchor Varela – EA4FRB 2011-2014
Page 28
SteppIR SARK-110 User’s Manual
The screenshots below shows graphs with plot thickness set to «Thick» and «Thin»:
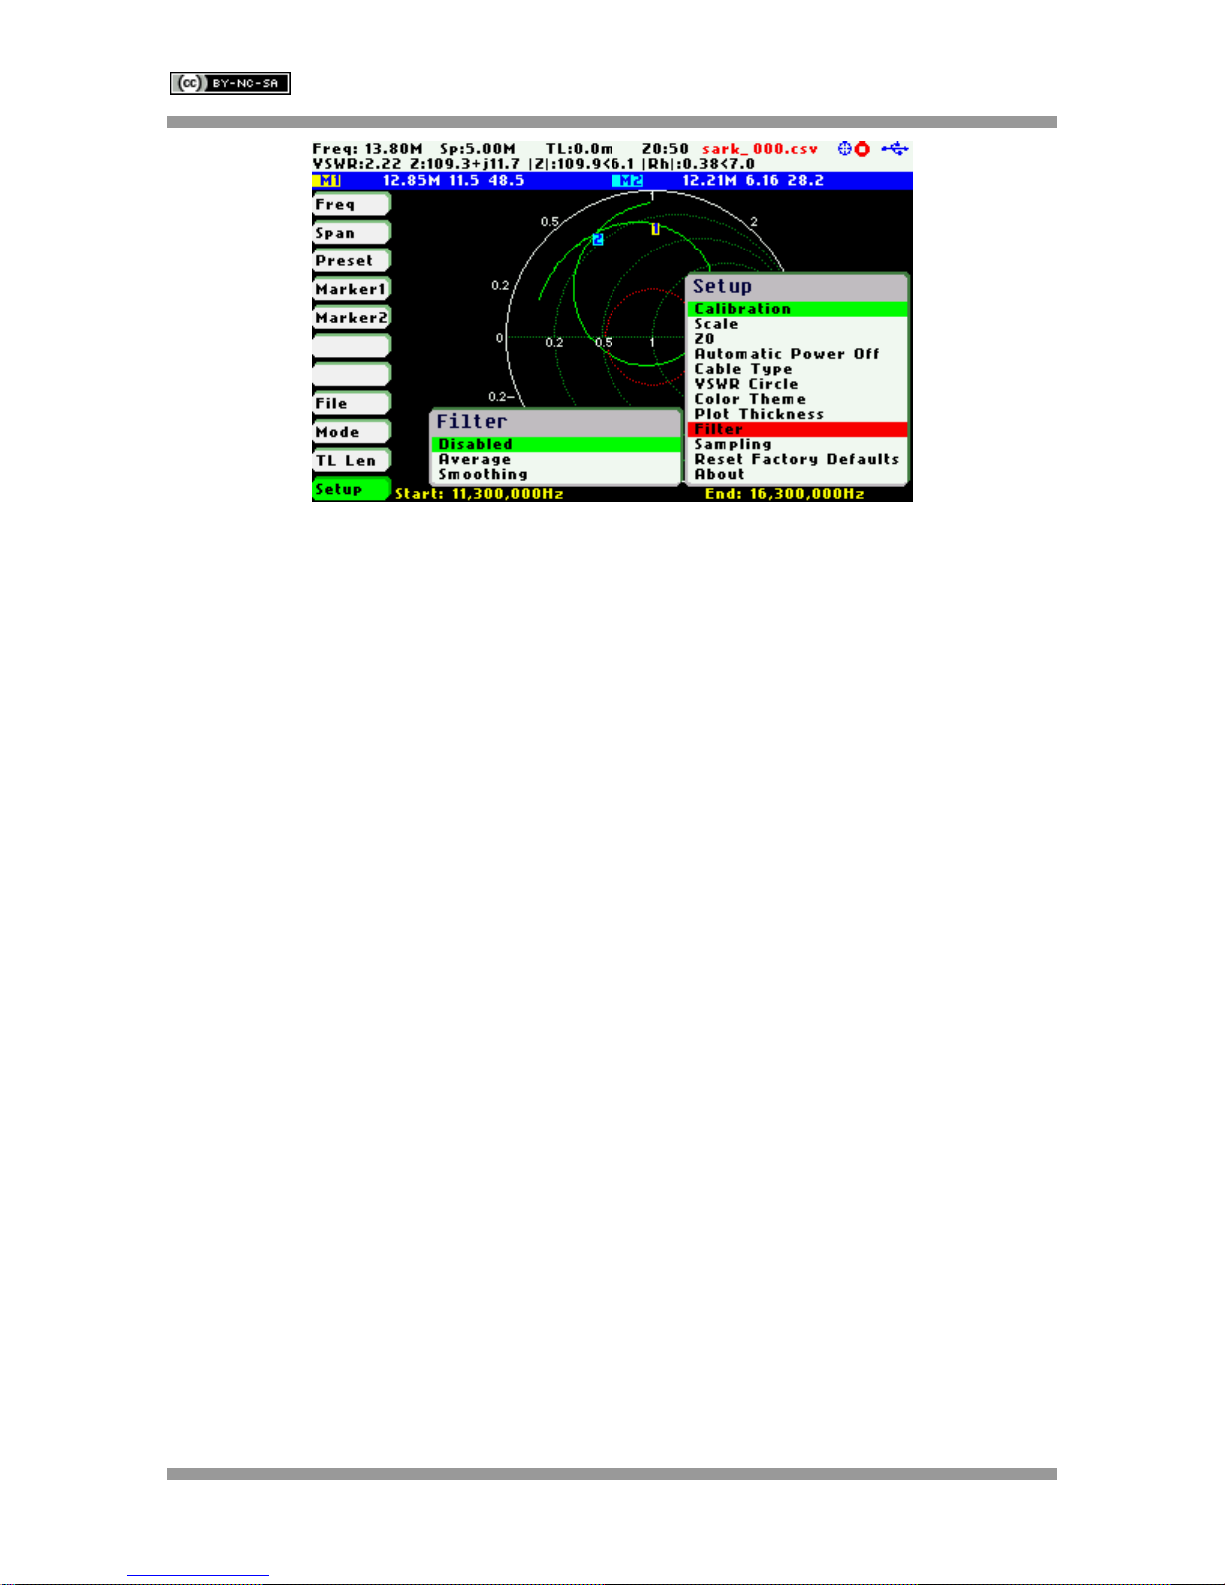
Setup – Filter
This setup offers the choice of one of two noise reduction filters or none for the Scalar Chart, Smith
Chart, Field, and Multi-band modes.
Rev 1.1.7 October 29th, 2014 - 28 - © Melchor Varela – EA4FRB 2011-2014
Page 29
SteppIR SARK-110 User’s Manual
The «Average» filter minimizes the noise but at the expense of reducing the measurement speed.
Four samples are taken for each measurement frequency and an average from these samples is
calculated.
The «Smoothing» filter is a moving average calculation for each measurement point the unweighted
mean of the previous measurement points. The measurement speed is not affected but there could
be a loss of accuracy.
Ø The magnitude of the peak or valley of a rapidly changing parameter may be affected.
Check the results with and without the filter if there is any doubt.
Rev 1.1.7 October 29th, 2014 - 29 - © Melchor Varela – EA4FRB 2011-2014
Page 30
SteppIR SARK-110 User’s Manual
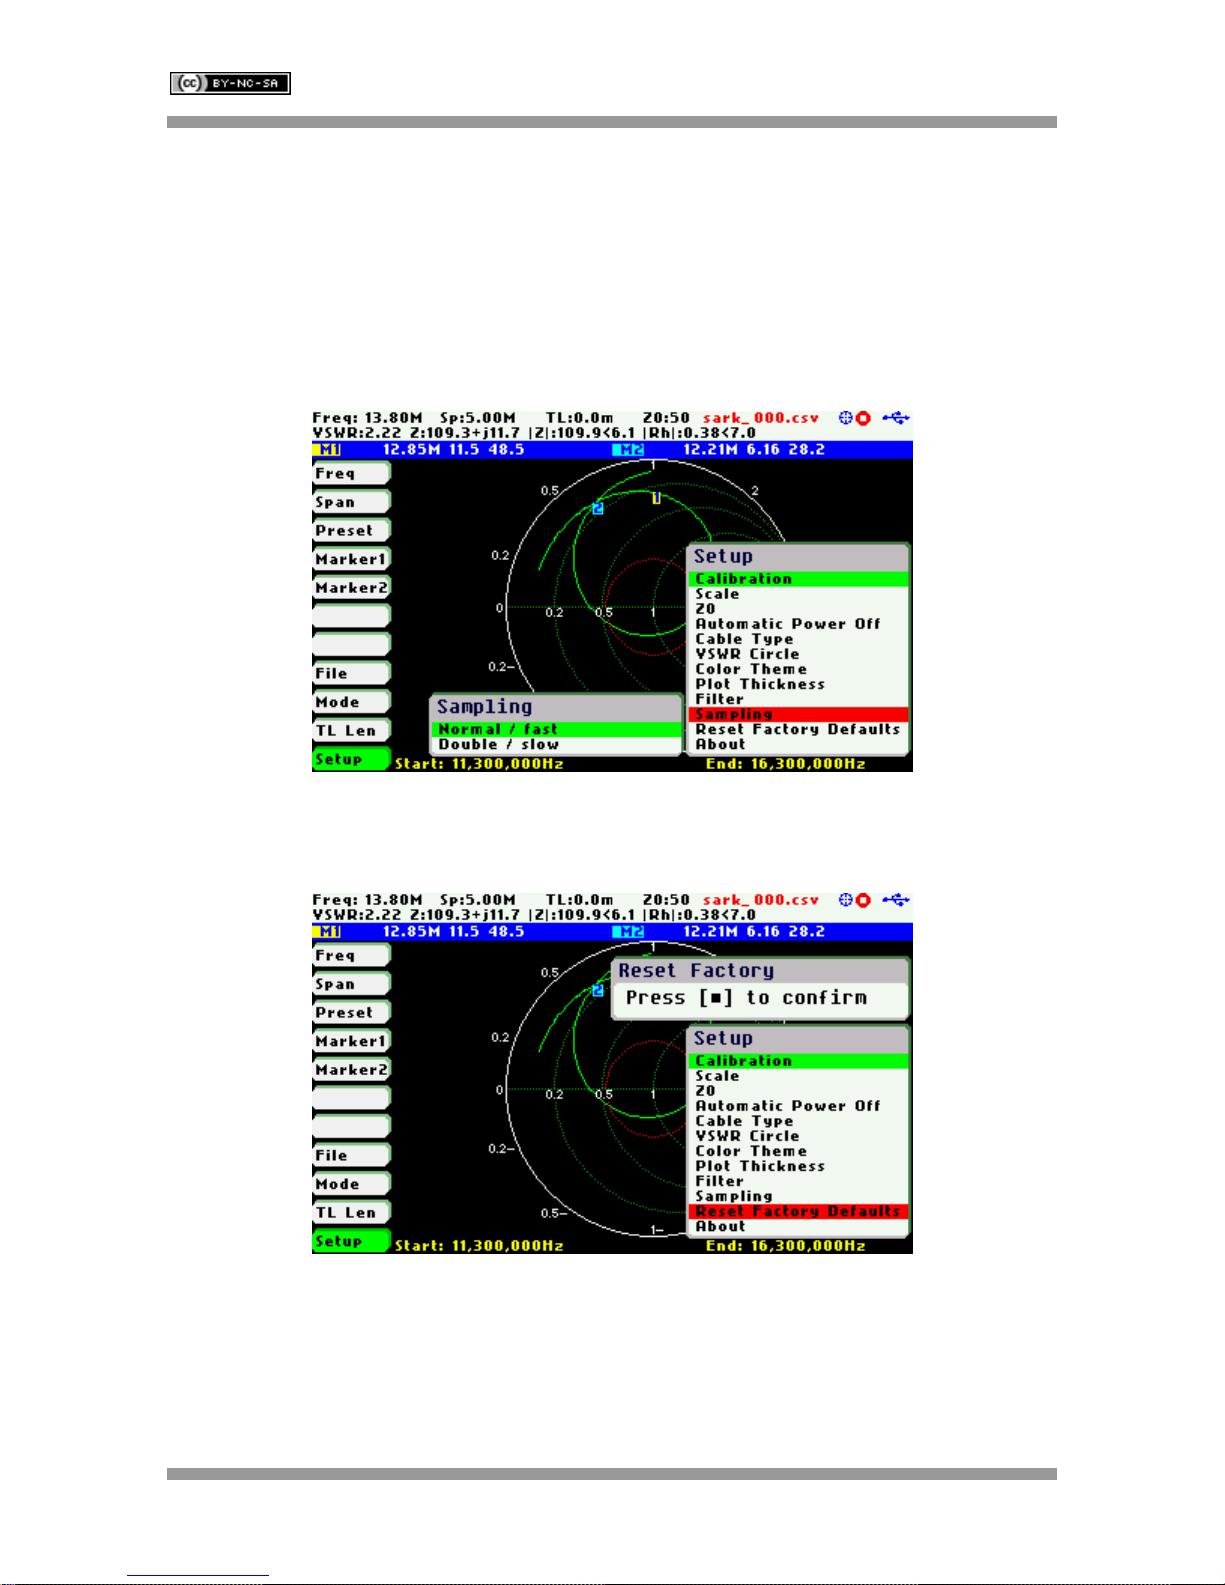
Setup – Sampling
This setup allows choice of the number of measurement samples from two options: «Normal / fast»
or «Double / slow». The «Normal / fast» option is the default setting and the more convenient for
most cases. The «Double / slow» option is intended for enhanced accuracy measurements,
because it reduces measurement ripple by doubling the number of samples taken, but at the
expense of a slower sweep speed. This enhancement in the measurements is more noticeable
when using automatic scales for measurement over a small range of values.
Setup – Reset to Factory Defaults
The Reset Factory Defaults option permits resetting the analyzer to its default settings.
Rev 1.1.7 October 29th, 2014 - 30 - © Melchor Varela – EA4FRB 2011-2014
Page 31
SteppIR SARK-110 User’s Manual
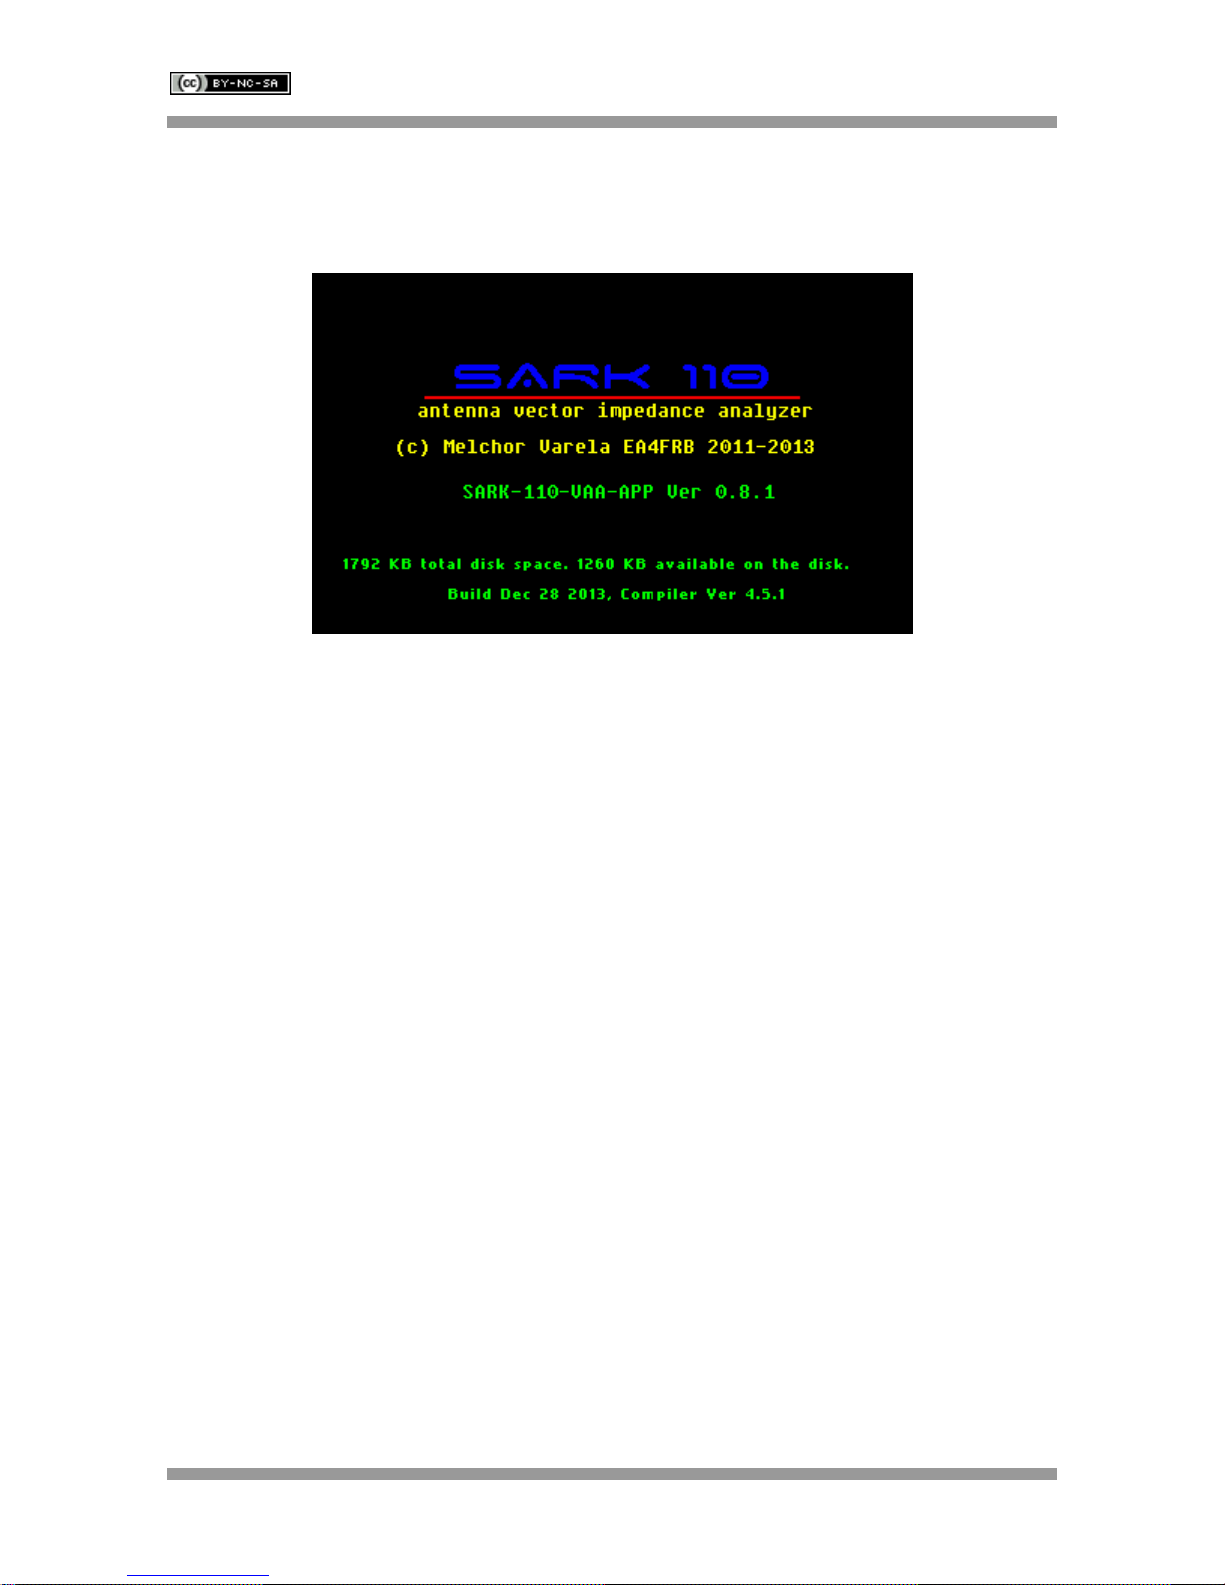
Setup – About
The about screen displays copyright information, firmware release number, disk size and free
space.
Rev 1.1.7 October 29th, 2014 - 31 - © Melchor Varela – EA4FRB 2011-2014
Page 32

SteppIR SARK-110 User’s Manual
1
Diagram
10
Frequency and span settings
2
Traces
11
Transmission Line length setting
3
Markers
12
Reference impedance setting
4
Vertical axis labeling
13
Loaded data file name
5
Frequency axis labeling
14
Disk write operation in progress
6
Main menu
15
Calibration status
7
Highlighted menu option
16
Run/Hold status
8
Markers information
17
USB/Battery status
9
Detailed measurements
5 Scalar Chart Mode
The Scalar Chart mode provides functionality for impedance measurements of antennas,
transmission lines, and RF circuits. The analyzer performs reflection measurements within a user-
specified frequency range, defined by the frequency and the span. The two user-selectable
fundamental parameters are displayed as a Cartesian diagram. Up to two markers can be selected
Rev 1.1.7 October 29th, 2014 - 32 - © Melchor Varela – EA4FRB 2011-2014
Page 33

SteppIR SARK-110 User’s Manual
to provide precise information in the plotted areas. Their positions can either be user-selected or
automatically tracked. They are also useful for indicating characteristic points in the plot.
Use Navigator A to highlight «Mode» in the main menu. Press the Select [■] button to activate the
Mode popup submenu and use Navigator B to highlight «Scalar Chart» submenu mode option.
Finally press the Select [■] button to enter into Scalar Chart mode.
The analyzer performs the measurements and updates the plot continuously, unless it is stopped by
pressing the Run/Hold [►||] button. The results of the measurements are kept in internal memory
and plotted on the display to permit user analysis. The measurements can be resumed at any time
by pressing the Run/Hold [►||] button again. Measurement data can be stored at any time on the
internal disk and restored later for review through different options in the «File» menu.
Rev 1.1.7 October 29th, 2014 - 33 - © Melchor Varela – EA4FRB 2011-2014
Page 34

SteppIR SARK-110 User’s Manual
1
Diagram
10
Frequency and span settings
2
Trace
11
Transmission Line length setting
3
Markers
12
Reference impedance setting
4
Constant impedance circle
13
Loaded data file name
5
Frequency start and end
14
Disk write operation in progress
6
Main menu
15
Calibration status
7
Highlighted menu option
16
Run/Hold status
8
Markers information
17
USB/Battery status
9
Detailed measurements
6 Smith Chart Mode
The Smith Chart mode is equivalent to the Scalar Chart mode but in this case the complex reflection
measurements for the user-specified frequency range are displayed in a Smith Chart diagram.
Rev 1.1.7 October 29th, 2014 - 34 - © Melchor Varela – EA4FRB 2011-2014
Page 35

SteppIR SARK-110 User’s Manual
Use Navigator A to highlight «Mode» in the main menu. Press the Select [■] button to activate the
Mode popup submenu and use Navigator B to highlight «Smith Chart» submenu mode option.
Finally press the Select [■] button to enter into Smith Chart mode.
As in the Scalar Chart mode, the measurements are performed continuously unless paused by
pressing the Run/Hold [►||] button.
The impedance measurement data and marker positions are preserved when changing to the
Scalar Chart mode and vice versa. For example, markers can be set at the zero reactance points of
the plot (where the plot crosses the X axis) in the Smith Chart mode and see them in Cartesian
format in the Scalar Chart mode.
Rev 1.1.7 October 29th, 2014 - 35 - © Melchor Varela – EA4FRB 2011-2014
Page 36

SteppIR SARK-110 User’s Manual
1
VSWR bar
10
Detailed measurements
2
Series impedance complex form
11
Detailed measurements extended
3
Circuit equivalent series
12
Frequency setting
4
Series resistance and equivalent
inductance (or capacitance) values
13
Transmission Line length setting
5
Parallel impedance complex form
14
Reference impedance setting
6
Parallel circuit equivalent
15
Calibration status
7
Parallel resistance and equivalent
inductance (or capacitance) values
16
Run/Hold status
8
Highlighted menu option
17
USB/Battery status
9
Main menu
7 Single Frequency Mode
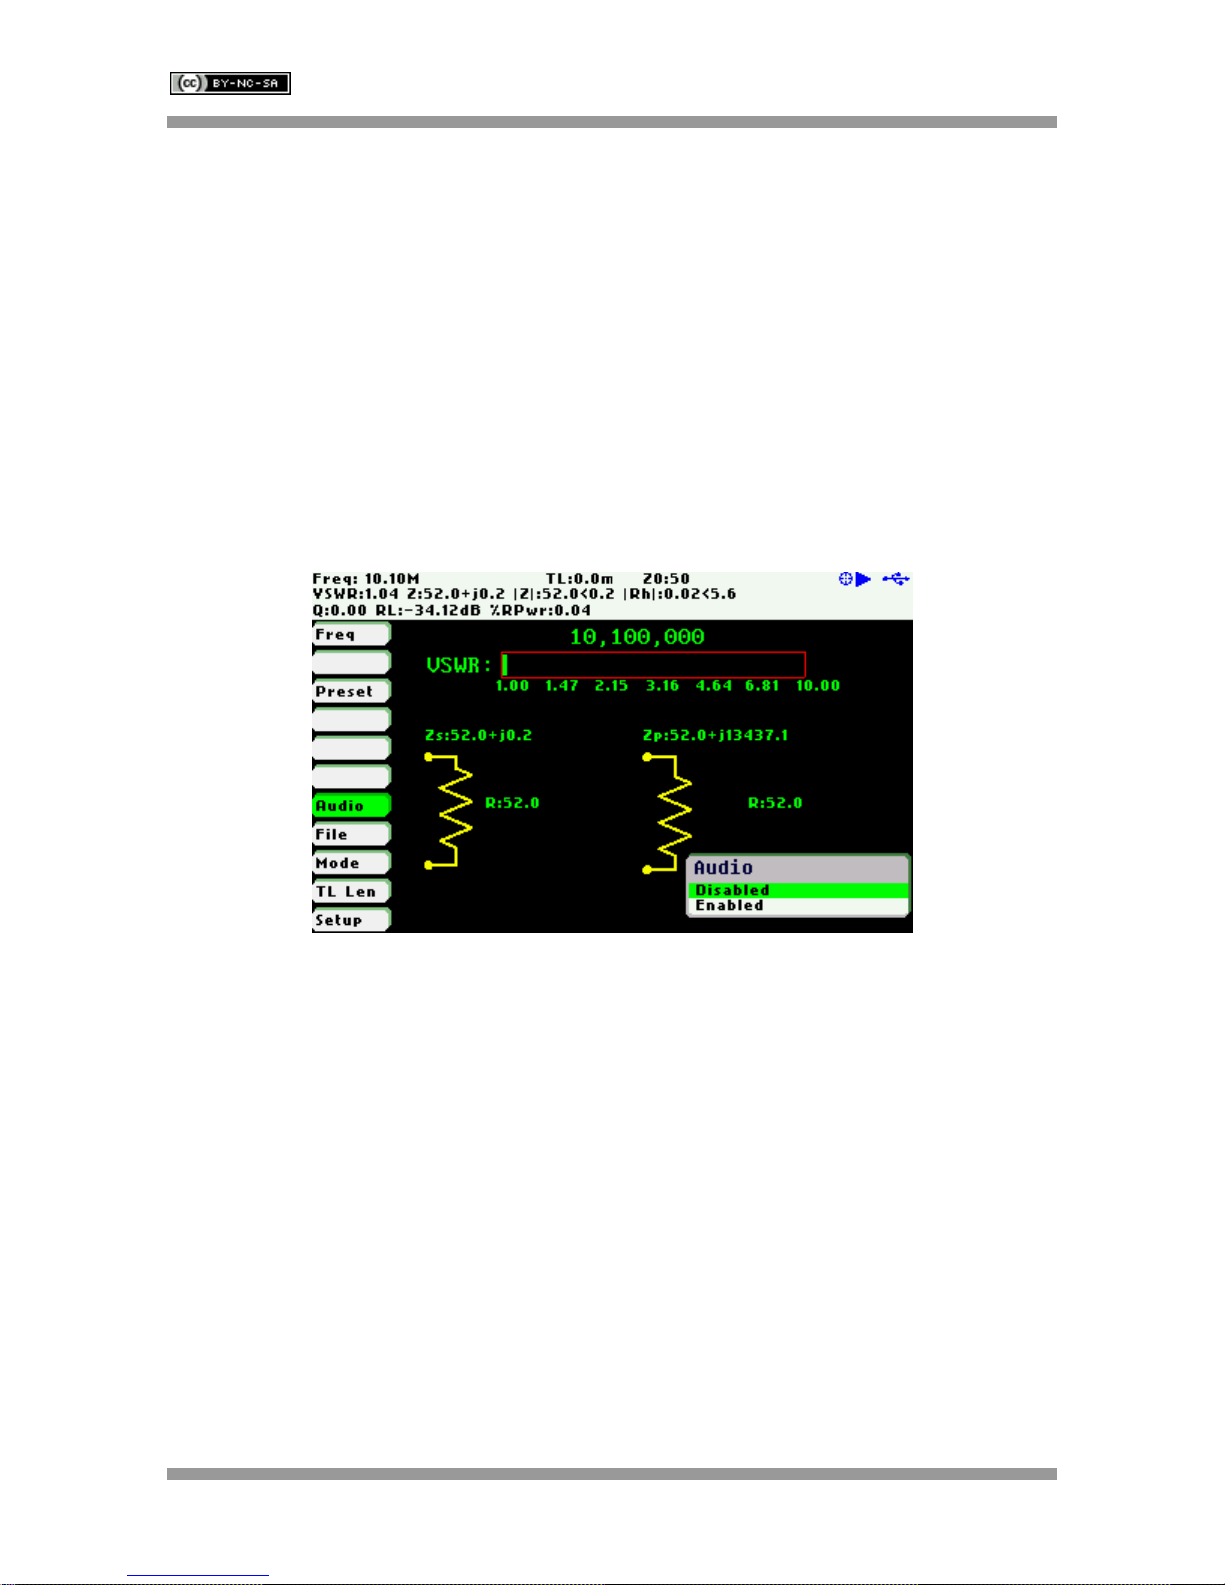
The Single Frequency mode provides impedance measurements at a single frequency. All the
measured fundamental parameters at the selected frequency are shown in the display. In addition, a
Rev 1.1.7 October 29th, 2014 - 36 - © Melchor Varela – EA4FRB 2011-2014
Page 37
SteppIR SARK-110 User’s Manual
VSWR graph is available for a quick visualization of this parameter. As well as the two element
equivalent circuit models, both series and parallel circuits are displayed as schematics.
Use Navigator A to highlight «Mode» in the main menu. Press the Select [■] button to activate the
Mode popup submenu and use Navigator B to highlight «Single Frequency» submenu mode option.
Finally press the Select [■] button to enter into Single Frequency mode.
The analyzer performs the measurements continuously, unless it is paused by pressing the
Run/Hold [►||] button. The measurements can be resumed at any time by pressing the same button
again.
This mode offers optional VSWR audio feedback. W hen activated by the menu option «Audio», the
analyzer produces beeps of different duration as an indication of VSWR. The audio is produced only
for VSWR values between 1.0 and 10.0 and the beep duration is shorter for lower values.
Rev 1.1.7 October 29th, 2014 - 37 - © Melchor Varela – EA4FRB 2011-2014
Page 38

SteppIR SARK-110 User’s Manual
1
Diagram
10
Length indication
2
Traces
11
Zoom mode
3
Markers
12
Cable Velocity Factor Setting
4
Vertical axis labeling
13
Reference impedance setting
5
Distance axis labeling
14
Loaded data file name
6
Main menu
15
Disk write operation in progress
7
Highlighted menu option
16
Calibration status
8
Markers information
17
Run/Hold status
9
Detailed measurements
18
USB/Battery status
8 Cable Test Mode (TDR)
Cable Test or Time Domain Reflectometer (TDR) mode is intended to identify potential coaxial cable
faults that could disrupt signal transmission. Unlike native TDR test equipment, the method of
measurement in the SteppIR SARK-110 is based on the theory of Frequency Domain Reflectometry
(FDR).
Rev 1.1.7 October 29th, 2014 - 38 - © Melchor Varela – EA4FRB 2011-2014
Page 39

SteppIR SARK-110 User’s Manual
The analyzer makes swept reflection measurements over the entire frequency range and
mathematically transforms the gathered data to Time Domain using an inverse Fourier transform.
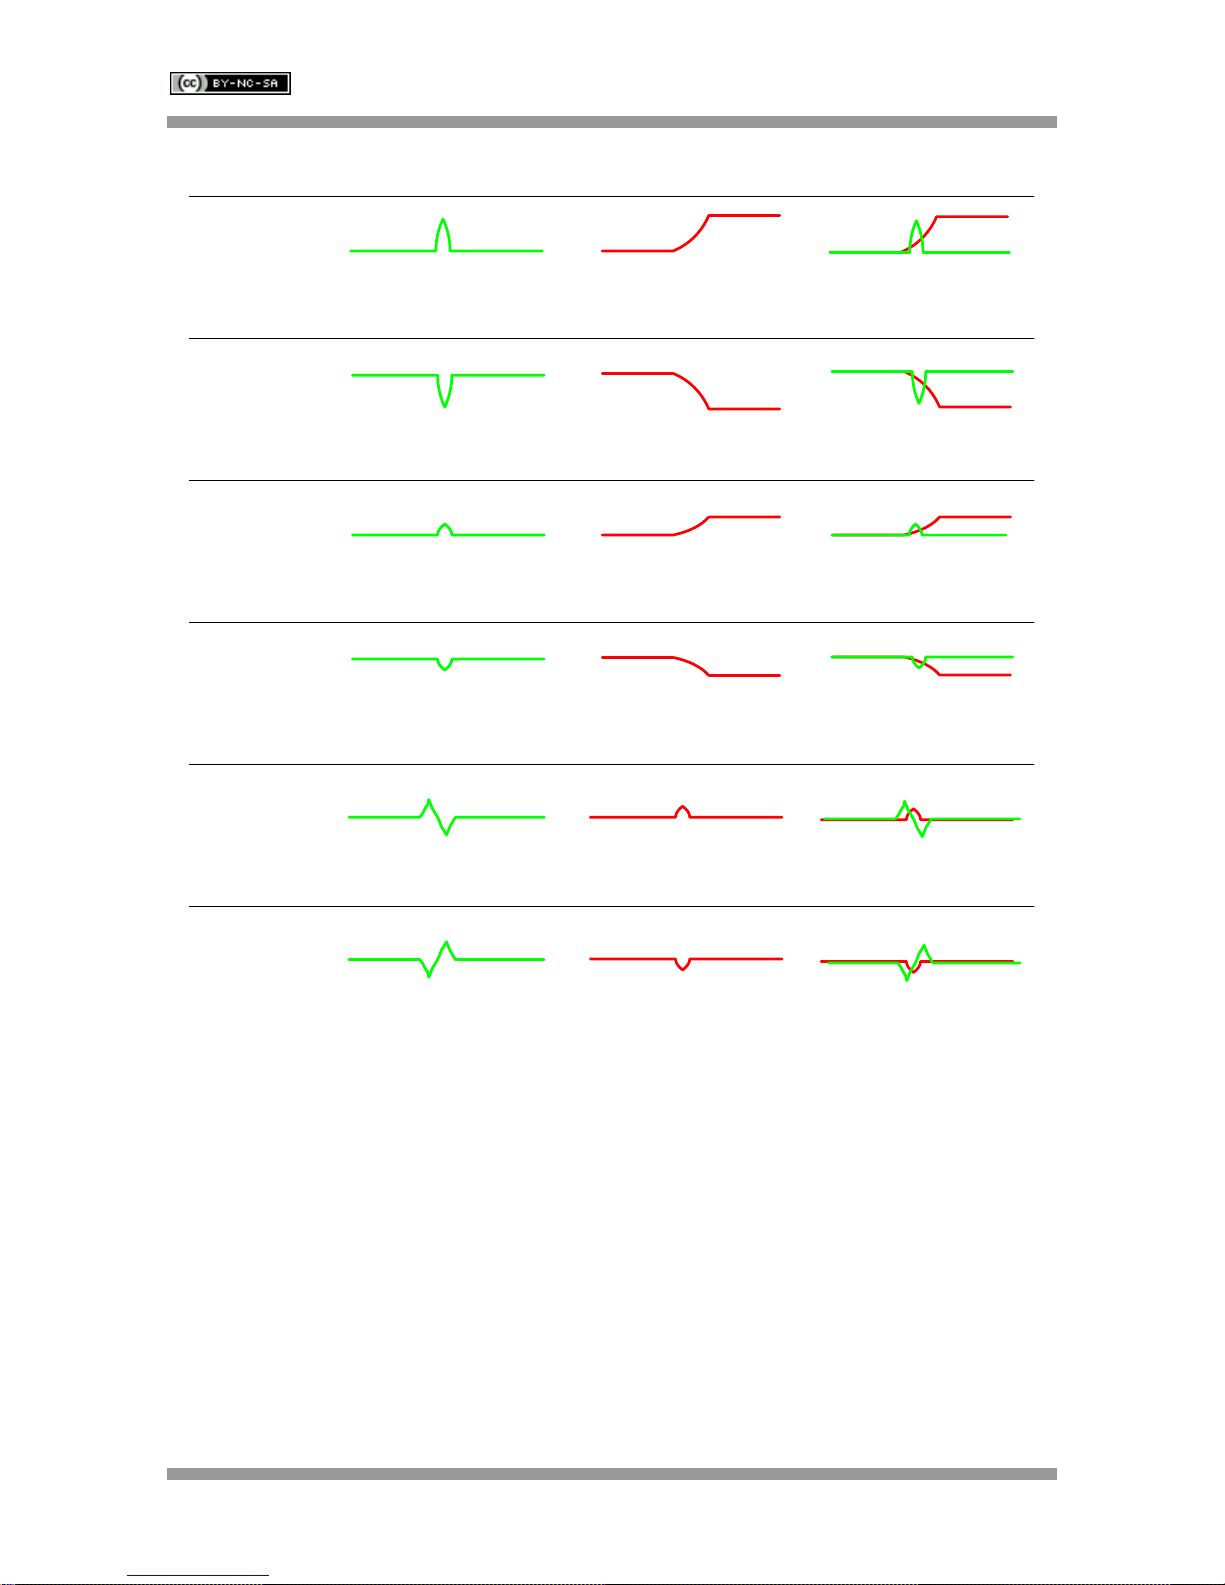
As a result, the step and impulse responses are plotted on the display, providing information about
the location and the nature of any fault. The impulse response trace (green trace) gives an indication
of the fault location. The step response trace (red trace) provides an indication of the nature of the
fault.
The vertical axis of the graph displays the reflection coefficient: Rho = -1 for short load, 0 for
matched impedance load (ZLoad = Z0), or Rho = +1 for open load. The horizontal axis displays the
distance in meters.
Use Navigator A to highlight «Mode» in the main menu. Press the Select [■] button to activate the
Mode popup submenu and use Navigator B to highlight «Cable Test» submenu mode option. Finally
press the Select [■] button to enter into Cable Test mode.
This measurement requires the user selection of the cable’s characteristic impedance and velocity
factor. These settings are obtained from the selected cable in the «Setup»«Cable Type» menu
option.
As in the other modes, the measurements are performed continuously and controlled by the
Run/Hold [►||] button, but in this case it takes some seconds for the results to show on the display
due to the time it takes to make a full frequency sweep.
The distance from the start of the cable to any discontinuity may be found by moving one of the
markers over the discontinuity of interest. The distance of the fault from the start of the cable would
then be shown in that marker’s distance figure.
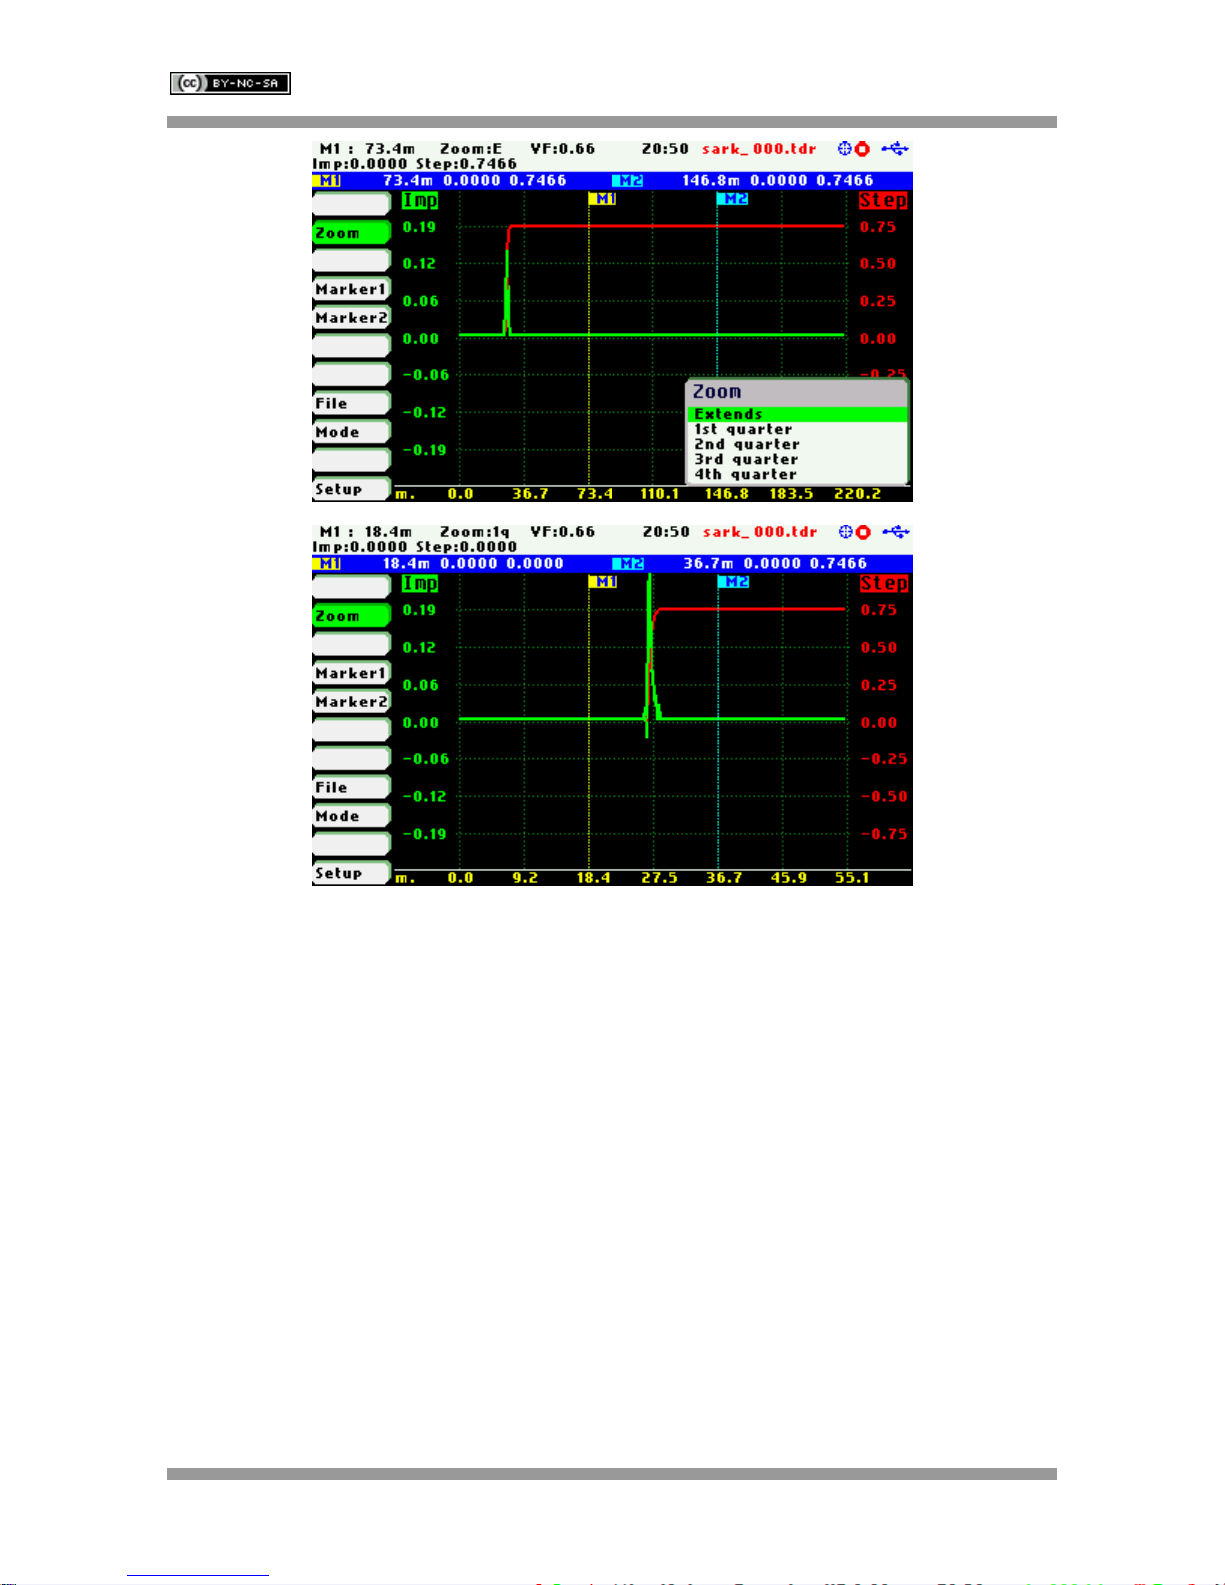
There is a basic zoom feature controllable from the «Zoom» menu option. This allows zooming one
of the four quarters of the graph or the complete span via the option «Extends». See in the
screenshots below the operation of the zoom function in which the measurement of a coaxial cable
line of 27.5 meters and Velocity Factor of 0.66 in open condition (unterminated at the other end) is
shown below:
Rev 1.1.7 October 29th, 2014 - 39 - © Melchor Varela – EA4FRB 2011-2014
Page 40
SteppIR SARK-110 User’s Manual
Figures below illustrate the responses of known discontinuities:
Rev 1.1.7 October 29th, 2014 - 40 - © Melchor Varela – EA4FRB 2011-2014
Page 41
SteppIR SARK-110 User’s Manual
Element
Step ResponseImpulse Response
Unity reflection Unity reflection
Open
Unity reflection, -180º Unity reflection, -180º
Short
Positive peak Positive level shift
Resistance
R > Z
0
Negative peak Negative level shift
Resistance
R < Z
0
Positive then negative peaks Positive peak
Inductance
Negative then positive peaks Negative peak
Capacitance
Display
Rev 1.1.7 October 29th, 2014 - 41 - © Melchor Varela – EA4FRB 2011-2014
Page 42

SteppIR SARK-110 User’s Manual
1
Diagram
9
Transmission Line length setting
2
Trace
10
Reference impedance setting
3
Vertical axis labeling
11
Loaded data file name
4
Frequency axis labeling
12
Disk write operation in progress
5
Maximum and minimum values
13
Calibration status
6
Highlighted menu option
14
Run/Hold status
7
Main menu
15
USB/Battery status
8
Frequency and span settings
9 Field Mode
Field Mode is equivalent to the Scalar Chart mode but with a more visible presentation aimed at
operation in the field especially if combined with the «White» color theme. Frequency and magnitude
of maximum and minimum points in the trace are shown at the top of the graph. This will be helpful
for instance, in the identification of the frequency and magnitude of the minimum VSWR point.
Rev 1.1.7 October 29th, 2014 - 42 - © Melchor Varela – EA4FRB 2011-2014
Page 43

SteppIR SARK-110 User’s Manual
Use Navigator A to highlight «Mode» in the main menu. Press the Select [■] button to activate the
Mode popup submenu and use Navigator B to highlight «Field» submenu mode option. Finally press
the Select [■] button to enter into Field mode.
Operation is similar to the scalar chart mode with some limitations such as one trace is plotted and
the markers feature is not available.
Rev 1.1.7 October 29th, 2014 - 43 - © Melchor Varela – EA4FRB 2011-2014
Page 44

SteppIR SARK-110 User’s Manual
1
Diagrams
8
Frequency and span settings (selected
band)
2
Trace
9
Transmission Line length setting
3
Selected band
10
Reference impedance setting
4
Main menu
11
Calibration status
5
Highlighted menu option
12
Run/Hold status
6
Frequency and magnitude value for
each band
13
USB/Battery status
7
Detailed measurements (at centre
frequency of selected band)
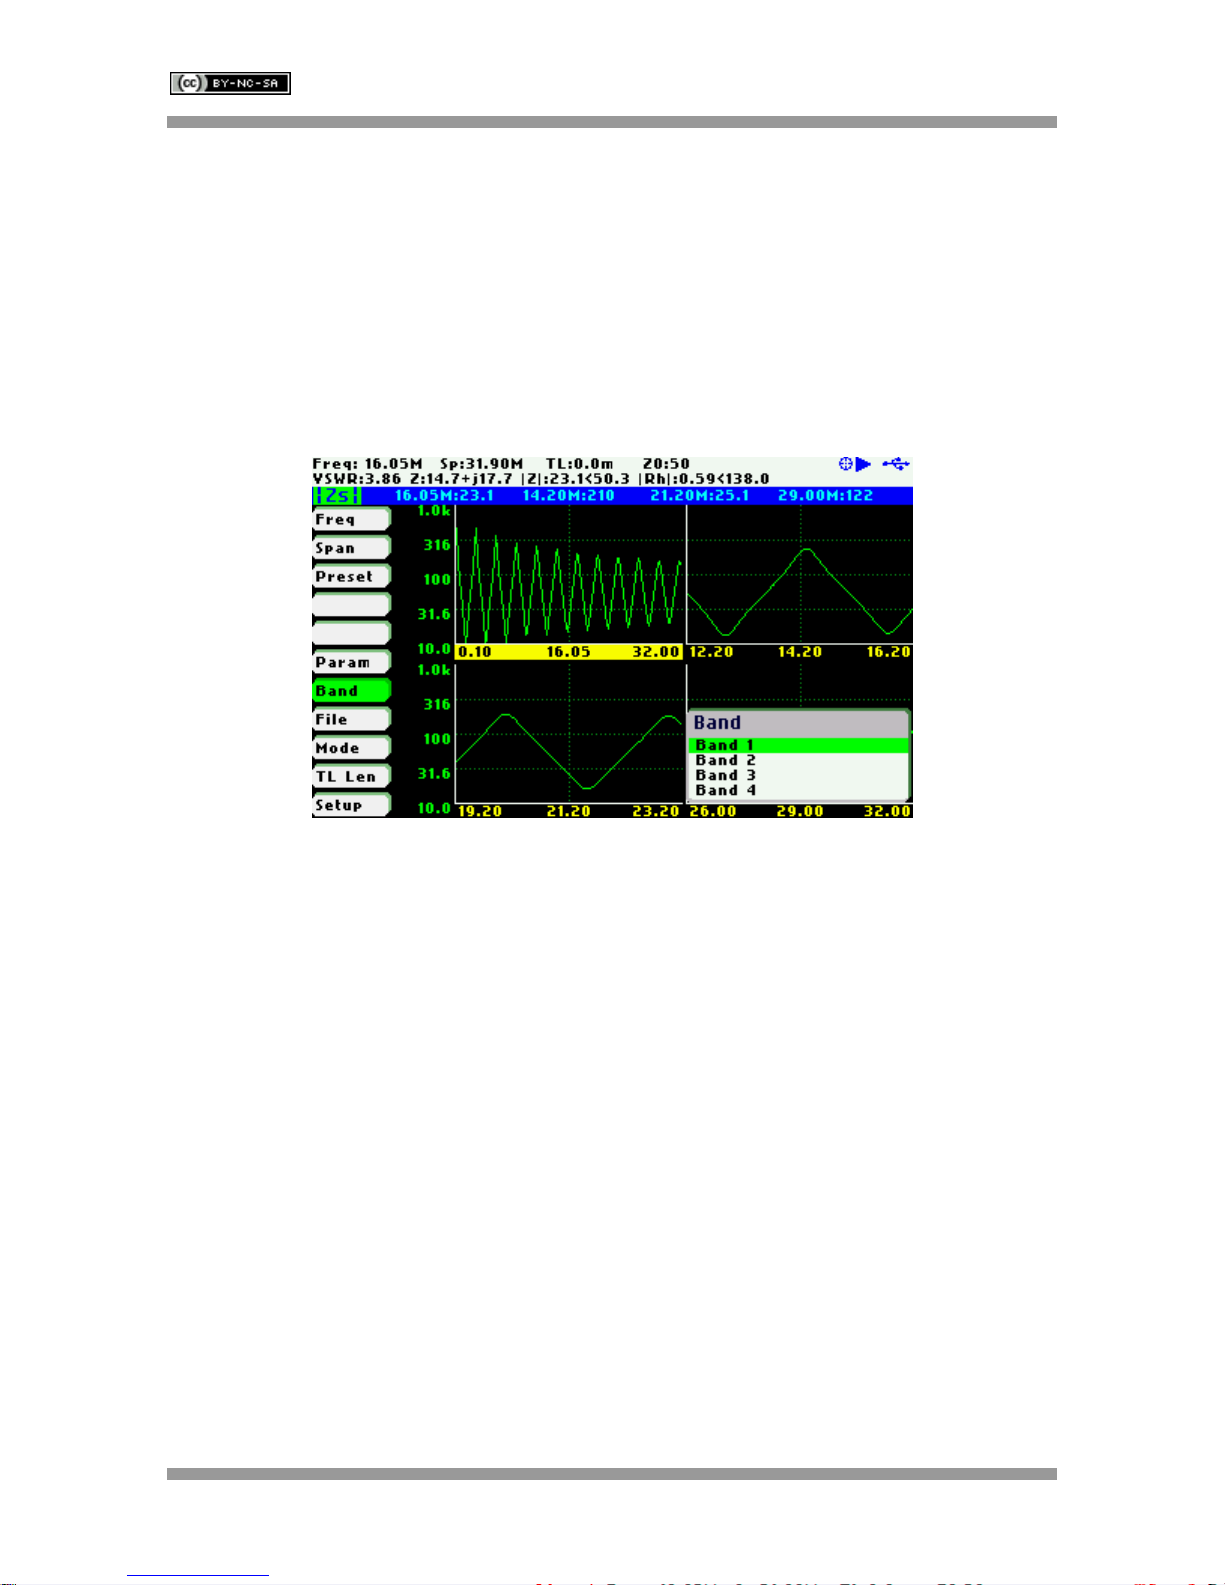
10 Multi-band Mode
The Multiband mode is a unique feature of the SteppIR SARK-110 to display the plot of an
impedance parameter in four scalar charts simultaneously. This feature is ideal for tuning multiband
antennas. Additionally, it can be used to display different views of the same band, as a kind of zoom
feature.
Rev 1.1.7 October 29th, 2014 - 44 - © Melchor Varela – EA4FRB 2011-2014
Page 45
SteppIR SARK-110 User’s Manual
Use Navigator A to highlight «Mode» in the main menu. Press the Select [■] button to activate the
Mode popup submenu and use Navigator B to highlight «Multi-band» submenu mode option. Finally
press the Select [■] button to enter into Multi-band mode.
Operation is similar to the scalar chart mode with some limitations such as unavailability of markers,
there is only a single trace and load and save data file operations are not available.
The main menu «Band» option allows selecting the active band. The selected band is highlighted in
the frequency axis of the band graph. Frequency and span settings are applied to the selected band.
The detailed measurements at the top of the screen correspond to the selected band as well.
Rev 1.1.7 October 29th, 2014 - 45 - © Melchor Varela – EA4FRB 2011-2014
Page 46
SteppIR SARK-110 User’s Manual
11 Signal Generator Mode
The SteppIR SARK-110 can be used as a programmable RF signal source in Signal Generator
Mode. It outputs a sinusoidal RF signal at a frequency programmable from 100 kHz to 230 MHz with
eight user selectable amplitude levels ranging from -73 dBm to -10 dBm. In addition, frequency
sweeps can be programmed with linear, bi-linear, logarithmic, or bi-logarithmic functions.
This signal generator mode is ideal for receiver testing and alignment, sensitivity tests, RF signal
tracing and troubleshooting.
Use Navigator A to highlight «Mode» in the main menu. Press the Select [■] button to activate the
Mode popup submenu and use Navigator B to highlight «Signal Generator» submenu mode option.
Finally press the Select [■] button to enter into Signal Generator mode.
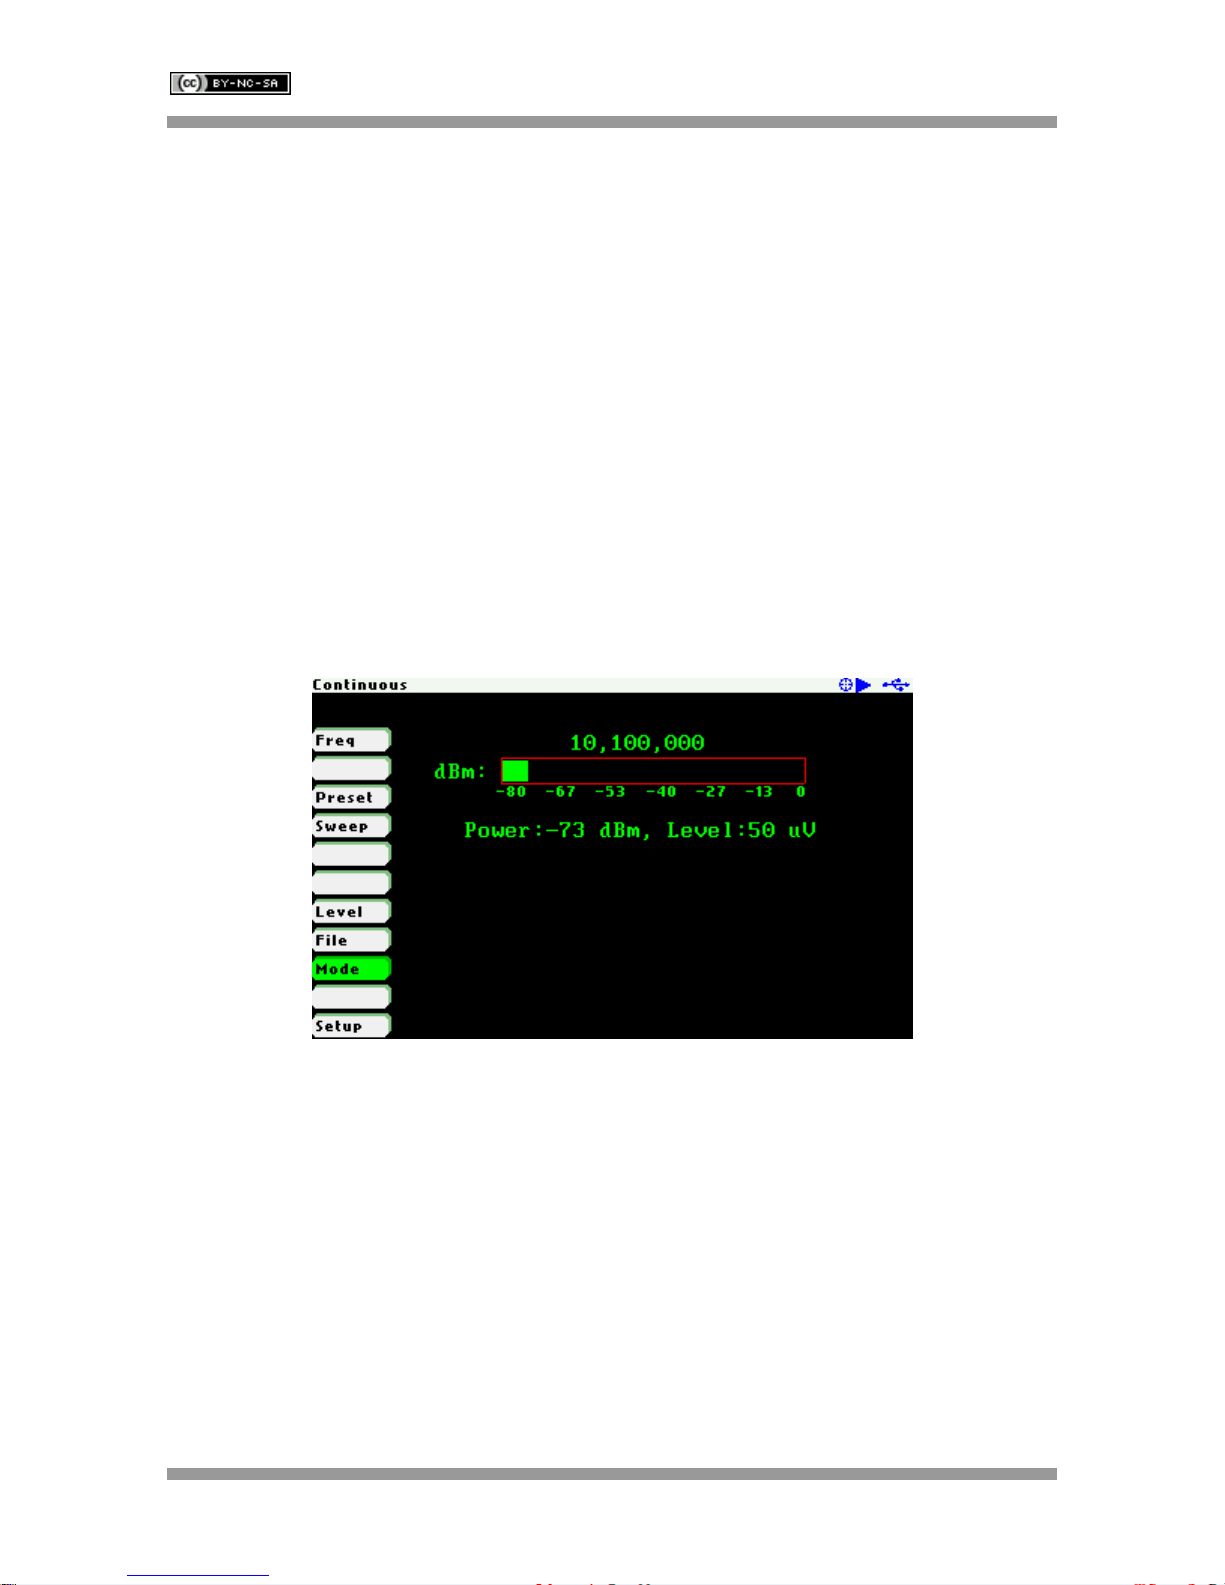
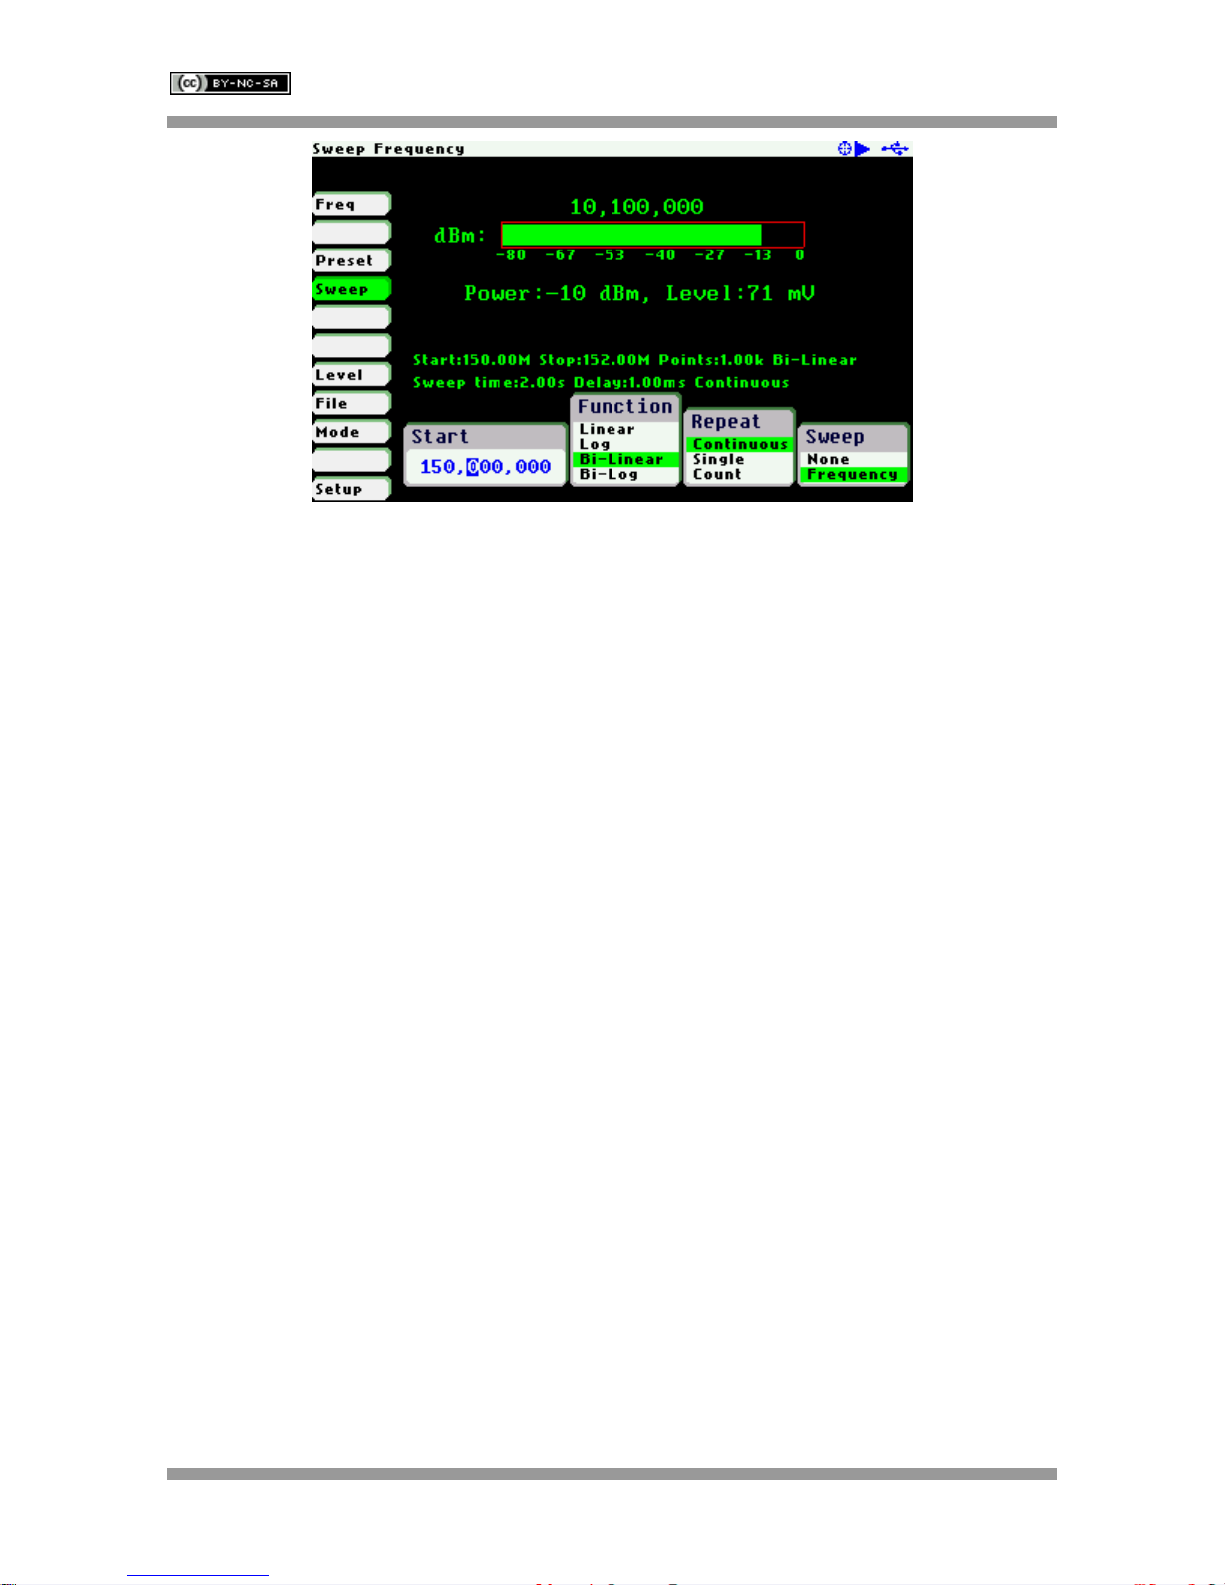
The screenshot below shows the signal generator screen in continuous frequency operation mode.
The screen includes the programmed frequency in Hertz and the output power level expressed both
in dBm and volts.
Frequency can be changed as usual; see chapter 4.4.
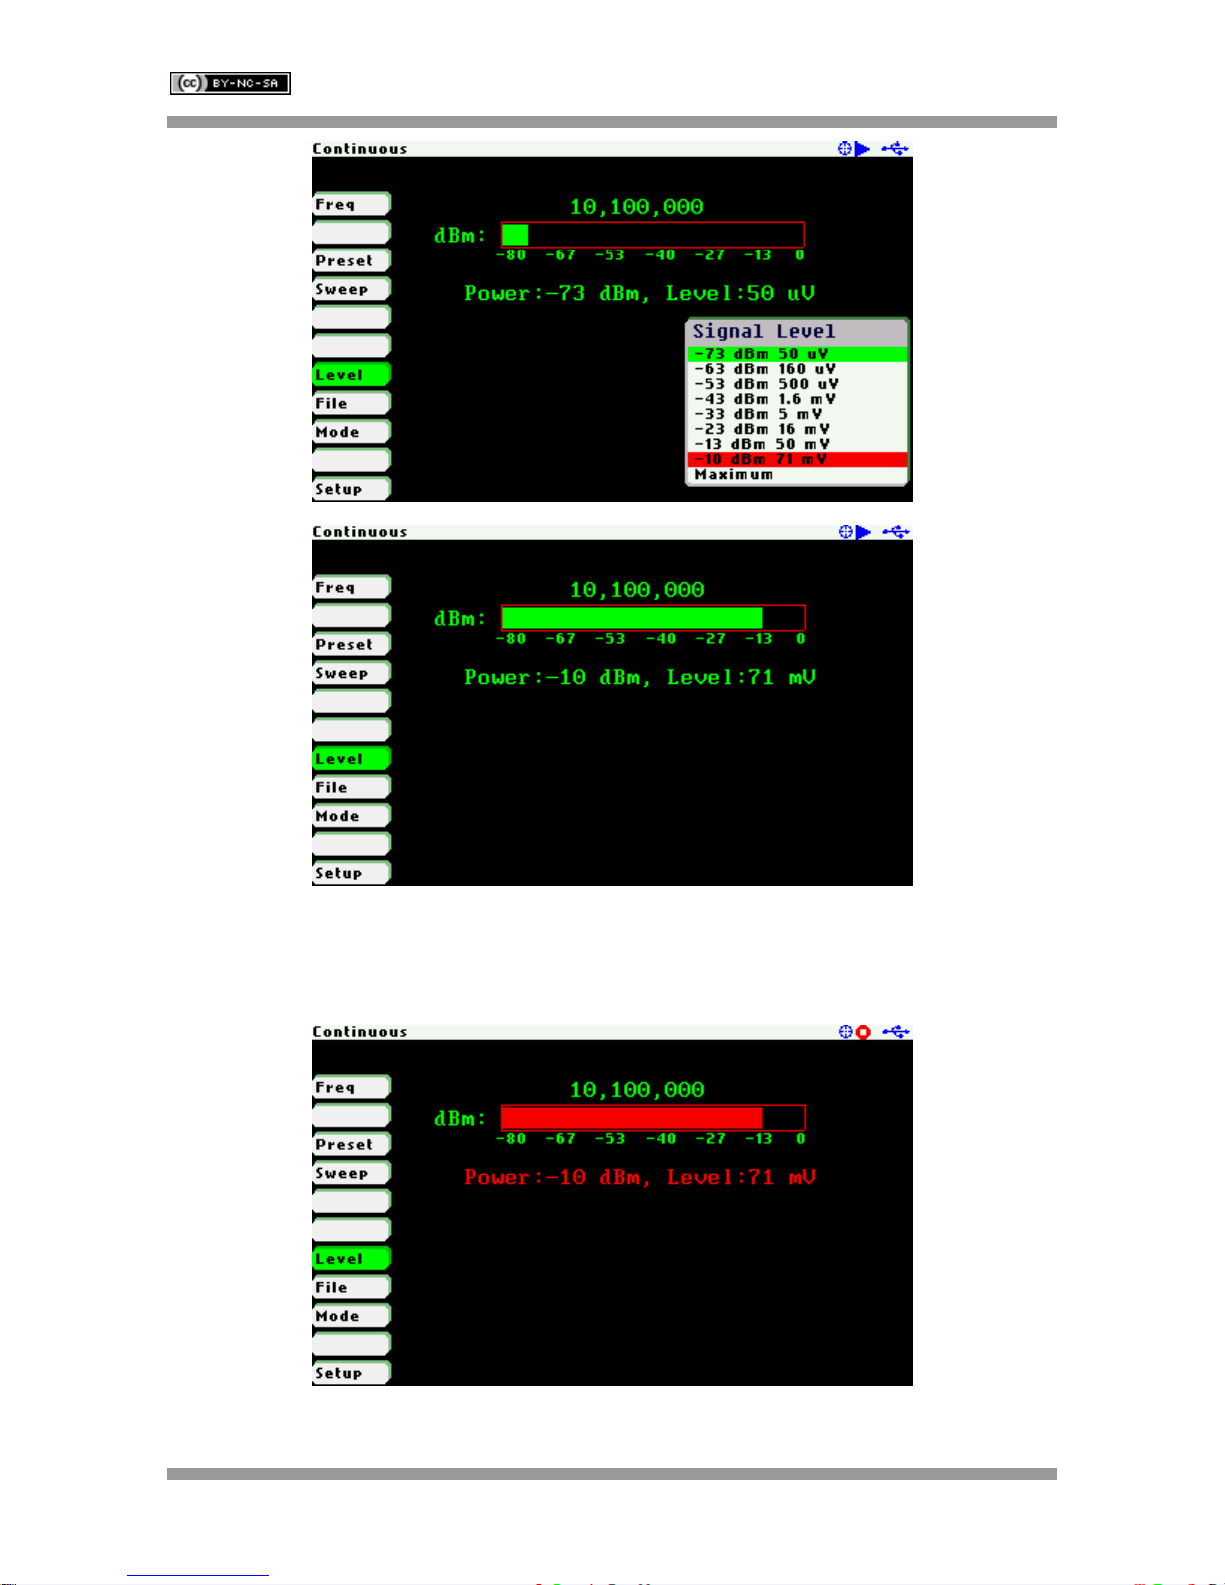
For changing the output level, use Navigator A to highlight «Level» in the main menu. Use
Navigator B to select the desired level or press the Select [■] button to activate the level selection
pop up dialog.
There are eight selectable output levels ranging from -73 dBm to -10 dBm. The «Maximum» output
level setting produces the device’s maximum output signal level that the hardware can support at
the assigned frequency. Note that when using this setting there is both a more noticeable amplitude
roll off with frequency as well as higher distortion of the output signal.
Rev 1.1.7 October 29th, 2014 - 46 - © Melchor Varela – EA4FRB 2011-2014
Page 47
SteppIR SARK-110 User’s Manual
The signal generator outputs continuously unless it is paused by pressing the Run/Hold [►||] button.
In the Hold state the level graph and power level indicators change to red. Signal generation can be
resumed at any time by pressing the same button again.
Rev 1.1.7 October 29th, 2014 - 47 - © Melchor Varela – EA4FRB 2011-2014
Page 48

SteppIR SARK-110 User’s Manual
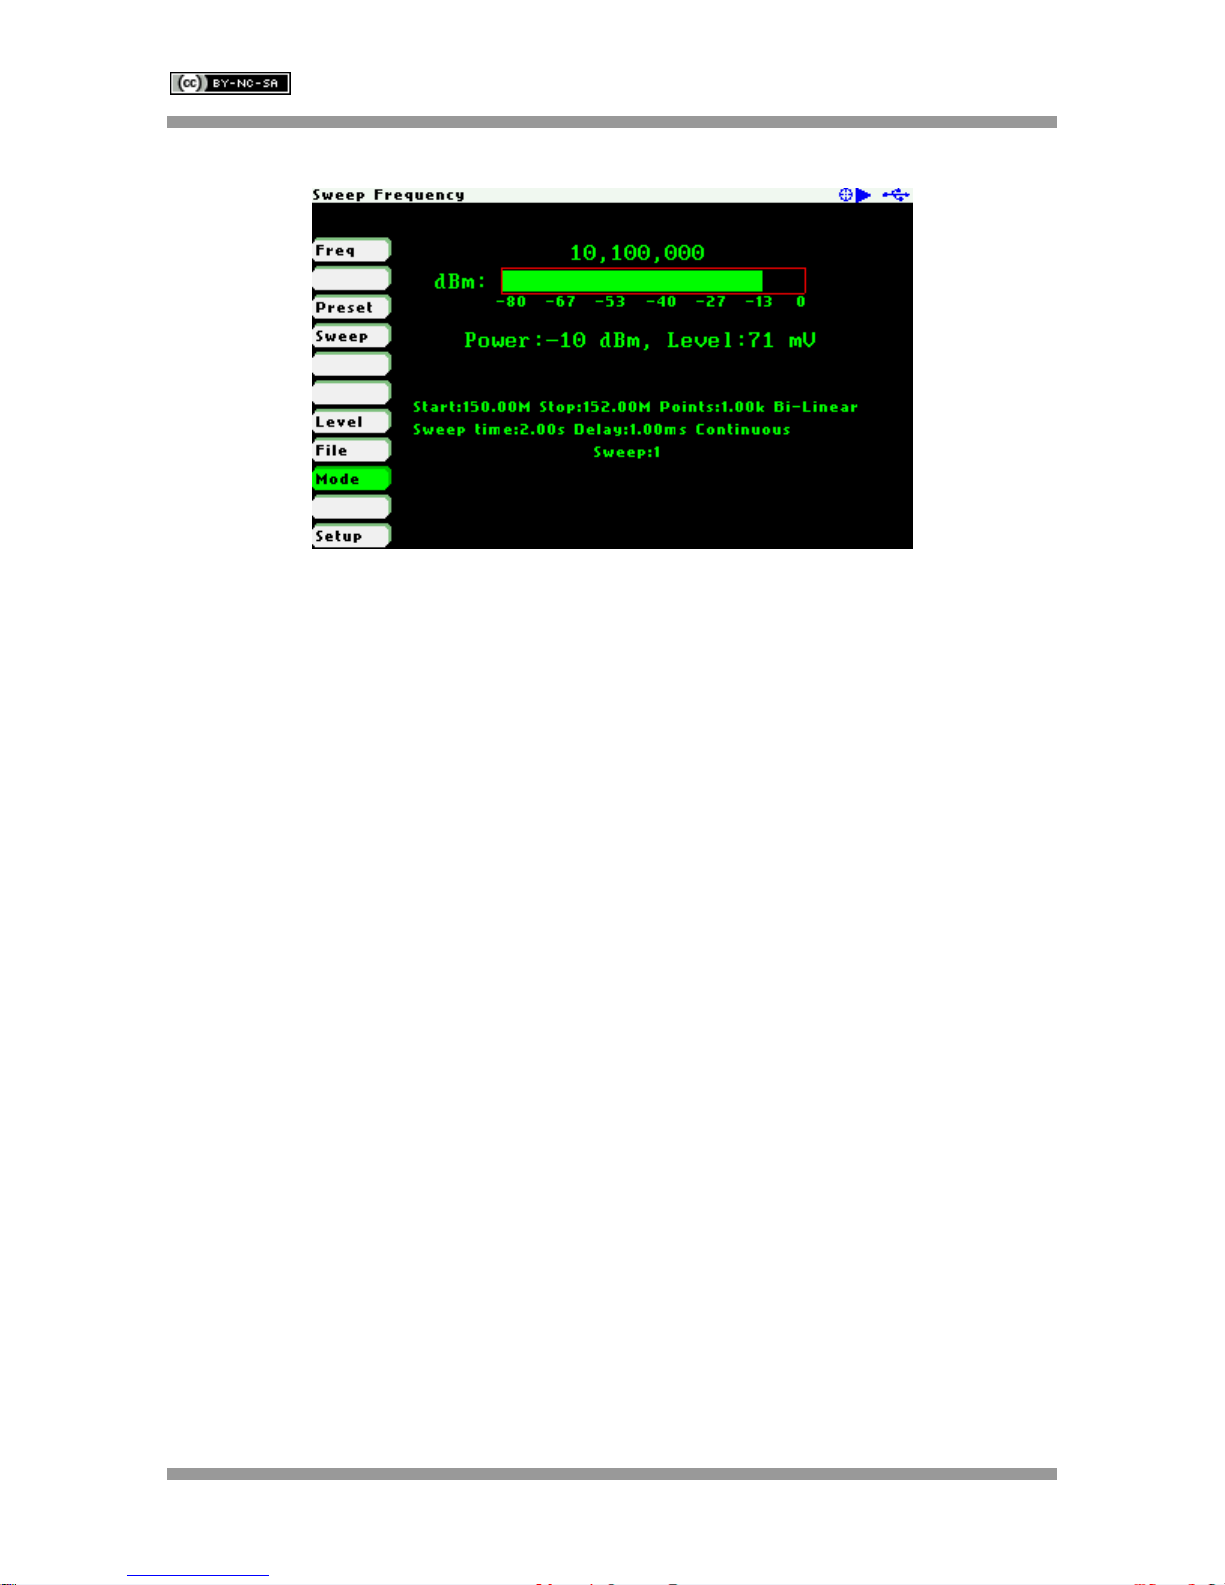
In frequency sweep mode the signal frequency will sweep across a range of provided frequencies.
To change the sweep parameters, use Navigator A to highlight «Sweep» in the main menu and
press the Select [■] button to validate the different sweep parameters.
The following parameters should be supplied:
Sweep:
o None Continuous frequency mode
o Frequency Sweep frequency mode
Repeat:
o Continuous Continuous signal generation
o Single Signal generator stops after a single sweep
o Count: Signal generator stops when number of sweeps reach count
<Count>
Function:
o Linear Linear frequency increase or decrease
o Log Logarithmic frequency increase or decrease
o Bi-Linear Start-Stop-Stop-Start sweep (Linear)
o Bi-Log Start-Stop-Stop-Start sweep (Log)
Start Frequency:
o <Start> Hertz
Stop Frequency:
o <Stop> Hertz
Number of points: Number of steps between start and stop frequency
o <Points>
Delay uS: Step time
o <Delay uS> Micro-seconds
Rev 1.1.7 October 29th, 2014 - 48 - © Melchor Varela – EA4FRB 2011-2014
Page 49
SteppIR SARK-110 User’s Manual
Rev 1.1.7 October 29th, 2014 - 49 - © Melchor Varela – EA4FRB 2011-2014
Page 50
SteppIR SARK-110 User’s Manual
All the sweep parameters are shown on the screen as seen in the screenshot below:
Another useful output power level value for receiver testing is -107dBm, which is 1uV into 50 ohms
and equates to S1 on an S-meter. This power level is not available in the SteppIR SARK-110, but a
34dB attenuator could be made to give -107dBm with a pi network of two 52 ohm resistors as shunt
in and out and a 1.2k + 52 ohm series resistor.
Rev 1.1.7 October 29th, 2014 - 50 - © Melchor Varela – EA4FRB 2011-2014
Page 51
SteppIR SARK-110 User’s Manual
12 Computer Control Mode
The SteppIR SARK-110 can be operated from a personal computer using SARK Plots client
software for Windows, further enhancing the capabilities of the instrument. There is no need to
install a dedicated driver since the communication is implemented using the standard USB HID
interface.
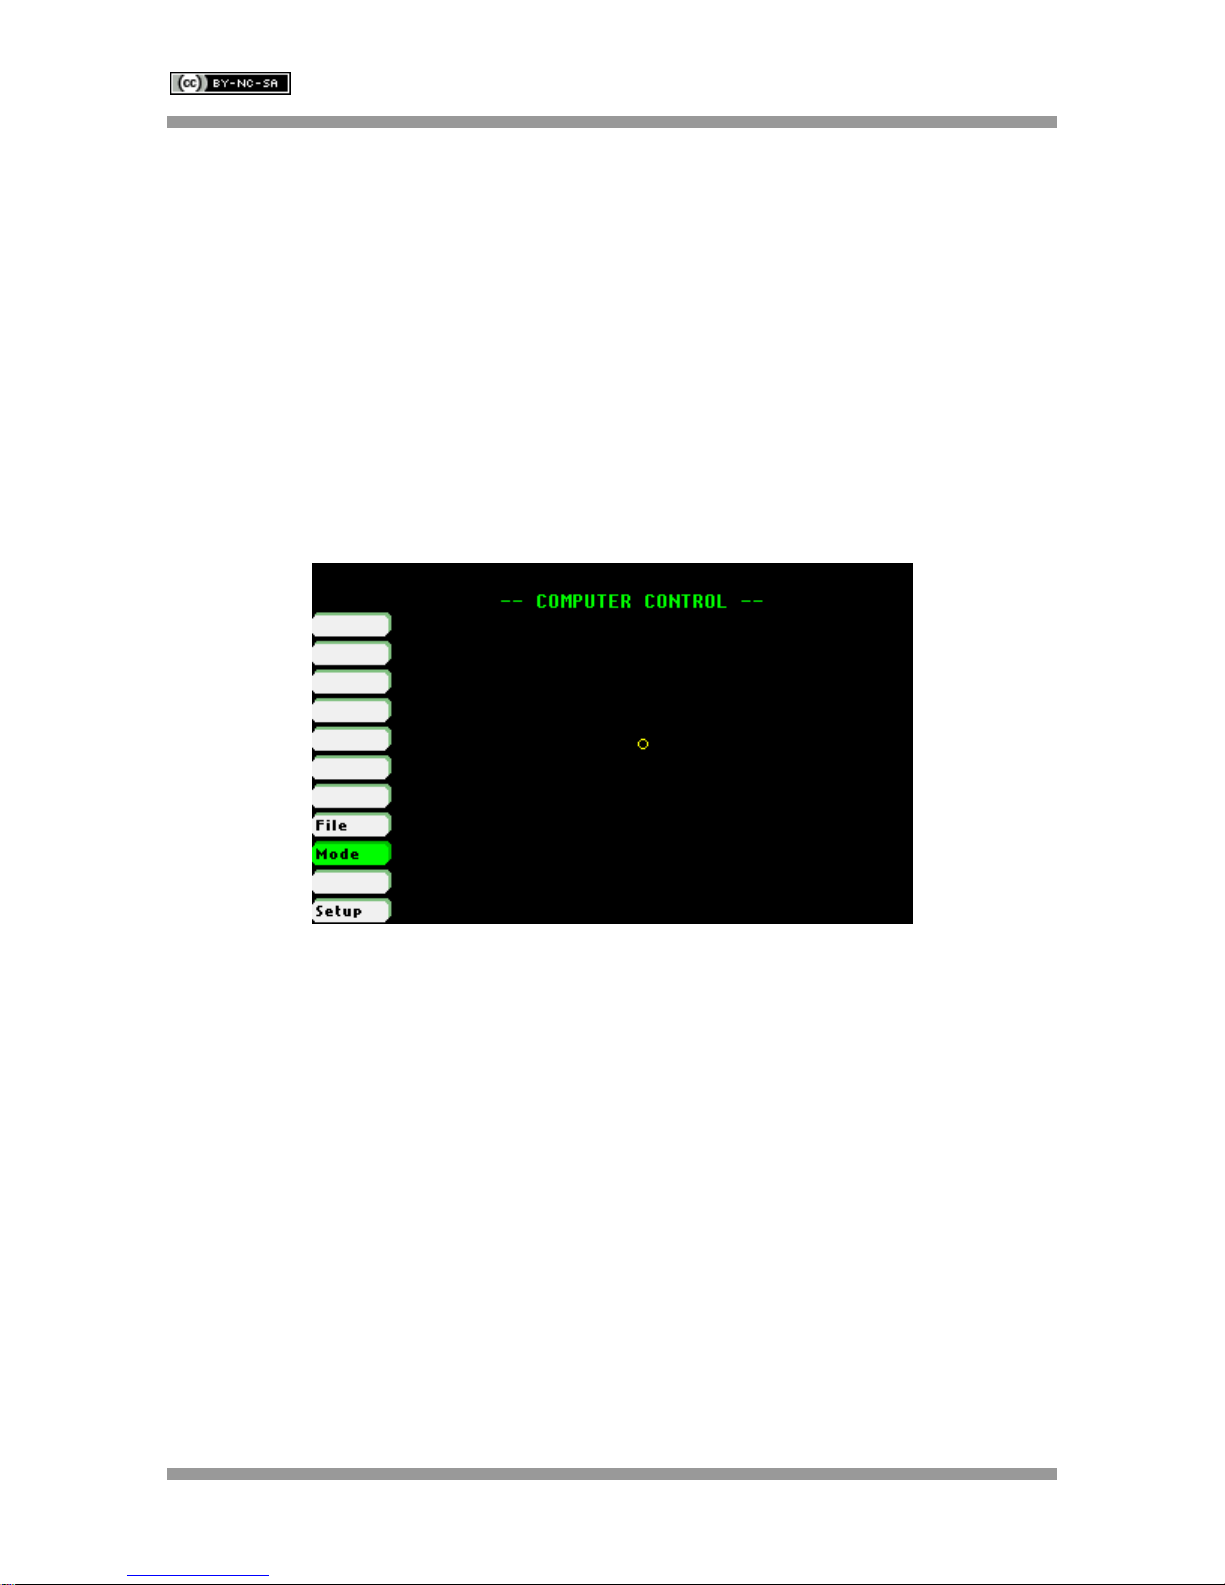
Use Navigator A to highlight «Mode» in the main menu. Press the Select [■] button to activate the
Mode popup submenu and use Navigator B to highlight «Computer Control» submenu mode option.
Finally press the Select [■] button to enter into Computer Control mode.
The analyzer establishes the USB link when it is connected to the personal computer but only
accepts commands from the client in Computer Control mode.
Rev 1.1.7 October 29th, 2014 - 51 - © Melchor Varela – EA4FRB 2011-2014
Page 52

SteppIR SARK-110 User’s Manual
The command interface specification is open for anyone wishing to develop client software. Source
code examples of the communication interface are available for different operating systems.
This information is available at the following link: http://www.sark110.com/commands-interface
Rev 1.1.7 October 29th, 2014 - 52 - © Melchor Varela – EA4FRB 2011-2014
Page 53
SteppIR SARK-110 User’s Manual
13 Transmission Line Add/Subtract
The SteppIR SARK-110 provides the capability of subtracting a length of transmission line
(transpose to load) or adding a length of transmission line (transpose to input). Use the subtraction
feature to discount the effect of the feed line so the measurements will be as if the analyzer were
connected at the antenna feed point. Use the addition feature for simulating the effect of a feed line.
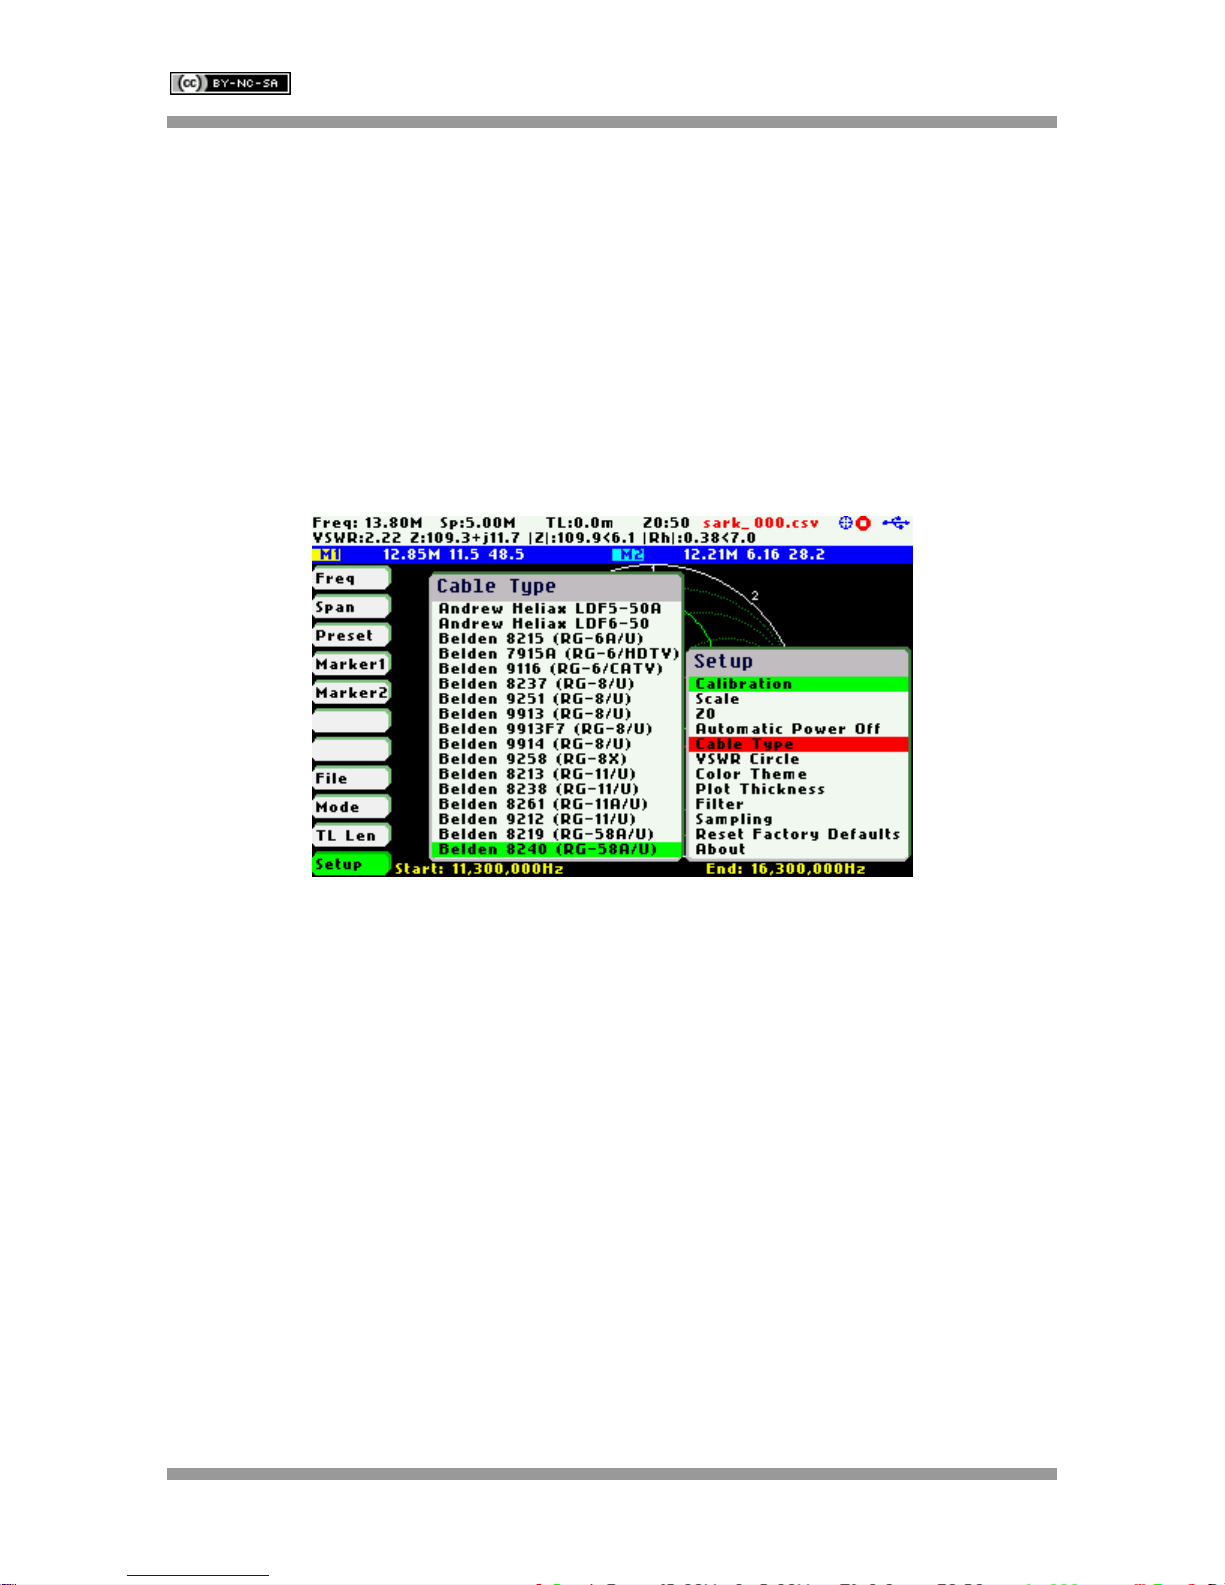
The transmission line type has to be known in advance. The SteppIR SARK-110 provides a
comprehensive list of cable types and in addition the user can specify up to three custom cable
types. The selection of the cable is available in the menu «Setup» «Cable Type», see the
screenshot below:
The transmission line length has to be entered into the «TL Len» menu option within the Main
menu. Use negative quantities for Subtract operations (transpose to load) and positive quantities for
Add operations (transpose to input).
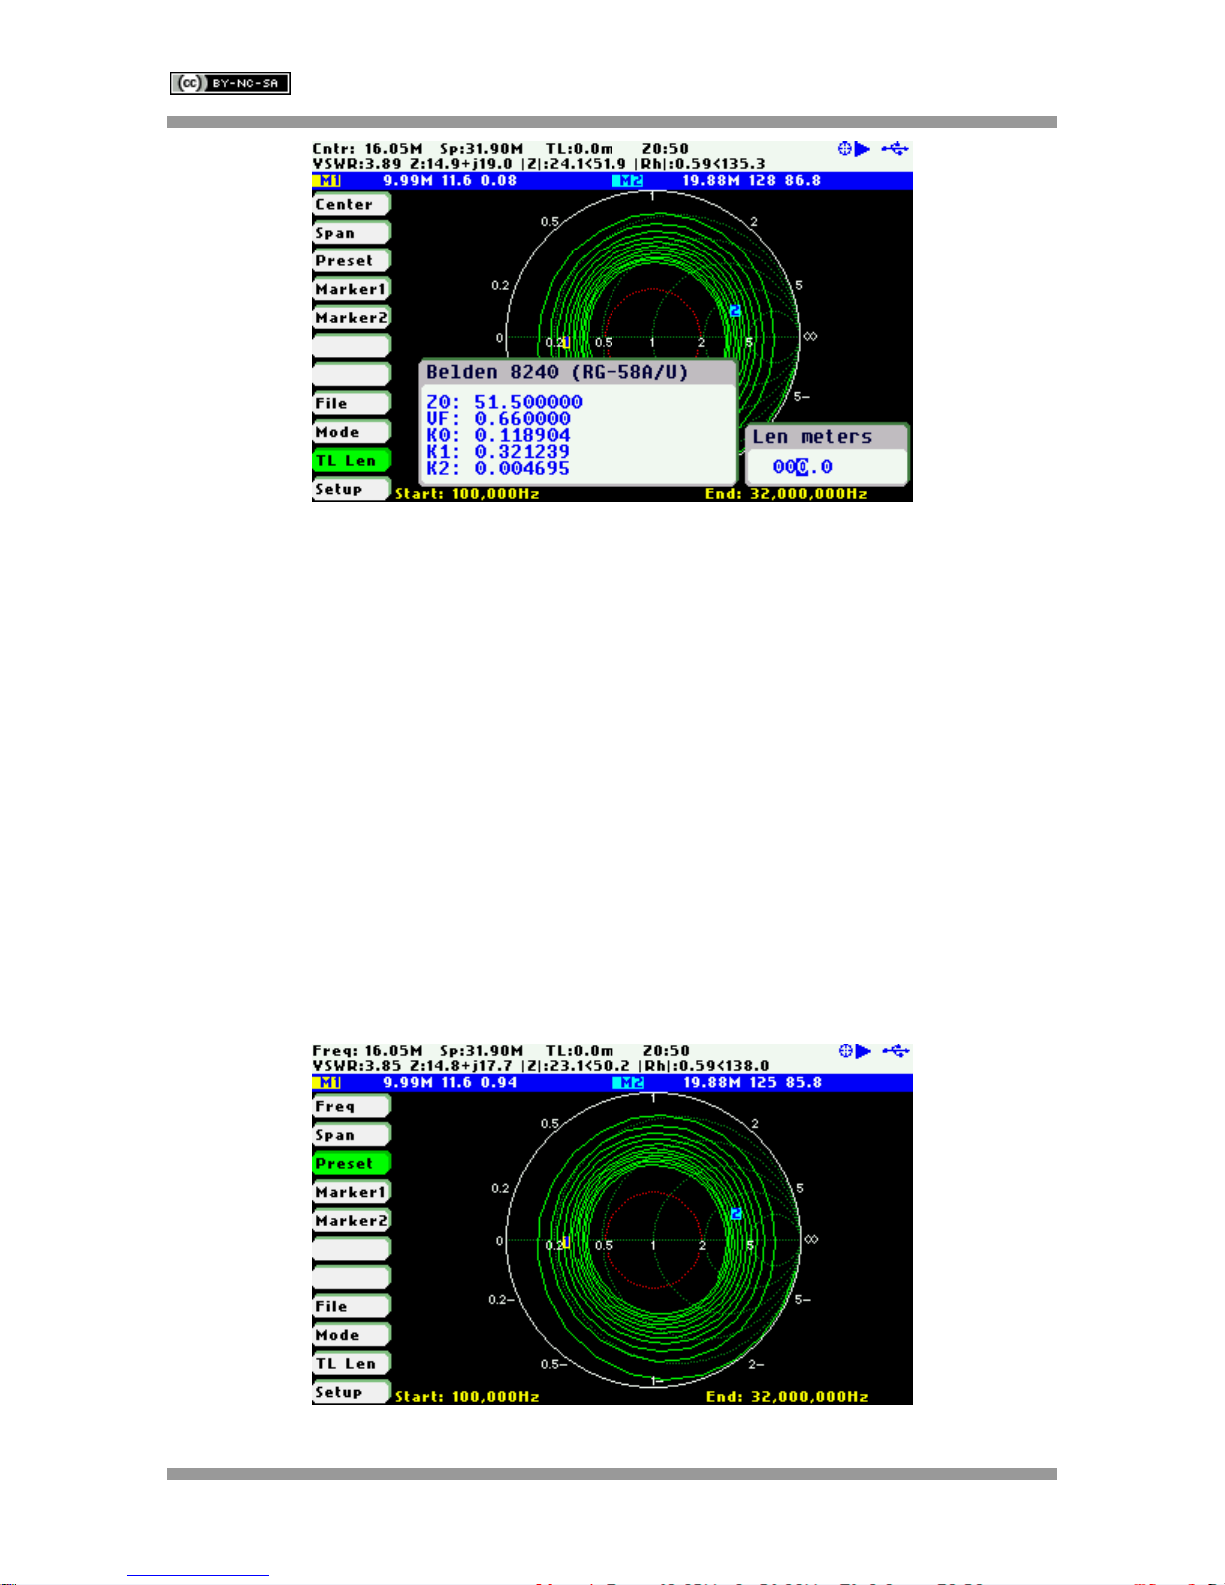
The pop-up edit dialog is activated by pressing the Select [■] button when the «TL Len» option is
active; see the screenshot below. The value is set by using Navigator B to adjust the digit at each of
the current length multiplier positions, shown in reverse video. The length multiplier position can be
changed using Navigator A. The length is validated by pressing the Select [■] button. The setting is
cancelled by pressing any other button. Note that the length value can be set to zero by pressing the
Save Screen [●] button
Rev 1.1.7 October 29th, 2014 - 53 - © Melchor Varela – EA4FRB 2011-2014
Page 54
SteppIR SARK-110 User’s Manual
The second method for changing the transmission length is simply by using Navigator B when the
«TL Len» menu option is active. The length value will change according the current length
multiplier. The length multiplier can be changed from the pop-up transmission line length edit dialog.
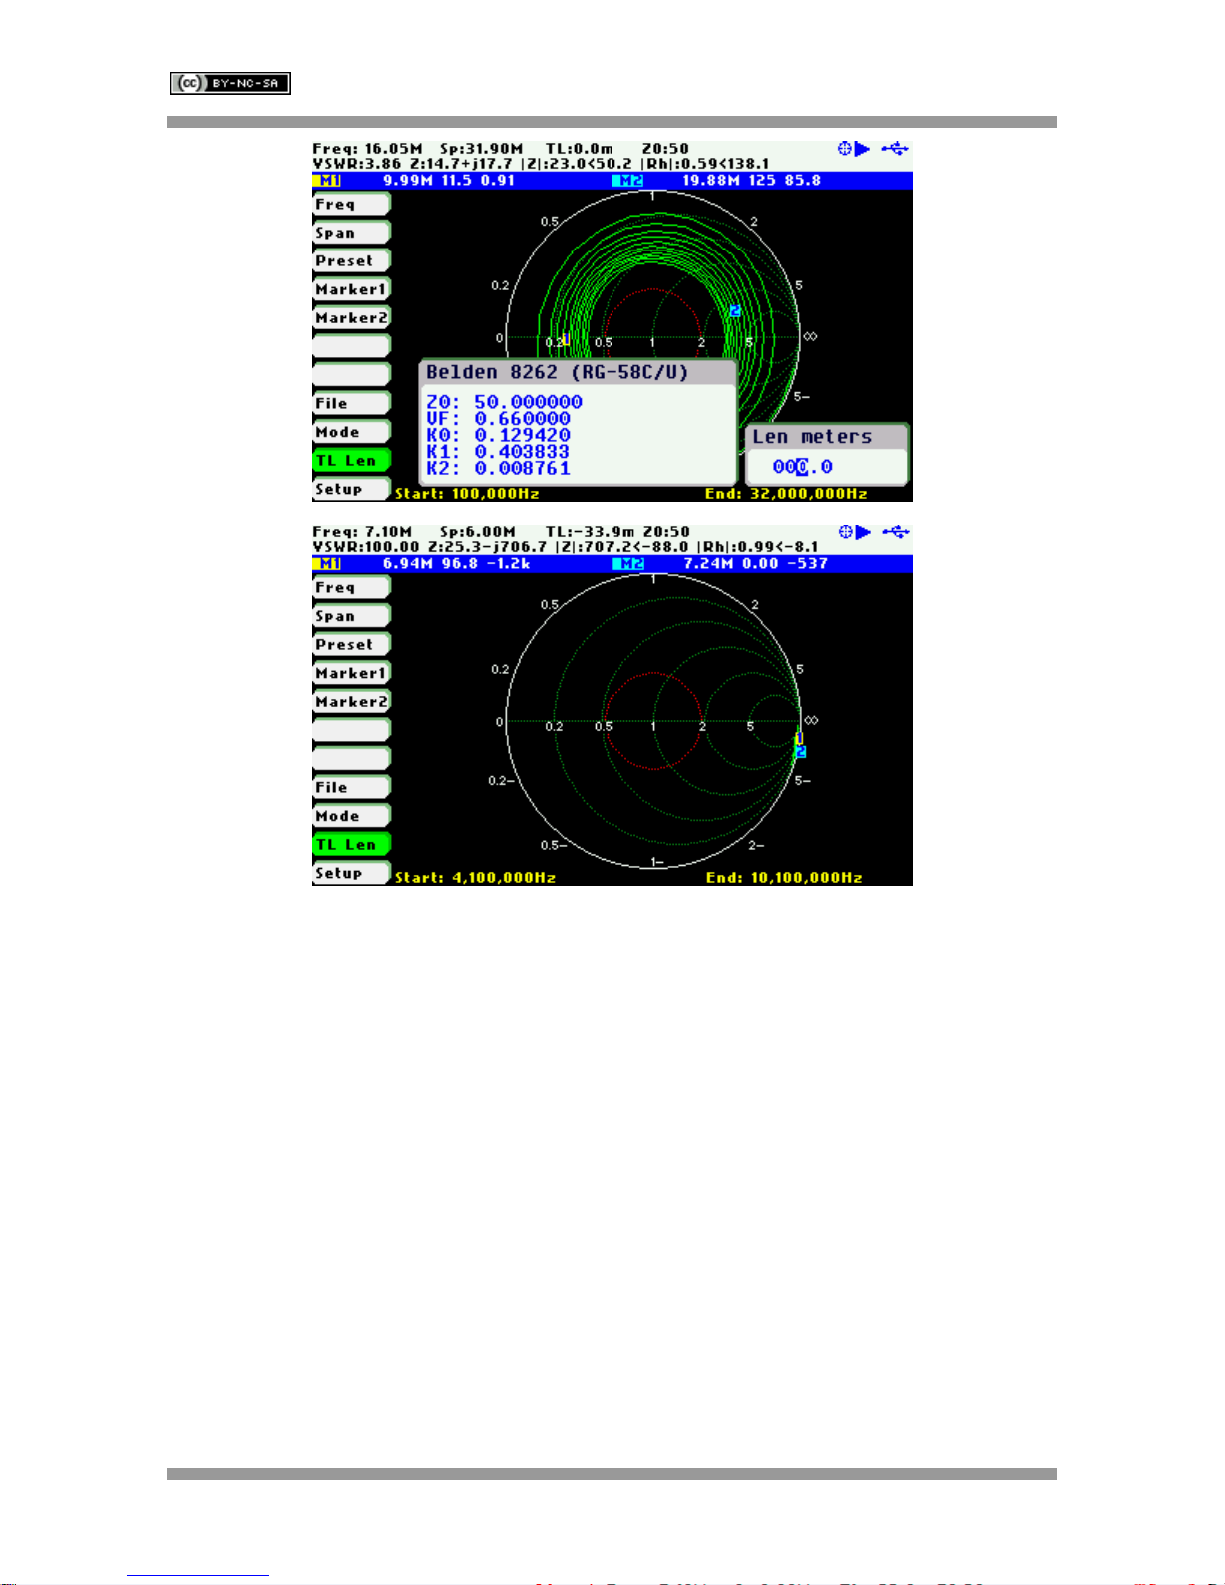
Since the precise cable length is not normally known in advance, there is a procedure to get the
cable length as follows. As a precondition the cable must be unterminated at the far end. Set the
SteppIR SARK-110 to Smith Chart mode and select «Preset» «Full HF». The Smith Chart will show
a spiral from infinite impedance and going towards the centre. When setting negative length values,
this spiral will be progressively unrolled and transposed to the infinite impedance point when the
exact length will be set. Then, if a load is connected at the cable far end, the presence of the
transmission line will be discounted.
The screenshots below show an example of this in operation. A line of 33.9m of RG-58C/U coax
cable is unterminated at the far end. The first screenshot shows the measurement without applying
the TL compensation and the last screenshot shows the measurement once the subtract feature
has been applied.
Rev 1.1.7 October 29th, 2014 - 54 - © Melchor Varela – EA4FRB 2011-2014
Page 55
SteppIR SARK-110 User’s Manual
Rev 1.1.7 October 29th, 2014 - 55 - © Melchor Varela – EA4FRB 2011-2014
Page 56

SteppIR SARK-110 User’s Manual
Synthesizer
Direct Digital Synthesis with 1Hz resolution
Sine wave output
Frequency range from 0.1 to 230Mhz
Measured
Parameters
Complex impedance (series and parallel) and reflection coefficient in
rectangular and polar form, VSWR, return loss, reflection power
percentage, quality factor, equivalent capacitance, equivalent inductance
Operating Modes
Scalar Chart, Smith Chart, Single Frequency, Cable Test (TDR), Field,
Multi-band, Signal Generator, Computer Control
Features Common
To Most Modes
Presets for amateur radio bands
Adjustable reference impedance
Save to disk and recall functions
Three available fixed scale options and automatic scaling
Presets for popular coaxial cables
Add/subtract transmission line
Black or white color schemes
Adjustable plot trace widths
Scalar Chart Mode
Graphical plot of two user-selected parameters in a rectangular chart
Two markers with manual or automatic positioning
Display detailed parameters for center frequency or any of the two
marker positions
Smith Chart Mode
Plots complex reflection coefficient in Smith Chart form
Two markers with manual or automatic positioning
Display detailed parameters for center frequency or either of the two
marker positions
Single Frequency
Mode
Display all parameters for a single frequency
Graphical representation of series and parallel impedance equivalent
VSWR Audio feedback
14 Specifications
Rev 1.1.7 October 29th, 2014 - 56 - © Melchor Varela – EA4FRB 2011-2014
Page 57

SteppIR SARK-110 User’s Manual
Cable Test Mode
Maximum length: about 250 m
Displays step and impulse responses
Field Mode
Graphical plot of one user-selected parameter in a scalar chart with
enhanced legibility
Display max and min values
Multi-band Mode
Display rectangular charts for four bands simultaneously
Signal Generator
Mode
Precise RF signal generator with 1 Hz resolution
Programmable output level from -73 dBm to -10 dBm
Continuous and frequency sweep modes
Linear, logarithmic, bi-linear, and bi-logarithmic sweep modes
Markers
Tracking modes:
o Peak Min
o Peak Max
o Absolute Min
o Absolute Max
o Value Cross Any
o Value Cross Up
o Value Cross Down
Interface
Full color 3” TFT LCD 400 x 240
4 dedicated buttons
2 navigation keys
MCX antenna socket
PC Interface
USB Mini-B receptacle
USB 2.0 Full Speed
USB Composite Device:
o Mass Storage Class (internal disk)
o HID Class (Computer Control mode)
Storage
2 MB internal disk FAT compatible
USB Mass Storage
Screenshot save and recall feature
Rev 1.1.7 October 29th, 2014 - 57 - © Melchor Varela – EA4FRB 2011-2014
Page 58

SteppIR SARK-110 User’s Manual
Measurement data save and recall feature
Possibility of files with user definable frequency presets, scale settings,
and three custom cable types
Measurement data files compatible with SARK Plots and ZPLOTS
programs
Calibration
Automated Open/Short/Load calibration
256 calibration points
Calibration settings stored on disk
Frequency calibration
Measurement
Architecture
Single conversion super heterodyne
Two independent measurement channels for simultaneous voltage and
current measurement for precise phase measurement
Two synchronized 12-bit analog to digital converters
Processor
72 MHz STM32 MCU
256KB Flash
48KB SRAM
RF Output
Connector: MCX socket
Output power: -10 dBm (0.1mW, 70.7mV rms) into a 50-ohm load
Power
3.7V 1000mAh Internal Lithium-Polymer battery
USB for operation and charging
Automatic Power Off functionality (disabled, 5, 10, or 30minutes)
Autonomy 2.5 hours
Charge time 3.5 hours
Environment
Operating temperature: 0ºC to 50ºC
Dimensions
98 * 60 * 14.5 (mm)
Weight
120g
Package Content
SteppIR SARK-110 x 1
Battery x 1
Rev 1.1.7 October 29th, 2014 - 58 - © Melchor Varela – EA4FRB 2011-2014
Page 59

SteppIR SARK-110 User’s Manual
MCX to BNC adapter pigtail x 1
Allen key x 1
Rev 1.1.7 October 29th, 2014 - 59 - © Melchor Varela – EA4FRB 2011-2014
Page 60

SteppIR SARK-110 User’s Manual
15 Precautions
1. Never connect the unit to an antenna during a lightning storm. Lightning strikes and static
discharges can damage the unit and may kill the operator.
2. Never apply an RF signal or any other external voltage to the test port of this unit. Doing so
may damage the unit. Note that powerful active transmitters nearby may induce a high RF
voltage on the antenna.
3. The test port is ESD protected; however, static build-up on an antenna may cause damage
to the unit when connected. As a precaution, always discharge the antenna before
connecting and after operation, disconnect the antenna.
4. This product emits a low power RF signal during its active measurement mode. When
connected to an antenna system, this radiation may cause interference to nearby
communication systems. Connect only for as long is necessary.
16 Regulatory Warning
This equipment is intended for use by radio amateurs in a laboratory environment only.
The product generates and radiates radio frequency energy and has not been tested for compliance
of both EMC and R&TTE directives, which are designed to provide reasonable protection against
radio frequency interference and, if not installed and used in accordance with the instruction manual,
may cause harmful interference to radio communications
Operation of this equipment in other environments may cause interference with radio
communications, in which case, the user is required to take whatever measures may be needed to
correct this interference at their own expense.
Rev 1.1.7 October 29th, 2014 - 60 - © Melchor Varela – EA4FRB 2011-2014
Page 61

SteppIR SARK-110 User’s Manual
17 Acknowledgments
I would like to offer a special thanks to the Seeed Studio team for making this product a reality.
The analyzer schematics and layout have been developed using the DesignSpark PCB tool.
Product information is available at: www.designspark.com/pcb
The analyzer firmware has been developed using the Lite edition of the Atollic TrueSTUDIO® for
STM32. Product information is available at: www.atollic.com
FAT File System was provided by the ChaN, FatFs module.
The STM32 firmware and USB library are provided by STMicroelectronics.
Many thanks to Dan Maguire, AC6LA, for the great ZPLOTS MSExcel application:
http://www.ac6la.com/zplots.html
Rev 1.1.7 October 29th, 2014 - 61 - © Melchor Varela – EA4FRB 2011-2014
Page 62

SteppIR SARK-110 User’s Manual
Appendix A: Theory of Operation
The block diagram below illustrates the main functional blocks of the SteppIR SARK-110 Antenna
Analyzer:
The SteppIR SARK-110 comprises four main sections: a signal generator used as an active source,
a bridge to provide signal separation, two tuned receivers that downconvert and detect the signals
and a microcontroller and display for calculating and reviewing the results.
The signal generator is provided by a single chip dual direct digital synthesizer (DDS) AD9958 from
Analog Devices, which generates a sinusoidal signal for impedance measurement and a local
oscillator signal for the tuned receivers (mixers). One of the DDS channels operates at the specified
test frequency and the other is programmed to operate just 1 kHz above it, which is the value of the
intermediate frequency. The DDS has an internal oscillator driven by an external 24 MHz crystal and
is able to multiply this clock internally by a user configurable factor of 4 to 20, so the maximum
internal clock frequency is 480 MHz. In general the DDS can be configured to generate a frequency
of up to one third of the clock frequency but in this design, due to the external reconstruction filter, it
is possible to achieve an output frequency of up to 230 MHz.
The amplitude level of the DDS channel’s output is frequency dependent and it is reduced with
increasing frequency following a SIN(X)/X function. The SteppIR SARK-110 software compensates
Rev 1.1.7 October 29th, 2014 - 62 - © Melchor Varela – EA4FRB 2011-2014
Page 63

SteppIR SARK-110 User’s Manual
for this amplitude rolloff effect by using the capability of the DDS to adjust the amplitude level of the
output signal, so the analyzer maintains a flat output amplitude.
The output of each of the DDS channels is differential and is amplified by a dual high speed current
feedback amplifier working in differential input mode and with output in single ended mode. Most
DDS designs use a broadband balun transformer to convert to single end mode but because of the
restricted height available in the SteppIR SARK110 enclosure a silicon-based solution was chosen.
The output of each amplifier is followed by elliptic low pass filters with a cut-off frequency of 230
MHz. These filters reduce the level of spurious high frequency components that appear in the output
of the DDS. These high frequency components consist of aliases at multiples of the internal clock
frequency as well as other spurs.
For impedance measurement a resistive bridge is used because of its simplicity and good frequency
response, working down to DC. In the bridge a voltage across one resistor is proportional to the
voltage being applied to the circuit under test and the voltage across another resistor is proportional
to the current flowing into the circuit connected to the analyzer’s test port. Both the magnitude and
phase are measured. The ratio of the two corresponds to the impedance we want to measure.
One of the mixers is used for the voltage measurement and the other for the current measurement.
The output of the mixers is the 1 kHz I.F. signal which is then amplified and filtered with a bandpass
filter before digitizing. Identical mixer and amplifier circuits are used for both the voltage and current
sensing paths. Any small differences in the gain and phase shift of these two signal paths are taken
care of by the calibration process.
The core of the analyzer is an STM32F103 microcontroller from STMicroelectronics. This
microcontroller incorporates the high-performance ARM Cortex M3 32 bit core operating at 72 MHz,
a Flash memory of 256 KB, SRAM of 48 KB, and an extensive range of I/O and peripherals
including a USB device controller and three 12-bit ADC converters. The digitizing of the 1 KHz I.F.
signal is done by two independent 12-bit ADC converters contained in the STM32 MCU. These two
converters operate simultaneously and are synchronized, so providing good accuracy for the phase
measurement.
The two sets of digital data from the voltage and current sensors are analyzed using an optimized
implementation of the discrete Fourier transform that works with a single bin. This produces the
amplitude and phase of the 1 kHz fundamental signal and cancels out any dc component due to
offsets in the operational amplifiers. The load impedance magnitude is the voltage amplitude divided
by the current amplitude. The phase angle of the impedance is the difference in the phase angles of
the voltage and current. Knowing these two parameters, we can calculate the equivalent resistance
and reactance of the load impedance. The rest of the parameters such as VSWR, reflection
coefficient, etc. are derived from the measured impedance value.
Rev 1.1.7 October 29th, 2014 - 63 - © Melchor Varela – EA4FRB 2011-2014
Page 64

SteppIR SARK-110 User’s Manual
Rev 1.1.7 October 29th, 2014 - 64 - © Melchor Varela – EA4FRB 2011-2014
Page 65
SteppIR SARK-110 User’s Manual
Abbreviation
Parameter
Description
Rs
Series resistance
Resistive value of a series impedance
Xs
Series reactance
Reactance value of a series impedance
Rp
Parallel resistance
Resistive value of a parallel impedance
Xp
Parallel reactance
Reactance value of a parallel impedance
|Zs|
Magnitude of a
series Impedance
Represents the absolute magnitude of the ratio of the
voltage difference amplitude to the current amplitude,
22
|| XRZ
<Zs
Impedance Angle
It is a measure of the phase angle of the ratio of the
amplitude of the voltage to the amplitude of the current,
expressed in degrees.
VSWR
Voltage Standing
Wave Ratio
It is a measure of how efficiently radio-frequency power is
transmitted from a power source, through a transmission
line and into a load (for example, from a power amplifier
through a transmission line and into an antenna).
RL
Return Losses
Return loss is the negative of the magnitude of the
reflection coefficient in dB.
)(10log20 RhoRL
CL
Cable Losses
Measurement of insertion loss of a cable in dB. The
measurement should be performed by applying a short
circuit in the cable end.
)
2
(
RL
ABSCL
|Rho|
Magnitude of a
Reflection
Coefficient (Rho)
It is a measure of the absolute magnitude of the ratio of
the amplitude of the reflected wave to the amplitude of the
incident wave.
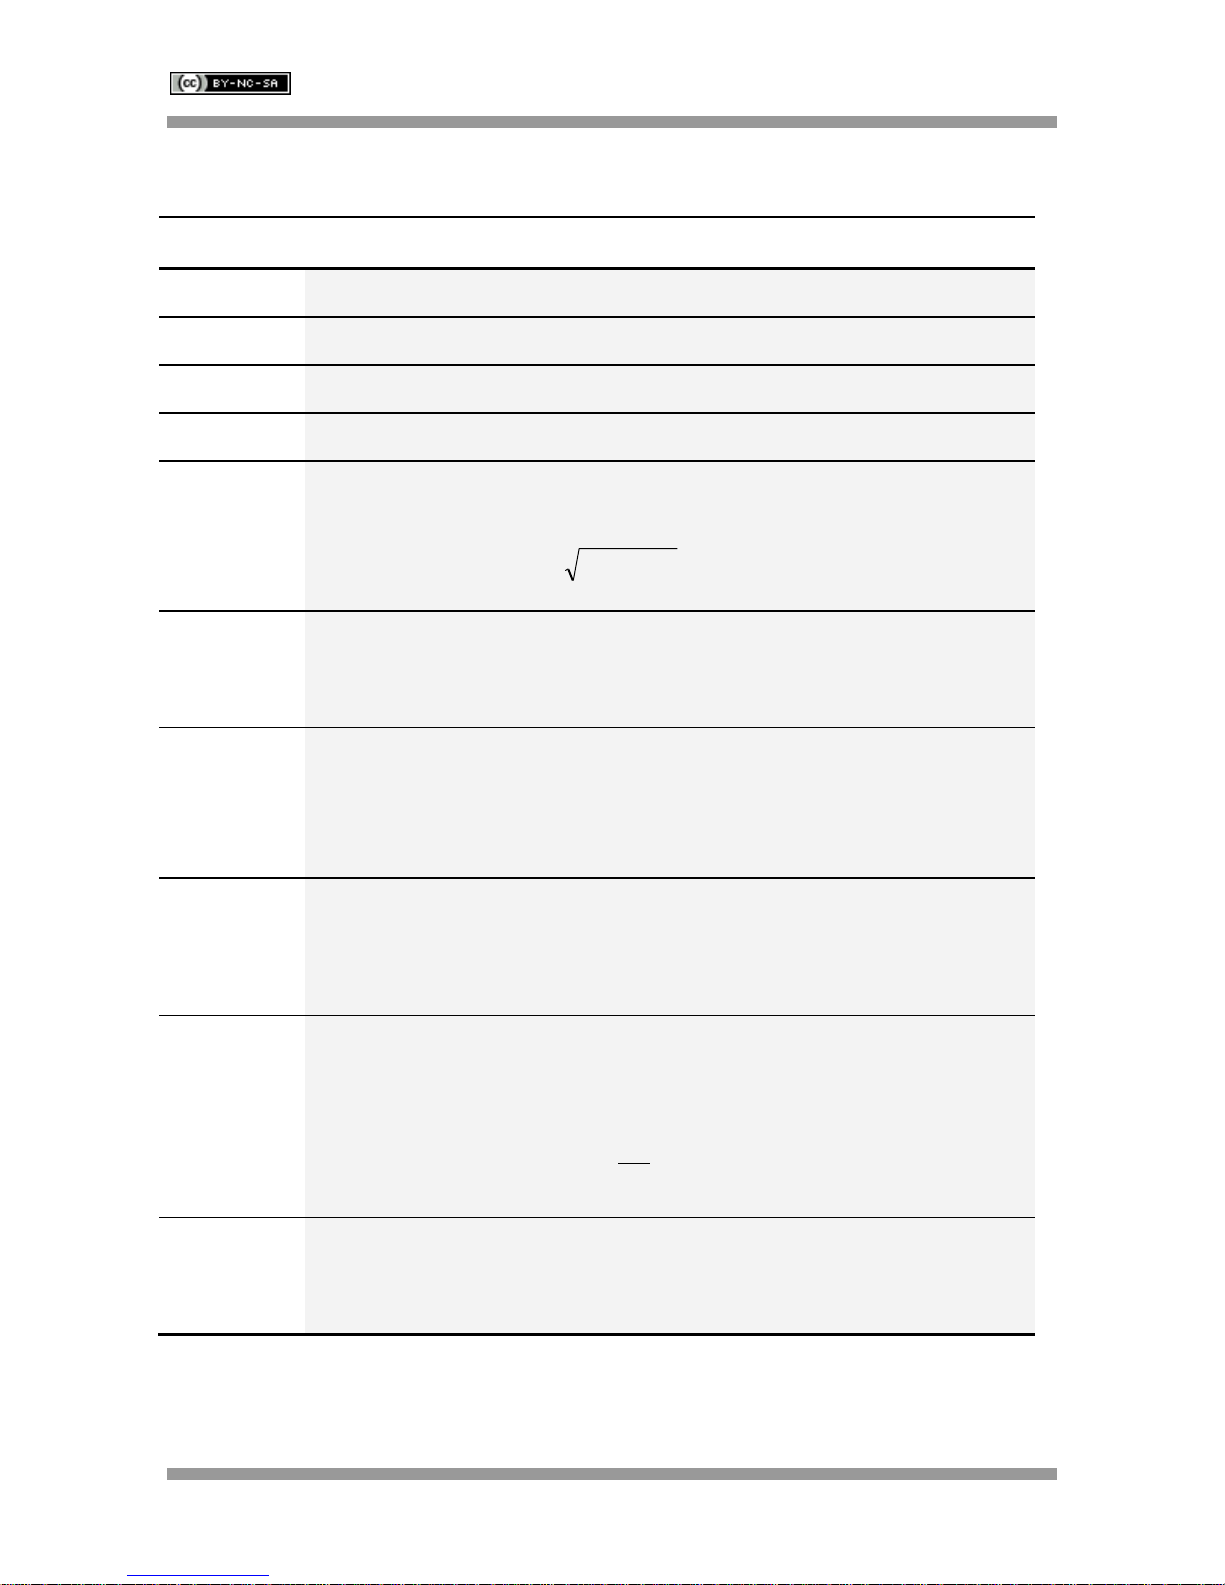
Appendix B: Fundamental Parameters
Rev 1.1.7 October 29th, 2014 - 65 - © Melchor Varela – EA4FRB 2011-2014
Page 66

SteppIR SARK-110 User’s Manual
Abbreviation
Parameter
Description
<Rho
Reflection
Coefficient Angle
It is a measure of the phase angle of the ratio of the
amplitude of the reflected wave to the amplitude of the
incident wave.
RhoR
RhoI
aPh tan
%Ref Pwr
Percentage of
Reflected Power
100%
2
RhoRPwr
Q
Quality Factor
It is defined as the ratio of the energy stored in a
component to the energy dissipated by the component,
R
X
Q
Cs
Series
Capacitance
Equivalent series capacitance at the measurement
frequency
Ls
Series Inductance
Equivalent series inductance at the measurement
frequency
Cp
Parallel
Capacitance
Equivalent parallel capacitance at the measurement
frequency
Lp
Parallel Inductance
Equivalent parallel inductance at the measurement
frequency
Rev 1.1.7 October 29th, 2014 - 66 - © Melchor Varela – EA4FRB 2011-2014
Page 67

SteppIR SARK-110 User’s Manual
Appendix C: Upgrading the firmware
The SteppIR SARK-110’s firmware may be upgraded via USB as described in the following steps:
This procedure assumes you have downloaded the appropriate update file from:
http://www.sark110.com/files/firmware
Ø Note: Two versions of the zipped upgrade file are always available. This is explained on
the download page
The downloaded file should be unzipped to produce an update file in the format:
SARK110-VAA-APP-x.y.z.dfu Where x.y.z is the incremental version number.
1. Connect the SteppIR SARK-110 to the PC with a USB cable
2. Copy the firmware file, e.g. SARK110-VAA-APP.x.y.z.dfu to the SARK’s USB disk
3. Power off the SteppIR SARK-110 and power it on again while simultaneously holding down
the Run/Hold [►||] button
4. The Device Firmware Upgrade screen prompts you to install the firmware file
5. If several firmware files are on the USB disc, use Navigator B to select the file to load
6. The firmware upgrade will commence after pressing the Select [■] button
7. Once complete, press the “Save Conf” [▲] button, which will reset the analyzer and run the
upgraded firmware
Rev 1.1.7 October 29th, 2014 - 67 - © Melchor Varela – EA4FRB 2011-2014
Page 68
SteppIR SARK-110 User’s Manual
é••• ê
-•••+
Ø
||
SARK-110
Reference
Plane
Open
Short
Load
Appendix D: OSL Calibration
The SteppIR SARK-110 provides a calibration procedure to compensate for the stray capacitance
and impedance of the external test fixture, e.g. the extension cable. This should be performed every
time the external test fixture is changed as well as periodically.
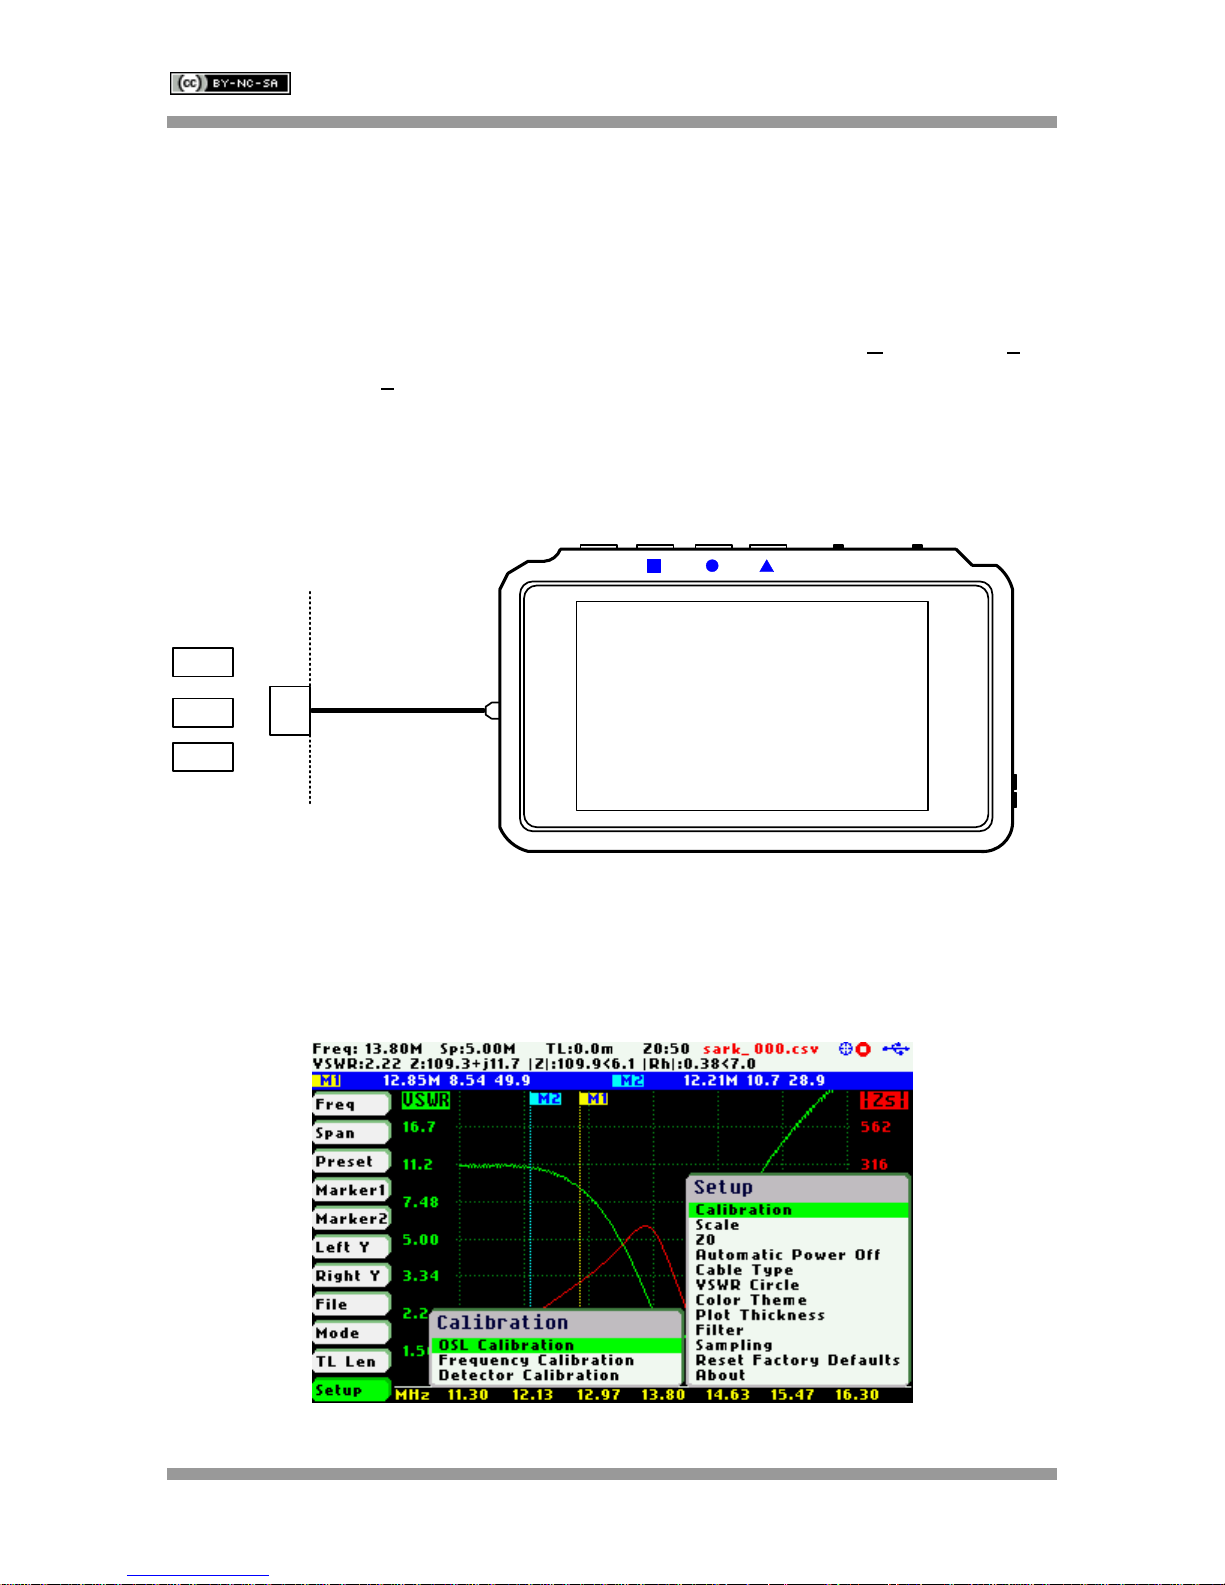
Calibration is performed by using a set of calibration plugs consisting of: an Open circuit, a Short
circuit and a calibrated Load having the same value as the reference impedance. These loads are
connected sequentially to the end of the test lead as instructed on the screen as described below.
Ø To set the reference impedance, please refer to Setup - Z0 in the chapter 4.12.
The place where these loads are connected during the calibration is called the Reference Plane.
The analyzer performs a series of measurements with these loads, calculating error coefficients that
are stored in a file that is automatically loaded each time the analyzer is run. These error coefficients
are used to correct the measured values.
The calibration operation is selected from the menus «Setup» «Calibration» «OSL Calibration».
Rev 1.1.7 October 29th, 2014 - 68 - © Melchor Varela – EA4FRB 2011-2014
Page 69
SteppIR SARK-110 User’s Manual
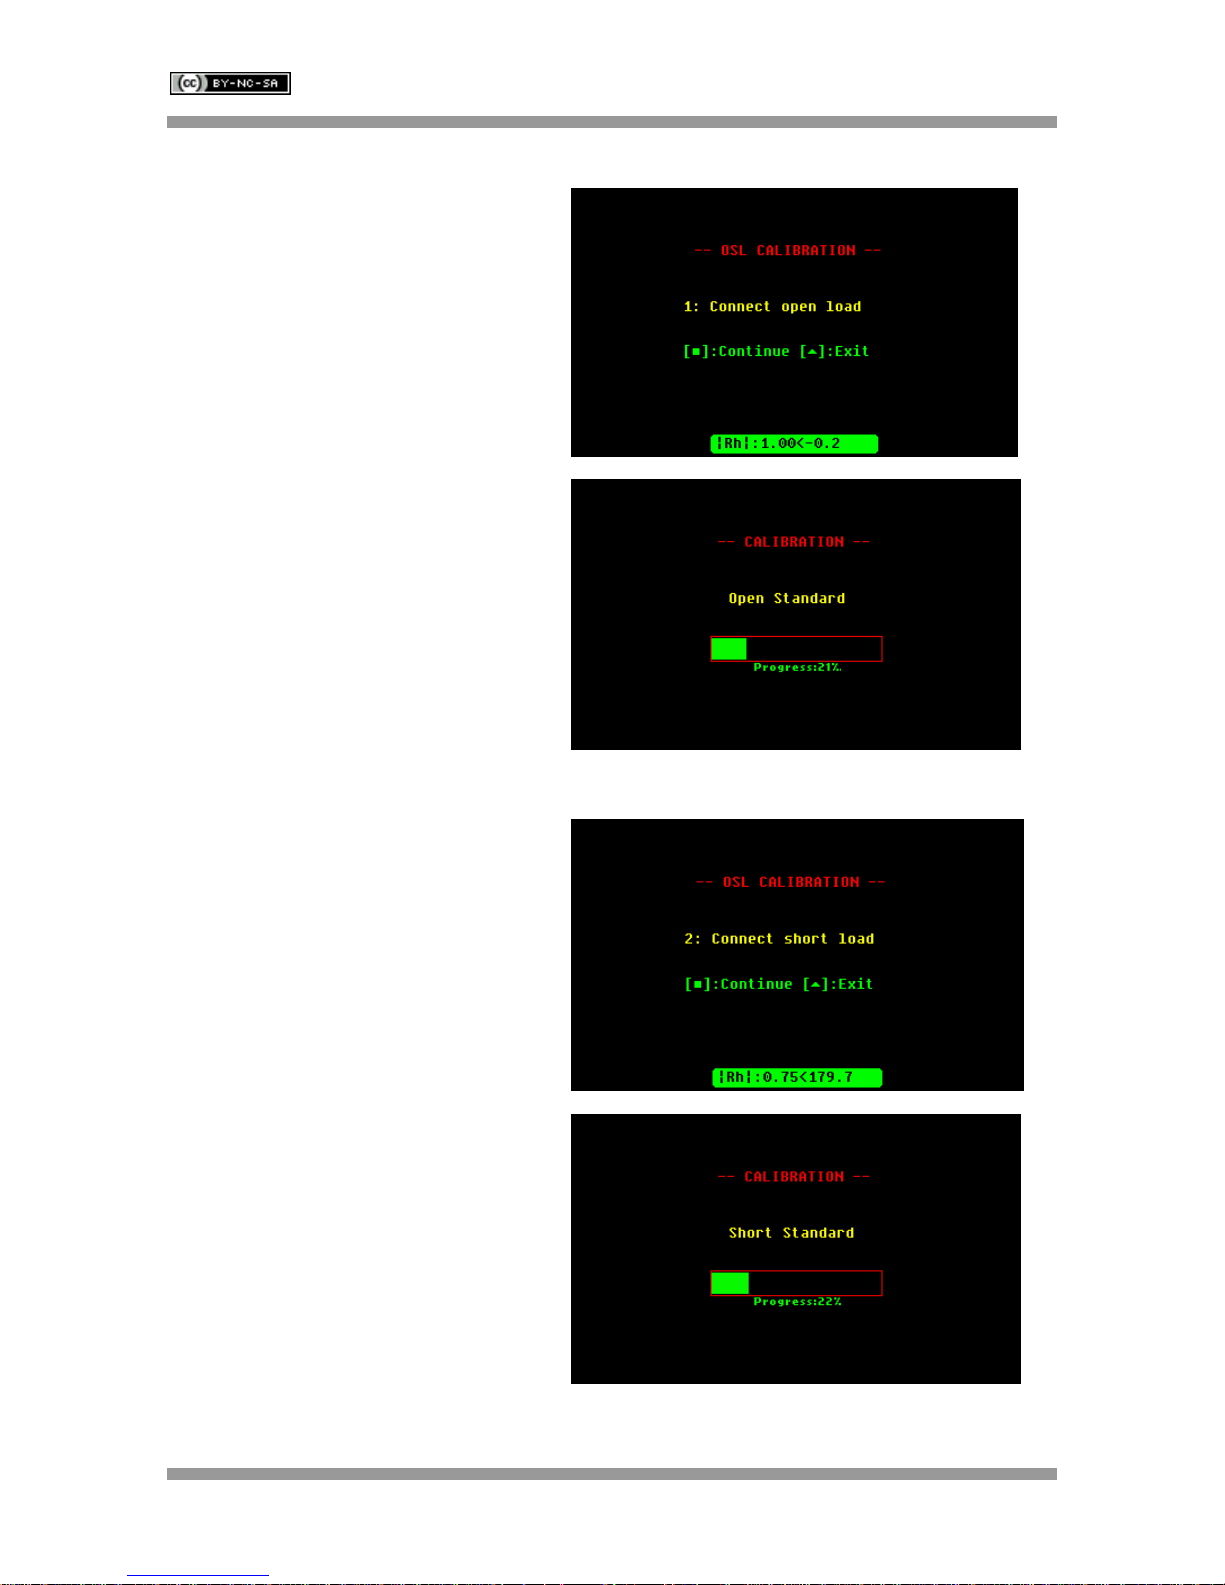
Connect the open load.
Press the appropriate button to continue, or
to exit.
The calibration progress will be shown in
the display bar.
Connect the short-circuit load.
Press the appropriate button to continue, or
to exit.
The calibration progress will be shown in
the display bar.
The calibration procedure is as follows:
Rev 1.1.7 October 29th, 2014 - 69 - © Melchor Varela – EA4FRB 2011-2014
Page 70
SteppIR SARK-110 User’s Manual
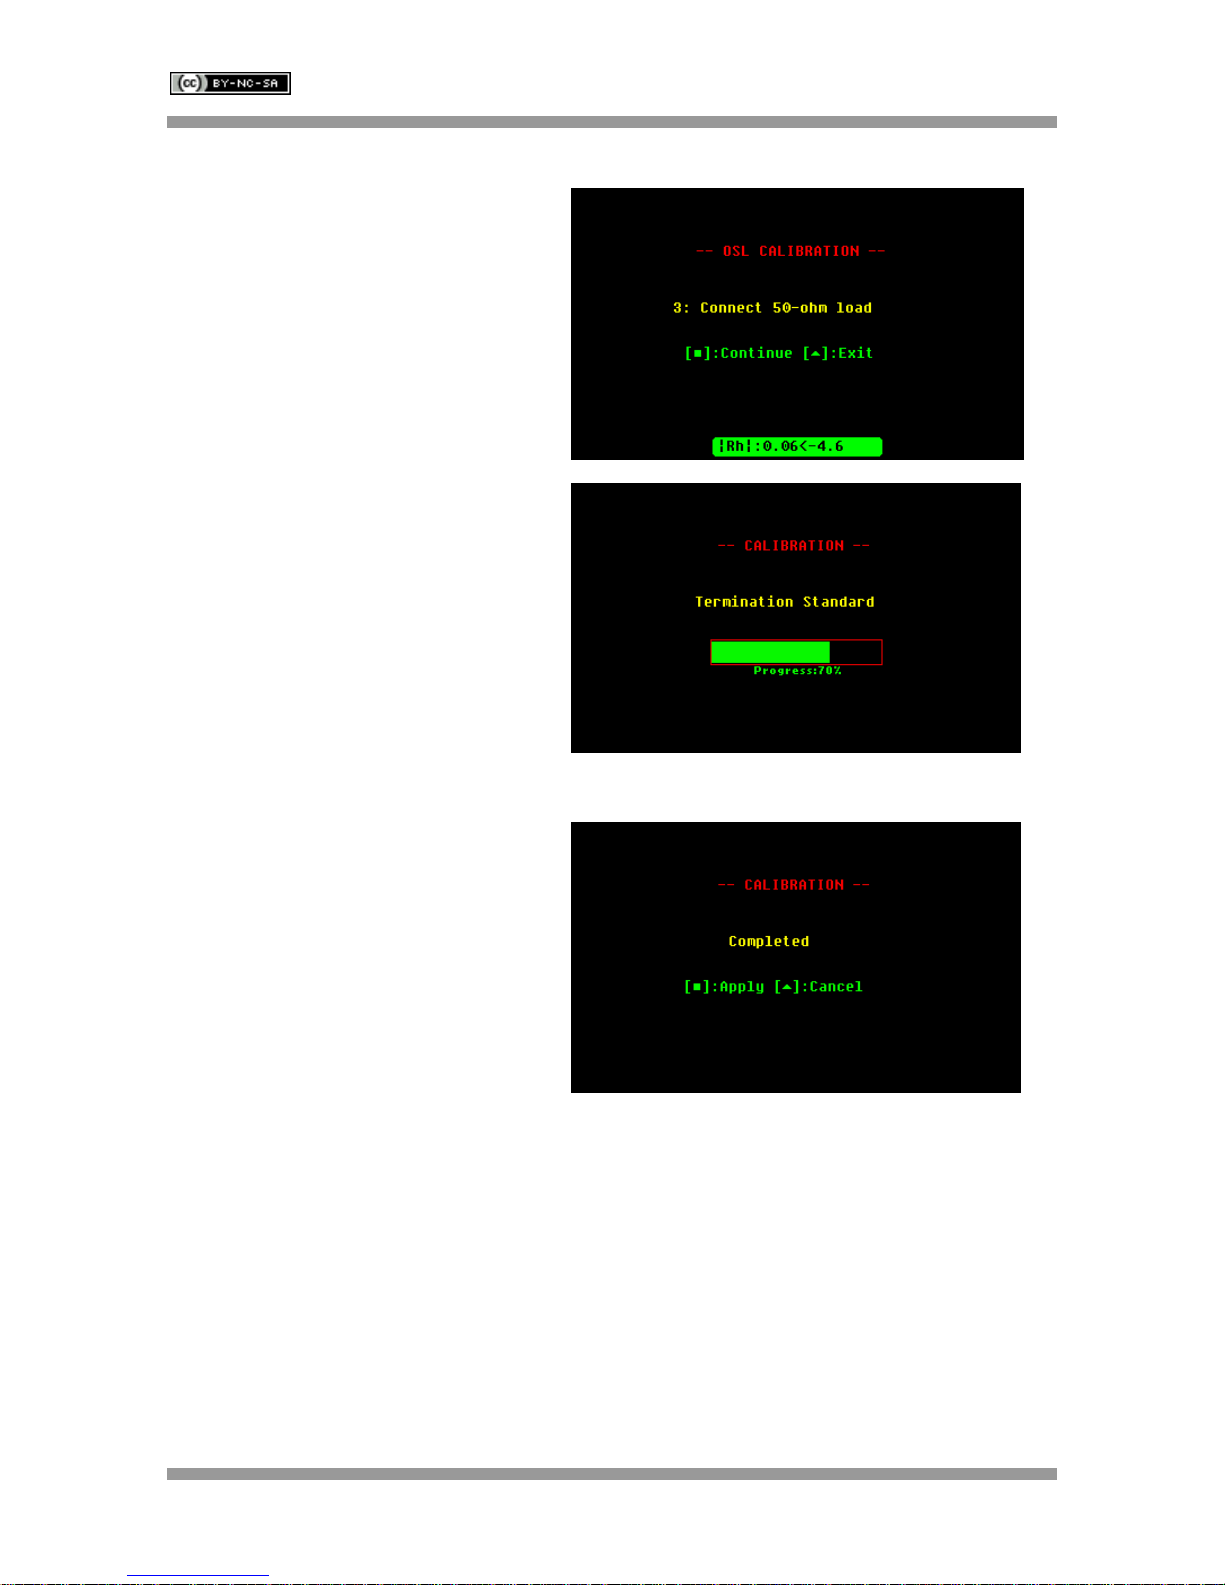
Connect the reference load.
Press the appropriate button to continue, or
to exit.
The calibration progress will be shown in
the display bar.
Press the appropriate button to apply the
new calibration settings, or to cancel them.
Rev 1.1.7 October 29th, 2014 - 70 - © Melchor Varela – EA4FRB 2011-2014
Page 71
SteppIR SARK-110 User’s Manual
Appendix E: Frequency Calibration
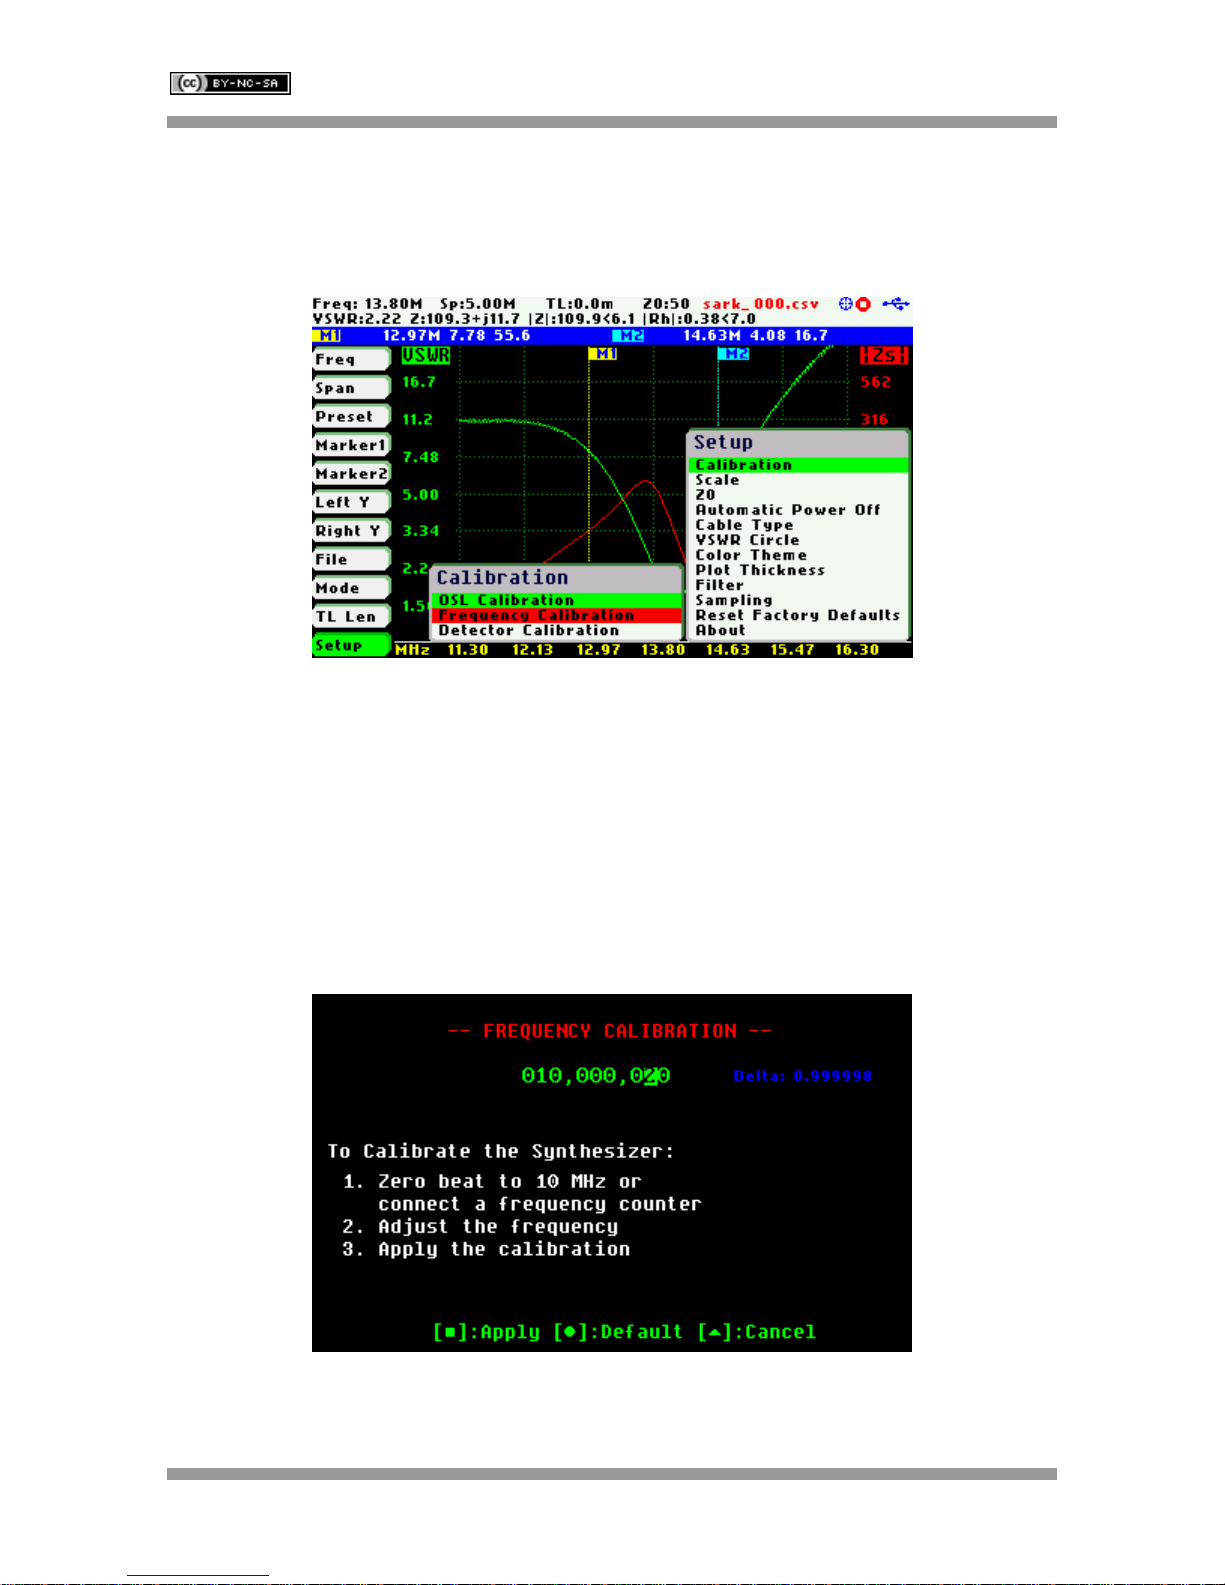
This setup permits the frequency synthesizer to be calibrated to 1 Hz. The calibration operation is
available at «Setup» «Calibration» «Frequency Calibration».
To calibrate the synthesizer, select «Frequency Calibration» from the «Calibration» submenu and
adjust the frequency while measuring it with an accurate frequency counter or, alternatively, zero-
beat it against WWV. Use Navigator B to change the frequency. The frequency will change
according to the current frequency multiplier that is highlighted in reverse video. Use Navigator A to
change the frequency multiplier position if needed. When an exact 10 MHz output is obtained, press
the Select [■] button to permanently store the setting.
Ø For best accuracy, allow the unit to be turned on for at least 10 or 15 minutes.
Press the Save Screen [●] button if the default setting needs to be restored.
Rev 1.1.7 October 29th, 2014 - 71 - © Melchor Varela – EA4FRB 2011-2014
Page 72
SteppIR SARK-110 User’s Manual
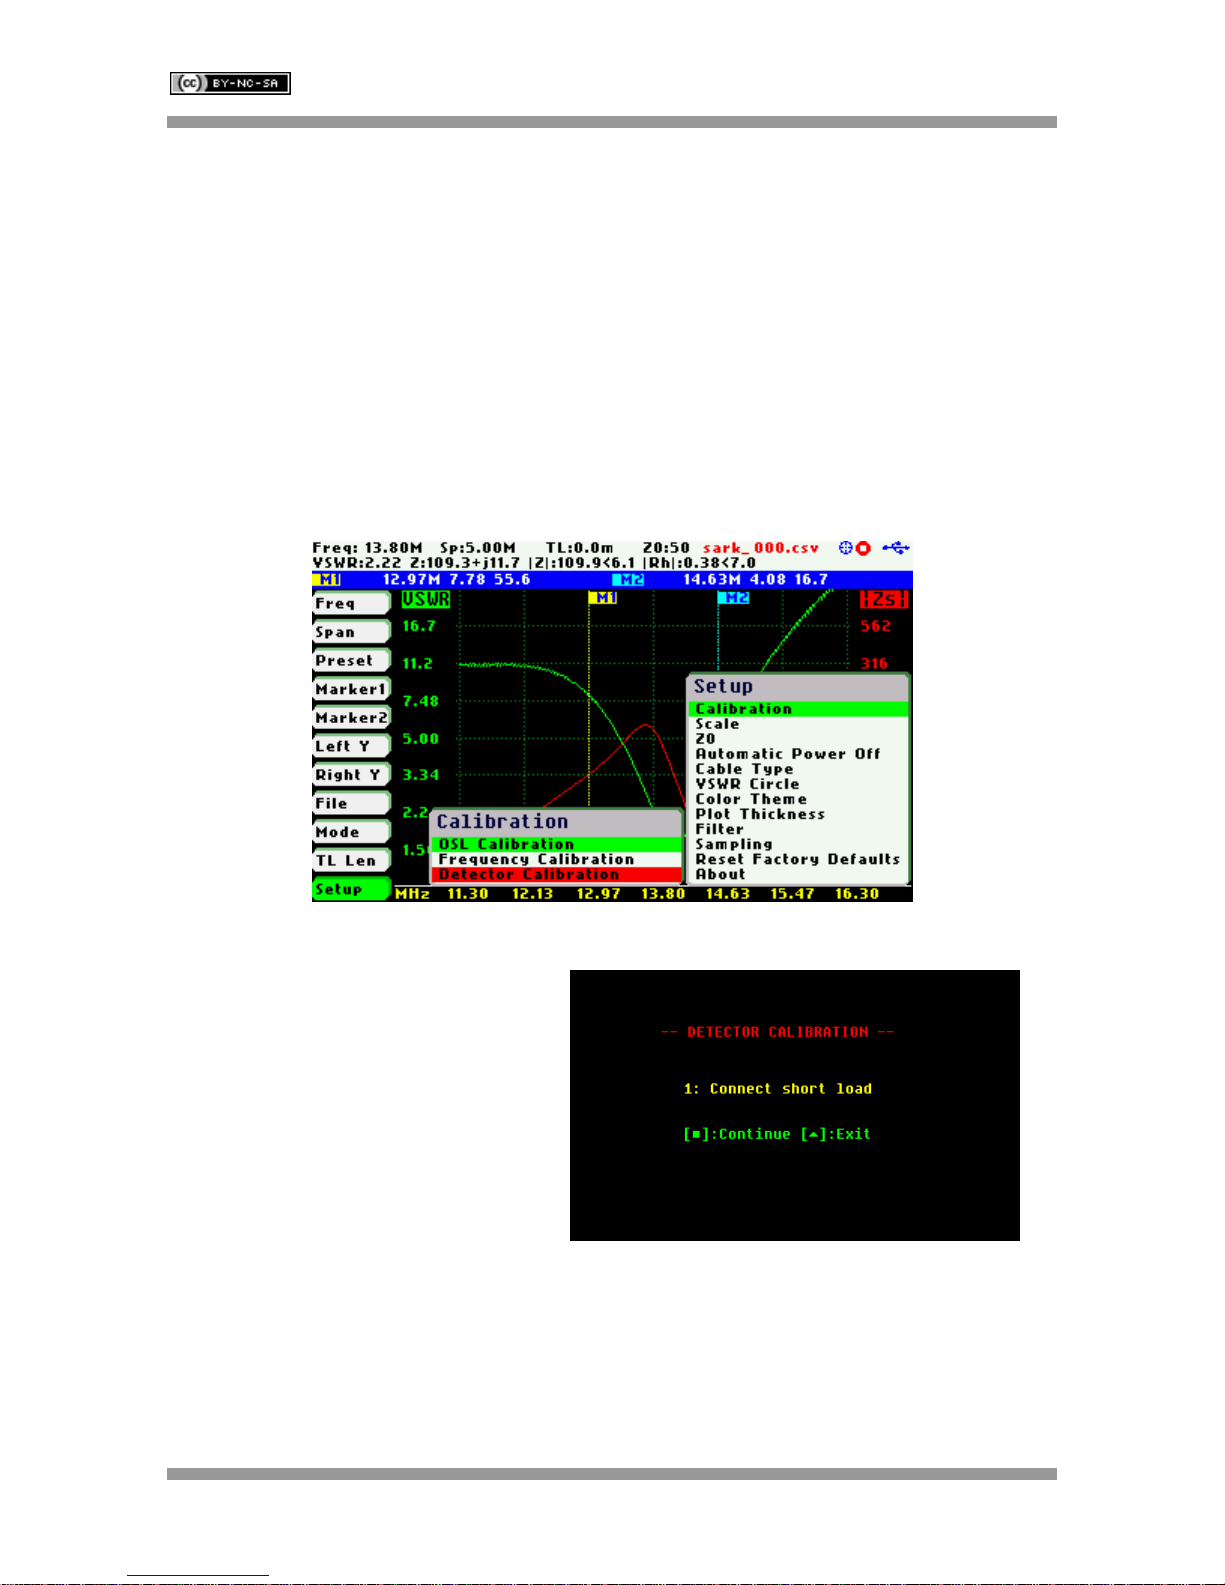
Connect the short load.
Press the appropriate button to continue, or
to exit.
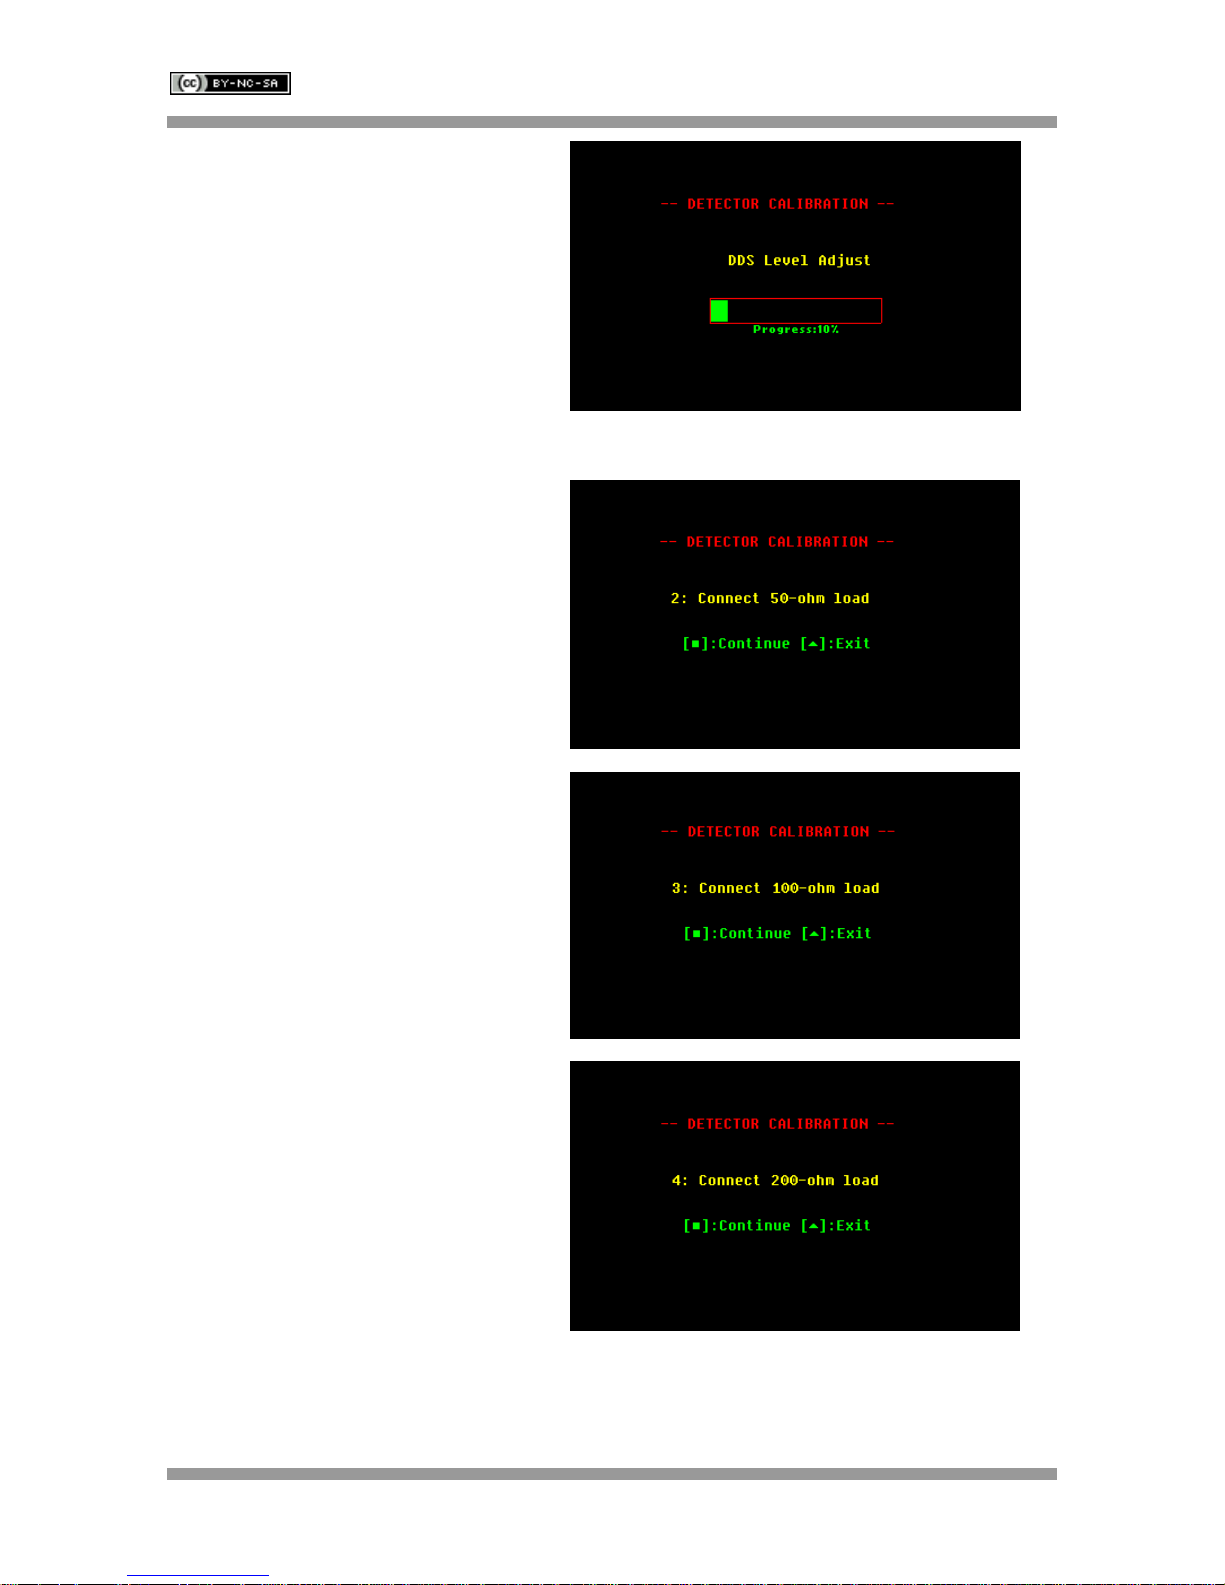
Appendix F: Detector Calibration
This procedure performs alignment of the SteppIR SARK-110’s internal measurement circuits. This
operation is done once at the factory and it is not necessary for the user to repeat it, but the
procedure is detailed for completeness.
The following test loads are required: 0, 50, 100, and 200-ohm. These loads need to be precise and
stable and should be properly implemented in order to have the least possible stray impedance.
Before performing this operation it is strongly recommended that the file containing the factory
results, detcalib.dat, is backed up to enable a restore, if needed.
The calibration operation is available at «Setup» «Calibration» «Detector Calibration».
The calibration procedure is as follows:
Rev 1.1.7 October 29th, 2014 - 72 - © Melchor Varela – EA4FRB 2011-2014
Page 73
SteppIR SARK-110 User’s Manual
The calibration progress will be shown in
the display bar.
Connect the 50-ohm load.
Press the appropriate button to continue, or
to exit.
Connect the 100-ohm load.
Press the appropriate button to continue, or
to exit.
Connect the 200-ohm load.
Press the appropriate button to continue, or
to exit.
Rev 1.1.7 October 29th, 2014 - 73 - © Melchor Varela – EA4FRB 2011-2014
Page 74
SteppIR SARK-110 User’s Manual
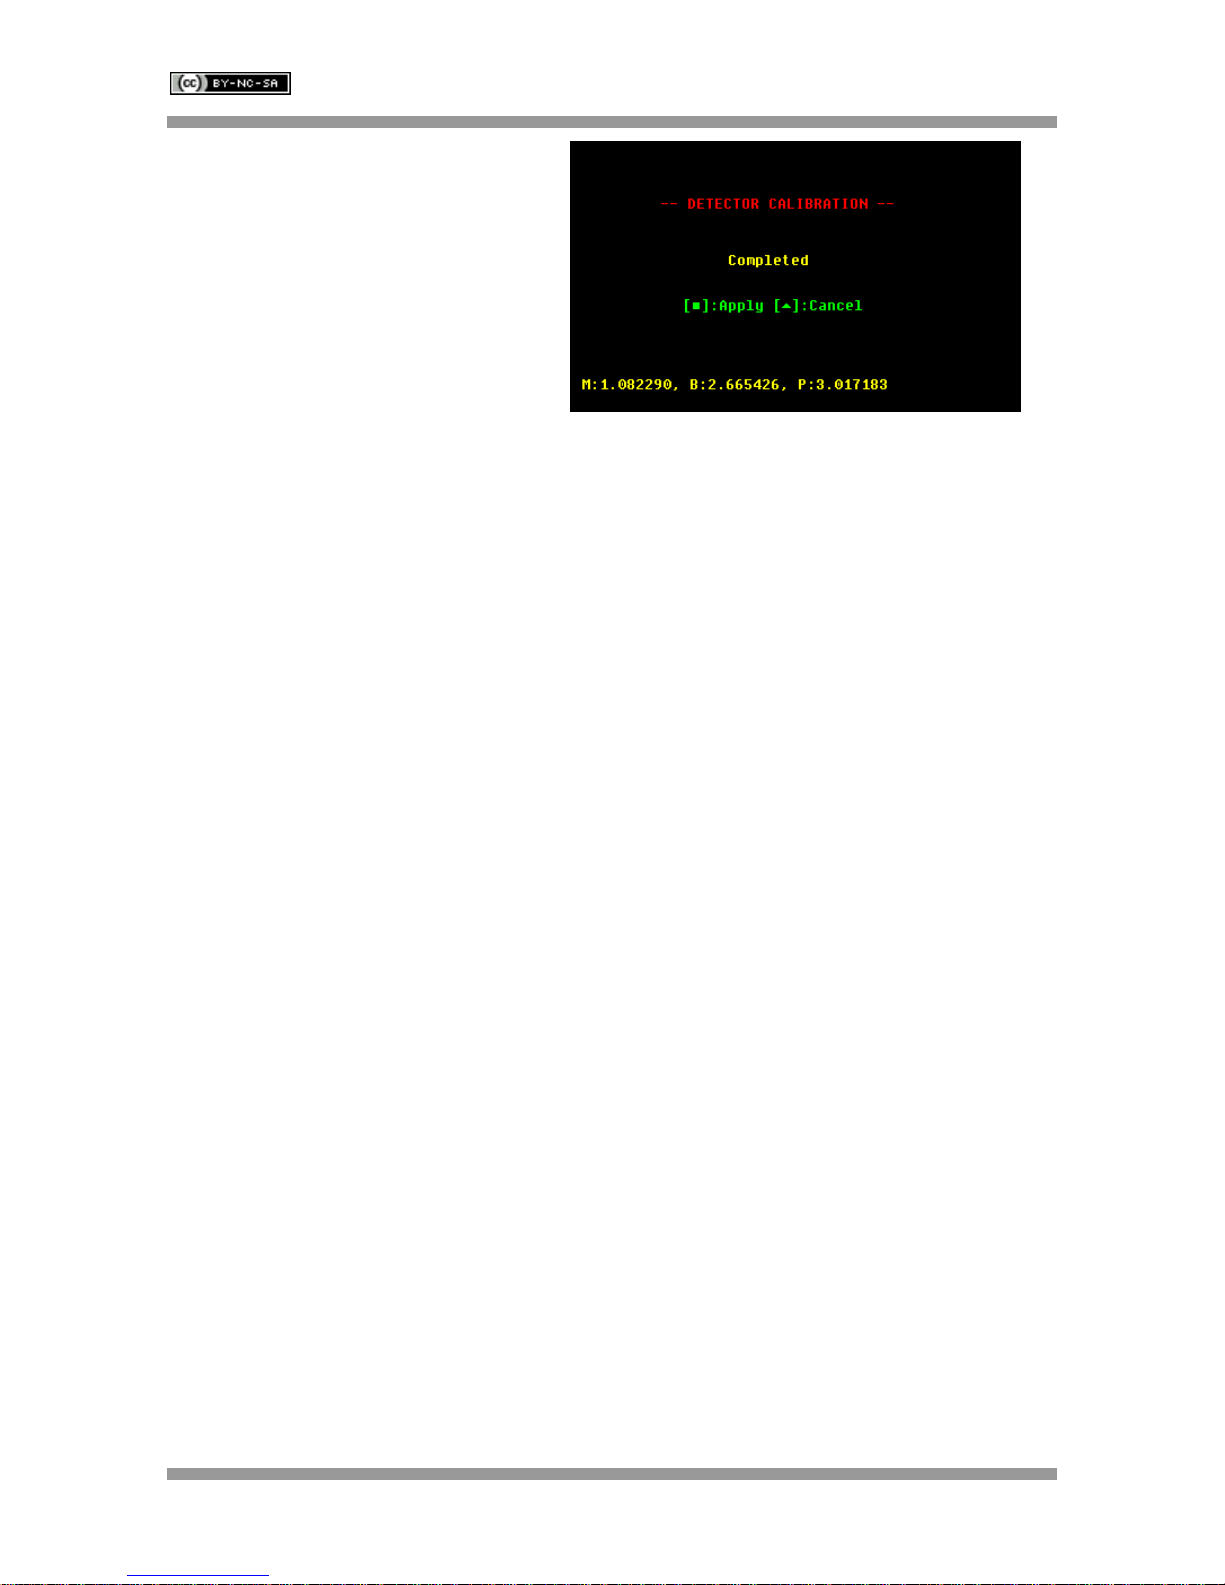
The calibration is completed.
The calibration coefficients are shown at
the bottom of the screen, for information.
Press the appropiate button to apply the
new calibration settings, or to cancel them.
Rev 1.1.7 October 29th, 2014 - 74 - © Melchor Varela – EA4FRB 2011-2014
Page 75

SteppIR SARK-110 User’s Manual
Appendix G: Frequency Presets File
Default frequency presets can be modified by the user by supplying a special text file stored on the
analyzer’s disk. The file name must be “presets.txt” and the format for each band entry in the file is
as follows:
legend, start_freq, stop_freq, def_mul_freq, def_mul_span, marker1_freq, marker2_freq
Where:
o legend: string to be displayed in the preset menu (max length: 20)
o start_freq: start frequency, specified in MHz
o stop_freq: stop frequency, specified in MHz
o def_mul_freq: default multiplier for setting the frequency
o def_mul_span: default multiplier for setting the span
o marker1_freq: default marker 1 frequency, specified in MHz
Example:
600M: 500 KHz, 0.1, 0.9, 3, 4, 0.2, 0.5
160M: 1.8 MHz, 1.3, 2.3, 4, 5, 1.8, 2.0
80M: 3.6 MHz, 1.6, 5.6, 5, 6, 3.5, 3.8
60M: 5.3 MHz, 3.3, 7.3, 5, 6, 5.2, 5.5
40M: 7.1 MHz, 5.1, 9.1, 5, 6, 7.0, 7.2
30M: 10.1 MHz, 8.1, 12.1, 5, 6, 10.1, 10.2
HF RFID: 13.5 MHz, 11.5, 15.5, 5, 6, 13.0, 14.0
20M: 14.2 MHz, 12.2, 16.2, 5, 6, 14.0, 14.4
17M: 18.1 MHz, 16.1, 20.1, 5, 6, 18.0, 18.2
15M: 21.2 MHz, 19.2, 23.2, 5, 6, 21.0, 21.5
12M: 24.9 MHz, 22.9, 26.9, 5, 6, 24.8, 25.0
11M: 27.8 MHz, 25.8, 29.8, 5, 6, 27.0, 28.0
10M: 29 MHz, 26.0, 32.0, 6, 7, 28.0, 29.7
6M: 51 MHz, 48.0, 54.0, 6, 7, 50.0, 52.0
4M: 70.1 MHz, 68.1, 72.1, 5, 6, 70.1, 70.2
2M: 145 MHz, 142.0, 148.0, 6, 7, 144.0, 146.0
Full HF, 0.1, 32.0, 6, 6, 10.0, 20.0
Full Span, 0.1, 230.0, 7, 7, 75.0, 150.0
o marker2_freq: default marker 2 frequency, specified in MHz
Rev 1.1.7 October 29th, 2014 - 75 - © Melchor Varela – EA4FRB 2011-2014
Page 76

SteppIR SARK-110 User’s Manual
Normal
Min
Max
Scale
Rs
10
1000
Log
Xs
-500
500
Linear
Rp
10
1000
Log
Xp
-500
500
Linear
|Zs|
10
1000
Log
<Zs
-100
100
Linear
VSWR
1.00
25.00
Log
RL
-40 0 Log
CL 0 20
Log
|Rho| 0 1.0
Linear
<Rho
-190
190
Linear
%Rp 0 100
Linear Q 0
20
Linear
Cs
-10000
10000
Linear
Ls
-100
100
Linear
Cp
-10000
10000
Linear
Lp
-100
100
Linear
High
Min
Max
Scale
Rs
10
5000
Log
Xs
-2500
2500
Linear
Rp
10
5000
Log
Xp
-2500
2500
Linear
|Zs|
10
5000
Log
<Zs
-100
100
Linear
VSWR
1.00
100.00
Log
RL
-60 0 Log
CL 0 30
Log
|Rho| 0 1.0
Linear
<Rho
-190
190
Linear
%Rp 0 100
Linear Q 0
50
Linear
Cs
-100000
100000
Linear
Ls
-1000
1000
Linear
Cp
-100000
100000
Linear
Lp
-1000
1000
Linear
Low
Min
Max
Scale
Rs 0 250
Linear
Xs
-125
125
Linear
Rp 0 250
Linear
Xp
-125
125
Linear
|Zs| 0 250
Linear
<Zs
-100
100
Linear
VSWR
1.00
10.00
Log
RL
-20 0 Log
CL 0 10
Log
|Rho| 0 1.0
Linear
<Rho
-190
190
Linear
%Rp 0 100
Linear Q 0
20
Linear
Cs
-1000
1000
Linear
Ls
-10
10
Linear
Cp
-1000
1000
Linear
Lp
-10
10
Linear
Appendix H: Scale Presets
Following tables show the default scale presets:
Rev 1.1.7 October 29th, 2014 - 76 - © Melchor Varela – EA4FRB 2011-2014
Page 77

SteppIR SARK-110 User’s Manual
Default scale presets can be modified by the user by supplying special text files stored on the
analyzer’s disk. The file names for each of the scales have to be the following:
«Scale» «Normal» “scal_def.txt”
«Scale» «High» “scal_hig.txt”
«Scale» «Low» “scal_low.txt”
«Scale» «Auto» “scal_aut.txt”
The files must contain an entry for each parameter with the following syntax:
min,max,log {Y,N}
Note that logarithmic scales do not accept negative ranges.
Example (file name “scal_def.txt”):
10,1000,Y #Rs
-500,500,N #Xs
10,1000,Y #Rp
-500,500,N #Xp
10,1000,Y #|Zs|
-100,100,N #<Zs
1.00,25.00,Y #VSWR
-40,0,N #RL
0,20,N #CL
0,1.0,N #|Rho|
-190,190,N #<Rho
0,100,N #%Rp
0,20,N #Q
-10000,10000,N #Cs
-100,100,N #Ls
-10000,10000,N #Cp
-100,100,N #Lp
Rev 1.1.7 October 29th, 2014 - 77 - © Melchor Varela – EA4FRB 2011-2014
Page 78

SteppIR SARK-110 User’s Manual
Appendix I: Custom Cable Settings
The SteppIR SARK-110 allows the user to specify three custom cable settings by supplying a
special text file stored on the analyzer’s disk. The file name must be “custcab.txt” and the format for
each cable entry in the file is as follows:
legend, Z0, VF, K0, K1, K2
Where:
o legend: string to be display in the preset menu (max length: 20)
o Z0: characteristic impedance
o VF: velocity factor
o K0: DC resistance, dB/100ft
o K1: coefficient for conductor loss, dB/100ft
o K2: coefficient for dielectric loss, dB/100ft
Example:
Test cable 1, 50, 0.68, 0.063897, 0.192292, 0.000051
Test cable 2, 60, 0.78, 0.073897, 0.193292, 0.000061
Test cable 3, 70, 0.88, 0.083897, 0.194292, 0.000071
Rev 1.1.7 October 29th, 2014 - 78 - © Melchor Varela – EA4FRB 2011-2014
 Loading...