

ST STTH6004W User Manual
®
Table 1: Main product characteristics
I
F(AV)
V
RRM
T
(max)
j
V
F
(max)
t
rr
(typ)
60 A
400 V
175 °C
0.83 V
50 ns
Features and benefits
■ Ultrafast switching
■ Low reverse current
■ Low thermal resistance
■ Reduces switching & conduction losses
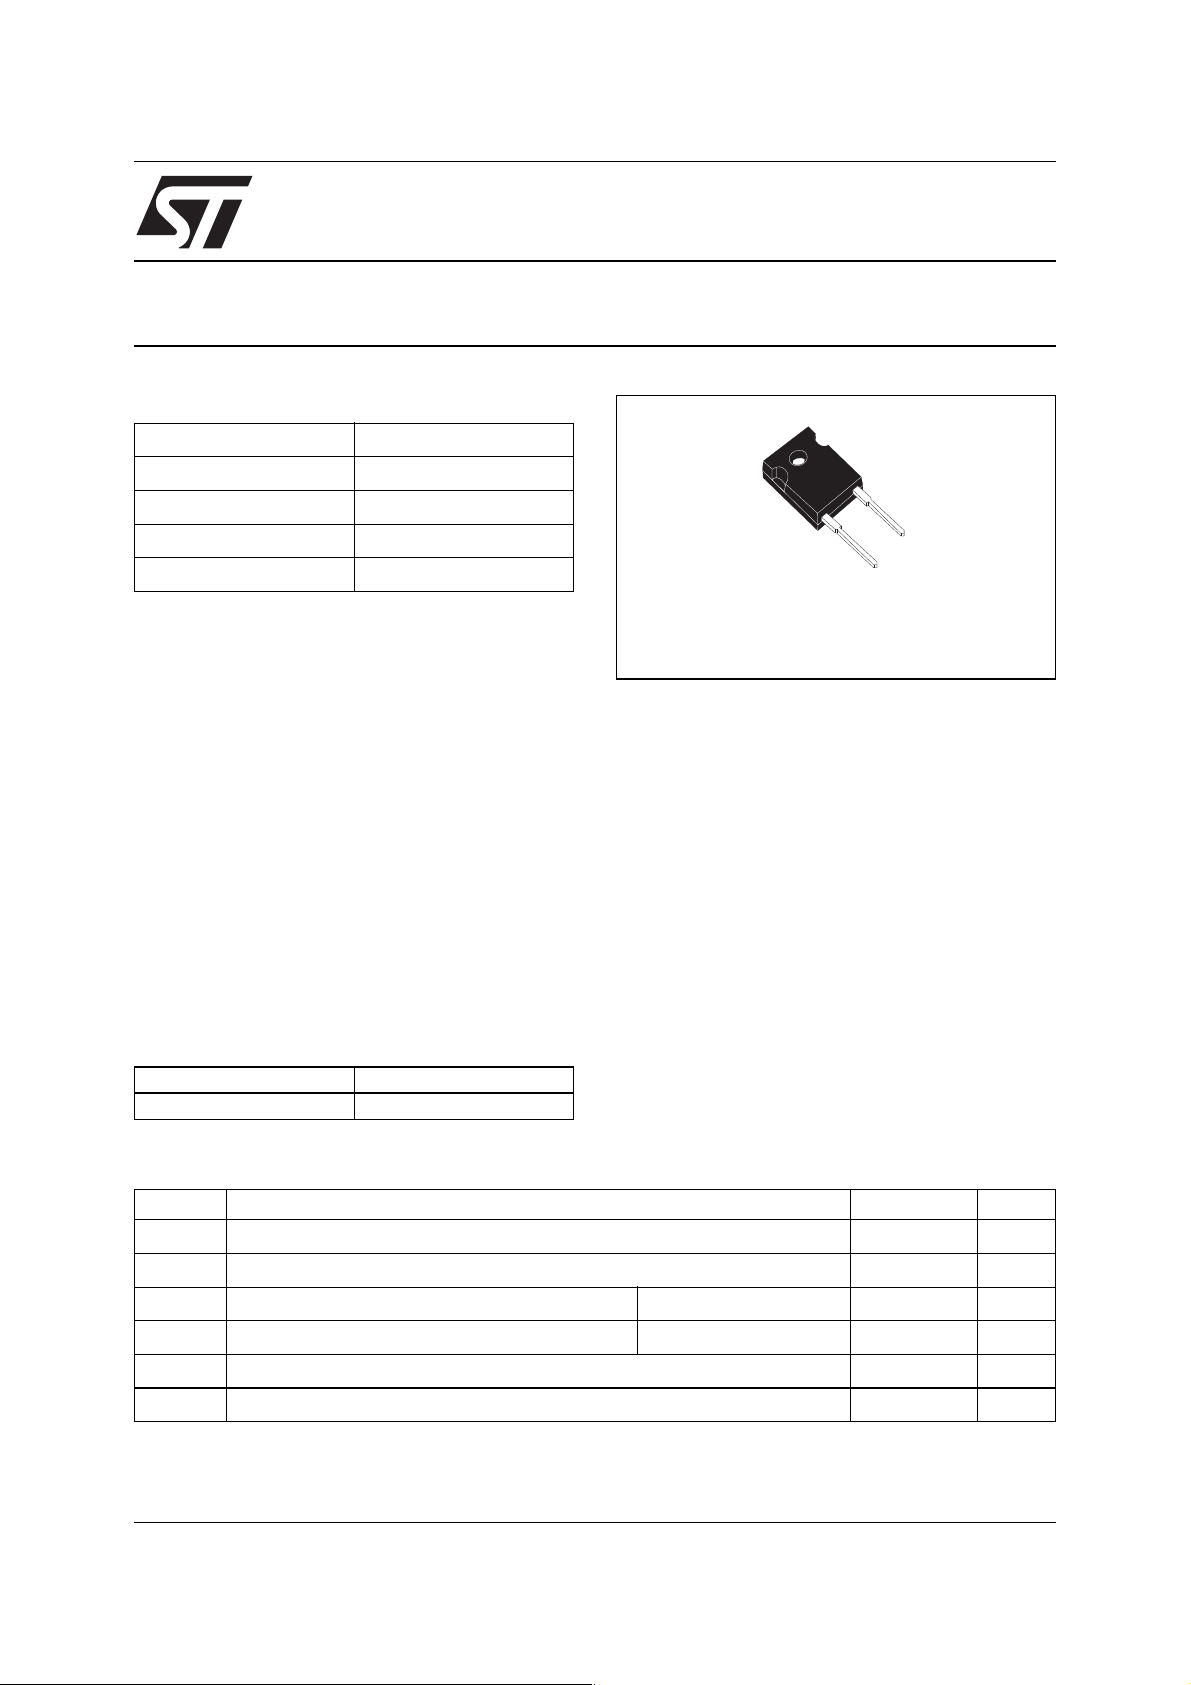
Description
The STTH6004W uses ST 400V technology and
is specially suited for use in switching power
supplies, welding equipment and industrial
applications, as an output rectification diode.
STTH6004W
Ultrafast high voltage rectifier
A
K
DO-247
STTH6004W
Table 2: Order codes
Part number Marking
STTH6004W STTH6004W
Table 3: Absolute ratings (limiting values)
Symbol Parameter Value Unit
V
RRM
I
F(RMS)
I
F(AV)
I
FSM
T
T
October 2005 REV. 1
Repetitive peak reverse voltage 400 V
RMS forward current 90 A
Average forward current Tc = 125 °C δ = 0.5 60 A
Surge non repetitive forward current tp = 10 ms sinusoidal 600 A
Storage temperature range -65 to + 175 °C
stg
Maximum operating junction temperature 175 °C
j
1/6
STTH6004W
Table 4: Thermal Resistance
Symbol Parameter Value (max). Unit
R
th(j-c)
Table 5: Static electrical characteristics
Symbol Parameter Test conditions Min. Typ Max. Unit
I
R
V
F
Pulse test: * tp = 5 ms, δ < 2%
To evaluate the conduction losses use the following equation: P = 0.8 x I
Table 6: Dynamic characteristics
Symbol Parameter Test conditions Min Typ Max Unit
t
I
RM
S
factor
t
V
FP
Junction to case 0.70 °C/W
* Reverse leakage current Tj = 25 °C VR = V
= 150 °C 100 1000
T
j
RRM
50 µA
** Forward voltage drop Tj = 25 °C IF = 60 A 1.2 V
= 150 °C 0.83 1.0
T
j
= 380 µs, δ < 2%
** t
p
+ 0.0033 I
Reverse recovery
rr
time
Reverse recovery
current
Tj = 25 °C IF = 1 A dIF/dt = 50 A/µs VR =30 V 66 90 ns
= 1 A dIF/dt = 200 A/µs VR =30 V 36 50
I
F
Tj = 125 °C IF = 60 A VR = 200 V
/dt = 100 A/µs
dI
F
Softness factor Tj = 125 °C IF = 60 A VR = 200 V
/dt = 100 A/µs
dI
F
Forward recovery
fr
time
Forward recovery
voltage
Tj = 25 °C IF = 60 A dIF/dt = 200 A/µs
V
= 1.1 x V
FR
Tj = 25 °C IF = 60 A dIF/dt = 200 A/µs
V
= 1.1 x V
FR
F(AV)
Fmax
Fmax
F2(RMS)
15 A
0.4
600 ns
3.2 V
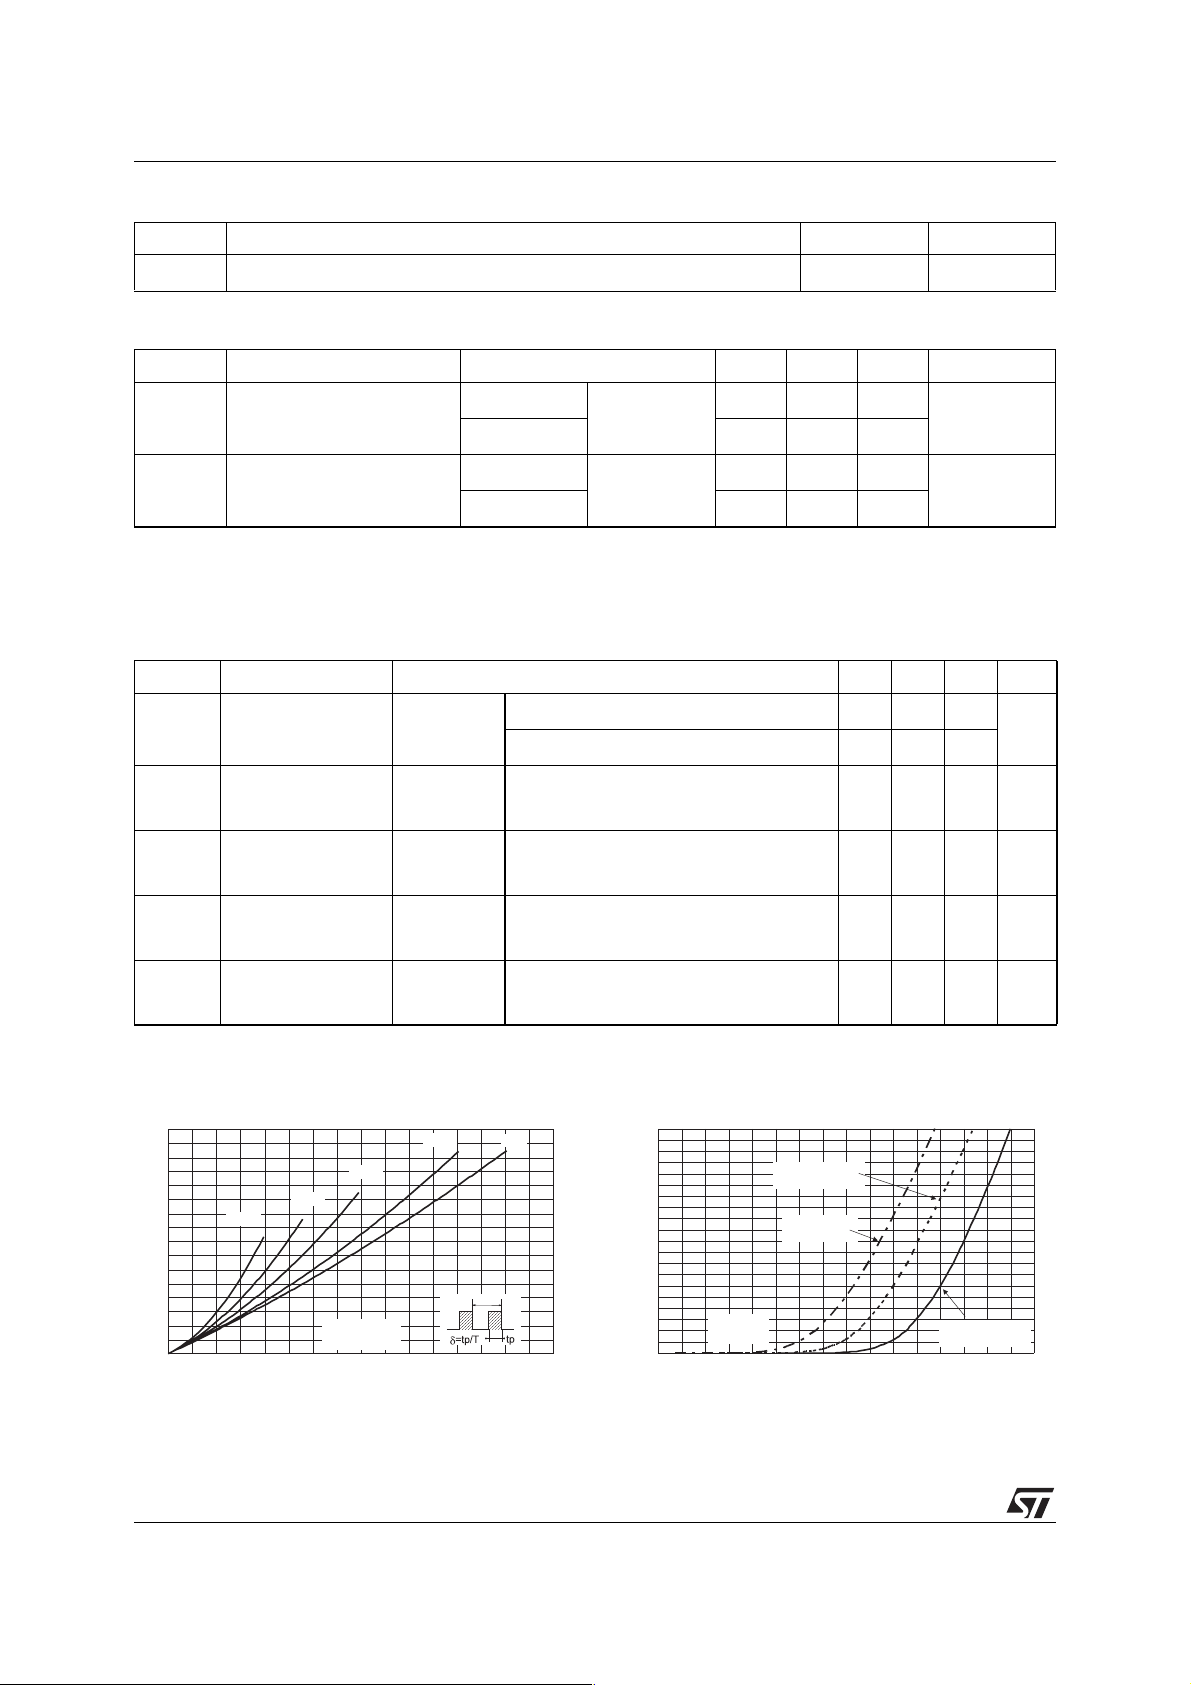
Figure 1: Conduction losses versus average
forward current
P(W)
80
70
60
50
40
30
20
10
0
0 1020304050607080
d=0.05
d=0.1
I
F(AV)
d=0.2
2/6
(A)
d=0.5
d=1
T
Figure 2: Forward voltage drop versus forward
current
I
(A)
FM
200
180
160
140
120
100
80
60
40
20
0
0.0 0.2 0.4 0.6 0.8 1.0 1.2 1.4 1.6
VFM(V)
TJ=150°C
(Maximum values)
TJ=150°C
(Typical values)
TJ=25°C
(Maximum values)
 Loading...