

ST STPS8H100 User Manual
June 2006 Rev 10 1/9
9
STPS8H100
High voltage power Schottky rectifier
Main product characteristics
Features and benefits
■ Negligible switching losses
■ High junction temperature capability
■ Low leakage current
■ Good trade off between leakage current and
forward voltage drop
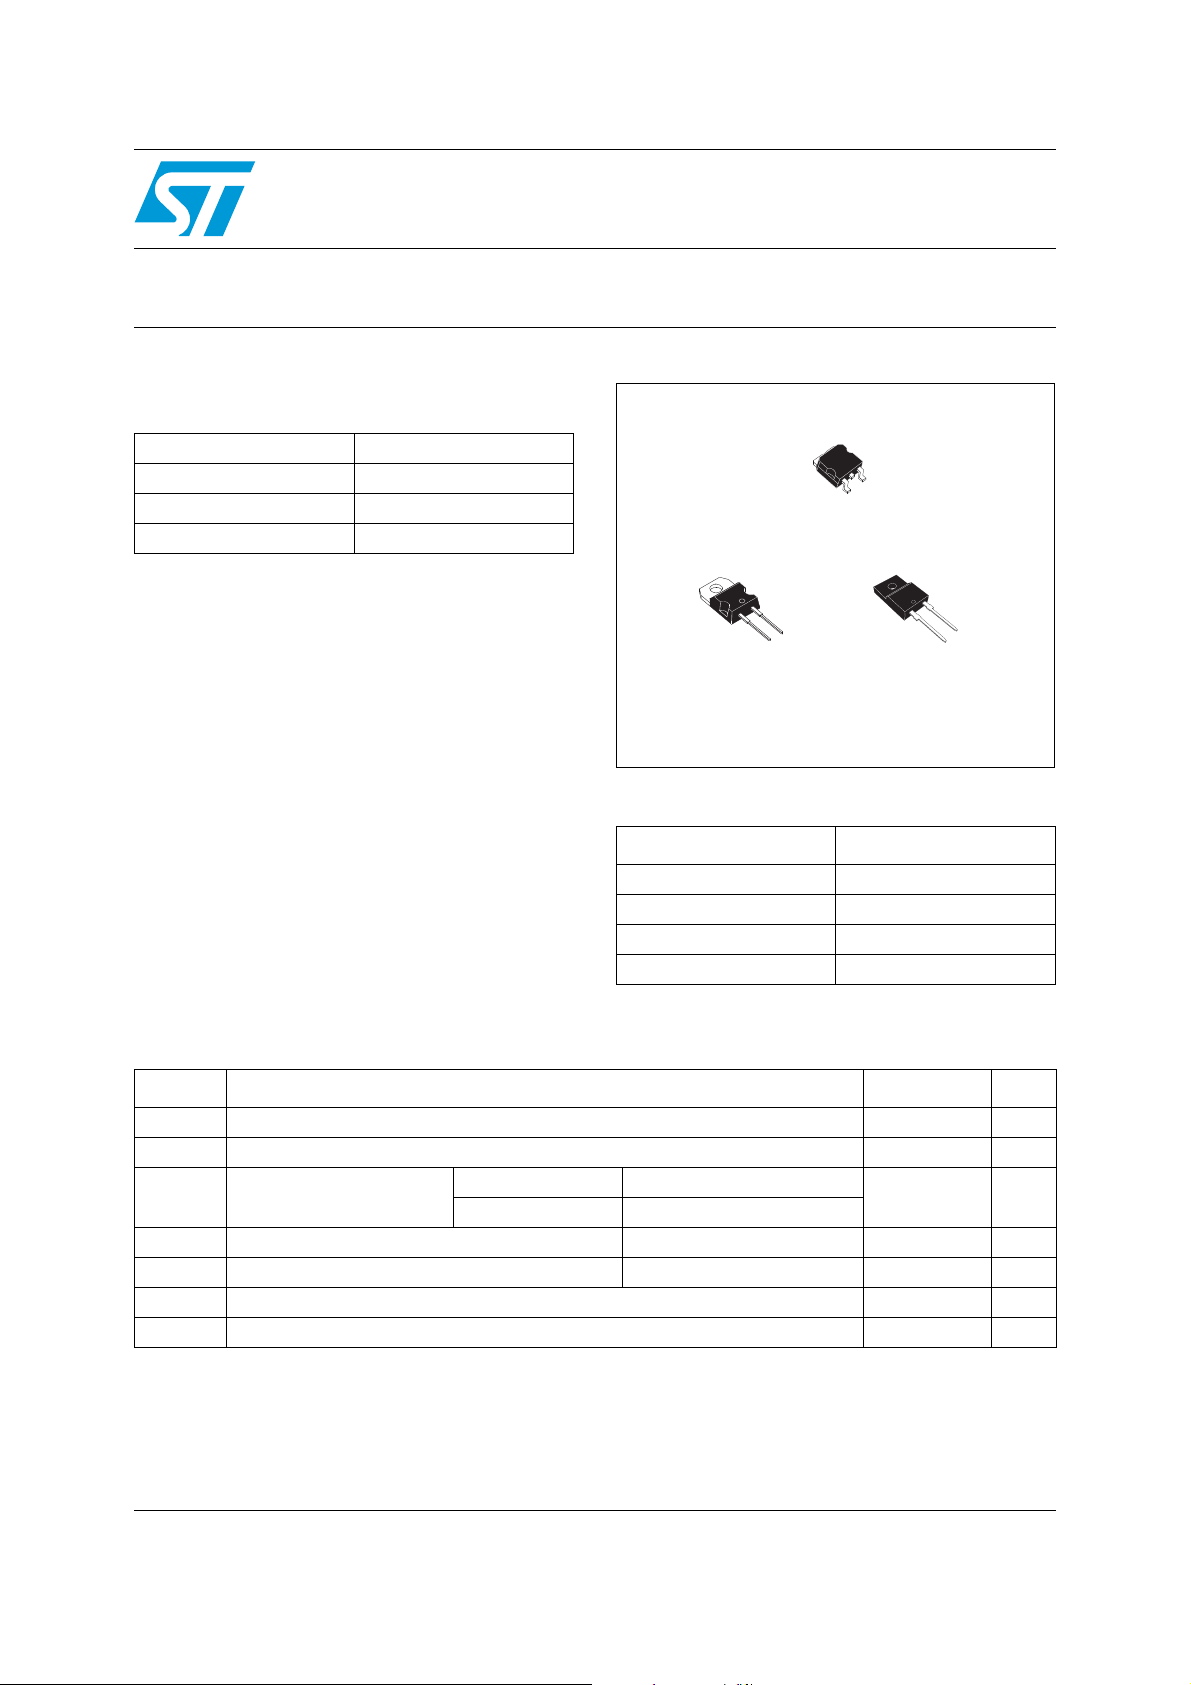
■ Insulated package:
– TO-220FPAC
Insulating voltage = 2000 V DC
Typical package capacitance = 12 pF
■ Avalanche capability specified
Description
Schottky barrier rectifier designed for high
frequency compact Switched Mode Power
Supplies such as adaptators and on board
DC/DC converters.
Order Codes
I
F(AV)
8 A
V
RRM
100 V
T
j
175° C
V
F
(max) 0.58 V
Part Number Marking
STPS8H100D STPS8H100D
STPS8H100G STPS8H100G
STPS8H100G-TR STPS8H100G
STPS8H100FP STPS8H100FP
K
A
NC
K
A
K
A
D
2
PAK
STPS8H100G
TO-220FPAC
STPS8H100FP
TO-220AC
STPS8H100D
Table 1. Absolute ratings (limiting values)
Symbol Parameter Value Unit
V
RRM
Repetitive peak reverse voltage 100
V
I
F(RMS)
RMS forward voltage 30
A
I
F(AV)
Average forward current
δ = 0.5
TO-220AC, D
2
PA K T
C
= 165° C
8
A
DO-15 T
C
= 150° C
I
FSM
Surge non repetitive forward current t
p
= 10 ms sinusoidal 250
A
P
ARM
Repetitive peak avalanche power t
p
= 1 µs T
j
= 25° C 10800
W
T
stg
Storage temperature range -65 to + 175 ° C
T
j
Maximum operating junction temperature 175 ° C
www.st.com
Characteristics STPS8H100
2/9
1 Characteristics
To evaluate the conduction losses use the following equation:
P = 0.48 x I
F(AV)
+ 0.0125 I
F
2
(RMS)
Table 2. Thermal resistance
Symbol Parameter Value Unit
R
th(j-c)
Junction to case
TO-220AC, D
2
PA K 1 . 6
° C/W
TO-220FPAC 4
Table 3. Static electrical characteristics (per diode)
Symbol Parameter Tests conditions Min. Typ Max. Unit
I
R
(1)
Reverse leakage current
T
j
= 25° C
V
R
= V
RRM
4.5 µA
T
j
= 125° C 2 6.0 mA
V
F
(2)
Forward voltage drop
T
j
= 25° C
I
F
= 8 A
0.71
V
T
j
= 125° C 0.56 0.58
T
j
= 25° C
I
F
= 10 A
0.77
T
j
= 125° C 0.59 0.64
T
j
= 25° C
I
F
= 16 A
0.81
T
j
= 125° C 0.65 0.68
1. t
p
= 5 ms, δ < 2%
2. t
p
= 380 µs, δ < 2%
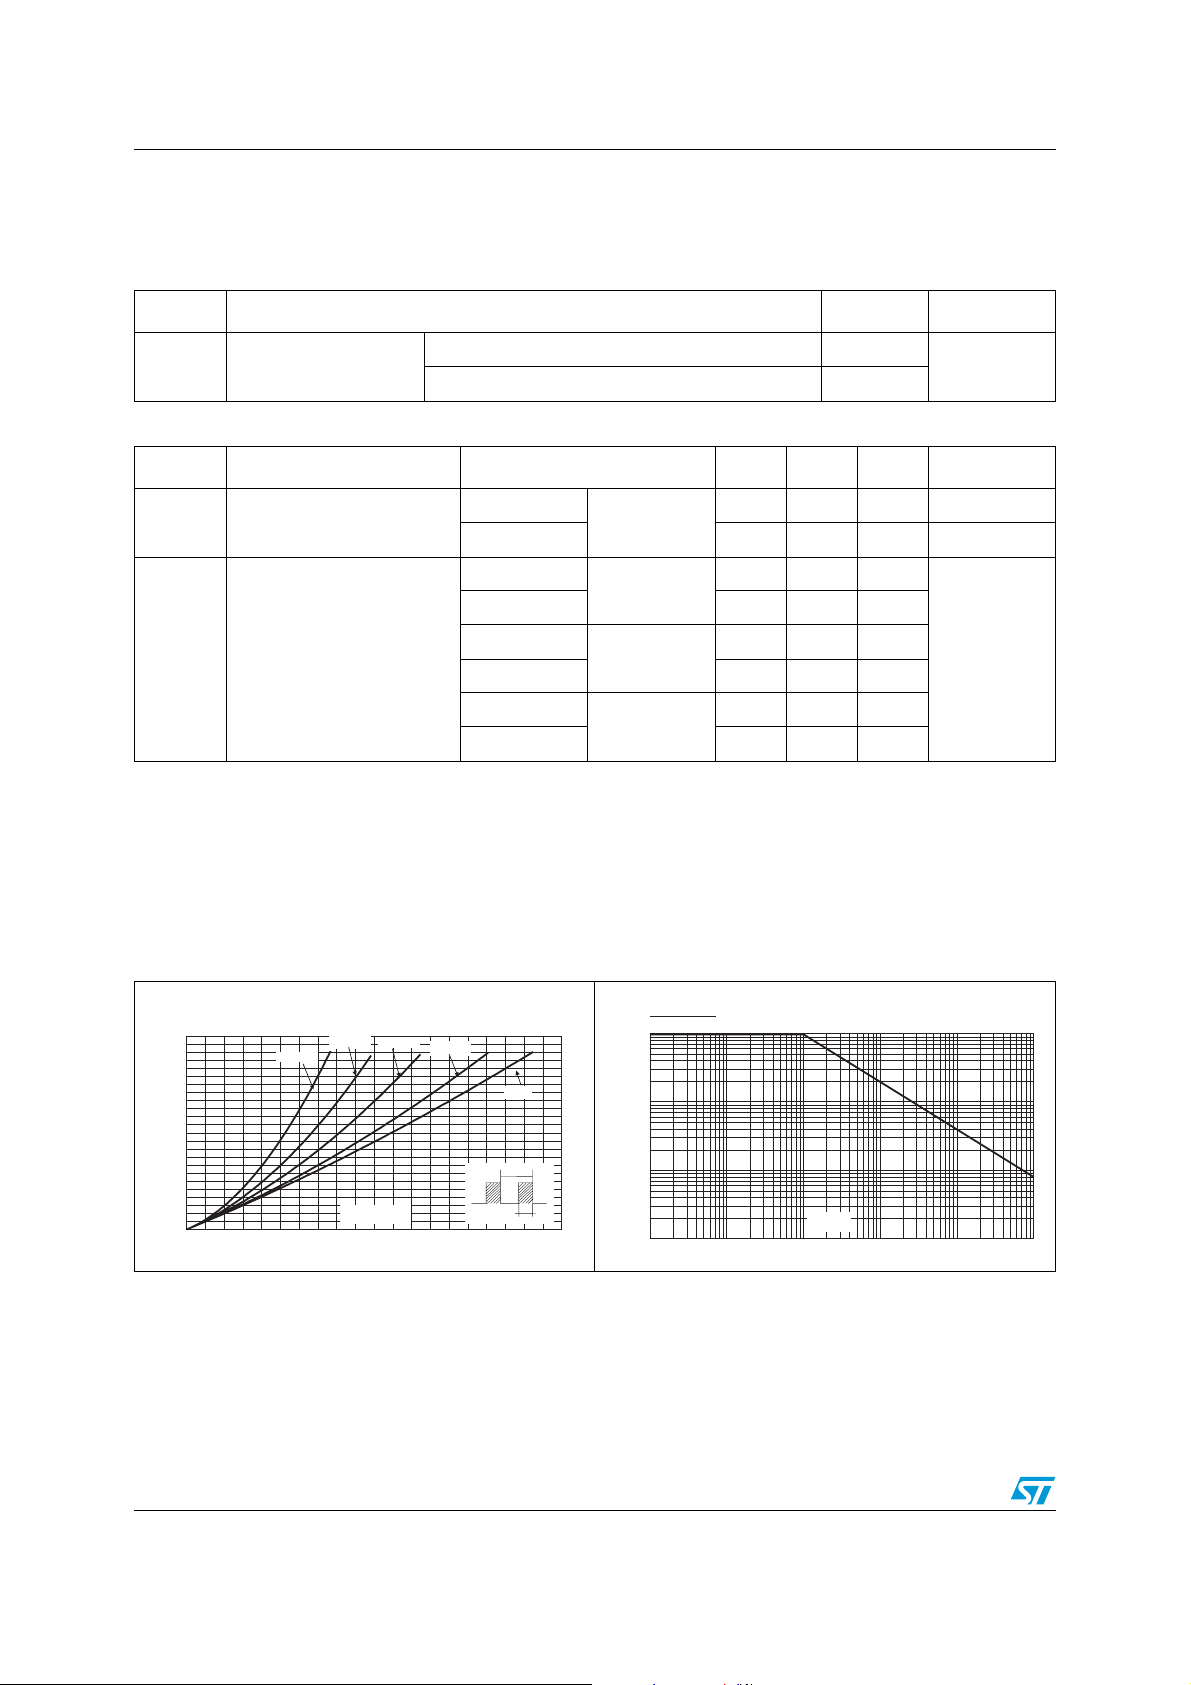
Figure 1. Average forward power
dissipation versus average
forward current
Figure 2. Normalized avalanche power
derating versus pulse duration
012345678910
0.0
0.5
1.0
1.5
2.0
2.5
3.0
3.5
4.0
4.5
5.0
5.5
6.0
I (A)
F(av)
P (W)
F(av)
δ = 0.2
δ = 0.5
δ = 1
δ = 0.05
δ = 0.1
T
δ
=t
p
/T
=t
p
/T
t
p
t
p
0.001
0.01
0.10.01 1
0.1
10 100 1000
1
t (µs)
p
P(t)
P (1µs)
ARM p
ARM
STPS8H100 Characteristics
3/9
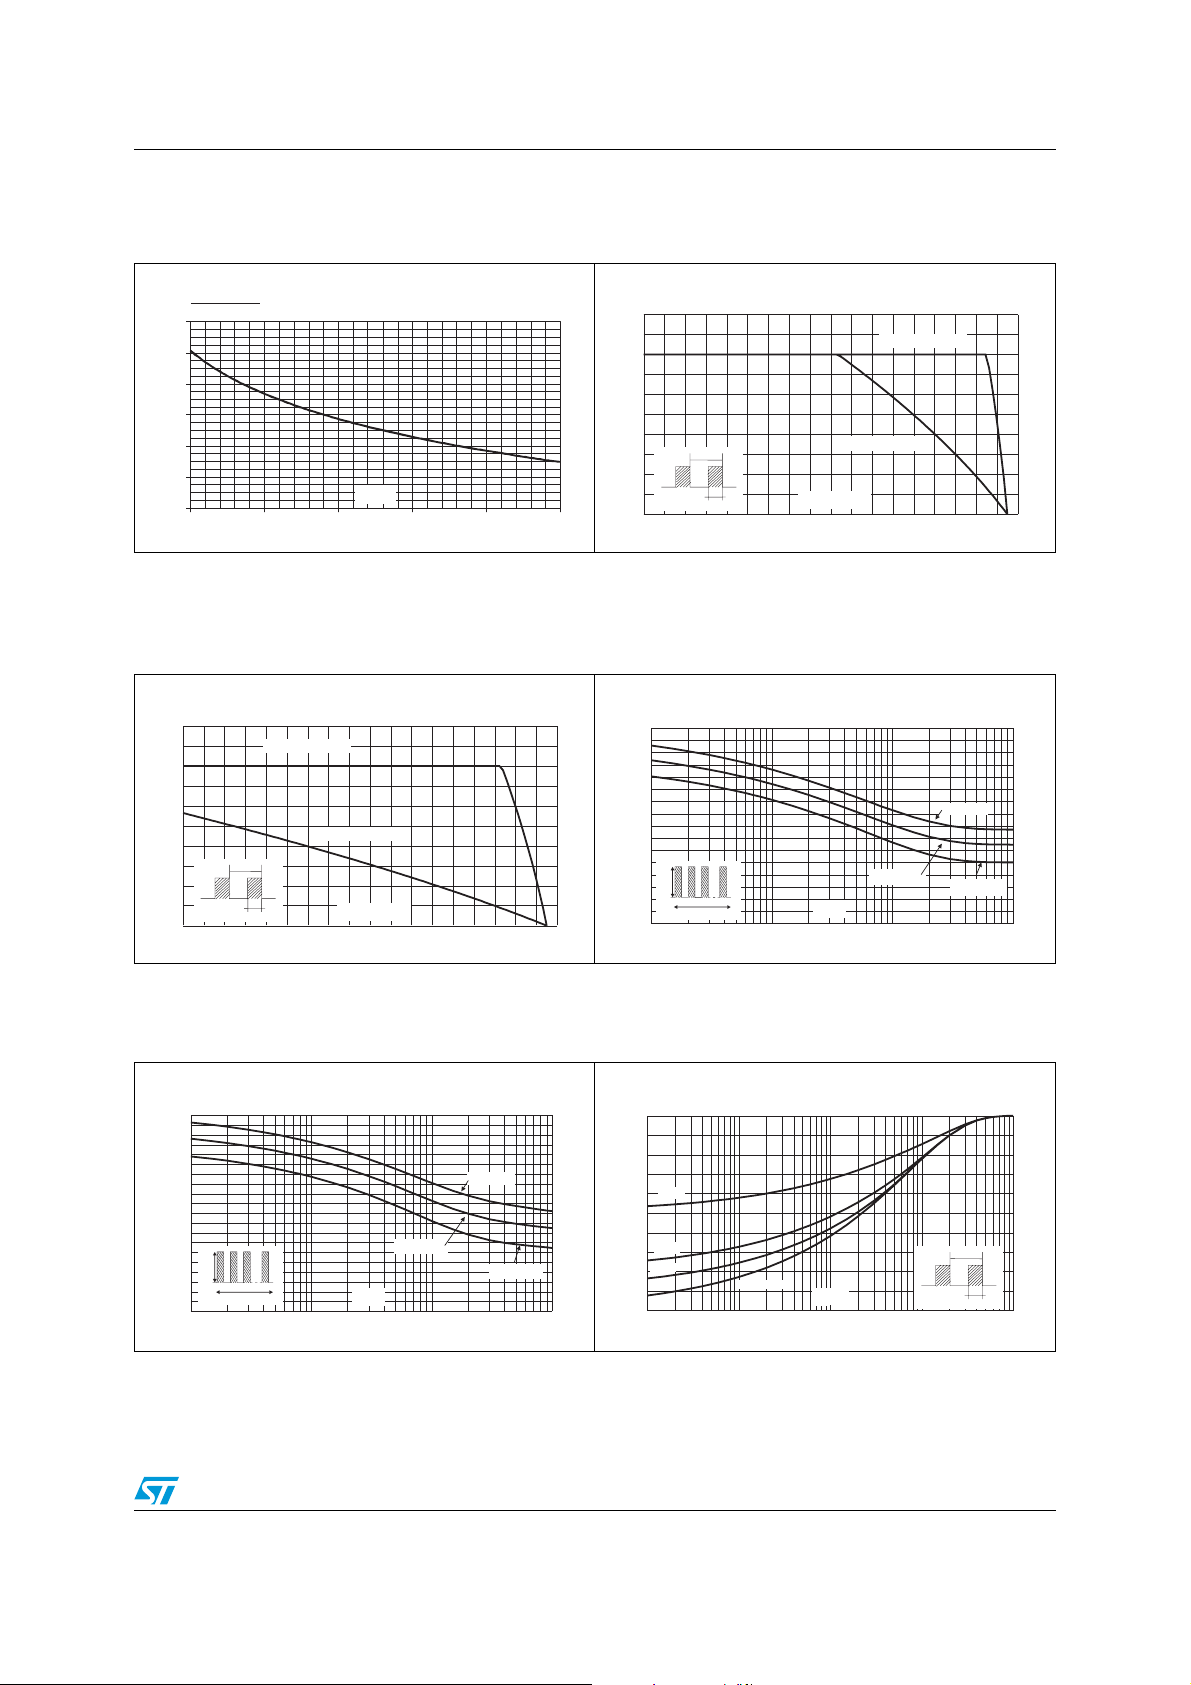
Figure 3. Normalized avalanche power
derating versus junction
temperature
Figure 4. Average forward current versus
ambient temperature, δ = 0.5,
(TO-220AC, D
2
PAK)
0
0.2
0.4
0.6
0.8
1
1.2
25 50 75 100 125 150
T (°C)
j
P(t)
P (25°C)
ARM p
ARM
0 20 40 60 80 100 120 140 160 180
0
2
4
6
8
10
T
amb
(°C)
I
F(av)
(A)
R
th(j-a)
=15°C/W
R
th(j-a)
=R
th(j-c)
T
δ
=t
p
/T
=t
p
/T
t
p
t
p
Figure 5. Average forward current versus
ambient temperature, δ = 0.5,
(TO-220FPAC)
Figure 6. Non repetitive surge peak
forward current versus overload
duration - maximum values, per
diode (TO-220AC, D
2
PAK)
0 20 40 60 80 100 120 140 160 180
0
2
4
6
8
10
R
th(j-a)
=50°C/W
R
th(j-a)
=R
th(j-c)
T
amb
(°C)
I
F(av)
(A)
T
δ
=t
p
/T
=t
p
/T
t
p
t
p
1E-3 1E-2 1E-1 1E+0
0
20
40
60
80
100
120
140
160
t(s)
I
M
(A)
T
c
=75°C
T
c
=100°C
T
c
=125°C
IM
t
δ=0.5
Figure 7. Non repetitive surge peak forward
current versus overload duration
- maximum values (TO-220FPAC)
Figure 8. Relative variation of thermal
impedance junction to case versus
pulse duration (TO-220AC, D
2
PAK)
1E-3 1E-2 1E-1 1E+0
0
10
20
30
40
50
60
70
80
90
100
T
c
=75°C
T
c
=100°C
T
c
=125°C
t(s)
I
M
(A)
IM
t
δ=0.5
1E-4 1E-3 1E-2 1E-1 1E+0
0.0
0.2
0.4
0.6
0.8
1.0
t
p
(s)
Z
th(j-c)
/R
th(j-c)
δ = 0.1
δ = 0.2
δ = 0.5
Single pulse
T
δ
=t
p
/T
=t
p
/T
t
p
t
p
 Loading...