ST AN3273 Application note

AN3273

Application note

STEVAL-IPP001V2: E-meter PLM demonstration board

Introduction

The purpose of this application note is to describe the use of the E-meter PLM demonstration board both in standalone and network mode. The E-meter demonstration board can be used as a guideline to design a typical energy-meter board for smart metering applications.

The document describes how to configure the board and how to interact with it; buttons, LEDs, configuration jumpers, and all hardware components used are described in detail, as well as the meaning of LCD data. A full description of the power line communication and its configuration and commands is provided too.

The E-meter demonstration board is based on the STM32F103VE microcontroller, ST7580 PLM module, and the STPMC1 poly-phase energy metering IC. It implements a PLM smartmeter node which allows the final utility to monitor energy consumption and other electrical parameters on one or more phases.

The voltage, current, power, power factor, THD, active and reactive energy, and other stored info can be shown on an LCD locally, or sent to a PLM data concentrator through a power line communication network.

Section 1 describes document and library rules

Section 2 describes the smart E-meter hardware demonstration board, its modes, uses and limitations

Section 3 highlights how to use the E-meter board in a PLC network and describes the PLM frames to be used in order to manage the board from another PLM node

Section 4 shows board schematics and the BOM list. Refer to UM0997 for more hardware details.

November 2011

Doc ID 17942 Rev 2

1/50

www.st.com

Contents

AN3273


Contents

1

Document and library rules . . . . . . . . . . . . . . . . . . . . . . . . . . . . . . . . . . .

5


1.1

Acronyms . . . . . . . . . . . . . . . . . . . . . . . . . . . . . . . . . . . . . . . . . . . . . . . . . .

5

2

E-meter PLM demonstration board . . . . . . . . . . . . . . . . . . . . . . . . . . . . .

6


2.1

Board introduction . . . . . . . . . . . . . . . . . . . . . . . . . . . . . . . . . . . . . . . . . . .

6


2.2

Main hardware components . . . . . . . . . . . . . . . . . . . . . . . . . . . . . . . . . . . .

7


2.3

Power-on and board use . . . . . . . . . . . . . . . . . . . . . . . . . . . . . . . . . . . . . .

9

2.3.1 STEVAL-IPE010V1 energy-meter board use . . . . . . . . . . . . . . . . . . . . . 10 2.3.2 E-meter application running . . . . . . . . . . . . . . . . . . . . . . . . . . . . . . . . . . 11 2.3.3 E-utility application running . . . . . . . . . . . . . . . . . . . . . . . . . . . . . . . . . . 12

2.4 Board and application limitations . . . . . . . . . . . . . . . . . . . . . . . . . . . . . . . 13

3

PLM network and frames . . . . . . . . . . . . . . . . . . . . . . . . . . . . . . . . . . . .

14


3.1

PLM Network parameters . . . . . . . . . . . . . . . . . . . . . . . . . . . . . . . . . . . . .

14


3.2

Smart E-meter use inside a PLM network . . . . . . . . . . . . . . . . . . . . . . . .

15

4

BOM list . . . . . . . . . . . . . . . . . . . . . . . . . . . . . . . . . . . . . . . . . . . . . . . . . .

18

5

Schematics . . . . . . . . . . . . . . . . . . . . . . . . . . . . . . . . . . . . . . . . . . . . . . .

35

6

References . . . . . . . . . . . . . . . . . . . . . . . . . . . . . . . . . . . . . . . . . . . . . . . .

48

7

Revision history . . . . . . . . . . . . . . . . . . . . . . . . . . . . . . . . . . . . . . . . . . .

49

2/50

Doc ID 17942 Rev 2

AN3273

List of tables


List of tables

Table 1. List of acronyms . . . . . . . . . . . . . . . . . . . . . . . . . . . . . . . . . . . . . . . . . . . . . . . . . . . . . . . . . . 5 Table 2. Jumpers default configuration. . . . . . . . . . . . . . . . . . . . . . . . . . . . . . . . . . . . . . . . . . . . . . . . 9 Table 3. PHY layer configuration . . . . . . . . . . . . . . . . . . . . . . . . . . . . . . . . . . . . . . . . . . . . . . . . . . . 14 Table 4. Command set . . . . . . . . . . . . . . . . . . . . . . . . . . . . . . . . . . . . . . . . . . . . . . . . . . . . . . . . . . . 15 Table 5. Class set . . . . . . . . . . . . . . . . . . . . . . . . . . . . . . . . . . . . . . . . . . . . . . . . . . . . . . . . . . . . . . . 15 Table 6. Data structures . . . . . . . . . . . . . . . . . . . . . . . . . . . . . . . . . . . . . . . . . . . . . . . . . . . . . . . . . . 16 Table 7. BOM . . . . . . . . . . . . . . . . . . . . . . . . . . . . . . . . . . . . . . . . . . . . . . . . . . . . . . . . . . . . . . . . . . 18 Table 8. Document revision history . . . . . . . . . . . . . . . . . . . . . . . . . . . . . . . . . . . . . . . . . . . . . . . . . 49

Doc ID 17942 Rev 2

3/50

List of figures

AN3273


List of figures

Figure 1.

STEVAL-IPP001V2 E-meter PLM demonstration board . . . . . . . . . . . . . . . . . . . . . . . . . .

. 6

Figure 2.

STEVAL-IPP001V2 E-meter demonstration board block diagram . . . . . . . . . . . . . . . . . . .

. 7

Figure 3.

STEVAL-IPP001V2 hardware description . . . . . . . . . . . . . . . . . . . . . . . . . . . . . . . . . . . . .

. 8

Figure 4.

Phase system cabling schematic . . . . . . . . . . . . . . . . . . . . . . . . . . . . . . . . . . . . . . . . . . . .

11

Figure 5.

STEVAL-IPP001V2 E-meter application view . . . . . . . . . . . . . . . . . . . . . . . . . . . . . . . . . .

11

Figure 6.

STEVAL-IPP001V2 E-utility application view . . . . . . . . . . . . . . . . . . . . . . . . . . . . . . . . . . .

12

Figure 7.

Commands format summary . . . . . . . . . . . . . . . . . . . . . . . . . . . . . . . . . . . . . . . . . . . . . . .

16

Figure 8.

Top . . . . . . . . . . . . . . . . . . . . . . . . . . . . . . . . . . . . . . . . . . . . . . . . . . . . . . . . . . . . . . . . . . .

35

Figure 9.

Metrology board connector . . . . . . . . . . . . . . . . . . . . . . . . . . . . . . . . . . . . . . . . . . . . . . . . .

36

Figure 10.

User interface . . . . . . . . . . . . . . . . . . . . . . . . . . . . . . . . . . . . . . . . . . . . . . . . . . . . . . . . . . .

36

Figure 11.

LCD connector section . . . . . . . . . . . . . . . . . . . . . . . . . . . . . . . . . . . . . . . . . . . . . . . . . . . .

37

Figure 12.

MCU schematic . . . . . . . . . . . . . . . . . . . . . . . . . . . . . . . . . . . . . . . . . . . . . . . . . . . . . . . . .

38

Figure 13.

RTC calibration, meter and LCD level . . . . . . . . . . . . . . . . . . . . . . . . . . . . . . . . . . . . . . . .

39

Figure 14.

MEMS module connector . . . . . . . . . . . . . . . . . . . . . . . . . . . . . . . . . . . . . . . . . . . . . . . . . .

40

Figure 15.

General purpose configuration jumpers . . . . . . . . . . . . . . . . . . . . . . . . . . . . . . . . . . . . . . .

40

Figure 16.

Power line modem . . . . . . . . . . . . . . . . . . . . . . . . . . . . . . . . . . . . . . . . . . . . . . . . . . . . . . .

41

Figure 17.

System JTAG connector, ST7580UART interface, and 8051 program flash memory . . . .

42

Figure 18.

Non-isolated zero-crossing, ST7580 reset button, current limit setting, and microcontroller


connection . . . . . . . . . . . . . . . . . . . . . . . . . . . . . . . . . . . . . . . . . . . . . . . . . . . . . . . . . . . . .

43

Figure 19.

Power supply (part 1) . . . . . . . . . . . . . . . . . . . . . . . . . . . . . . . . . . . . . . . . . . . . . . . . . . . . .

44

Figure 20.

Power supply (part 2) . . . . . . . . . . . . . . . . . . . . . . . . . . . . . . . . . . . . . . . . . . . . . . . . . . . . .

45

Figure 21.

Power supply (part 3) . . . . . . . . . . . . . . . . . . . . . . . . . . . . . . . . . . . . . . . . . . . . . . . . . . . . .

46

Figure 22.

ZigBee module connector. . . . . . . . . . . . . . . . . . . . . . . . . . . . . . . . . . . . . . . . . . . . . . . . . .

46

Figure 23.

USB connector . . . . . . . . . . . . . . . . . . . . . . . . . . . . . . . . . . . . . . . . . . . . . . . . . . . . . . . . . .

47

4/50

Doc ID 17942 Rev 2

AN3273

Document and library rules


1 Document and library rules

This document uses the conventions described in the sections below.

1.1Acronyms

Table 1 lists the acronyms used in this document.

Table 1.

List of acronyms


Acronym

Meaning


APP

Application


API

Application programming interface


HAL

Hardware abstraction layer


RTOS

Real-time operating system


PLM

Power line modem


PLC

Power line communication


MCU

Microcontroller unit


SPI

Serial peripheral interface


OOP

Object oriented programming


Doc ID 17942 Rev 2

5/50

E-meter PLM demonstration board

AN3273


2 E-meter PLM demonstration board

2.1Board introduction

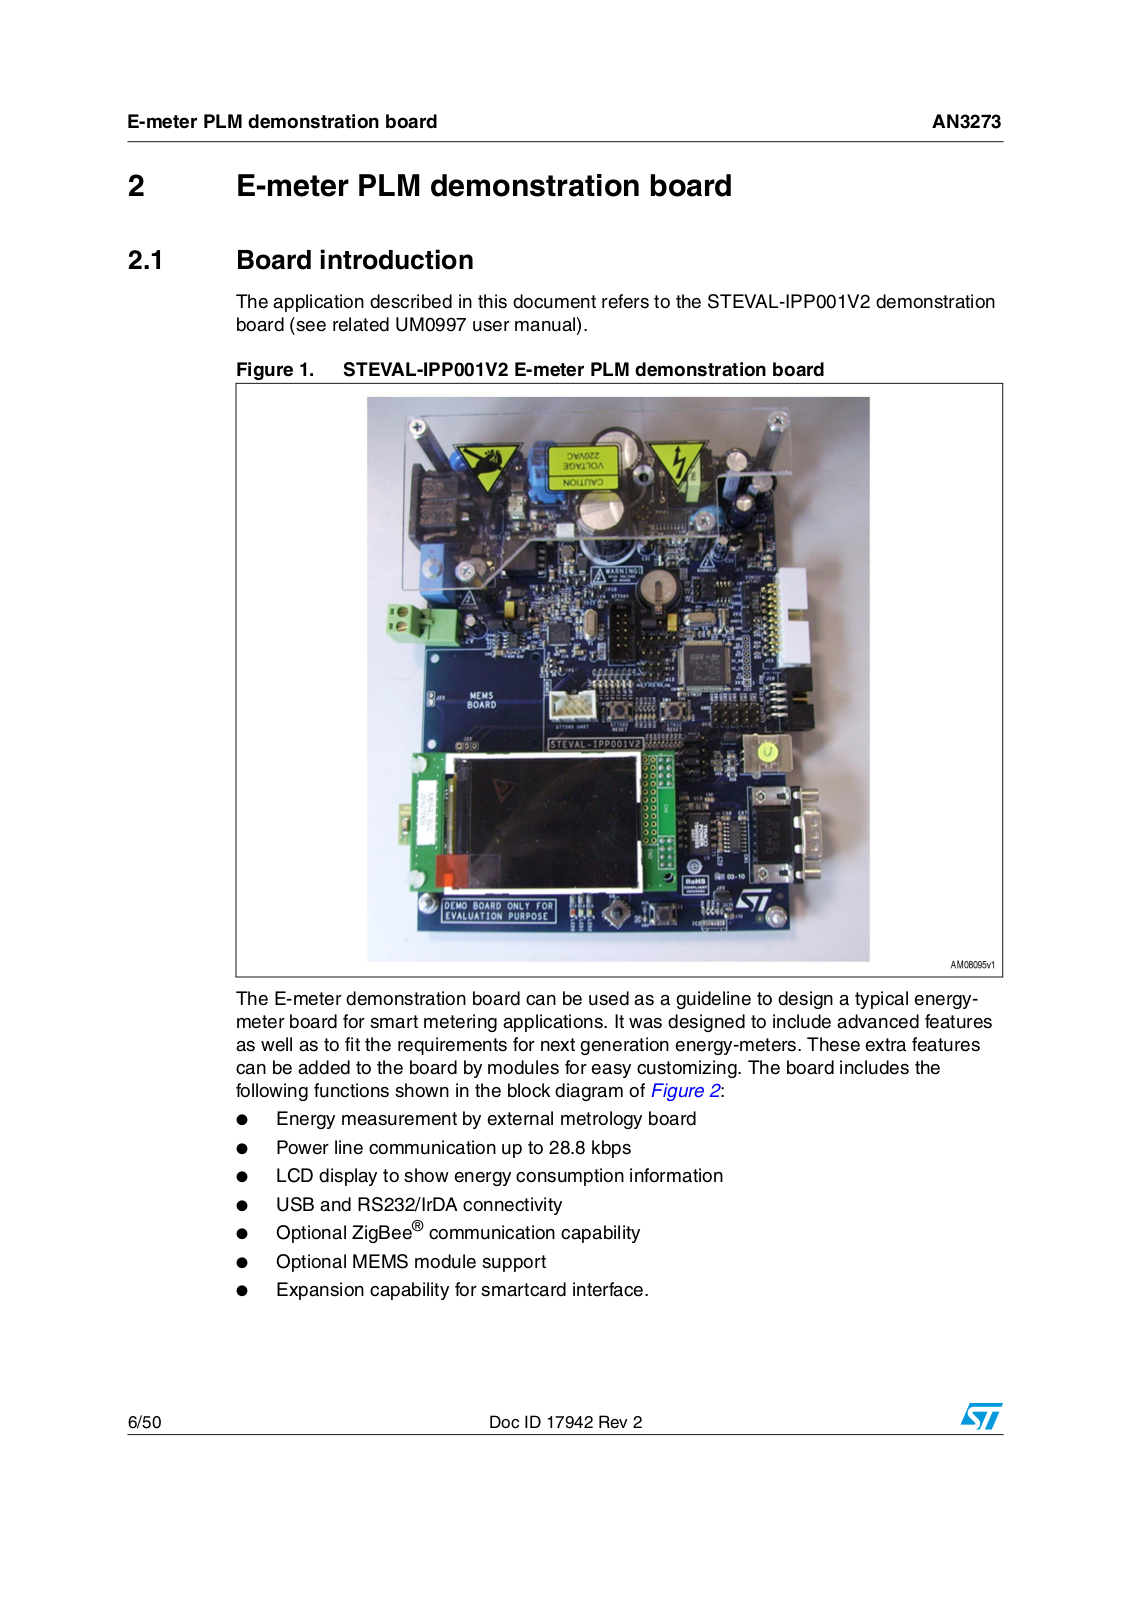
The application described in this document refers to the STEVAL-IPP001V2 demonstration board (see related UM0997 user manual).

Figure 1. STEVAL-IPP001V2 E-meter PLM demonstration board

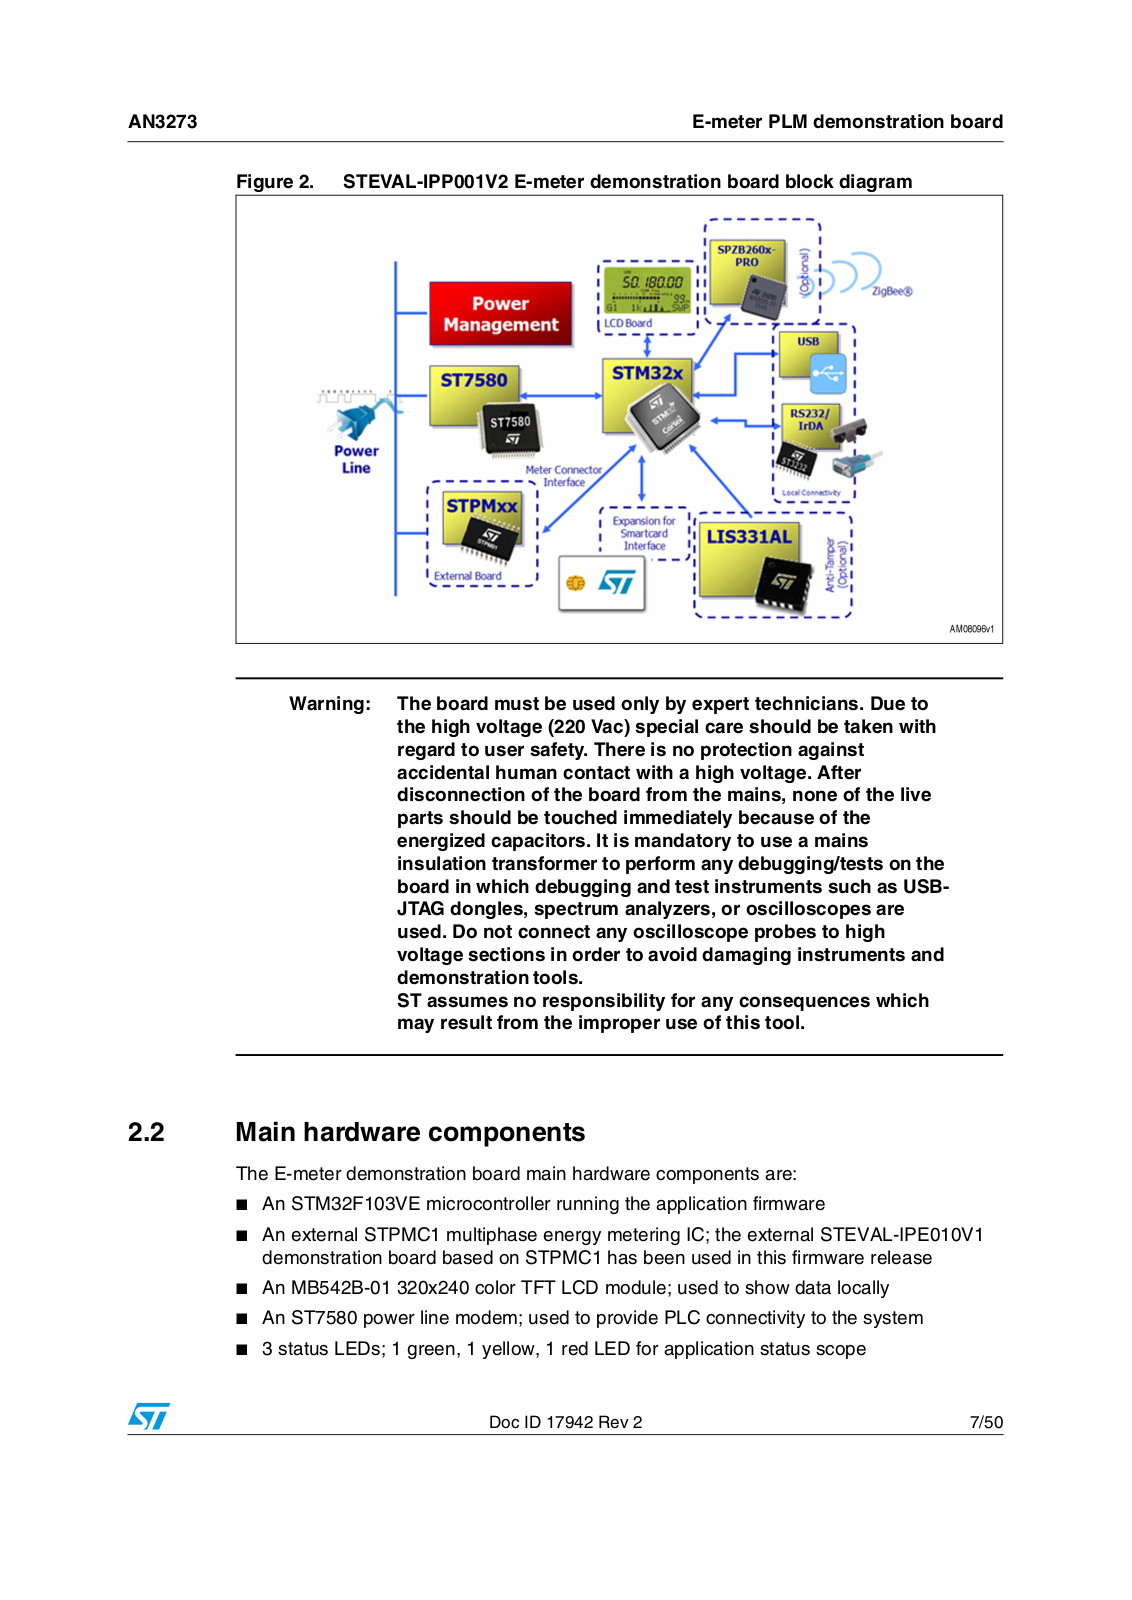
The E-meter demonstration board can be used as a guideline to design a typical energymeter board for smart metering applications. It was designed to include advanced features as well as to fit the requirements for next generation energy-meters. These extra features can be added to the board by modules for easy customizing. The board includes the following functions shown in the block diagram of Figure 2:

Energy measurement by external metrology board

Power line communication up to 28.8 kbps

LCD display to show energy consumption information

USB and RS232/IrDA connectivity

Optional ZigBee® communication capability

Optional MEMS module support

Expansion capability for smartcard interface.

6/50

Doc ID 17942 Rev 2

AN3273

E-meter PLM demonstration board


Figure 2. STEVAL-IPP001V2 E-meter demonstration board block diagram

Warning: The board must be used only by expert technicians. Due to the high voltage (220 Vac) special care should be taken with regard to user safety. There is no protection against accidental human contact with a high voltage. After disconnection of the board from the mains, none of the live parts should be touched immediately because of the energized capacitors. It is mandatory to use a mains insulation transformer to perform any debugging/tests on the board in which debugging and test instruments such as USBJTAG dongles, spectrum analyzers, or oscilloscopes are used. Do not connect any oscilloscope probes to high voltage sections in order to avoid damaging instruments and demonstration tools.

ST assumes no responsibility for any consequences which may result from the improper use of this tool.

2.2Main hardware components

The E-meter demonstration board main hardware components are:

An STM32F103VE microcontroller running the application firmware

An external STPMC1 multiphase energy metering IC; the external STEVAL-IPE010V1 demonstration board based on STPMC1 has been used in this firmware release

An MB542B-01 320x240 color TFT LCD module; used to show data locally

An ST7580 power line modem; used to provide PLC connectivity to the system

3 status LEDs; 1 green, 1 yellow, 1 red LED for application status scope

Doc ID 17942 Rev 2

7/50

E-meter PLM demonstration board

AN3273


5 configuration jumpers (SW19, 20, 21, 22, and 23); used for software configuration scope

1 user button (S1) and 1 joystick (U8); used for user application scope

1 microcontroller reset button (SW4); used to force an MCU reset

1 modem reset button (SW1); used to force an ST7580 reset.

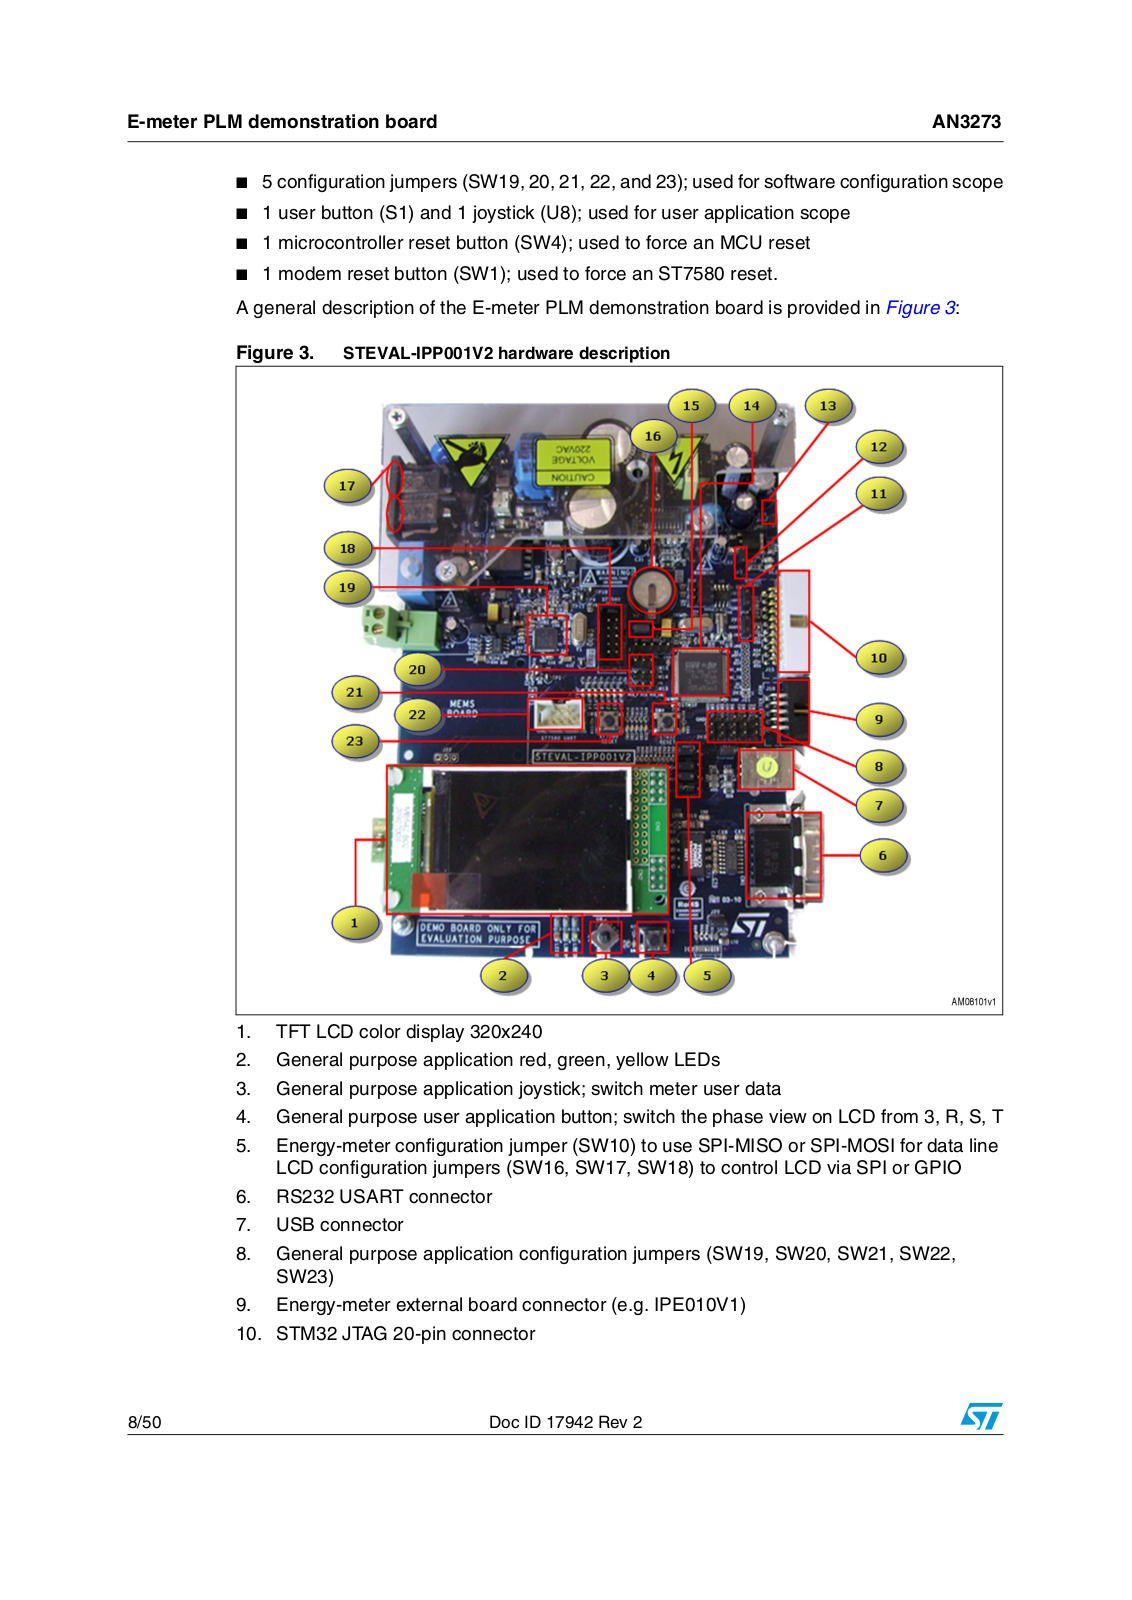
A general description of the E-meter PLM demonstration board is provided in Figure 3:

Figure 3. STEVAL-IPP001V2 hardware description

1.TFT LCD color display 320x240

2.General purpose application red, green, yellow LEDs

3.General purpose application joystick; switch meter user data

4.General purpose user application button; switch the phase view on LCD from 3, R, S, T

5.Energy-meter configuration jumper (SW10) to use SPI-MISO or SPI-MOSI for data line LCD configuration jumpers (SW16, SW17, SW18) to control LCD via SPI or GPIO

6.RS232 USART connector

7.USB connector

8.General purpose application configuration jumpers (SW19, SW20, SW21, SW22, SW23)

9.Energy-meter external board connector (e.g. IPE010V1)

10.STM32 JTAG 20-pin connector

8/50

Doc ID 17942 Rev 2

AN3273

E-meter PLM demonstration board


11.STM32 boot configuration jumpers (SW7, SW9)

12.Enable/disable DL2 LED

13.Enable/disable DL1 LED

14.STM32F103VE 32-bit high density microcontroller

15.Battery enabled/disabled configuration jumper (SW12)

16.Battery for STM32 VBAT supply

17.85 V - 256 V board power supply. Suggested 110 V - 220 Vac

18.ST7580 JTAG 10-pin connector

19.ST7580 power line modem IC

20.RTC calibration/normal mode configuration jumpers

21.STM32 microcontroller reset button

22.ST7580 PLM IC UART connection connector

23.ST7580 PLM IC reset button.

2.3Power-on and board use

Before turning on the board for the first time, make sure the following configuration jumpers are fitted or unfitted according to the following default table:

Table 2.

Jumpers default configuration


Jumper

Description

Default


DL1 enable


JP6

– Fitted: DL1 enabled

Fitted


– Not fitted: DL1 disabled


DL2 enable


JP7

– Fitted: DL2 enabled

Fitted


– Not Fitted: DL2 disabled


To connect mains ground to board ground


JP8

– Fitted: grounds connected

Not fitted


– Not fitted: grounds not connected


SW3,SW5,

EEPROM address setting


– Fitted (1-2): address bit 1

Fitted (2-3)


SW6


– Fitted (2-3): address bit 0


Boot option


SW7, SW9

– Fitted (1-2): boot option bit 0

Fitted (1-2)


– Fitted (2-3): boot option bit 1


STM32 VBAT option


SW12

– Fitted (1-2): VBAT from power supply

Fitted (1-2)


– Fitted (2-3): VBAT from battery ß


RTC calibration mode


SW13, SW14, SW15

– Fitted (1-2): normal mode

Fitted (1-2)


– Fitted (2-3): RTC calibration mode


Doc ID 17942 Rev 2

9/50

E-meter PLM demonstration board

AN3273


Table 2.

Jumpers default configuration (continued)


Jumper

Description

Default


SW19, SW20, SW21, SW22

General purpose configuration bit


– Fitted (1-2): configuration bit 0

Fitted (1-2)


SW23


– Fitted (2-3): configuration bit 1


JP11, JP12, JP13, JP14,

STM32-ST7580 connection


– Fitted: STM32-ST7580 control lines connected

Fitted

JP15, JP17, JP18

– Not fitted: STM32-ST7580 control lines not connected


Energy-meter board power supply option


J11

– Fitted: energy-meter powered by the board

Fitted


– Not fitted: energy-meter self powered


Energy-meter data line option


SW10

– Fitted (1-2): data line connected to SPI2-MOSI

Fitted (2-3)


– Fitted (2-3): data line connected to SPI2-MISO


LCD connection option


SW16, SW17, SW18

– Fitted (1-2): LCD controlled by SP1

Fitted (1-2)


– Fitted (2-3): LCD controlled by GPIOs


ST7580 external flash enable


JP5

– Fitted: ST7580 run flash firmware

Fitted


– Not fitted: ST7580 disabled


ST7580 external flash hold


JP4

– Fitted: flash data output disabled

Not fitted


– Not fitted: flash data output enabled


Once configuration is set according to the above description, connect and cable the STEVAL-IPE010V1 poly-phase energy-meter demonstration board before powering on the smart E-meter board.

2.3.1STEVAL-IPE010V1 energy-meter board use

The STEVAL-IPE010V1 must be calibrated. It means that STPMC1 OTP calibration registers have been calibrated in order to read coherent voltage, current, and energy data through the STPMS1 daughter boards connected to the board for each monitored phase.

Figure 4 shows the cabling-schema for the STEVAL-IPP001V2 plus STEVAL-IPE010V1 3- phase system.

It is also possible to cable the full system in mono-phase schema, using one daughter sensor board only (on top of STEVAL-IPE010V1) and configuring STPMC1 in order to work in mono-phase mode (see the STPMC1 datasheet).

10/50

Doc ID 17942 Rev 2

ST AN3273 Application note

AN3273

E-meter PLM demonstration board


Figure 4. Phase system cabling schematic

2.3.2E-meter application running

Once the 3-phase system is put in place, according to the previous description, the system is powered on, the smart E-meter application shows the following view on the LCD:

Figure 5. STEVAL-IPP001V2 E-meter application view

1.Phase identification (3, R, S, T)

2.Energy counter in watts. Red digit represents tenths of a watt

3.Phase current in ampere

Doc ID 17942 Rev 2

11/50

E-meter PLM demonstration board

AN3273


4.Phase reactive energy in kVar

5.Power factor or “no load” if no load condition is detected

6.Meter user data; use joystick to move shown data

7.Phase THD parameter in percentage

8.Phase wide active power in kWatt

9.Phase voltage in Volts.

If the application is running without any problems a green LED (LED1) is blinking. During counter moving, the red LED (LED0) blinks every time the red number (tenths of a watt) moves to the next step.

To move from a phase view to the next phase view, it's necessary to press user button S1. Joystick U8 allows to scroll through user data.

2.3.3E-utility application running

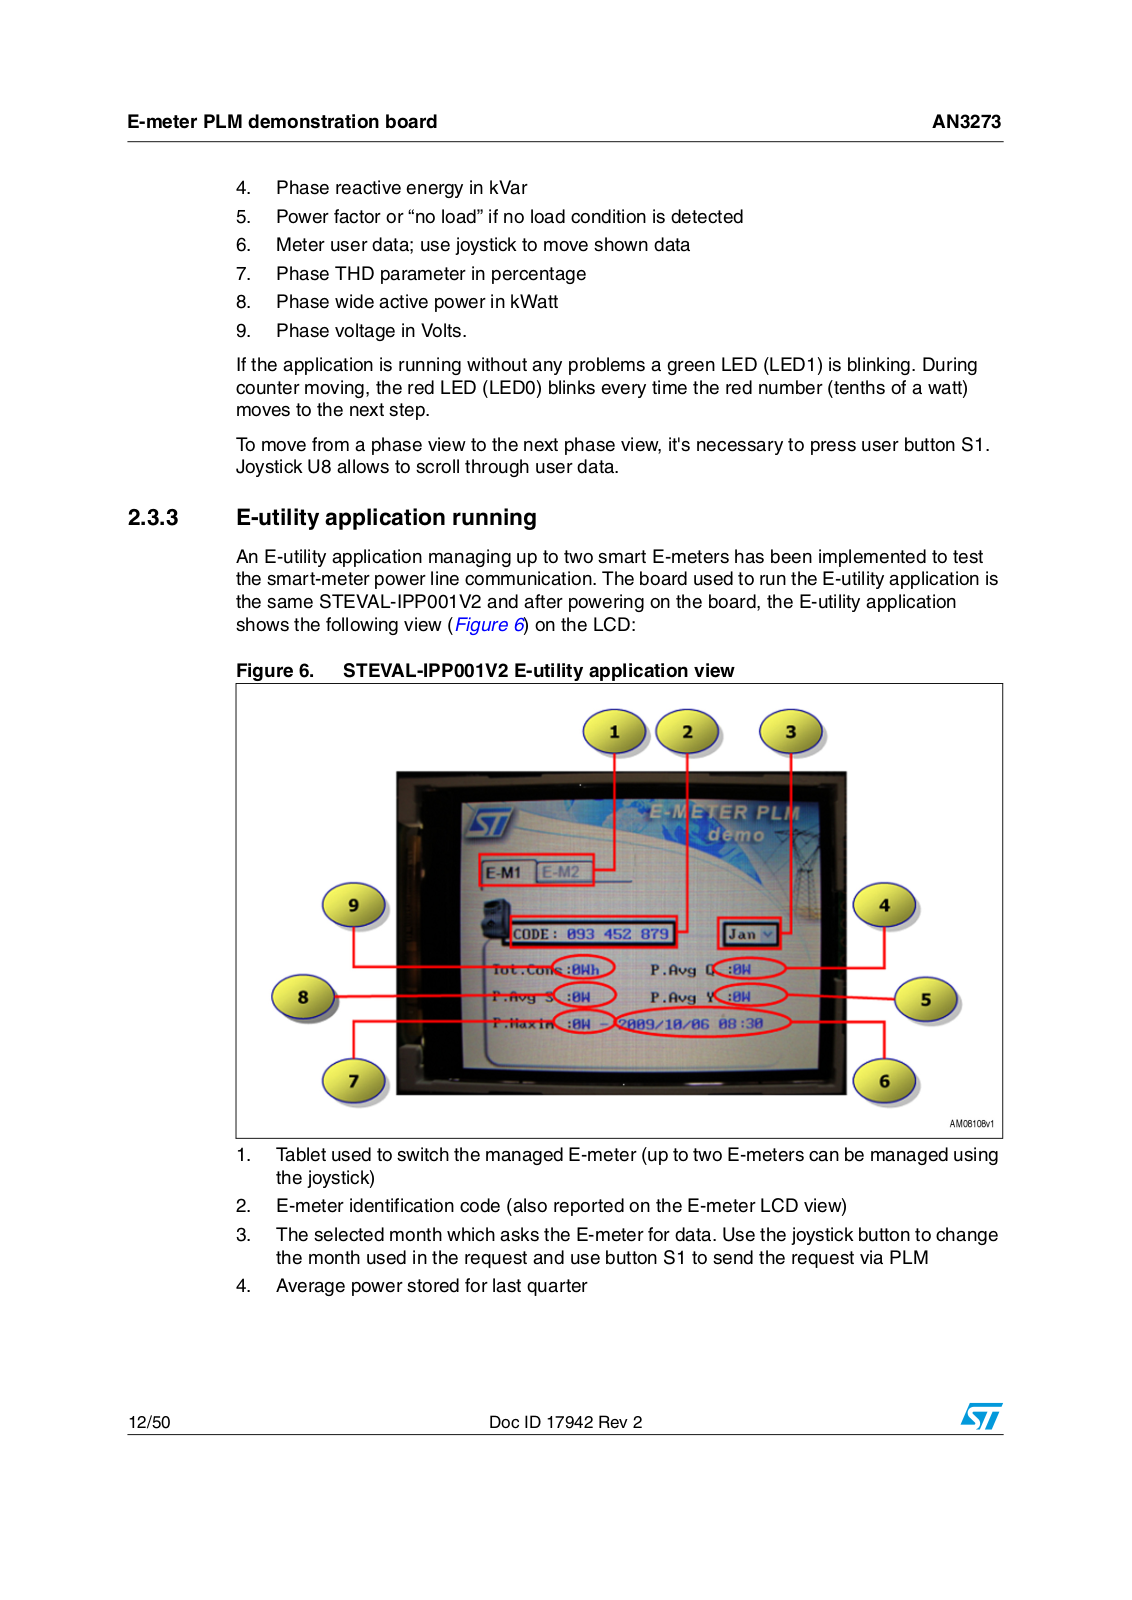
An E-utility application managing up to two smart E-meters has been implemented to test the smart-meter power line communication. The board used to run the E-utility application is the same STEVAL-IPP001V2 and after powering on the board, the E-utility application shows the following view (Figure 6) on the LCD:

Figure 6. STEVAL-IPP001V2 E-utility application view

1.Tablet used to switch the managed E-meter (up to two E-meters can be managed using the joystick)

2.E-meter identification code (also reported on the E-meter LCD view)

3.The selected month which asks the E-meter for data. Use the joystick button to change the month used in the request and use button S1 to send the request via PLM

4.Average power stored for last quarter

12/50

Doc ID 17942 Rev 2

AN3273

E-meter PLM demonstration board


5.Average power stored for last year

6.Date and time

7.Maximum demand power for the selected month

8.Average power stored for last six months

9.Total energy consumption of the selected E-meter.

Joystick left/right keys are used to move from the first to the second managed meter; joystick key press is used to change the selected month; user button S1 is used to send a request to the selected E-meter.

2.4Board and application limitations

The smart E-meter is for evaluation purposes only. The board and running applications have the following limitations:

Smart E-meter application counter supposes to count active positive energy only. Even if STPMC1 is able to count negative energy, the application doesn't support this kind of energy in this release

High voltage disturbance. Sometimes a high voltage disturbance, such as button line spike (and so a button action), is observed during turn on/off of the electric load connected to the smart E-Plug

A 7-byte static address has been assigned via firmware to the smart E-meter application, as below. If it is necessary to use more than one smart E-Meter demonstration board in a demonstrator system, this address must be changed manually in order to differentiate STEVA-IPP001V2 boards:

#ifdef METER_1

u8 DL_ADDRESS[7] = {0xAA, 0xBB, 0xCC, 0xDD, 0xEE, 0xFF, 0x0}; #else

u8 DL_ADDRESS[7] = {0xAA, 0xBB, 0xCC, 0xDD, 0xEE, 0xF0, 0x0}; #endif.

In a future release a limited set of MAC addresses could be managed using the board configuration jumpers.

Doc ID 17942 Rev 2

13/50

PLM network and frames

AN3273


3 PLM network and frames

This section describes how to use the meter board inside a network with a master/slave architecture. The network includes several meters (slaves) and one data concentrator (master). Each meter maintains a database with the energy consumption data statistics which are stored in an external EEPROM. The master can read the statistics data of each meter, requesting them through commands transferred using the PLM communication.

3.1PLM Network parameters

During startup each node configures the physical layer of the ST7580 with the following parameters:

Table 3.

PHY layer configuration


General settings 1

0x11


Frequency pair

72-86 kHz


TX channel

High channel


Rx channel

Only high channel


Zero-crossing synchronization

Asynchronous


Current control

Enabled


General settings 2

0x15


TX modulation

BPSK


TX gain

21


General settings 3

0x0E


RX high channel modulation

Any PSK


RX low channel modulation

Any PSK


PSK preamble length

32 bits


FSK modulation settings

0x3A


Baud rate

2400 bps


Deviation

1


Preamble length

32 bits


Unique word length

16 bits


FSK modulation unique word LSB

0x9B


FSK modulation unique word MSB

0x58


The master address is configured as AA-BB-CC-DD-EE-00 in hexadecimal format. For a complete list of the possible modem settings refer to the ST7580 data brief.

14/50

Doc ID 17942 Rev 2

AN3273

PLM network and frames


3.2Smart E-meter use inside a PLM network

A demo application layer for metering applications has been implemented on top of the PLM communication protocol. The layer implements a command/response protocol with three kinds of frames:

Table 4.

Command set


Command name

Code

Description


GET


0x00

Command to read database variable of the remote meter


SET


0x01

Command to write database variable of the remote meter


RSP


0x02

Response to a GET request


The database variables are identified by the classes described in Table 5. The same table shows how some classes have sub-classes and also the access permission.

Table 5.

Class set


Class name

Class code

Sub-class

Sub-class code

Description

name


TOTAL_CONS

0x00

N/A

N/A

Total energy consumption variable (read

only)


AV_MD


0x01

N/A

N/A

Average maximum demand variables


(read only)


TARIFF_NUM

0x00

Number of tariff managed by the meter

TARIFF_LIST

0x02

(read/write)


TARIFF

0x01

Tariff variable (read/write)


TAMPER_LIST

0x03

N/A

N/A

List of detected tamper by the meter (read

only)


DAY

0x00

Daily based maximum demand variable


MONTH

0x01

Monthly based maximum demand

MD_DB


0x04

variable


QUARTER

0x02

Quarter based maximum demand


variable


MD_CONFIG

0x05

N/A

N/A

Maximum demand storage configuration

(read/write)


DEMO


0x06

N/A

N/A

Command class used in the demo


application


Figure 7 summarizes the generic application layer frame format and also the format for each command.

Doc ID 17942 Rev 2

15/50

Loading...
+ 35 hidden pages