ST AN3095 APPLICATION NOTE

AN3095

Application note

STEVAL-ISV002V1, STEVAL-ISV002V2 3 kW grid-connected PV system, based on the STM32x

Introduction

The STEVAL-ISV002V2 demonstration board is the same as the STEVAL-ISV002V1, but assembled in a metal suitcase. In recent years, the interest in photovoltaic (PV) applications has grown exponentially. As PV systems need an electronic interface to be connected to the grid or standalone loads, the PV market has started appealing to many power electronics manufacturers. Improvements in design, technology and manufacturing of PV inverters, as well as cost reduction and high efficiency, are always the main objectives, [see References 1, 2].

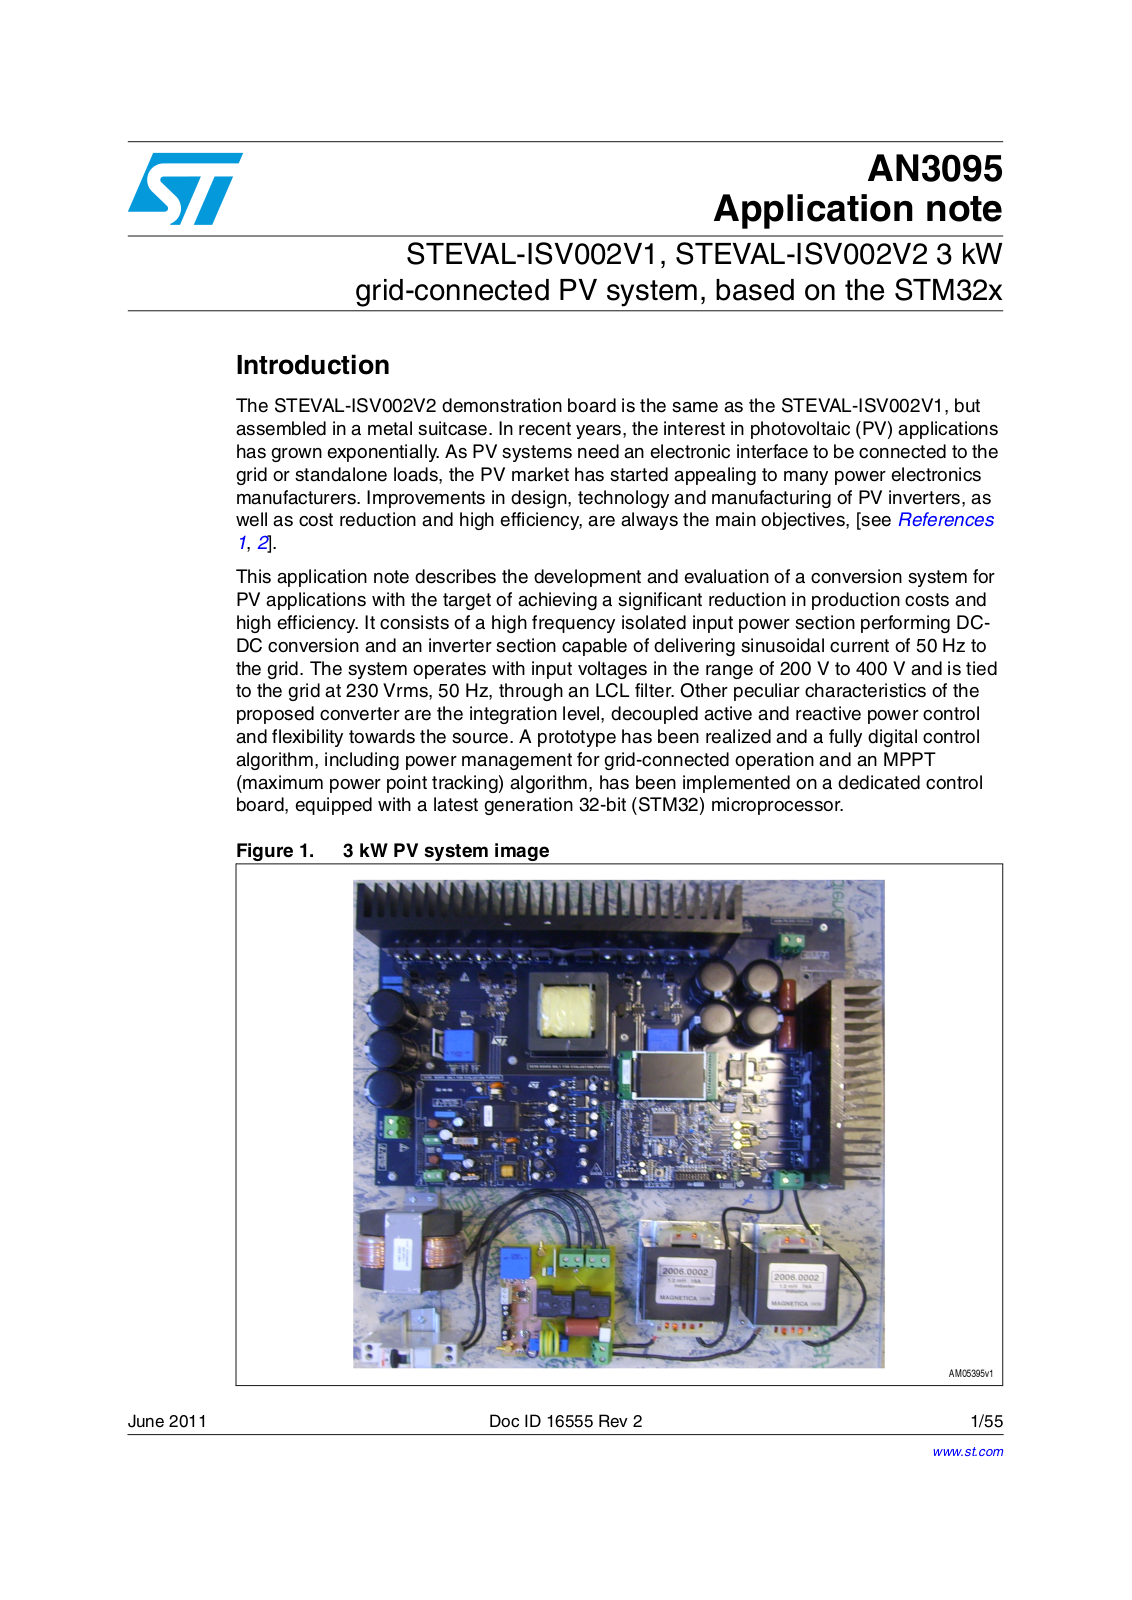
This application note describes the development and evaluation of a conversion system for PV applications with the target of achieving a significant reduction in production costs and high efficiency. It consists of a high frequency isolated input power section performing DCDC conversion and an inverter section capable of delivering sinusoidal current of 50 Hz to the grid. The system operates with input voltages in the range of 200 V to 400 V and is tied to the grid at 230 Vrms, 50 Hz, through an LCL filter. Other peculiar characteristics of the proposed converter are the integration level, decoupled active and reactive power control and flexibility towards the source. A prototype has been realized and a fully digital control algorithm, including power management for grid-connected operation and an MPPT (maximum power point tracking) algorithm, has been implemented on a dedicated control board, equipped with a latest generation 32-bit (STM32) microprocessor.

Figure 1. 3 kW PV system image

June 2011

Doc ID 16555 Rev 2

1/55

www.st.com

Contents

AN3095


Contents

1

System description . . . . . . . . . . . . . . . . . . . . . . . . . . . . . . . . . . . . . . . .

. . 6

2

DC-DC converter . . . . . . . . . . . . . . . . . . . . . . . . . . . . . . . . . . . . . . . . . .

. . 8

3

DC-DC converter design . . . . . . . . . . . . . . . . . . . . . . . . . . . . . . . . . . . .

. 15

4

DC-AC converter . . . . . . . . . . . . . . . . . . . . . . . . . . . . . . . . . . . . . . . . . .

. 21

5

Schematic description . . . . . . . . . . . . . . . . . . . . . . . . . . . . . . . . . . . . .

. 24

6

STM32-based current control strategy for inverter grid connection

. 38

7

Experimental results . . . . . . . . . . . . . . . . . . . . . . . . . . . . . . . . . . . . . . .

. 45

8

Conclusions . . . . . . . . . . . . . . . . . . . . . . . . . . . . . . . . . . . . . . . . . . . . . .

. 51

9

References . . . . . . . . . . . . . . . . . . . . . . . . . . . . . . . . . . . . . . . . . . . . . . .

. 52

10

Revision history . . . . . . . . . . . . . . . . . . . . . . . . . . . . . . . . . . . . . . . . . .

. 54

2/55

Doc ID 16555 Rev 2

AN3095

List of tables


List of tables

Table 1. System specifications . . . . . . . . . . . . . . . . . . . . . . . . . . . . . . . . . . . . . . . . . . . . . . . . . . . . . . 7 Table 2. MOSFET electrical characteristics . . . . . . . . . . . . . . . . . . . . . . . . . . . . . . . . . . . . . . . . . . . 16 Table 3. Diode rectifier electrical characteristics. . . . . . . . . . . . . . . . . . . . . . . . . . . . . . . . . . . . . . . . 16 Table 4. HF transformer specifications . . . . . . . . . . . . . . . . . . . . . . . . . . . . . . . . . . . . . . . . . . . . . . . 17 Table 5. STGW35HF60WD electrical characteristics . . . . . . . . . . . . . . . . . . . . . . . . . . . . . . . . . . . . 22 Table 6. Operating modes of grid-connected voltage source inverter . . . . . . . . . . . . . . . . . . . . . . . 38 Table 7. Execution time of the main control functions . . . . . . . . . . . . . . . . . . . . . . . . . . . . . . . . . . . 45 Table 8. Document revision history . . . . . . . . . . . . . . . . . . . . . . . . . . . . . . . . . . . . . . . . . . . . . . . . . 54

Doc ID 16555 Rev 2

3/55

List of figures

AN3095


List of figures

Figure 1.

3 kW PV system image. . . . . . . . . . . . . . . . . . . . . . . . . . . . . . . . . . . . . . . . . . . . . . . . . . . .

. 1

Figure 2.

Block scheme of hardware implementation . . . . . . . . . . . . . . . . . . . . . . . . . . . . . . . . . . . .

. 6

Figure 3.

DC-DC and DC-AC converter . . . . . . . . . . . . . . . . . . . . . . . . . . . . . . . . . . . . . . . . . . . . . . .

. 8

Figure 4.

DC-DC converter control signals . . . . . . . . . . . . . . . . . . . . . . . . . . . . . . . . . . . . . . . . . . . .

. 8

Figure 5.

DC-DC converter equivalent circuit . . . . . . . . . . . . . . . . . . . . . . . . . . . . . . . . . . . . . . . . . .

. 9

Figure 6.

Current flow in mode 1 . . . . . . . . . . . . . . . . . . . . . . . . . . . . . . . . . . . . . . . . . . . . . . . . . . . .

10

Figure 7.

Current flow in mode 2 . . . . . . . . . . . . . . . . . . . . . . . . . . . . . . . . . . . . . . . . . . . . . . . . . . . .

10

Figure 8.

Current path in mode 3 . . . . . . . . . . . . . . . . . . . . . . . . . . . . . . . . . . . . . . . . . . . . . . . . . . . .

11

Figure 9.

DC-DC converter operating waveforms . . . . . . . . . . . . . . . . . . . . . . . . . . . . . . . . . . . . . . .

11

Figure 10.

Modulation and transformer current in DCM. . . . . . . . . . . . . . . . . . . . . . . . . . . . . . . . . . . .

12

Figure 11.

Power transfer function for different input voltages . . . . . . . . . . . . . . . . . . . . . . . . . . . . . .

13

Figure 12.

Variation of parameter “d” with input voltage for n=1.2. . . . . . . . . . . . . . . . . . . . . . . . . . . .

14

Figure 13.

Conversion systems with modified DC-AC inverter . . . . . . . . . . . . . . . . . . . . . . . . . . . . . .

23

Figure 14.

Schematic of the power stage . . . . . . . . . . . . . . . . . . . . . . . . . . . . . . . . . . . . . . . . . . . . . .

26

Figure 15.

Output sensing and relay board schematic . . . . . . . . . . . . . . . . . . . . . . . . . . . . . . . . . . . .

28

Figure 16.

Schematic of the AC voltage measurement circuit . . . . . . . . . . . . . . . . . . . . . . . . . . . . . . .

29

Figure 17.

Line current conditioning circuit . . . . . . . . . . . . . . . . . . . . . . . . . . . . . . . . . . . . . . . . . . . . .

30

Figure 18.

ADC interrupt service routine . . . . . . . . . . . . . . . . . . . . . . . . . . . . . . . . . . . . . . . . . . . . . . .

30

Figure 19.

STM32 microcontroller schematic . . . . . . . . . . . . . . . . . . . . . . . . . . . . . . . . . . . . . . . . . . .

31

Figure 20.

DC-DC converter driver . . . . . . . . . . . . . . . . . . . . . . . . . . . . . . . . . . . . . . . . . . . . . . . . . . .

32

Figure 21.

DC-AC converter driver . . . . . . . . . . . . . . . . . . . . . . . . . . . . . . . . . . . . . . . . . . . . . . . . . . .

33

Figure 22.

5 V,1 A flyback converter with VIPER17HN . . . . . . . . . . . . . . . . . . . . . . . . . . . . . . . . . . . .

35

Figure 23.

Multi-output flyback converter with VIPER27HN. . . . . . . . . . . . . . . . . . . . . . . . . . . . . . . . .

36

Figure 24.

Block diagram of the implemented control . . . . . . . . . . . . . . . . . . . . . . . . . . . . . . . . . . . . .

39

Figure 25.

Stationary reference frame and rotating reference frame . . . . . . . . . . . . . . . . . . . . . . . . . .

40

Figure 26.

Implemented PLL structure. . . . . . . . . . . . . . . . . . . . . . . . . . . . . . . . . . . . . . . . . . . . . . . . .

40

Figure 27.

DQ components of the current . . . . . . . . . . . . . . . . . . . . . . . . . . . . . . . . . . . . . . . . . . . . . .

41

Figure 28.

Block diagram of the implemented MPPT algorithm. . . . . . . . . . . . . . . . . . . . . . . . . . . . . .

42

Figure 29.

Grid angle and Vd component . . . . . . . . . . . . . . . . . . . . . . . . . . . . . . . . . . . . . . . . . . . . . .

46

Figure 30.

Grid angle and grid voltage. . . . . . . . . . . . . . . . . . . . . . . . . . . . . . . . . . . . . . . . . . . . . . . . .

46

Figure 31. Grid angle (yellow), grid voltage (red), 90° phase-shifted voltage (blue) . . . . . . . . . . . . . .

46

Figure 32.

DC-DC phase-shift modulation . . . . . . . . . . . . . . . . . . . . . . . . . . . . . . . . . . . . . . . . . . . . . .

47

Figure 33. Phase-shifted signals, transformer current in CCM, power MOSFET M1 drain current . . .

47

Figure 34. Power MOSFET M1Ch1 gate signal; Ch2 drain-source voltage and drain current Ch4. .

47

Figure 35. Phase-shifted gate signals (Ch1, Ch2), primary and secondary transformer voltage


(Ch3, Ch4) . . . . . . . . . . . . . . . . . . . . . . . . . . . . . . . . . . . . . . . . . . . . . . . . . . . . . . . . . . . . .

47

Figure 36. DC-AC voltage and current in standalone mode (open-loop operation). . . . . . . . . . . . . . .

48

Figure 37.

Grid voltage (blue), inverter voltage (red), injected current (green); injected power


(math function) . . . . . . . . . . . . . . . . . . . . . . . . . . . . . . . . . . . . . . . . . . . . . . . . . . . . . . . . . .

48

Figure 38.

Inverter voltage (green) and current (blue) at 800 W,PF=0.97 . . . . . . . . . . . . . . . . . . . . . .

48

Figure 39.

Inverter voltage (green) and current (yellow) at 2500 W, PF . . . . . . . . . . . . . . . . . . . . . . .

48

Figure 40.

DC-DC converter efficiency at different input voltages . . . . . . . . . . . . . . . . . . . . . . . . . . . .

49

Figure 41.

System efficiency . . . . . . . . . . . . . . . . . . . . . . . . . . . . . . . . . . . . . . . . . . . . . . . . . . . . . . . .

49

Figure 42. MOSFET M1Ch1 gate signal, Ch2 drain-source voltage and Ch 4 drain current. . . . . . .

49

Figure 43. Phase-shifted gate signals (Ch1, Ch2), primary and secondary transformer voltage


(Ch3, Ch4) . . . . . . . . . . . . . . . . . . . . . . . . . . . . . . . . . . . . . . . . . . . . . . . . . . . . . . . . . . . . .

49

4/55

Doc ID 16555 Rev 2

AN3095

List of figures

Figure 44.

Low-side device modulation (red and blue track); high-side device modulation (yellow


track and green track). . . . . . . . . . . . . . . . . . . . . . . . . . . . . . . . . . . . . . . . . . . . . . . . . . . . .

50

Figure 45.

High-side device modulation in leg 1 (yellow track); high-side device modulation in


leg 2 (green track); inverter output voltage (blue track) . . . . . . . . . . . . . . . . . . . . . . . . . . .

50

Doc ID 16555 Rev 2

5/55

System description

AN3095


1 System description

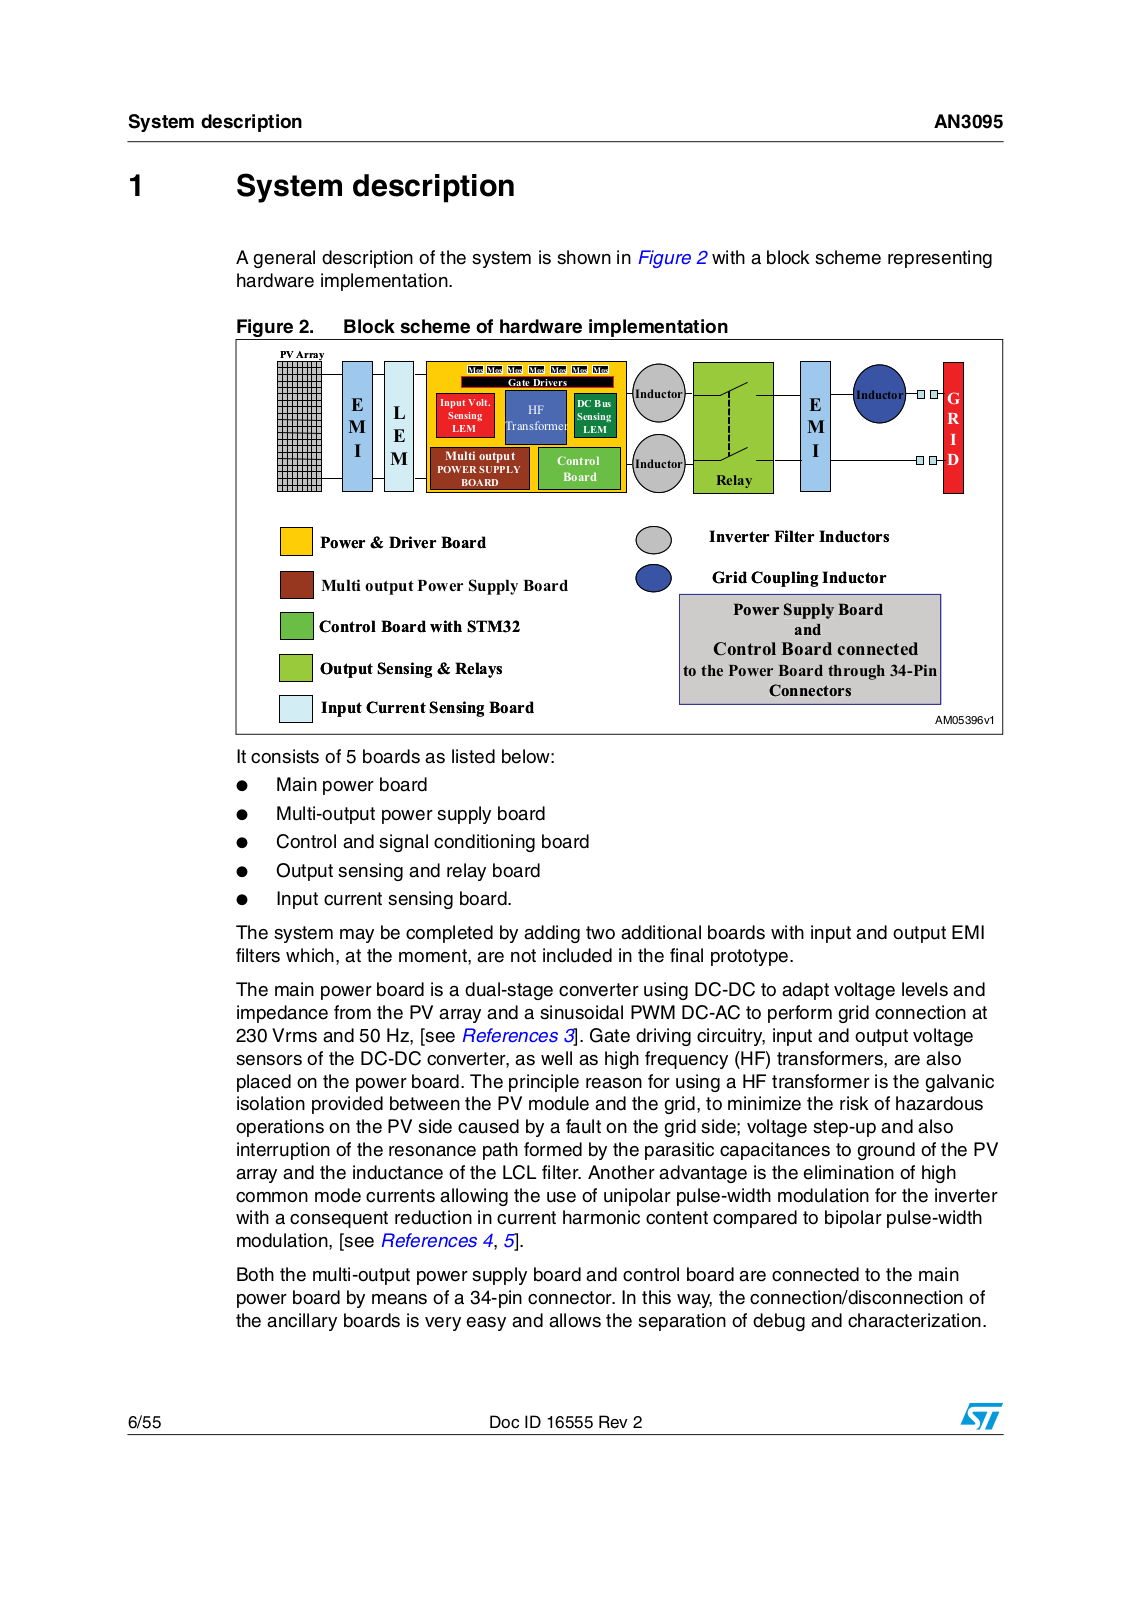
A general description of the system is shown in Figure 2 with a block scheme representing hardware implementation.

Figure 2. Block scheme of hardware implementation

39$UUD\

( / 0 ( , 0

0RV 0RV 0RV

0RV

0RV 0RV 0RV


*DWH 'ULYHUV


,QGXFWRU

,QSXW 9ROW


+)


'& %XV


6HQVLQJ


6HQVLQJ


7UDQVIRUPHU


/(0

/(0


0XOWL RXWSXW


&RQWURO

,QGXFWRU

32 (5 6833/<


%RDUG

5HOD\

%2$5'


(,QGXFWRU *

0

5

,

,

'


3RZHU 'ULYHU %RDUG

,QYHUWHU )LOWHU ,QGXFWRUV


0XOWL RXWSXW 3RZHU 6XSSO\ %RDUG

*ULG &RXSOLQJ ,QGXFWRU


&RQWURO %RDUG ZLWK 670


3RZHU 6XSSO\ %RDUG


DQG


2XWSXW 6HQVLQJ 5HOD\V

&RQWURO %RDUG FRQQHFWHG


WR WKH 3RZHU %RDUG WKURXJK 3LQ


,QSXW &XUUHQW 6HQVLQJ %RDUG


&RQQHFWRUV


!-V


It consists of 5 boards as listed below:

Main power board

Multi-output power supply board

Control and signal conditioning board

Output sensing and relay board

Input current sensing board.

The system may be completed by adding two additional boards with input and output EMI filters which, at the moment, are not included in the final prototype.

The main power board is a dual-stage converter using DC-DC to adapt voltage levels and impedance from the PV array and a sinusoidal PWM DC-AC to perform grid connection at 230 Vrms and 50 Hz, [see References 3]. Gate driving circuitry, input and output voltage sensors of the DC-DC converter, as well as high frequency (HF) transformers, are also placed on the power board. The principle reason for using a HF transformer is the galvanic isolation provided between the PV module and the grid, to minimize the risk of hazardous operations on the PV side caused by a fault on the grid side; voltage step-up and also interruption of the resonance path formed by the parasitic capacitances to ground of the PV array and the inductance of the LCL filter. Another advantage is the elimination of high common mode currents allowing the use of unipolar pulse-width modulation for the inverter with a consequent reduction in current harmonic content compared to bipolar pulse-width modulation, [see References 4, 5].

Both the multi-output power supply board and control board are connected to the main power board by means of a 34-pin connector. In this way, the connection/disconnection of the ancillary boards is very easy and allows the separation of debug and characterization.

6/55

Doc ID 16555 Rev 2

AN3095

System description


The output sensing and relays board was realized to interface the power system and the grid. This task is accomplished with the implementation of a proper control algorithm which requires both grid-current and grid-voltage sensing. For this reason, the board is equipped with current and voltage Hall effect sensors. Two relays, controlled by an I/O of the microcontroller, are also placed on the same PCB to interrupt/connect phase and neutral of the system to phase and neutral of the grid. Moreover, this board is provided with two-way connectors for electrical wiring of the LCL filter to the main power board.

The multi-output power supply board implements two independent offline flyback converters, with wide input voltage range, based on VIPER technology, to generate the following output voltages:

+5 V to supply DC-DC converter gate drivers

+5 V to supply DC-AC converter gate drivers

+5 V to supply the microcontroller

+/-15 V for LEM sensors supply

24 V for relays supply

The main advantage of an offline solution is the availability of a power supply for circuits dedicated to communication and data transfer even at night or in the case of weak PV field energy production. The price to pay for such an advantage is higher power consumption during standby mode of the main power unit.

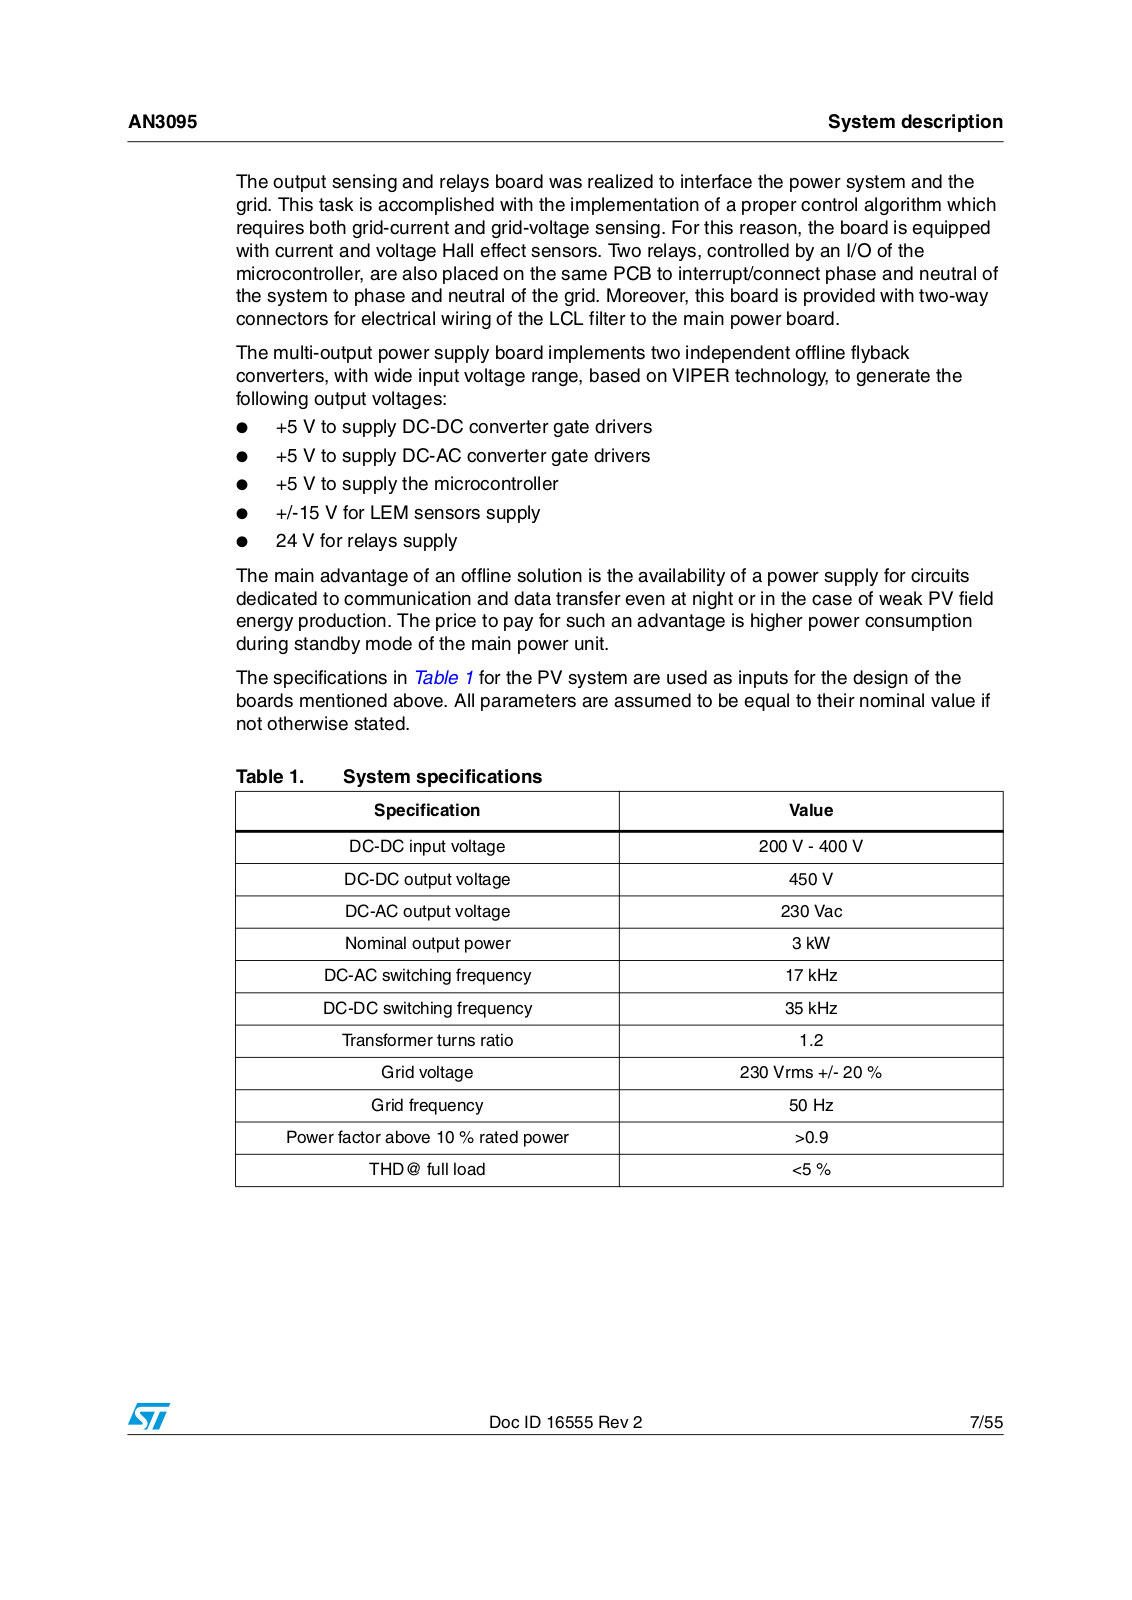
The specifications in Table 1 for the PV system are used as inputs for the design of the boards mentioned above. All parameters are assumed to be equal to their nominal value if not otherwise stated.

Table 1.

System specifications


Specification

Value


DC-DC input voltage

200 V - 400 V


DC-DC output voltage

450 V


DC-AC output voltage

230 Vac


Nominal output power

3 kW


DC-AC switching frequency

17 kHz


DC-DC switching frequency

35 kHz


Transformer turns ratio

1.2


Grid voltage

230 Vrms +/- 20 %


Grid frequency

50 Hz


Power factor above 10 % rated power

>0.9


THD@ full load

<5 %


Doc ID 16555 Rev 2

7/55

DC-DC converter

AN3095


2 DC-DC converter

The dual-stage inverter for grid-connected applications includes a DC-DC converter to amplify the voltage and a DC-AC inverter to control the current injected into the grid.

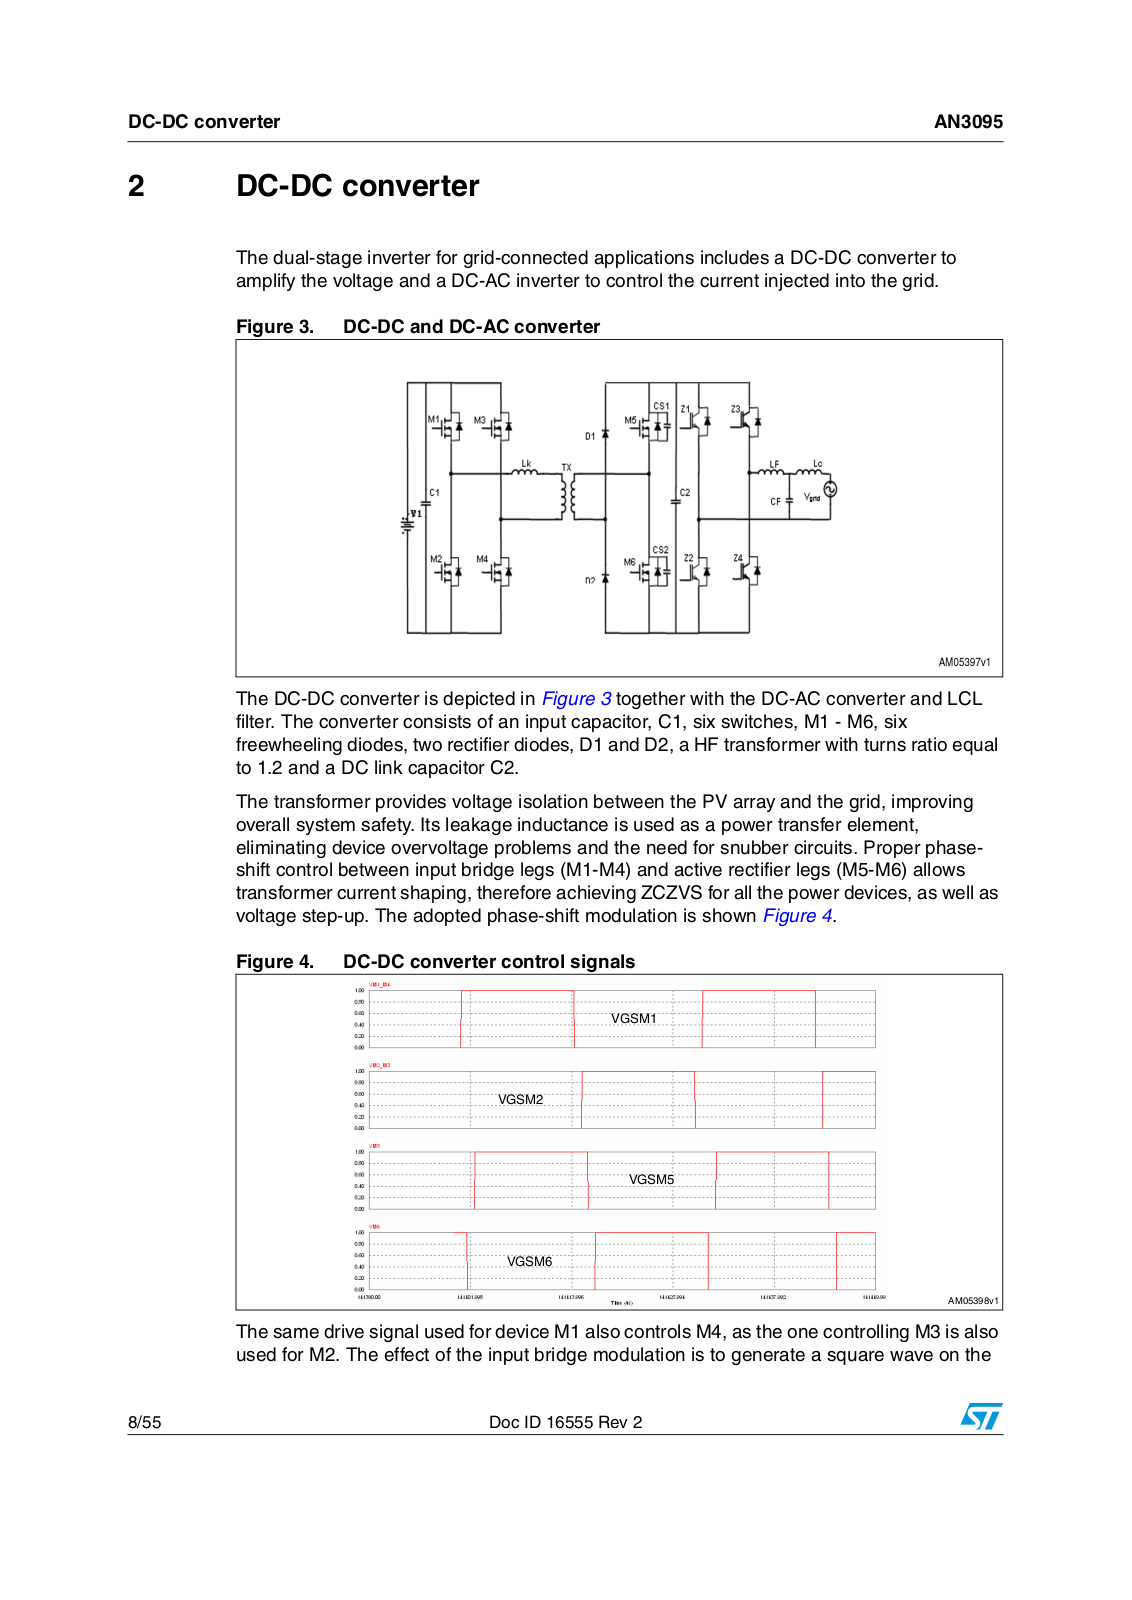
Figure 3. DC-DC and DC-AC converter

The DC-DC converter is depicted in Figure 3 together with the DC-AC converter and LCL filter. The converter consists of an input capacitor, C1, six switches, M1 - M6, six freewheeling diodes, two rectifier diodes, D1 and D2, a HF transformer with turns ratio equal to 1.2 and a DC link capacitor C2.

The transformer provides voltage isolation between the PV array and the grid, improving overall system safety. Its leakage inductance is used as a power transfer element, eliminating device overvoltage problems and the need for snubber circuits. Proper phaseshift control between input bridge legs (M1-M4) and active rectifier legs (M5-M6) allows transformer current shaping, therefore achieving ZCZVS for all the power devices, as well as voltage step-up. The adopted phase-shift modulation is shown Figure 4.

Figure 4. DC-DC converter control signals

VGSM1

VGSM2

VGSM5

VGSM6

AM05398v1

The same drive signal used for device M1 also controls M4, as the one controlling M3 is also used for M2. The effect of the input bridge modulation is to generate a square wave on the

8/55

Doc ID 16555 Rev 2

AN3095

DC-DC converter


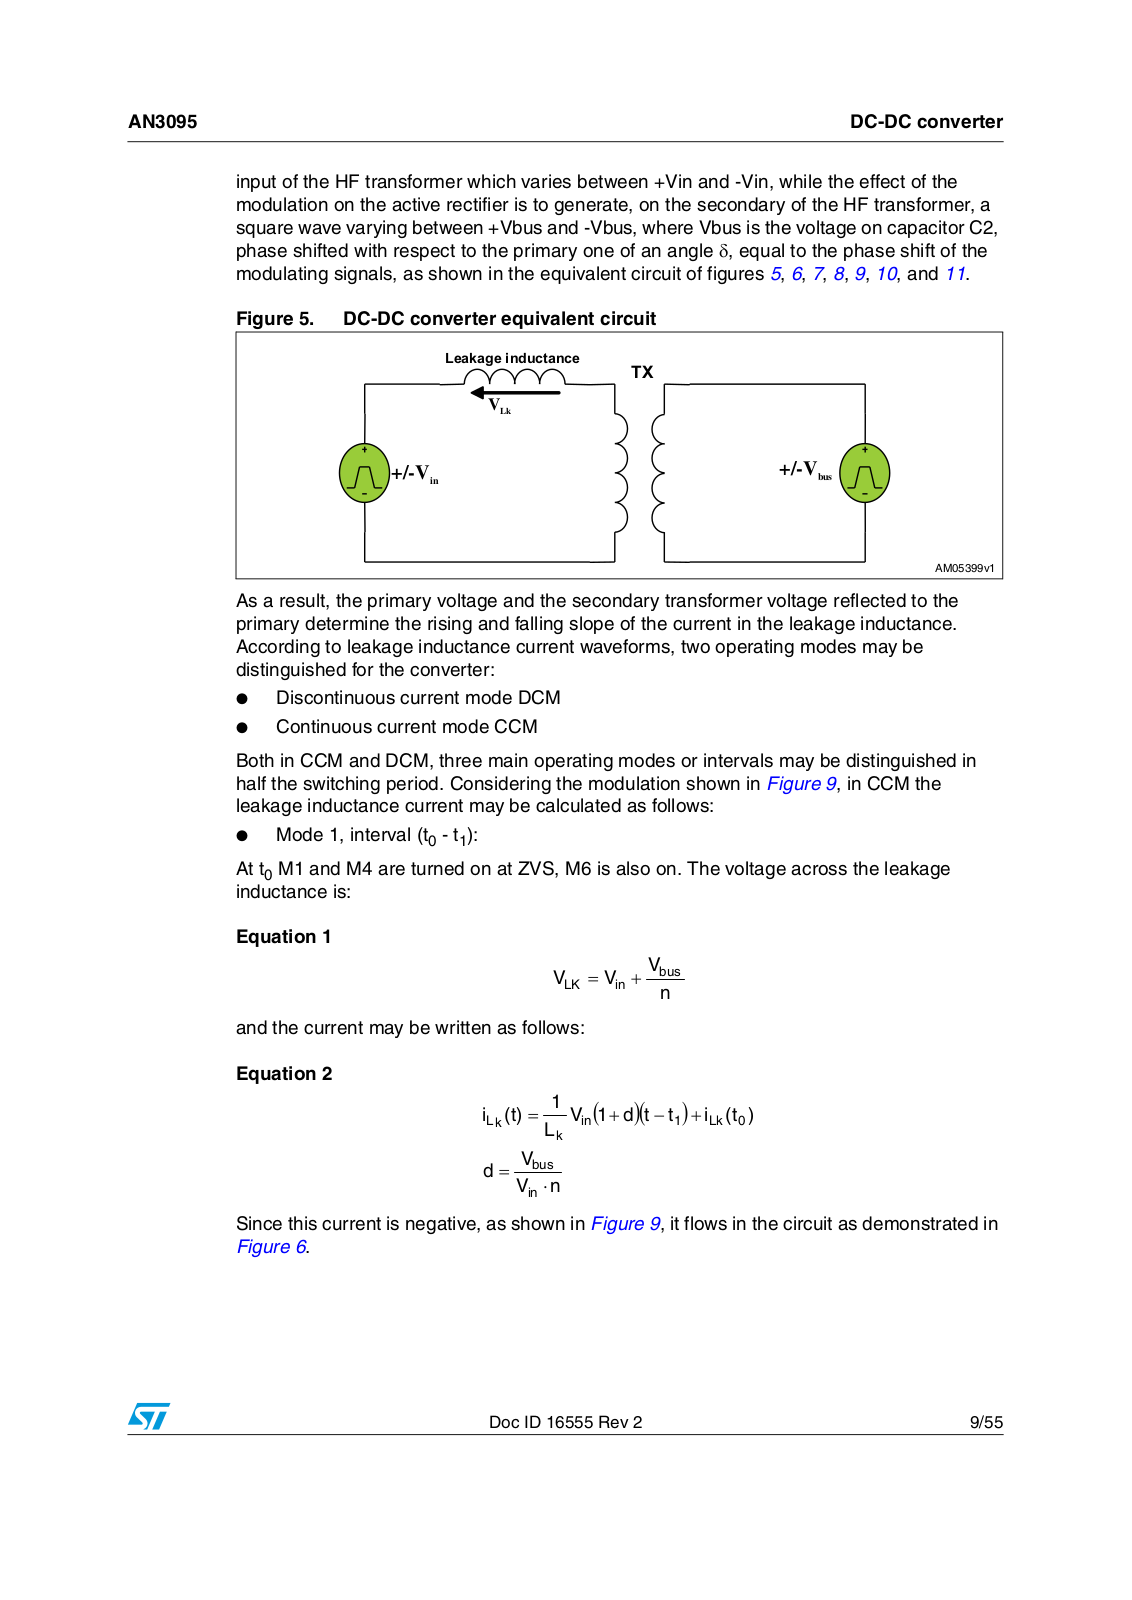
input of the HF transformer which varies between +Vin and -Vin, while the effect of the modulation on the active rectifier is to generate, on the secondary of the HF transformer, a square wave varying between +Vbus and -Vbus, where Vbus is the voltage on capacitor C2, phase shifted with respect to the primary one of an angle δ, equal to the phase shift of the modulating signals, as shown in the equivalent circuit of figures 5, 6, 7, 8, 9, 10, and 11.

Figure 5. DC-DC converter equivalent circuit


/HDNDJH LQGXFWDQFH

7;


6,K

6IN

6BUS

!-V

As a result, the primary voltage and the secondary transformer voltage reflected to the primary determine the rising and falling slope of the current in the leakage inductance. According to leakage inductance current waveforms, two operating modes may be distinguished for the converter:

Discontinuous current mode DCM

Continuous current mode CCM

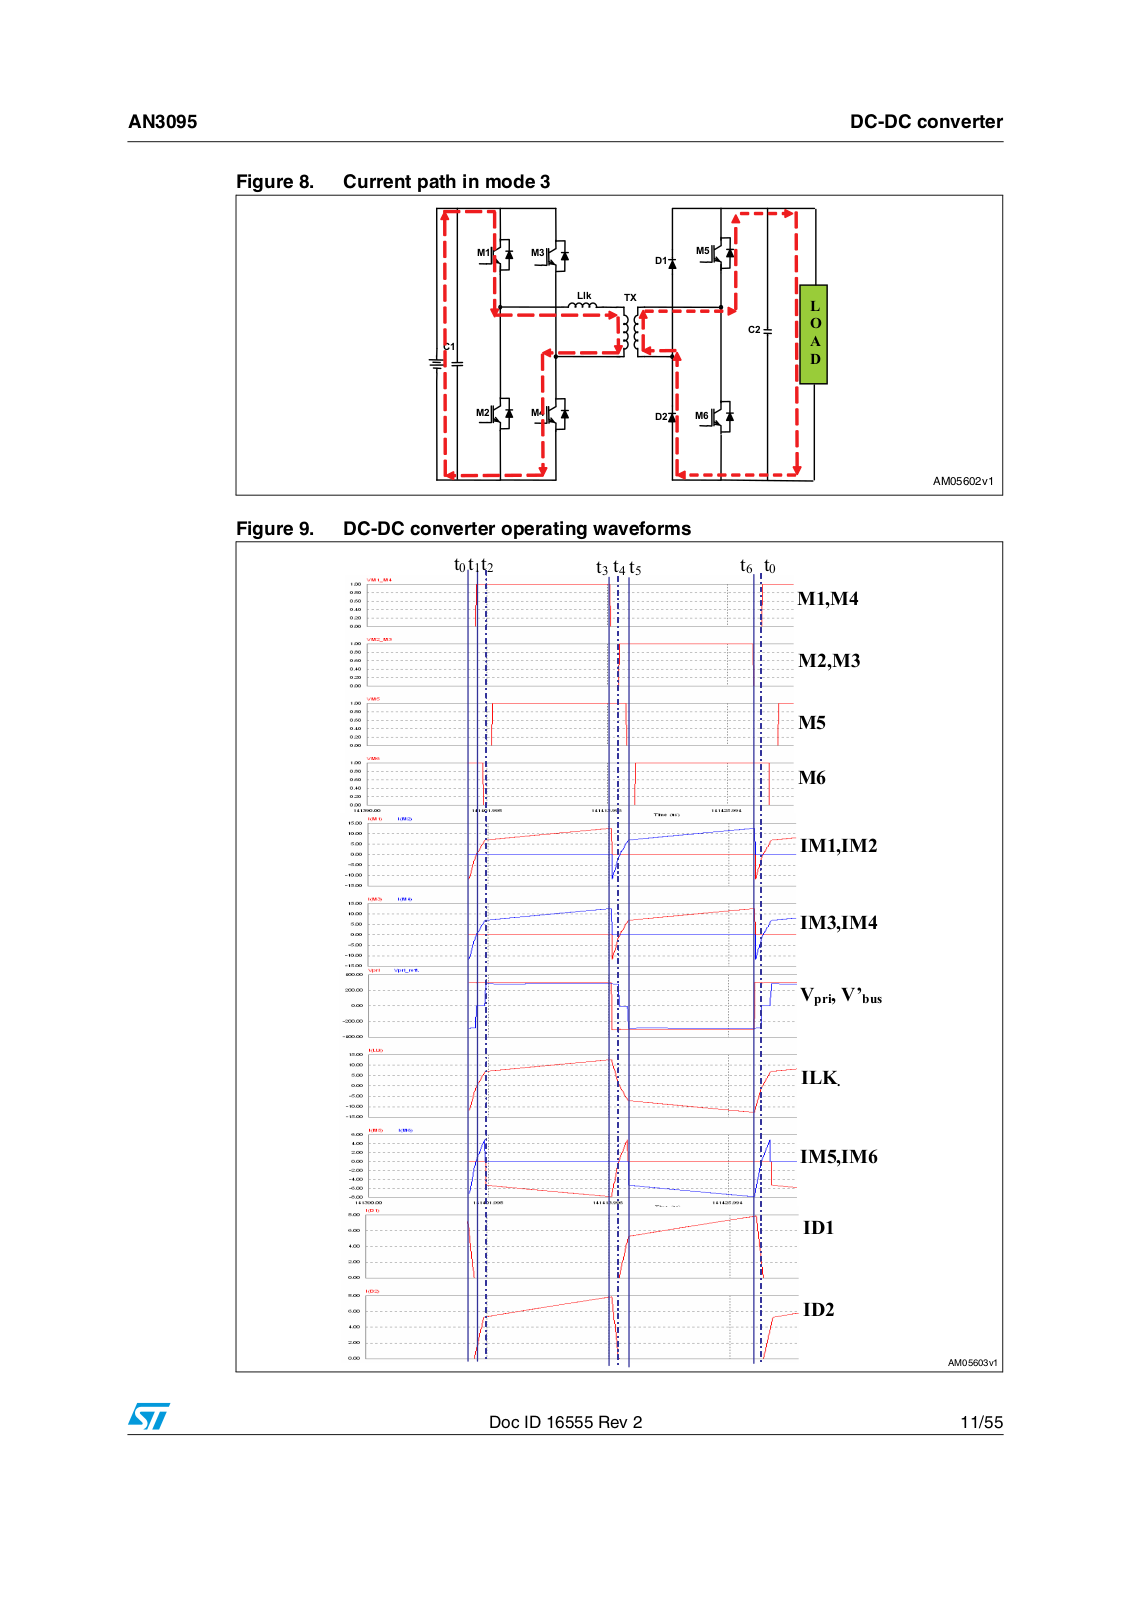
Both in CCM and DCM, three main operating modes or intervals may be distinguished in half the switching period. Considering the modulation shown in Figure 9, in CCM the leakage inductance current may be calculated as follows:

Mode 1, interval (t0 - t1):

At t0 M1 and M4 are turned on at ZVS, M6 is also on. The voltage across the leakage inductance is:

Equation 1

VLK = Vin + Vbus

n

and the current may be written as follows:

Equation 2

i

(t) =

1

V

(1+ d)(t − t


)+i


(t


)


1

Lk

0

Lk


in


Lk


d = Vbus

Vin n

Since this current is negative, as shown in Figure 9, it flows in the circuit as demonstrated in

Figure 6.

Doc ID 16555 Rev 2

9/55

DC-DC converter

AN3095


Figure 6. Current flow in mode 1

0

0

'

0


/ON

7;


/


&

2


$

&


'

9LQ


0

0

'

0


!-V

This mode ends when leakage inductor current reaches zero at t=t1.

Mode 2, interval (t1-t2):

When the leakage inductor current reaches zero, D1 and D2 turn-off with soft switching, as the current naturally reaches zero. After t=t1 M6 is still on, primary current changes polarity and flows through M1 and M4. On the secondary side the transformer is shorted through M6 and D2, as shown in Figure 7. Inductor current may be written as:

Equation 3


iLk (t) = 1

Vin (t − t1 )+iLk (t0 )


Lk


Figure 7. Current flow in mode 2


0

0

0


'


/ON

7;


/


&

2


$

&


'

9LQ


0

0

' 0


!-V

Mode 3, interval (t2-t3):

At t=t2 M6 is turned off and M5 is turned on under ZVS. A positive voltage equal to +Vbus is applied on transformer secondary winding. Leakage inductor current is given by:

Equation 4

i

(t) =

1

V

(1− d)(t − t2)+i


(t


)


Llk

2

LK


in


Lk


The current path in the circuit is drawn in Figure 8.

10/55

Doc ID 16555 Rev 2

ST AN3095 APPLICATION NOTE

AN3095


DC-DC converter

Figure 8.

Current path in mode 3


0

0

'

0


/ON

7;


/


&

2


$


&


'


0

0

'

0


!-V

Figure 9.

DC-DC converter operating waveforms


t0 t1t2


t3 t4 t5

t6 t0


M1,M4

M2,M3

M5

M6

IM1,IM2

IM3,IM4

Vpri, V’bus

ILK.

IM5,IM6

ID1

ID2

AM05603v1

Doc ID 16555 Rev 2

11/55

DC-DC converter

AN3095


Due to symmetry during the two halves of the switching period, current expressions and current paths may be derived with similar considerations for the second half of the switching period.

If d >1 the current in the leakage inductor may reach zero and there is a boundary between CCM and DCM.

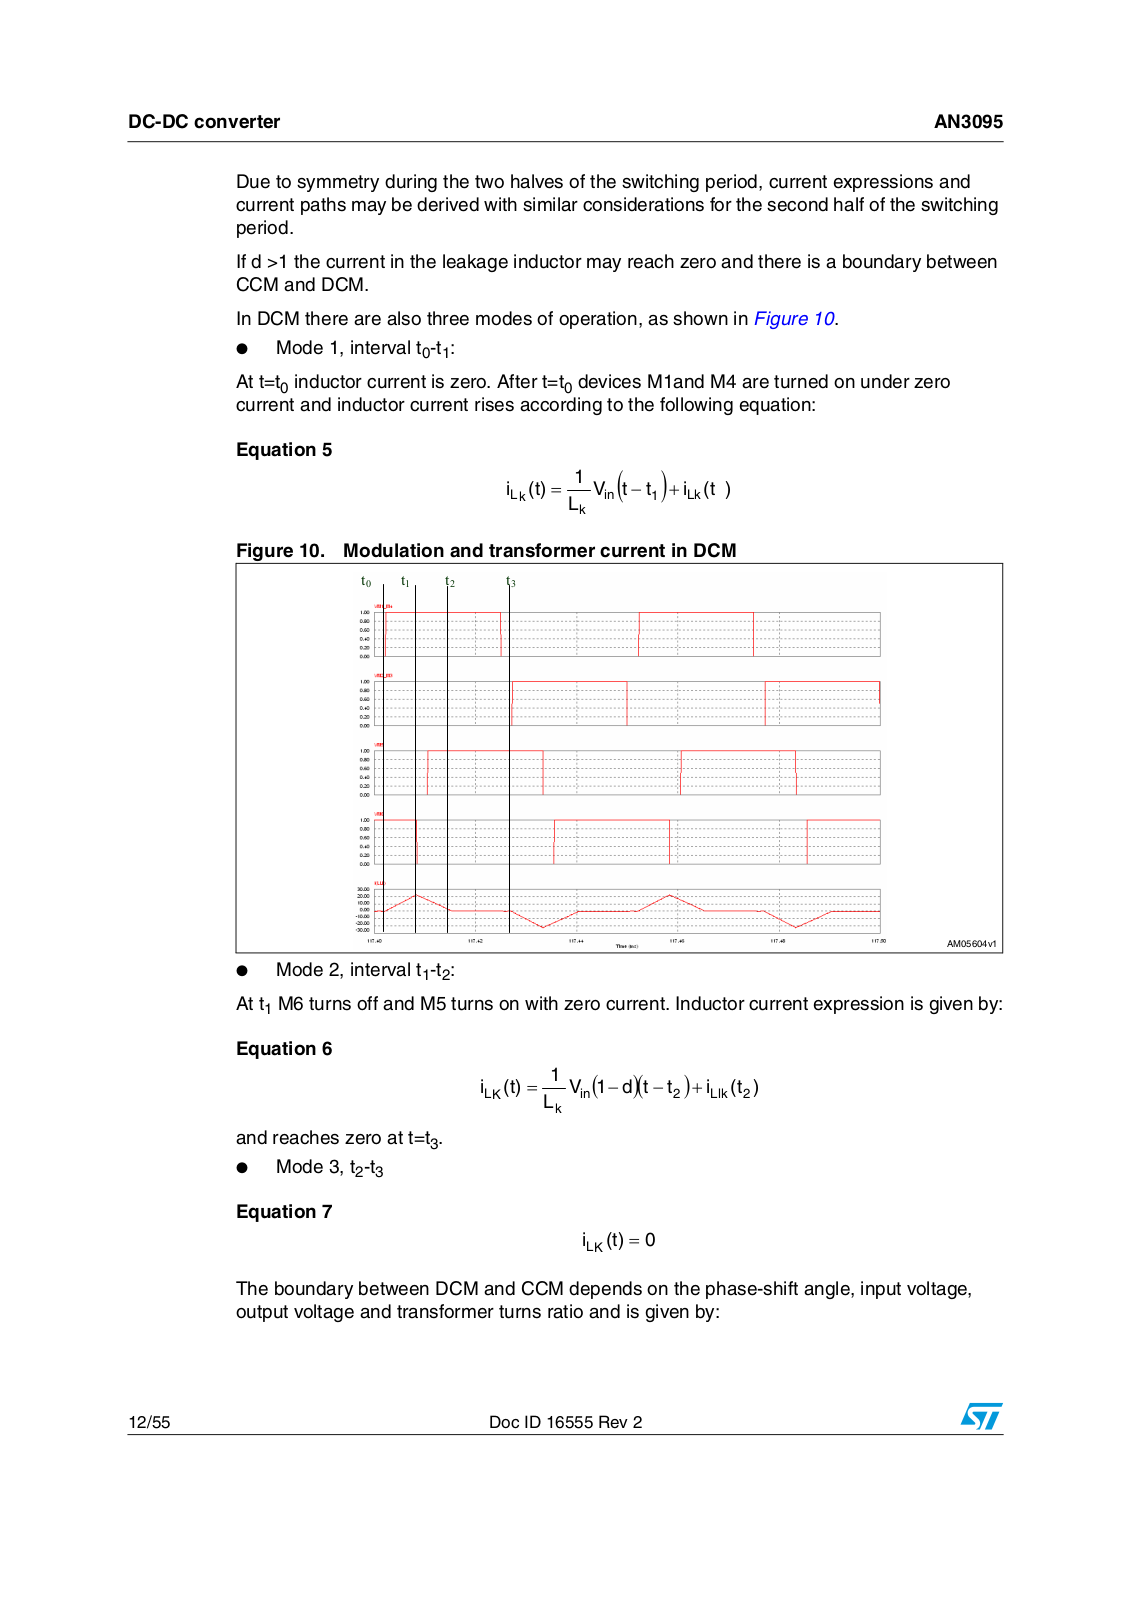
In DCM there are also three modes of operation, as shown in Figure 10.

Mode 1, interval t0-t1:

At t=t0 inductor current is zero. After t=t0 devices M1and M4 are turned on under zero current and inductor current rises according to the following equation:

Equation 5

iLk

(t) =

1

Vin (t − t1 )+iLk (t )


Lk

Figure 10. Modulation and transformer current in DCM

t0


t1

t2

t

3


AM05604v1

Mode 2, interval t1-t2:

At t1 M6 turns off and M5 turns on with zero current. Inductor current expression is given by:

Equation 6

i

(t) =

1

V

(1− d)(t − t


)+i


(t


)


2

Llk

2

LK


in


Lk


and reaches zero at t=t3.

Mode 3, t2-t3

Equation 7

iLK (t) = 0

The boundary between DCM and CCM depends on the phase-shift angle, input voltage, output voltage and transformer turns ratio and is given by:

12/55

Doc ID 16555 Rev 2

AN3095

DC-DC converter


Equation 8

φB = d −1π d

By integrating the leakage current expression over the switching period and multiplying the result by the input voltage value the expression of power transfer may be derived as:

Equation 9


2


d


P =

Vin


φ2

φ < φ

B


ωsLk


2π(d −1)


V2


d


P =

in


F(φ)

φ > φB


2


ωsLk


2(2 + d)


where ωs=2πfs is the switching frequency in rad/s, φ=ωst is the phase-shift angle and

F(φ) = π(1+ d − 2d2 ) + 4φ(1+ d + d2 ) − 2 φ2 (2 + 2d + d2 ) .

π

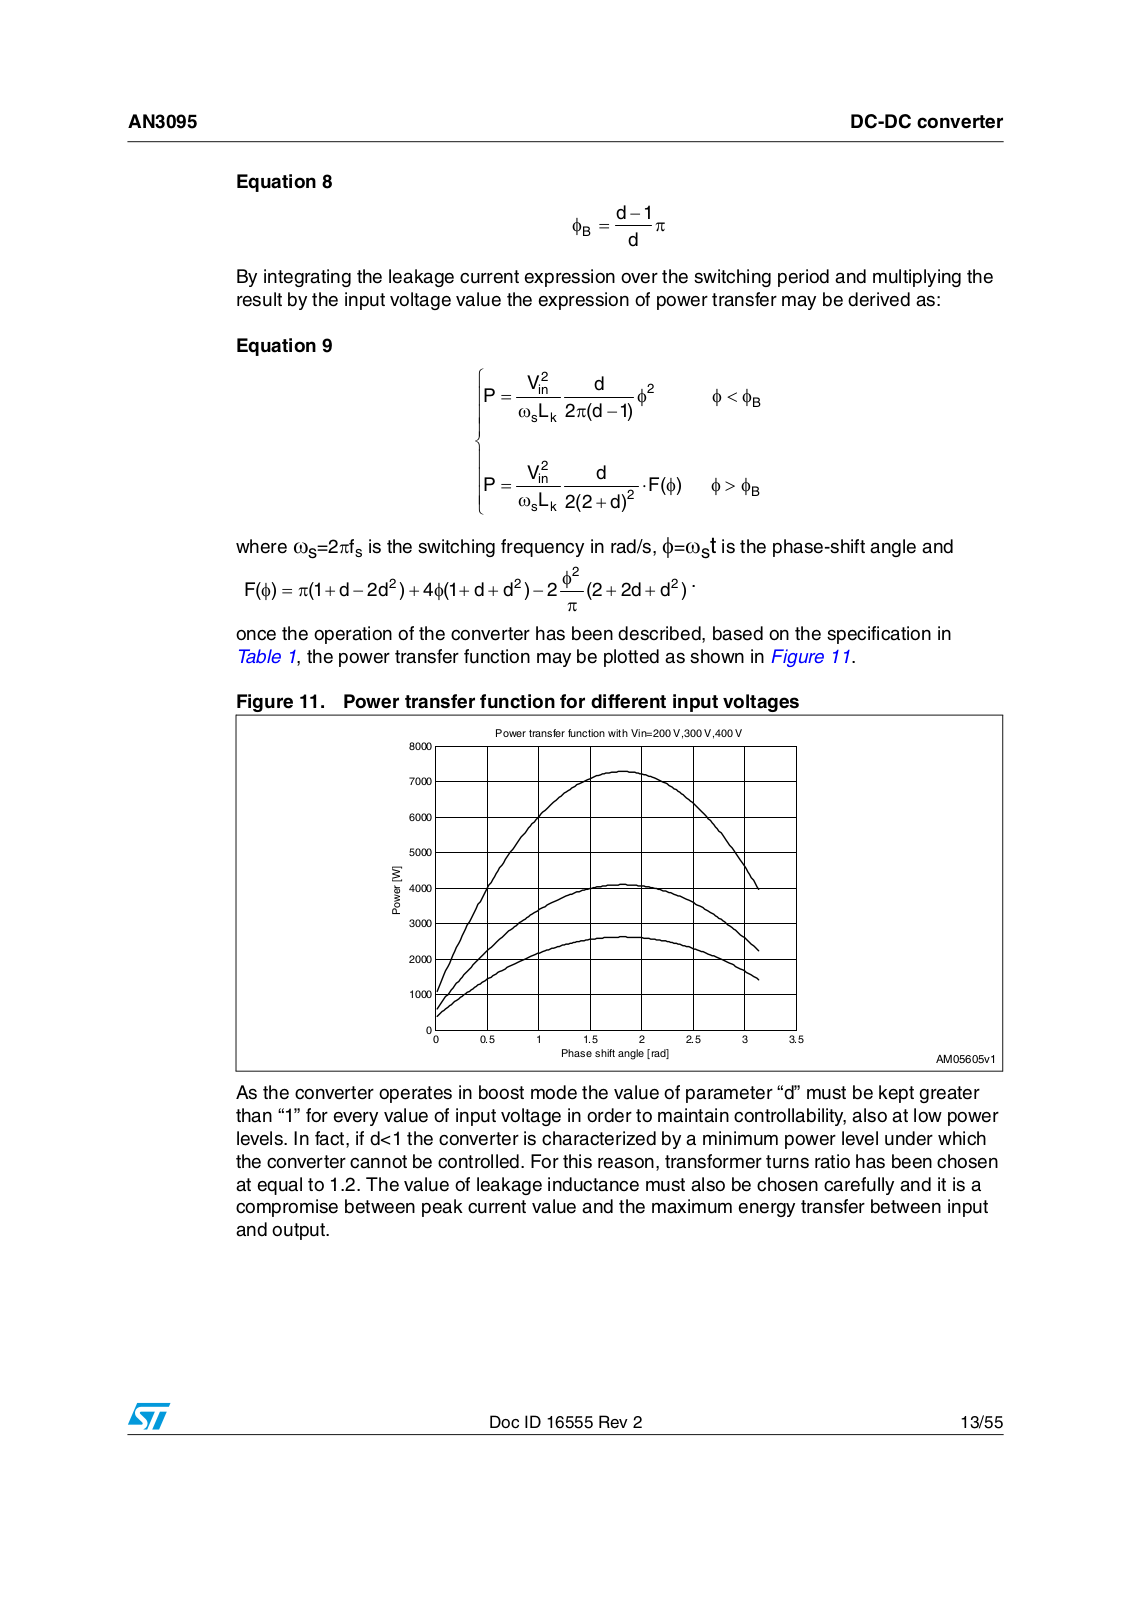
once the operation of the converter has been described, based on the specification in Table 1, the power transfer function may be plotted as shown in Figure 11.

Figure 11. Power transfer function for different input voltages


0OWER TRANSFER FUNCTION WITH 6IN 6 6 6


;7=


0OWER


0HASE SHIFT ANGLE ;RAD=


!-V


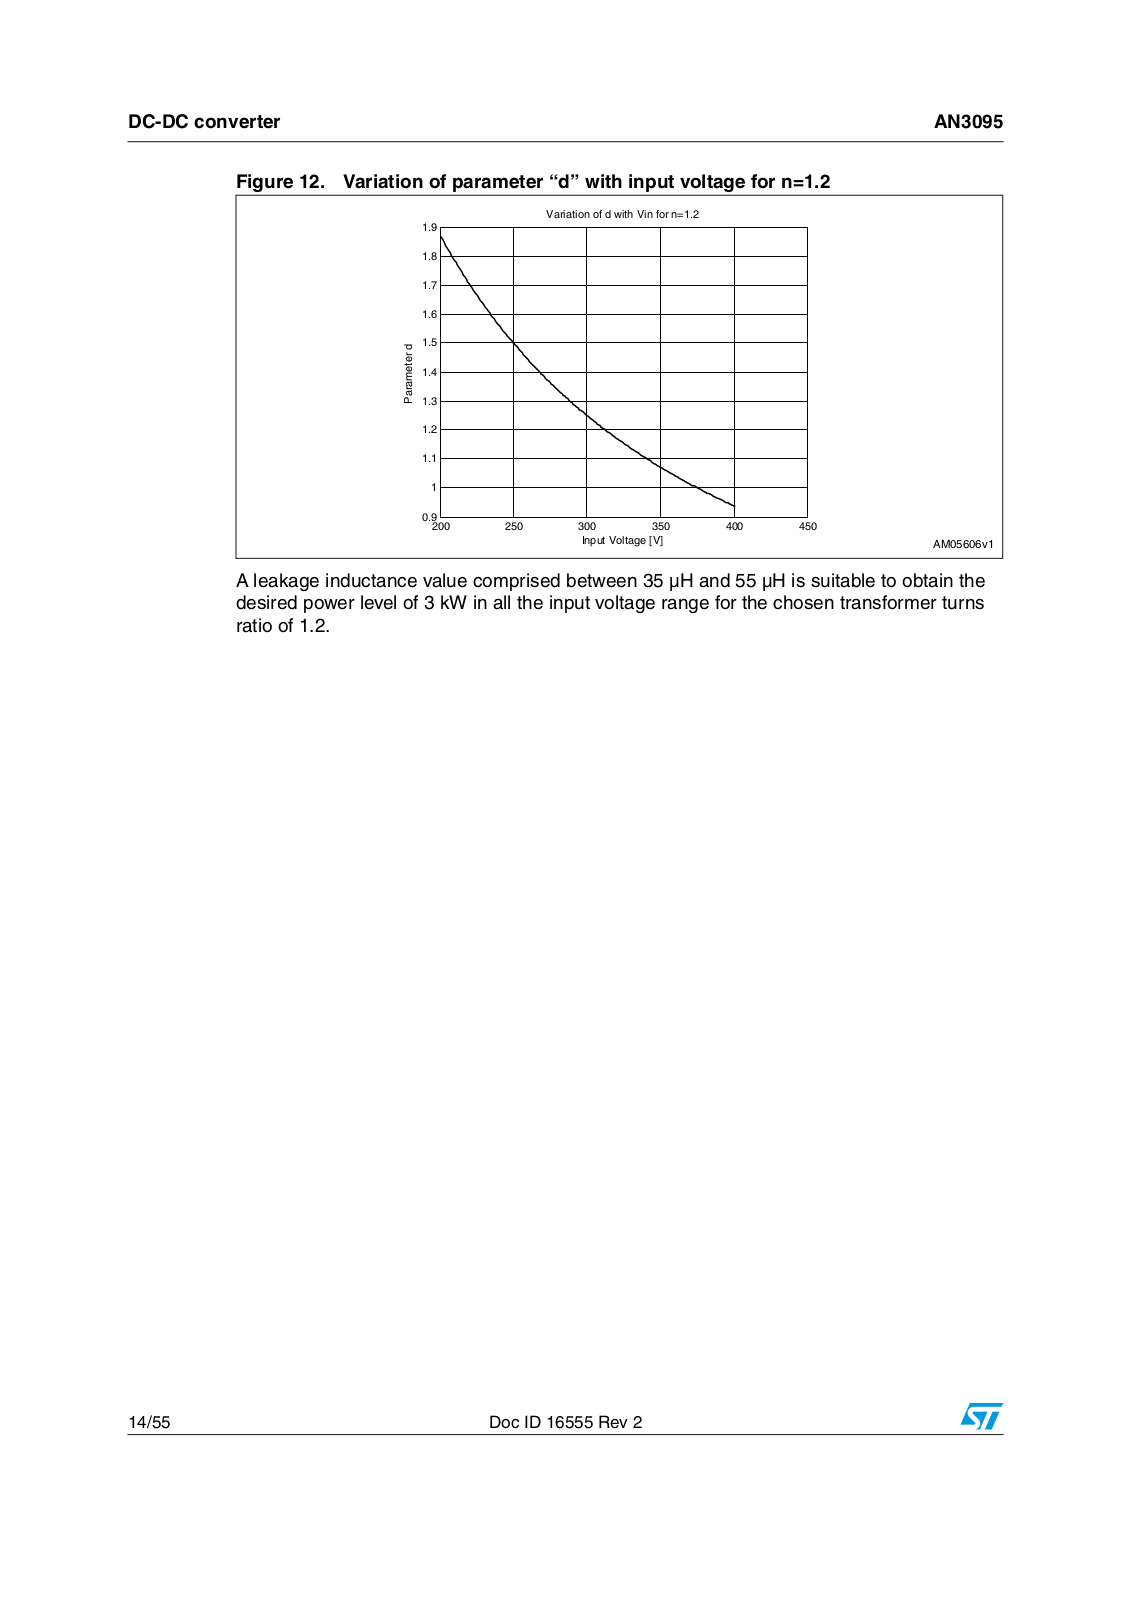
As the converter operates in boost mode the value of parameter “d” must be kept greater than “1” for every value of input voltage in order to maintain controllability, also at low power levels. In fact, if d<1 the converter is characterized by a minimum power level under which the converter cannot be controlled. For this reason, transformer turns ratio has been chosen at equal to 1.2. The value of leakage inductance must also be chosen carefully and it is a compromise between peak current value and the maximum energy transfer between input and output.

Doc ID 16555 Rev 2

13/55

DC-DC converter

AN3095


Figure 12. Variation of parameter “d” with input voltage for n=1.2


6ARIATION OF D WITHH6INNFOR N


D


0ARAMETER


)NPUT 6OLTAGE ;6=


!-V


A leakage inductance value comprised between 35 µH and 55 µH is suitable to obtain the desired power level of 3 kW in all the input voltage range for the chosen transformer turns ratio of 1.2.

14/55

Doc ID 16555 Rev 2

AN3095

DC-DC converter design


3 DC-DC converter design

After having described the operation of the DC-DC converter, the design may be completed according to the specifications in Table 1.

Input power: assuming 90 % efficiency the input power is:

Equation 10

Pin = Pout = 3333 W

0.9

Maximum average input current:

Equation 11

I

=

Pin

=

3333

=16.66 A


in


Vinmin

200


Maximum average output current:

Equation 12

I

=

Pout

= 7.5 A


out


Voutmin


Maximum input power device RMS current value:

Equation 13

Irms

= 2 Dmax Iin

1+K +K2

3(K

+1)2


Where K=0 for triangular waveforms and K=1 for rectangular waveforms. This said, the maximum RMS current value in DCM is:

Equation 14

I

= 2 D

I

1+K +K2

D

max I

=13.6 A


+1)2

= 2

rms_ DCM


max in 3(K


3 In


And assuming K=0.6 for trapezoidal current waveform in CCM:

Equation 15

I

= 2 D

I

1+K +K2

= 2 D

I 1.15 = 27.2 A


+1)2

rms_ CCM


max in 3(K


max In

Minimum input power device breakdown voltage:

Equation 16

VBrkMos =1.3 •VMPPTmax =1.3 * 400 = 520 V

Doc ID 16555 Rev 2

15/55

DC-DC converter design

AN3095


Transformer turns ratio:

As the converter operates in boost mode, to avoid problems of controllability for low power levels, the value of parameter “d” must always be greater than one:

Equation 17

d ≥1→ n ≤ Vout ≤1.12

dVinMAX

Moreover, considering the voltage drop across the leakage inductor it is possible to operate the converter with n=1.2 without incurring regulation problems for high input voltage values at low power.

Minimum output power device breakdown voltage:

Equation 18

VBrkMos _ OUTPUT =1.2 •VMPPTmax * n =1.2 * 400 = 576 V

Power device selection:

According to the calculations above, four STW55NM60ND MOSFETs were selected for the input bridge and also two STW55NM60NDs for the active rectifier. The main characteristics of this MOSFET are reported in Table 2 and 3:

Table 2.

MOSFET electrical characteristics


VDS@Tjmax

RDSon_max

ID@100°C

Coss

Qg


650 V


0.06 Ω

29 A

900 pF

190 nC


Rectifier diode selection:

Two STTH60L06s are selected for the diode leg. The main characteristics are shown in

Figure 3:

Table 3.

Diode rectifier electrical characteristics


Vf_max @150 °C IF=60 A

Vrrm

Trr_max

IF

IRM


1.4 V

600 V

85 n

60 A

10.5 A


Input capacitor value:

The input capacitor, C1, is designed to smooth the high frequency ripple at the input of the PV array. If the current generated by the module is assumed to be constant and the current drawn by the converter is assumed to be a pulse train, the following equation gives the value of the input capacitance:

Equation 19

C1

>

Parray

2fs varray Vinmin


16/55

Doc ID 16555 Rev 2

AN3095

DC-DC converter design


where:


Parray is the PV field maximum output power,

Varray is the allowable peak-to-peak voltage

ripple at the input of the array, fs is the switching frequency and Vinmin is the minimum operating value for the input voltage. Assuming 90 % efficiency for the converter and 0.1 %

of admissible peak-to-peak ripple voltage the input capacitance value is:

Equation 20


C1

>


Parray

=

3333.33

=1.1mF

2fs

varray Vinmin

2 * 35000 * 0.2 * 200


Three 330 µF, 450 V electrolytic capacitors are connected in parallel at the input of the converter to limit the effect of the high frequency ripple on the PV generator.

Output capacitor value:

In a similar way the value of the C2 bus capacitor may be calculated, taking the fact that the ripple is sinusoidal at twice the grid frequency into account:

Equation 21

C2

>


Pout

=

3000

=1.17 mF

grid

vbus Vbus

2 * 2 * π* 50 * 9 * 450


where the peak-to-peak voltage of 9 V corresponds to a voltage ripple of 1 % of the nominal bus voltage and the grid frequency is 50 Hz.

HF transformer design:

The design is based on the core geometry method. The transformer specifications are shown in Table 4:

Table 4.

HF transformer specifications


Specification


Symbol

Value


Nominal input voltage


Vin

300 V

Maximum input voltage


Vinmax

400 V

Minimum input voltage


Vinmin

200 V


Input current


Iin

27 A

Nominal output voltage


Vout

450 V


Output current


Iout

22.5 A


Switching frequency


f

35 kHz


Efficiency


η

99 %


Regulation


α

0.15


Max operating flux density


Bm

0.15 T


Window utilization


Ku

0.3


Duty cycle


Dmax

0.5

Maximum temperature rise


Tr

70 °C

Doc ID 16555 Rev 2

17/55

Loading...
+ 38 hidden pages