

Page 1
AN2951
Application note
3 kW fixed-off-time (FOT) power factor correction
Introduction
In recent years, regulation in terms of electrical efficiency, electromagnetic noise, and
reliability of the electronic apparatus, in all the application fields, are pushing to use power
factor correction in almost all applications; from low power range to high power range, and
from industrial to domestic applications.
For this reason the design of a new PFC architecture is required to satisfy these new
priorities. The PFC must work from a few watts to thousands of watts and also use cheap
devices and materials. The design described in this paper is able to cover most of the
common domestic and industrial applications.
A few examples of the application fields are: air conditioning, inverters (for fans and pumps),
welding machinery, and industrial battery chargers.
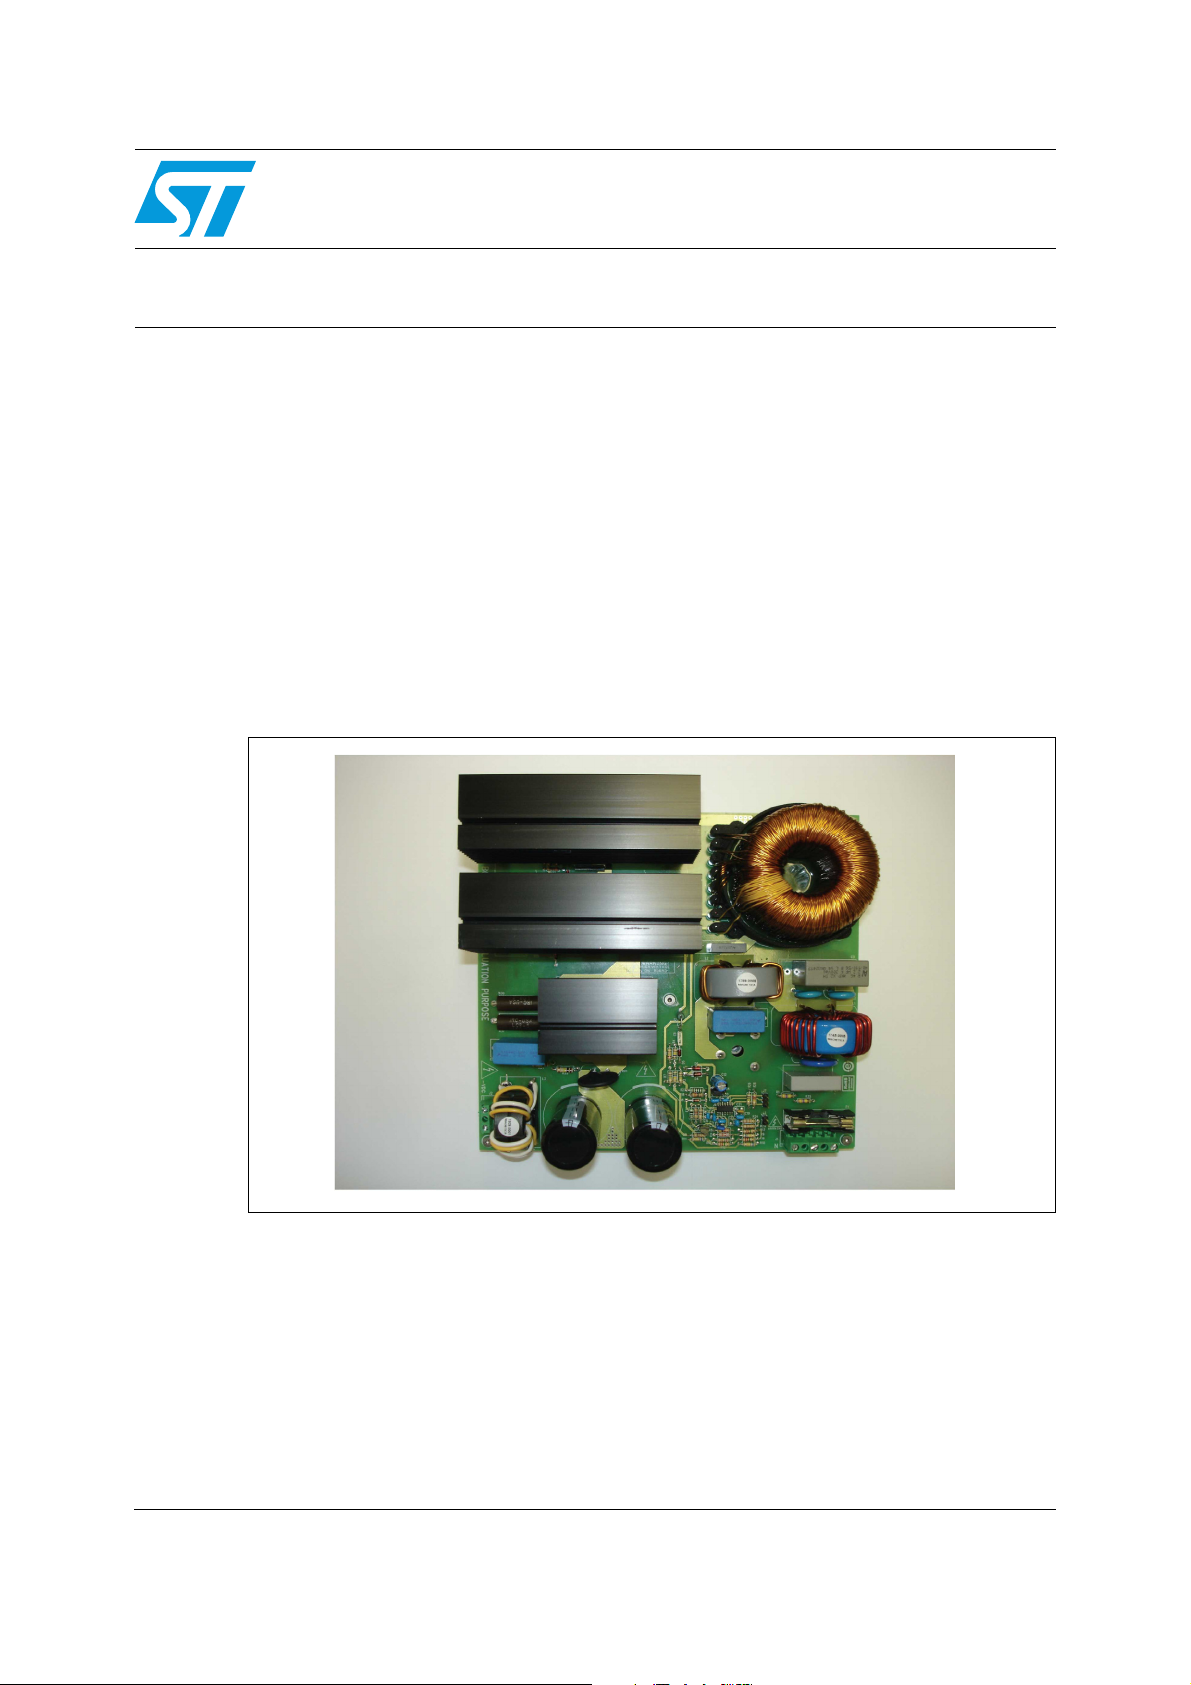
Figure 1. STEVAL-ISF001V1, 3 kW FOT PFC board-top view
June 2010 Doc ID 15500 Rev 1 1/27
!-V
www.st.com
Page 2

Contents AN2951
Contents
1 PFC working mode general description . . . . . . . . . . . . . . . . . . . . . . . . . 5
2 Practical implementation of an FOT-controlled PFC preregulator . . . . 6
3 Fixed-off-time using the L6562 . . . . . . . . . . . . . . . . . . . . . . . . . . . . . . . . 7
4 Working mode along line period in a FOT PFC . . . . . . . . . . . . . . . . . . . 9
5 Practical 3 kW FOT PFC design . . . . . . . . . . . . . . . . . . . . . . . . . . . . . . . 12
6 Power dissipation . . . . . . . . . . . . . . . . . . . . . . . . . . . . . . . . . . . . . . . . . . 16
7 Schematic and circuit description . . . . . . . . . . . . . . . . . . . . . . . . . . . . . 18
8 Experimental results and scope acquisition . . . . . . . . . . . . . . . . . . . . 22
9 Revision history . . . . . . . . . . . . . . . . . . . . . . . . . . . . . . . . . . . . . . . . . . . 26
2/27 Doc ID 15500 Rev 1
Page 3

AN2951 List of tables
List of tables
Table 1. Technical specifications . . . . . . . . . . . . . . . . . . . . . . . . . . . . . . . . . . . . . . . . . . . . . . . . . . . 12
Table 2. Measurements for Vinac = 185 Vac . . . . . . . . . . . . . . . . . . . . . . . . . . . . . . . . . . . . . . . . . . 22
Table 3. Measurements for Vinac = 230 Vac . . . . . . . . . . . . . . . . . . . . . . . . . . . . . . . . . . . . . . . . . . 23
Table 4. Measurements for Vinac = 265 Vac . . . . . . . . . . . . . . . . . . . . . . . . . . . . . . . . . . . . . . . . . . 23
Table 5. Document revision history . . . . . . . . . . . . . . . . . . . . . . . . . . . . . . . . . . . . . . . . . . . . . . . . . 26
Doc ID 15500 Rev 1 3/27
Page 4

List of figures AN2951
List of figures
Figure 1. STEVAL-ISF001V1, 3 kW FOT PFC board-top view . . . . . . . . . . . . . . . . . . . . . . . . . . . . . . 1
Figure 2. Line, inductor, switch and diode current on TM and CCM control . . . . . . . . . . . . . . . . . . . . 5
Figure 3. Block diagram of a fixed-off-time architecture . . . . . . . . . . . . . . . . . . . . . . . . . . . . . . . . . . . 6
Figure 4. FOT control with the L6562 and relevant timing waveforms. . . . . . . . . . . . . . . . . . . . . . . . . 8
Figure 5. Working mode along line semiperiod . . . . . . . . . . . . . . . . . . . . . . . . . . . . . . . . . . . . . . . . . . 9
Figure 6. Inductor, switch and diode currents in a CCM FOT-controlled PFC stage . . . . . . . . . . . . . 10
Figure 7. 3 kW FOT PFC demonstration board (STEVAL-ISF001V1) . . . . . . . . . . . . . . . . . . . . . . . . 12
Figure 8. 3 kW PFC STEVAL-ISF001V1 schematic . . . . . . . . . . . . . . . . . . . . . . . . . . . . . . . . . . . . . 20
Figure 9. MAGNETICA technical sheet . . . . . . . . . . . . . . . . . . . . . . . . . . . . . . . . . . . . . . . . . . . . . . . 21
Figure 10. Scope acquisition. Working conditions: Vinac=220 AC; Pout=500 W . . . . . . . . . . . . . . . . 24
Figure 11. Scope acquisition: startup with a connected load of 1200 W . . . . . . . . . . . . . . . . . . . . . . . 25
Figure 12. EMI tests after the design and assembling of the filters . . . . . . . . . . . . . . . . . . . . . . . . . . . 25
4/27 Doc ID 15500 Rev 1
Page 5
AN2951 PFC working mode general description
1 PFC working mode general description
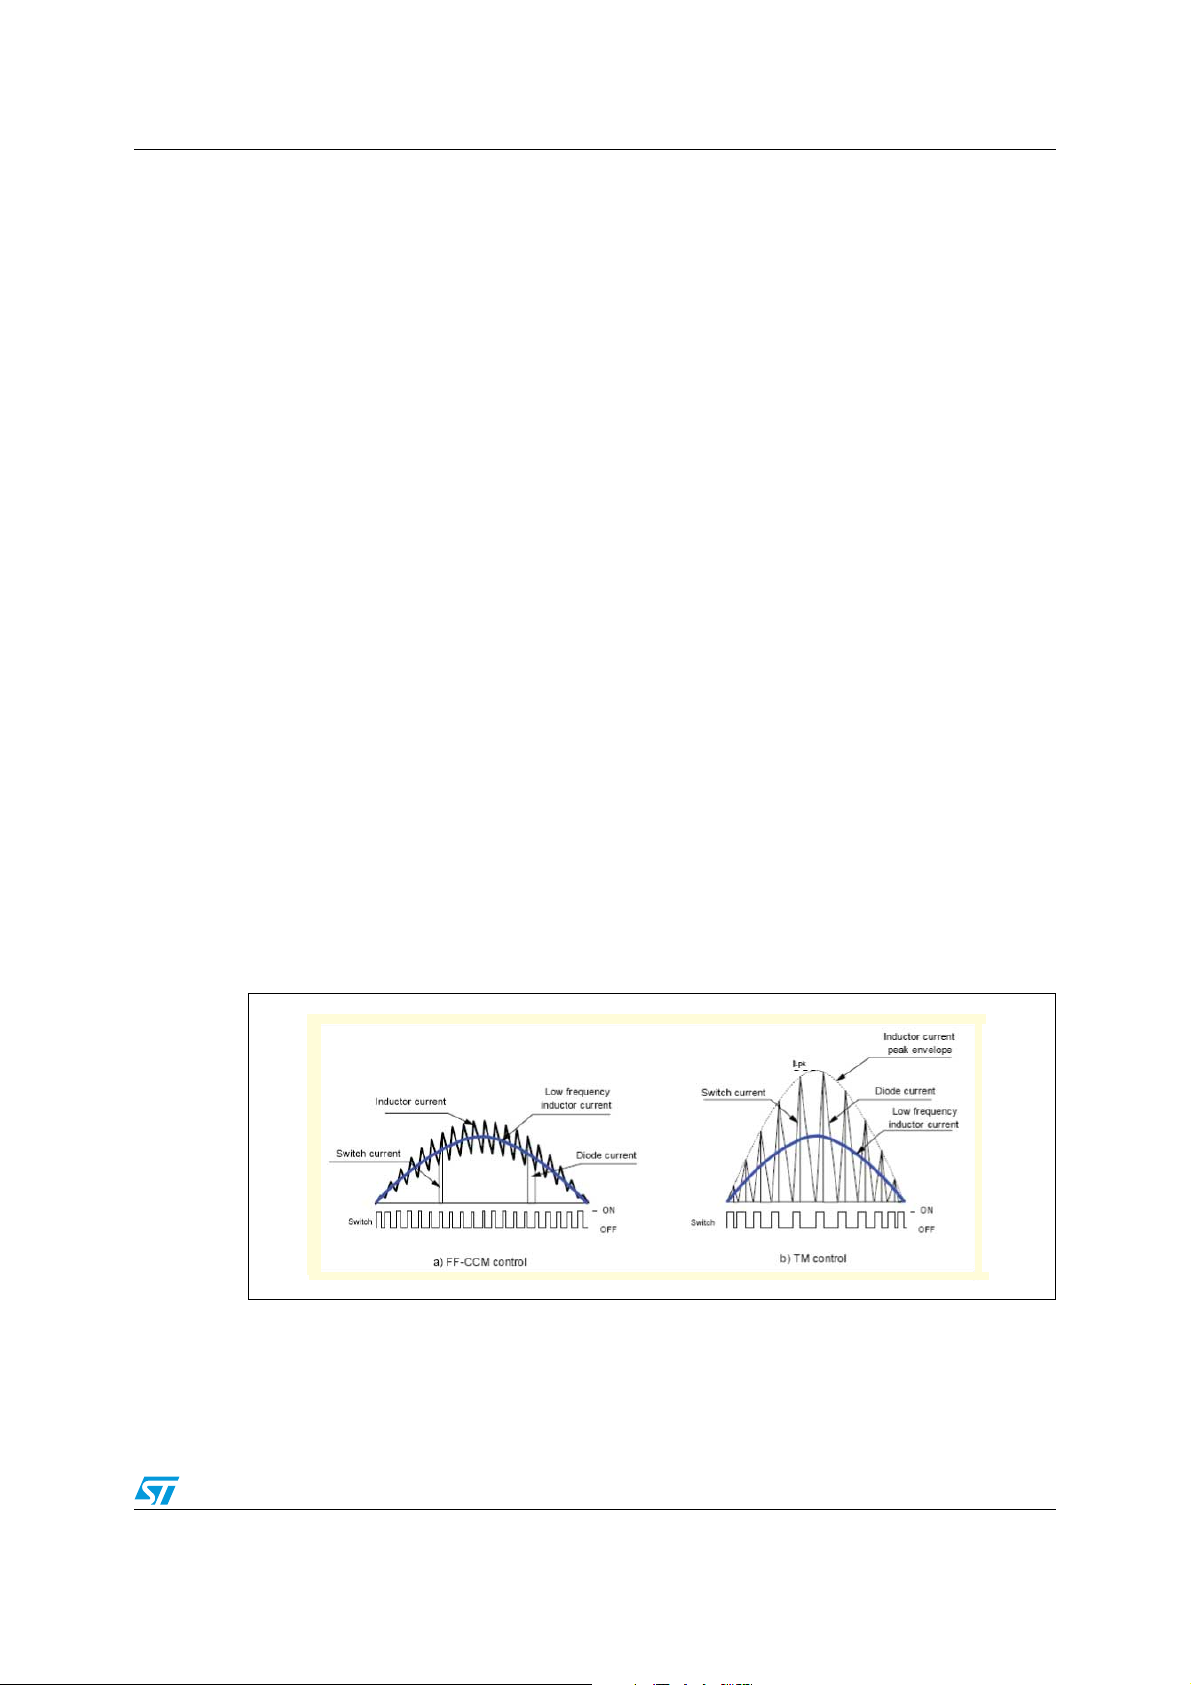
Essentially two methods of controlling power factor corrector (PFC) preregulators are well
known and used. Fixed frequency PWM average current control and fixed-on-time variable
frequency control.
The first method is a relatively complex control that requires a controller (e.g. L4981) which
is usually sophisticated and expensive. With this method the current on the inductor is
continuous and oscillates around the sinusoidal semiperiod value with a predetermined and
fixed ripple.
In the second method the current on the inductor is discontinuous, reaching zero and
starting to increase again on each switching period. It is cheaper but cannot be used for high
power range applications due to the large peak current it causes during its action according
to the load.
Other than these two methods, a third may be approached. Instead of maintaining the ontime fixed, such as TM PFC, the Toff is kept constant and the Ton is free to be changed in
order to modulate the power drained from the source according to the load. This is called
the “fixed-off-time modulation method”. Obviously, it is also a variable frequency control with
some advantages, in particular the spread of noise energy conducted on the net that gives a
lower noise power density in respect to a fixed frequency modulation, which simplifies the
design and realization of the main filter required to match the EMC regulation.
The interesting point is that this kind of modulation can be obtained using a simple and
cheap controller designed for TM (transition mode), e.g. the L6562 or L6563 by
STMicroelectronics.
This method, with a complete theoretical explanation, is well described and depicted in the
AN1792 application note by STMicroelectronics; “Design of fixed-off-time controller PFC
preregulators with L6562”. We suggest first reading the antecedent AN1792 application note
before continuing to read. Starting from this point we refer to the AN1792 to study in depth
the design of a 3 kW FOT PFC preregulator.
Figure 2. Line, inductor, switch and diode current on TM and CCM control
!-V
Doc ID 15500 Rev 1 5/27
Page 6
Practical implementation of an FOT-controlled PFC preregulator AN2951
2 Practical implementation of an FOT-controlled PFC
preregulator
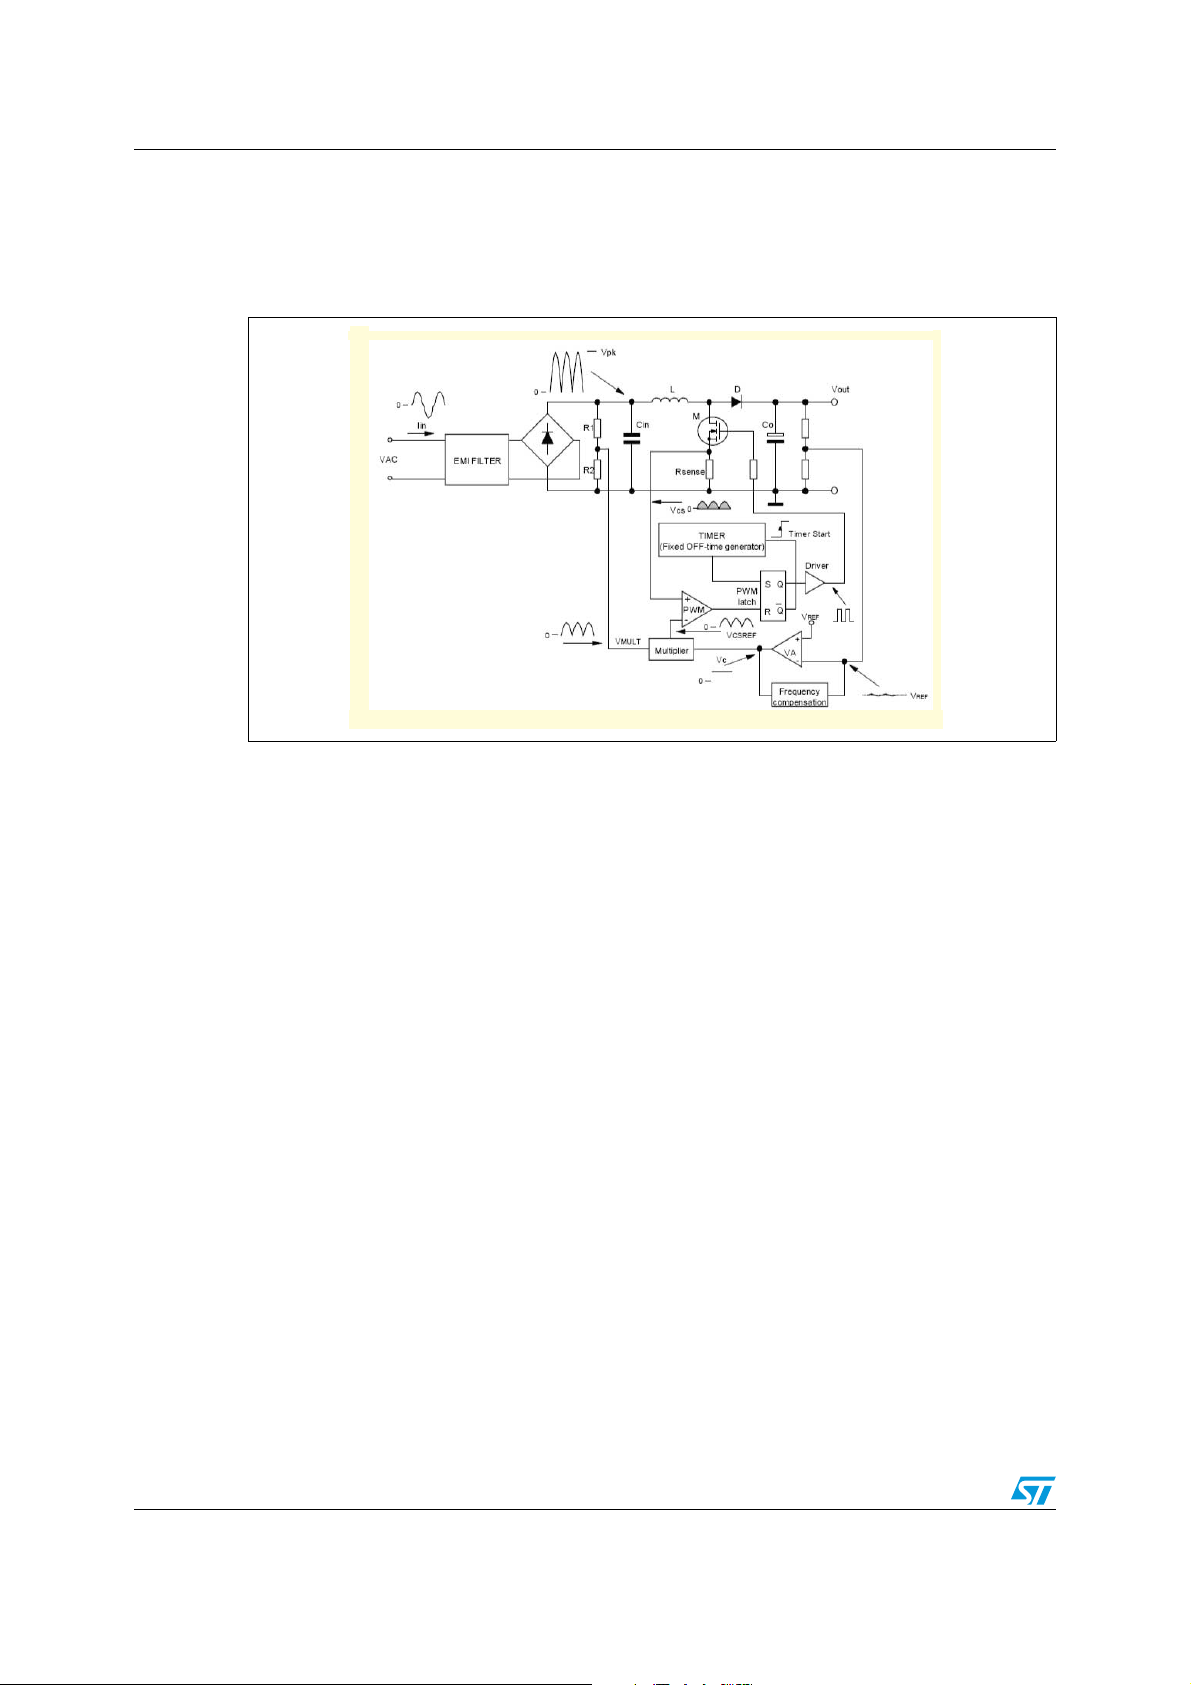
Figure 3. Block diagram of a fixed-off-time architecture
!-V
The power conversion topology is classically based on a boost converter modulated to drain
a current that follows the shape of the main AC voltage; in order to have a current as
sinusoidal as possible, and in phase with the mains, assuring a high power factor and low
THD (total harmonic distortion).
The architecture is based on a fixed-off-time generator, a multiplier, a PWM generator, and a
voltage amplifier with frequency compensation to implement the output voltage control
against the load variations.
To modulate the current on the inductor a current reading is required. The information
regarding the peak current can be retrieved by reading, at the end of the Ton period, the
voltage drop on a sense resistor in series with the power switch.
The input at the multiplier (Vmult) is responsible of the “shaping” action dictated by the input
AC voltage.
The amplitude of the sinusoidal shaping action that directly imposes the reference to the
PWM generator is given by the voltage loop control through the error amplifier and the
frequency compensation.
In practice, the PWM block fixes the Ton time. As soon as the current on the power switch
reaches the value fixed by the output multiplier level (Vcsref), the output of the comparator
resets the flip-flop and turns off the power switch.
At the same time the output of the comparator triggers the timer and the counting of the offtime starts. At the end of the fixed-off-time period the timer block sets the flip-flop and the
power switch is again switched on.
These functions can be implemented by using a TM controller such as the L6562 or L6563.
6/27 Doc ID 15500 Rev 1
Page 7

AN2951 Fixed-off-time using the L6562
3 Fixed-off-time using the L6562
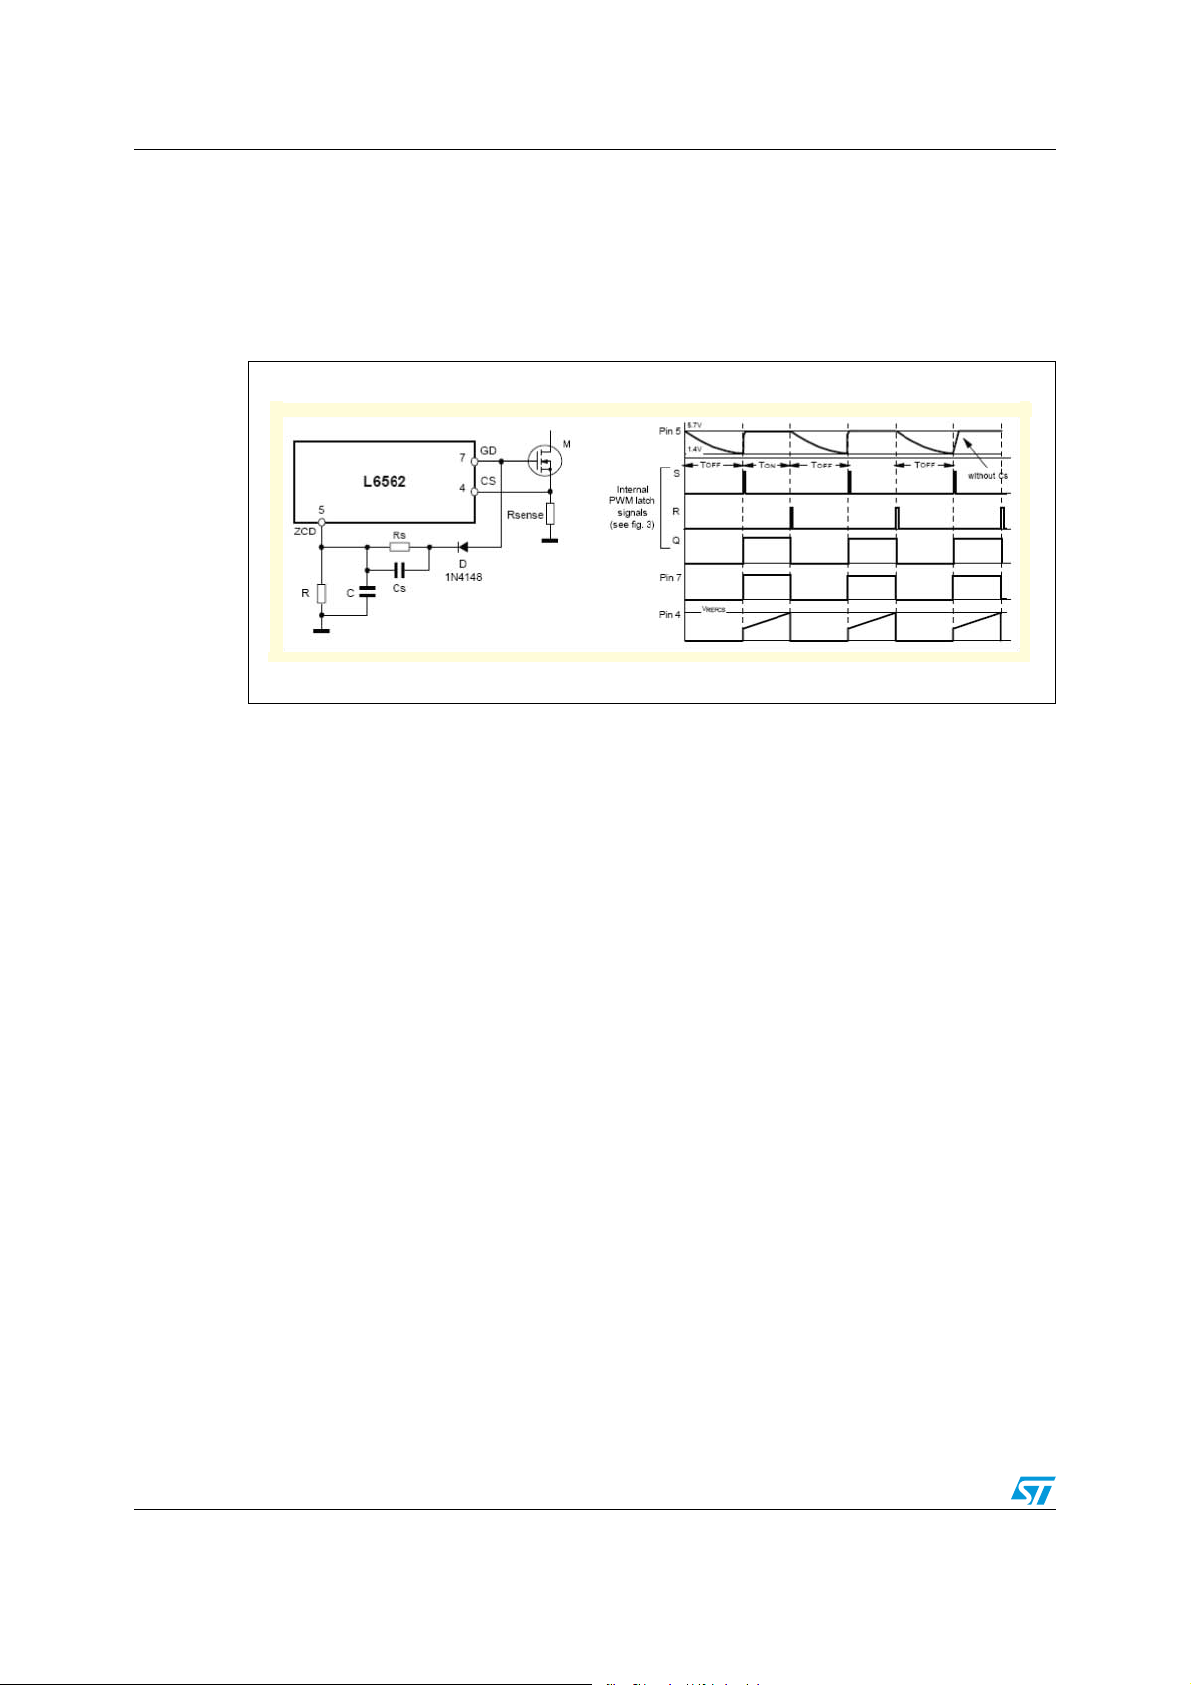
The circuit to implement FOT control with the TM L6562 driver is shown in Figure 4.
On the L6563 driver the V
pin is available which allows, working in TM, to detect the zero
ZCD
crossing of the current on the main inductor. Here we show how it is possible to use this pin
to force the driver to work in a fixed-off-time mode.
During Ton of the power switch, pin 7 (GD gate driver) is high and the D diode is direct
biased. Under this condition, because the output GD is at Vcc (usually 15v), the voltage on
V
is internally clamped to V
ZCD
ZCDclamp
=5.7 V.
During Toff, the GD pin is low, the D diode is reverse-biased and the C capacity can be
discharged by the R resistor following the exponential law:
Equation 1
t
RC
eVV−=
Until the voltage on the V
ZCDclampZCD
pin reaches the triggering threshold (about 1.4 V) the power
ZCD
switch is switched on. Using this passive net the Toff can be set by design. Solving Equation
1 in respect to the time the Toff can be calculated:
Equation 2
V
ZCDclamp
lnRCToff
V
ZCDtrigger
RC4.1
≈=
As suggested with AN1792, it is better to select a capacitor first, and calculate the needed
resistor to set the desired Toff.
The passive net composed by CS and Rs assures that, as soon as the V
capacitor is charged at V
capability of the V
ZCD
pin.
ZCDclamp
as quickly as possible without exceeding the current
goes high the C
GD
Equation 3
VVV −−
−−
FZCDclampGD
V
+
ZCDclamp
R
I
ZCD|
RR
<<
S
V
ZCDclamp
VVV
FZCDclampGD
Cs acts as a speed-up capacitor needed to instantaneously charge C in case of very short
Ton when working at high AC input voltage and light load.
The Cs capacitor should be chosen as:
Equation 4
V
CC−−<
s
The FOT control allows a CCM operation and high power capability but with the circuit
ZCDclamp
VVV
FZCDclampGD
complexity and driver performance generally sufficient on a TM controller.
Doc ID 15500 Rev 1 7/27
Page 8
Fixed-off-time using the L6562 AN2951
This is possible because a characteristic of an FOT control is the possibility to use a simple
peak current control instead of a more difficult average mode control as required on a
classic CCM control.
For further details and implications of FOT control, please refer to the AN1792 application
note.
Figure 4. FOT control with the L6562 and relevant timing waveforms
!-V
8/27 Doc ID 15500 Rev 1
Page 9
AN2951 Working mode along line period in a FOT PFC
4 Working mode along line period in a FOT PFC
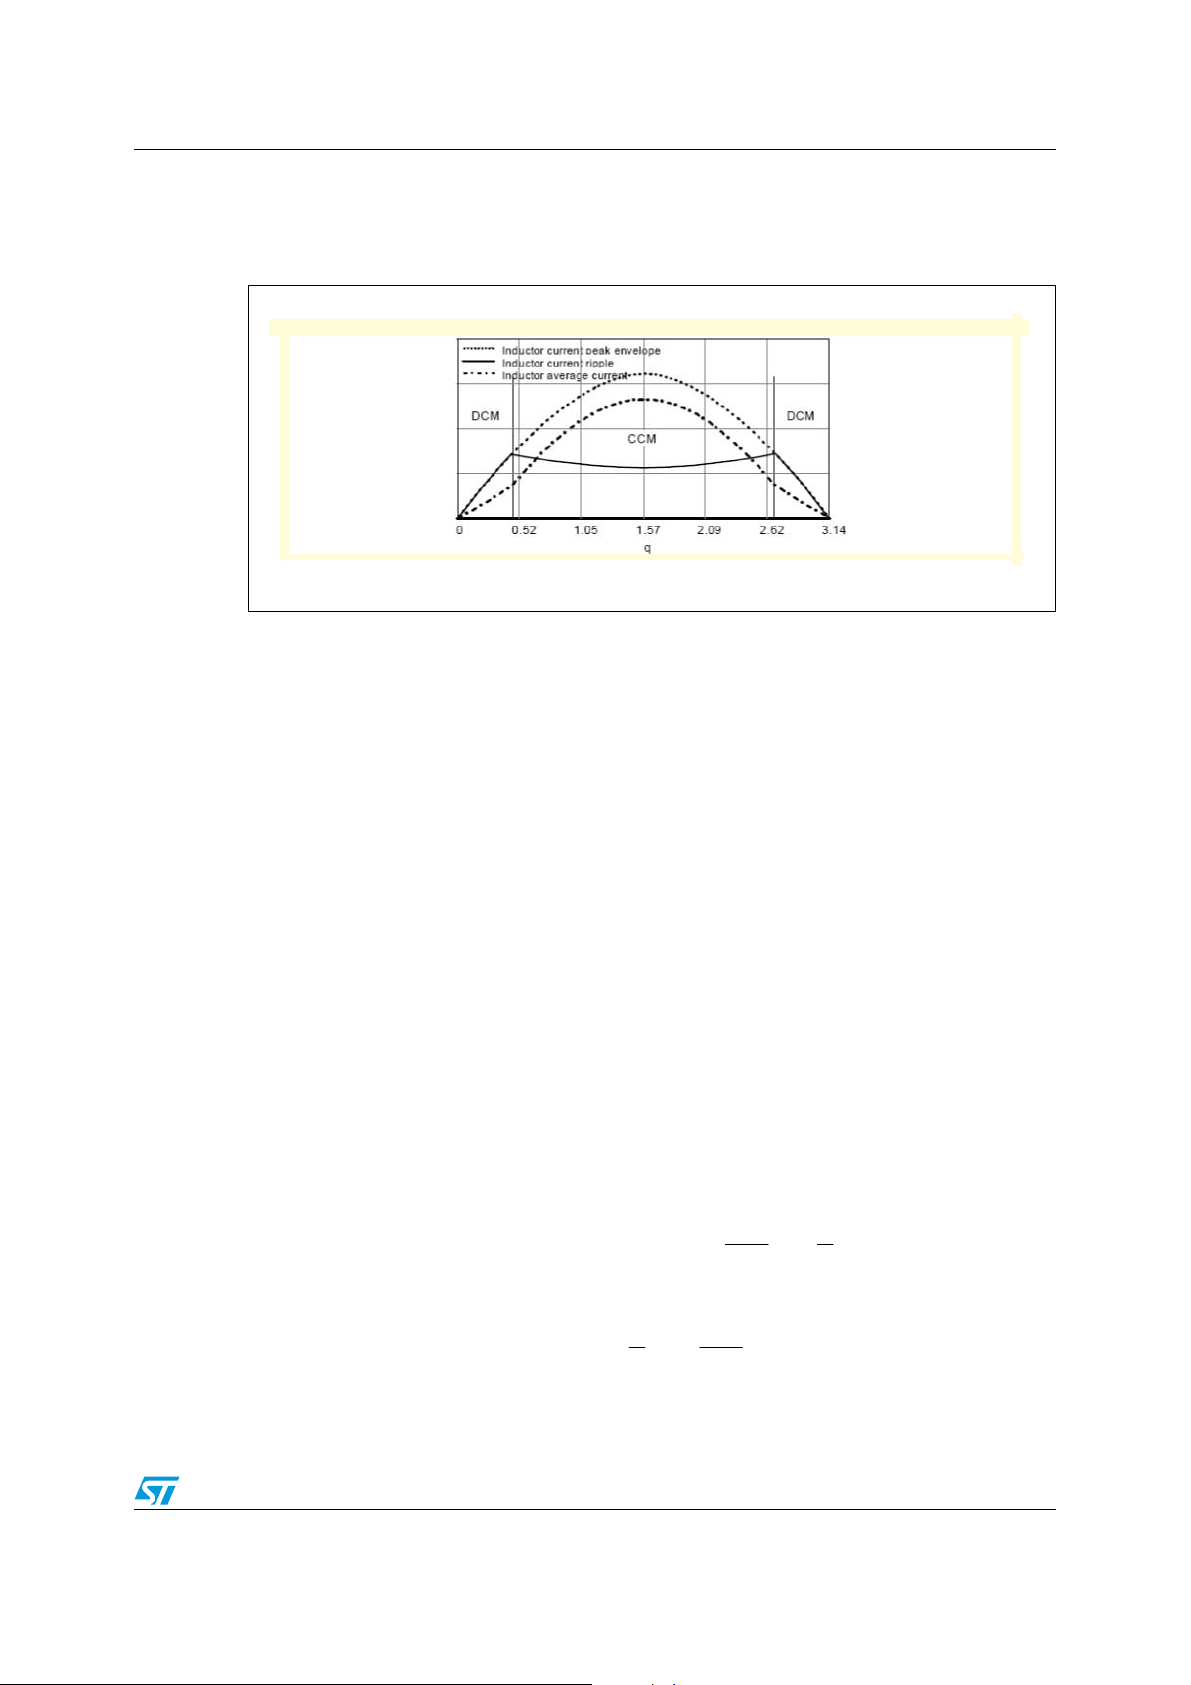
Figure 5. Working mode along line semiperiod
!-V
In Figure 5 a full description of the main characteristics and the evolution of some key
parameters of an FOT, along the semiperiod of the input AC source, is shown. The dotted
line represents the envelope of the peak inductor current. As clearly noted, the shape is
sinusoidal as required, in order to have a high power factor. This is a consequence of the
Ton modulation carried out by following the output of the multiplier Vcsref (see Figure 3).The
dash-dot line represents the inductor average current. A distortion on the average
instantaneous boost current value can be noted around the zero crossing of the line voltage.
Though this aspect is not negligible, it is inevitable. It is due to the working mode
(discontinuous) in this region. A trade off between operating frequency and line current
distortion has also to be taken into account. To limit the line current distortion at high line
voltage a suitably large Toff must be selected; also fixing a limited current ripple on the boost
inductor, a bigger inductor size may be needed. Returning to Figure 5, the continuous line
represents the inductor current ripple along the sinusoidal semiperiod (0 -π).
Some important considerations can be taken into account regarding this matter. Two kinds
of working modes can be recognized during the semiperiod; DCM and CCM. For low input
voltage (near zero crossing of the mains) the converter works in discontinuous mode; this
means that the current reaches zero for a certain time during the switching period. The
behavior along the semiperiod is symmetrical in respect to the centre of the semiperiod
(π/2). Two points can be identified where the current ripple on the boost inductor is equal to
the peak value. Those two points dictate the transition between the discontinuous and
continuous mode, therefore we call the respective angle; the transition angle. If θ is the
transition angle:
Equation 5
DCM
0t
<<
θ
--- -
and
ω
θ−π
ω
π
<<
t
ω
Equation 6
CCM
θ
t
ω
θ−π
<<
ω
The amplitude of the DCM portion, and so the angle, are not fixed but depends on input
voltage and load power. As the power is reduced, the DCM region increases.
Doc ID 15500 Rev 1 9/27
Page 10

Working mode along line period in a FOT PFC AN2951
For very light load and high input voltage the working mode can be completely
discontinuous. The width of the DCM portion depends on the ripple chosen for the boost
inductor current during the design calculation. In a Fixed power load, the smaller the ripple
imposed during the design, the narrower the DCM portion is. The drawback is that a bigger,
and therefore more expensive and cumbersome, inductor is required. A trade off between
these parameters needs to be accepted. This parameter is usually fixed as a percentage
value of the maximum peak current on the inductor (min Vac max output power) and a value
between 0.2 (20%) and 0.4 (40%) is usually adopted. We call this parameter K
. In the DCM
r
region the stress on the power switch, due to the reverse recovery of the boost diode, is
reduced; moreover the switching losses on the power switch due to the turn on under a zero
current condition are also reduced. As the DCM portion can also reach 30% of whole
semiperiod, this can help to improve the efficiency, thanks to soft switching operation. In
Figure 6 an example of the current on: line, power switches, and diode; on a semiperiod of
the input AC voltage, is depicted.
Figure 6. Inductor, switch and diode currents in a CCM FOT-controlled PFC stage
!-V
As shown in Figure 6 the current on the inductor increases during Ton (inductor
magnetization) and decreases during Toff. The peak of the inductor current, cycle by cycle,
is enveloped by I
sin ωt. As Toff is fixed by design, only Ton is free to change, the
lpeak
frequency is variable along the semiperiod. In particular, it is at maximum on the peak of the
input voltage (where Ton is minimum) and minimum at the transition angle (transition
between CCM and DCM and vice versa). The switching frequency is fixed during the entire
DCM portion. Some analogous observations may be done on the boost inductor current
ripple. It is at a minimum on the top of the sinusoid and maximum at the transition angle. As
a consequence of this, a relationship between transition angle and K
can be provided:
r
Equation 7
I
r
Equation 7 comes from the definition of K
sinK =θ=
as the ratio between the maximum current ripple
r
lripple
I
lpk
amplitude to the inductor peak current. At the transition angle (boundary point CCM-DCM),
as the working mode starts to go into DCM, the current ripple is equal to the peak current
sinusoidal envelop value multiplied by sinθ (remember that θ is the transition angle).
The line current is sinusoidal in the portion between the two transition angles, but it is linear
in the two DCM portions. For this reason it is impossible to have a power factor equal to 1
using fixed-off-time.
10/27 Doc ID 15500 Rev 1
Page 11

AN2951 Working mode along line period in a FOT PFC
For further information and for a collection of all the theoretical formulas involved in FOT
modulation theory, also including some 3-D plots of various quantity change within one half
cycle of the main voltage and load variation, please refer to the AN1792 application note.
Doc ID 15500 Rev 1 11/27
Page 12

Practical 3 kW FOT PFC design AN2951
5 Practical 3 kW FOT PFC design
Here is a description of the rules and calculations used to design the 3 kW FOT PFC. The
prototype board can be ordered with the code STEVAL-ISF001V1.
Figure 7. 3 kW FOT PFC demonstration board (STEVAL-ISF001V1)
!-V
In Ta bl e 1 , the electrical specifications of the STEVAL-ISF001V1 design are shown.
Table 1. Technical specifications
Parameter Value
Line voltage 185 to 265 Vac
Line frequency 50 Hz
Regulated output voltage 400 Vdc
Maximum output power 3000 W
Vout ripple (%) 5%
Maximum switching frequency 55 kHz
Inductor current ripple (Kr) 0.25
To properly calculate the Toff on a fixed-on-time modulator, we need to consider that it must
be of a proper size to assure that at high voltage input and light load, it is enough to avoid
distortion on the input current.
To do this, we start by considering the basic relationship, valid on a boost topology working
in CCM, between Vout and Vin.
Equation 8
V
out
V
1
Where: is duty cycle
in
δ−=1
δ
Equation 9
Ton
δ
---------- -=
T
12/27 Doc ID 15500 Rev 1
Where T is the switching period
Page 13

AN2951 Practical 3 kW FOT PFC design
Equation 10
V
out
V
1
=
Ton
1
−
T
T
=
TonT
−
T
Toff
1
==
swin
Tofff
From that:
Toff =
V
in
fV
swout
In order to avoid main current distortion when working at high line voltage the Toff must be
selected at greater than a minimum value.
Therefore, if a limit on the maximum switching frequency wants to be respected:
Equation 11
2Vinrms
Toff >
Voutfsw
min
max
Where fsw
is the maximum frequency wanted for the switching. (see Section 3).
max
Starting from now we can define two quantities useful for the calculation:
Equation 12
2Vinrms
=
K
max
max
Vout
Equation 13
2Vinrms
K
=
min
min
Vout
These two relations represent the Vpk/Vout ratio at minimum and maximum AC main input.
Starting from the same considerations of
Equation 10, it is possible to calculate the
minimum Ton required by the boost:
Equation 14
−
K1
max
Ton
min
=
Toff
K
max
It is simple to verify that:
Equation 15
min
1
ToffTon
+
fsw
max
=
Particular attention must be paid to verify the maximum switching frequency of the system.
In fact, the Ton
is calculated according to the maximum input voltage required by the
min
technical specification. In this condition, the reduction of the on-time, due to the greater
input voltage and with the off-time fixed, pushes the switching frequency to a higher value. If
a maximum switching frequency wants to be respected, a lower value must be posted into
the relationship (
The full calculation requires a recursive method to verify that, imposing the switching
frequency at low voltage input, the switching frequency at high voltage input doesn't
overcome the maximum wanted. See
Equation 17).
Equation 22 and Equation 23.
This could prevent using high frequency switching (at low voltage input) in order to have a
small inductor size.
Doc ID 15500 Rev 1 13/27
Page 14

Practical 3 kW FOT PFC design AN2951
Following the definition of current ripple and parameter (see above), it is possible to
calculate
ΔI
ripple
.
Equation 16
Δ
I
peak
ripple
Δ
I
ripple
+
2
Solving by ΔI
ripple
=
K
r
Ilmain
Equation 17
IlmainK2
I
ripple
=Δ
peakr
)K2(
−
r
If we want to impose the maximum current ripple calculated by Equation 24, as it is at
transition angle, the relation between the ripple and the value of the boost inductor is:
Equation 18
Δ
I
ripple
Vinrms2KVout
minr
Toff
L
=
−
While remembering that Kr=sinθ; the input voltage at the transition angle is :
2Vinrms
minKr
Equation 19
K
min
185*2
400
652.0
==
Following the information above and the technical specifications summarized in Ta bl e 1 , the
calculations of the 3 kW FOT board are:
Equation 20
K
max
265*2
400
934.0
==
Equation 21
Toff
2*185
3
10*35*400
s3.16
μ=>
Equation 22
Ton
min
−
=
934.0
;s15.1s3.16*
μ=μ
934.01
Equation 23
fsw
max
=
1
≈
s3.16s15.1
μ+μ
(fsw
kHz57
@Vinrms
max
max
)
Equation 24
Iin
rms
P
=
out
η
14/27 Doc ID 15500 Rev 1
min
3000
PFVinrms
==
99.0*185*95.0
A24.17
Page 15

AN2951 Practical 3 kW FOT PFC design
Equation 25
I
ripple
24.17*2*25.0*2
=Δ
−
≈
)25.02(
A95.6
Equation 26
L
−
≥
185*2*25.0400
95.6
6
−
H78510*3.16
μ≈
Choosing for C a value of 1.5 nF the R resistor = 7.6 kΩ. (8.2 kΩ is used with a slightly
greater Toff).
For the calculation of the output electrolytic capacitors the following formula may be used.
Fixing the maximum voltage ripple to 10% of the output voltage we have:
Equation 27
V401.0VV
=≤
*outPkPk_ripple_out
I
V
C
=
out
()
π
=
Pk_Pk_ripple_out
Vf2
out
()
π
I
out
Cf2
outmains
=
Pk_Pk_ripple_outmains
5.7
π
40*50*2*
F597
μ=
2 capacitors of 330 µF can be paralleled on the output.
Doc ID 15500 Rev 1 15/27
Page 16

Power dissipation AN2951
6 Power dissipation
In this section some calculations and theoretical relations are shown.
The calculation of the power dissipation on active devices on the board, under the right
working conditions and accepting some approximations, may be considered standard and
no different to a PFC working in CCM.
Let's start from the calculation of the current on the output at full load:
Equation 28
P
I
out
V
As already calculated above the RMS value of the current on the mains is 17.24 A. The
peak current is:
Equation 29
Also the input average current may be calculated as:
out
out
3000
400
rms_inpk_in
A5.7
===
===
A3.2424.17*2I*2I
Equation 30
I2
I
AVG_in
PK_in
=
π
24*2
=
=
π
A28.15
The total dissipation on the bridge is:
Equation 31
AVG_inFbridge
≅==
W5.3028.15*1*2IV2P
In order to calculate the power dissipated on the boost diode we need to evaluate the RMS
on the diode.
Equation 32
I
Drms
P
o
=
V
(min)pk_in
V*16
V3
π
out
3000
(min)pk_in
=
261
261*16
4000*3
π
A121.15.11
≅=
Equation 33
=
PPPP +=+
1
2
QVf
rroutswcondswconddiode
From the datasheet of the STTH12S06 diodes used as boost diodes we find:
Equation 34
o
F
V5.1)125(V
=
nC160Qrr=
ns14rrt=
Equation 35
1
IVP
16/27 Doc ID 15500 Rev 1
outswFFdiode
2
9
−
=+=+=+=
W52.2152.31810*160*400*kHz5512*5.1Qrr2Vf
Page 17

AN2951 Power dissipation
Where we considered doubling the Qrr because two diodes in parallel are used. For the
used power switches we have:
Equation 36
() ()
oo
)25(onDS)125(onDS
Ω=Ω== 171.0m90*9.1R9.1R
Equation 37
1250C =
pFoss
Equation 38
s30t
r
μ=
Equation 39
I
III
pkpk
ripple
pk_inLDS
2
95.6
3.24
=+=+==
2
A78.27
With two power switches in parallel we have 13.89 A for each.
Equation 40
=
I
DS
rms
Equation 41
Equation 42
Equation 43
P
out
η
V*PF*
pkminin
1
P
()
Drmscond
2
Vt(f2P
outrswsw
V16
2
−
2
R*I
I
pk_in
2
V3
π
()
1
2
2
*10*30(10*55*2
out
2
pkminin
)o
125(onDS
78.27
3000
1
2
2
2
=+=
)VC
outoss
≅+=
swcondmos_Tot
2
261*99.0*95.0
===
−−
W53PPP
261*16
−=
π
=
400*3
A53.11
W35.11171.0*53.11*
21293
W42)400*10*1250400*
=+=
Doc ID 15500 Rev 1 17/27
Page 18

Schematic and circuit description AN2951
7 Schematic and circuit description
In Figure 8 the detailed schematic of the board is given.
Starting from the input section a common mode EMC filter is fitted in order to be compliant
with the EMC limit rule suited to industrial and domestic application. (EN55014 and
EN55022).
The alternative voltage, from the mains, is than rectified by the input low frequency bridge
that provides, to the next boost stage, a rectified sinusoidal waveform with a frequency
doubled in respect to the input main waveform. The C22 capacitor (0.68uF) is calculated as
having a residual ripple around the sinusoidal envelope at maximum load and minimum
input voltage of 6% of the Vin peak value.
The main boost inductor, designed and realized by MAGNETICA (Italy), is a ferrite inductor
core designed to minimize the hystereses losses.
The technical sheet, with a complete order code, is shown in
Figure 9.
The inductor has a secondary side winding that provides the low voltage auxiliary supply to
the L6563 driver.
At the startup, the current and voltage on the main inductor is still zero, so any voltage can
be generated by the secondary auxiliary winding. In this condition, and only during the
startup, the R7 and R13 resistors, 150 kΩ each, with the D4 Zener diode (fitted for limitation
purposes) charge the C12 capacitor and supply the driver that starts the PWM operation. As
soon as the PWM signal starts to switch, a voltage is present across the auxiliary winding,
so the low supply voltage across the C12 capacitor is maintained.
The two paralleled boost diodes conduct the peak inductor current at the end of the Ton
period. At the maximum power and minimum input voltage the peak current can reach 29 A.
The part number for the diodes is STTH12S06. This diode has a trr of only 14 ns that help to
reduce switching losses caused by reverse recovery, relevant in cases of continuous
switching operations as in this case.
The D2 diode and the NTC resistor RV1 are used to limit the inrush current, due to the
electrolytic capacitor on the output, during the startup.
TM
The chosen switching devices are two power MOSFETs from the MDmesh
II family,
STW55NM60.
Two Power MOSFETs can be mounted on the board, working in parallel in order to reduce
R
MDmesh
and according to power dissipation. A solution with the new device from the
DS(on)
TM
V family was tested with interesting results in terms of efficiency. Using only one
device STW77N65M5 an output power of 2.5 kW may be supplied by the systems.
In order to properly drive the two power MOS and to minimize switching losses, during the
on and off transient, a small push-pull driver was interposed between the driver and the two
gates. A reading of the current conducted by the two power MOSFETs, equal to the current
on the main inductor during the Ton period, is necessary to the driver in order to fix the right
current level on the inductor according to the input instantaneous voltage and the output
power delivered to the load.
This current is sensed by a sensing resistor implemented paralleling two 0,07 Ω noninductive sensing resistors. The output DC bus voltage is sensed by the driver through the
resistive net composed by R12, R16, R17, and R24.
18/27 Doc ID 15500 Rev 1
Page 19

AN2951 Schematic and circuit description
As stated on the L6563 datasheet this pin is used to sense the PFC preregulator output
voltage and is used for protection purposes.
If the voltage at the pin exceeds 2.5 V the IC is shut down, its consumption goes almost to
the startup level and this condition is latched. The PWM_LATCH pin is asserted high.
Normal operation can be resumed only by cycling the Vcc. This function is used for
protection in case the feedback loop fails.
The feedback loop is otherwise implemented by the net R9, R10, R11, R14, and R15.
The RC net, on the ZCD pin, is used to fix the desired Toff time according to the sizing
calculation of the application (refer to the full explanation and practical calculation already
given). The small signal BJT Q3 is used to implement a Toff modulation according to the
input voltage. At low voltage instant time of the input waveform, (near the zero crossing of
the input sinusoidal supply) in order to minimize the distortion on the input current, due to
the low voltage in input, the Toff period needs to be reduced. Acting in this way the ratio
between the Ton and Toff is increased and the distortion on the input current can be
reduced.
The J4 jumper present on the board allows the choosing of two possible solutions of low
voltage supply of the driver. Inserting the jumper on the right, the auxiliary supply, produced
via the winding on the main inductor, is used; otherwise an external DC power source (20
Vdc 100 mA min) can be connected.
This can be useful during debug of the board or if an inductor without any secondary
winding is to be tested.
On the J7 some control signals of the driver chip are available (refer to the L6563
datasheet).
Doc ID 15500 Rev 1 19/27
Page 20

Schematic and circuit description AN2951
Figure 8. 3 kW PFC STEVAL-ISF001V1 schematic
20/27 Doc ID 15500 Rev 1
!-V
Page 21

AN2951 Schematic and circuit description
Figure 9. MAGNETICA technical sheet
-!'.%4)#!
!-V
Doc ID 15500 Rev 1 21/27
Page 22

Experimental results and scope acquisition AN2951
8 Experimental results and scope acquisition
A complete set of measurements, changing supply voltage and load condition, have been
collected and are shown below.
An electronic dummy load was connected at the output of the board and two electronic watt
meters to get a precise measurement of:
● Input AC power
● PF and THD
● Output power
● Output voltage
In addition to this, an oscilloscope was also used to measure the Vout ripple and to obtain
some images of significant waveform.
The efficiency was calculated off-line using the collected measurements.
The following three tables (
Ta bl e 2 , Ta bl e 3 , and Tab le 4 ) contain the data for three different
values of the input voltage chosen in the nominal range (185<Vac<265).
Table 2. Measurements for Vinac = 185 Vac
Pout Pin eff.(%) PF THD Vout Voutripple Ripple%
156 163 95.7 0.940 18.3 406 8 2.0
306 319 95.9 0.971 11.5 406 12 3.0
457 474 96.4 0.984 8.5 406 14 3.4
606 628 96.5 0.989 7.1 406 16 3.9
755 782 96.5 0.992 6.4 406 16 3.9
906 938 96.6 0.993 5.8 406 16 3.9
1056 1093 96.6 0.995 5.3 406 17 4.2
1206 1247 96.7 0.996 5.1 406 19 4.7
1356 1403 96.7 0.996 4.9 406 22 5.4
1506 1558 96.7 0.996 4.8 406 24 5.9
1660 1715 96.8 0.997 4.7 406 26 6.4
1810 1870 96.8 0.997 4.7 406 28 6.9
1958 2020 96.9 0.997 4.5 406 31 7.6
2108 2173 97.0 0.997 4.4 406 33 8.1
2254 2322 97.1 0.987 4.3 406 38 9.4
2407 2480 97.1 0.987 4.3 406 41 10.1
2559 2640 96.9 0.988 4.2 406 41 10.1
2792 2894.0 96.5 0.988 4.2 406 42 10.3
2981 3095.0 96.3 0.989 4.1 406 43 10.6
22/27 Doc ID 15500 Rev 1
Page 23

AN2951 Experimental results and scope acquisition
Table 3. Measurements for Vinac = 230 Vac
Pout Pin eff.(%) PF THD Vout Voutripple Ripple%
156 163 95.7 0.870 25.4 406 8 2.0
306 317 96.5 0.964 15.2 406 12 3.0
456 471 96.8 0.978 11.6 406 14 3.4
607 626 97.0 0.985 9.8 406 16 3.9
757 780 97.1 0.989 8.8 406 16 3.9
907 933 97.2 0.991 7.8 406 18 4.4
1057 1086 97.3 0.992 7.5 406 18 4.4
1207 1240 97.3 0.993 7.1 406 20 4.9
1356 1395 97.2 0.994 6.8 406 22 5.4
1506 1550 97.2 0.995 6.6 406 24 5.9
1657 1706 97.1 0.995 6.4 406 28 6.9
1807 1863 97.0 0.996 6.2 406 29 7.1
1958 2020 96.9 0.996 5.9 406 31 7.6
2108 2178 96.8 0.996 5.8 406 33 8.1
2260 2340 96.6 0.996 5.8 406 35 8.6
2408 2493 96.6 0.996 5.6 406 38 9.4
2558 2650 96.5 0.997 5.6 406 40 9.9
2816 2920 96.4 0.998 5.5 406 42 10.3
2981 3091 96.4 0.998 5.4 406 43 10.6
Table 4. Measurements for Vinac = 265 Vac
Pout Pin eff.(%) PF THD Vout Voutripple Ripple%
156 163 95.7 0.830 30.0 406 8 2.0
307 318 96.5 0.950 15.7 406 12 3.0
457 470 97.2 0.970 15.7 406 15 3.7
606 623 97.3 0.975 15.4 406 16 3.9
757 777 97.4 0.978 15.4 406 19 4.7
906 930 97.4 0.981 15.3 406 21 5.2
1056 1084 97.4 0.983 15.0 406 21 5.2
1206 1237 97.5 0.983 15.1 406 22 5.4
1356 1391 97.5 0.984 15.1 406 23 5.7
1507 1546 97.5 0.985 15.1 406 26 6.4
1658 1702 97.4 0.985 15.1 406 28 6.9
1807 1858 97.3 0.986 14.9 406 30 7.4
Doc ID 15500 Rev 1 23/27
Page 24

Experimental results and scope acquisition AN2951
Table 4. Measurements for Vinac = 265 Vac (continued)
Pout Pin eff.(%) PF THD Vout Voutripple Ripple%
1959 2013 97.3 0.986 14.9 406 33 8.1
2110 2168 97.3 0.986 14.8 406 35 8.6
2257 2320 97.3 0.998 14.8 406 35 8.6
2408 2480 97.1 0.998 14.7 406 38 9.4
2562 2640 97.0 0.998 14.6 406 40 9.9
2822 2916 96.8 0.999 14.5 406 41 10.1
2987 3093 96.6 0.999 14.4 406 42 10.3
Figure 10 is an image showing the current on the boost inductor in blue and the input
voltage in yellow. The working conditions are: Vinac=220 AC; Pout=500 w. As can be seen,
at this power level the working mode is already continuous in almost all the semiperiod of
the input AC.
Figure 10. Scope acquisition. Working conditions: Vinac=220 AC; Pout=500 W
In this second image (Figure 11) a simulation of startup, with a connected load, of 1200 W is
shown.
24/27 Doc ID 15500 Rev 1
!-V
Page 25

AN2951 Experimental results and scope acquisition
Figure 11. Scope acquisition: startup with a connected load of 1200 W
!-V
All the magnetic parts present on the board and designs for the input and output filter to
make the system IEC55014 and IEC55022 compliant are provided by MAGNETICA.
Figure 12 is an image showing the conducted emission after the design and assembling of
the filter.
Figure 12. EMI tests after the design and assembling of the filters
!-V
Doc ID 15500 Rev 1 25/27
Page 26

Revision history AN2951
9 Revision history
Table 5. Document revision history
Date Revision Changes
22-Jun-2010 1 Initial release.
26/27 Doc ID 15500 Rev 1
Page 27

AN2951
Please Read Carefully:
Information in this document is provided solely in connection with ST products. STMicroelectronics NV and its subsidiaries (“ST”) reserve the
right to make changes, corrections, modifications or improvements, to this document, and the products and services described herein at any
time, without notice.
All ST products are sold pursuant to ST’s terms and conditions of sale.
Purchasers are solely responsible for the choice, selection and use of the ST products and services described herein, and ST assumes no
liability whatsoever relating to the choice, selection or use of the ST products and services described herein.
No license, express or implied, by estoppel or otherwise, to any intellectual property rights is granted under this document. If any part of this
document refers to any third party products or services it shall not be deemed a license grant by ST for the use of such third party products
or services, or any intellectual property contained therein or considered as a warranty covering the use in any manner whatsoever of such
third party products or services or any intellectual property contained therein.
UNLESS OTHERWISE SET FORTH IN ST’S TERMS AND CONDITIONS OF SALE ST DISCLAIMS ANY EXPRESS OR IMPLIED
WARRANTY WITH RESPECT TO THE USE AND/OR SALE OF ST PRODUCTS INCLUDING WITHOUT LIMITATION IMPLIED
WARRANTIES OF MERCHANTABILITY, FITNESS FOR A PARTICULAR PURPOSE (AND THEIR EQUIVALENTS UNDER THE LAWS
OF ANY JURISDICTION), OR INFRINGEMENT OF ANY PATENT, COPYRIGHT OR OTHER INTELLECTUAL PROPERTY RIGHT.
UNLESS EXPRESSLY APPROVED IN WRITING BY AN AUTHORIZED ST REPRESENTATIVE, ST PRODUCTS ARE NOT
RECOMMENDED, AUTHORIZED OR WARRANTED FOR USE IN MILITARY, AIR CRAFT, SPACE, LIFE SAVING, OR LIFE SUSTAINING
APPLICATIONS, NOR IN PRODUCTS OR SYSTEMS WHERE FAILURE OR MALFUNCTION MAY RESULT IN PERSONAL INJURY,
DEATH, OR SEVERE PROPERTY OR ENVIRONMENTAL DAMAGE. ST PRODUCTS WHICH ARE NOT SPECIFIED AS "AUTOMOTIVE
GRADE" MAY ONLY BE USED IN AUTOMOTIVE APPLICATIONS AT USER’S OWN RISK.
Resale of ST products with provisions different from the statements and/or technical features set forth in this document shall immediately void
any warranty granted by ST for the ST product or service described herein and shall not create or extend in any manner whatsoever, any
liability of ST.
ST and the ST logo are trademarks or registered trademarks of ST in various countries.
Information in this document supersedes and replaces all information previously supplied.
The ST logo is a registered trademark of STMicroelectronics. All other names are the property of their respective owners.
© 2010 STMicroelectronics - All rights reserved
STMicroelectronics group of companies
Australia - Belgium - Brazil - Canada - China - Czech Republic - Finland - France - Germany - Hong Kong - India - Israel - Italy - Japan -
Malaysia - Malta - Morocco - Philippines - Singapore - Spain - Sweden - Switzerland - United Kingdom - United States of America
www.st.com
Doc ID 15500 Rev 1 27/27
 Loading...