How it Works
Log In / Sign Up
Buy Points
How it Works
FAQ
Contact Us
Questions and Suggestions
Users
ST
Loading...
A
AN2678
AN2679
AN2680
AN2681
AN2682
AN2683
AN2684
AN2686
AN2687
AN2689
AN2691
AN2692
AN2695
AN2705
AN2708
AN2710
AN2711
AN2713
AN2715
AN2716
AN2722
AN2725
AN2726
AN2727
AN2728
AN2730
AN2734
AN2737
AN2744
AN2749
AN2751
AN2753
AN2754
AN2755
AN2757
AN2758
AN2759
AN2760
AN2761
AN2771
AN2777
AN2780
AN2781
AN2782
AN2783
AN2786
AN2787
AN279
AN2791
AN2792
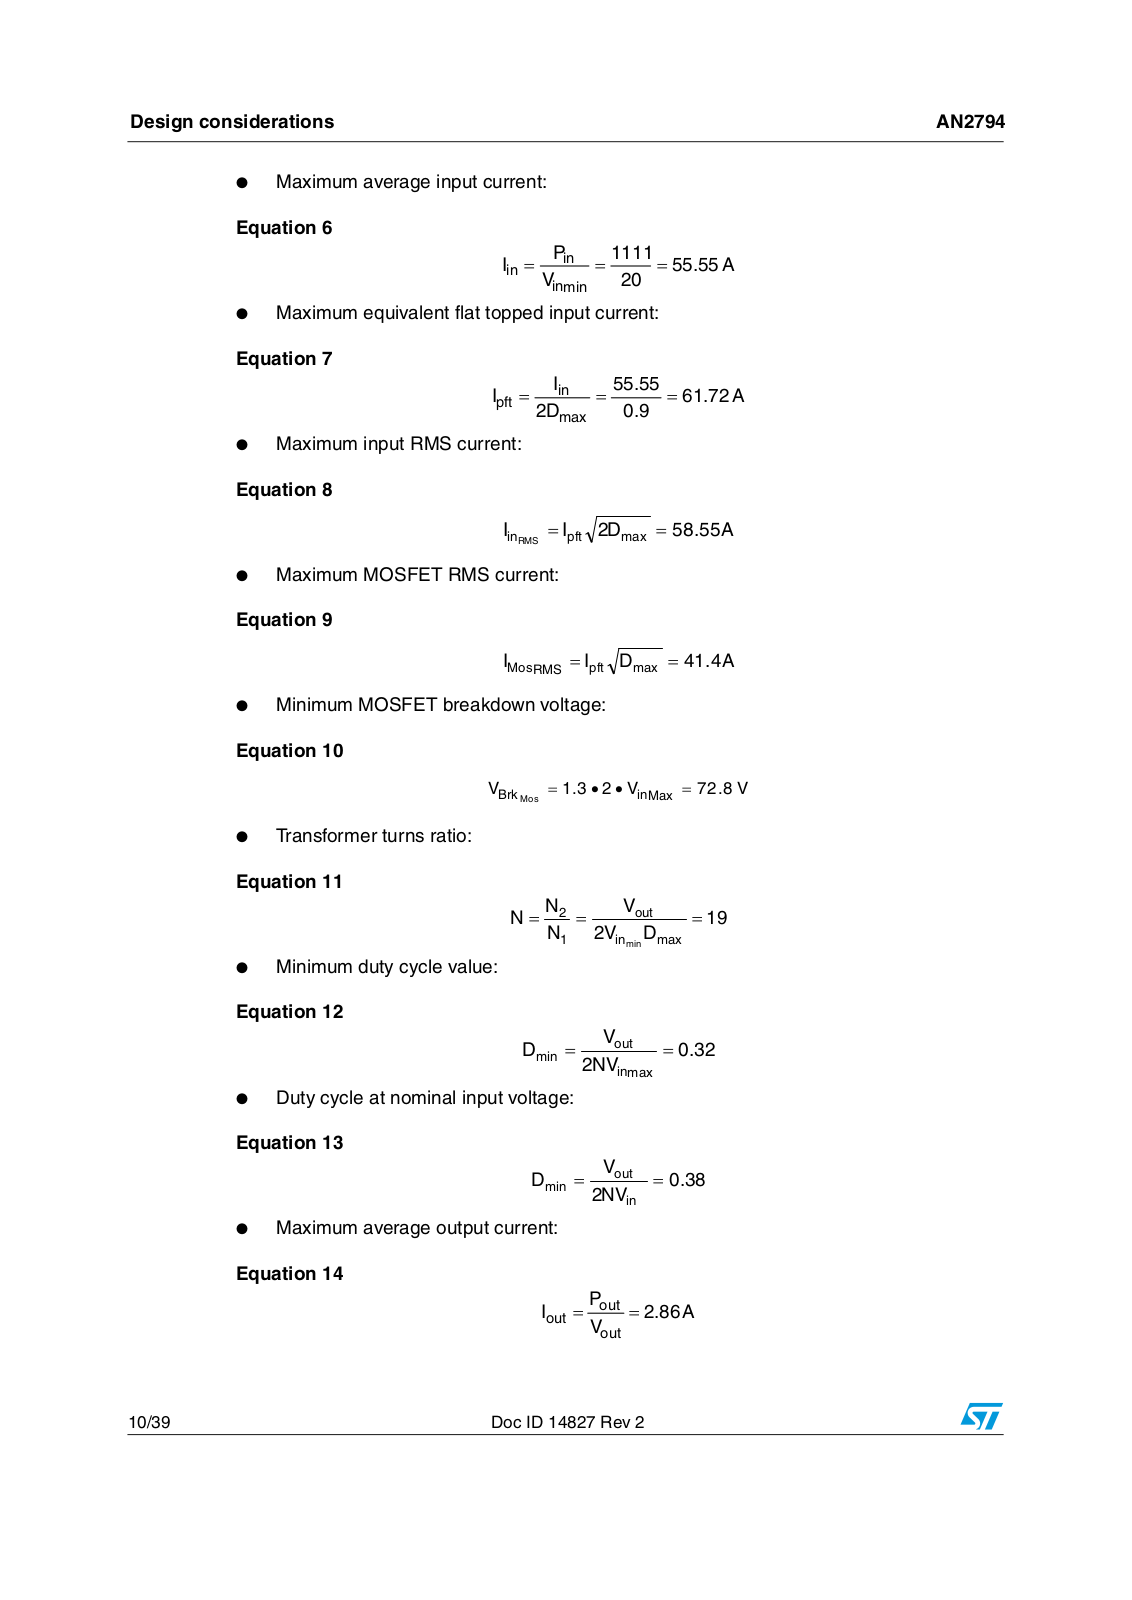
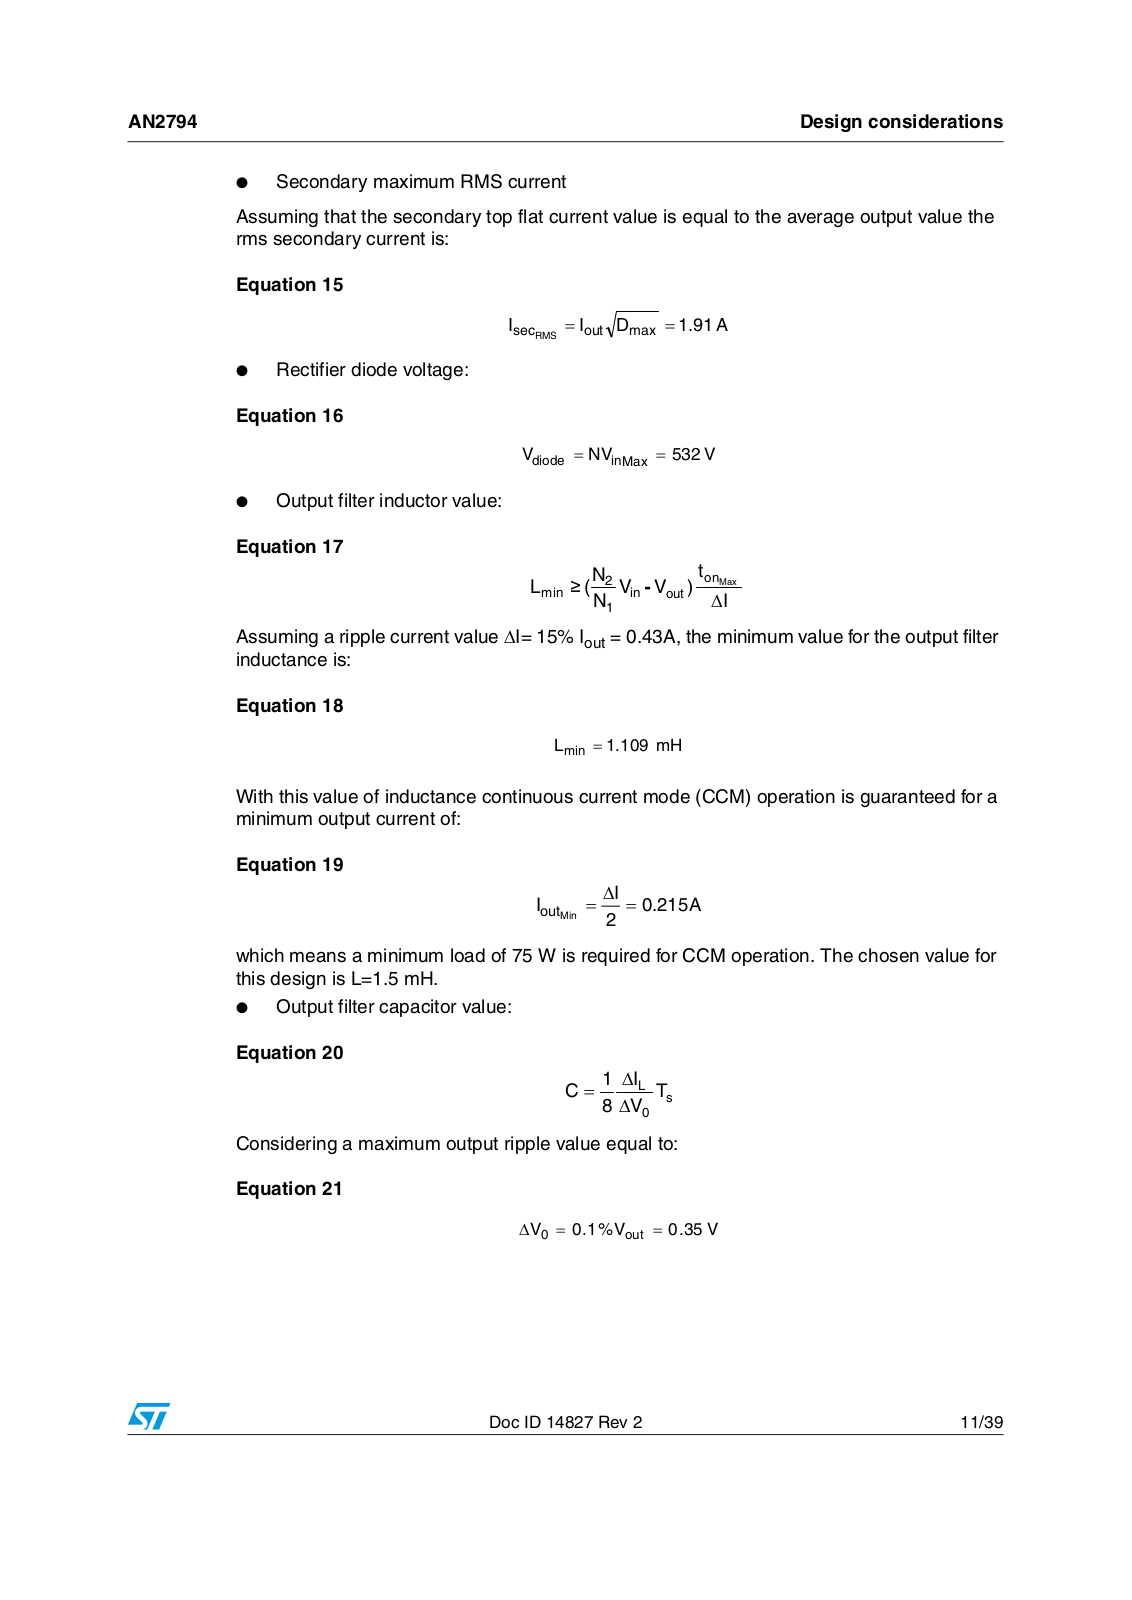
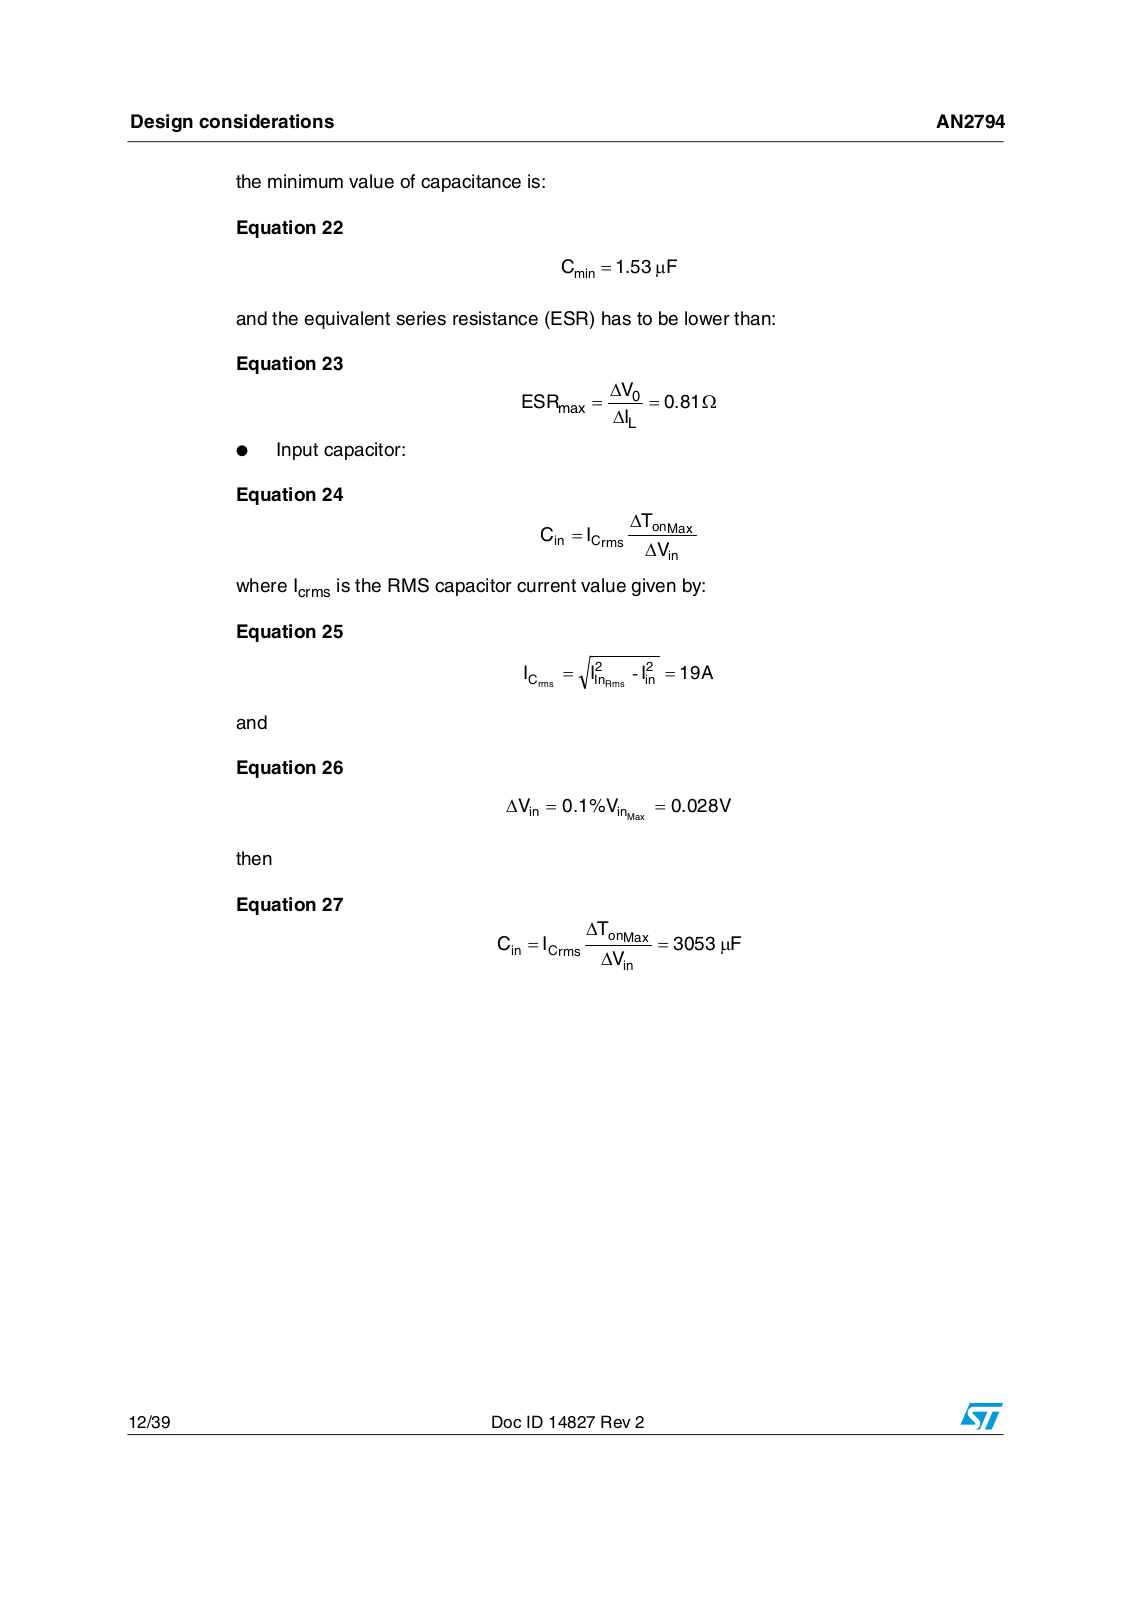
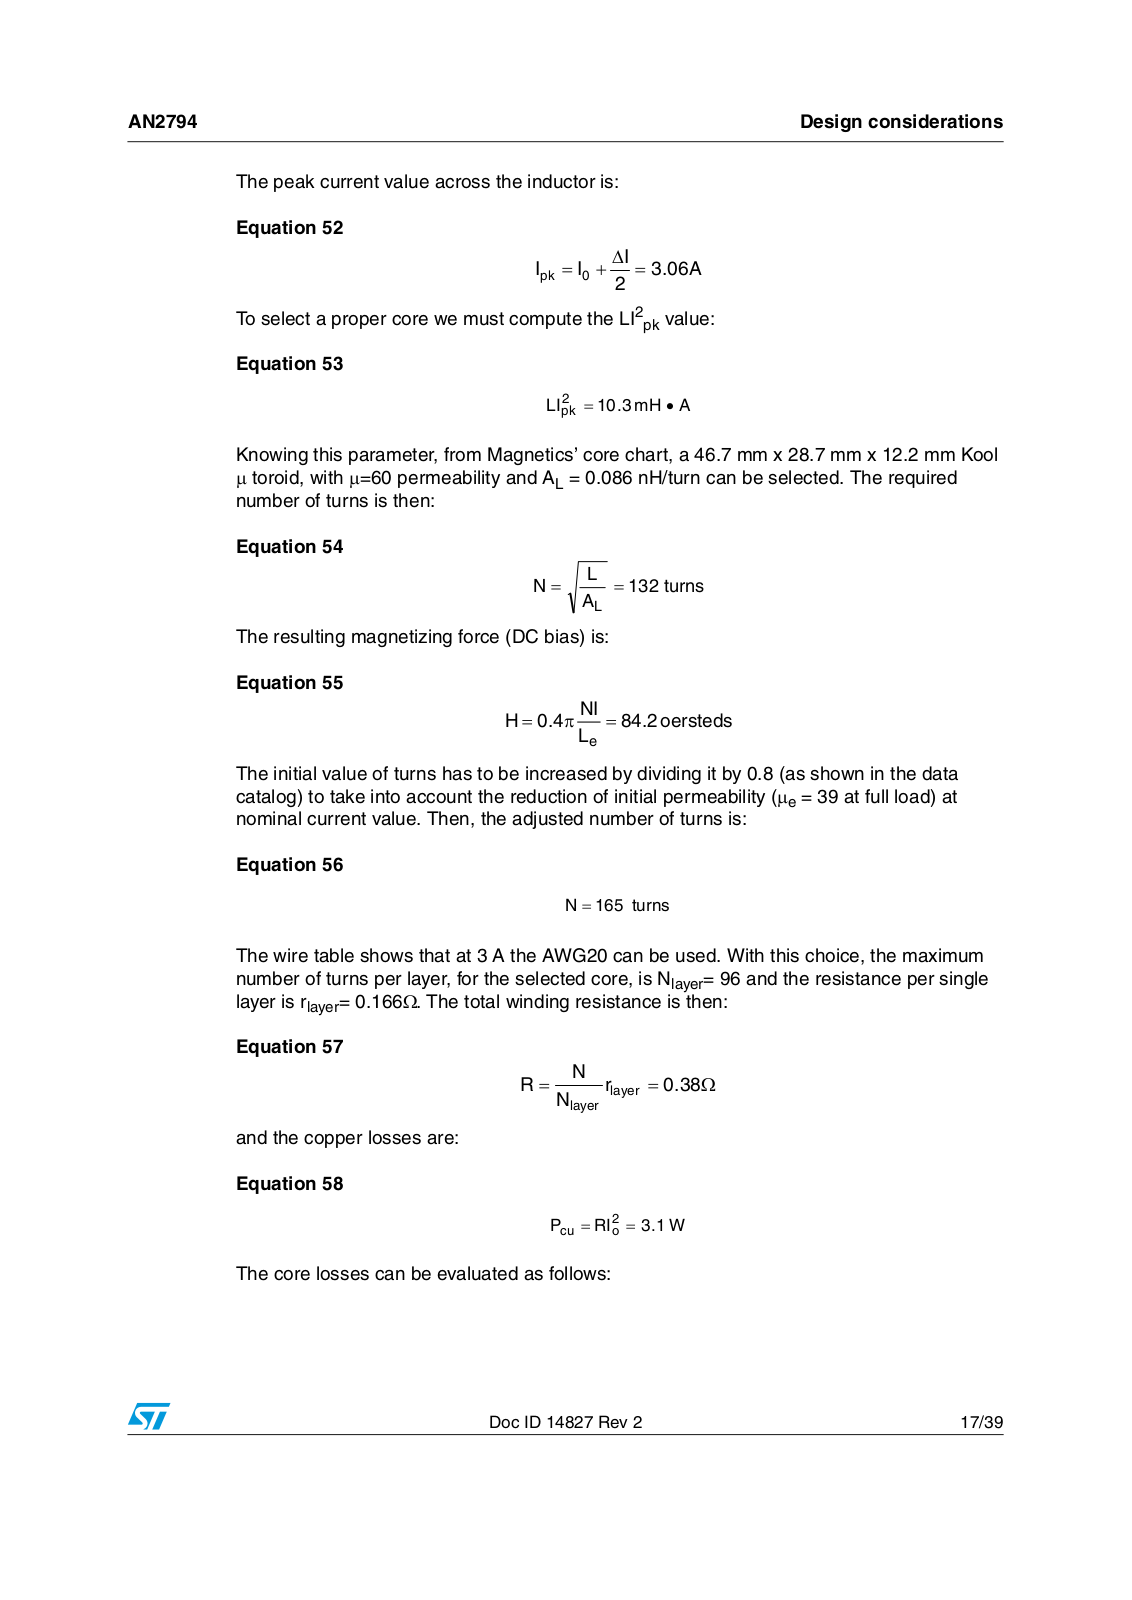
AN2794
AN2795
AN2797
AN2799
AN2800
AN2804
AN2807
AN2808
AN2809
AN2810
AN2811
AN2813
AN2815
AN2816
AN2818
AN2821
AN2822
AN2823
AN2824
AN2825
AN2827
AN2829
AN2831
AN2834
2
AN2835
AN2836
AN2839
AN2840
AN2841
AN2843
AN2844
AN2846
AN2847
AN2852
AN2855
AN2857
2
AN2859
AN2860
AN2862
AN2863
AN2865
AN2866
AN2867
2
AN2868
AN2869
AN2870
AN2872
AN2874
AN2898
AN2927
Loading...
Loading...
Nothing found
AN2794
APPLICATION NOTE
39 pgs
3.2 Mb
0
Table of contents
Loading...
ST AN2794 APPLICATION NOTE
...
ST APPLICATION NOTE
Download
Specifications and Main Features
Frequently Asked Questions
User Manual
Download
Loading...
+
hidden pages
Unhide
You need points to download manuals.
1 point = 1 manual.
You can buy points or you can get point for every manual you upload.
Buy points
Upload your manuals
 Loading...