

Page 1
AN2512
Application note
Three-phase meter based STPM01, VIPer12A
Introduction
This application note describes how to design a three-phase meter using STPM01 as the
measuring device and a VIPer12A based SMPS (Switch Mode Power Supply).
STPM01 is a metering ASSP implemented in an advanced 0.35 µm BCD6 technology. It is
designed for the effective measurement of active, reactive and apparent energies, Vrms,
Irms, instantaneous voltage and current, frequency in power line systems that use the
current transformer, Rogowski coil and/or shunt principle.
This device can be used as a standalone on-board metering device in single-phase energy
meter applications or as a peripheral in a microprocessor based single- or three-phase
meter.
In a standalone configuration STPM01 outputs a pulse train signal having a frequency
proportional to the active power used, while in peripheral mode STPM01 is used in a
microprocessor based application. In this case, measured data are read at a fixed time
interval from the device internal registers by means of SPI interface processed by a
microcontroller.
In the following paragraphs a circuit description is explained, with particular focus on the
power supply section, the three-phase design, and the clock management network. Then,
the power calculation algorithm is discussed and finally some layout hints and experimental
results are shown.
This application note should be used in conjunction with the STPM01 and VIPer12A
datasheet.
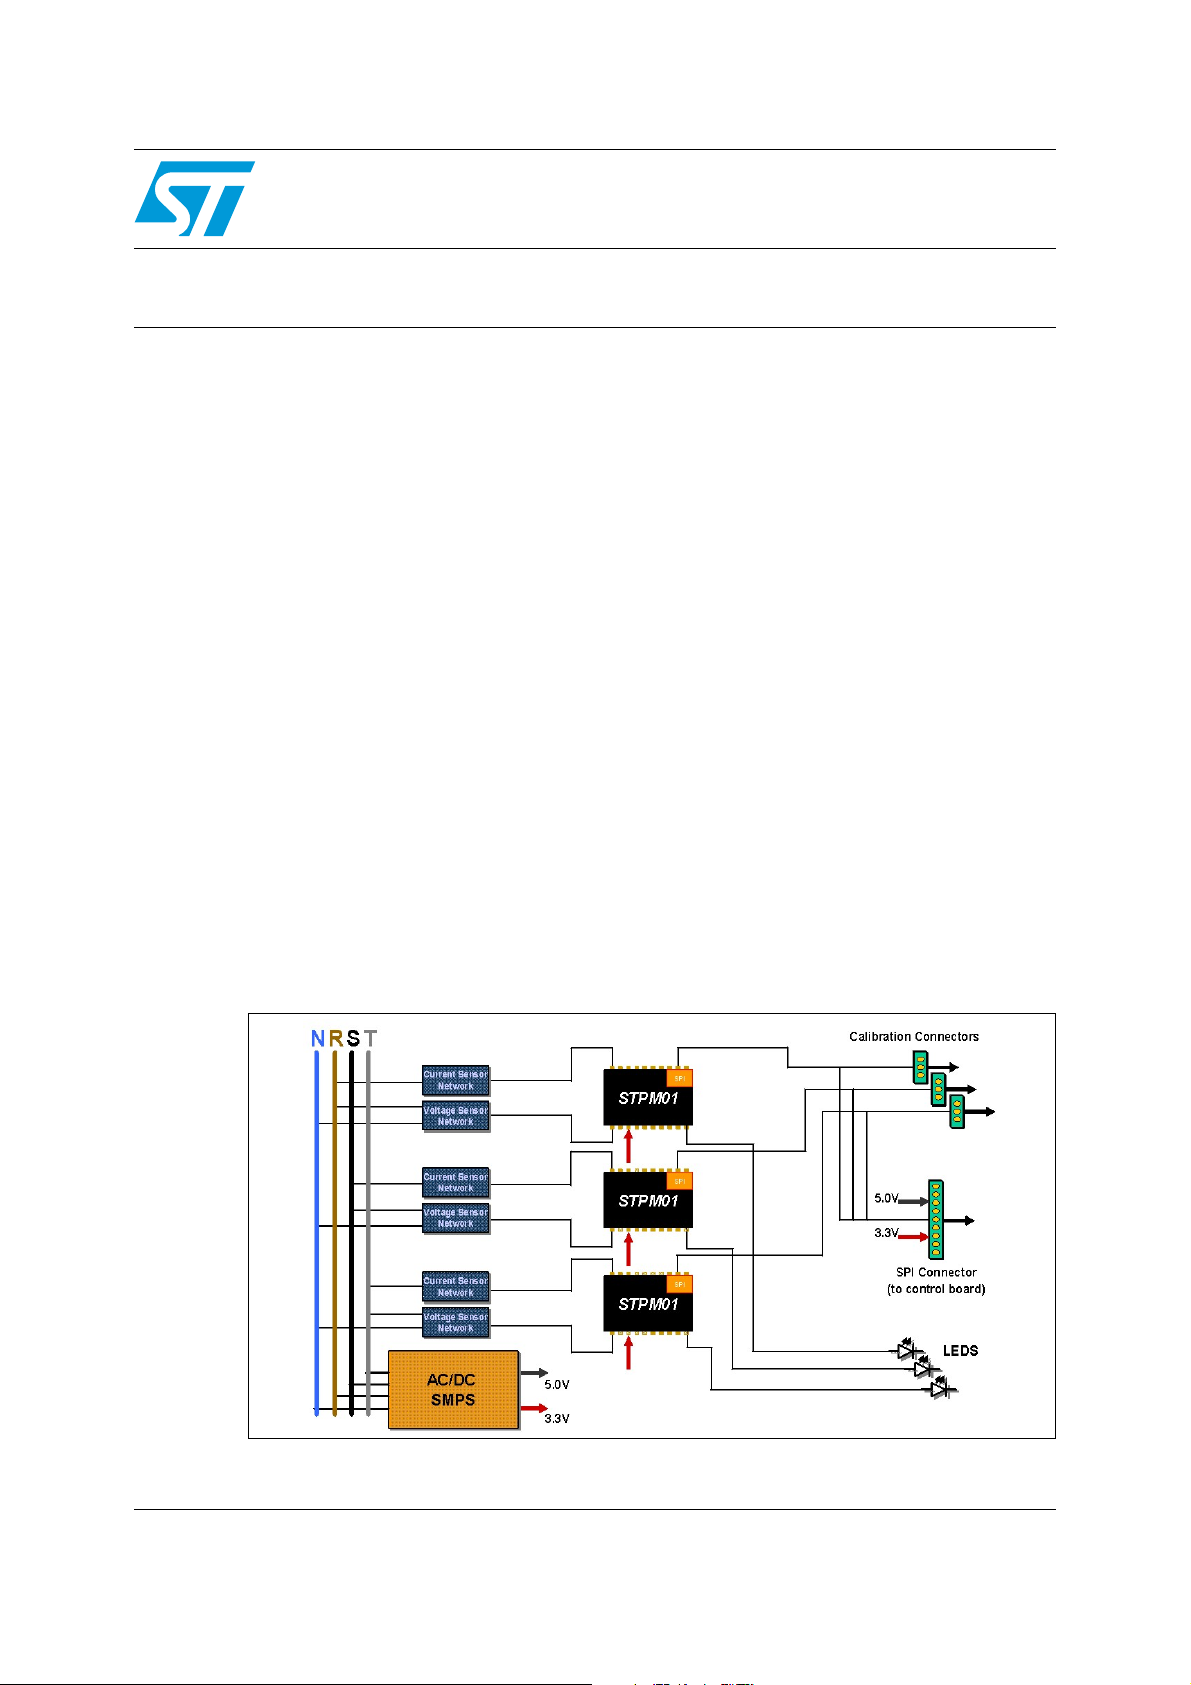
Three phase block diagram
April 2007 Rev 1 1/38
www.st.com
Page 2

Contents AN2512
Contents
1 Application description . . . . . . . . . . . . . . . . . . . . . . . . . . . . . . . . . . . . . . 4
1.1 Operating conditions . . . . . . . . . . . . . . . . . . . . . . . . . . . . . . . . . . . . . . . . . 4
1.2 Circuit description . . . . . . . . . . . . . . . . . . . . . . . . . . . . . . . . . . . . . . . . . . . . 4
1.3 Power supply circuit . . . . . . . . . . . . . . . . . . . . . . . . . . . . . . . . . . . . . . . . . . 5
1.4 Phase circuit . . . . . . . . . . . . . . . . . . . . . . . . . . . . . . . . . . . . . . . . . . . . . . . . 8
1.4.1 Current sensing circuit . . . . . . . . . . . . . . . . . . . . . . . . . . . . . . . . . . . . . . . 9
1.4.2 Anti-aliasing filter . . . . . . . . . . . . . . . . . . . . . . . . . . . . . . . . . . . . . . . . . . . 9
1.4.3 Voltage sensing circuit . . . . . . . . . . . . . . . . . . . . . . . . . . . . . . . . . . . . . . . 9
1.4.4 Crosstalk cancellation network . . . . . . . . . . . . . . . . . . . . . . . . . . . . . . . . 9
1.5 Clock management network . . . . . . . . . . . . . . . . . . . . . . . . . . . . . . . . . . . 10
2 Communication with microprocessor . . . . . . . . . . . . . . . . . . . . . . . . . . 11
3 Power calculation algorithm . . . . . . . . . . . . . . . . . . . . . . . . . . . . . . . . . . 13
3.1 STPM01 SPI Interface . . . . . . . . . . . . . . . . . . . . . . . . . . . . . . . . . . . . . . . 13
3.2 STPM01 Initialization (latching) and reading (shifting) . . . . . . . . . . . . . . . 14
3.3 Data record structure . . . . . . . . . . . . . . . . . . . . . . . . . . . . . . . . . . . . . . . . 15
3.4 Data integrity checks . . . . . . . . . . . . . . . . . . . . . . . . . . . . . . . . . . . . . . . . 17
3.5 Unpacking of data records . . . . . . . . . . . . . . . . . . . . . . . . . . . . . . . . . . . . 17
3.6 Processing of phase energy values . . . . . . . . . . . . . . . . . . . . . . . . . . . . . 19
3.7 Three-phase energy calculation . . . . . . . . . . . . . . . . . . . . . . . . . . . . . . . . 20
3.8 Pulse generation . . . . . . . . . . . . . . . . . . . . . . . . . . . . . . . . . . . . . . . . . . . 20
4 Layout rules . . . . . . . . . . . . . . . . . . . . . . . . . . . . . . . . . . . . . . . . . . . . . . . 21
5 Experimental results . . . . . . . . . . . . . . . . . . . . . . . . . . . . . . . . . . . . . . . . 22
5.1 Phase one results . . . . . . . . . . . . . . . . . . . . . . . . . . . . . . . . . . . . . . . . . . . 22
5.2 Phase two results . . . . . . . . . . . . . . . . . . . . . . . . . . . . . . . . . . . . . . . . . . . 23
5.3 Phase three results . . . . . . . . . . . . . . . . . . . . . . . . . . . . . . . . . . . . . . . . . 23
5.4 Voltage and frequency influence on phase three . . . . . . . . . . . . . . . . . . . 24
6 Revision history . . . . . . . . . . . . . . . . . . . . . . . . . . . . . . . . . . . . . . . . . . . 37
2/38
Page 3

AN2512 List of figures
List of figures
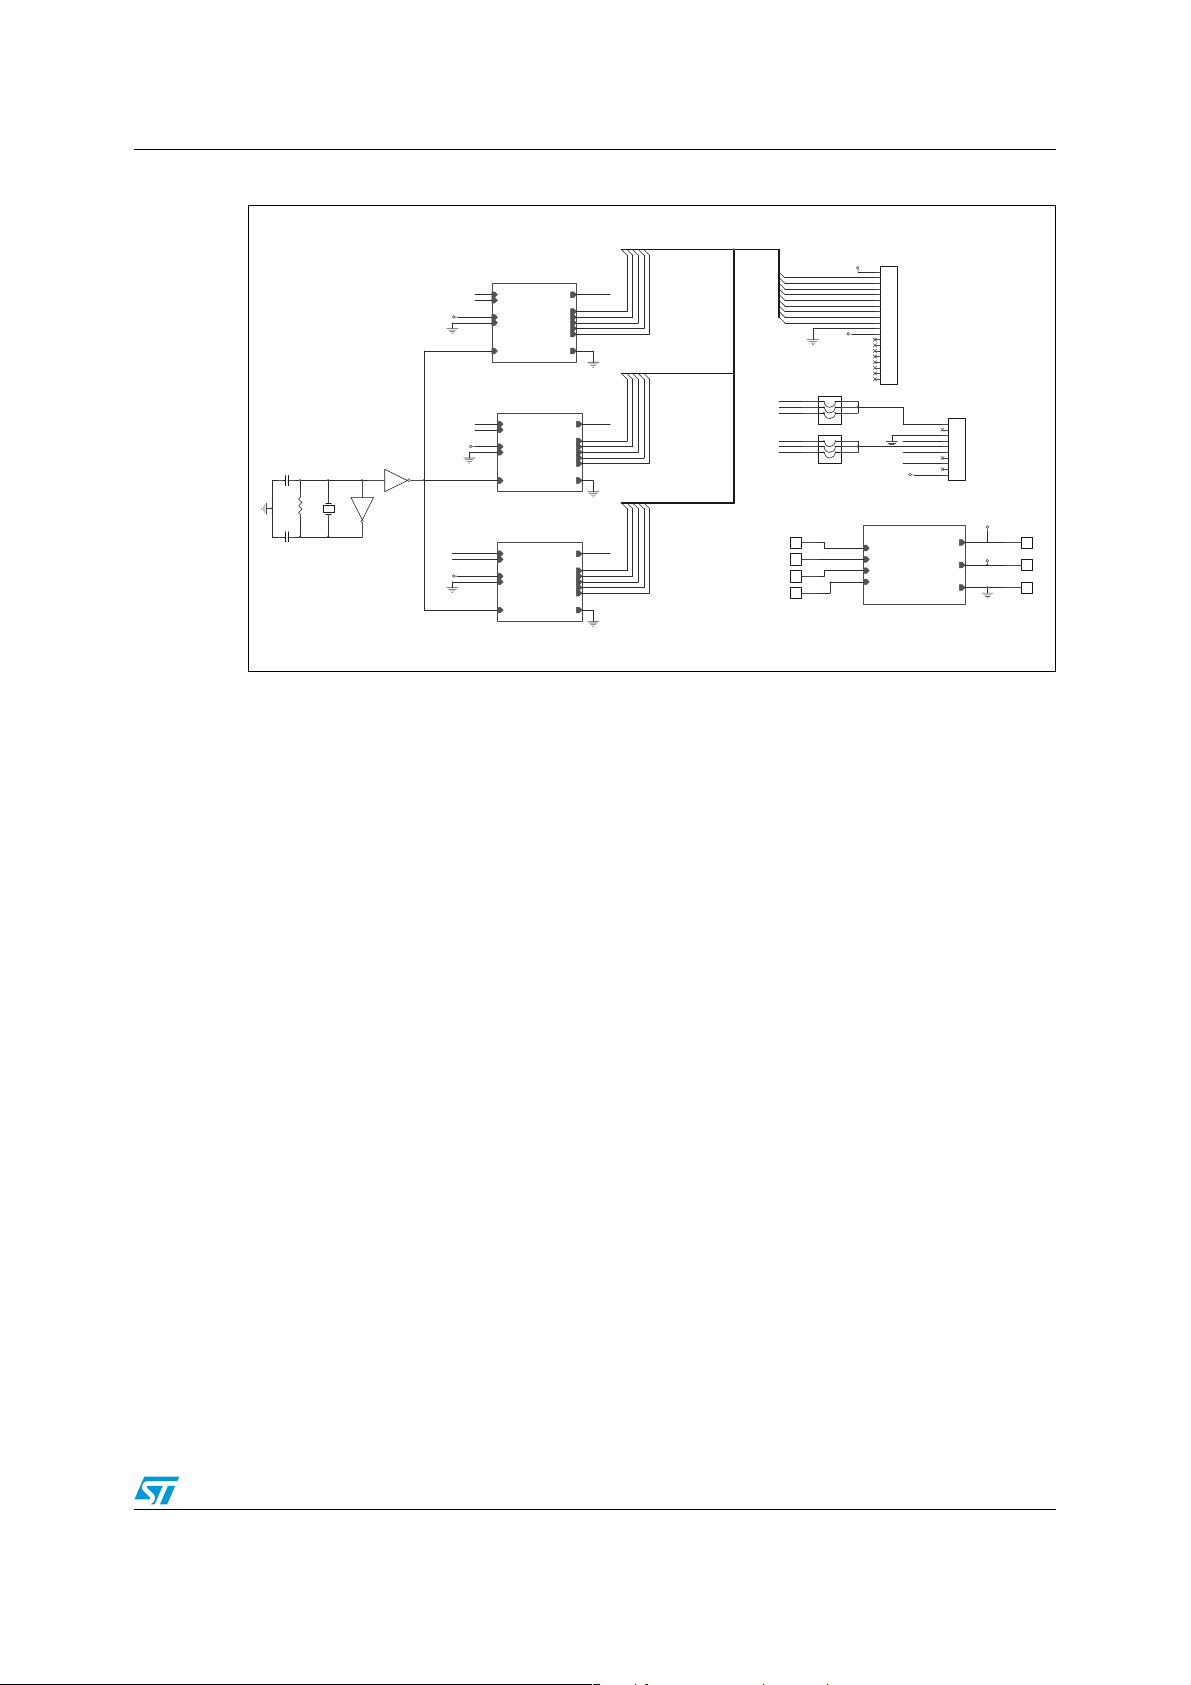
Figure 1. Top layer circuit schematic . . . . . . . . . . . . . . . . . . . . . . . . . . . . . . . . . . . . . . . . . . . . . . . . . . 5
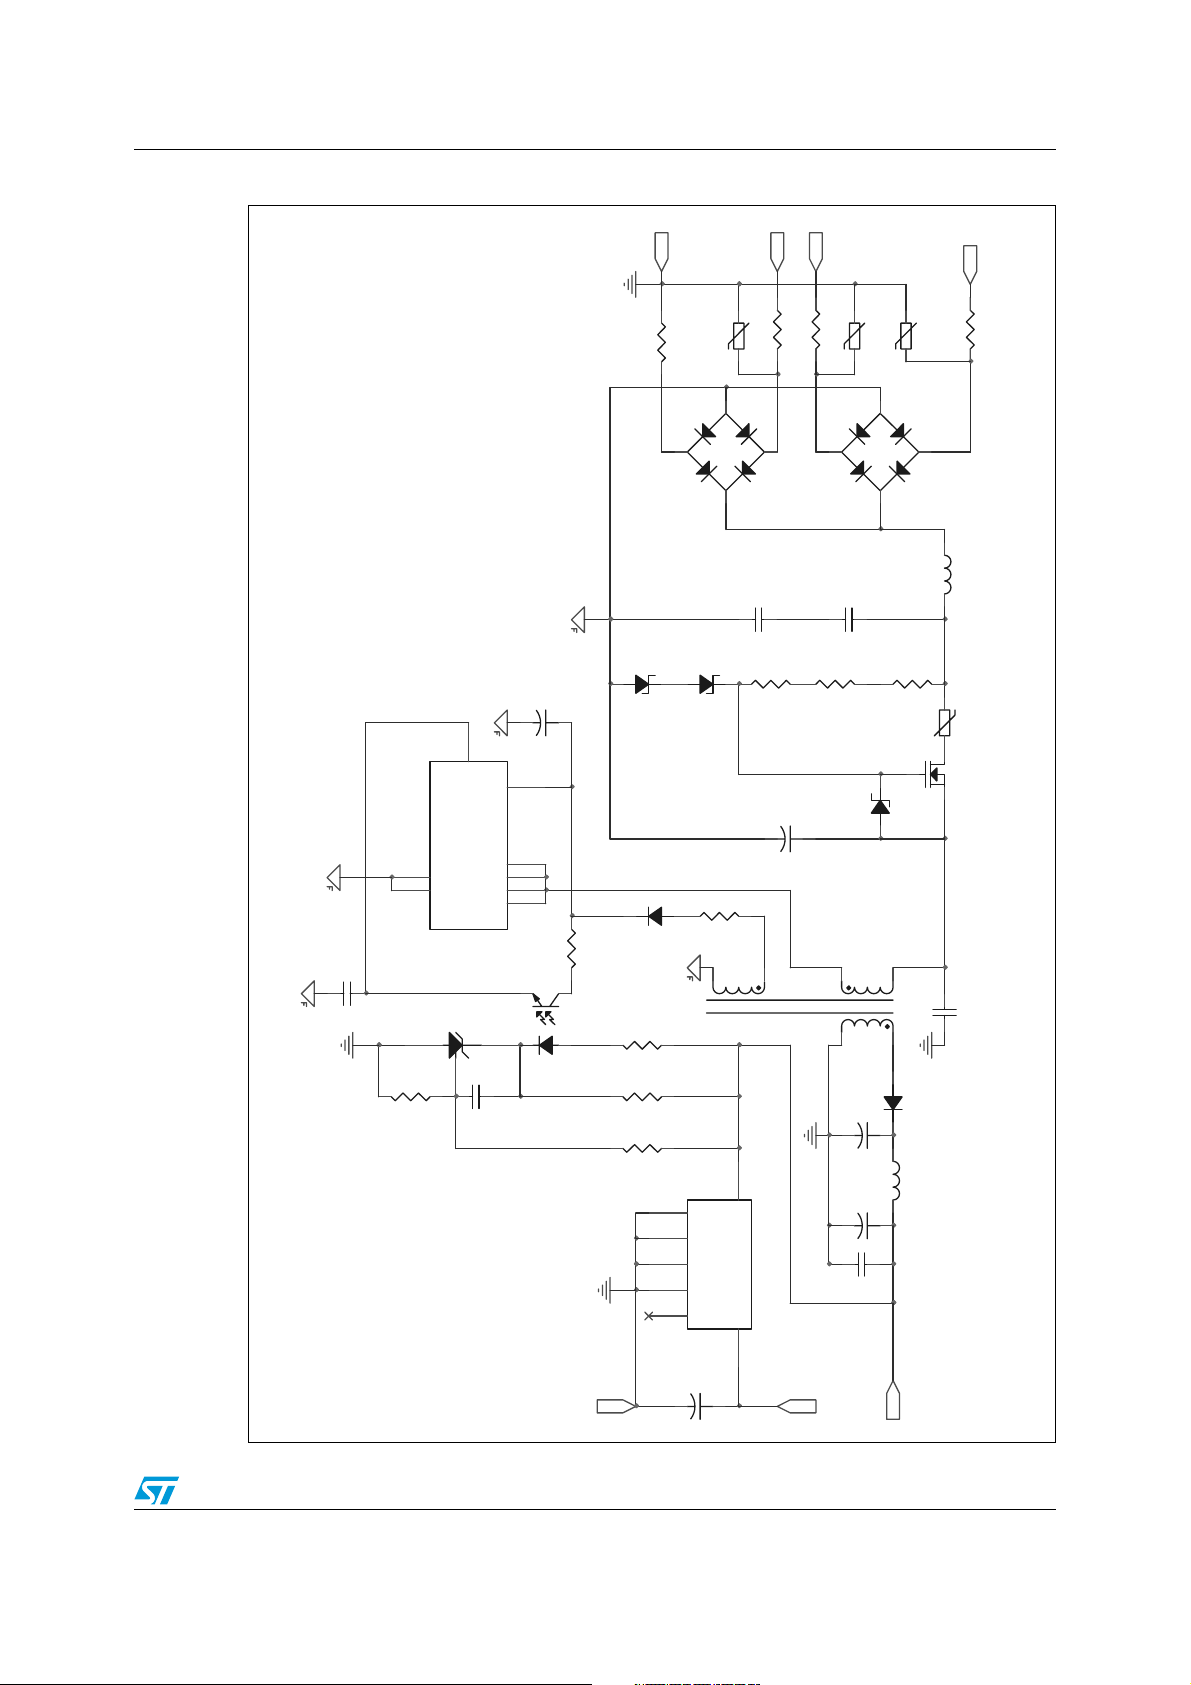
Figure 2. SMPS circuit schematic . . . . . . . . . . . . . . . . . . . . . . . . . . . . . . . . . . . . . . . . . . . . . . . . . . . . 7
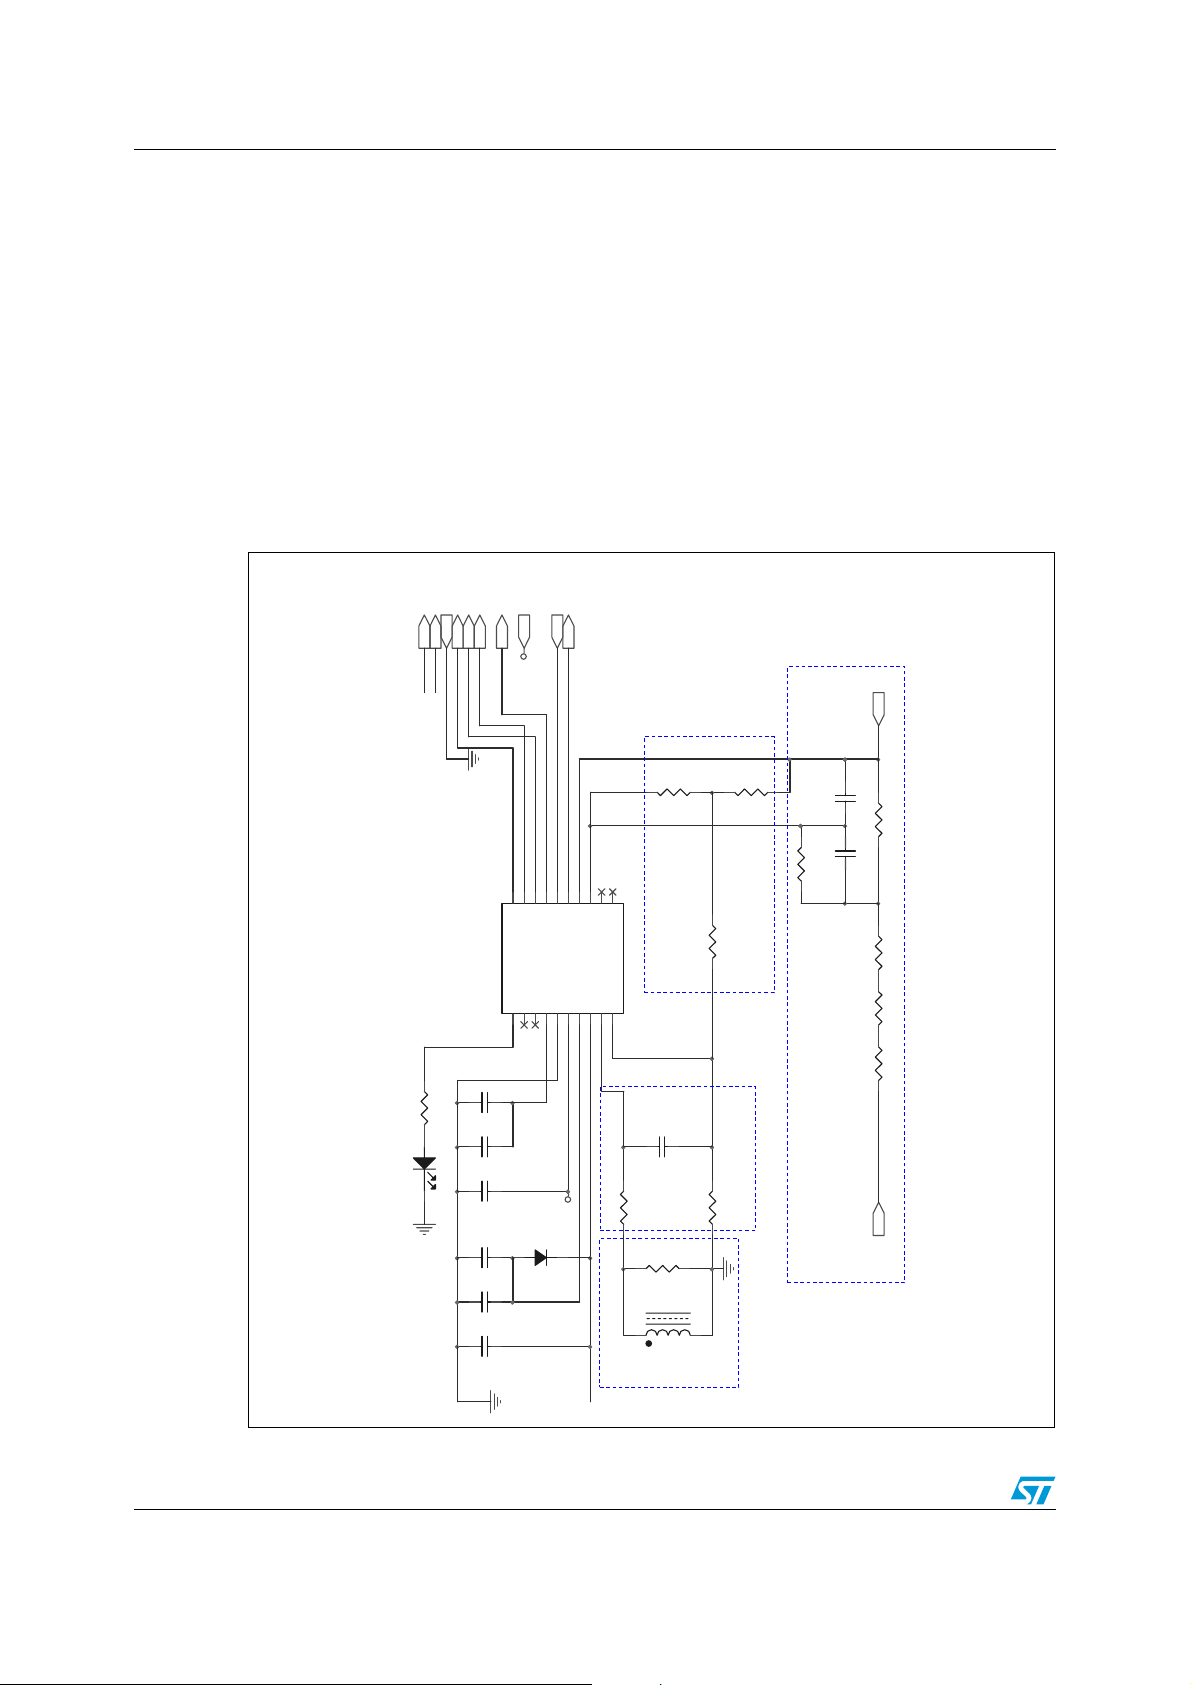
Figure 3. Phase circuit schematic . . . . . . . . . . . . . . . . . . . . . . . . . . . . . . . . . . . . . . . . . . . . . . . . . . . . 8
Figure 4. Clock management network schematic . . . . . . . . . . . . . . . . . . . . . . . . . . . . . . . . . . . . . . . 10
Figure 5. Connectors schematic . . . . . . . . . . . . . . . . . . . . . . . . . . . . . . . . . . . . . . . . . . . . . . . . . . . . 11
Figure 6. Flow chart of phase reading . . . . . . . . . . . . . . . . . . . . . . . . . . . . . . . . . . . . . . . . . . . . . . . . 14
Figure 7. Timing for data records reading in 3 phase system . . . . . . . . . . . . . . . . . . . . . . . . . . . . . . 15
Figure 8. Data records reconstruction . . . . . . . . . . . . . . . . . . . . . . . . . . . . . . . . . . . . . . . . . . . . . . . . 16
Figure 9. STPM01 data register structure . . . . . . . . . . . . . . . . . . . . . . . . . . . . . . . . . . . . . . . . . . . . . 16
Figure 10. Typical profile of output of an energy integrator . . . . . . . . . . . . . . . . . . . . . . . . . . . . . . . . . 19
Figure 11. Graph of experimental results of phase n.1 tests . . . . . . . . . . . . . . . . . . . . . . . . . . . . . . . . 22
Figure 12. Graph of experimental results of phase n.2 tests . . . . . . . . . . . . . . . . . . . . . . . . . . . . . . . . 23
Figure 13. Graph of experimental results of phase n.3 tests . . . . . . . . . . . . . . . . . . . . . . . . . . . . . . . . 24
Figure 14. Graph of voltage and frequency influence on phase n.3 . . . . . . . . . . . . . . . . . . . . . . . . . . 25
Figure 15. Instantaneous voltage (or current) in one voltage cycle of a three-phase system . . . . . . . 25
Figure 16. Per-phase powers in (a) delta-connected load and (b) wye-connected load . . . . . . . . . . . 26
Figure 17. Two-wattmeter method in star- or delta-connected load. . . . . . . . . . . . . . . . . . . . . . . . . . . 27
Figure 18. The wattmeter connections in the three-phase four-wire loads . . . . . . . . . . . . . . . . . . . . . 28
3/38
Page 4

Application description AN2512
1 Application description
Three-phase meters (which derive as particular cases from poly-phase systems), are most
commonly used in practical industrial applications, and in a few cases also for domestic use.
This three-phase meter can be used as a reference board to build a Class 0,5 three-phase
microprocessor based meter for power line systems 3-Wire DELTA service, 4-Wires DELTA
and WYE service. It uses a multi-chip topology, in which each phase is monitored using a
single-phase device.
In this way, three STPM01 have been used with a common clock network. The power supply
is implemented in fly-back topology using a VIPer12A.
The meter cannot be used in standalone mode and a management/supervisory board must
be used for energy integration and data displaying. Such a control board should be plugged
in the connector J2 (referring to board schematics below), while the connector J1 is used for
calibration purposes in association (or conjunction) with the STPMxx parallel
programmer/reader released with the application.
1.1 Operating conditions
Table 1. Operating conditions
Value Min Max Unit
V
NOM
I
NOM/IMAX
f
LIN
T
AMB
1.2 Circuit description
The meter consists of one board divided into the following sections:
● Power supply management circuit
● Phase circuit
● Clock management network
● Connectors.
The schematic of the board is shown in Figure 1.
80 480 V
530A
45 65 Hz
- 40 +85 °C
RMS
RMS
4/38
Page 5
AN2512 Application description
Figure 1. Top layer circuit schematic
5V
J2
PHASE_1
P1
P
N
N
VDD
VDD
GND
CLKIN
CLKIN CLKOU T
PHASE
PHASE_2
P2 VOTPL2
P
N
N
VDD
VDD
P3
N
GND
CLKIN CLKOUT
PHASE
PHASE_3
P
N
VDD
GND
CLKIN CLKOUT
PHASE
U8A
C1
4.194304MHz
15pF
R1
1M
C2
15pF
74HC14A/SO
1 2
34
U8B
Y1
74HC14A/SO
VDD
VOTPL1
VOTP
SDA
SDA
SCSL1
SCS
SCL
SCL
LEDL1
LED
SYN
SYN
VOTP
SDA
SDA
SCSL2
SCS
SCL
SCL
LEDL2
LED
SYN
SYN
VOTPL3
VOTP
SDA
SDA
SCSL3
SCS
SCL
SCL
LEDL3
LED
SYN
SYN
SCL
SDA
SYN
SCSL1
SCSL2
SCSL3
LEDL1
LEDL2
LEDL3
J14
1 2
VOTPL1
3 4
VOTPL2
5 6
VOTPL3
JUMPER3
J13
1 2
SCSL1
3 4
SCSL2
5 6
SCSL3
SCSJUMPER
J7 1 J111
J8 1
J9 1
J10 1
1
2
3
4
5
6
7
8
9
10
11
VDD
12
13
14
15
16
17
18
19
20
CON20
J1
VOTP
1
2
3
SDA
4
SCS
5
SCL
6
7
SYN
8
9
VDD
10
SMPS
P1
P1
P2
P2
P3
P3
N
N
SMPS
5V
5V
VDD
3.3V
GND
J121
J51
1.3 Power supply circuit
A 3-phase 4-wire bridge is used for mains rectification because the neutral rectification is
needed to ensure proper operation in case of missing neutral connection or neutral misswiring.
A varistor is connected between each line and neutral to guarantee pulse voltage test
immunity according to the EN62052-11 standard.
The input EMI filter is a simple, undamped LC-filter for both differential and common mode
noise suppression.
The circuit for input voltage limiting is connected between the input EMI filter and the bulk
capacitor C4. Such a circuitry includes a Power MOSFET and a self driven control section.
The MOSFET Q1 is a standard N-Channel 500 V 3.3 Ω in D-PAK package, mounted on a
small copper area to improve thermal performance. The self driven control section consists
of a voltage divider and zener diodes. The resistors R1, R2 and R3 ensure the gate-source
charge for the switch, while the zener diodes D3 and D4 set the maximum voltage value
(360 V) across the bulk capacitor.
An NTC limits the inrush current and ensures Q1 operation inside its safe operating area.
The Flyback converter is based on VIPer12A, a product in the VIPerX2A family, which
combines a dedicated current mode off-line PWM controller with a high voltage power
MOSFET on the same silicon chip. The switching frequency is fixed at 60 kHz by the IC
internal oscillator in order to optimize the transformer size and cost. The transformer
reflected voltage has been set to 60 V, providing enough margin for the leakage inductance
voltage spike and no snubber circuit is needed which allows consequent cost savings.
As soon as the voltage is applied on the input of the converter, the high voltage start-up
current source connected to the drain pin is activated and starts to charge the V
capacitor
dd
C8 through a constant current of 1 mA. When the voltage across this capacitor reaches the
V
on threshold (about 14 V), the VIPer12A starts to switch. During normal operation the
dd
5/38
Page 6

Application description AN2512
smart power IC is powered by the auxiliary winding of the transformer via the diode D7. No
spike killer for the auxiliary voltage fluctuations is needed thanks to the wide range of the
V
pin (9-38 V). The primary current is measured using the integrated current sensing for
dd
current mode operation.
The output rectifier D6 has been chosen in accordance with the maximum reverse voltage
and power dissipation. In particular a 0.5A-80 V Schottky diode, type TMBAT49, has been
selected.
The output voltage regulation is performed by secondary feedback on the 5 V output
dedicated to the display, while the 3.3 V output, dedicated to the logic part and the
microcontroller, is linearly post-regulated from the 5 V output. This operation is performed by
a very low drop voltage regulator, L4931ABD33, in SO-8 package. The voltage regulator
delivers up to 100 mA, ensuring good reliability with no heat sink. The feedback network
ensures the required insulation between the primary and secondary sections. The
optotransistor directly drives the VIPer12A feedback pin which controls the IC operation.
A small LC filter has been added to the 5 V output in order reduce the high frequency ripple
with reasonable output capacitors value.
The Flyback transformer is a layer type based on E13 core and N27 ferrite, manufactured by
Pulse Eldor, and ensures safety insulation in accordance with the EN60950.
For more info on the power supply, please refer to AN2264, "Three-Phase SMPS for low
power applications with VIPer12A". The schematic of the power supply section is shown in
Figure 2.
6/38
Page 7
AN2512 Application description
Figure 2. SMPS circuit schematic
P2
N
P3
P1
R62 22E 1W
SO5K275/275V
R64 22E 1W
RV3
4
-+
1
BRIDGE
3
10uF 50V
C21
D9
180V
3
FB
Vdd
VIPer12AS/SO-8
2
S
1
S
47nF 50V SMD
C24
3 1
R25
4.7K 1% SM D
U4
TS2431
2
100nF 50V SMD
+
4
U5
5
D
6
D
7
D
8
D
5.6K
R24
4
3
PC817
12
C23
GND
LL4148
220E SMD
U3
R21
R22
1K SMD
4.7K 1% SM D
D7
180V
10E SMD
R20
D10
5
R23
2
GND
3
GND
6
GND
7
GND
5
INHIB
1000uF 50V
C20
+
R63 22E 1W
2
1
BRIDGE
D8
220nF 630V
C19
330k
4
U2 L4931ABD33
VOUTVIN
3.3V@100mA
18
220nF 630V
C16
R59
330k
R60
ZMM 15/S OD-80
C18 2.2uF450V
+
2
6
330uF 25V
22uF 16V
100nF SMD
3.3V
SO5K275/275V
SO5K275/275V
RV2
4
-+
3
R58
330k
120E
1
D4
1
T1
10
D5
TMBAT49
C14
+
L3
10uH 125mA SMD
C15
+
C17
5V@10mA
5V
R61 22E 1W
RV1
2
D3
1mH
L2
NTC1
4 3
Q1 STD5nk40Z
C22
2nF/2kV (Y1)
7/38
Page 8
Application description AN2512
1.4 Phase circuit
This paragraph explains the implementation of the phase network which performs the power
calculation.
The three phases are identical. Figure 3 shows the implementation of the STPM01 used for
energy calculation of each phase.
The schematic can be divided into the following subsets:
● Current sensing circuit (1)
● Anti-aliasing Filter (2)
● Voltage Sensing Circuit (3)
● Crosstalk Cancellation Network (4).
Figure 3. Phase circuit schematic
SDA
SCS
SCL
SYN
LED
VOTP
GND
VDD
CLKI N
CLKOUT
GND
LED
VOTP
SDA
LED
R2 750
12
D1
VDD
SCL
SYN
SCS
R10
150K
R9
2,2K
C12
0
C11
R13
2.2M
4
2
R8 1k
C8
C7
C6
C5
C4
C3
Scl
Sda
U1
led
MON
1245687
20
1MY
1nF
1nF
D2
1MY
1nF
1nF
R7
12131416171531819
Vip
Vin
Iln2
Syn
Scs
CLKin
CLKout
Vdda
STPM01_TSSOP20
Votp
Ilp1
Iln1 Ilp2
9
10 11
C9
10nF
R5 1k
R6
3.4
CT
L1
1
VOTP
MOP
Vddd
Vss
Vcc
VDD
LL4148
N
N
33nF
4.7u
R17 470
R16
200K
R15
270K
R14
270K
P
P
3
8/38
Page 9

AN2512 Application description
1.4.1 Current sensing circuit
The STPM01 has two external current sensing circuits, primary and secondary current
channels.
Normally, the second current circuit is used in single-phase meter implementation when the
anti-tamper feature is required. In this way it is possible to read also the current flowing into
the neutral wire to have a comparison with the current flowing into the line wire and detect
possible tampers.
In this application only the primary channel has been used. As a consequence, the
configuration of STPM01 is:
● PST= 2 if a current transformer is used (this is the case of this meter);
● PST= 0 (or 1) if a Rogowski coil is used
in the latter case ADDG bit can be used to have a further gain of x8.
The current channel uses a current transformer to sense mains current. The burden resistor
is used to produce a voltage between VIN1 and VIP1 proportional to the current measured.
1.4.2 Anti-aliasing filter
The anti-aliasing filter is a low-pass filter. It has a negligible influence on the voltage drop
between IIN1 and IIP1. Its aim is to reduce the distortion caused by the sampling, also
called aliasing, by removing the out-of-band frequencies of the input signal before sampling
it with the analog-to-digital converter.
Filtering is easily implemented with a resistor-capacitor (RC) single-pole circuit which
obtains an attenuation of -20dB/dec.
1.4.3 Voltage sensing circuit
A resistor divider is used as voltage sensor.
The 740 kΩ resistor is separated into three, 2x270 kΩ and 1x200 kΩ, in-series resistors,
which ensure that a high voltage transient does not bypass the resistor. This also reduces
the potential across the resistors, thereby decreasing the possibility of arcing. The following
resistors are used to implement resistor divider:
● R=R14+R15+R16=740 KΩ,
● R5=470 Ω.
Capacitor C11 and resistance (R19+ R15) create a filter which prevents Electromagnetic
Interference (EMI).
1.4.4 Crosstalk cancellation network
The voltage front-end handles voltages of considerable amplitude, which makes it a
potential source of noise. Disturbances are readily emitted into current measurement
circuitry where they interfere with the actual signal to be measured. Typically, this produces
a non-linear error at small signal amplitudes and non-unity power factors. At unity power
factor, voltage and current signals are in phase and crosstalk between voltage and current
channels merely appears as a gain error, which can be calibrated. When voltage and
current are not in phase, crosstalk has a non-linear effect on the measurements, which
cannot be calibrated.
9/38
Page 10
Application description AN2512
Crosstalk is minimized by means of good PCB planning and the proper use of filter
components in the crosstalk network. Recommended filter components are shown in
Figure 3. The network subtracts a signal proportional to the voltage input from the current
input. This prevents cross talking within the STPM01.
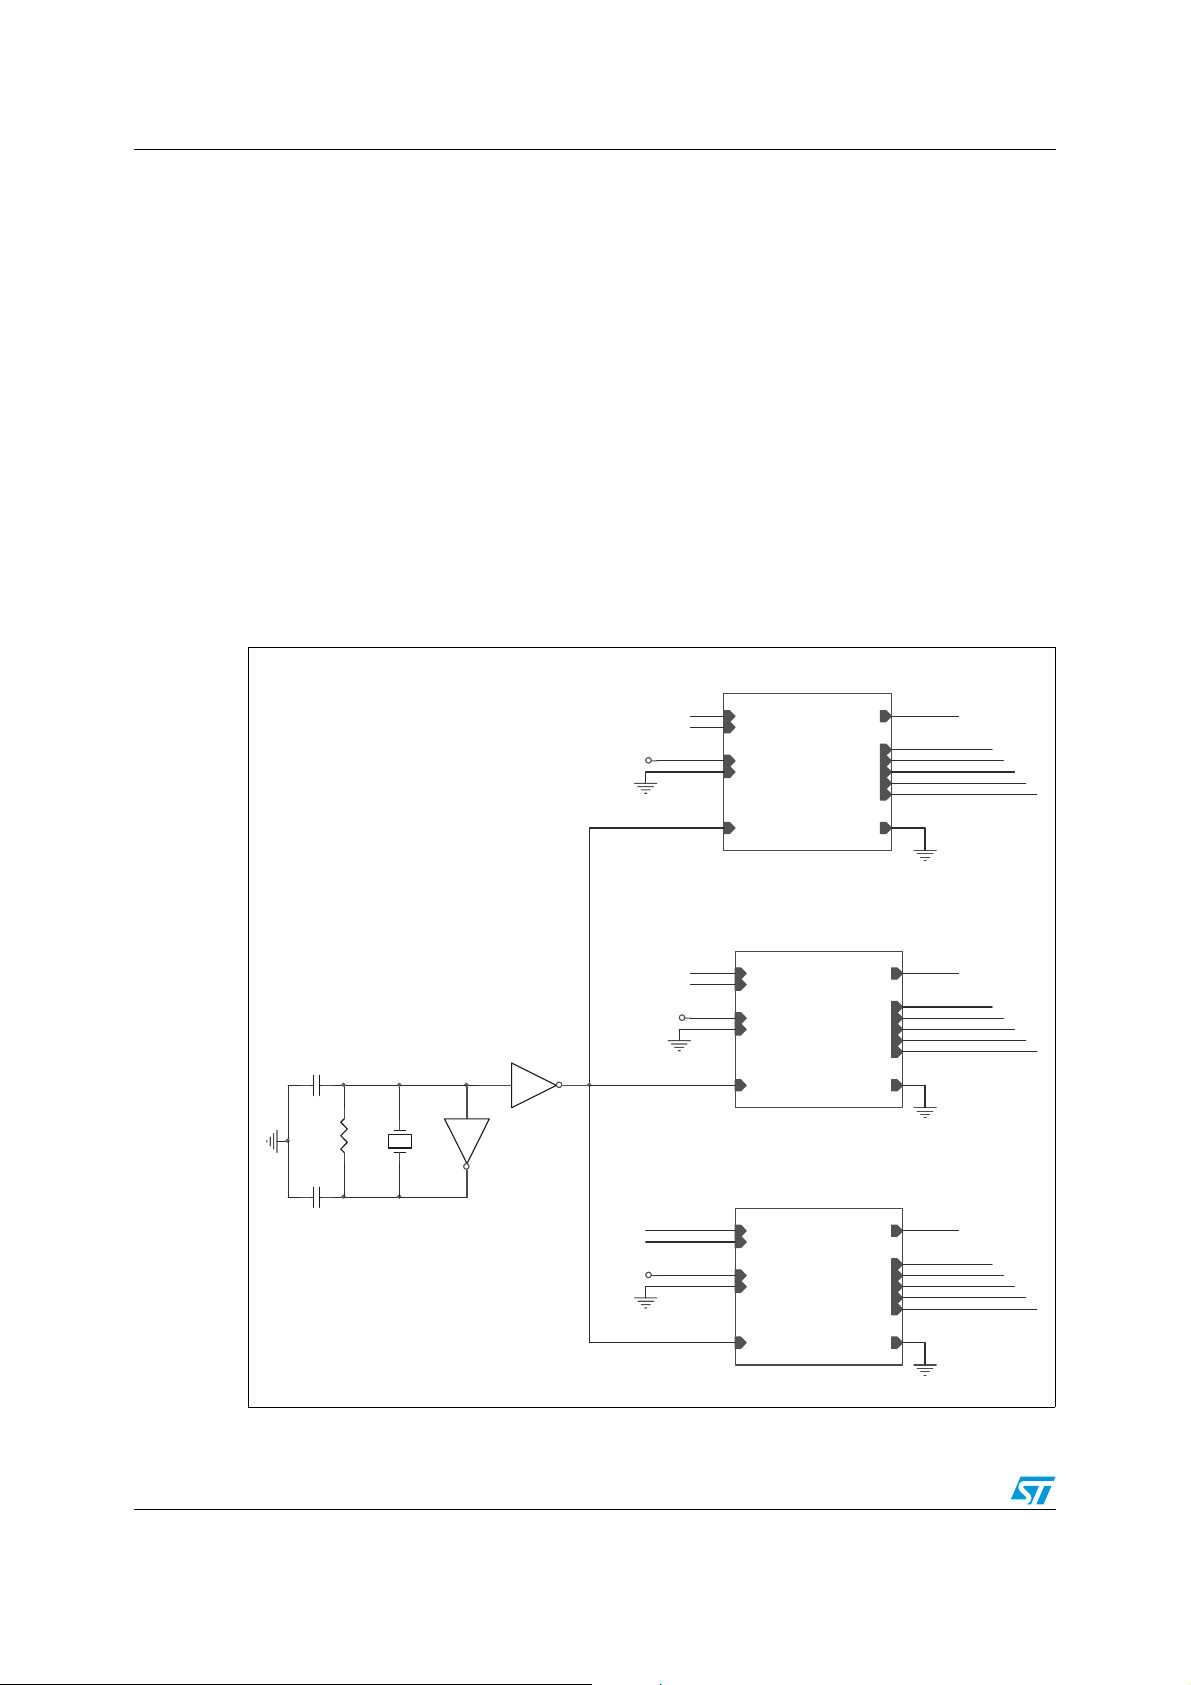
1.5 Clock management network
4.194 MHz quartz is used to supply the clock to the three STPM01 devices. Figure 4 shows
the schematic of the enhanced clock network which prevents EMI influences.
A discrete inverter network is used to change the impedance of the common node of the
three blocks. The output of the inverter prevents the second order antenna effect of the
node.
The CLKOUT pins are grounded to guarantee the current loop.
To select the measurement frequency range, MDIV must be set to 0 in the configuration
register of STPM01. If an 8 MHz quartz is used, this bit must be changed to 1.
Figure 4. Clock management network schematic
PHASE_1
VDD
CLKI N
P1
P
N
N
VDD
GND
CLKI N CLKOUT
PHASE
VOTP
SDA
SCS
SCL
LED
SYN
VOTPL1
SDA
SCSL1
SCL
LEDL1
SYN
U8A
34
74HC14A/SO
1 2
U8B
74HC14A/ SO
C1
15pF
C2
15pF
4.194304MHz
R1
1M
Y1
10/38
VDD
PHASE_2
P2 VOTPL2
N
VDD
P3
N
P
N
VDD
GND
CLKI N CLKOUT
PHASE
PHASE_3
P
N
VDD
GND
CLKI N CLKOUT
PHASE
VOTP
SDA
SCS
SCL
LED
SYN
VOTP
SDA
SCS
SCL
LED
SYN
SDA
SCSL2
SCL
LEDL2
SYN
VOTPL3
SDA
SCSL3
SCL
LEDL3
SYN
Page 11
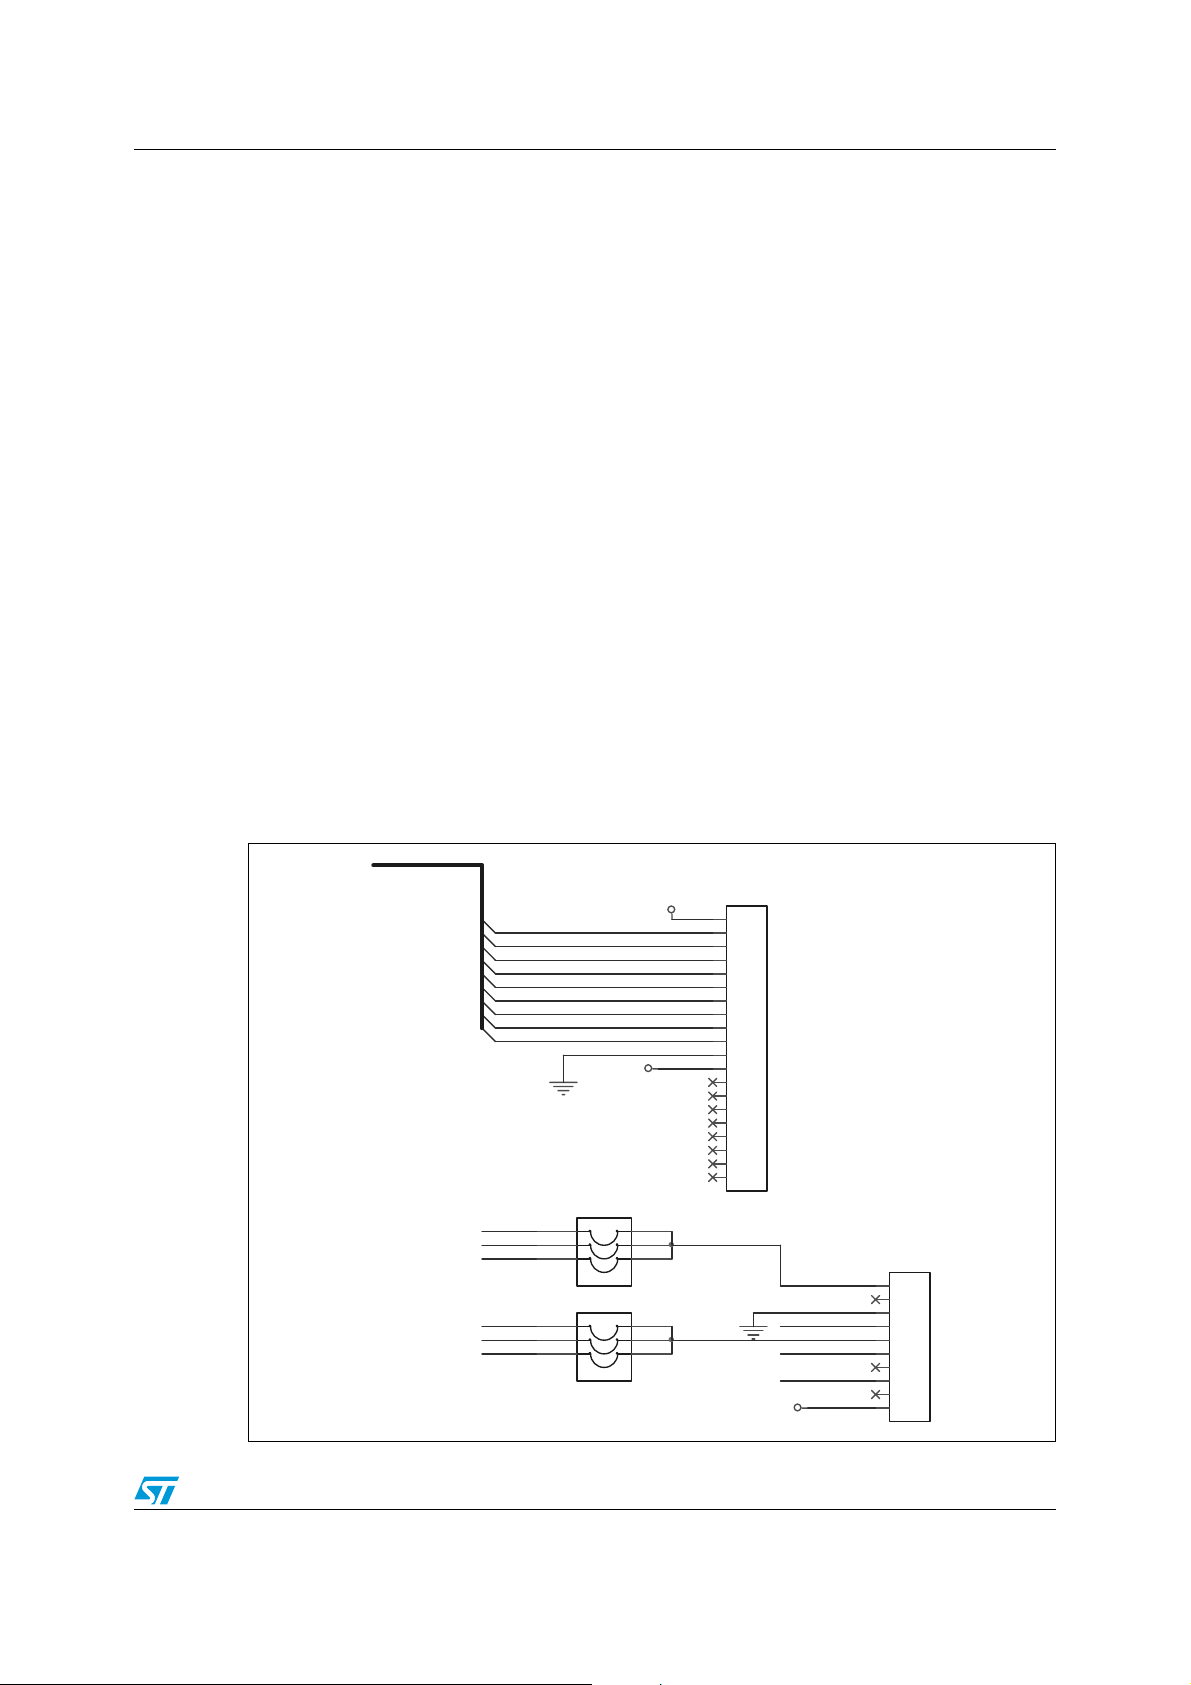
AN2512 Communication with microprocessor
2 Communication with microprocessor
A control board with embedded microprocessor should be connected to connector J2 of
module using 20-wire flat cable. Ta bl e 2 below describes the pin-out of the connector.
Each STPM01 has an SPI communication port implemented by four multi-purpose pins.
Through the J2 connector, the control board can read data records or it can access the
mode or configuration signals of each metering device by means of dedicated protocol.
Each pin can draw up to 4 mA at +3.0 V from the control module. The selection of the device
to be read is done acting on one of the three SCSLx (STPM01 device select) pins.
By default, the STPM01 is configured in peripheral mode by setting configuration bits
APL = 0.
This implies also the following output settings:
● watchdog reset signal on MON pin;
● zero-crossing (ZCR) on MOP pin;
● a pulse train with frequency proportional to the power consumption on LED pin.
To display the information on the power consumption, it is either possible to feed three
LEDs, each one showing the information on one phase, from the LED pins of the three
measurement devices, or the control board can generate an LED signal to show the global
power consumption by reading and manipulating energy information from the three STPM01
registers. In this case, the control board may also recalibrate any result read from the
module through appropriate software.
Figure 5. Connectors schematic
SCL
SDA
SYN
SCSL1
SCSL2
SCSL3
LEDL1
LEDL2
LEDL3
VOTPL1
VOTPL2
VOTPL3
SCSL1
SCSL2
SCSL3
VDD
J14
1 2
3 4
5 6
JUMPER3
J13
1 2
3 4
5 6
SCSJUMPER
5V
J2
1
2
3
4
5
6
7
8
9
10
11
12
13
14
15
16
17
18
19
20
CON20
VDD
VOTP
SDA
SCS
SCL
SYN
J1
1
2
3
4
5
6
7
8
9
10
11/38
Page 12

Communication with microprocessor AN2512
Table 2. J2 connector pin description
Pin No. Pin name Functional description
1. 5 V
2. SCL SPI Interface Pin
3. SDA SPI Interface Data Pin
4. SYN SPI Interface Pin
5. SCSL1 Phase n.1 SPI enable signal
6. SCSL2 Phase n.2 SPI enable signal
7. SCSL3 Phase n.3 SPI enable signal
8. LEDL1 LED output of Phase n.1
9. LEDL2 LED output of Phase n.2
10. LEDL3 LED output of Phase n.3
11. GND Signal reference level 0 V and power supply return
12. VDD
13. --- NC
14. --- NC
15. --- NC
16. --- NC
17. --- NC
18. --- NC
Up to 25 mA can be drawn from this pin
Up to 100 mA can be drawn from this pin
Power out of +5.0 V
Power out of +3.3 V
19. --- NC
20. --- NC
A host system can communicate with each measurement module (actually, with the
STPM01) using SPI interface, through connector J2. The STPM01 always acts as an SPI
slave while the host system acts as an SPI master. An application control board or an
external system can be considered as host.
Connector J1 is used in the evaluation phase to connect the measurement module to a PC
through the STPM01 parallel Programmer/Reader hardware interface.
This allows the user to set temporarily or permanently the internal STPM01 registers using a
dedicated GUI. Jumpers J13 and J14 select which of the three devices will be accessed.
The VOTP pin on the connector J1 is used when a host wants to permanently write some
configuration bits in the metering device. In this case, a +15 V power level must be present
on the VOTP. This level must be delivered from the host itself because the module does not
have an on-board charge pump.
Ta bl e 3 shows the pin description of the connector J1.
12/38
Page 13

AN2512 Power calculation algorithm
Table 3. J1 connector pin description
Pin no. Pin name Functional description
1. VOTP
2. --- NC
3. GND Signal reference level 0V and power supply return
4. SDA SPI Interface Data Signal
5. SCS SPI Enable Signal
6. SCL SPI Interface Clock Signal
7. --- NC
8. SYN SPI Interface Signal
9. --- NC
10. VDD
Power supply Input of +15.0 V during permanent write to OTP
Up to 100 mA can be drawn from this pin
3 Power calculation algorithm
3.1 STPM01 SPI Interface
The STPM01 SPI interface supports a simple serial protocol, which is implemented in order
to enable communication between a host system (microcontroller or PC) and the device.
Three tasks can be performed with this interface:
● Remote resetting the device
● Reading data records
● Writing the Mode bits and the configuration bits (temporarily or permanently).
cells
Power Out of +3.3 V
Four pins of the device are dedicated to this purpose: SCS, SYN, SCL, and SDA. SCS, SYN
and SCL are all input pins while SDA can be input or output according to whether the SPI is
in write or read mode.
The condition under which SCS, SYN and SCL inputs are set to high level determines the
idle state of the SPI interface and no data transfer occurs.
● SCS: enables SPI operation when low. The microcontroller uses this pin to multiplex
the reading of the three devices.
● SYN: when SCS is low, the SYN pin status selects whether the SPI is in read (SYN=1)
or write mode (SYN=0). When SCS is high and SYN is also high, the results of the
input or output data are transferred to the transmission latches.
● SCL: is the clock pin of the SPI interface. This pin function is also controlled by the SCS
status. If SCS is low, SCL is the input of serial bit synchronization clock signal. When
SCS is high, SCL is also high determining the idle state of the SPI.
● SDA: is the Data pin. If SCS is low, the operation of SDA is dependent on the status of
SYN pin. If SYN is high, SDA is the output of serial bit data (read mode). If SYN is low,
SDA is the input of serial bit data signal (write mode). If SCS is high, SDA is idle.
13/38
Page 14

Power calculation algorithm AN2512
In this chapter the readings of data records will be treated in case of 3 phase usage of
STPM01, in particular we will refer to the flow chart in Figure 6.
Figure 6. Flow chart of phase reading
3.2 STPM01 Initialization (latching) and reading (shifting)
There are two phases of reading the STPM01 data called latching and shifting.
Latching is used to sample results into transmission latches by initiating an active pulse on
SYN while SCS is idle. The pulse length of SYN must be longer than 2 periods of the
measurement clock (that is, t
The latching phase has to be done at the same time for all the STPM01 devices keeping the
SCSLx lines in idle state in order to read the information coming from each phase at the
same moment.
Shifting starts when SCS becomes active (low). At the beginning of this phase, another,
much shorter pulse (t
- t4 = 30 ns) should be applied to SYN. An alternative way to read
5
shifted data is to extend the pulse on SYN into the second phase of reading (from t
Latching and shifting finish at the last rise of SYN (shown by the t
these readings are completed, the STPM01 is reset.
It is possible to read data, by applying 32 serial clocks per data record. Up to 8 data records
can be read this way from each device. Switching to another device is possible enabling the
corresponding SCS line. Note that, enabling multiple SCS lines corrupts the information
received causing parity error. So, in any case, two or more devices cannot be enabled at the
same time.
In order to maximize the reliability of the readings, each data structure can be read twice
and compared. This is possible just by restarting the shifting procedure, then applying the
clock signal on the SCL pin one more time, keeping the corresponding SCS pin in active
state (low).
- t1 more than 500 ns).
2
line in Figure 7). After
5
to t5).
1
14/38
Page 15

AN2512 Power calculation algorithm
Figure 7. Timing for data records reading in 3 phase system
● t
→ t2: Latching Phase. Interval value>2/f
1
●
t2 → t3: Data latched, SPI idle. Interval value>30 ns
● t
→ t4: Enable SPI for read operation. Interval value > 30 ns
3
● t
→ t5: Serial clock counter is reset. Interval value > 30 ns
4
● t
→ t6: SPI reset and enabled for read operation. Interval value > 30 ns
5
● t
: Internal data transferred to SDA
7
● t
: SDA data is stable and can be read
8
● t
: End of phase 1 reading, begin of Phase 2 reading
9
● t
● t
: End of phase 2 reading, begin of Phase 3 reading
10
: End of phase 3 reading, stop of STPM01 shifting
11
CLK
3.3 Data record structure
Every data record is 4 bytes long. The 1st readout byte of data record is the Least
Significant Byte (LSB). Each byte can be further divided into a most and least significant
nibble (msn, lsn). The msn of the 4th byte of data value holds the parity code rather than
useful data. In fact, every data record consists of 4-bit parity code and 28-bit data value
where the parity code is computed from the data value which makes total of 32 bits or 4
bytes.
The Figure 8 below shows top down how bytes of data record are output from the SDA and
how they should be re-organized by the host to retrieve useful information.
15/38
Page 16

Power calculation algorithm AN2512
Figure 8. Data records reconstruction
8 bit SPI reading order
1stbyte - LSB
msb lsb
7 07 0 7 07 0
parity nibble 28 bit data
7 07 0 7 07 0
4thbyte - MSB
parity nibble
msb lsb
7 07 015 815 823 1623 1600 2424
32 bits register assembling
The data records have a fixed position of reading and no addressing of records is needed. It
is up to the host to decide how many records should be read out from the device.
Figure 9 shows the records position within the default sequence of reading, their name and
information contained.
Figure 9. STPM01 data register structure
16/38
Page 17

AN2512 Power calculation algorithm
3.4 Data integrity checks
Each bit of parity nibble is defined as odd parity of all seven corresponding bits of data
nibbles. In order to check the data record integrity, the application might execute the
following C code, given as an example:
int BadParity (unsigned char *bp)
{
register unsigned char prty; /* temporary register */
prty = *bp, /* take the 1st byte of data */
prty ^= *(bp+1), /* XOR it with the 2nd byte*/
prty ^= *(bp+2), /*and with the 3rd byte */
prty ^= *(bp+3), /*and with the 4th byte */
prty ^= prty<<4, prty &= 0xF0; /* combine and remove the lower nibble */
return (prty != 0xF0); /*returns 1, if bad parity */
}
if (BadParity(dap) || BadParity(drp) || /* DAP and DRP. data record*/
BadParity(dsp) || BadParity(dfp) || /* DSP and DFP data record */
BadPari
BadParity(cfl) || BadParity(cfh)) /* CFL and CFH data record */
/* code for repeat of reading sequence should be entered here */ ;
ty(dev) || BadParity(dmv) || /* DEV and DMV data record */
If the parity nibble check fails, the reading task should be repeated but, this time, without
request of latching, otherwise a new data is latched and the previous reading is incorrectly
lost. In a very harsh EMI environment, it would be good practice to read the data records
twice and then compare both readings. This way the probability of detecting bad readings is
significantly improved. A single bad data reading can be discarded because no meaningful
information is lost as long the reading frequency is about 30 ms.
3.5 Unpacking of data records
After each data record is read correctly, its parity nibble and possible padding bits should be
masked out and then it should be unpacked to retrieve each information as indicated in
Figure 9. The momentary values of current and voltage should be considered as signed
integers, while all the other values as unsigned integers.
Below an example of readings and unpacking of the data is given (MSBF is cleared, that is,
the device reads most significant bit first).
● DAP 65 7A 7C 82: parity = 8, type0 energy=27C7A, status = 65
● DRP 52 7A 0C 90: parity = 9, reactive energy=00C7A, frequency high byte = 52
● DSP 25 00 8C E2: parity = E, apparent energy=28C00, frequency low byte = 25
17/38
Page 18

Power calculation algorithm AN2512
● DFP 00 06 6E 22: parity = 2, type1 energy = 26E06, mode signals = 00
● DEV BB B3 07 DD: parity = D, i
● DMV 3F AF AA CA: parity = C, i
● CFL 01 00 00 E0: parity = E, configuration bits low part = 0000001
● CFH 00 00 00 F0: parity = F, configuration bits high part = 0000000
= 1B3BB, u
RMS
= AF3F, u
MOM
RMS
MOM
= 638
= AAA
The metering device computes wide-band active energy which is type0 by default and
fundamental harmonic active energy which is type1 by default. The configuration bit FUND
can be used to select which becomes type0 or type1, by default FUND = 0.
Ta bl e 4 shows the meaning of "status" byte in the DAP data record.
Table 4. STPM01 status bit description
Bit no. Bit name
0. BIL
Functional
description
No load
condition
Condition
BIL = 0: No load condition not detected
BIL = 1: No load detected
1. BCF Σ∆ Signal status BCF= 0: Σ∆ signals alive
BCF= 1: one or both Σ∆ signals are stacked
2. BFR
Line frequency
range
BFR = 0: Line frequency inside the 45 Hz-65 Hz range
BFR = 1: Line frequency out of range
3. BIT
Tamper
condition
BIT = 0: Tamper not detected
BIT = 1: Tamper detected
4. MUX
Current channel
selection
MUX = 0: Primary current channels selected by the tamper
module
MUX = 1: Secondary current channels selected by the
tamper module
5. LIN
Trend of the line
voltage
LIN = 0: line voltage is going from the minimum to the
maximum value (∆v/∆t >0)
LIN = 1: line voltage is going from the maximum to the
minimum value (∆v/∆t < 0)
6. PIN
Output pin
check
PIN = 0: the output pins are consistent with the data
PIN = 1: the output pins are different with the data, this
means some output pin is forced to 1 or 0
7. HLT Data validity HLT = 0: the data records reading are valid
HLT = 1: the data records are not valid. A reset occurred and
Normally, a host reads the DAP data record first but, if a "Precharge" command is sent to the
module before the beginning of the reading task, the DEV data record is read first. This way,
faster reading of RMS and momentary values is possible.
18/38
a restart is in progress.
Page 19

AN2512 Power calculation algorithm
3.6 Processing of phase energy values
Within each STPM01 metering device the sources of energy values are implemented as 20bit up/down counters. The value of such counters eventually rolls over if the direction of
power is not changing too often, which is normally the case. For example, if the maximal
possible positive power (360 V * 33 A = 12 kW) is measured by one of the phases, the
internal counter would count up and reach its maximal value (0xFFFFF) in about 1.2
seconds then the value rolls over to zero (0x00000) at once and starts to count up again. A
sawtooth shape of values is produced, see Figure 10. For the negative power, the counter
counts down, showing the same behavior. The slope of the shape is proportional to
measured power which may change its value and direction at any moment. Also, if power is
absolutely less than No-Load Condition limit, selected by LTCH, the counter stops. For the
calculation of the value of the least significant bit of counters, please refer to the STPM01
datasheet.
An application should recognize rollovers. A rollover from high to low should be recognized.
If the msn of the energy value of two consecutive readings changes from 0xF to 0x0 or, if
change from 0x0 to 0xF is detected, a low to high rollover is recognized. To ensure detection
of change, an application should successfully read the energy values at least every 0.1
second but, for security reasons, at least 30 readings per second should be performed.
Figure 10. Typical profile of output of an energy integrator
Using an msn of energy value as a rollover code is convenient because it is stored in the
MSB of data record accompanied with the parity code. Therefore it is easily unpacked and
checked for the characteristic values. When rollover is detected, a 0x00100000 should be
added to the energy reading with rollover code 0x0.
To compute a single phase energy it is recommended to use the following procedure.
The software should implement a 32-bit integrator. The integrator is divided into two stages:
● frac 32-bit signed integer variable;
● integ 32-bit signed integer variable.
The other variables to be used are:
● old 32-bit signed integer variable;
● new 32-bit signed integer variable;
● quot 16-bit unsigned integer variable;
● quant 16-bit signed integer variable.
Each time the host receives a new reading, the 20-bit energy value is stored in the new
variable, and the difference between the new and old energy values is stored in the quant
variable. The value of frac is derived by adding to itself the quant value. Before the next
19/38
Page 20

Power calculation algorithm AN2512
reading, the old variable should be updated with the new value for the next quant
computation.
When frac collects a preset amount of energy (that is, 10 Wh, absolute, with the
corresponding integer value stored as a threshold variable), the integ value should be
changed by 1 bit and the frac value changed according to the threshold value. The preset
threshold value must be set according to the value of the least significant bit of the internal
energy counter (for more detail, please refer to the STPM01 datasheet).
If the time difference of two consecutive readings is known, an applied power can be
computed easily as: p = quant/∆t.
This procedure should be repeated for each energy type (active, reactive, apparent and
fundamental active).
If an LED output from MCU is required, the resolution of the energy count must be increased
by dividing the value of quant by 16 and adding it in 16 times to frac. A reminder of such
division can be added to the frac value immediately, while the quotient quot (quant/16) can
be added later 16 times but faster. A timer interrupt service routine is the best place to
implement these calls. This way, output pulse generation of signal LEDs, which is used for
meter accuracy check, with 2 ms resolution is possible (given that 2 consecutive readings
occur every 32 ms).
This calculation should be done for each type of energy (Active wide band, Reactive,
Apparent and active fundamental). For more details on single phase energy calculation,
please refer to AN2159 "SPI Communication for comprehensive energy reading of the
STPM01".
3.7 Three-phase energy calculation
The above procedure refers to one of the phases of a three-phase meter.
To calculate the global amount of energy in a three-phase system, it is necessary to define
an array of the above variables structure, where the number of elements is four, one for each
phase energy and one for the total energy, which is given by the sum of the three-phase
energies.
In Appendix A an example of the definition of the variables used in a practical application is
shown.
3.8 Pulse generation
From the first stage of integration of total active energy counter (referred to as frac), and
according to the number of pulses per kWh desired as output, a pulse train is generated to
feed an LED.
Three more LEDs are fed from the LED pins of STPM01 devices to display power
consumption of the respective phase.
20/38
Page 21

AN2512 Layout rules
4 Layout rules
Noise rejection is the main issue to work on when a three-phase multi-chip approach has
been chosen. In this case layout plays a crucial role.
Here some rules to follow in layout phase:
● Components positioning
The components of measuring section (STPM01, Current Transformers, passive
components) are placed using the same layout for each phase. The phases are placed in a
symmetrical scheme. In this way reduction of the cross talking can be achieved.
The Current transformer is placed very close to the correspondent STPM01 to minimize the
captured noise.
● Components routing
The passive components belonging to the analogue input channels must be placed between
the sensor and the STPM01 always respecting a symmetrical scheme.
Particular care should be given for the voltage channel path because the voltage inputs are
normally relatively further from the corresponding STPM01.
● Quartz
The crystal network has been placed in the middle of the board ensuring a completely
symmetrical path between the devices. A copper plate has been used under the Crystal
both on the TOP and on the BOTTOM side of PCB.
● Copper plate
The copper plate area should be extended under the entire digital section and under the
crystal oscillator which provides the clock for the three STPM01.
21/38
Page 22

Experimental results AN2512
5 Experimental results
The tests have been conducted considering In =10 A, Vn = 220 V, f = 52 Hz, where In is the
nominal current and Vn is the nominal voltage.
5.1 Phase one results
Table 5. Experimental results of phase n.1 tests
I (A) e%min e%av e%max PF 0,5C PF 0,5L Stmin Stmax
0,05 -1,841 -1,257 -0,724
0,1 -0,259 -0,119 0,123 -1 1
0,25 0,277 0,282 0,336 -1 1
0,5 0,114 0,152 0,177 -0,5 0,5
5 0,038 0,047 0,052 0,04 0,03 -0,5 0,5
10 0,032 0,036 0,041 -0,5 0,5
20 0,016 0,019 0,022 -0,5 0,5
30 0,045 -0,5 0,5
45 0,06 -0,5 0,5
Figure 11. Graph of experimental results of phase n.1 tests
1,5
1
0,5
0
p[%]
-0,5
-1,5
0,05 0,1 0,25 0,5 5 10 20 30 45
-1
I[A]
22/38
Page 23

AN2512 Experimental results
5.2 Phase two results
Table 6. Experimental results of phase n.2 tests
I (A) e%min e%av e%max PF 0,5C PF 0,5L Stmin Stmax
0,05 -1,841 -1,257 -0,724
0,1 -0,259 -0,119 0,123 -1 1
0,25 0,277 0,282 0,336 -1 1
0,5 0,114 0,152 0,177 -0,5 0,5
5 0,038 0,047 0,052 0,04 0,03 -0,5 0,5
10 0,032 0,036 0,041 -0,5 0,5
20 0,016 0,019 0,022 -0,5 0,5
30 0,045 -0,5 0,5
45 0,06 -0,5 0,5
Figure 12. Graph of experimental results of phase n.2 tests
1,5
1
0,5
0
p[%]
-0,5
-1,5
0,05 0,1 0,25 0,5 5 10 20 30 45
-1
5.3 Phase three results
Table 7. Experimental results of phase n.3 tests
I (A) e%min e%av e%max PF 0,5C PF 0,5L Stmin Stmax
0,05 2,14
0,1 -0,45 -1 1
0,25 -0,04 -1 1
0,5 0,09 -0,5 0,5
5 0 0,03 0,04 -0,5 0,5
I[A]
10 -0,5 0,5
20 -0,5 0,5
23/38
Page 24

Experimental results AN2512
Table 7. Experimental results of phase n.3 tests (continued)
I (A) e%min e%av e%max PF 0,5C PF 0,5L Stmin Stmax
30 -0,5 0,5
45 -0,5 0,5
Figure 13. Graph of experimental results of phase n.3 tests
5.4 Voltage and frequency influence on phase three
Table 8. Voltage influence on phase n.3
I = 0,1 A f = 52 Hz
Ve%Stmin
240 -0,22 -0,65
220 -0,45 -0,65
180 -0,47 -0,65
120 -0,58 -0,65
Table 9. Frequency influence on phase n.3
I = 5 A V = 220 V
fe%Stmin
45 -0,41 -0,4
52 0 -0,4
65 -0,41 -0,4
I = 5 A V = 220 V
24/38
Page 25

AN2512 Three-phase systems
Figure 14. Graph of voltage and frequency influence on phase n.3
0,1
-0,1
-0,3
p[%]
-0,5
-0,7
0,1
-0,1
p[%]
-0,3
-0,5
240 220 180 120
45 52 65
Appendix A Three-phase systems
Three-phase is a common method of electric power transmission. It is a type of polyphase
system used to power motors and many other devices.
I[A]
I[A]
The currents are sinusoidal functions of time, all at the same frequency but with different
phases. In a three-phase system the phases are spaced equally, giving a phase separation
of 120°. The frequency is typically 50 Hz in Europe and 60 Hz in the US and Canada.
Figure 15. Instantaneous voltage (or current) in one voltage cycle of a three-phase
system
The three phases could be supplied over six wires, with two wires reserved for the exclusive
use of each phase. However, they are generally supplied over three or four wires:
● Three phases, 3-Wire DELTA service which has no neutral and 220 V between phases
25/38
Page 26

Three-phase systems AN2512
● Three phases, 4-Wires DELTA and WYE service which has 220 V between phase-
neutral and 380 V phase-phase.
A.1 Power in three-phase AC circuits
Let's assume that the angle between the phase voltage and the phase current is θ, which is
equal to the angle of the load impedance. Considering the load configurations given in
Figure 16, the phase power and the total power can be estimated easily.
Figure 16. Per-phase powers in (a) delta-connected load and (b) wye-connected load
(a)
(b)
In the case of Figure 16 (a), the total active power is equal to three times the power of one
phase:
Equation 1
P1P2P3PV
•θcos•====
lineIphase
Equation 2
P
Total
3P 3V
•θcos•==
lineIphase
Since the line current in the balanced delta-connected loads is:
Equation 3
I
line
3I
•=
phase
If this equation is substituted into Equation 2, the total active load becomes:
Equation 4
P
Total
In Figure 16 (b), however, the impedances contain the line currents I
current, I
) and the phase voltages.
phase
3V
• I
line
•θcos•=
line
(equal to the phase
line
Equation 5
V
V
phase
line
------------=
3
26/38
Page 27

AN2512 Three-phase systems
Therefore, the phase active power and the total active power are:
Equation 6
P1P2P3PV
•θcos•====
phaseIline
Equation 7
P
Total
3P 3V
phaseIline
θcos••==
If the relationship between the phase voltage and the line voltage is used, the total active
power becomes identical to the Equation 4 developed. This means that the total power in
any balanced three-phase load (∆- or Y-connected) is given by Equation 4. Similarly, the
total reactive and the total apparent power in the three-phase balanced ac circuits can be
given by:
Equation 8
Q
Total
3V
lineIline
θsin••=
Equation 9
S
Total
3V
lineIline
•=
A.2 Power measurement techniques
In the three-phase power systems, one, two, or three wattmeters can be used to measure
the total power. A wattmeter may be considered to be a voltmeter and an ammeter
combined in the same box, which has a deflection proportional to V
the angle between the voltage and current. A wattmeter has two voltage and two current
terminals, which have + or - polarity signs. Three power measurement methods utilizing the
wattmeters are described next, and are applied to the balanced three-phase ac load.
A.2.1 Two-Wattmeter method
This method can be used in a three-phase three-wire balanced or unbalanced load system
that may be connected ∆ or Y. To perform the measurement, two wattmeters are connected
as shown in Figure 17.
Figure 17. Two-wattmeter method in star- or delta-connected load
cosθ, where θ is
rmsIrms
27/38
Page 28

Three-phase systems AN2512
In the balanced loads, the sum of the two wattmeter readings gives the total power. This can
be proven in a star-connected load mathematically using the power reading of each meter
as:
Equation 10
P1V12I1• 30°θ–()cos• V
• 30°θ–()cos•==
lineIline
Equation 11
P
2V32I3
• 30°θ–()cos• V
• 30°θ–()cos•==
lineIline
Equation 12
P
TotalP1P2
3V
lineIline
θcos••=+=
If the difference of the readings is computed,
Equation 13
P2P1– V
• 30°θ–()cos• V
lineIline
• 30°θ–()V
lineIline
•θsin=cos•–=
lineIline
which is 1/√3 times the total three-phase reactive power. This means that the two-wattmeter
method can also indicate the total reactive power in the three-phase loads and also the
power factor.
A.3 Three-Wattmeter method
This method is used in a three-phase four-wire balanced or unbalanced load. The
connections are made with one meter in each line as shown in Figure 18. In this
configuration, the total active power supplied to the load is equal to the sum of the three
wattmeter readings.
Equation 14
Figure 18. The wattmeter connections in the three-phase four-wire loads
P
Total
P1P2– P3–=
28/38
Page 29

AN2512 Example of source code
A.4 One-Wattmeter method
This method is suitable only in three-phase four-wire balanced loads. The connection of the
wattmeter is similar to the drawing given in Figure 18. The total power is equal to three times
the reading of only one wattmeter that is connected between one phase and the neutral.
Appendix B Example of source code
The C code below shows an example of handling energy value (either active type 0, type1,
reactive or apparent) after it has been read, unpacked and stored into register new. For
signed wide-band Active energy as an example, a pointer named e should be loaded with
&ActWB then, EnergyQuant() should be called. This function checks for rollover and
computes a quant of energy. Later, EnergyUpdate() is called. This function updates the
fractional part of integrator first (frac). If the fractional part reaches a certain limit, it is
subtracted from the fractional part and the integer part (integ) of integrator increments. The
value of the limit and the direction of subtraction and increment depends on the sign of
quant.
Some applications may have positive and negative energy integrators or quadrant
integrators for Apparent energy. All this influences an implementation of both functions. With
a proper limit value for the fractional part, one can prescribe a suitable bit weight of the
integer part of the integrator.
For example if the limit is set to 0x00140000 (with a device calibrated to provide 128000
pulses/kWh) then the lsb of the integer part represents exactly 0.01 kWh.
Below is an example of source code.
/* definition of STPM01 registers structure */
typedef struct STPM {
long int DAP[3];
long int DRP[3];
long int DSP[3];
long int DFP[3];
long int DEV[3];
long int DMV[3];
long int CFL[3];
long int CFH[3];
} STPM_Struct;
/* definition of energy integrator structure */
typedef struct energ {
long int old[4]; /* previous energy value */
int quot[4]; /* quant/16 */
int quant[4]; /* new - old, measure of power */
29/38
Page 30

Example of source code AN2512
long int frac[4]; /* fraction part of energy integrator */
long int integ[4]; /* integer part of energy integrator */
} ENERG;
/* definition of variables for internal registers values */
char status[3];
char mode[3];
int freq[3];
int uRMS[3];
int iRMS[3];
int uMOM[3];
int iMOM[3];
long int active0[4];
long int active1[4];
long int reactive[4];
long int apparent[4];
/* allocation for all types of energies */
long int new; /* energy value to be handled */
ENERG *e; /* -> energy integrator */
ENERG Ac
ENERG Reactive; /* Reactive energy */
ENERG ActFund; /* Active fundamental energy */
ENERG Apparent; /* Apparent energy */
/* definition of constant */
#define ELIMIT 0x140000 /* produces 0.01 kWh resolution in case of 128000 pulses per
kWh */
/*----------------------------------------------------------------------------------
ROUTINE NAME : EnergyQuant
INPUT/OUTPUT : None/None
DESCRIPTION : Energy quant computing function (version for signed energy
integration). Checks for rollovers and compute quant as difference between new and
old value. Returns a negative sign of quant.
----------------------------------------------------------------------------------*/
tWB; /* Active wide band energy */
int EnergyQuant(Long int *new)
{
long int NewTemp;
char i,Temp;
30/38
Page 31

AN2512 Example of source code
if (ReadSTPM01Falg == 0){
for (i = 0; i < 3; i ++){
NewTemp = * new;
e->old[i] = NewTemp;// save the value for the first time reading
new ++; //next data
}
e->quot[0] = 0;
e->quot[1] = 0;
e->quot[2] = 0;
}
else{
e->quant[3] = 0;
for (i = 0; i <3; i++ ){
NewTemp = *new; // Rollover high to low occurs when MSB goes from F to 0
if (NewTemp >= e->old[i]){
if ((NewTemp - e->old[i]) >= 0x80000){ //roll over, negative energy
e->quant[i] = 0x100000 + e->old[i] -NewTemp;
e->quant[3] -= e->quant[i];//total ernergy minus the negative energy
}
else{
e->quant[i] = NewTemp - e->old[i]; //positive energy
e->quant[3] += e->quant[i]; //add the positive energy to the total energy
}
}
els
e{
if ((e->old[i] - NewTemp) >= 0x80000) { //roll over, positive energy
e->quant[i] = 0x100000 + NewTemp - e->old[i];
e->quant[3] += e->quant[i]; //total ernergy plus the positive energy
}
else{
e->quant[i] = e->old[i] - NewTemp; //negative energy
e->quant[3] -= e->quant[i]; //total energy minus the negative energy
}
}
e->old[i] = NewTemp;// save the value for next time
new ++; //next data
}
}
31/38
Page 32

Example of source code AN2512
if (e->quant[3] > 0xf0000000) //for test purpose
e->quant[3] = 0;
e->quot[3] = e->quant[3] >> 4;
Temp = e->quant[3] & 0x0f;//save the residue
e->frac[3] += Temp;
Accuracy_Error_Count ++;
if (Accuracy_Error_Count == 3){
Accuracy_Error_Count = 0;
if (e->quant[0] >= 2)
e->quant[0] -= 2;
}
led_frac += e->quant[0] & 0x0f;
e->quot[2] = e->quot[1];
e->quot[1] = e->quot[0];
e->quot[0] = e->quant[0] >> 4;
}
/*--------------------------------------------------------------------------------
ROUTINE NAME : EnergyUpdate
INPUT/OUTPUT : None/None
DESCRIPTION : Energy update function (version for signed energy integration)If quant
is negative, subtract o
frac reaches ELIMIT
---------------------------------------------------------------------------------*/
int EnergyUpdate(void)
{
PM_u8 i;
e = &ActWB; // active WB energy calculation
for (i = 0; i < 3; i++){
e->frac[i] += (Long int)e->quot[i];// add quot to frac
if (e->quant[i] < 0){ // is quant negative?
if (e->frac[i] > (-ELIMIT))
return(0); // yes, is within the limit?
else {
e->frac[i] += ELIMIT;
(e->integ[i])--; // no, subtract it and increment
therwise add its value from the integrator. Returns true when
32/38
Page 33

AN2512 Example of source code
}
}
else {
if (e->frac[i] < ELIMIT)
return(0); // no, is within the limit?
else {
e->frac[i] -= ELIMIT;
(e->integ[i])++; // no, subtract it and increment
}
}
}
e->frac[3] += (long int)e->quot[3]; // add quot to frac
led_frac += (Long int)e->quot[0];
if (led_frac >= MeterConstant) { //MeterConstant = 0x1f400 //128000 0x4000)
GPIO0->PD ^= 0x1000; //GPIO0.12 Active engergy output
led_frac -= MeterConstant; //0x4000;
}
if (e->frac[3] >= ELIMIT) {
e->frac[3] -= ELIMIT;
(e->integ[3])++; // no, subtract it and increment
lTotal[0] ++;
}
/*caculat
return(1); // return limit has been reached
}
e the 3 phase total energy, and generate the output pulse*/
33/38
Page 34

BOM list AN2512
Appendix C BOM list
Table 10. BOM list
Index Qty Ref.
12 C1,C2
C3, C4, C6, C7, C13,
212
36
46
5 3 C11, C21, C31 4.7 µF No mounted
61 C34
71 C35
8 2 C36, C39
9 2 C37, C43
10 1 C38
11 1 C40
12 1 C41
13 1 C42
C14, C16, C17, C23,
C24, C26, C27
C5, C8, C15, C18,
C25, C28
C9, C12, C19, C22,
C29, C32
Value / generic part
number
SMT C0G ceramic
capacitor,15 pF 50 V
SMT X7R ceramic
capacitor,1000 pF 50 V
X7R SMT ceramic
capacitor, 1 µF 16 Vdc
SMT X7R ceramic
capacitor,10 nF 50 V
Rubycon aluminium
radial Lead Electrolytic
Capacitor ZL Series
56 mR 995 mA 20%
330 µF 25 V
Rubycon aluminium
radial Lead Electrolytic
Capacitor ZA Series
270 mR 350 mA 20%
22UF 16 V
SMD ceramic capacitor
220 nF 630 V 20%
220NF 630 V
SMT X7R ceramic
capacitor,100 nF 50 V
Radyal Electrolytic
capacitor 2.2 µF 400 V
Radyal Electrolytic
capacitor 1000 µF 25 V
Radyal Electrolytic
capacitor 10 µF 50 V
Y1 suppression ceramic
cap, 2.2 nF 250 Vac
Package
0805
0805
0805
0805
2220 TDK
0805
Diameter:
10 mm Lead
s pa c i ng :
5 mm
Diameter:
13 mm Lead
s pa c i ng :
5 mm
Diameter:4
mm Lead
spacing:
2.5 mm
Manufacture’s
ordering code/
orderable part
number
Supplier Sup-
plier’s
order-
ing code
Rubycon
Rubycon
CERAMITE RS 214-5903
34/38
Page 35

AN2512 BOM list
Table 10. BOM list (continued)
Index Qty Ref.
14 1 C44
15 3 D1,D3,D5
16 4 D2,D4,D6,D14
17 2 D7,D12
18 1 D8
19 1 D9
20 2 D11,D13
21 1 J1
22 1 J2
23 7
24 2 J13, J14
25 3 L1,L2,L3
26 1 L4
27 1 L5
28 1 NTC1
29 1 Q1
J5,J7,J8,J9,J10,J11,
J12
Value / generic part
number
SMT X7R ceramic
capacitor 47NF 50 V
SMD LED low current
superred
Small signal SMD diode
LL4148
SMT Diode Bridge
1000 V 1 A
Mini-Melf Zener diode
15 V 0.5 W 5%
Small Signal Schottky
Diode 80 V 0.5 A
TMBAT49
DO-41 Zener diode
180 V 2 W 5%
5 way 2 row header, 0.1
in pitch 7 mm pin (10 PIN
connector)
10 way 2 row header, 0.1
in pitch 7 mm pin (20
PIN connector)
1 way header, 7 mm pin
(1 PIN connector)
3 way 2 row header,
0.1in pitch 7 mm pin (6
PIN connector for
jumper)
Current transformer for
indirect connection
without dc-tolerance
CT 1:2000
Axial BC inductor,
1000 µH 130 mA
Signal-Use SMD
Inductor 10 µH 125 mA
NTC inrush current
suppressor, 50 R 2 A
N-CHANNEL 500 V -
2.8 Ω - 2.3 A Zener-
Protected
SuperMESH™Power
MOSFET
STD3NK50Z
Supplier Sup-
plier’s
order-
Package
Manufacture’s
ordering code/
orderable part
number
ing code
0805
P-LCC-2 OSRAM Distrelec 631039
1206
General
semiconductor
SMD Mini-
Melf 1206
MELF Glass STMicroelectronics
DO41
THT
THT
THT
THT
VAC
THT
THT axial Epcos RS 191-0712
0805 TDK
THT RS 210-673
DPAK STMicroelectronics
www.vacuumschm
elze.de
RS 269-344
35/38
Page 36

BOM list AN2512
Table 10. BOM list (continued)
Manufacture’s
Index Qty Ref.
Value / generic part
number
Package
ordering code/
orderable part
number
30 3 RV1,RV2,RV3 SO5K275/275 V Epcos
31 1 R1
32 3 R2,R18,R34
33 7
34 3 R6,R22,R38
35 3 R7,R23,R39
36 3 R9,R25,R41
37 3 R10,R26,R42
38 3 R13,R29,R45
39 6
40 3 R16,R32,R48
41 3 R17,R33,R49
42 1 R52
43 1 R53
44 2 R55,R57
45 1 R56
46 3 R58,R59,R60
47 4 R61,R62,R63,R64
R5,R8,R21,R24,R37,
R40,R54
R14,R15,R30,R31,R
46,R47
S MT c h ip r es is t or
1 MOhm 1% 0.125 W
SMT chip resistor,
750 Ohm 1% 0.125 W
S MT c h ip r es is t or
1 Kohm 1% 0.125 W
MMA 0204 Professional
MELF resistors 3.3 Ohm
1%
SMT chip resistor
150 KOhm 1% 0.125 W
MMA 0204 Professional
M EL F r es is to rs
2.2 MOhm 1%
SMT chip resi stor
2,2 Kohm 1% 0.125 W
S MT c h ip r e si s to r,
0 Ohm 0.125 W
MMA 0204 Professional
MELF resis to rs
270 KOhm 1% SMD
MMA 0204 Professional
MELF resis to rs
200 KOhm 1% SMD
MMA 0204 Professional
MELF resistors 470 Ohm
1% SMD
SMT chip re si st or
10 Ohm 1% 0.125 W
SMT chip resistor
220 Ohm 1%
0.125 W
SMT chip resi stor
4.7 KOhm 1% 0.125 W
SMT chip resi stor
5.6 Kohm 1% 0.125 W
SMT chip resistor
330 kOhm 5% 0.25 W
ROX1S metal oxide film
resistor 22 Ohm 1 W
0805
0805
0805
1206 Beyschlag
0805
1206 Beyschlag
0805
0805
1206 Beyschlag
1206 Beyschlag
1206 Beyschlag
0805
0805
0805
0805
1206
axial Neohm
Supplier Sup-
plier’s
order-
ing code
Distrelec 730096
Distrelec 713014
Distrelec 713154
Distrelec 713132
Distrelec 713129
Distrelec 713066
RS 214-0920
36/38
Page 37

AN2512 Revision history
Table 10. BOM list (continued)
Index Qty Ref.
48 1 T1
49 3 U1,U2,U3
50 1 U4
51 1 U5 Opto-isolator PC817 DIP6
52 1 U6
53 1 U7
54 1 U8
Value / generic part
number
E13 TIW Switch mode
transformer
Programmable single
phase energy metering
IC with tamper detection
STPM01FTR_TSSOP20
Very low drop voltage
regulators 3.3 V WITH
INHIBIT 300 mA 1%
L4931ABD33
Programmable shunt
voltage reference 1%
TS2431
Low power OFF-Line
SMPS Primary Switcher
VIPer12AS-E
HEX SCHMITT inverter
M74HC14
Package
TSSOP20 STMicroelectronics
SOT23-3 STMicroelectronics
Manufacture’s
ordering code/
orderable part
number
Pulse
THT
SO-8 STMicroelectronics
SO-8 STMicroelectronics
SOP STMicroelectronics
(www.pulseeng.
com)
Supplier Sup-
plier’s
order-
ing code
55 1 Y1 Crystal 4.194304 MHZ Auris
6 Revision history
Table 11. Revision history
Date Revision Changes
17-Apr-2007 1 First issue
Distrelec 335026
37/38
Page 38

AN2512
Please Read Carefully:
Information in this document is provided solely in connection with ST products. STMicroelectronics NV and its subsidiaries (“ST”) reserve the
right to make changes, corrections, modifications or improvements, to this document, and the products and services described herein at any
time, without notice.
All ST products are sold pursuant to ST’s terms and conditions of sale.
Purchasers are solely responsible for the choice, selection and use of the ST products and services described herein, and ST assumes no
liability whatsoever relating to the choice, selection or use of the ST products and services described herein.
No license, express or implied, by estoppel or otherwise, to any intellectual property rights is granted under this document. If any part of this
document refers to any third party products or services it shall not be deemed a license grant by ST for the use of such third party products
or services, or any intellectual property contained therein or considered as a warranty covering the use in any manner whatsoever of such
third party products or services or any intellectual property contained therein.
UNLESS OTHERWISE SET FORTH IN ST’S TERMS AND CONDITIONS OF SALE ST DISCLAIMS ANY EXPRESS OR IMPLIED
WARRANTY WITH RESPECT TO THE USE AND/OR SALE OF ST PRODUCTS INCLUDING WITHOUT LIMITATION IMPLIED
WARRANTIES OF MERCHANTABILITY, FITNESS FOR A PARTICULAR PURPOSE (AND THEIR EQUIVALENTS UNDER THE LAWS
OF ANY JURISDICTION), OR INFRINGEMENT OF ANY PATENT, COPYRIGHT OR OTHER INTELLECTUAL PROPERTY RIGHT.
UNLESS EXPRESSLY APPROVED IN WRITING BY AN AUTHORIZED ST REPRESENTATIVE, ST PRODUCTS ARE NOT
RECOMMENDED, AUTHORIZED OR WARRANTED FOR USE IN MILITARY, AIR CRAFT, SPACE, LIFE SAVING, OR LIFE SUSTAINING
APPLICATIONS, NOR IN PRODUCTS OR SYSTEMS WHERE FAILURE OR MALFUNCTION MAY RESULT IN PERSONAL INJURY,
DEATH, OR SEVERE PROPERTY OR ENVIRONMENTAL DAMAGE. ST PRODUCTS WHICH ARE NOT SPECIFIED AS "AUTOMOTIVE
GRADE" MAY ONLY BE USED IN AUTOMOTIVE APPLICATIONS AT USER’S OWN RISK.
Resale of ST products with provisions different from the statements and/or technical features set forth in this document shall immediately void
any warranty granted by ST for the ST product or service described herein and shall not create or extend in any manner whatsoever, any
liability of ST.
ST and the ST logo are trademarks or registered trademarks of ST in various countries.
Information in this document supersedes and replaces all information previously supplied.
The ST logo is a registered trademark of STMicroelectronics. All other names are the property of their respective owners.
© 2007 STMicroelectronics - All rights reserved
STMicroelectronics group of companies
Australia - Belgium - Brazil - Canada - China - Czech Republic - Finland - France - Germany - Hong Kong - India - Israel - Italy - Japan -
Malaysia - Malta - Morocco - Singapore - Spain - Sweden - Switzerland - United Kingdom - United States of America
www.st.com
38/38
 Loading...