

Page 1
MODEL SR850
DSP Lock-In Amplifier
Stanford Research Systems
1290-D Reamwood Avenue
Sunnyvale, California 94089
Phone: (408) 744-9040 • Fax: (408) 744-9049
email: info@thinkSRS.com • www.thinkSRS.com
Copyright © 1992 by SRS, Inc.
All Rights Reserved.
Revision 1.8 (02/2007)
Page 2

Page 3

TABLE OF CONTENTS
GENERAL INFORMATION
Safety and Preparation for Use 1-3
Specifications 1-5
Abridged Command List 1-7
GETTING STARTED
Your First Measurements 2-1
The Basic Lock-in 2-3
Displays and Traces 2-7
Outputs, Offsets and Expands 2-13
Scans and Sweeps 2-17
Using the Disk Drive 2-23
Aux Outputs and Inputs 2-31
Trace Math 2-35
SR850 BASICS
What is a Lock-in Amplifier? 3-1
What Does a Lock-in Measure? 3-3
The SR850 Functional Diagram 3-5
Reference Channel 3-7
Phase Sensitive Detectors 3-9
Time Constants and DC Gain 3-11
DC Outputs and Scaling 3-13
Dynamic Reserve 3-17
Signal Input Amplifier and Filters 3-19
Input Connections 3-21
Intrinsic (Random) Noise Sources 3-23
External Noise Sources 3-25
Noise Measurements 3-27
OPERATION
FRONT PANEL 4-1
Power On/Off and Power On Tests 4-1
Video Display 4-1
Soft Keys 4-2
Keypad 4-2
Spin Knob 4-2
Disk Drive 4-2
Front Panel BNC Connectors 4-2
SCREEN DISPLAY 4-5
Default Display 4-5
Data Traces 4-6
Single/Dual Trace Displays 4-7
Bar Graphs 4-9
Polar Graphs 4-10
Strip Charts 4-11
Trace Scans, Sweeps and Aliasing 4-13
Settings and Input/Output Monitor 4-15
Menu Display 4-15
Status Indicators 4-16
KEYPAD 4-19
Normal and Alternate Keys 4-19
Menu Keys 4-19
Additional Menus 4-20
Entry Keys 4-20
START/CONT and PAUSE/RESET 4-20
CURSOR 4-21
ACTIVE DISPLAY 4-21
MARK 4-21
CURSOR MAX/MIN 4-22
AUTO RESERVE 4-22
AUTO GAIN 4-22
AUTO PHASE 4-22
AUTO SETUP 4-22
AUTOSCALE 4-22
PRINT to a PRINTER 4-23
PRINT to a FILE 4-23
HELP 4-23
LOCAL 4-23
REAR PANEL 4-25
Power Entry Module 4-25
IEEE-488 Connector 4-25
RS232 Connector 4-25
Parallel Printer Connector 4-25
PC Keyboard Connector 4-25
Rear Panel BNC Connectors 4-26
Aux Inputs (A/D Inputs) 4-26
Aux Outputs (D/A Outputs) 4-26
X and Y Outputs 4-26
Signal Monitor Output 4-26
Trigger Input 4-27
TTL Sync Output 4-27
Preamp Connector 4-27
USING SRS PREAMPS 4-27
MENUS
Menu Guide 5-1
Default Settings 5-2
Reference and Phase Menu 5-3
Input and Filters Menu 5-7
Gain and Time Constant Menu 5-9
Output and Offset Menu 5-15
Trace and Scan Menu 5-17
Display and Scale Menu 5-21
Aux Outputs Menu 5-25
Cursor Setup Menu 5-29
Edit Mark Menu 5-31
Math Menu 5-33
Disk Menu 5-41
System Setup Menu 5-49
PROGRAMMING
GPIB Communications 6-1
RS232 Communications 6-1
Status Indicators and Queues 6-1
Command Syntax 6-1
1-1
Page 4

Table of Contents
Interface Ready and Status 6-2
GET (Group Execute Trigger) 6-2
DETAILED COMMAND LIST 6-3
Reference and Phase 6-4
Input and Filter 6-6
Gain and Time Constant 6-7
Output and Offset 6-9
Trace and Scan 6-10
Display and Scale 6-11
Cursor 6-13
Mark 6-14
Aux Input and Output 6-15
Math 6-16
Store and Recall 6-18
Setup 6-19
Print and Plot 6-21
Front Panel and Auto Functions 6-22
Data Transfer 6-23
Interface 6-28
Status Reporting 6-29
STATUS BYTE DEFINITIONS 6-30
Serial Poll Status Byte 6-30
Service Requests 6-31
Standard Event Status Byte 6-31
LIA Status Byte 6-32
Error Status Byte 6-32
PROGRAM EXAMPLES
Microsoft C, Nationall Instr GPIB 6-33
QUICKBASIC, Nationall Instr GPIB 6-39
TESTING
Introduction 7-1
Preset 7-1
Serial Number 7-1
Firmware Revision 7-1
General Installation 7-2
Necessary Equipment 7-3
If A Test Fails 7-3
PERFORMANCE TESTS
Self Tests 7-5
DC Offset 7-7
Common Mode Rejection 7-9
Amplitude Accuracy and Flatness 7-11
Amplitude Linearity 7-13
Frequency Accuracy 7-15
Phase Accuracy 7-17
Sine Output Amplitude 7-19
DC Outputs and Inputs 7-21
Input Noise 7-23
PERFORMANCE TEST RECORD 7-25
SERVICE
Circuit Boards 8-1
Adjusting DC Offset and CMRR 8-3
Adjusting Notch Filters 8-6
CIRCUITRY
Circuit Boards 9-1
Video Driver and CRT 9-1
CPU Board 9-3
Power Supply Board 9-5
DSP Logic Board 9-7
Analog Input Board 9-9
PARTS LISTS
Power Supply Board 9-11
DSP Logic Board 9-13
Analog Input Board 9-20
CPU Board 9-27
Chassis Assembly 9-32
Miscellaneous 9-35
SCHEMATIC DIAGRAMS
CPU Board
Power Supply Board
DSP Logic Board
Analog Input Board
1-2
Page 5

SAFETY AND PREPARATION FOR USE
WARNING
Dangerous voltages, capable of causing injury or death, are present in
this instrument. Use extreme caution whenever the instrument covers
are removed. Do not remove the covers while the unit is plugged into a
live outlet.
CAUTION
This instrument may be damaged if operated
with the LINE VOLTAGE SELECTOR set for the
wrong AC line voltage or if the wrong fuse is
installed.
LINE VOLTAGE SELECTION
The SR850 operates from a 100V, 120V, 220V, or
240V nominal AC power source having a line frequency of 50 or 60 Hz. Before connecting the power cord to a power source, verify that the LINE
VOLTAGE SELECTOR card, located in the rear
panel fuse holder, is set so that the correct AC input voltage value is visible.
Conversion to other AC input voltages requires a
change in the fuse holder voltage card position
and fuse value. Disconnect the power cord, open
the fuse holder cover door and rotate the fuse-pull
lever to remove the fuse. Remove the small printed circuit board and select the operating voltage
by orienting the printed circuit board so that the
desired voltage is visible when pushed firmly into
its slot. Rotate the fuse-pull lever back into its normal position and insert the correct fuse into the
fuse holder.
LINE FUSE
Verify that the correct line fuse is installed before
connecting the line cord. For 100V/120V, use a 1
Amp fuse and for 220V/240V, use a 1/2 Amp fuse.
LINE CORD
The SR850 has a detachable, three-wire power
cord for connection to the power source and to a
protective ground. The exposed metal parts of the
instrument are connected to the outlet ground to
protect against electrical shock. Always use an
outlet which has a properly connected protective
ground.
SERVICE
Do not attempt to service or adjust this instrument
unless another person, capable of providing first
aid or resuscitation, is present.
Do not install substitute parts or perform any unauthorized modifications to this instrument. Contact
the factory for instructions on how to return the instrument for authorized service and adjustment.
FURNISHED ACCESSORIES
- Power Cord
- Operating Manual
ENVIRONMENTAL CONDITIONS
OPERATING
Temerpature: +10° C to +40° C
(Specifications apply over +18° C to +28° C)
Relative Humidity: <90% Non-condensing
NON-OPERATING
Temperature: -25° C to 65° C
Humidity: <95% Non-condensing
WARNING REGARDING USE WITH PHOTOMULTIPLIERS AND OTHER DETECTORS
The front end amplifier of this instrument is easily
damaged if a photomultiplier is used improperly
with the amplifier. When left completely unterminated, a cable connected to a PMT can charge to
several hundred volts in a relatively short time. If
this cable is connected to the inputs of the SR850
the stored charge may damage the front-end op
amps. To avoid this problem, always discharge the
cable and connect the PMT output to the SR850
input before turning the PMT on.
1-3
Page 6

1-4
Page 7

SR850 DSP LOCK-IN AMPLIFIER
SPECIFICATIONS
SIGNAL CHANNEL
Voltage Inputs Single-ended (A) or differential (A-B).
Current Input 106 or 108 Volts/Amp.
Full Scale Sensitivity 2 nV to 1 V in a 1-2-5-10 sequence (expand off).
Input Impedance Voltage: 10 MΩ+25 pF, AC or DC coupled.
Current: 1 kΩ to virtual ground.
Gain Accuracy ±1% from 20°C to 30°C (notch filters off), ±0.2% typical.
Input Noise 6 nV/√Hz at 1 kHz (typical).
Signal Filters 60 (50) Hz and 120(100) Hz notch filters (Q=4).
CMRR 100 dB at 10 kHz (DC Coupled), decreasing by 6 db/octave above 10 kHz
Dynamic Reserve Greater than 100 dB (with no signal filters).
Harmonic Distortion <-90 dB to 10 kHz, <-80 dB to 100 kHz.
REFERENCE CHANNEL
Frequency Range 1 mHz to 102 kHz
Reference Input TTL (rising or falling edge) or Sine.
Sine input is1 MΩ, AC coupled (>1 Hz). 400 mV pk-pk minimum signal.
Phase Resolution 0.001°
Absolute Phase Error <1°
Relative Phase Error <0.001°
Orthogonality 90° ± 0.001°
Phase Noise External synthesized reference: 0.005° rms at 1 kHz, 100 ms, 12 dB/oct.
Internal reference: crystal synthesized, <0.0001° rms at 1 kHz.
Phase Drift <0.01°/°C below 10 kHz
<0.1°/°C to 100 kHz
Harmonic Detect Detect at Nxf where N<32767 and Nxf<102 kHz.
Acquisition Time (2 cycles + 5 ms) or 40 ms, whichever is greater.
DEMODULATOR
Zero Stability Digital displays have no zero drift on all dynamic reserves.
Analog outputs: <5 ppm/°C for all dynamic reserves.
Time Constants 10 µs to 30 s (reference > 200 Hz). 6, 12, 18, 24 dB/oct rolloff.
up to 30000 s (reference < 200 Hz). 6, 12, 18, 24 dB/oct rolloff.
Synchronous filtering available below 200 Hz.
Harmonic Rejection -90 dB
INTERNAL OSCILLATOR
Frequency 1 mHz to 102 kHz.
Frequency Accuracy 25 ppm + 30 µHz
Frequency Resolution 5 digits or 0.1 mHz, whichever is greater.
Frequency Sweeps Linear and Log.
Distortion f<10 kHz, below -80 dBc. f>10 kHz, below -70 dBc.1 Vrms amplitude.
Output Impedance 50 Ω
Amplitude 4 mVrms to 5 Vrms (into a high impedance load) with 2 mV resolution.
(2 mVrms to 2.5 Vrms into 50Ω load).
Amplitude Accuracy 1%
Amplitude Stability 50 ppm/°C
Outputs Sine output on front panel. TTL sync output on rear panel.
When using an external reference, both outputs are phase locked to the
external reference.
1-5
Page 8

SR850 DSP Lock-In Amplifier
INPUTS AND OUTPUTS
Channel 1 Output X, R, θ, or Trace 1-4. Traces are defined as A•B/C or A•B/C2 where A, B,
and C are selected from the quantities Unity, X, Y, R, θ, Xnoise, Ynoise,
Rnoise, Aux Inputs 1 through 4, or Frequency.
Output Voltage: ±10 V full scale. 10 mA max output current.
Channel 2 Output Y, R, θ, or Trace 1-4. Traces are defined as A•B/C or A•B/C2 where A, B,
and C are selected from the quantities Unity, X, Y, R, θ, Xnoise, Ynoise,
Rnoise, Aux Inputs 1 through 4, or Frequency.
Output Voltage: ±10 V full scale. 10 mA max output current.
X and Y Outputs Rear panel outputs of cosine (X) and sine (Y) components.
Output Voltage: ±10 V. 10 mA max output current.
Aux. Outputs 4 BNC Digital to Analog outputs.
±10 V full scale, 1 mV resolution. May be set to a fixed voltage or swept in
amplitude (linear or log). 10 mA max output current.
Aux. Inputs 4 BNC Analog to Digital inputs.
Differential inputs with1 MΩ input impedance on both shield and center
conductor. ±10 V full scale, 1 mV resolution.
Trigger Input TTL trigger input triggers each data sample and/or start of scan.
Monitor Output Analog output of signal amplifiers (before the demodulator).
DISPLAYS
Screen Format Single or dual display.
Displayed Quantities Each display may show one of the traces.
Traces are defined as A•B/C or A•B/C2 where A, B and C are selected from
the quantities Unity, X, Y, R, θ, Xnoise, Ynoise, Rnoise, Aux Inputs 1
through 4, or Frequency.
Display Types Large numeric readout with bar graph, polar graph, and strip chart.
Chart Data Buffer 64k data points may be stored and displayed on strip charts. The buffer can
be configured as a single trace with 64k points, 2 traces with 32k points
each, or 4 traces with16k points each. The internal data sample rate ranges
from 512 Hz down to 1 point every 16 seconds. Samples can also be
triggered.
ANALYSIS FUNCTIONS
Smoothing 5 - 25 point Savitsky-Golay smoothing of trace regions.
Curve Fits Line, Exponential, and Gaussian fits of trace regions.
Calculator Arithmetic, trigonometric, and logarithmic calculations on trace regions.
Statistics Mean and standard deviation of trace regions.
GENERAL
Monitor Monochrome CRT. 640H by 480V resolution.
Adjustable brightness and screen position.
Interfaces IEEE-488, RS232 and Printer interfaces standard.
All instrument functions can be controlled through the IEEE-488 and RS232
interfaces. A PC keyboard input is provided for additional flexibility.
Preamp Power Power connector for SR550 and SR552 preamplifiers.
Hardcopy Screen dumps to dot matrix and HP LaserJet compatible printers. Data
plots to HP-GL compatible plotters (via RS232 or IEEE-488). Screens can
also be saved to disk as PCX image files.
Disk 3.5 inch DOS compatible format, 720 kbyte capacity.
Storage of data and setups.
Power 60 Watts, 100/120/220/240 VAC, 50/60 Hz.
Dimensions 17"W x 6.25"H x 19.5"D
Weight 40 lbs.
Warranty One year parts and labor on materials and workmanship.
1-6
Page 9

SR850 DSP Lock-In Amplifier
COMMAND LIST
VARIABLES i,j,k,l,m Integers
f Frequency (real)
x,y,z Real Numbers
s String
REFERENCE and PHASE page description
PHAS (?) {x} 6-4 Set (Query) the Phase Shift to x degrees.
FMOD (?) {i} 6-4 Set (Query) the Reference Source to Internal (0), Sweep (1) , or External (2).
FREQ (?) {f} 6-4 Set (Query) the Reference Frequency to f Hz.Set only in Internal reference mode.
SWPT (?) {i} 6-4 Set (Query) the Internal Sweep Type to Linear (0) or logarithmic (1).
SLLM (?) {f} 6-4 Set (Query) the Start Frequency to f Hz.Set only in Internal Sweep mode.
SULM (?) {f} 6-4 Set (Query) the Stop Frequency to f Hz.Set only in Internal Sweep mode.
RSLP (?) {i} 6-4 Set (Query) the External Reference Slope to Sine(0), TTL Rising (1), or TTL Falling (2).
HARM (?) {i} 6-5 Set (Query) the Detection Harmonic to 1 ≤ i ≤ 32767 and i•f ≤ 102 kHz.
SLVL (?) {x} 6-5 Set (Query) the Sine Output Amplitude to x Vrms. 0.004 ≤ x ≤5.000.
INPUT and FILTER page description
ISRC (?) {i} 6-6 Set (Query) the Input Configuration to A (0), A-B (1) , or I (2).
IGAN (?) {i} 6-6 Set (Query) the Current Conversion Gain to 1 MΩ (0) or 100 MΩ (1).
IGND (?) {i} 6-6 Set (Query) the Input Shield Groungind to Float (0) or Ground (1).
ICPL (?) {i} 6-6 Set (Query) the Input Coupling to AC (0) or DC (1).
ILIN (?) {i} 6-6 Set (Query) the Line Notch Filters to Out (0), Line In (1) , 2xLine In (2), or Both In (3).
GAIN and TIME CONSTANT page description
SENS (?) {i} 6-7 Set (Query) the Sensitivity to 2 nV (0) through 1 V (26) rms full scale.
RMOD (?) {i} 6-7 Set (Query) the Dynamic Reserve Mode to Max (0), Manual (1), or Min (2).
RSRV (?) {i} 6-7 Set (Query) the Dynamic Reserve to i th reserve. Set will switch to Manual Reserve Mode.
OFLT (?) {i} 6-7 Set (Query) the Time Constant to 10 µs (0) through 30 ks (19).
OFSL (?) {i} 6-8 Set (Query) the Low Pass Filter Slope to 6 (0), 12 (1), 18 (2) or 24 (3) dB/oct.
SYNC (?) {i} 6-8 Set (Query) the Synchronous Filter to Off (0) or On below 200 Hz (1).
OUTPUT and OFFSET page description
FOUT (?) i {, j} 6-9 Set (Query) the CH1 (i=1) or CH2 (2) Output Source to XY,R,θ,Trace 1, 2, 3, 4 (j=0...6).
OEXP (?) i {, x, j} 6-9 Set (Query) the X, Y, R (i=1,2,3) Offset to x percent and Expand to j. -105.00 ≤ x ≤ 105.00 and
1 ≤ j ≤ 256.
AOFF i 6-9 Auto Offset X, Y, R (i=1,2,3).
TRACE and SCAN page description
TRCD (?) i {, j, k, l, m} 6-10 Set (Query) the Definition of Trace i (1-4) to j•k/l and Store (m=1) or Not Store (0). j, k, l select
1, X, Y, R, q, Xn, Yn, Rn, Aux 1, Aux 2, Aux 3, Aux4, or F (j,k,l = 0...12). l=13-24 selects X
through F2.
SRAT (?) {i} 6-10 Set (Query) the Sample Rate to 62.5 mHz (0) through 512 Hz (13) or Trigger (14).
SLEN (?) {x} 6-10 Set (Query) the Scan Length to x seconds.
SEND (?) {i} 6-10 Set (Query) the Scan Mode to 1 Shot (0) or Loop (1).
TRIG 6-10 Software trigger command. Same as trigger input.
DISPLAY and SCALE page description
ASCL 6-11 Auto Scale the active display.
ADSP (?) {i} 6-11 Set (Query) the active display to Full (0), Top (1) or Bottom (2). Full screen is always active.
SMOD (?) {i} 6-11 Set (Query) the Screen Format to Single (0) or Up/Down dual (1) display mode.
MNTR (?) {i} 6-11 Set (Query) the Monitor Display to settings (0) or Input/Output (1).
DTYP (?) i {, j} 6-11 Set (Query) theFull (i=0), Top (i=1) or Bottom (i=2) Display Type to Polar (j=0), Blank (j=1),
Bar (j=2) or Chart (j=3).
2
1-7
Page 10

SR850 DSP Lock-In Amplifier
DTRC (?) i {, j} 6-11 Set (Query) theFull (i=0), Top (i=1) or Bottom (i=2) Display Trace to trace j (1,2,3,4).
DSCL (?) {x} 6-11 Set (Query) theFull (i=0), Top (i=1) or Bottom (i=2) Display Range to x.
DOFF (?) {x} 6-11 Set (Query) theFull (i=0), Top (i=1) or Bottom (i=2) Display Center value to x.
DHZS (?) {i} 6-12 Set (Query) theFull (i=0), Top (i=1) or Bottom (i=2) Display Horizontal Scale to 2 ms (0) through
200 ks (32) per div.
RBIN? i 6-12 Query the bin number at the right edge of the Full (i=0), Top (i=1) or Bottom (i=2) chart display.
CURSOR page description
CSEK (?) {i} 6-13 Set (Query) the active display Cursor Seek mode to Max (0), Min (1) or Mean (2).
CWID (?) {i} 6-13 Set (Query) the active display Cursor Width to Off (0), Narrow (1), Wide (2) or Spot (3).
CDIV (?) {i} 6-13 Set (Query) the active display Chart Divisions to 8 (0), 10 (1) or None (2).
CLNK (?) {i} 6-13 Set (Query) the Cursor Control Mode to Linked (0) or Separate (1).
CDSP (?) {i} 6-13 Set (Query) the active display Cursor Readout to Delay (0), Bin (1), Fsweep (2) or Time (3).
CMAX 6-13 Move active chart cursor to max or min. Same as pressing [CURSOR MAX/MIN] key.
CURS? i 6-13 Query the cursor horz,vert position of Full (0), Top (1) or Bottom (2) chart display.
CBIN (?) {i} 6-13 Set (Query) the center of the cursor region in the active chart display. i is the bin number.
MARK page description
MARK 6-14 Places a mark in the data buffer. Same as pressing [MARK] key.
MDEL 6-14 Delete the nearest mark to the left of the cursor. Same as pressing <Marker Delete> softkey.
CNXT 6-14 Move active chart cursor to next mark to the right.
CPRV 6-14 Move active chart cursor to next mark to the left.
MACT? 6-14 Query the number of active marks. Also returns the active mark numbers.
MBIN? i 6-14 Query the bin number of mark #i.
MTXT (?) i {,s} 6-14 Set (Query) the label text for mark #i.
AUX INPUT/OUTPUT page description
OAUX ? i 6-15 Query the value of Aux Input i (1,2,3,4).
AUXM(?) i{, j} 6-15 Set (Query) the Output Mode of Aux Output i (1,2,3,4). j selects Fixed (0), Log (1) or Linear (2).
AUXV (?) i {, x} 6-15 Set (Query) voltage of Aux Output i (1,2,3,4) to x Volts. -10.500 ≤ x ≤ 10.500. Fixed Output
Mode only.
SAUX (?) i {, x, y, z} 6-15 Set (Query) the Aux Output i (1,2,3,4) Sweep Limits to Start (x), Stop (y) and Offset (z) voltag-
es. 0.001 ≤ x,y ≤ 21.000 and -10.500 ≤ z ≤ 10.500.
TSTR (?) {i} 6-15 Set (Query) the Trigger Starts Scan? mode to No (0) or Yes (1).
MATH page description
SMTH i 6-16 Smooth the data within the active chart using 5 (0), 11 (1), 17 (2), 21 (3), 25 (4) point width.
COPR (?) {i} 6-16 Set (Query) the Calculator Operation to +, -, x, /, sin, cos, tan, √x, x
CALC 6-17 Do the Calculation selected by COPR with the argument set by CTRC or CARG.
CAGT (?) {i} 6-17 Set (Query) the Calculation Argument Type to Trace (0) or Constant (1).
CTRC (?) {i} 6-17 Set (Query) the Trace Argument to Trace i (1,2,3,4).
CARG (?) {x} 6-17 Set (Query) the Constant Argument value to x.
FTYP (?) {i} 6-17 Set (Query) the Fit Type to Linear (0), Exponential (1) or Gaussian (2).
FITT i, j 6-17 Fit the data within the chart region between i% and j% from the left edge. 0 ≤ i,j ≤ 100.
PARS ? i 6-17 Query the fit parameters a (0), b (1), c (2) or t0 (3).
STAT i, j 6-17 Statistically analyze the data within the chart region between i% and j% from the left edge.
0 ≤ i,j ≤ 100.
SPAR ? i 6-17 Query the Statistical results mean (0), standard dev (1), total (2) or delta time (3).
STORE AND RECALL FILE page description
FNAM (?) {s} 6-18 Set (Query) the current File Name to string s.
SDAT 6-18 Save the Active Display's Trace Data to the file specified by FNAM.
SASC 6-18 Save the Active Display's Trace Data in ASCII format to the file specified by FNAM.
SSET 6-18 Save the Settings to the file specified by FNAM.
2
, log, 10x (i=0...10).
1-8
Page 11

SR850 DSP Lock-In Amplifier
RDAT 6-18 Recall the Trace Data from the file specified by FNAM to the active display's trace buffer.
RSET 6-18 Recall the Settings from the file specified by FNAM.
SETUP page description
OUTX (?) {i} 6-19 Set (Query) the Output Interface to RS232 (0) or GPIB (1).
OVRM (?) {i} 6-19 Set (Query) the GPIB Overide Remote state to Off (0) or On (1).
KCLK (?) {i} 6-19 Set (Query) the Key Click to Off (0) or On (1).
ALRM (?) {i} 6-19 Set (Query) the Alarms to Off (0) or On (1).
THRS (?) {i} 6-19 Set (Query) the Hours to 0≤ i ≤ 23.
TMIN (?) {i} 6-19 Set (Query) the Minutes to 0 ≤ i ≤ 59.
TSEC (?) {i} 6-19 Set (Query) the Seconds to 0 ≤ i ≤ 59.
DMTH (?) {i} 6-19 Set (Query) the Month to 1 ≤ 1 ≤ 12.
DDAY (?) {i} 6-19 Set (Query) the Day to 1 ≤ 1 ≤ 31.
DYRS (?) {i} 6-19 Set (Query) the Year to 0 ≤ 1 ≤ 99.
PLTM (?) {i} 6-19 Set (Query) the Plotter Mode to RS232 (0) or GPIB (1).
PLTB (?) {i} 6-19 Set (Query) the Plotter Baud Rate to 300 (0), 1200 (1), 2400 (2), 4800 (3), 9600 (4).
PLTA (?) {i} 6-19 Set (Query) the Plotter GPIB Address to 0 ≤ i ≤ 30.
PLTS (?) {i} 6-19 Set (Query) the Plot Speed to Fast (0) or Slow (1).
PNTR (?) {i} 6-19 Set (Query) the Trace Pen Number to 1 ≤ i ≤ 6.
PNGD (?) {i} 6-20 Set (Query) the Grid Pen Number to 1 ≤ i ≤ 6.
PNAL (?) {i} 6-20 Set (Query) the Alphanumeric Pen Number to 1 ≤ i ≤ 6.
PNCR (?) {i} 6-20 Set (Query) the Cursor Pen Number to 1 ≤ i ≤ 6.
PRNT (?) {i} 6-20 Set (Query) the Printer Type to Epson (0), HP (1) or File (2).
PRINT AND PLOT page description
PRSC 6-21 Print the screen. Same as the [PRINT] key.
PALL 6-21 Plot the display(s).
PTRC 6-21 Plot the trace(s) only.
PCUR 6-21 Plot the cursor(s) only.
FRONT PANEL CONTROLS
AUTO FUNCTIONS page description
STRT 6-22 Start or continue a scan. Same as [START/CONT] key.
PAUS 6-22 Pause a scan. Does not reset a paused or done scan.
REST 6-22 Reset the scan. All stored data is lost.
ASCL 6-11 Auto Scale the active display.
ATRC (?) {i} 6-22 Set (Query) the active display to Top (0) or Bottom (1). Full screen is always active.
AGAN 6-22 Auto Gain function. Same as pressing the [AUTO GAIN] key.
ARSV 6-22 Auto Reserve function. Same as pressing the [AUTO RESERVE] key.
APHS 6-22 Auto Phase function. Same as pressing the [AUTO PHASE] key.
AOFF i 6-22 Auto Offset X,Y or R (i=1,2,3).
CMAX 6-22 Move Cursor to Max or Min. Same as pressing the [CURSOR MAX/MIN] key.
DATA TRANSFER page description
OUTP? i 6-23 Query the value of X (1), Y (2), R (3) or θ (4). Returns ASCII floating point value.
OUTR? i 6-23 Query the value of Trace i (1,2,3,4). Returns ASCII floating point value.
OAUX? i 6-23 Query the value of Aux Input i (1,2,3,4). Returns ASCII floating point value.
SPTS? i 6-23 Query the number of points stored in Trace i (1,2,3,4).
TRCA? i,j,k 6-23 Read k≥1 points starting at bin j≥0 from trace i (1,2,3,4) in ASCII floating point.
TRCB? i,j,k 6-23 Read k≥1 points starting at bin j≥0 from trace i (1,2,3,4) in IEEE binary floating point.
TRCL? i,j,k 6-24 Read k≥1 points starting at bin j≥0 from trace i (1,2,3,4) in non-normalized binary floating point.
FAST (?) {i} 6-25 Set (Query) Fast Data Transfer Mode On (1 or 2) or Off (0).On will transfer binary X and Y eve-
ry sample during a scan over the GPIB interface.
STRD 6-25 Start a scan after 0.5sec delay. Use with Fast Data Transfer Mode.
1-9
Page 12

SR850 DSP Lock-In Amplifier
INTERFACE page description
*RST 6-26 Reset the unit to its default configurations.
*IDN? 6-26 Read the SR850 device identification string.
LOCL(?) {i} 6-26 Set (Query) the Local/Remote state to LOCAL (0), REMOTE (1), or LOCAL LOCKOUT (2).
OVRM (?) {i} 6-26 Set (Query) the GPIB Overide Remote state to Off (0) or On (1).
TRIG 6-26 Software trigger command. Same as trigger input.
STATUS page description
*CLS 6-27 Clear all status bytes.
*ESE (?) {i} {,j} 6-27 Set (Query) the Standard Event Status Byte Enable Register to the decimal value i (0-255).
*ESE i,j sets bit i (0-7) to j (0 or 1). *ESE? queries the byte. *ESE?i queries only bit i.
*ESR? {i} 6-27 Query the Standard Event Status Byte. If i is included, only bit i is queried.
*SRE (?) {i} {,j} 6-27 Set (Query) the Serial Poll Enable Register to the decimal value i (0-255). *SRE i,j sets bit i (0-
7) to j (0 or 1). *SRE? queries the byte, *SRE?i queries only bit i.
*STB? {i} 6-27 Query the Serial Poll Status Byte. If i is included, only bit i is queried.
*PSC (?) {i} 6-27 Set (Query) the Power On Status Clear bit to Set (1) or Clear (0).
ERRE (?) {i} {,j} 6-27 Set (Query) the Error Status Enable Register to the decimal value i (0-255). ERRE i,j sets bit i
(0-7) to j (0 or 1). ERRE? queries the byte, ERRE?i queries only bit i.
ERRS? {i} 6-27 Query the Error Status Byte. If i is included, only bit i is queried.
LIAE (?) {i} {,j} 6-27 Set (Query) the LIA Status Enable Register to the decimal value i (0-255). LIAE i,j sets
bit i (0-7) to j (0 or 1). LIAE? queries the byte, LIAE?i queries only bit i.
LIAS? {i} 6-27 Query the LIA Status Byte. If i is included, only bit i is queried.
STATUS BYTE DEFINITIONS
SERIAL POLL STATUS BYTE (6-28)
bit name usage
0 SCN No data is being acquired
1 IFC No command execution in progress
2 ERR Unmasked bit in error status byte set
3 LIA Unmasked bit in LIA status byte set
4 MAV The interface output buffer is non-empty
5 ESB Unmasked bit in standard status byte set
6 SRQ SRQ (service request) has occurred
7 Unused
STANDARD EVENT STATUS BYTE (6-29)
bit name usage
0 INP Set on input queue overflow
1 Unused
2 QRY Set on output queue overflow
3 Unused
4 EXE Set when command execution error occurs
5 CMD Set when an illegal command is received
6 URQ Set by any key press or knob rotation
7 PON Set by power-on
LIA STATUS BYTE (6-29)
bit name usage
0 RESRV Set when a RESRV overload is detected
1 FILTR Set when a FILTR overload is detected
2 OUTPT Set when a OUTPT overload is detected
3 UNLK Set when reference unlock is detected
4 RANGE Set when detection freq crosses 200 Hz
5 TC Set when time constant is changed
6 TRIG Set when unit is triggered
7 PLOT Set when a plot is completed
ERROR STATUS BYTE (6-30)
bit name usage
0 Prn/Plt Err Set when an printing or plotting error occurs
1 Backup Error Set when battery backup fails
2 RAM Error Set when RAM Memory test finds an error
3 Disk Error Set when a disk error occurs
4 ROM Error Set when ROM Memory test finds an error
5 GPIB Error Set when GPIB binary data transfer aborts
6 DSP Error Set when DSP test finds an error
7 Math Error Set when an internal math error occurs
1-10
Page 13

GETTING STARTED
YOUR FIRST MEASUREMENTS
The sample measurements described in this section are designed to acquaint the first time user with the
SR850 DSP Lock-In Amplifier. Do not be concerned that your measurements do not exactly agree with these
exercises. The focus of these measurement exercises is to learn how to use the instrument.
It is highly recommended that the first time user step through some or all of these exercises before attempting
to perform an actual experiment.
The experimental procedures are detailed in two columns. The left column lists the actual steps in the experiment. The right column is an explanation of each step.
Key Types There are two types of front panel keys which will be referred to in this
manual. Hardkeys are those keys with labels printed on them. Their function is determined by the label and does not change. Hardkeys are referenced by brackets like this - [HARDKEY]. The softkeys are the six gray
keys along the right edge of the screen. Their function is labelled by a
menu box displayed on the screen next to the key. Softkey functions
change depending upon the situation. Softkeys will be referred to as the
<Soft Key> or simply the Soft Key.
Hardkeys The keypad consists of five groups of hardkeys. The ENTRY keys are
used to enter numeric parameters which have been highlighted by a softkey. The MENU keys select a menu of softkeys. Pressing a menu key
will change the menu boxes which are displayed next to the softkeys.
Each menu groups together similar parameters and functions. The
CONTROL keys start and stop actual data acquisition, select the cursor
and toggle the active display. These keys are not in a menu since they
are used frequently and while displaying any menu. The SYSTEM keys
output the screen to a printer and display help messages. These keys
can also be accessed from any menu. The AUTO keys perform auto
functions such as Auto Gain and Auto Phase.
Softkeys The SR850 has a menu driven user interface. The 6 softkeys to the right
of the video display have different functions depending upon the information displayed in the menu boxes at the right of the video display. In general, the softkeys have two uses. The first is to toggle a feature on and
off or to choose between settings. The second is to highlight a parameter
which is then changed using the knob or numeric keypad. In both cases,
the softkey selects the parameter which is displayed adjacent to it.
Knob The knob is used to adjust parameters which have been highlighted by a
softkey. Many numeric entry fields may be adjusted with the knob. In
addition, many parameters are adjusted only with the knob. These are
typically parameters with a limited set of values, such as sensitivity or
time constant. In these cases, the parameter is selected by a softkey.
The [CURSOR] key will set the knob function to scrolling the cursor
within the active chart display.
2-1
Page 14

Getting Started
2-2
Page 15

The Basic Lock-in
THE BASIC LOCK-IN
This measurement is designed to use the internal oscillator to explore some of the basic lock-in functions.
You will need BNC cables.
Specifically, you will measure the amplitude of the Sine Out at various frequencies, sensitivities, time constants and phase shifts. The "normal" lock-in display will be used throughout this exercise.
1. Disconnect all cables from the lock-in. Turn
the power on while holding down the [←]
(backspace) key. Wait until the power-on tests
are completed.
2. Connect the Sine Out on the front panel to the
A input using a BNC cable.
When the power is turned on with the backspace
key depressed, the lock-in returns to its default
settings. See the Default Settings list in the Menu
section for a complete listing of the settings.
The display is the "normal" lock-in display. The
lock-in setup is displayed across the top of the
screen. The sensitivity, reserve, time constant,
prefilters and input configuration are all easily visible. Watch how these indicators change as you
change parameters. The upper numeric readout
and bar graph shows the value of X (Rcosθ) and
the lower graph shows the the value of Y (Rsinθ).
The input impedance of the lock-in is 10 MΩ. The
Sine Out has an output impedance of 50Ω. Since
the Sine Output amplitude is specified into a high
impedance load, the output impedance does not
affect the amplitude.
The lock-in defaults to the internal oscillator reference set at 1.000 kHz. The reference mode (Intrnl)
and frequency are displayed at the bottom of the
screen. In this mode, the lock-in generates a synchronous sine output at the internal reference
frequency.
3. Press [AUTO PHASE]
4. Press [REF/PHASE]
The sine amplitude is 1.000 Vrms and the
sensitivity is 1 V(rms). Since the phase shift of the
sine output is very close to zero, the upper display
(X) should read close to 1.000 V and the lower display (Y) should read close to 0.000 V.
Automatically adjust the reference phase shift to
eliminate any residual phase error. This should set
the value of Y to zero.
Display the Reference and Phase menu. The
phase shift (displayed in the top menu box) should
be close to zero.
2-3
Page 16

The Basic Lock-in
5. Press the <Rotate 90 deg> softkey.
Press the <deg.> softkey.
Use the knob to adjust the phase shift until Y
is zero and X is equal to the positive
amplitude.
Press [9] [0] [ENTER]
Press [AUTO PHASE]
6. Press <Ref. Frequency>
Press [1] [2] [.] [3] [4] [5] [EXP] [3] [ENTER]
This adds 90° to the reference phase shift. The
value of X drops to zero and Y becomes minus the
magnitude (-1.000 V).
Highlight the phase shift.
The knob can be used to adjust parameters which
are continuous, such as phase, amplitude and frequency. The final phase value should be close to
zero again.
Phase shifts can also be entered numerically.
The knob is useful for small adjustments while
numeric entry is easier when changing to a precise value or by a large amount.
Use the Auto Phase function to return Y to zero
and X to the amplitude.
Highlight the internal reference frequency menu.
Enter 12.345 kHz in exponential form. The meas-
ured signal amplitude should stay within 1% of 1 V
and the phase shift should stay close to zero (the
value of Y should stay close to zero).
Press [1] [0] [0] [0] [ENTER]
7. Press <Sine Output>
Use the knob to adjust the amplitude.
Press [.] [0] [1] [ENTER]
8. Press [GAIN/TC]
Press [AUTO GAIN]
Parameters can be entered in real or integer form
as well. In this case, the frequency is changed to
1.000 kHz.
The internal oscillator is crystal synthesized with
25 ppm of frequency error. The frequency can be
set with 5 digit or 0.1 mHz resolution, whichever is
greater.
Highlight the sine output amplitude.
As the amplitude is changed, the measured value
of X should equal the sine output amplitude.
The amplitude may be entered numerically also.
The sine amplitude can be set from 4 mV to 5 V
rms into high impedance (half the amplitude into a
50 Ω load).
Display the Gain and Time Constant menu.
The Auto Gain function will adjust the sensitivity so
2-4
Page 17

The Basic Lock-in
that the measured magnitude (R) is a sizable percentage of full scale.
9. Press <Sensitivity>
Use the knob to change the sensitivity to
50 mV.
Change the sensitivity back to 20 mV.
10. Press <Time Constant>
Use the knob to change the time constant to
300 µs.
Change the time constant to 3 ms.
11. Press the <Filter db/oct.> softkey until 6 dB/oct
is selected.
Highlight the full scale sensitivity.
Parameters which are discrete values, such as
sensitivity and time constant, can only be changed
with the knob. Numeric entry is not allowed for
these parameters.
Highlight the time constant.
The values of X and Y become noisy. This is
because the 2f component of the output (at 2 kHz)
is no longer attenuated completely by the low pass
filters.
Let's leave the time constant short and change the
filter slope.
Parameters which have their available options displayed within the menu box are selected by pressing the corresponding softkey until the desired
option is chosen.
The X and Y outputs are somewhat noisy at this
short time constant and only 1 pole of low pass
filtering.
Press <Filter db/oct.> again to select
12 dB/oct.
Press <Filter db/oct.> twice to select
24 db/oct.
Press <Filter db/oct> again to select 6 db/oct.
12. Press [REF/PHASE]
Press <Ref. Frequency>
Press [5] [0] [ENTER]
The outputs are less noisy with 2 poles of filtering.
With 4 poles of low pass filtering, even this short
time constant attenuates the 2f component reasonably well and provides steady readings.
Let's leave the filtering short and the outputs noisy
for now.
Display the Reference and Phase menu.
Highlight the internal reference frequency.
Enter 50 Hz for the reference frequency. With a
3 ms time constant and only 6 db/oct of filtering,
the output is totally dominated by the 2f component at 50 Hz.
2-5
Page 18

The Basic Lock-in
13. Press [GAIN/TC]
Press <Synchronous> to select <200 Hz.
Display the Gain and Time Constant menu again.
This turns on synchronous filtering whenever the
detection frequency is below 200 Hz.
Synchronous filtering effectively removes output
components at multiples of the detection frequency. At low frequencies, this filter is a very effective
way to remove 2f without requiring extremely long
time constants.
The outputs are now very quiet and steady, even
though the time constant is very short. The
response time of the synchronous filter is equal to
the period of the detection frequency (20 ms in this
case).
This concludes this measurement example. You
should have a feeling for the basic operation of the
menus, knob and numeric entry. Basic lock-in
parameters have been introduced and you should
be able to perform simple measurements.
2-6
Page 19

Displays and Traces
DISPLAYS and TRACES
This measurement is designed to use the internal oscillator and an external signal source to explore some of
the display types. You will need a synthesized function generator capable of providing a 100 mVrms sine
wave at 1.000 kHz (the DS345 from SRS will suffice), BNC cables and a terminator appropriate for the generator function output.
Specifically, you will display the lock-in outputs when measuring a signal close to, but not equal to, the internal reference frequency. This setup ensures changing outputs which are more illustrative than steady outputs.
The displays will be configured to show X, Y, R and θ in bar graph and polar formats. The example Scans and
Sweeps demonstrates the use of the chart graph.
1. Disconnect all cables from the lock-in. Turn
the power on while holding down the [←]
(backspace) key. Wait until the power-on tests
are completed.
2. Turn on the function generator, set the fre-
quency to 1.0000 kHz (exactly) and the amplitude to 500 mVrms.
Connect the function output (sine wave) from
the synthesized function generator to the A
input using a BNC cable and appropriate
terminator.
When the power is turned on with the backspace
key depressed, the lock-in returns to its default
settings. See the Default Settings list in the Menu
section for a complete listing of the settings.
The display is the "normal" lock-in display. The
lock-in setup is displayed across the top of the
screen. The sensitivity, reserve, time constant,
prefilters and input configuration are all easily visible. Watch how these indicators change as you
change parameters. The upper numeric readout
and bar graph shows the value of X (Rcosθ) and
the lower graph shows the the value of Y (Rsinθ).
The input impedance of the lock-in is 10 MΩ. The
generator may require a terminator. Many generators have either a 50Ω or 600Ω output impedance.
Use the appropriate feedthrough or T termination if
necessary. In general, not using a terminator
means that the function output amplitude will not
agree with the generator setting.
The lock-in defaults to the internal oscillator reference set at 1.000 kHz. The reference mode (Intrnl)
and frequency are displayed at the bottom of the
screen. In this mode, the internal oscillator sets
the detection frequency.
3. Press [REF/PHASE]
The internal oscillator is crystal synthesized so
that the actual reference frequency should be very
close to the actual generator frequency. The X and
Y displays should read values which change very
slowly. The lock-in and the generator are not
phase locked but they are at the same frequency
with some slowly changing phase.
Display the Reference and Phase menu.
2-7
Page 20

Displays and Traces
Press <Ref. Frequency>
Use the knob to change the frequency to
999.80 Hz.
4. Press [DISPLAY/SCALE]
Press <Type/Trace> twice to highlight the displayed trace number.
Highlight the internal oscillator frequency.
By setting the lock-in reference 0.2 Hz away from
the signal frequency, the X and Y outputs are
0.2 Hz sine waves (difference between reference
and signal frequency). The X and Y output displays should now oscillate at about 0.2 Hz (the
accuracy is determined by the crystals of the generator and the lock-in).
Display the Display and Scale menu.
The SR850 collects data in the form of traces.
There are 4 definable traces and only these trace
quantities may be displayed. The default definition
of these traces is X, Y, R and θ for traces 1, 2, 3
and 4.
The Display Scale menu box shows the display
parameters for the Full (screen), Top or Bottom
(split screen) displays. In this case, the Top display parameters are shown.
Each display shows one of the data traces. The
Top display defaults to showing trace 1 which has
a default definition of X. Thus the top bar graph
shows the X output.
Use the knob to change the trace number to 3.
Press [AUTO SCALE]
5. Press <Full, Top or Bottom> to select Bottom.
Press <Type/Trace> twice to highlight the displayed trace number.
Use the knob to change the trace number to 4.
Trace 3 has a default definition of R so showing
trace 3 on the top graph will display the quantity R.
R is phase independent so it shows a steady value
(close to 0.500 V).
[AUTO SCALE] automatically scales the active
display. The top display is the active display (as
indicated by the inverse trace identifier at the
upper left of the display).
To modify the bottom graph, you must display the
bottom graph's parameters in the Display Scale
menu box. This also makes the bottom display the
active display (for autoscaling). The trace indicator
(at the upper left of each display) is highlighted on
the active display.
The bottom display defaults to trace 2 (Y).
Trace 4 is θ. The phase between the reference
and the signal changes by 360° every 5 sec
(0.2 Hz difference frequency).
2-8
Page 21

Displays and Traces
Press [AUTO SCALE]
Press the <± Range> softkey. This is the fifth
softkey from the top.
Press [1] [8] [0] [ENTER]
6. Press <Monitor> to select Input/Output.
7. Press <Format> to select Single.
[AUTO SCALE] automatically scales the active
display. In this case, the trace data is moving and
autoscaling may not do a very satisfactory job.
To manually set the graph scale, you set the range
(±) and center value (@). The graph displays a
scale equal to the center value plus and minus the
range.
In this case, set the bar graph to ±180°. The bar
graph should be a linear phase ramp at 0.2 Hz.
The monitor display at the top of the screen monitors either the lock-in settings (sensitivity, time
constant, etc.) or the measured lock-in inputs and
outputs (X, Y, R, θ and Aux In 1-4).
The Input/Output monitor allows you to see all of
the measured quantities, even if they are not
shown on the larger displays.
The screen is now setup for a single display. The
default display type for the full screen display is a
polar graph.
8. Press [REF/PHASE]
Press <Ref. Frequency>
Use the knob to adjust the frequency slowly to
try to stop the rotation of the signal vector.
9. Use a BNC cable to connect the TTL SYNC
output from the generator to the Reference
Input of the lock-in.
Press <Ref. Source>
The polar graph plots the quantities X and Y on an
X-Y axis. The resulting vector has a length equal
to the magnitude R and has a phase angle relative
to the positive X axis equal to θ. In this case, since
the phase is rotating at the difference frequency,
the vector rotates at 0.2 Hz.
Display the Reference and Phase menu.
Highlight the internal oscillator frequency.
As the internal reference frequency gets closer to
the signal frequency, the rotation gets slower and
slower. If the frequencies are EXACTLY equal,
then the phase is constant.
By using the signal source as the external reference, the lock-in will phase lock its internal oscillator to the signal frequency and the phase will be a
constant.
Highlight the reference source.
Use the knob to select External.
Select external reference mode. The lock-in will
phase lock to the signal at the Reference Input.
2-9
Page 22

Displays and Traces
Press <Ref. Slope> to select Rising Edge.
10. Press [DISPLAY/SCALE]
Press <Format> to select Up/Down.
11. Press [TRACE/SCAN]
Press <1 / 2 / 3 / 4> to select trace 3.
With a TTL reference signal, the slope needs to be
set to either rising or falling edge.
The signal vector on the polar graph will not rotate
since the phase is a constant. The actual phase
depends upon the phase difference between the
function output and the sync output from the
generator.
The external reference frequency (as measured by
the lock-in) is displayed at the bottom of the
screen. The reference mode is shown as Ext+ for
external TTL rising edge. The LOCK indicator
should be on (successfully locked to the external
reference).
Display the Display and Scale menu.
Change the screen to dual display mode again.
Display the Trace and Scan menu.
Trace 3 is defined as R and is displayed on the top
graph. Let's change the definition of trace 3 to
something else.
Press the second softkey, next to the trace
definition, to highlight the R.
Use the knob to change the A parameter from
R to X.
Press the second softkey to highlight the
denominator (C) of the trace definition.
Use the knob to change the C parameter from
1 to R.
12. Press [REF/PHASE]
Press [AUTO PHASE]
Traces are defined as A•B/C. The quantities A, B,
and C are selected from the various quantities
measured by the lock-in.
Trace 3 has now been redefined to be X. The top
graph now displays X. The trace definition is
shown at the upper left of each graph.
Traces may be defined to be ratios and products
of 2 or 3 quantities.
Trace 3 is now defined as X/R and is equal to
cosθ, independent of the signal amplitude. The
traces can be defined to display the most useful
quantities for a given experiment. Trace data may
be stored in the data buffers. Scans and chart
graphs will be discussed in a later example.
Change the reference phase shift to check that
trace 3 displays cosθ.
Automatically adjust the measured phase shift to
zero. The top display should show cos0° or 1.
Press <deg.>
Highlight the phase shift.
2-10
Page 23

Displays and Traces
Using the keypad, enter a phase shift which is
45° greater than the displayed phase shift.
At a measured phase shift of 45°, trace 3 should
equal cos45° or 0.707.
This concludes this measurement example. You
should have a feeling for the basic operation of the
display types and trace definitions.
2-11
Page 24

Displays and Traces
2-12
Page 25

Outputs, Offsets and Expands
OUTPUTS, OFFSETS and EXPANDS
This measurement is designed to use the internal oscillator to explore some of the basic lock-in outputs. You
will need BNC cables and a digital voltmeter (DVM).
Specifically, you will measure the amplitude of the Sine Out and provide analog outputs proportional to the
measurement. The effect of offsets and expands on the displayed values and the analog outputs will be
explored.
1. Disconnect all cables from the lock-in. Turn
the power on while holding down the [←]
(backspace) key. Wait until the power-on tests
are completed.
2. Connect the Sine Out on the front panel to the
A input using a BNC cable.
When the power is turned on with the backspace
key depressed, the lock-in returns to its default
settings. See the Default Settings list in the Menu
section for a complete listing of the settings.
The display is the "normal" lock-in display. The
lock-in setup is displayed across the top of the
screen. The sensitivity, reserve, time constant,
prefilters and input configuration are all easily visible. Watch how these indicators change as you
change parameters. The upper numeric readout
and bar graph shows the value of X (Rcosθ) and
the lower graph shows the the value of Y (Rsinθ).
The input impedance of the lock-in is 10 MΩ. The
Sine Out has an output impedance of 50Ω. Since
the Sine Output amplitude is specified into a high
impedance load, the output impedance does not
affect the amplitude.
The lock-in defaults to the internal oscillator reference set at 1.000 kHz. The reference mode (Intrnl)
and frequency are displayed at the bottom of the
screen. In this mode, the lock-in generates a synchronous sine output at the internal reference
frequency.
3. Connect the CH1 output on the front panel to
the DVM. Set the DVM to read DC Volts.
The sine amplitude is 1.000 Vrms and the
sensitivity is 1 V(rms). Since the phase shift of the
sine output is very close to zero, the upper display
(X) should read close to 1.000 V and the lower display (Y) should read close to 0.000 V.
The CH1 output defaults to X. The output voltage
is simply (X/Sensitivity - Offset)xExpandx10V. In
this case, X = 1.000 V, the sensitivity = 1 V, the
offset is zero percent and the expand is 1. The
output should thus be 10 V or 100% of full scale.
2-13
Page 26

Outputs, Offsets and Expands
4. Press [REF/PHASE]
Press <Sine Output>
Press [.] [5] [ENTER]
5. Press [OUTPUT/OFFSET]
Press <Auto Offset>
Display the Reference and Phase menu.
Highlight the sine output amplitude.
Enter an amplitude of 0.5 V. The top display
should show X=0.5 V and the CH1 output should
be 5 V on the DVM.
Display the Output and Offset menu. This menu
chooses which measured parameters or traces
are output on CH1 and CH2. In addition, the X, Y
and R offsets and expands are programmed in this
menu.
The Offset & Expand menu box displays the offset
and expand of either X, Y or R. In this case, the X
offset and expand is displayed. The <X,Y,R> softkey selects the which offset and expand is
displayed.
Auto Offset automatically adjusts the Xoffset (or Y
or R) such that X (or Y or R) becomes zero. The
offset should be about 50% in this case. Offsets
are useful for making relative measurements. In
analog lock-ins, offsets were generally used to
remove DC output errors from the lock-in itself.
The SR850 has no DC output errors and the offset
is not required for most measurements.
Press <Offset>
Press [4] [0] [ENTER]
Press <Expand>
Set the expand to 10 using the knob or the
numeric entry keys.
The offset affects both the displayed value of X
and any analog output proportional to X. The CH1
output should be zero in this case.
The highlighted OFFST indicator turns on at the
bottom left of the top display to indicate that the
displayed trace is affected by an offset.
Highlight the X offset.
Enter an offset of 40% of full scale. The output off-
sets are a percentage of full scale. The percentage does not change with the sensitivity. The displayed value of X should be 0.100 V (0.5 V - 40%
of full scale). The CH1 output voltage is
(X/Sensitivity - Offset)xExpandx10V.
CH1 Out = (0.5/1.0 - 0.4)x1x10V = 1 V
Highlight the X expand.
With an expand of 10, the display has one more
digit of resolution (100.XX mV).
2-14
Page 27

Outputs, Offsets and Expands
The highlighted EXPD indicator turns on at the
bottom left of the top display to indicate that the
displayed trace is affected by an expand.
The CH1 output is
(X/Sensitivity - Offset)xExpandx10V. In this case,
the output voltage is
CH1 Out = (0.5/1.0 - 0.4)x10x10V = 10V
The expand allows the output gain to be increased
by up to 256. The output voltage is limited to
10.9 V and any output which tries to be greater will
turn on the OUTPT overload indicator at the
bottom left of the screen.
With offset and expand, the output voltage gain
and offset can be programmed to provide control
of feedback signals with the proper bias and gain
for a variety of situations.
Offsets do add and subtract from the displayed
values while expand increases the resolution of
the display.
6. Connect the DVM to the X output on the rear
panel.
7. Connect the DVM to the CH1 output on the
front panel again.
Press <Expand>
Press [1] [ENTER]
The X and Y outputs on the rear panel always provide voltages proportional to X and Y (with offset
and expand). The X output voltage should be
10 V, just like the CH1 output.
The front panel outputs can be configured to
output different traces quantities while the rear
panel outputs always output X and Y.
Outputs proportional to X and Y (rear panel, CH1
or CH2) have 100 kHz of bandwidth. The CH1 and
CH2 outputs, when configured to be proportional
to R, θ, or a trace (even a trace defined as X or Y)
are updated at 512 Hz and have a 200 Hz bandwidth. It is important to keep this in mind if you use
very short time constants.
Let's change CH1 to a trace.
First, set the X expand back to 1.
Press <Offset>
Press [0] [ENTER]
Set the X offset back to 0.0%.
X Should be 0.500 V again and the CH1 output
2-15
Page 28

Outputs, Offsets and Expands
should be 5.0 V.
Press <Source>
Use the knob to select Trace1.
8. Press [TRACE/SCAN]
Press the second softkey, next to the trace
definition, to highlight the X.
Use the knob to change the numerator from X
to 1.
Press the second softkey twice to highlight the
denominator (C) of the trace definition.
Use the knob to change the denominator from
1 to X.
Highlight the CH1 source. The CH1 output is proportional to this source.
CH1 can be proportional to X, R, θ, or Trace 1-4.
Choose Trace 1. Trace 1 has a default definition of
X so the CH1 output should remain 5.0 V (but its
bandwidth is only 200 Hz instead of 100 kHz).
Display the Trace and Scan menu.
Traces are defined as A•B/C. The quantities A, B,
and C are selected from the various quantities
measured by the lock-in.
Trace 1 is defined as X by default. Let's change it
to 1/X.
Trace 1 is now 1•1/1 and the top display shows
1.000
Change the denominator.
Trace 1 is now defined as 1/X. The top display
shows Trace 1. The trace definition is shown at
the upper left of the top display. The trace units
are shown at the bottom center of the top display
(1/V).
Remember, X was 0.5V. Thus, 1/X is 1/0.5 = 2.0
(1/V). The display should show 2.0 (or very close).
Displays use the actual measured quantities to
calculate the value of a trace. If X was 5 mV, the
value of Trace 1 would be 1/5 mV or 200 (1/V).
Traces are calculated using Volts, degrees, and
Hz for the units of A, B and C.
The CH1 output voltage is 0.2V. This is because
trace output voltages are calculated using the
output voltages of the A, B and C quantities rather
than their displayed values. In this case, X=0.5V.
As an analog output voltage, this would be 5.0 V
(1/2 scale of 1V full scale sensitivity). The 1/X
output voltage is 1/5.0V or 0.2 V.
See the DC Outputs and Scaling discussion in the
Lock-In Basics section for more detailed
information.
2-16
Page 29

Scans and Sweeps
SCANS and SWEEPS
This measurement is designed to use the internal oscillator to explore some of the basic lock-in functions.
You will need BNC cables.
Specifically, you will measure the response of the line notch filters by sweeping the internal reference frequency and measuring the sine output. Traces and strip chart displays will be used to record X, Y, R and θ as the
signal is swept through the input notch filters.
1. Disconnect all cables from the lock-in. Turn
the power on while holding down the [←]
(backspace) key. Wait until the power-on tests
are completed.
2. Connect the Sine Out on the front panel to the
A input using a BNC cable.
When the power is turned on with the backspace
key depressed, the lock-in returns to its default
settings. See the Default Settings list in the Menu
section for a complete listing of the settings.
The display is the "normal" lock-in display. The
lock-in setup is displayed across the top of the
screen. The sensitivity, reserve, time constant,
prefilters and input configuration are all easily visible. Watch how these indicators change as you
change parameters. The upper numeric readout
and bar graph shows the value of X (Rcosθ) and
the lower graph shows the the value of Y (Rsinθ).
The input impedance of the lock-in is 10 MΩ. The
Sine Out has an output impedance of 50Ω. Since
the Sine Output amplitude is specified into a high
impedance load, the output impedance does not
affect the amplitude.
The lock-in defaults to the internal oscillator reference set at 1.000 kHz. The reference mode (Intrnl)
and frequency are displayed at the bottom of the
screen. In this mode, the lock-in generates a synchronous sine output at the internal reference
frequency.
3. Press [INPUT/FILTERS]
Press the <Line Notches> softkey until Both filters are selected.
The sine amplitude is 1.000 Vrms and the
sensitivity is 1 V(rms). Since the phase shift of the
sine output is very close to zero, the upper display
(X) should read close to 1.000 V and the lower display (Y) should read close to 0.000 V.
Display the Input and Filters menu. This menu
allows the input configuration to be changed.
With the line notch filters engaged, signal inputs at
60 (50) Hz and 120 (100) Hz are removed. Note
that the line filter indicators at the top of the screen
are both on.
2-17
Page 30

Scans and Sweeps
4. Press [DISPLAY/SCALE]
Press the <Type/Trace> softkey to select the
Trace number.
Use the knob to select Trace 3.
5. Press [REF/PHASE]
Press <Ref. Source>
Use the knob to select Internal Sweep.
6. Press <Sweep Menu>
Display the Display and Scale menu. This menu
configures and scales the different screen displays
and graphs.
Highlight the trace number for the Top Bar graph.
The SR850 acquires and displays data in the form
of traces. The default definitions for the 4 traces
are X, Y, R and θ. These definitions may be
changed.
Display the magnitude R (Trace 3) on the top
graph.
Display the Reference and Phase menu.
Choose internal reference frequency sweep. In
this mode, the SR850 will sweep the internal oscillator from a start to a stop frequency.
Set the sweep start and stop frequencies in this
submenu. Sweeps may be linear or logarithmic. In
this case, let's use a linear sweep.
Press <Start>
Press [4] [0] [ENTER].
Press <Stop>
Press [1] [6] [0] [ENTER].
7. Press [GAIN/TC]
Press <Time Constant> and use the knob to
select 10 ms.
Press <Synchronous> to select <200 Hz.
8. Press [TRACE/SCAN]
Highlight the start frequency.
Set the start frequency to 40 Hz. The reference
changes to 40.000 Hz as shown in the frequency
readout at the bottom center of the screen.
Highlight the stop frequency.
Set the stop frequency to 160 Hz.
Display the Gain and Time Constant menu.
Choose a short time constant so that the frequen-
cy can be swept in a reasonably short time.
Since the sweep frequencies are below 200 Hz,
you can take advantage of the synchronous filter
to remove the 2f component of the output without
using a long time constant.
Display the Trace and Scan menu. This menu
allows the trace definitions to be changed and the
scan (sweep) to be configured. Trace data is sampled and stored in the buffers at the sample rate.
Swept parameters (reference frequency in this
case) are also updated at the sample rate (immediately after the data is sampled). The scan time
2-18
Page 31

Scans and Sweeps
sets the amount of time the buffer will store and
the length of any sweep.
In this measurement, let's leave the trace definitions equal to the defaults and just change the
sample rate and scan time.
Press <Sample Rate>
Use the knob to select 32 Hz.
Press <Scan Length>
Press [1] [0] [0] [ENTER]
Press <1 Shot/Loop> to select 1 Shot.
Highlight the sample rate.
The trace data will be sampled at 32 Hz and
stored in the buffer. After each data point is
recorded, the reference frequency will be updated.
This determines the resolution of our data along
the time axis.
Highlight the scan length.
Set the scan length to 100 seconds (1:40). This
configures the data buffer to hold 3200 data points
(32 Hz sample rate x 100 second scan length).
The scan length is also the sweep time for the
internal frequency sweep. Sweeps are always
coordinated with the data acquisition. In this case,
the sweep range is 120 Hz (40 Hz to 160 Hz) and
will take 100 seconds and be updated 3200 times.
Each stored data point will represent a frequency
increment of 0.0375 Hz (120/3200).
Scans can repeat (Loop) or stop when finished (1
Shot). Let's take a single scan of data.
Now you're finally ready to start the scan.
9. Press [START/CONT]
The [START/CONT] key starts the scan and
sweep. The scan indicator at the bottom left corner
of the screen switches from STOP to Run 1 (single
scan in progress). The reference frequency read-
out at the bottom center displays the frequency
while sweeping.
As the frequency passes through 60 (50) Hz and
120 (100) Hz, the value of R should drop close to
zero as the signal sweeps through each input
notch filter.
When the scan is complete, the scan indicator
switches to DONE and the frequency should be
160 Hz.
Now let's try displaying the data in a more mean-
ingful way.
2-19
Page 32

Scans and Sweeps
10. Press [DISPLAY/SCALE]
Press <Format> to select Single.
Press <Type>
Use the knob to select Chart.
Press <Type> again to highlight the Trace
number. Use the knob to select Trace 3.
Press [AUTO SCALE]
11. Press the <± Range> softkey. This is the fifth
softkey from the top.
Use the knob to select 1.000 e0 (1 V) for the
range.
Press the <± Range> softkey again to highlight the center value (@).
Display the Display and Scale menu.
Choose a full screen display.
Highlight the display type (the default is polar).
Let's view the stored data on a chart graph.
To view R on the chart, you need to display Trace
3. The chart now displays R vs time (frequency).
Auto Scale the graph.
To manually adjust the graph scale, you change
the center value and range. Highlight the range
(±).
The graph displays a vertical scale equal to the
center value plus and minus the range. The range
can also be entered numerically to any value. The
knob adjusts the range in a 1-2-5 sequence.
Highlight the center value.
Press [0] [ENTER]
12. Press [CURSOR]
Use the knob to read specific data points from
the graph.
Press [CURSOR SETUP]
Set the center to zero.
The graph always displays the center and range
below the chart in the units of the trace being displayed. The default horizontal scale is 10 seconds
per division. This can be changed but let's leave it
since the entire scan fits perfectly on the screen.
This key activates the cursor. The knob now controls the cursor. The cursor coordinates are displayed at the top right of the chart. When the
cursor coordinates are surrounded by a box, the
cursor is active and the knob will move the cursor.
The cursor horizontal position is displayed in units
of seconds (time from the end of the scan) and the
vertical position is in the trace units. Since this is
an internal frequency sweep, let's read the frequency as the horizontal position.
Display the Cursor Setup menu. The cursor can
be configured in many different modes. The cursor
can be defined as a region where the marker
seeks the max or min within the region. Cursors
on split screen charts can also be linked together.
Press <Cursor Readout> twice to select
Fsweep.
Set the cursor display to show the frequency and
trace value of each data point. The reference fre-
2-20
Page 33

Scans and Sweeps
quency of each point is displayed in the cursor
coordinate display.
The graph shows all 3200 data points at once.
Since the screen resolution only has 640 pixels
across, each X-axis value must represent multiple
data points. The cursor reads the Max, Min or
Mean of the data points graphed at each X-axis
position.
Press <Cursor Seek> to select Min.
Use the knob to read the frequencies of the
notch filter zeroes or minimums.
13. Press [DISPLAY/SCALE]
Press <Type/Trace> to highlight the Trace
number again.
Use the knob to select Trace 1.
Use the knob to select Trace 2.
Use the knob to select Trace 4.
Press [AUTO SCALE].
To read the notch filter minimum frequencies,
select Min.
The cursor displays the frequency and trace value
of the smallest data point graphed at each horizontal X-axis position.
Show the Display and Scale menu again.
The SR850 can store up to 4 traces simultaneous-
ly. In the default configuration, all 4 traces are
stored. Let's take a look at the other traces.
Trace 1 is X. This corresponds to the real part of
the filter response.
Trace 2 is Y. This corresponds to the quadrature
part of the filter response (or derivative of X).
Trace 4 is θ. This is the phase response of the filters. The phase approaches 180° at the exact filter
notch frequencies and approaches zero at frequencies far from the notches. In many experiments, the phase (or quadrature) measurements
yield a far more exact measure of the actual resonant or peak frequency than R.
14. Press [PAUSE/RESET]
15. Press {START/CONT]
Pressing the [PAUSE/RESET] key while DONE
will reset the scan and sweep. The stored data is
lost and the scan indicator shows STOP again.
Swept parameters (frequency in this case) return
to their start values and the graph is blanked.
Let's take the data again, this time while displaying
the chart to show the scan data in progress.
The data scrolls in from the right. New points are
added at the right edge and the old points move to
the left. This is a strip chart type of graph.
The buffers can be configured for a single scan
(1 Shot) as in this measurement, or continuous
2-21
Page 34

Scans and Sweeps
looping (Loop). In the loop mode, scans repeat
indefinitely and the entire data buffer is filled at the
sample rate. When the end is reached, new points
are added at the beginning again, overwriting the
oldest data. This mode is convenient for always
storing the last buffer full of data. If something
worth saving occurs, simply pause the scan and
save, print or plot the data.
16. When the scan is complete, press
[TRACE/SCAN].
Press <1 Shot/Loop> to select Loop.
Press [PAUSE/RESET]
Press [START/CONT] to start the scan again.
17. Press [PAUSE/RESET] ONCE.
Press [START/CONT]
18. Press [DISPLAY/SCALE]
Display the Trace and Scan menu.
Choose the loop buffer.
Reset the scan and data buffer.
This time, the scan and sweep will repeat at the
end. The buffer is capable of storing 16000 points
(for 4 traces). Each scan is 3200 points so 5 complete sweeps can be stored in the buffer.
Pause the scan by pressing the [PAUSE/RESET]
key once while the scan is in progress. The scan
indicator shows PAUSE. Pressing this key again
will reset the data!!!
Resume the scan with [START/CONT] key.
Let the scan run for more than 100 seconds so
data scrolls past the left edge of the graph.
Show the Display and Scale menu.
Press <sec/div> (the last softkey).
Use the knob to select 20 S/div.
Highlight the horizontal chart scale.
Twice as much data will now be shown on the
graph. 2 complete sweeps can now be displayed
on the graph.
2-22
Page 35

The Disk Drive
USING THE DISK DRIVE
The disk drive on the SR850 may be used to store 3 types of files.
1. Data File
This includes the data in the active display trace. In addition to the data, the instrument state (sensitivity,
input configuration, time constant, reference, scan parameters, aux outputs) and the trace definition of
the stored trace are saved. Data files are recalled into the trace buffer of the active display. If the
present trace buffer is configured to hold less points than the stored trace, then points are recalled starting with the oldest point in the stored trace until the trace buffer is filled. The stored instrument state and
the trace definition of the recalled trace are recalled as well. When data is recalled from disk, the instrument state is changed to the state in effect when the data was stored!
2. ASCII Data File
This file saves the data in the active display trace in ASCII format. These files may not be recalled to the
display. This format is convenient when transferring data to a PC application. ASCII files are much
larger than the binary data file for the same trace.
3. Settings File
This files stores the lock-in settings. This includes the instrument state (see Data file) as well as the
system setup (printer, plotter, etc.) Recalling this file will change the lock-in setup to that stored in the
file.
The disk drive uses double-sided, double density (DS/DD) 3.5" disks. The disk capacity is 720k. The SR850
uses the DOS format. A disk which was formatted on a PC or PS2 (for 720k) may be used. Files written by
the SR850 may be copied or read on a DOS computer.
This measurement is designed to familiarize the user with the disk drive. We will use the internal oscillator to
provide a signal so that there is some data to save and recall. Specifically, you will save and recall a data file
and a settings file.
STORING AND RECALLING DATA
1. Disconnect all cables from the lock-in. Turn
the power on while holding down the [←]
(backspace) key. Wait until the power-on tests
are completed.
2. Connect the Sine Out on the front panel to the
A input using a BNC.
When the power is turned on with the backspace
key depressed, the lock-in returns to its default
settings. See the Default Settings list in the Menu
section for a complete listing of the settings.
The display is the "normal" lock-in display. The
lock-in setup is displayed across the top of the
screen. The upper numeric readout and bar graph
shows the value of X (Rcosθ) and the lower graph
shows the the value of Y (Rsinθ).
The input impedance of the lock-in is 10 MΩ. The
Sine Out has an output impedance of 50Ω. Since
the Sine Output amplitude is specified into a high
impedance load, the output impedance does not
affect the amplitude.
The lock-in defaults to the internal oscillator refer-
2-23
Page 36

The Disk Drive
ence set at 1.000 kHz. The reference mode (Intrnl)
and frequency are displayed at the bottom of the
screen. In this mode, the lock-in generates a synchronous sine output at the internal reference
frequency.
The sine amplitude is 1.000 Vrms and the
sensitivity is 1 V(rms). Since the phase shift of the
sine output is very close to zero, the upper display
(X) should read close to 1.000 V and the lower display (Y) should read close to 0.000 V.
3. Press [AUTO PHASE]
4. Press [DISPLAY/SCALE]
Press <Format> to select Single display.
Press <Type>
Use the knob to adjust the display type to
Chart.
5. Press [TRACE/SCAN]
Press <Scan Length>
Press [1] [0] [0] [ENTER]
Press <1 Shot/Loop> to select 1 Shot.
Automatically adjust the phase shift so that Y is
zero and X is equal to the magnitude.
Show the Display and Scale menu.
Change the screen to a full screen display.
Highlight the display type.
With the chart display, we can see the data stored
in the trace buffers.
Display the Trace and Scan menu.
Highlight the scan length.
Set the scan length to 100 seconds. At the default
sample rate of 1 Hz, this represents 100 points in
the scan.
Take one scan and then stop.
6. Press [REF/PHASE]
Press [START/CONT]
Press <Rotate 90 deg.> a few times during the
scan to generate some changes in the data.
7. Put a blank double-sided, double density
(DS/DD)3.5" disk into the drive.
Display the Reference and Phase menu.
Start the scan. The quantity X is sampled and
stored at a rate of 1 Hz. The trace buffer is
graphed on the chart display as the data is taken.
Each time the phase is shifted by 90°, the value of
X changes from (plus or minus) the signal amplitude to zero and back.
After 100 seconds, the scan will finish and we can
save the graph on disk.
Use a blank if disk if possible, otherwise any disk
that you don't mind formatting will do. Make sure
the write protect tab is off.
2-24
Page 37

The Disk Drive
8. Press [DISK]
Press <Disk Utils>
Press <Disk Format>
Press <Return>
Press <Data Save>
Press <File Name>
Press [ALT]
Press [D] [A] [T] [A] [1] [ALT]
Press <Data Save>
Display the Disk menu.
Choose Disk Utilities.
Make sure that the disk does not contain any infor-
mation that you want. Formatting the disk takes
about a minute.
Go back to the main Store and Recall menu.
Display the Data Save menu.
Now we need a file name.
[ALT] lets you enter the letter characters printed
below each key. The numbers function as normal.
Type a file name such as DATA1 (or any legal
DOS file name) and turn off the ALT mode.
This saves the trace data which is displayed on
the active display to disk using the file name specified above. If the entered file name has no extension, then the extension .85T is appended to the
file name.
9. Press [DISPLAY/SCALE]
Press <Type/Trace> twice to highlight the
trace number.
Use the knob to change the trace number to 2.
10. Press [DISK]
Press <Data Save>
Press <File Name>
All stored data points in the selected trace are
saved. Only the trace in the active display is
saved. In this case, only trace 1 (X) is saved, even
though the other traces have data stored.
In addition to the data, the instrument state (most
lock-in parameters, scan parameters, and the
active trace definition) is stored.
Let's change the display to show another trace.
The other traces are stored in the buffer and can
be displayed at any time.
This displays trace 2 (Y) on the chart so we can
save it also.
Display the Disk menu.
Choose the Data Save menu.
Save trace 2 (Y) using a new file name. This way
you can have multiple files in the disk catalog.
Press [ALT] [D] [A] [T] [A] [2] [ALT]
Use the file name DATA2 (or any legal DOS file
name) and turn off the ALT mode.
2-25
Page 38

The Disk Drive
Press <Data Save>
11. Press <Catalog> to select On.
Press <Return>
12. Press [PAUSE RESET]
13. Press <Data Recall>
Press <Catalog> to select On.
Use the knob to select the first file.
Save Trace 2.
Display the disk catalog. This display lists all of the
files on the disk. The files which you just saved
should appear in the catalog. Each file has a
name, extension, and type. The file type for binary
trace data is TRC.
Go back to the main Store and Recall menu.
Reset the scan. This clears the data buffers within
the lock-in.
Display the Data Recall menu.
Display the disk catalog. The 2 files which you just
saved should be listed.
The knob chooses a file in the catalog display.
Let's recall the X data (the file made by saving
Trace 1).
Press <Data Recall>
14. Press [DISPLAY/SCALE]
This recalls the data file from disk and stores it in
the active display trace. The active display trace is
redefined to agree with the recalled data trace definition. In this case, the data is recalled into Trace
2 (since it is currently being shown on the active
display). Trace 2 becomes defined as X since that
is the trace definition of the recalled data.
Data acquisition is paused so no new data will be
taken.
If the active display is not a chart, the data is still
recalled into the trace which is shown by the active
display. For example, if the active display is a bar
graph showing Trace 2, then the recalled data fills
Trace 2. The trace is redefined to agree with the
recalled data and the bar graph will show the
present value of the redefined trace.
Data files may not be recalled into traces which
are not presently being stored.
Show the Display and Scale menu.
Press <Format> to select Up/Down
Press<Type>
Choose the dual display format.
Highlight the Top display type.
2-26
Page 39

The Disk Drive
Use the knob to select the Chart display.
Press <Full, Top or Bottom> to select Bottom.
Use the knob to select the Chart display for
the bottom display.
Press [AUTO SCALE]
Display two charts.
Select the bottom display. The bottom display type
should be highlighted.
Both displays should be charts.
Auto scale the bottom display. The [AUTO
SCALE] will scale the active display. In this case,
the bottom display is active since we just changed
it. The active display shows its trace number in
inverse at the upper left of the display.
Note that both Trace 1 (top) and Trace 2 (bottom)
are defined as X. Trace 2 is the recalled X data.
Trace 1, which was empty before the data was
recalled, has been filled with zeroes so that its
length agrees with the recalled trace.
All stored traces must have the same length. If the
recalled data trace has less points than existing
traces in memory, then the recalled trace is
padded with zeroes until it is the same length. If
the recalled data has more points than the existing
traces in memory (as was the case here), the
existing traces are padded with zeroes until they
are the same length as the recalled trace. Data is
never destroyed in the recall process.
Press [ACTIVE DISPLAY]
15. Press [DISK]
Press <Data Recall>
Press <Catalog> to select On.
Use the knob to select the second file.
If the recalled trace has more points than the existing trace buffer allocation (16k points for 4 stored
traces, 32k points for 2 stored traces, or 64k points
for 1 stored trace), then as many points are
recalled as will fit in the existing trace buffer. The
other existing traces are either padded with zeroes
or left alone, depending upon how many points are
presently stored.
Make the top display active. The top display trace
number should be highlighted at the upper left of
the top display. This makes Trace 1 the active display trace.
Let's recall the stored Y trace into Trace 1.
Display the Data Recall menu.
Display the disk catalog.
The knob chooses a file in the catalog display.
Let's recall the Y data (the file made by saving
Trace 2).
2-27
Page 40

The Disk Drive
Press <Data Recall>
Press [AUTO SCALE]
This recalls the data file from disk and stores it in
the active display trace. The active display trace is
redefined to agree with the recalled data trace def-
inition. In this case, the data is recalled into Trace
1 (since it is currently being shown on the active
display). Trace 1 becomes defined as Y since that
is the trace definition of the recalled data.
The existing data in Trace 2 (bottom display) is not
changed.
Auto Scale the top display.
In general, the existing lock-in state may not agree
with the state stored in the recalled data file. In this
case, the lock-in state is also recalled along with
the data. Existing data in other traces is not
destroyed but may lose their meaning given the
new lock-in state. For example, if the existing data
sample rate is 1 Hz and data is stored in the
traces, recalling a data file whose data was stored
at 2 Hz will change the sample rate to 2 Hz. The
existing data is not destroyed but will be displayed
as if the data was sampled at 2 Hz. If the state
was not recalled with the data, then the recalled
data would have no meaning. This way, the
recalled data is meaningful. Existing data is pre-
sumably more easily recaptured and can also be
saved if important.
2-28
Page 41

STORING AND RECALLING SETTINGS
The Disk Drive
1. Turn the lock-in on while holding down the [←]
(backspace) key. Wait until the power-on tests
are completed. Disconnect any cables from
the lock-in.
2. Press [GAIN/TC]
Press <Sensitivity>
Use the knob to change the sensitivity to
100 mV.
Press <Time Constant>
Use the knob to select 1 S.
3. Press [DISK]
Press <Settings Save>
Press <File Name>
When the power is turned on with the backspace
key depressed, the lock-in returns to its default
settings. See the Default Settings list in the Menu
section for a complete listing of the settings.
Change the lock-in setup so that we have a nondefault setup to save.
Show the Gain and Time Constant menu.
Highlight the full scale sensitivity.
Select 100 mV.
Highlight the time constant.
Select 1 second.
Display the Disk menu.
Choose the Settings Save menu.
Now we need a file name.
Press [ALT]
Press [T] [E] [S] [T] [1] [ALT]
Press <Settings Save>
4. Turn the lock-in off and on while holding down
the [←] (backspace) key. Wait until the poweron tests are complete.
Press [GAIN/TC]
5. Press [DISK]
Press <Settings Recall>
[ALT] lets you enter the letters printed below each
key. The numbers function as normal.
Type a file name such as TEST1 (or any legal
DOS file name) and turn off the ALT mode.
This saves the setup to disk using the file name
specified above. If the entered file name has no
extension, then the extension .85S is appended to
the file name.
Change the lock-in setup back to the default
setup. Now let's recall the lock-in setup that we
just saved.
Check that the sensitivity and time constant are 1V
and 100 ms (default values).
Display the Disk menu.
Choose the Settings Recall menu.
2-29
Page 42

The Disk Drive
Press <Catalog>
Use the knob to select the settings file which
you just saved.
6. Press <Settings Recall>
Press [GAIN/TC]
Display the disk catalog listing. Note that settings
files have the file type SET.
When the disk catalog is displayed, the knob high-
lights a file. Use the knob to choose the file TEST1
to recall.
This recalls the settings from the file TEST1. The
lock-in settings are changed to those stored in
TEST1.
The sensitivity and time constant should be the
same as those in effect when you created the file.
Settings files store the lock-in state (sensitivity,
time constant, reference, etc.), the display setup
(display format, type, trace parameters, etc.) as
well as the system setup (plotter, printer, interface
settings, etc.).
2-30
Page 43

Aux Outputs and Inputs
AUX OUTPUTS and INPUTS
This measurement is designed to illustrate the use of the Aux Outputs and Inputs on the rear panel. You will
need BNC cables and a digital voltmeter (DVM).
Specifically, you will set the Aux Output voltages and measure them with the DVM. These outputs will then be
connected to the Aux Inputs to simulate external DC voltages which the lock-in can measure.
1. Disconnect all cables from the lock-in. Turn
the power on while holding down the [←]
(backspace) key. Wait until the power-on tests
are completed.
2. Connect Aux Out 1 on the rear panel to the
DVM. Set the DVM to read DC volts.
3. Press [AUX OUTPUTS]
Press <Voltage>
Press [1] [0] [ENTER]
Press [-] [5] [ENTER]
When the power is turned on with the backspace
key depressed, the lock-in returns to its default
settings. See the Default Settings list in the Menu
section for a complete listing of the settings.
The 4 Aux Outputs can provide programmable
voltages between -10 and +10 volts. The outputs
can be a fixed voltage or they can sweep with the
scan.
Display the Aux Output menu.
Highlight the output voltage of Aux Out 1.
Change the output to 10V. The DVM should dis-
play 10.0 V. The knob can also be used to adjust
the voltages.
Change the output to -5V. The DVM should display -5.0 V.
The 4 outputs are useful for controlling other
parameters in an experiment, such as pressure,
temperature, wavelength, etc.
4. Press [DISPLAY/SCALE]
Press <Monitor> to select Input/Output.
Show the Display and Scale menu.
Change the monitor display at the top of the
screen to show the Aux Inputs (A1, A2, A3 and
A4).
The Aux Inputs can read 4 analog voltages. These
inputs are useful for monitoring and measuring
other parameters in an experiment, such as pressure, temperature, position, etc.
We'll use Aux Out 1 to provide an analog voltage
to measure.
2-31
Page 44

Aux Outputs and Inputs
5. Disconnect the DVM from Aux Out 1. Connect
Aux Out 1 to Aux In 1 on the rear panel.
6. Press [TRACE/SCAN]
Press the second softkey, next to the trace
definition, to highlight the X.
Use the knob to change the A parameter from
X to AI1.
Press [AUTO SCALE]
The A1 monitor should now display -5 V. The monitor display shows all 4 Aux Inputs. To display and
save the Aux Input values, a trace needs to be
defined to measure an Aux Input.
Display the Trace and Scan menu.
Trace 1 is defined as X. Let's change it to Aux
Input 1.
The Aux Inputs are abbreviated AI1, AI2, AI3 and
AI4. Trace 1 is now defined as AI1. The top graph
shows trace 1 and should display -5.0 V.
The traces can measure Aux Inputs directly. In
addition, these inputs can be used to multiply or
divide other quantities (such as X, Y or R) for ratio
normalization or gain modulation.
Auto Scale the top bar graph.
Now let's setup a voltage sweep on Aux Output 1.
7. Press <Scan Length>
Press [1] [0] [0] [ENTER]
8. Press [AUX OUTPUTS]
Press <Fixed / Log / Linear> twice to select
Linear.
Press <Start>
Press [1] [ENTER]
Press <Stop>
Press [5] [ENTER]
Highlight the scan length.
Set the scan time to 100 seconds. The sample
rate is 1 Hz so the scan is 100 samples long.
Display the Aux Output menu again.
Choose a linear sweep for Aux Output 1. Each
Aux Output may be swept in voltage in either log
or linear fashion.
Highlight the start voltage.
Enter 1 V for the start voltage. The Aux 1 output
changes to 1 V since data acquisition is stopped
right now. All swept parameters return to their start
values when a scan is stopped.
Highlight the stop voltage.
Enter 5 V for the stop voltage.
The offset voltage is used to offset the sweep with-
out changing the start and stop. For log (exponential) sweeps, the offset allows much more flexibility
in defining the range and acceleration of a sweep.
9. Press [START/CONT]
Start the scan. Aux Out 1 will linearly ramp from
2-32
Page 45

Aux Outputs and Inputs
1 V to 5 V in 100 seconds updating every second.
The output voltage is measured on Aux In 1,
recorded in Trace 1 and displayed on the top
graph.
10. Press [DISPLAY/SCALE]
Press <Type / Trace> to highlight the type of
the top display.
Use the knob to change the display type to
Chart.
Show the Display and Scale menu.
The top display is a bar graph. Let's change it to a
chart to show the history of Aux In 1.
The chart display shows the history of the sweep.
The SR850 can be used as a general purpose 4
channel digital chart recorder. The displays can be
scaled vertically and horizontally with full cursor
readouts. Data can be stored on disk and output to
a printer or plotter.
2-33
Page 46

Aux Outputs and Inputs
2-34
Page 47

Trace Math
TRACE MATH
This example is designed to familiarize the user with the trace math functions in the lock-in. You will need
BNC cables and a 50Ω terminator.
Specifically, you will record the input noise in a trace and perform various calculations with the trace. The
internal oscillator will also be used to provide signal data for curve fits.
There are a few points to remember about the trace math functions.
Math functions may only be performed on trace data which is stored in a trace buffer and displayed in
the active chart display. Data which are not within the time window of the chart are not operated upon. Use
the horizontal chart scale to select the size of the time window and move the cursor to pan the window to the
desired portion of the trace buffer. Data which exceeds the upper or lower display range of the graph are, of
course, operated upon.
The amount of time a math function takes to complete depends upon its complexity and the number of data
points which are operated on. For example, 25-point smoothing takes longer than 5-point smoothing while
each type of smoothing takes longer the more points there are. Do not operate on more points than
necessary.
Math functions can only be performed while data acquisition is stopped, either by pausing or finishing a scan.
Some math operations change the stored trace data. Resuming a scan after smoothing, for example, will
result in a trace where a region of the trace is smoothed and other regions are not.
1. Disconnect all cables from the lock-in. Turn
the power on while holding down the [←]
(backspace) key. Wait until the power-on tests
are completed.
2. Connect a 50Ω terminator to the A input.
When the power is turned on with the backspace
key depressed, the lock-in returns to its default
settings. See the Default Settings list in the Menu
section for a complete listing of the settings.
The display is the "normal" lock-in display. The
lock-in setup is displayed across the top of the
screen. The upper numeric readout and bar graph
shows the value of X (Rcosθ) and the lower graph
shows the the value of Y (Rsinθ).
The input impedance of the lock-in is 10 MΩ. The
terminator effectively provides a short at the input
so that the input noise is predominantly the voltage noise of the input transistors.
The lock-in defaults to the internal oscillator reference set at 1.000 kHz. All measurements will be
made at 1 kHz in this example.
3. Press [GAIN/TC]
Press <Sensitivity>
Display the Gain and Time Constant menu.
Highlight the sensitivity.
2-35
Page 48

Trace Math
Use the knob to select 50 nV.
4. Press [TRACE/SCAN]
Press <Sample Rate>
Use the knob to change the sample rate to
16 Hz.
5. Press [DISPLAY/SCALE]
Press <Format> to select Single.
Press <Type>
Use the knob to select Chart.
Press <± Range>
To measure the input noise, we need to use an
appropriate sensitivity.
Display the Trace and Scan menu.
Since the time constant is 100 ms, we need a
sample rate greater than 1 Hz to record the output.
Choose 16 Hz as the sample rate.
Leave the scan mode on Loop. Data will be
recorded indefinitely with the trace buffer storing
the last 16k (1000 seconds) of data.
Show the Display and Scale menu.
Use a full screen display.
Highlight the display type.
Math functions require a chart display.
Highlight the chart range.
Press [5] [0] [EXP] [-] [9] [ENTER]
Press <sec/Div> (the last softkey).
Use the knob to select 5.0 S/Div.
6. Press [START/CONT]
Wait until the data fills the graph (50 sec) and
data starts scrolling past the left edge.
Press [PAUSE/CONT]
7. Press [MATH]
Press <Stats>
Press <Do Stats>
Enter 50 nV for the chart range.
Highlight the horizontal time scale.
Change the scale to 5.0 S/Div so 50 seconds of
data will fill the graph.
Start the scan. The X output is recorded on the
chart display. The chart shows the last 50 seconds
of data. The graph should be a noisy trace about 2
divisions peak to peak.
Pause the data acquisition. No new data is recorded and the graph stops scrolling to the left.
Display the Math menu.
Choose the Statistics menu.
The mean, standard deviation, total and time
span are calculated for the data between the left
and right limits. The limits are shown as vertical
heavy dashed lines. The limits default to the left
2-36
Page 49

Trace Math
and right edge of the graph display. In this case,
50 seconds of data (800 data points at 16 Hz
sample rate).
The results are displayed at the bottom of the
screen. The standard deviation (σ)should be about
6 nV or so. This is the rms noise of the input in a
noise equivalent bandwidth of 1.2 Hz (100 ms, 12
dB/oct time constant). The input noise (in Volts/
√Hz) is thus the standard deviation divided by the
square root of 1.2 Hz.
The lock-in can measure noise directly in V/√Hz,
this measurement is meant to illustrate the statistical functions.
Press <Return> twice.
8. Press <Smooth>
Press <17 point>
Press [CURSOR]
Use the knob to move the cursor past the left
edge of the graph. The data will scroll to the
right to display unsmoothed portions of the
trace.
Press <Return>
8. Press <Calc>
Return to the main Math menu.
Choose the Smoothing menu.
Perform 17 point smoothing on the noisy data. The
data should become less noisy and smoother.
Smoothing reduces narrow variations in the data.
Let the knob move the cursor.
The smoothing operation changed the data within
the time window of the graph. Data which was not
displayed was not smoothed. This trace now contains a region which has been smoothed and a
region which is untouched.
Smoothing changes the data in the buffer and the
original unsmoothed points are lost.
Return to the main Math menu.
Choose the Calculator menu.
Press <Operation>
Use the knob to select x2.
Press <Do Calc.>
Press [AUTO SCALE]
Use the knob to select √.
Highlight the operation.
Let's square the data.
Calculations are performed on all of the data
within the time window of the graph. Let the calcu-
lation finish.
X squared is a positive quantity. The magnitude of
the data is now 10
view the data.
Select square root.
-18
so auto scale is required to
2-37
Page 50

Trace Math
Press <Do Calc.>
Press [AUTO SCALE]
Use the knob to select log10.
Press <Do Calc.>
Use the knob to select ❊.
Press <Argument Type> to select Constant.
Press <Constant Value>
Press [2] [0] [ENTER]
Press <Do Calc.>
Press [AUTO SCALE]
Press [CURSOR]
Use the knob to read points from the graph.
The net effect is to take the absolute value of X.
Let the calculation finish.
The magnitude of the data is back to 10-9.
Take the log of |X|.
Let the calculation finish.
Let's multiply the data by something.
Multiply the data by a constant.
Highlight the constant value.
Enter 20.
The final data is 20log|X| which results in a graph
of X scaled in dBV. Let the calculation finish.
Auto scale the graph.
Activate the cursor.
The values of the data should be in the range
below -160 dBV and below.
9. Press [PAUSE/RESET]
10. Press [DISPLAY/SCALE]
Press <Format> to select Up/Down.
11. Press [GAIN/TC]
Press <Sensitivity>
Use the knob to change the sensitivity to 1V.
Press <Time Constant>
Use the knob to change the time constant to
3S.
Press <Filter db/oct.> until 6 db is selected.
12. Press [TRACE/SCAN]
Press <Scan Length>
Clear the data buffers for the next measurement.
Show the Display and Scale menu.
Display the bar graphs.
Display the Gain and Time Constant menu.
Highlight the sensitivity.
Change the sensitivity to measure the Sine Out.
Highlight the time constant.
Use a long time constant.
Choose the simplest filter response.
Show the Trace and Scan menu.
Highlight the scan length.
Press [5] [0] [ENTER]
Enter a scan length of 50 seconds.
2-38
Page 51

Trace Math
Press <1 Shot/Loop> to select 1 Shot.
13. Connect the Sine Out to the A input using a
BNC cable.
Wait until the value of X reaches 1 V.
14. Press [DISPLAY/SCALE]
Press <Format> to select Single.
Press the <± Range> softkey. This is the fifth
softkey from the top.
Press [1] [ENTER]
Stop data acquisition after the scan is complete.
The input impedance of the lock-in is 10 MΩ. The
Sine Out has an output impedance of 50Ω. Since
the Sine Output amplitude is specified into a high
impedance load, the output impedance does not
affect the amplitude.
The sine amplitude is 1.000 Vrms and the
sensitivity is 1 V(rms). Since the phase shift of the
sine output is very close to zero, the upper display
(X) should read close to 1.000 V and the lower display (Y) should read close to 0.000 V.
Show the Display and Scale menu.
Display the full screen chart again.
Set the chart scale.
Set the range to ±1 V.
Press the <± Range> softkey again to highlight the center (@) value.
Press [0] [ENTER]
15. Press [START/CONT] and after about 10 sec-
onds, remove the cable from the A input.
16. Press [MATH]
Press <Fit>
Press <Fit Type> to select Exp.
Set the chart center.
Set the chart center to zero.
Start the scan. When the cable is removed, the
value of X should decrease to zero over the next
15 seconds or so.
Wait until the scan finishes. When the scan is finished, the DONE indictor at the bottom left of the
screen will switch on.
The graph should be an exponential decay starting
when the cable was removed from the input. Let's
fit a curve to this data.
Display the Math menu.
Choose the Fit menu.
Choose exponential fit.
Press [CURSOR]
Use the knob to position the cursor at the point
where the signal starts to decay.
Activate the cursor.
Use the cursor to determine the graph region over
which the curve fit will be calculated.
2-39
Page 52

Trace Math
Press <Left Limit>
Use the knob to position the cursor 3 divisions
to the right of the left limit.
Press <Right Limit>
Move the cursor farther to the right.
Press <Do Fit>
Set the left limit of the region at the start of the
signal decay.
Select the smallest region which covers the signal
decay.
Set the right limit.
The fit region is between the two limit marks (verti-
cal heavy dashed lines). Only the data between
the limits is used to calculate the fit.
Curve fit calculations can take a long time if the fit
region encompasses a lot of data points. Try to
use the smallest region possible when performing
fits.
The curve fit uses a multi-iteration chi-squared
minimization technique. After each iteration, the
value of chi2 is displayed at the bottom of the
screen. Pressing the last softkey during the fit will
terminate the calculation after the current iteration.
The fit parameters are displayed in a window in
the center of the screen. The decay parameter b
should be 3 seconds (6 db time constant).
17. Press any key to continue.
Press any key to continue.
18. Press <Fit Type> twice to select Line.
Press <Do Fit>
Press any key to continue.
Press any key to continue.
19. Press [DISPLAY/SCALE]
Press <S/Div>
Use the knob to change the horizontal time
scale to 1 S/Div.
Press [CURSOR]
The first time a key is pressed, the parameter
window is removed. The curve fit is plotted over
the data on the graph.
The next key removes the curve fit from the graph.
Try fitting a line to this region.
Fit a line to this region.
Remove the parameter window. The calculated fit
is terrible of course.
Remove the curve fit.
Show the Display and Scale menu.
Highlight the horizontal scale.
Zoom in on the graph.
Activate the cursor.
2-40
Page 53

Trace Math
Move the cursor past the left edge of the
graph to pan the data window until the signal
decay becomes visible again.
20. Press [MATH]
Press <Fit>
Press <View Params>
Press any key to continue.
Press any key to continue.
Scroll the data to show the signal decay region.
Go back to the Math menu.
Choose the Fit menu.
View the most recent fit. The most recent fit is
stored in memory and can be viewed again.
Remove the parameter window so that the plotted
fit can be seen. The fit is now being displayed at a
different graph scale than before. Details on the
quality of the fit can be examined up close.
Remove the fit from the graph.
The math functions are very powerful data analy-
sis tools. Together with the flexible trace definitions, the SR850 can perform complex data acquisition and analysis tasks.
2-41
Page 54

Trace Math
2-42
Page 55
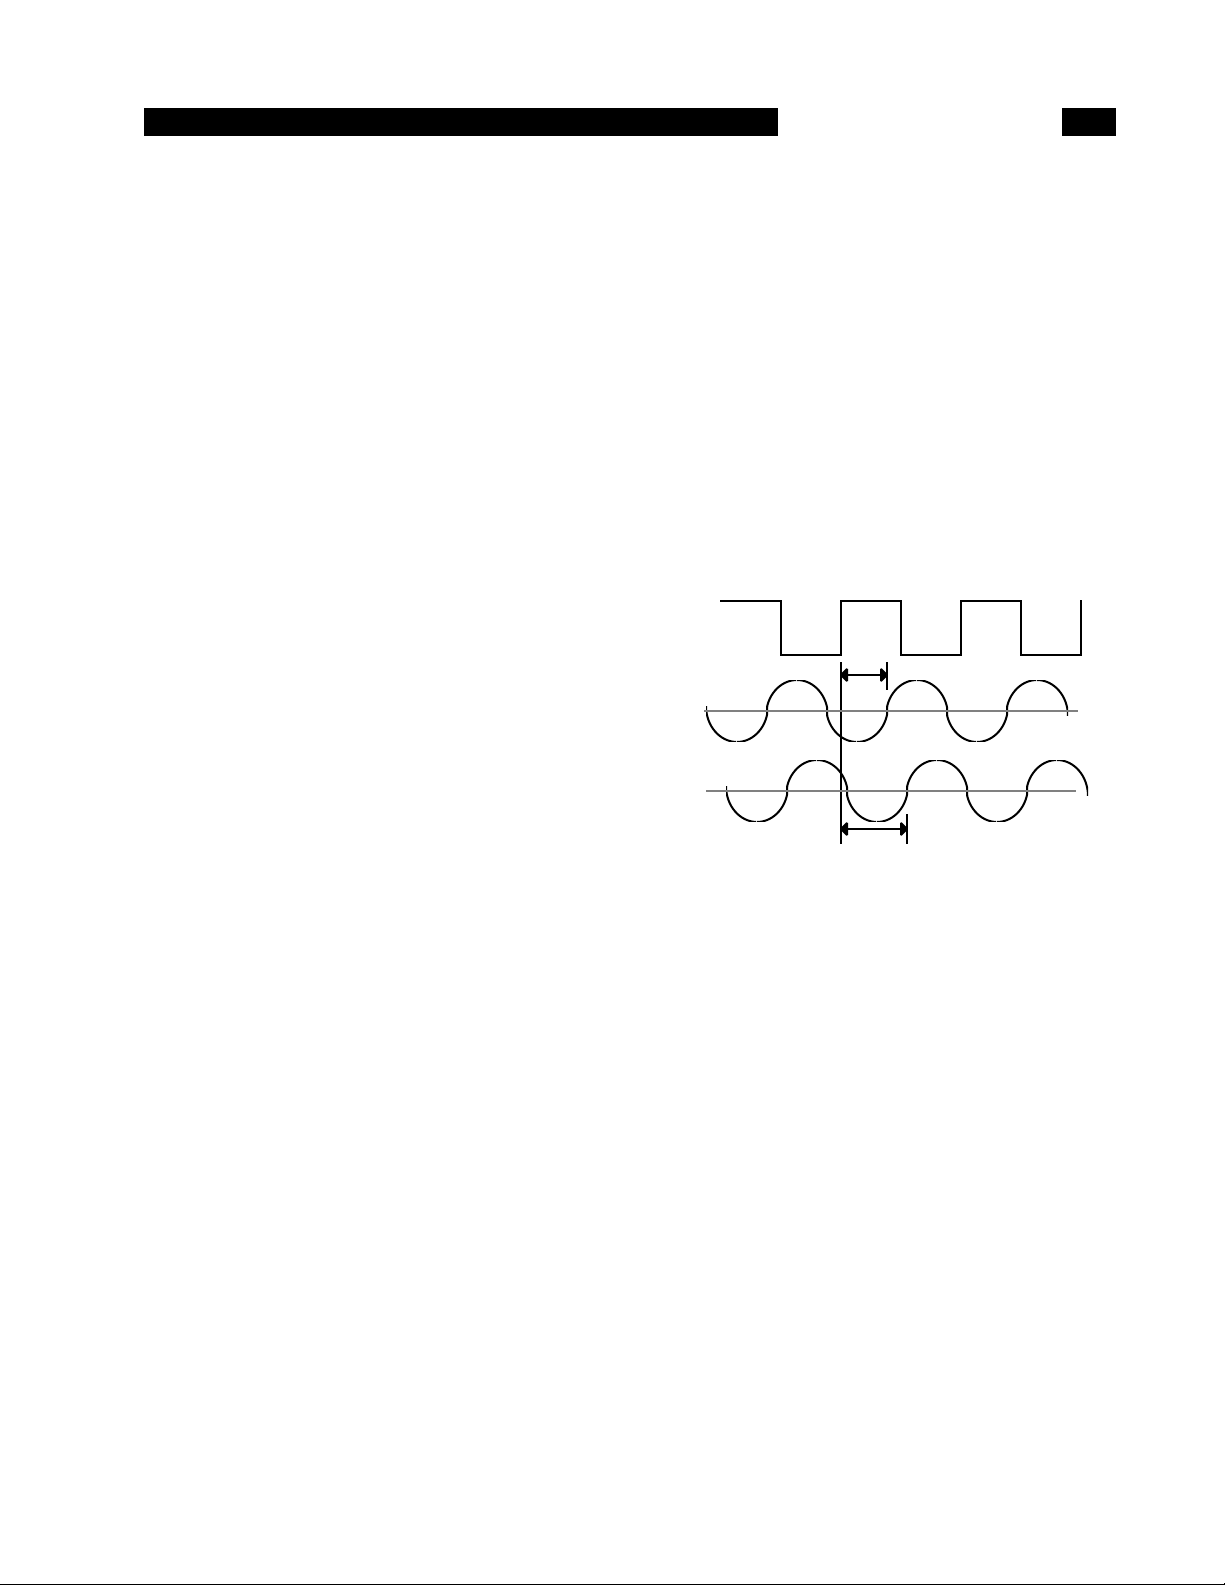
WHAT IS A LOCK-IN AMPLIFIER?
SR850 BASICS
Lock-in amplifiers are used to detect and measure
very small AC signals - all the way down to a few
nanovolts! Accurate measurements may be made
even when the small signal is obscured by noise
sources many thousands of times larger.
Lock-in amplifiers use a technique known as
phase-sensitive detection to single out the component of the signal at a specific reference frequency
AND phase. Noise signals at frequencies other
than the reference frequency are rejected and do
not affect the measurement.
Why use a lock-in?
Let's consider an example. Suppose the signal is a
10 nV sine wave at 10 kHz. Clearly some amplification is required. A good low noise amplifier will
have about 5 nV/√Hz of input noise. If the amplifier
bandwidth is 100 kHz and the gain is 1000, then
we can expect our output to be 10 µV of signal
(10 nV x 1000) and 1.6 mV of broadband noise
(5 nV/√Hz x √100 kHz x 1000). We won't have
much luck measuring the output signal unless we
single out the frequency of interest.
If we follow the amplifier with a band pass filter
with a Q=100 (a VERY good filter) centered at
10 kHz, any signal in a 100 Hz bandwidth will be
detected (10 kHz/Q). The noise in the filter pass
band will be 50 µV (5 nV/√Hz x √100 Hz x 1000)
and the signal will still be 10 µV. The output noise
is much greater than the signal and an accurate
measurement can not be made. Further gain will
not help the signal to noise problem.
Now try following the amplifier with a phasesensitive detector (PSD). The PSD can detect the
signal at 10 kHz with a bandwidth as narrow as
0.01 Hz! In this case, the noise in the detection
bandwidth will be only 0.5 µV (5 nV/√Hz x √.01 Hz
x 1000) while the signal is still 10 µV. The signal to
noise ratio is now 20 and an accurate measurement of the signal is possible.
What is phase-sensitive detection?
Lock-in measurements require a frequency reference. Typically an experiment is excited at a fixed
frequency (from an oscillator or function generator)
and the lock-in detects the response from the
experiment at the reference frequency. In the diagram below, the reference signal is a square wave
at frequency ωr. This might be the sync output
from a function generator. If the sine output from
the function generator is used to excite the experiment, the response might be the signal waveform
shown below. The signal is V
where V
The SR850 generates its own sine wave, shown
as the lock-in reference below. The lock-in reference is VLsin(ωLt + θ
The SR850 amplifies the signal and then multiplies
it by the lock-in reference using a phase-sensitive
detector or multiplier. The output of the PSD is
simply the product of two sine waves.
V
psd
The PSD output is two AC signals, one at the difference frequency (ωr - ωL) and the other at the
sum frequency (ωr + ωL).
If the PSD output is passed through a low pass
filter, the AC signals are removed. What will be
left? In the general case, nothing. However, if ω
equals ωL, the difference frequency component
will be a DC signal. In this case, the filtered PSD
output will be
V
psd
is the signal amplitude.
sig
Reference
θ
Signal
Lock-in Reference
= V
= 1/2 V
= 1/2 V
sigVL
1/2 V
sin(ωrt + θ
cos([ωr - ωL]t + θ
sigVL
cos([ωr + ωL]t + θ
sigVL
cos(θ
sigVL
ref
sig
θ
).
ref
sig
sig
)sin(ωLt + θ
- θ
ref
sig
)
sin(ωrt + θ
)
ref
- θ
+ θ
ref
) -
ref
sig
sig
sig
)
)
r
3-1
Page 56

SR850 Basics
This is a very nice signal - it is a DC signal proportional to the signal amplitude.
Narrow band detection
Now suppose the input is made up of signal plus
noise. The PSD and low pass filter only detect signals whose frequencies are very close to the lockin reference frequency. Noise signals at frequencies far from the reference are attenuated at the
PSD output by the low pass filter (neither ω
ω
ref
nor ω
noise+ωref
are close to DC). Noise at fre-
noise
quencies very close to the reference frequency will
result in very low frequency AC outputs from the
PSD (|ω
noise-ωref
| is small). Their attenuation
depends upon the low pass filter bandwidth and
roll-off. A narrower bandwidth will remove noise
sources very close to the reference frequency, a
wider bandwidth allows these signals to pass. The
low pass filter bandwidth determines the bandwidth of detection. Only the signal at the reference
frequency will result in a true DC output and be
unaffected by the low pass filter. This is the signal
we want to measure.
Where does the
lock-in reference come from?
We need to make the lock-in reference the same
as the signal frequency, i.e. ωr = ωL. Not only do
the frequencies have to be the same, the phase
between the signals can not change with time, otherwise cos(θ
be a DC signal. In other words, the lock-in reference needs to be phase-locked to the signal
reference.
sig
- θ
) will change and V
ref
psd
will not
sync) which is always phase-locked to the reference oscillator.
Magnitude and phase
Remember that the PSD output is proportional
to V
difference between the signal and the lock-in reference oscillator. By adjusting θ
equal to zero, in which case we can measure V
-
(cosθ=1). Conversely, if θ is 90°, there will be no
output at all. A lock-in with a single PSD is called a
single-phase lock-in and its output is V
This phase dependency can be eliminated by
adding a second PSD. If the second PSD multiplies the signal with the reference oscillator shifted
by 90°, i.e. VLsin(ωLt + θ
tered output will be
V
V
Now we have two outputs, one proportional to
cosθ and the other proportional to sinθ. If we call
the first output X and the second Y,
X = V
these two quantities represent the signal as a
vector relative to the lock-in reference oscillator. X
is called the 'in-phase' component and Y the
'quadrature' component. This is because when
θ=0, X measures the signal while Y is zero.
cosθ where θ = (θ
sig
= 1/2 V
psd2
~ V
psd2
cosθ Y = V
sig
sig
sigVL
sinθ
- θ
sig
ref
sin(θ
sig
). θ is the phase
ref
we can make θ
ref
+ 90°), its low pass fil-
- θ
ref
)
sig
sinθ
sig
sig
cosθ.
Lock-in amplifiers use a phase-locked-loop (PLL)
to generate the reference signal. An external reference signal (in this case, the reference square
wave) is provided to the lock-in. The PLL in the
lock-in locks the internal reference oscillator to this
external reference, resulting in a reference sine
wave at ωr with a fixed phase shift of θ
. Since
ref
the PLL actively tracks the external reference,
changes in the external reference frequency do
not affect the measurement.
All lock-in measurements
require a reference signal.
In this case, the reference is provided by the excitation source (the function generator). This is
called an external reference source. In many situations, the SR850's internal oscillator may be used
instead. The internal oscillator is just like a function generator (with variable sine output and a TTL
By computing the magnitude (R) of the signal
vector, the phase dependency is removed.
R = (X2 + Y2)
1/2
= V
sig
R measures the signal amplitude and does not
depend upon the phase between the signal and
lock-in reference.
A dual-phase lock-in, such as the SR850, has two
PSD's, with reference oscillators 90° apart, and
can measure X, Y and R directly. In addition, the
phase θ between the signal and lock-in reference,
can be measured according to
θ = tan-1 (Y/X)
3-2
Page 57

WHAT DOES A LOCK-IN MEASURE?
SR850 Basics
So what exactly does the SR850 measure?Fourier's theorem basically states that any
input signal can be represented as the sum of
many, many sine waves of differing amplitudes,
frequencies and phases. This is generally considered as representing the signal in the "frequency
domain". Normal oscilloscopes display the signal
in the "time domain". Except in the case of clean
sine waves, the time domain representation does
not convey very much information about the various frequencies which make up the signal.
What does the SR850 measure?
The SR850 multiplies the signal by a pure sine
wave at the reference frequency. All components
of the input signal are multiplied by the reference
simultaneously. Mathematically speaking, sine
waves of differing frequencies are orthogonal, i.e.
the average of the product of two sine waves is
zero unless the frequencies are EXACTLY the
same. In the SR850, the product of this multiplication yields a DC output signal proportional to the
component of the signal whose frequency is exactly locked to the reference frequency. The low pass
filter which follows the multiplier provides the averaging which removes the products of the reference
with components at all other frequencies.
The SR850, because it multiplies the signal with a
pure sine wave, measures the single Fourier (sine)
component of the signal at the reference frequency. Let's take a look at an example. Suppose the
input signal is a simple square wave at frequency
f. The square wave is actually composed of many
sine waves at multiples of f with carefully related
amplitudes and phases. A 2V pk-pk square wave
can be expressed as
lowing the multiplier. This "bandwidth narrowing" is
the primary advantage that a lock-in amplifier provides. Only inputs at frequencies at the reference
frequency result in an output.
RMS or Peak?
Lock-in amplifiers as a general rule display the
input signal in Volts RMS. When the SR850 displays a magnitude of 1V (rms), the component of
the input signal at the reference frequency is a
sine wave with an amplitude of 1 Vrms or
2.8 V pk-pk.
Thus, in the previous example with a2 V pk-pk
square wave input, the SR850 would detect the
first sine component, 1.273sin(ωt). The measured
and displayed magnitude would be 0.90 V (rms)
(1/√2 x 1.273).
Degrees or Radians?
In this discussion, frequencies have been referred
to as f (Hz) and ω (2πf radians/sec). This is
because people measure frequencies in cycles
per second and math works best in radians. For
purposes of measurement, frequencies as measured in a lock-in amplifier are in Hz. The equations
used to explain the actual calculations are sometimes written using ω to simplify the expressions.
Phase is always reported in degrees. Once again,
this is more by custom than by choice. Equations
written as sin(ωt + θ) are written as if θ is in
radians mostly for simplicity. Lock-in amplifiers
always manipulate and measure phase in
degrees.
S(t) = 1.273sin(ωt) + 0.4244sin(3ωt) +
0.2546sin(5ωt) + ...
where ω = 2πf. The SR850, locked to f will single
out the first component. The measured signal will
be 1.273sin(ωt), not the 2V pk-pk that you'd measure on a scope.
In the general case, the input consists of signal
plus noise. Noise is represented as varying signals
at all frequencies. The ideal lock-in only responds
to noise at the reference frequency. Noise at other
frequencies is removed by the low pass filter fol-
3-3
Page 58

SR850 Basics
3-4
Page 59
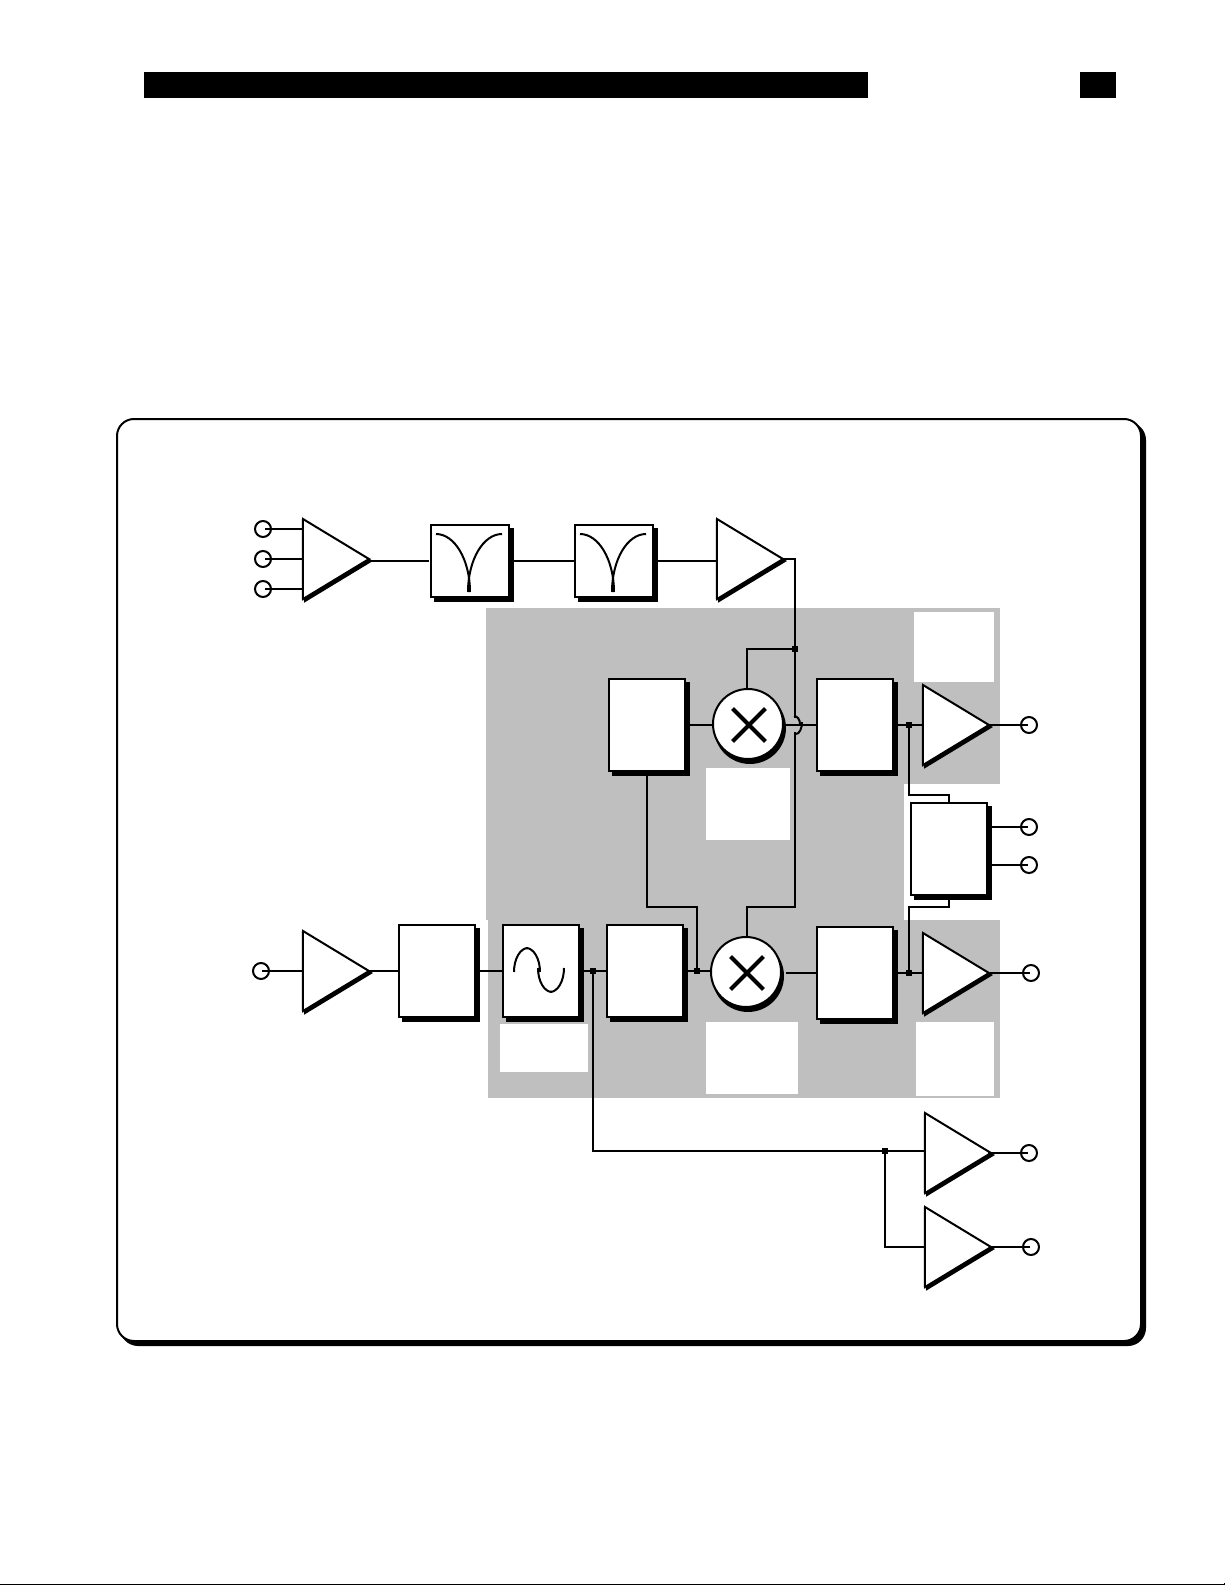
THE FUNCTIONAL SR850
Differential
Amp
100/120 Hz
Notch
Filter
Locked
Loop
The functional block diagram of the SR850 DSP
Lock-In Amplifier is shown below. The functions in
the gray area are handled by the digital signal processor (DSP). We'll discuss the DSP aspects of
the SR850 as they come up in each functional
block description.
SR850 Basics
Voltage
Current
Reference In
Sine or TTL
A
B
Low Noise
I
Discriminator
50/60 Hz
Notch
Filter
PLL
Phase
Internal
Oscillator
90°
Phase
Shift
Phase
Shifter
Gain
Phase
Sensitive
Detector
Phase
Sensitive
Detector
Low
Pass
Filter
Low
Pass
Filter
DC Gain
Offset
Expand
R and
Ø Calc
DC Gain
Offset
Expand
Y Out
R
Ø
X Out
SR850 FUNCTIONAL BLOCK DIAGRAM
3-5
Sine Out
TTL Out
Discriminator
Page 60

SR850 Basics
3-6
Page 61

REFERENCE CHANNEL
SR850 Basics
A lock-in amplifier requires a reference oscillator
phase-locked to the signal frequency. In general,
this is accomplished by phase-locking an internal
oscillator to an externally provided reference
signal. This reference signal usually comes from
the signal source which is providing the excitation
to the experiment.
Reference Input
The SR850 reference input can accept an analog
signal (like a sine wave) or a TTL logic signal. The
first case is called External Sine. The input is AC
coupled (above 1 Hz) and the input impedance is
1 MΩ. A sine wave input greater than 200 mV pk
will trigger the input discriminator. Positive zero
crossings are detected and considered to be the
zero for the reference phase shift.
TTL reference signals can be used at all frequencies up to 102 kHz. For frequencies below 1 Hz,
a TTL reference signal is required. Many function generators provide a TTL SYNC output which
can be used as the reference. This is convenient
since the generator's sine output might be smaller
than 200 mV or be varied in amplitude. The SYNC
signal will provide a stable reference regardless of
the sine amplitude.
When using a TTL reference, the reference input
can be set to External Rising (detect rising edges)
or External Falling (detect falling edges). In each
case, the internal oscillator is locked (at zero
phase) to the detected edge.
Internal Oscillator
The internal oscillator in the SR850 is basically a
100 kHz function generator with sine and TTL
sync outputs. The oscillator can be phase-locked
to the external reference.
The oscillator generates a digitally synthesized
sine wave. The digital signal processor, or DSP,
sends computed sine values to a 16 bit digital-toanalog converter every 4 µs (256 kHz). An antialiasing filter converts this sampled signal into a
low distortion sine wave. The internal oscillator
sine wave is output at the SINE OUT BNC on the
front panel. The amplitude of this output may be
set from 4 mV to 5 V.
When an external reference is used, this internal
oscillator sine wave is phase-locked to the reference. The rising zero crossing is locked to the
detected reference zero crossing or edge. In this
mode, the SINE OUT provides a sine wave phaselocked to the external reference. At low frequencies (below 10 Hz), the phase locking is accomplished digitally by the DSP. At higher frequencies,
a discrete phase comparator is used.
The internal oscillator may be used without an
external reference. In the Internal Reference
mode, the SINE OUT provides the excitation for
the experiment. The phase-locked-loop is not used
in this mode since the lock-in reference is providing the excitation signal.
The TTL OUT on the rear panel provides a TTL
sync output. The internal oscillator's rising zero
crossings are detected and translated to TTL
levels. This output is a square wave.
Reference Oscillators and Phase
The internal oscillator sine wave is not the reference signal to the phase sensitive detectors. The
DSP computes a second sine wave, phase shifted
by θ
an external reference), as the reference input to
the X phase sensitive detector. This waveform is
sin(ωrt + θ
able in .001° increments.
The input to the Y PSD is a third sine wave, computed by the DSP, shifted by 90° from the second
sine wave. This waveform is sin(ωrt + θ
Both reference sine waves are calculated to 20
bits of accuracy and a new point is calculated
every 4 µs (256 kHz). The phase shifts (θ
the 90° shift) are also exact numbers and accurate
to better than .001°. Neither waveform is actually
output in analog form since the phase sensitive
detectors are actually multiply instructions inside
the DSP.
from the internal oscillator (and thus from
ref
). The reference phase shift is adjust-
ref
+ 90°).
ref
ref
and
Phase Jitter
When an external reference is used, the phaselocked loop adds a little phase jitter. The internal
oscillator is supposed to be locked with zero
phase shift relative the external reference. Phase
jitter means that the average phase shift is zero
but the instantaneous phase shift has a few milli-
3-7
Page 62

SR850 Basics
degrees of noise. This shows up at the output as
noise in phase or quadrature measurements.
Phase noise can also cause noise to appear at the
X and Y outputs. This is because a reference
oscillator with a lot of phase noise is the same as
a reference whose frequency spectrum is spread
out. That is, the reference is not a single frequency, but a distribution of frequencies about the true
reference frequency. These spurious frequencies
are attenuated quite a bit but still cause problems.
The spurious reference frequencies result in signals close to the reference being detected. Noise
at nearby frequencies now appears near DC and
affects the lock-in output.
Phase noise in the SR850 is very low and generally causes no problems. In applications requiring no
phase jitter, the internal reference mode should be
used. Since there is no PLL, the internal oscillator
and the reference sine waves are directly linked
and there is no jitter in the measured phase.
(Actually, the phase jitter is the phase noise of a
crystal oscillator and is very, very small).
Harmonic Detection
It is possible to compute the two PSD reference
sine waves at a multiple of the internal oscillator
frequency. In this case, the lock-in detects signals
at Nxf
ence. The SINE OUT frequency is not affected.
The SR850 can detect at any harmonic up to
N=32767 as long as Nxf
102 kHz.
which are synchronous with the refer-
ref
does not exceed
ref
3-8
Page 63

SR850 Basics
THE PHASE SENSITIVE DETECTORS (PSD's)
The SR850 multiplies the signal with the reference
sine waves digitally. The amplified signal is converted to digital form using a 16 bit A/D converter
sampling at 256 kHz. The A/D converter is preceded by a 102 kHz anti-aliasing filter to prevent
higher frequency inputs from aliasing below
102 kHz. The signal amplifier and filters will be discussed later.
This input data stream is multiplied, a point at a
time, with the computed reference sine waves
described previously. Every 4 µs, the input signal
is sampled and the result is multiplied by the two
reference sine waves (90° apart).
Digital PSD vs Analog PSD
The phase sensitive detectors (PSD's) in the
SR850 act as linear multipliers, that is, they multiply the signal with a reference sine wave. Analog
PSD's (both square wave and linear) have many
problems associated with them. The main problems are harmonic rejection, output offsets, limited
dynamic reserve and gain error.
The digital PSD multiplies the digitized signal with
a digitally computed reference sine wave.
Because the reference sine waves are computed
to 20 bits of accuracy, they have very low harmonic content. In fact, the harmonics are at the
-120 dB level! This means that the signal is multiplied by a single reference sine wave (instead of a
reference and its many harmonics) and only the
signal at this single reference frequency is detected. The SR850 is completely insensitive to signals
at harmonics of the reference. In contrast, a
square wave multiplying lock-in will detect at all of
the odd harmonics of the reference (a square
wave contains many large odd harmonics).
scale signal, the analog PSD measures the signal
with an error. The error is caused by non-linearity
in the multiplication (the error at the output
depends upon the amplitude of the input). This
error can be quite large (10% of full scale) and
depends upon the noise amplitude, frequency, and
waveform. Since noise generally varies quite a bit
in these parameters, the PSD error causes quite a
bit of output uncertainty.
In the digital lock-in, the dynamic reserve is limited
by the quality of the A/D conversion. Once the
input signal is digitized, no further errors are introduced. Certainly the accuracy of the multiplication
does not depend on the size of the numbers. The
A/D converter used in the SR850 is extremely
linear, meaning that the presence of large noise
signals does not impair its ability to correctly digitize a small signal. In fact, the dynamic reserve of
the SR850 can exceed 100 dB without any problems. We'll talk more about dynamic reserve a little
later.
An analog linear PSD multiplies the signal by an
analog reference sine wave. Any amplitude variation in the reference amplitude shows up directly
as a variation in the overall gain. Analog sine wave
generators are susceptible to amplitude drift, especially as a function of temperature. The digital reference sine wave has a precise amplitude and
never changes. This eliminates a major source of
gain error in a linear analog lock-in.
The overall performance of a lock-in amplifier is
largely determined by the performance of its
phase sensitive detectors. In virtually all respects,
the digital PSD outperforms its analog
counterparts.
Output offset is a problem because the signal of
interest is a DC output from the PSD and an
output offset contributes to error and zero drift.
The offset problems of analog PSD's are eliminated using the digital multiplier. There are no erroneous DC output offsets from the digital
multiplication of the signal and reference. In fact,
the actual multiplication is totally free from errors.
The dynamic reserve of an analog PSD is limited
to about 60 dB. When there is a large noise signal
present, 1000 times or 60 dB greater than the full
We've discussed how the digital signal processor
in the SR850 computes the internal oscillator and
two reference sine waves and handles both phase
sensitive detectors. In the next section, we'll see
the same DSP perform the low pass filtering and
DC amplification required at the output of the
PSD's. Here again, the digital technique eliminates
many of the problems associated with analog lockin amplifiers.
3-9
Page 64

SR850 Basics
3-10
Page 65

TIME CONSTANTS and DC GAIN
SR850 Basics
Remember, the output of the PSD contains many
signals. Most of the output signals have frequencies which are either the sum or difference
between an input signal frequency and the reference frequency. Only the component of the input
signal whose frequency is exactly equal to the reference frequency will result in a DC output.
The low pass filter at the PSD output removes all
of the unwanted AC signals, both the 2F (sum of
the signal and the reference) and the noise components. This filter is what makes the lock-in such
a narrow band detector.
Time Constants
Lock-in amplifiers have traditionally set the low
pass filter bandwidth by setting the time constant.
The time constant is simply 1/2πf where f is the
-3 dB frequency of the filter. The low pass filters
are simple 6 dB/oct roll off, RC type filters. A 1
second time constant referred to a filter whose
-3 dB point occurred at 0.16 Hz and rolled off at
6 dB/oct beyond 0.16 Hz. Typically, there are two
successive filters so that the overall filter can roll
off at either 6 dB or 12 dB per octave. The time
constant referred to the -3 dB point of each filter
alone (not the combined filter).
The notion of time constant arises from the fact
that the actual output is supposed to be a DC
signal. In fact, when there is noise at the input,
there is noise on the output. By increasing the time
constant, the output becomes more steady and
easier to measure reliably. The trade off comes
when real changes in the input signal take many
time constants to be reflected at the output. This is
because a single RC filter requires about 5 time
constants to settle to its final value. The time
constant reflects how slowly the output responds,
and thus the degree of output smoothing.
Note that the SR850 displays the time constant
and the equivalent noise bandwidth (ENBW) in the
time constant menu. The ENBW is NOT the filter
-3 dB pole, it is the effective bandwidth for
Gaussian noise. More about this later.
Digital Filters vs Analog Filters
The SR850 improves on analog filters in many
ways. First, analog lock-ins provide at most, two
stages of filtering with a maximum roll off of
12 dB/oct. This limitation is usually due to space
and expense. Each filter needs to have many different time constant settings. The different settings
require different components and switches to
select them, all of which is costly and space
consuming.
The digital signal processor in the SR850 handles
all of the low pass filtering. Each PSD can be followed by up to four filter stages for up to 24 dB/oct
of roll off. Since the filters are digital, the SR850 is
not limited to just two stages of filtering.
Why is the increased roll off desirable? Consider
an example where the reference is at 1 kHz and a
large noise signal is at 1.05 kHz. The PSD noise
outputs are at 50 Hz (difference) and 2.05 kHz
(sum). Clearly the 50 Hz component is the more
difficult to low pass filter. If the noise signal is
80 dB above the full scale signal and we would
like to measure the signal to 1% (-40 dB), then the
50 Hz component needs to be reduced by 120 dB.
To do this in two stages would require a time constant of at least 3 seconds. To accomplish the
same attenuation in four stages only requires
100 ms of time constant. In the second case, the
output will respond 30 times faster and the experiment will take less time.
Synchronous Filters
Another advantage of digital filtering is the ability
to do synchronous filtering. Even if the input signal
has no noise, the PSD output always contains a
component at 2F (sum frequency of signal and reference) whose amplitude equals or exceeds the
desired DC output depending upon the phase. At
low frequencies, the time constant required to
attenuate the 2F component can be quite long. For
example, at 1 Hz, the 2F output is at 2 Hz and to
attenuate the 2 Hz by 60 dB in two stages requires
a time constant of 3 seconds.
A synchronous filter, on the other hand, operates
totally differently. The PSD output is averaged
over a complete cycle of the reference frequency.
The result is that all components at multiples of
the reference (2F included) are notched out completely. In the case of a clean signal, almost no
additional filtering would be required. This is
increasingly useful the lower the reference frequency. Imagine what the time constant would
3-11
Page 66

SR850 Basics
need to be at 0.001 Hz!
In the SR850, synchronous filters are available at
detection frequencies below 200 Hz. At higher frequencies, the filters are not required (2F is easily
removed without using long time constants).
Below 200 Hz, the synchronous filter follows either
one or two stages of normal filters. The output of
the synchronous filter is followed by two more
stages of normal filters. This combination of filters
notches all multiples of the reference frequency
and provides overall noise attenuation as well.
Long Time Constants
Time constants above 100 seconds are difficult to
accomplish using analog filters. This is simply
because the capacitor required for the RC filter is
prohibitively large (in value and in size!). Why
would you use such a long time constant?
Sometimes you have no choice. If the reference is
well below 1 Hz and there is a lot of low frequency
noise, then the PSD output contains many very
low frequency components. The synchronous filter
only notches multiples of the reference frequency,
the noise is filtered by the normal filters.
The SR850 can provide time constants as long as
30000 seconds at reference frequencies below
200 Hz. Obviously you don't use long time constants unless absolutely necessary, but they're
available.
DC Output Gain
How big is the DC output from the PSD? It
depends on the dynamic reserve. With 60 dB of
dynamic reserve, a noise signal can be 1000 times
(60 dB) greater than a full scale signal. At the
PSD, the noise can not exceed the PSD's input
range. In an analog lock-in, the PSD input range
might be 5V. With 60 dB of dynamic reserve, the
signal will be only 5 mV at the PSD input. The
PSD typically has no gain so the DC output from
the PSD will only be a few millivolts! Even if the
PSD had no DC output errors, amplifying this millivolt signal up to 10 V is error prone. The DC
output gain needs to be about the same as the
dynamic reserve (1000 in this case) to provide a
10 V output for a full scale input signal. An offset
as small as 1 mV will appear as 1 V at the output!
In fact, the PSD output offset plus the input offset
of the DC amplifier needs to be on the order of
10 µV in order to not affect the measurement. If
the dynamic reserve is increased to 80dB, then
this offset needs to be 10 times smaller still. This
is one of the reasons why analog lock-ins do not
perform well at very high dynamic reserve.
The digital lock-in does not have an analog DC
amplifier. The output gain is yet another function
handled by the digital signal processor. We
already know that the digital PSD has no DC
output offset. Likewise, the digital DC amplifier has
no input offset. Amplification is simply taking input
numbers and multiplying by the gain. This allows
the SR850 to operate with 100 dB of dynamic
reserve without any output offset or zero drift.
What about resolution?
Just like the analog lock-in where the noise can
not exceed the input range of the PSD, in the digital lock-in, the noise can not exceed the input
range of the A/D converter. With a 16 bit A/D converter, a dynamic reserve of 60 dB means that
while the noise has a range of the full 16 bits, the
full scale signal only uses 6 bits. With a dynamic
reserve of 80 dB, the full scale signal uses only
2.5 bits. And with 100 dB dynamic reserve, the
signal is below a single bit! Clearly multiplying
these numbers by a large gain is not going to
result in a sensible output. Where does the output
resolution come from?
The answer is filtering. The low pass filters effectively combine many data samples together. For
example, at a 1 second time constant, the output
is the result of averaging data over the previous 4
or 5 seconds. At a sample rate of 256 kHz, this
means each output point is the exponential average of over a million data points. (A new output
point is computed every 4 µs and is a moving
exponential average). What happens when you
average a million points? To first order, the resulting average has more resolution than the incoming
data points by a factor of million . This represents
a gain of 20 bits in resolution over the raw data. A
1 bit input data stream is converted to 20 bits of
output resolution from 1 out of a million all the way
up to a million out of a million or 1.
The compromise here is that with high dynamic
reserve (large DC gains), some filtering is
required. The shortest time constants are not
available when the dynamic reserve is very high.
This is not really a limitation since presumably
there is noise which is requiring the high dynamic
reserve and thus substantial output filtering will
also be required.
3-12
Page 67

DC OUTPUTS and SCALING
SR850 Basics
The SR850 has X and Y outputs on the rear panel
and Channel 1 and 2 (CH1 and CH2) outputs on
the front panel.
X and Y
The X and Y rear panel outputs are the outputs
from the two phase sensitive detectors with low
pass filtering, offset and expand. These outputs
are the traditional outputs of an analog lock-in.
The X and Y outputs have an output bandwidth of
100 kHz.
CH1 and CH2
The two front panel outputs can be configured to
output voltages proportional to X, Y, R, θ, or
Traces 1-4.
If the outputs are set to X or Y, these outputs
duplicate the rear panel outputs.
If they are set to R or θ the output voltages are
proportional to the calculated values of R and θ.
These calculations are performed at a rate of 512
Hz and the R and θ outputs are updated at the
512 Hz rate.
If the outputs are proportional to a data trace, then
the output is also updated at 512 Hz. The traces
are defined in the TRACE menu as A•B/C where
A,B,C can be X, Y, R, θ, Xnoise, Ynoise, Rnoise,
Frequency, Aux Inputs 1-4, or unity (C may also
be any quantity squared). If a trace is defined as
simply X, this trace, when output through CH1 or
CH2, will only update at 512 Hz. It is better in this
case to set CH1 to output X directly, rather than
the trace defined as X. The output scale of a data
trace is discussed later in this section.
X, Y, R and Output scales
The sensitivity of the lock-in is the rms amplitude
of an input sine (at the reference frequency) which
results in a full scale DC output. Traditionally, full
scale means 10 VDC at the X, Y or R BNC output.
The overall gain (input to output) of the amplifier is
then 10 V/sensitivity. This gain is distributed
between AC gain before the PSD and DC gain following the PSD. Changing the dynamic reserve at
a given sensitivity changes the gain distribution
while keeping the overall gain constant.
The SR850 considers 10 V to be full scale for any
output proportional to simply X, Y or R. This is the
output scale for the X and Y rear panel outputs as
well as the CH1 and CH2 outputs when configured
to output X, Y or R. When the CH1 or CH2 outputs
are proportional to a data trace which is simply
defined as X, Y or R, the output scale is also 10 V
full scale.
Lock-in amplifiers are designed to measure the
RMS value of the AC input signal. All sensitivities
and X, Y and R outputs and displays are RMS
values.
Phase is a quantity which ranges from -180° to
+180° regardless of the sensitivity. When the CH1
or CH2 outputs a voltage proportional to θ, the
output scale is 18°/Volt or 180°=10V.
X, Y and R Output Offset and Expand
The SR850 has the ability to offset the X, Y and R
outputs. This is useful when measuring deviations
in the signal around some nominal value. The
offset can be set so that the output is offset to
zero. Changes in the output can then be read
directly from the display or output voltages. The
offset is specified as a percentage of full scale and
the percentage does not change when the sensitivity is changed. Offsets up to ±105% can be
programmed.
The X, Y and R outputs may also be expanded.
This simply takes the output (minus its offset) and
multiplies by an expansion factor. Thus, a signal
which is only 10% of full scale can be expanded to
provide 10 V of output rather than only 1 V. The
normal use for expand is to expand the measurement resolution around some value which is not
zero. For example, suppose a signal has a nominal value of 0.9 mV and we want to measure small
deviations, say 10 µV or so, in the signal. The sensitivity of the lock-in needs to be 1 mV to accommodate the nominal signal. If the offset is set so to
90% of full scale, then the nominal 0.9 mV signal
will result in a zero output. The 10 µV deviations in
the signal only provide 100 mV of DC output. If the
output is expanded by 10, these small deviations
are magnified by 10 and provide outputs of 1 VDC.
The SR850 can expand the output by a factor from
1 to 256 provided the expanded output does not
exceed full scale. In the above example, the 10 µV
3-13
Page 68

SR850 Basics
deviations can be expanded up to 100 times
before they exceed full scale (at 1 mV sensitivity).
The analog output with offset and expand is
Output = (signal/sensitivity - offset) x Expand x10V
where offset is a fraction of 1 (50%=0.5), expand
is an integer from 1 to 256 and the output can not
exceed 10 V. In the above example,
Output = (0.91mV/1mV - 0.9) x 10 x 10V = 1V
for a signal which is 10 µV greater than the 0.9 mV
nominal. (Offset = 0.9 and expand =10).
The X and Y offset and expand functions in the
SR850 are output functions, they do NOT affect
the calculation of R or θ. R has its own output
offset and expand.
Trace displays
Only data traces may be displayed on the screen.
In order to display the quantity X, it is necessary to
define a trace to be X and then choose to display
that trace.
Output offsets ARE reflected in data trace displays
which depend upon X, Y or R. For example, a
trace which is defined as X is affected by the X
offset. When the X output is offset to zero, the displayed trace value on the screen will drop to zero
also. Any display which is showing a trace which is
affected by a non-zero offset will display a highlighted Offst indicator at the lower left of the
display.
Output expands do NOT increase the displayed
values of X, Y or R in data traces. Expand increases the resolution of the X, Y or R value used to
calculate the trace value. For example, a trace
which is defined as X does not increase its displayed value when X is expanded. This is because
the expand function increases the resolution with
which the signal is measured, not the size of the
input signal. The displayed value will show an
increased resolution but will continue to display
the original value of X minus the X offset. Any display which is showing a trace which is affected by
a non-unity expand will display a highlighted Expd
indicator at the lower left of the display.
example, if a trace is defined as X•θ/Aux 1 and
X=1 mV, θ=37°, and Aux 1= 2.34 V, then the
trace value is 0.001 x 37/2.34 Volt•degrees per
Volt or 0.01581 Vdeg/V. This value is not changed
by the sensitivity (X is the input signal, not the
output voltage) or by X expand. An X offset will,
however, change the value of this trace.
Trace output scaling
What about CH1 or CH2 outputs proportional to
data traces which are not simply X, Y, R or θ? If a
trace is defined as A•B/C, then the trace output
voltage depends upon the values of each parameter. Trace output voltages are calculated by determining the output voltages for the individual
quantities, A, B and C. The individual output voltages (-10 V to +10 V) are then combined using the
trace definition to determine the trace output
voltage.
For example, suppose a trace is defined as X/R.
The parameters X and R scale as 10 V for a full
scale input signal. If the sensitivity is 1 V and the
measured values are X=500 mV and R=1 V, the
X output would be 5 V and the R output would be
10 V. The trace output voltage is simply
(X=5 V)/(R=10 V)=0.5 V.
Output voltages for traces which are defined as A,
B, A/C, B/C or A•B/C are calculated using the
output voltages for A, B and C. Traces defined as
A•B (A,B≠1, C=1) have output voltages which are
the product of the A and B output voltages divided
by 10.
For example, suppose a trace is defined as X•θ.
The parameter X scales as 10 V for a full scale
input signal and θ scales as 10 V for 180° of phase
shift. If the measured X is 1 V on the 1 V sensitivity, X would be 100% of full scale or 10 V. If the
phase is 180°, then θ is also 10 V. The trace
output voltage is thus, (X=10 V)•(θ=10 V)/10=10 V.
The extra factor of 10 allows products of two full
scale quantities to be output.
X, Y and R output offsets ARE reflected in trace
outputs which depend upon X, Y or R. For example, a trace which is defined as X and output
through CH1 or CH2 is affected by the X offset.
When the X output is offset to zero, the trace
output voltage will drop to zero also.
Complex data traces are displayed and stored in
the actual units of the computed quantity. For
Output expands DO increase the output voltage of
X, Y or R in trace outputs. Expand increases the
3-14
Page 69

output voltages of X, Y or R in trace output calculations. For example, a trace which is defined as X
and output through CH1 or CH2 increases its
output voltage by the expand factor when X is
expanded. This is because the output voltage of X
is expanded.
The output voltage scales for the individual quantities are listed below.
X,Y,R (signal/sensitivity-offset)xExpandx10V
θ 10V/180°
Xn,Yn,Rn (noise signal/sensitivity)xExpandx10V
Aux In 1-4 output voltage = Aux input voltage
1 1V
F 5V - 10V for each octave in frequency.
For example,
1000 Hz = 5V
1200 Hz = 6V
1600 Hz = 8V
1800 Hz = 9V
1990 Hz = 9.95V
2000 Hz = 5V (next octave)
The octaves are defined as follows,
...
62.5 Hz - 125 Hz
125 Hz - 250 Hz
250 Hz - 500 Hz
500 Hz - 1000 Hz
1 kHz - 2 kHz
4 kHz - 8 kHz
8 kHz - 16 kHz
...
SR850 Basics
3-15
Page 70

SR850 Basics
3-16
Page 71
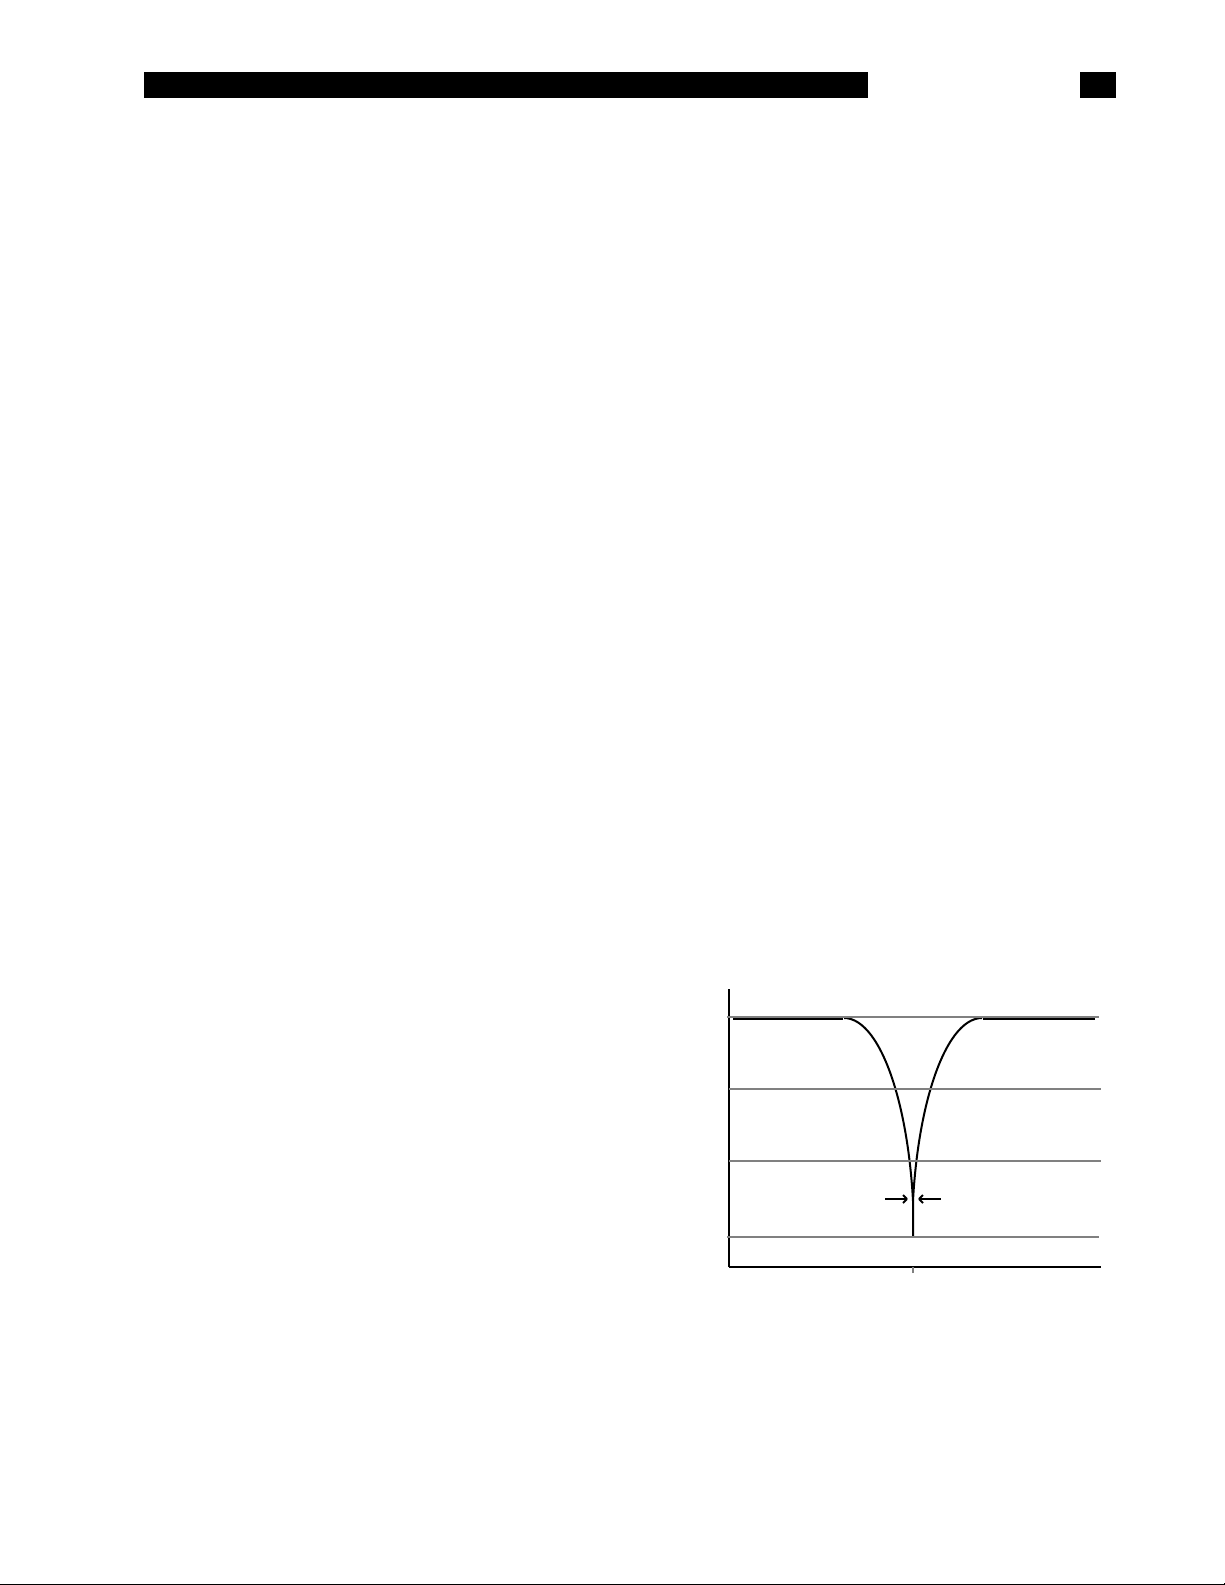
DYNAMIC RESERVE
SR850 Basics
We've mentioned dynamic reserve quite a bit in
the preceding discussions. It's time to clarify
dynamic reserve a bit.
What is dynamic reserve really?
Suppose the lock-in input consists of a full scale
signal at f
The traditional definition of dynamic reserve is the
ratio of the largest tolerable noise signal to the full
scale signal, expressed in dB. For example, if full
scale is 1 µV, then a dynamic reserve of 60 dB
means noise as large as 1 mV (60 dB greater than
full scale) can be tolerated at the input without
overload.
The problem with this definition is the word 'tolerable'. Clearly the noise at the dynamic reserve limit
should not cause an overload anywhere in the
instrument - not in the input signal amplifier, PSD,
low pass filter or DC amplifier. This is accomplished by adjusting the distribution of the gain. To
achieve high reserve, the input signal gain is set
very low so the noise is not likely to overload. This
means that the signal at the PSD is also very
small. The low pass filter then removes the large
noise components from the PSD output which
allows the remaining DC component to be amplified (a lot) to reach 10 V full scale. There is no
problem running the input amplifier at low gain.
However, as we have discussed previously,
analog lock-ins have a problem with high reserve
because of the linearity of the PSD and the DC offsets of the PSD and DC amplifier. In an analog
lock-in, large noise signals almost always disturb
the measurement in some way.
plus noise at some other frequency.
ref
high gain and low frequency noise and offset drift
at the PSD output or the DC amplifier input will be
amplified and appear large at the output. The
noise is more tolerable than the DC drift errors
since increasing the time constant will attenuate
the noise. The DC drift in an analog lock-in is usually on the order of 1000ppm/°C when using 60 dB
of dynamic reserve. This means that the zero point
moves 1% of full scale over 10°C temperature
change. This is generally considered the limit of
tolerable.
Lastly, dynamic reserve depends on the noise frequency. Clearly noise at the reference frequency
will make its way to the output without attenuation.
So the dynamic reserve at f
frequency moves away from the reference frequency, the dynamic reserve increases. Why?
Because the low pass filter after the PSD attenuates the noise components. Remember, the PSD
outputs are at a frequency of |f
at which the reserve increases depends upon the
low pass filter time constant and roll off. The
reserve increases at the rate at which the filter
rolls off. This is why 24 dB/oct filters are better
than 6 or 12 dB/oct filters. When the noise frequency is far away, the reserve is limited by the
gain distribution and overload level of each gain
element. This reserve level is the dynamic reserve
referred to in the specifications.
actual reserve
60 dB
is 0dB. As the noise
ref
noise-fref
60 dB specified reserve
|. The rate
The most common problem is a DC output error
caused by the noise signal. This can appear as an
offset or as a gain error. Since both effects are
dependent upon the noise amplitude and frequency, they can not be offset to zero in all cases and
will limit the measurement accuracy. Because the
errors are DC in nature, increasing the time constant does not help. Most lock-ins define tolerable
noise as noise levels which do not affect the
output more than a few percent of full scale. This
is more severe than simply not overloading.
Another effect of high dynamic reserve is to generate noise and drift at the output. This comes about
because the DC output amplifier is running at very
40 dB
20 dB
low pass filter
bandwidth
0 dB
f
ref
The above graph shows the actual reserve vs the
frequency of the noise. In some instruments, the
signal input attenuates frequencies far outside the
lock-in's operating range (f
these cases, the reserve can be higher at these
>>100 kHz). In
noise
3-17
f
noise
Page 72

SR850 Basics
frequencies than within the operating range. While
this may be a nice specification, removing noise at
frequencies very far from the reference does not
require a lock-in amplifier. Lock-ins are used when
there is noise at frequencies near the signal. Thus,
the dynamic reserve for noise within the operating
range is more important.
Dynamic reserve in the SR850
The SR850, with its digital phase sensitive detectors, does not suffer from DC output errors caused
by large noise signals. The dynamic reserve can
be increased to above 100 dB without measurement error. Large noise signals do not cause
output errors from the PSD. The large DC gain
does not result in increased output drift.
In fact, the only drawback to using ultra high
dynamic reserves (>60 dB) is the increased output
noise due to the noise of the A/D converter. This
increase in output noise is only present when the
dynamic reserve is increased above 60 dB AND
above the minimum reserve. (If the minimum
reserve is 80 dB, then increasing to 90 dB may
increase the noise. As we'll discuss next, the minimum reserve does not have increased output
noise no matter how large it is.)
To set a scale, the SR850's output noise at 100 dB
dynamic reserve is only measurable when the
signal input is grounded. Let's do a simple experiment. If the lock-in reference is at 1 kHz and a
large signal is applied at 9.5 kHz, what will the
lock-in output be? If the signal is increased to the
dynamic reserve limit (100 dB greater than full
scale), the output will reflect the noise of the signal
at 1 kHz. The spectrum of any pure sine generator
always has a noise floor, i.e. there is some noise
at all frequencies. So even though the applied
signal is at 9.5 kHz, there will be noise at all other
frequencies, including the 1 kHz lock-in reference.
This noise will be detected by the lock-in and
appear as noise at the output. This output noise
will typically be greater than the SR850's own
output noise. In fact, virtually all signal sources will
have a noise floor which will dominate the lock-in
output noise. Of course, noise signals are generally much noisier than pure sine generators and will
have much higher broadband noise floors.
If the noise does not reach the reserve limit, the
SR850's own output noise may become detectable
at ultra high reserves. In this case, simply lower
the dynamic reserve and the DC gain will
decrease and the output noise will decrease also.
In general, do not run with more reserve than necessary. Certainly don't use ultra high reserve when
there is virtually no noise at all.
The frequency dependence of dynamic reserve is
inherent in the lock-in detection technique. The
SR850, by providing more low pass filter stages,
can increase the dynamic reserve close to the reference frequency. The specified reserve applies to
noise signals within the operating range of the
lock-in, i.e. frequencies below 100 kHz. The
reserve at higher frequencies is actually higher but
is generally not that useful.
Minimum dynamic reserve
The SR850 always has a minimum amount of
dynamic reserve. This minimum reserve changes
with the sensitivity (gain) of the instrument. At high
gains (full scale sensitivity of 50 µV and below),
the minimum dynamic reserve increases from
37 dB at the same rate as the sensitivity increases. For example, the minimum reserve at 5 µV
sensitivity is 57 dB. In many analog lock-ins, the
reserve can be lower. Why can't the SR850 run
with lower reserve at this sensitivity?
The answer to this question is - Why would you
want lower reserve? In an analog lock-in, lower
reserve means less output error and drift. In the
SR850, more reserve does not increase the output
error or drift. More reserve can increase the output
noise though. However, if the analog signal gain
before the A/D converter is high enough, the
5 nV/√Hz noise of the signal input will be amplified
to a level greater than the input noise of the A/D
converter. At this point, the detected noise will
reflect the actual noise at the signal input and not
the A/D converter's noise. Increasing the analog
gain (decreasing the reserve) will not decrease the
output noise. Thus, there is no reason to decrease
the reserve. At a sensitivity of 5 µV, the analog
gain is sufficiently high so that A/D converter noise
is not a problem. Sensitivities below 5 µV do not
require any more gain since the signal to noise
ratio will not be improved (the front end noise dominates). The SR850 does not increase the gain
below the 5 µV sensitivity, instead, the minimum
reserve increases. Of course, the input gain can
be decreased and the reserve increased, in which
case the A/D converter noise might be detected in
the absence of any signal input.
3-18
Page 73

SIGNAL INPUT AMPLIFIER and FILTERS
SR850 Basics
A lock-in can measure signals as small as a few
nanovolts. A low noise signal amplifier is required
to boost the signal to a level where the A/D converter can digitize the signal without degrading the
signal to noise. The analog gain in the SR850
ranges from roughly 7 to 1000. As discussed previously, higher gains do not improve signal to
noise and are not necessary.
The overall gain (AC plus DC) is determined by
the sensitivity. The distribution of the gain (AC
versus DC) is set by the dynamic reserve.
Input noise
The input noise of the SR850 signal amplifier is
about 5 nVrms/√Hz. What does this noise figure
mean? Let's set up an experiment. If an amplifier
has 5 nVrms/√Hz of input noise and a gain of
1000, then the output will have 5 µVrms/√Hz of
noise. Suppose the amplifier output is low pass filtered with a single RC filter (6 dB/oct roll off) with a
time constant of 100 ms. What will be the noise at
the filter output?
Amplifier input noise and Johnson noise of resistors are Gaussian in nature. That is, the amount of
noise is proportional to the square root of the
bandwidth in which the noise is measured. A
single stage RC filter has an equivalent noise
bandwidth (ENBW) of 1/4T where T is the time
constant (RxC). This means that Gaussian noise
at the filter input is filtered with an effective bandwidth equal to the ENBW. In this example, the
filter sees 5 µVrms/√Hz of noise at its input. It has
an ENBW of 1/(4x100ms) or 2.5 Hz. The voltage
noise at the filter output will be
5 µVrms/√Hz x√2.5Hz or 7.9µVrms. For
Gaussian noise, the peak to peak noise is about 5
times the rms noise. Thus, the output will have
about 40 µV pk-pk of noise.
Input noise for a lock-in works the same way. For
sensitivities below about 5 µV full scale, the input
noise will determine the output noise (at minimum
reserve). The amount of noise at the output is
determined by the ENBW of the low pass filter.
The SR850 displays the ENBW in the Time
Constant menu. The ENBW depends upon the
time constant and filter roll off. For example, suppose the SR850 is set to 5 µV full scale with a 100
ms time constant and 6 dB/oct of filter roll off. The
lock-in will measure the input noise with an ENBW
of 2.5 Hz. This translates to 7.9 nVrms at the
input. At the output, this represents about 0.16%
of full scale (7.9 nV/5 µV). The peak to peak noise
will be about 0.8% of full scale.
All of this assumes that the signal input is being
driven from a low impedance source. Remember
resistors have Johnson noise equal to
0.13x√R nVrms/√Hz. Even a 50Ω resistor has
almost 1 nVrms/√Hz of noise! A signal source
impedance of 2kΩ will have a Johnson noise
greater than the SR850's input noise. To determine the overall noise of multiple noise sources,
take the square root of the sum of the squares of
the individual noise figures. For example, if a 2kΩ
source impedance is used, the Johnson noise will
be 5.8 nVrms/√Hz. The overall noise at the SR850
input will be [52 + 5.82]
We'll talk more about noise sources later in this
section.
At lower gains (sensitivities above 50 µV), there is
not enough gain at high reserve to amplify the
input noise to a level greater than the noise of the
A/D converter. In these cases, the output noise is
determined by the A/D noise. Fortunately, at these
sensitivities, the DC gain is low and the noise at
the output is negligible.
1/2
or 7.7 nVrms/√Hz.
Notch filters
The SR850 has two notch filters in the signal
amplifier chain. These are pre-tuned to the line frequency (50 or 60 Hz) and twice the line frequency
(100 or 120 Hz). In circumstances where the largest noise signals are at the power line frequencies,
these filters can be engaged to remove noise signals at these frequencies. Removing the largest
noise signals before the final gain stage can
reduce the amount of dynamic reserve required to
perform a measurement. To the extent that these
filters reduce the required reserve to either 60 dB
or the minimum reserve (whichever is higher), then
some improvement might be gained. If the
required reserve without these notch filters is
below 60 dB or if the minimum reserve is sufficient, then these filters do not significantly improve
the measurement.
Using either of these filters precludes making
3-19
Page 74

SR850 Basics
measurements in the vicinity of the notch frequencies. These filters have a finite range of attenuation, generally 10 Hz or so. Thus, if the lock-in is
making measurements at 70 Hz, do not use the
60 Hz notch filter! The signal will be attenuated
and the measurement will be in error. When measuring phase shifts, these filters can affect phase
measurements up to an octave away.
Anti-aliasing filter
After all of the signal filtering and amplification,
there is an anti-aliasing filter. This filter is required
by the signal digitization process. According to the
Nyquist criterion, signals must be sampled at a frequency at least twice the highest signal frequency.
In this case, the highest signal frequency is
100 kHz and the sampling frequency is 256 kHz
so things are ok. However, no signals above 128
kHz can be allowed to reach the A/D converter.
These signals would violate the Nyquist criterion
and be undersampled. The result of this undersampling is to make these higher frequency signals appear as lower frequencies in the digital
data stream. Thus a signal at 175 kHz would
appear below 100 kHz in the digital data stream
and be detectable by the digital PSD. This would
be a problem.
To avoid this undersampling, the analog signal is
filtered to remove any signals above 154 kHz
(when sampling at 256 kHz, signals above
154 kHz will appear below 102 kHz). This filter has
a flat pass band from DC to 102 kHz so as not to
affect measurements in the operating range of the
lock-in. The filter rolls off from 102 kHz to 154 kHz
and achieves an attenuation above 154 kHz of at
least 100 dB. Amplitude variations and phase
shifts due to this filter are calibrated out at the factory and do not affect measurements. This filter is
transparent to the user.
Input Impedance
The input impedance of the SR850 is 10 MΩ. If a
higher input impedance is desired, then the SR550
remote preamplifier must be used. The SR550 has
an input impedance of 100 MΩ and is AC coupled
from 1 Hz to 100 kHz.
3-20
Page 75
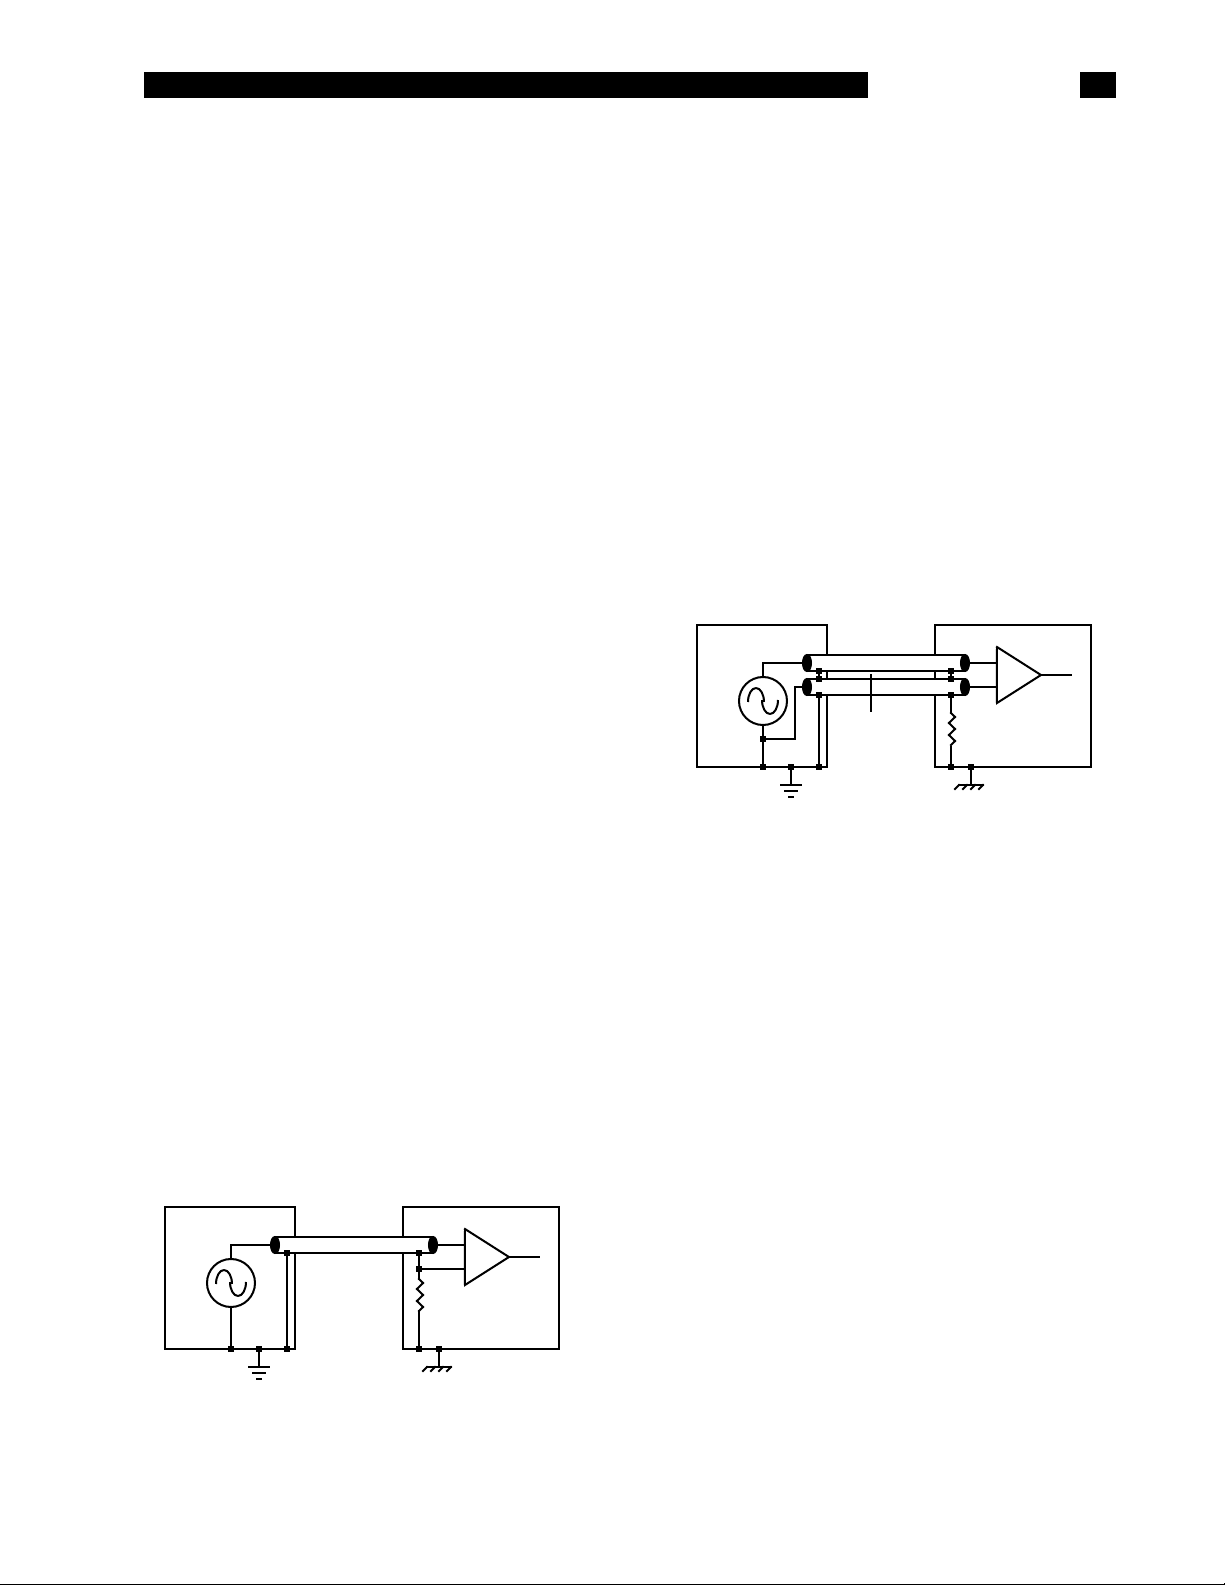
INPUT CONNECTIONS
A
A
SR850 Basics
In order to achieve the best accuracy for a given
measurement, care must be taken to minimize the
various noise sources which can be found in the
laboratory. With intrinsic noise (Johnson noise, 1/f
noise or input noise), the experiment or detector
must be designed with these noise sources in
mind. These noise sources are present regardless
of the input connections. The effect of noise sources in the laboratory (such as motors, signal generators, etc.) and the problem of differential grounds
between the detector and the lock-in can be minimized by careful input connections.
There are two basic methods for connecting a voltage signal to the lock-in - the single-ended connection is more convenient while the differential
connection eliminates spurious pick-up more
effectively.
Single-Ended Voltage Connection (A)
In the first method, the lock-in uses the A input in a
single-ended mode. The lock-in detects the signal
as the voltage between the center and outer conductors of the A input only. The lock-in does not
force the shield of the A cable to ground, rather it
is internally connected to the lock-in's ground via a
resistor. The value of this resistor is chosen in the
INPUT menu. Float uses 1 kΩ and Ground uses
10Ω. This avoids ground loop problems between
the experiment and the lock-in due to differing
ground potentials. The lock-in lets the shield
'quasi-float' in order to sense the experiment
ground. However, noise pickup on the shield will
appear as noise to the lock-in. This is bad since
the lock-in cannot reject this noise. Common mode
noise, which appears on both the center and
shield, is rejected by the 100 dB CMRR of the
lock-in input, but noise on only the shield is not
rejected at all.
Experiment
Signal
Source
Grounds may be at different potentials
SR850 Lock-In
+
-
R
Differential Voltage Connection (A-B)
The second method of connection is the differential mode. The lock-in measures the voltage difference between the center conductors of the A and
B inputs. Both of the signal connections are shielded from spurious pick-up. Noise pickup on the
shields does not translate into signal noise since
the shields are ignored.
When using two cables, it is important that both
cables travel the same path between the experiment and the lock-in. Specifically, there should not
be a large loop area enclosed by the two cables.
Large loop areas are susceptible to magnetic
pickup.
Experiment
Signal
Source
Loop
Area
Grounds may be at different potentials
SR850 Lock-In
+
-
B
R
Common Mode Signals
Common mode signals are those signals which
appear equally on both center and shield (A) or
both A and B (A-B). With either connection
scheme, it is important to minimize both the
common mode noise and the common mode
signal. Notice that the signal source is held near
ground potential in both illustrations above. If the
signal source floats at a nonzero potential, the
signal which appears on both the A and B inputs
will not be perfectly cancelled. The common mode
rejection ratio (CMRR) specifies the degree of cancellation. For low frequencies, the CMRR of 100
dB indicates that the common mode signal is canceled to 1 part in 105. Even with a CMRR of
100 dB, a 100 mV common mode signal behaves
like a 1 µV differential signal! This is especially
bad if the common mode signal is at the reference
frequency (this happens a lot due to ground
loops). The CMRR decreases by about 6 dB/
octave (20 dB/decade) starting at around 1 kHz.
3-21
Page 76

SR850 Basics
Current Input (I)
The current input on the SR850 uses the A input
BNC. Voltage or current input is chosen in the
INPUT menu. The current input has a 1 kΩ input
impedance and a current gain of either 106 or
108 Volts/Amp. Currents from 1 µA down to 2 fA
full scale can be measured.
The impedance of the signal source is the most
important factor to consider in deciding between
voltage and current measurements.
For high source impedances, greater than 1 MΩ
(106 gain) or 100 MΩ (108 gain), and small currents, use the current input. Its relatively low impedance greatly reduces the amplitude and phase
errors caused by the cable capacitance-source
impedance time constant. The cable capacitance
should still be kept small to minimize the high frequency noise gain of the current preamplifier.
For moderate to low source impedances, or larger
currents, the voltage input is preferred. A small
value resistor may be used to shunt the signal current and generate a voltage signal. The lock-in
then measures the voltage across the shunt resistor. Select the resistor value to keep the shunt voltage small (so it does not affect the source current)
while providing enough signal for the lock-in to
measure.
AC vs DC Coupling
The signal input can be either AC or DC coupled.
The AC coupling high pass filter passes signals
above 160 mHz (0.16 Hz) and attenuates signals
at lower frequencies. AC coupling should be used
at frequencies above 50 mHz whenever possible.
At lower frequencies, DC coupling is required.
A DC signal, if not removed by the AC coupling
filter, will multiply with the reference sine wave and
produce an output at the reference frequency. This
signal is not normally present and needs to be
removed by the low pass filter. If the DC component of the signal is large, then this output will be
large and require a long time constant to remove.
AC coupling removes the DC component of the
signal without any sacrifice in signal as long as the
frequency is above 160 mHz.
The current input current to voltage preamplifier is
always DC coupled. AC coupling can be selected
following the current preamplifier to remove any
DC current signal.
Which current gain should you use? The current
gain determines the input current noise of the lockin as well as its measurement bandwidth. Signals
far above the input bandwidth are attenuated by
6 dB/oct. The noise and bandwidth are listed
below.
Gain Noise Bandwidth
6
10
10
The current gain is selected in the INPUT menu
when the I input is in use.
130 fA/√Hz 70 kHz
8
13 fA/√Hz 700 Hz
3-22
Page 77

INTRINSIC (RANDOM) NOISE SOURCES
noise
(rms)= 0.13 R ENBW nV
SR850 Basics
Random noise finds its way into experiments in a
variety of ways. Good experimental design can
reduce these noise sources and improve the
measurement stability and accuracy.
There are a variety of intrinsic noise sources which
are present in all electronic signals. These sources
are physical in origin.
Johnson noise
Every resistor generates a noise voltage across its
terminals due to thermal fluctuations in the electron density within the resistor itself. These fluctuations give rise to an open-circuit noise voltage,
V
(rms)= 4k TR∆f
noise
where k=Boltzmann's constant (1.38x10
T is the temperature in °Kelvin (typically 300°K), R
is the resistance in Ohms, and ∆f is the bandwidth
in Hz. ∆f is the bandwidth of the measurement.
Since the input signal amplifier in the SR850 has a
bandwidth of approximately 300 kHz, the effective
noise at the amplifier input is V
or 350√R nV pk-pk. This noise is broadband and if
the source impedance of the signal is large, can
determine the amount of dynamic reserve
required.
The amount of noise measured by the lock-in is
determined by the measurement bandwidth.
Remember, the lock-in does not narrow its detection bandwidth until after the phase sensitive
detectors. In a lock-in, the equivalent noise bandwidth (ENBW) of the low pass filter (time constant)
sets the detection bandwidth. In this case, the
measured noise of a resistor at the lock-in input,
typically the source impedance of the signal, is
simply
( )
1/2
= 70√R nVrms
noise
-23
J/°K),
amount of broadband noise that will be amplified.
This affects the dynamic reserve. The time constant sets the amount of noise which will be measured at the reference frequency. See the SIGNAL
INPUT AMPLIFIER discussion for more information about Johnson noise.
Shot noise
Electric current has noise due to the finite nature
of the charge carriers. There is always some nonuniformity in the electron flow which generates
noise in the current. This noise is called shot
noise. This can appear as voltage noise when current is passed through a resistor, or as noise in a
current measurement. The shot noise or current
noise is given by
I
(rms) = 2q I∆f( )
noise
where q is the electron charge (1.6x10
Coulomb), I is the RMS AC current or DC current
depending upon the circuit, and ∆f is the
bandwidth.
When the current input of a lock-in is used to
measure an AC signal current, the bandwidth is
typically so small that shot noise is not important.
1/2
-19
1/f noise
Every 10 Ω resistor, no matter what it is made of,
has the same Johnson noise. However, there is
excess noise in addition to Johnson noise which
arises from fluctuations in resistance due to the
current flowing through the resistor. For carbon
composition resistors, this is typically 0.1 µV-3 µV
of rms noise per Volt of applied across the resistor. Metal film and wire-wound resistors have
about 10 times less noise. This noise has a 1/f
spectrum and makes measurements at low frequencies more difficult.
V
The SR850 displays the ENBW in the TIME
CONSTANT menu. This is the correct noise bandwidth for the time constant and the number of
poles and should be used to calculate the detected Johnson noise. The displayed ENBW does not
take the synchronous filter into account.
The signal amplifier bandwidth determines the
Other sources of 1/f noise include noise found in
vacuum tubes and semiconductors.
Total noise
All of these noise sources are incoherent. The
total random noise is the square root of the sum of
the squares of all the incoherent noise sources.
3-23
Page 78

SR850 Basics
3-24
Page 79

EXTERNAL NOISE SOURCES
dt
= ωC
strayVnoise
SR850 Basics
In addition to the intrinsic noise sources discussed
in the previously, there are a variety of external
noise sources within the laboratory.
Most of these noise sources are asynchronous,
i.e. they are not related to the reference and do
not occur at the reference frequency or its harmonics. Examples include lighting fixtures, motors,
cooling units, radios, computer screens, etc.
These noise sources affect the measurement by
increasing the required dynamic reserve or lengthening the time constant.
Some noise sources, however, are related to the
reference and, if picked up in the signal, will add or
subtract from the actual signal and cause errors in
the measurement. Typical sources of synchronous
noise are ground loops between the experiment,
detector and lock-in, and electronic pick up from
the reference oscillator or experimental apparatus.
Many of these noise sources can be minimized
with good laboratory practice and experiment
design. There are several ways in which noise
sources are coupled into the signal path.
Capacitive coupling
An AC voltage from a nearby piece of apparatus
can couple to a detector via a stray capacitance.
Although C
noise may still be larger than a weak experimental
signal. This is especially damaging if the coupled
noise is synchronous (at the reference frequency).
Experiment
We can estimate the noise current caused by a
stray capacitance by,
where ω is 2π times the noise frequency, V
the noise amplitude, and C
capacitance.
may be very small, the coupled
stray
Stray Capacitance
Detector
stray
dV
is the stray
stray
i= C
Noise
Source
noise
is
For example, if the noise source is a power circuit,
then f = 60 Hz and V
= 120 V. C
noise
stray
can be
estimated using a parallel plate equivalent capacitor. If the capacitance is roughly an area of 1 cm
at a separated by 10 cm, then C
is 0.009 pF.
stray
The resulting noise current will be 400 pA (at
60 Hz). This small noise current can be thousands
of times larger than the signal current. If the noise
source is at a higher frequency, the coupled noise
will be even greater.
If the noise source is at the reference frequency,
then the problem is much worse. The lock-in
rejects noise at other frequencies, but pick-up at
the reference frequency appears as signal!
Cures for capacitive noise coupling include:
1) Removing or turning off the noise source.
2) Keeping the noise source far from the
experiment (reducing C
). Do not bring
stray
the signal cables close to the noise
source.
3) Designing the experiment to measure voltages with low impedance (noise current
generates very little voltage).
4) Installing capacitive shielding by placing
both the experiment and detector in a
metal box.
Inductive coupling
An AC current in a nearby piece of apparatus can
couple to the experiment via a magnetic field. A
changing current in a nearby circuit gives rise to a
changing magnetic field which induces an emf
(dØB/dt) in the loop connecting the detector to the
experiment. This is like a transformer with the
experiment-detector loop as the secondary
winding.
B(t)
Experiment
Detector
Noise
Source
2
3-25
Page 80

SR850 Basics
dt
+ V
dC
dt
=
dQ
dt
= i
Cures for inductively coupled noise include:
1) Removing or turning off the interfering
noise source.
2) Reduce the area of the pick-up loop by
using twisted pairs or coaxial cables, or
even twisting the 2 coaxial cables used in
differential connections.
3) Using magnetic shielding to prevent the
magnetic field from crossing the area of
the experiment.
4) Measuring currents, not voltages, from
high impedance detectors.
Resistive coupling or ground loops
Currents flowing through the ground connections
can give rise to noise voltages. This is especially a
problem with reference frequency ground currents.
Experiment
Detector
Microphonics
Not all sources of noise are electrical in origin.
Mechanical noise can be translated into electrical
noise by microphonic effects. Physical changes in
the experiment or cables (due to vibrations for
example) can result in electrical noise over the
entire frequency range of the lock-in.
For example, consider a coaxial cable connecting
a detector to a lock-in. The capacitance of the
cable is a function of its geometry. Mechanical
vibrations in the cable translate into a capacitance
that varies in time, typically at the vibration frequency. Since the cable is governed by Q=CV,
taking the derivative, we have
dV
C
Mechanical vibrations in the cable which cause a
dC/dt will give rise to a current in the cable. This
current affects the detector and the measured
signal.
Some ways to minimize microphonic signals are:
I(t)
Noise Source
In this illustration, the detector is measuring the
signal relative to a ground far from the rest of the
experiment. The experiment senses the detector
signal plus the voltage due to the noise source's
ground return current passing through the finite
resistance of the ground between the experiment
and the detector. The detector and the experiment
are grounded at different places which, in this
case, are at different potentials.
Cures for ground loop problems include:
1) Grounding everything to the same physical point.
2) Using a heavy ground bus to reduce the
resistance of ground connections.
3) Removing sources of large ground currents from the ground bus used for small
signals.
1) Eliminate mechanical vibrations near the
experiment.
2) Tie down cables carrying sensitive signals
so they do not move.
3) Use a low noise cable that is designed to
reduce microphonic effects.
Thermocouple effects
The emf created by junctions between dissimilar
metals can give rise to many microvolts of slowly
varying potentials. This source of noise is typically
at very low frequency since the temperature of the
detector and experiment generally changes slowly.
This effect is large on the scale of many detector
outputs and can be a problem for low frequency
measurements, especially in the mHz range.
Some ways to minimize thermocouple effects are:
1) Hold the temperature of the experiment or
detector constant.
2) Use a compensation junction, i.e. a
second junction in reverse polarity which
generates an emf to cancel the thermal
potential of the first junction. This second
junction should be held at the same temperature as the first junction.
3-26
Page 81

NOISE MEASUREMENTS
SR850 Basics
Lock-in amplifiers can be used to measure noise.
Noise measurements are generally used to characterize components and detectors.
The SR850 measures input signal noise AT the
reference frequency. Many noise sources have a
frequency dependence which the lock-in can
measure.
How does a lock-in measure noise?
Remember that the lock-in detects signals close to
the reference frequency. How close? Input signals
within the detection bandwidth set by the low pass
filter time constant and roll-off appear at the output
at a frequency f=f
appears as noise at the output with a bandwidth of
DC to the detection bandwidth.
The noise is simply the standard deviation (root of
the mean of the squared deviations)of the measured X, Y or R . The SR850 can measure this
noise exactly by recording the output quantity on a
chart display and then calculating the standard
deviation using the trace math functions. The
noise, in Volts/√Hz, is simply the standard deviation divided by the square root of the equivalent
noise bandwidth of the time constant.
For Gaussian noise, the equivalent noise bandwidth (ENBW) of a low pass filter is the bandwidth
of the perfect rectangular filter which passes the
same amount of noise as the real filter. The
ENBW is displayed along with the time constant in
the GAIN/TC menu.
. Input noise near f
sig-fref
ref
moving average of X is computed. This is the
mean value of X over some past history. The
present mean value of X is subtracted from the
present value of X to find the deviation of X from
the mean. Finally, the moving average of the absolute value of the deviations is calculated. This calculation is called the mean average deviation or
MAD. This is not the same as an RMS calculation.
However, if the noise is Gaussian in nature, then
the RMS noise and the MAD noise are related by
a constant factor.
The SR850 uses the MAD method to estimate the
RMS noise quantities Xn, Yn and Rn. The advantage of this technique is its numerical simplicity
and speed.
The noise calculations for X, Y and R occur at
512 Hz. At each sample, the mean and moving
average of the absolute value of the deviations is
calculated. The averaging time (for the mean and
average deviation) depends upon the time constant. The averaging time is selected by the
SR850 and ranges from 10 to 80 times the time
constant. Shorter averaging times yield a very
poor estimate of the noise (the mean varies rapidly
and the deviations are not averaged well). Longer
averaging times, while yielding better results, take
a long time to settle to a steady answer.
To change the settling time, change the time constant. Remember, shorter settling times use smaller time constants (higher noise bandwidths) and
yield noisier noise estimates.
Noise estimation
The above technique, while mathematically sound,
can not provide a real time output or an analog
output proportional to the measured noise. For
these measurements, the SR850 can estimate the
X, Y or R noise directly.
To display or record the noise of X, for example,
simply define a trace as Xn (in the Trace/Scan
menu). The quantity Xn is computed in real time
and is an estimate of the noise of X. The quantities
Yn and Rn are estimations of the Y noise and R
noise.
The quantity Xn is computed from the measured
values of X using the following algorithm. The
The quantities Xn, Yn and Rn are displayed in
units of Volts/√Hz. The ENBW of the time constant
is already factored into the calculation. Thus, the
mean value of Xn should not depend upon the
time constant.
The SR850 performs the noise calculations all of
the time, whether or not Xn, Yn or Rn are being
recorded or displayed. Thus, as soon as Xn is displayed, the value shown is up to date and no settling time is required. If the sensitivity is changed,
then the noise estimate will need to settle to the
correct value.
For most applications, noise estimation and standard deviation calculations yield the same answer.
3-27
Page 82

SR850 Basics
Which method you use depends upon the requirements of the experiment.
R noise
The quantity Rn can be somewhat hard to understand. For example, suppose X and Y are equally
noisy and centered about zero. The values of R
are always positive (magnitude) and thus average
to a nonzero value. In this case, X and Y noise
result in an average R which can be interpreted as
the minimum detectable value of R. Increasing the
time constant reduces the X and Y output noise
and reduces this average value of R. The calculation of R noise by either method will typically yield
a value smaller than either Xn or Yn. This is
because X and Y have both positive and negative
values with a zero center yielding large deviations
while R is always positive with a non zero mean
and has smaller deviations. In this case, R noise is
mathematically defined but not indicative of the
Gaussian noise typically measured.
If there is a nonzero steady state value of R such
that the noise excursions of R are small compared
with the mean R, then R noise is meaningful. This
is the case when measuring noise in the presence
of real detectable signal. In this case, the value Rn
approaches Xn and Yn.
3-28
Page 83
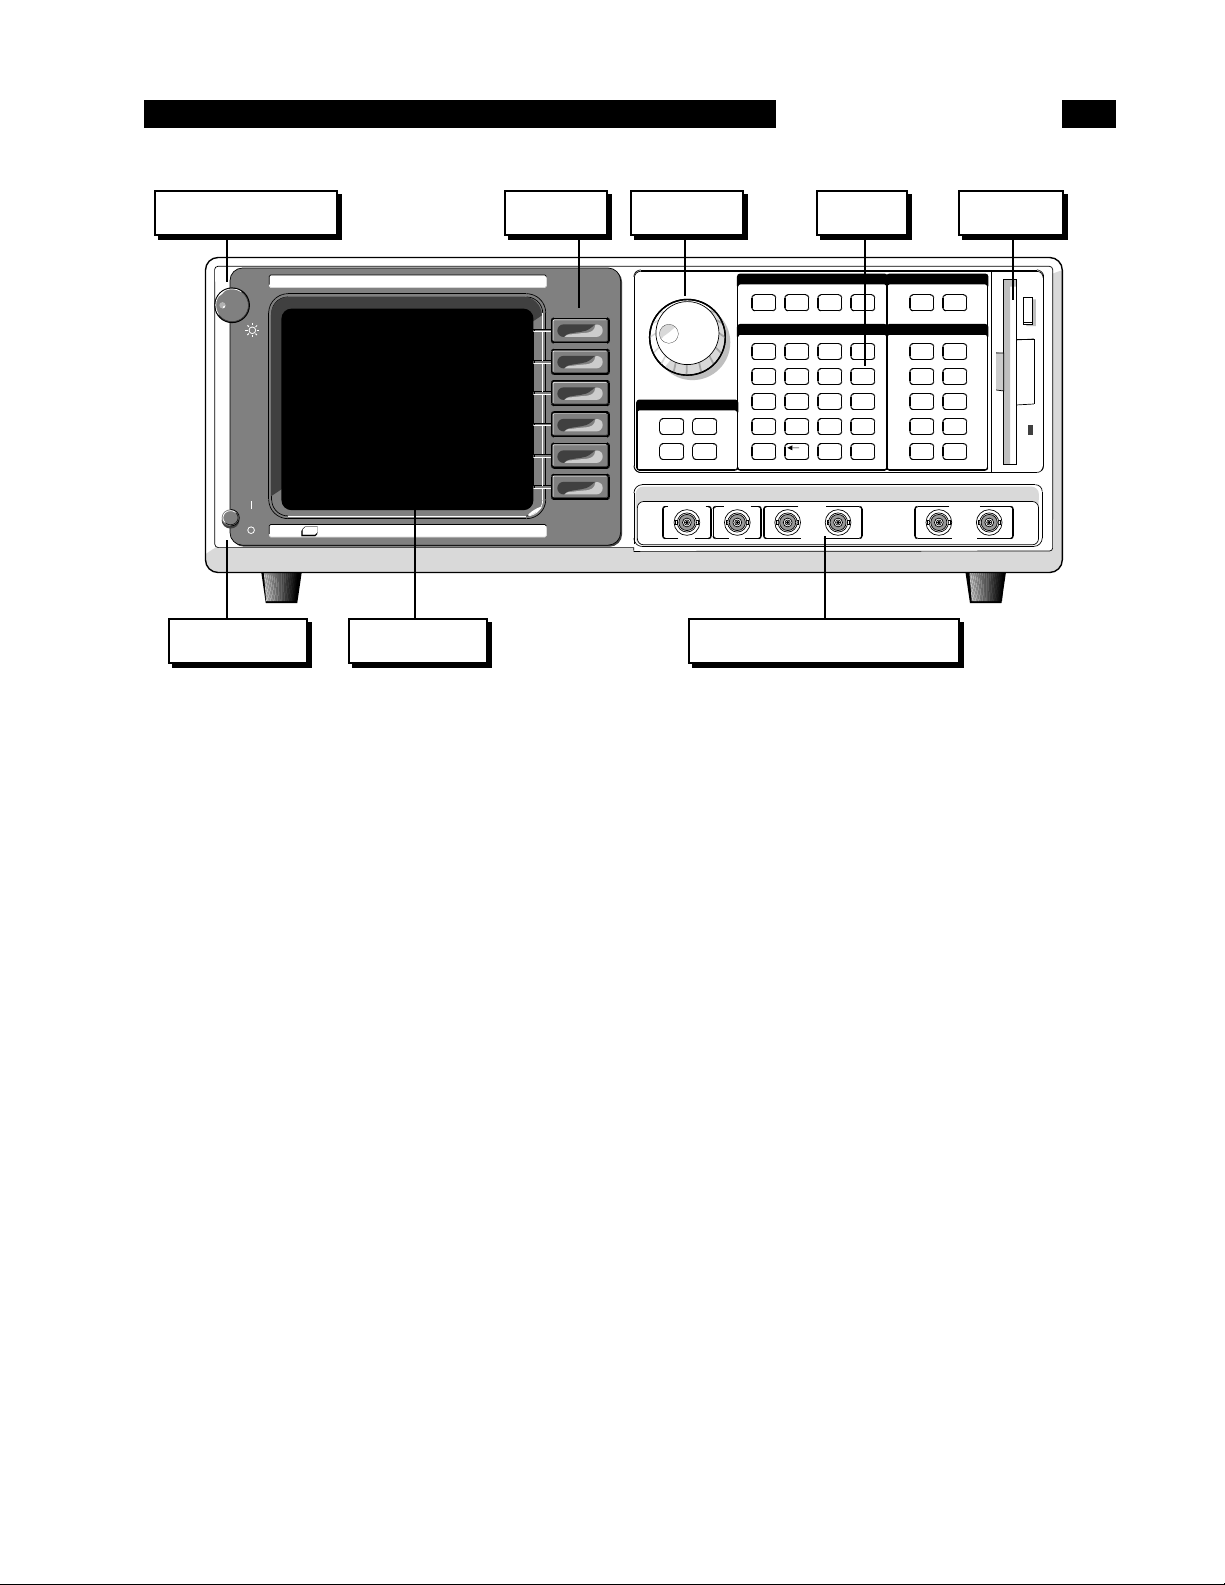
POWER BUTTON
The SR850 is turned on by pushing in the power
button. The video display may take a few seconds
to warm up and become visible. Adjust the brightness until the screen is easily readable.The model,
firmware version and serial number of the unit are
displayed when the power is turned on.
A series of internal tests are performed at this
point. Each test is displayed as it is performed and
the results are represented graphically as OK or
NOT OK. The tests are described below.
RAM
This test performs a read/write test to the
processor RAM. In addition, the nonvolatile
backup memory is tested. All instrument
settings are stored in nonvolatile memory
and are retained when the power is turned
off. If the memory check passes, then the
instrument returns to the settings in effect
when the power was last turned off. If there
is a memory error, then the stored settings
are lost and the default settings are used.
ROM
This test checks the processor ROM.
CLR
This test indicates whether the unit is being
reset. To reset the unit, hold down the
backspace [←] key while the power is
turned on. The unit will use the default settings. The default setup is listed in a later
chapter.
CLK
This test checks the CMOS clock and calendar for a valid date and time. If the there
is an error, the time will be reset to a default
time. Change the clock settings using the
SYSTEM SETUP menu.
DSP
This test checks the digital signal processor
(DSP).
VIDEO DISPLAY
The monochrome video display is the user interface for data display and front panel programming
operations. The resolution of the display is 640H
by 480V. The brightness is adjusted using the
brightness control knob located at the upper left
corner. As with most video displays, do not set the
brightness higher than necessary. The display
may be adjusted left/right and up/down in the
Screen Settings function in the SYSTEM SETUP
menu.
Power Button
Brightness Control
Soft Keys
Spin Knob
Key Pad
Disk Drive
Front Panel BNC Connectors
Video Display
FRONT PANEL
4-1
W
R S T
M N O
J
G H I
B C A D E F
Y Z
P U Q
V X
K L
AUTO
RESERVE
AUTO
GAIN
AUTO
PHASE
AUTO
SCALE
ALT EXP ENTER
0
_
CURSOR
MAX/MIN
.
1 3
CURSOR
SETUP
2
4 6
EDIT
MARK
5
7 9
MARK
8
START
CONT
CURSOR ACTIVE
DISPLAY
PAUSE
RESET
DISK
AUX
OUTPUTS
TRACE
SCAN
GAIN
TC
REF
PHASE
PRINT
SYSTEM
SETUP
MATH
DISPLAY
SCALE
OUTPUT
OFFSET
INPUT
FILTERS
HELP
MODEL SR850 DSP LOCK-IN AMPLIFIER
STANFORD RESEARCH SYSTEMS
SRS
AUTO
SYSTEM
MENU
ENTRY
CONTROL
100M /15pF
1M
REFERENCE IN
SIGNAL IN
SINE OUT
50
OUTPUT
<20mA
CH1 A-ICH2 B
Ω Ω
Ω
LOCAL
Page 84

Front Panel
The main area of the display is occupied by the
output display(s). Both single and dual trace displays are available. In addition, each display can
be formatted as a large numeric readout with bar
graph, a polar graph, or a strip chart.
A complete description of the screen display
options follows in the next section.
SOFT KEYS
The SR850 has a menu driven user interface. The
6 soft keys to the right of the video display have
different functions depending upon the information
displayed in the menu boxes at the right of the
screen. In general, the soft keys have two uses.
The first is to toggle a feature on and off or to
choose between various options. The second is to
highlight a parameter which is then changed using
the spin knob or numeric keypad. In both cases,
the soft keys select the parameters which are displayed adjacent to them.
KEYPAD
The keypad consists of five groups of keys. The
ENTRY keys are used to enter numeric parameters which have been highlighted by a soft key.
The MENU keys select a menu of soft keys.
Pressing a menu key will change the menu boxes
which are displayed next to the soft keys. Each
menu presents a group of related parameters and
functions. The CONTROL keys start and stop
actual data acquisition, select the cursor and
toggle the active display. These keys are not in a
menu since they are used frequently and while displaying any menu. The SYSTEM keys print the
screen to a printer and display help messages.
Once again, these keys can be accessed from any
menu. The AUTO keys perform auto functions and
are accessible from any menu.
A complete description of the keys follows in the
next section.
SPIN KNOB
The spin knob is used to adjust parameters which
have been highlighted using the soft keys. Most
numeric entry fields may be adjusted using the
knob. Some parameters with many options, sensitivity for example, use the knob to select the
desired option. In addition, functions such as display zooming and scrolling use the knob as well.
In these cases, the knob function is selected by
the soft keys. The [CURSOR] key, which can be
pressed at any time, will set the knob function to
scrolling the cursor if there is a strip chart displayed.
DISK DRIVE
The 3.5" disk drive is used to store data and instrument settings. Double sided, double density disks
should be used. The disk capacity is 720k bytes
formatted. The disk format is DOS compatible.
Disks written by the SR850 may be read by PC
compatible computers equipped with a 3.5" drive
and DOS 3.0 or higher.
Only use double sided double density (DS/DD)
disks. Do not use high density (DS/HD) disks.
FRONT PANEL BNC CONNECTORS
Refer to the previous section, SR850 Basics, for
detailed information about each input or output.
Reference Input
The reference input can be a sine wave (rising
zero crossing detected) or a TTL pulse or square
wave (rising or falling edge). The input impedance
is 1 MΩ AC coupled (>1 Hz) for the sine input. For
low frequencies (<1 Hz), it is necessary to use a
TTL reference signal. The TTL input provides the
best overall performance and should be used
whenever possible.
Sine Out
The internal oscillator output has a 50Ω output
impedance and varies in amplitude from 4 mVrms
to 5 Vrms. The output level is specified into a high
impedance load. If the output is terminated in a
low impedance, such as 50Ω, the amplitude will be
less than the programmed amplitude (half for a
50Ω load).
This output is active even when an external reference is used. In this case, the sine wave is phase
locked to the reference and its amplitude is programmable.
A TTL sync output is provided on the rear panel.
This output is useful for triggering scopes and
other equipment at the reference frequency. The
TTL sync output is a square wave derived from the
zero crossings of the sine output.
4-2
Page 85

Ch1 & Ch2 Outputs
The Channel 1 and Channel 2 outputs can be configured to output a voltage from -10 V to +10 V
proportional to X, Y, R, θ, or Traces 1 through 4.
±10 V is full scale. The outputs can source 10 mA
maximum.
Signal Inputs
The input mode may be single-ended, A, or differential, A-B. The A and B inputs are voltage inputs
with 10 MΩ, 25 pF input impedance. Their connector shields are isolated from the chassis by 10 Ω
(Ground) or 1 kΩ (Float). Do not apply more than
50 V to either input. The shields should never
exceed 1 V. The I (current) input is 1 kΩ to a virtual ground.
Front Panel
4-3
Page 86

Front Panel
4-4
Page 87
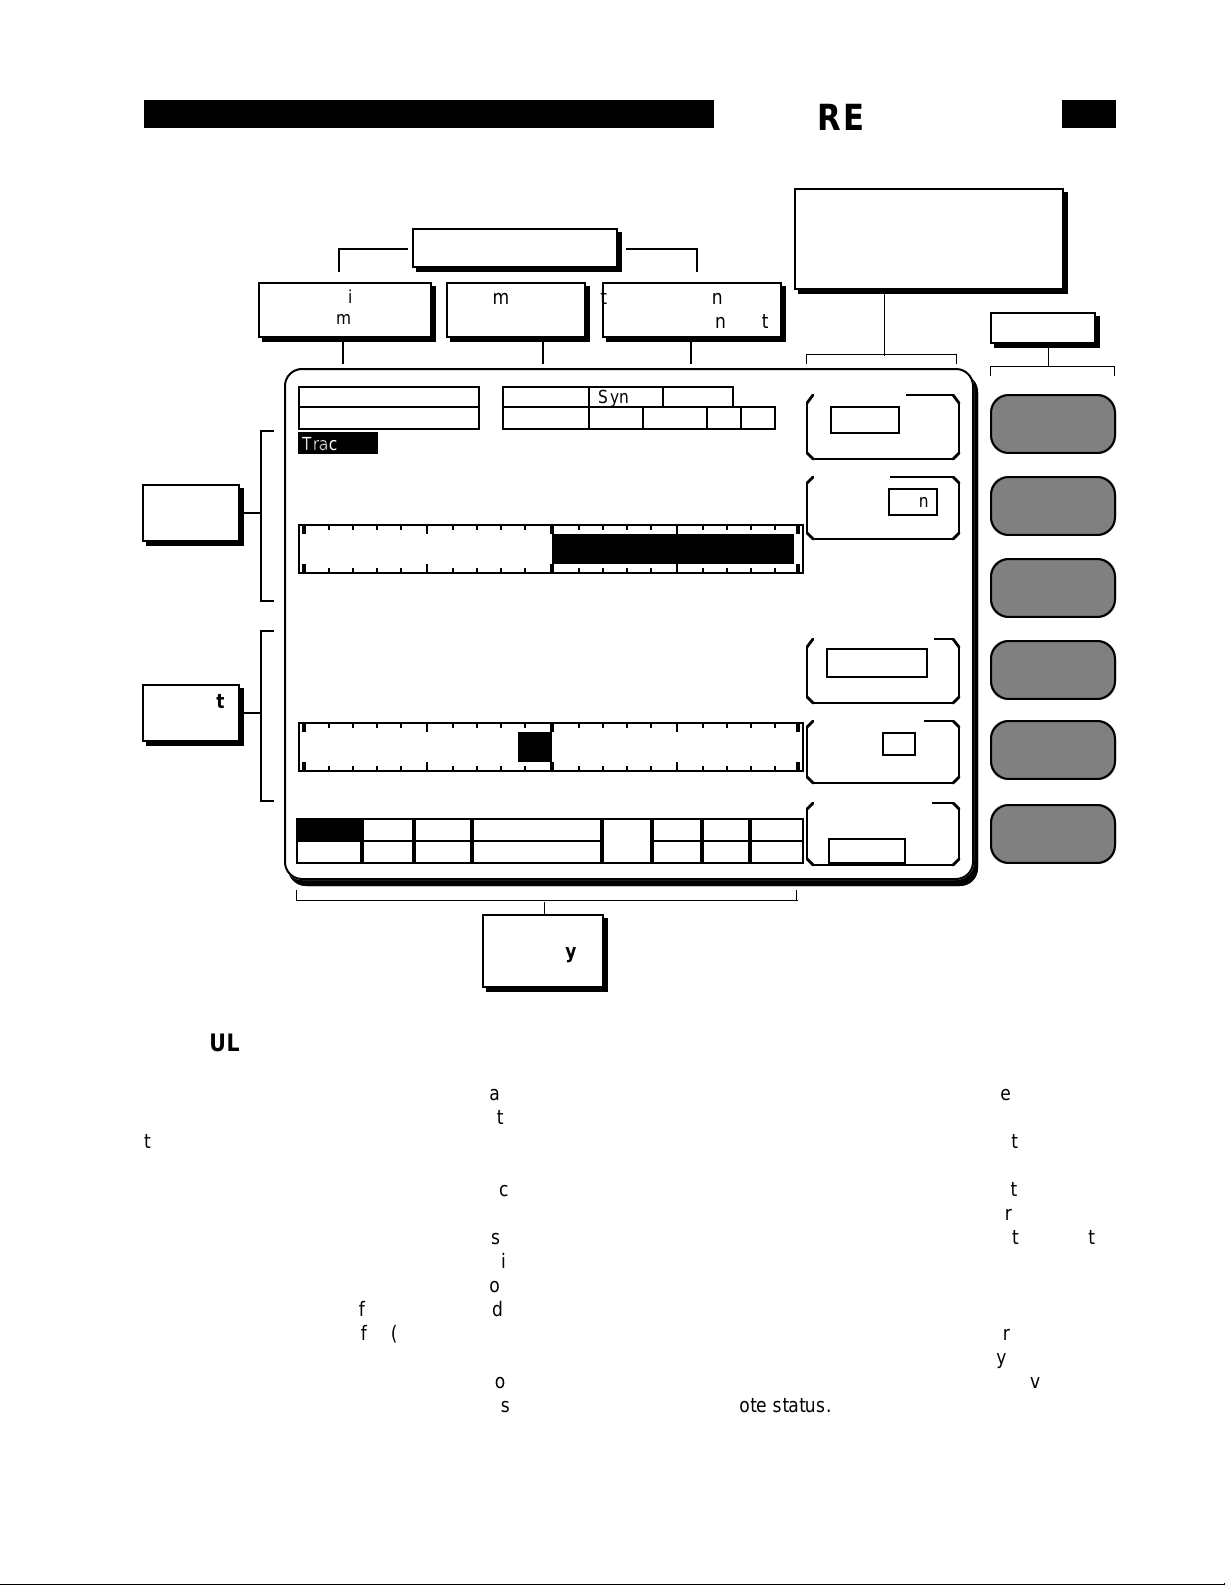
Lock-in Parameters
Trace 1
Stop
Soft Keys
Sensitivity and
Dynamic Reserve
Time Constant
and Slope
Input configuration
and signal filters
Bottom
Display
SCREEN DISPLAY
DEFAULT DISPLAY
The SR850's default display is shown above. This
is the display format in effect when the unit is
turned on.
This screen resembles a "normal" lock-in front
panel. The lock-in setup is displayed across the
top of the screen. The sensitivity, reserve, time
constant, prefilters and input configuration are all
easily visible. The upper numeric readout and bar
graph show the value of X (Rcosθ) and the lower
graph shows the value of Y (Rsinθ).
The bar graphs are normally scaled so that plus
full scale is at the right end, minus full scale is at
the left end, and zero is in the middle. Whenever
the sensitivity is changed, the bar graphs are
scaled to the full scale sensitivity. The
[AUTO SCALE] key will scale the active display to
the actual measured signal (the center remains
zero). The range and center of a bar graph may be
manually adjusted to expand a portion of the
scale.
Status indicators are displayed across the bottom
of the screen. These include the reference mode,
unlock alert, reference frequency, harmonic
detect, overloads, and GPIB/RS232 activity, error
and remote status.
Soft Key Definitions.
Pressing the corresponding
soft key will either highlight a
field or select an option.
Top
Display
Full Scale = 10 mV
Dyn Reserve = 0 dB
100 mS
12 dB/oct Line 2xLin AC A
X
X = 9.7284 mV
± 10.000 e-3 0.0 V
Trace 2
Y
Y =-1.2050 mV
± 10.000 e-3 0.0 V
Intrnl
Fr= 100.00 Hz
Harmonic= 1 LOCLOCK
Syncro
Sensitivity
10 mV f.s.
60 dB gain
Reserve
Max
Time Constant
Filter dB/oct.
18 24
Synchronous
Off
< 200Hz
Min
Manual
100 mS
1.2 Hz
6 12
Status and
activity
indicators
4-5
Page 88

Screen Display
DATA TRACES
The SR850 collects and displays data in the form
of traces. There are four data traces which may be
defined. Each trace is defined as A•B/C where the
parameters A, B, and C are chosen from X, Y, R,
θ, Xnoise, Ynoise, Rnoise, Aux Inputs 1-4,
Frequency, and unity (1). C can also be any quantity squared. The traces are defined in the TRACE/
SCAN menu.
Only data traces may be displayed. In order to
display the quantity X, it is necessary to define a
trace to be X and then choose to display that
trace.
When the unit is reset, the traces are defined as
follows:
Trace 1 X
Trace 2 Y
Trace 3 R
Trace 4
where B and C are set to unity in each case.
In most cases, the default trace definitions will suffice. For specialized situations, the traces may be
redefined to fit the experiment. Some examples:
Trace 3 R/AI1 Magnitude/Aux Input 1. This
normalizes the magnitude to
an external slowly varying
signal. (detector output normalized to laser power for
instance.)
Trace 4 Xn Xnoise. The SR850 calculates
the rms noise of X in the bandwidth determined by the time
constant.
Trace 3 AI3 Aux Input 3. Store and display
the value of Aux Input 3. The
SR850 can monitor an external voltage while recording
normal lock-in quantities such
as X, Y, R or θ.
Trace 4 F Frequency. Store the refer-
ence frequency along with the
X, Y, R or θ.
4-6
Page 89
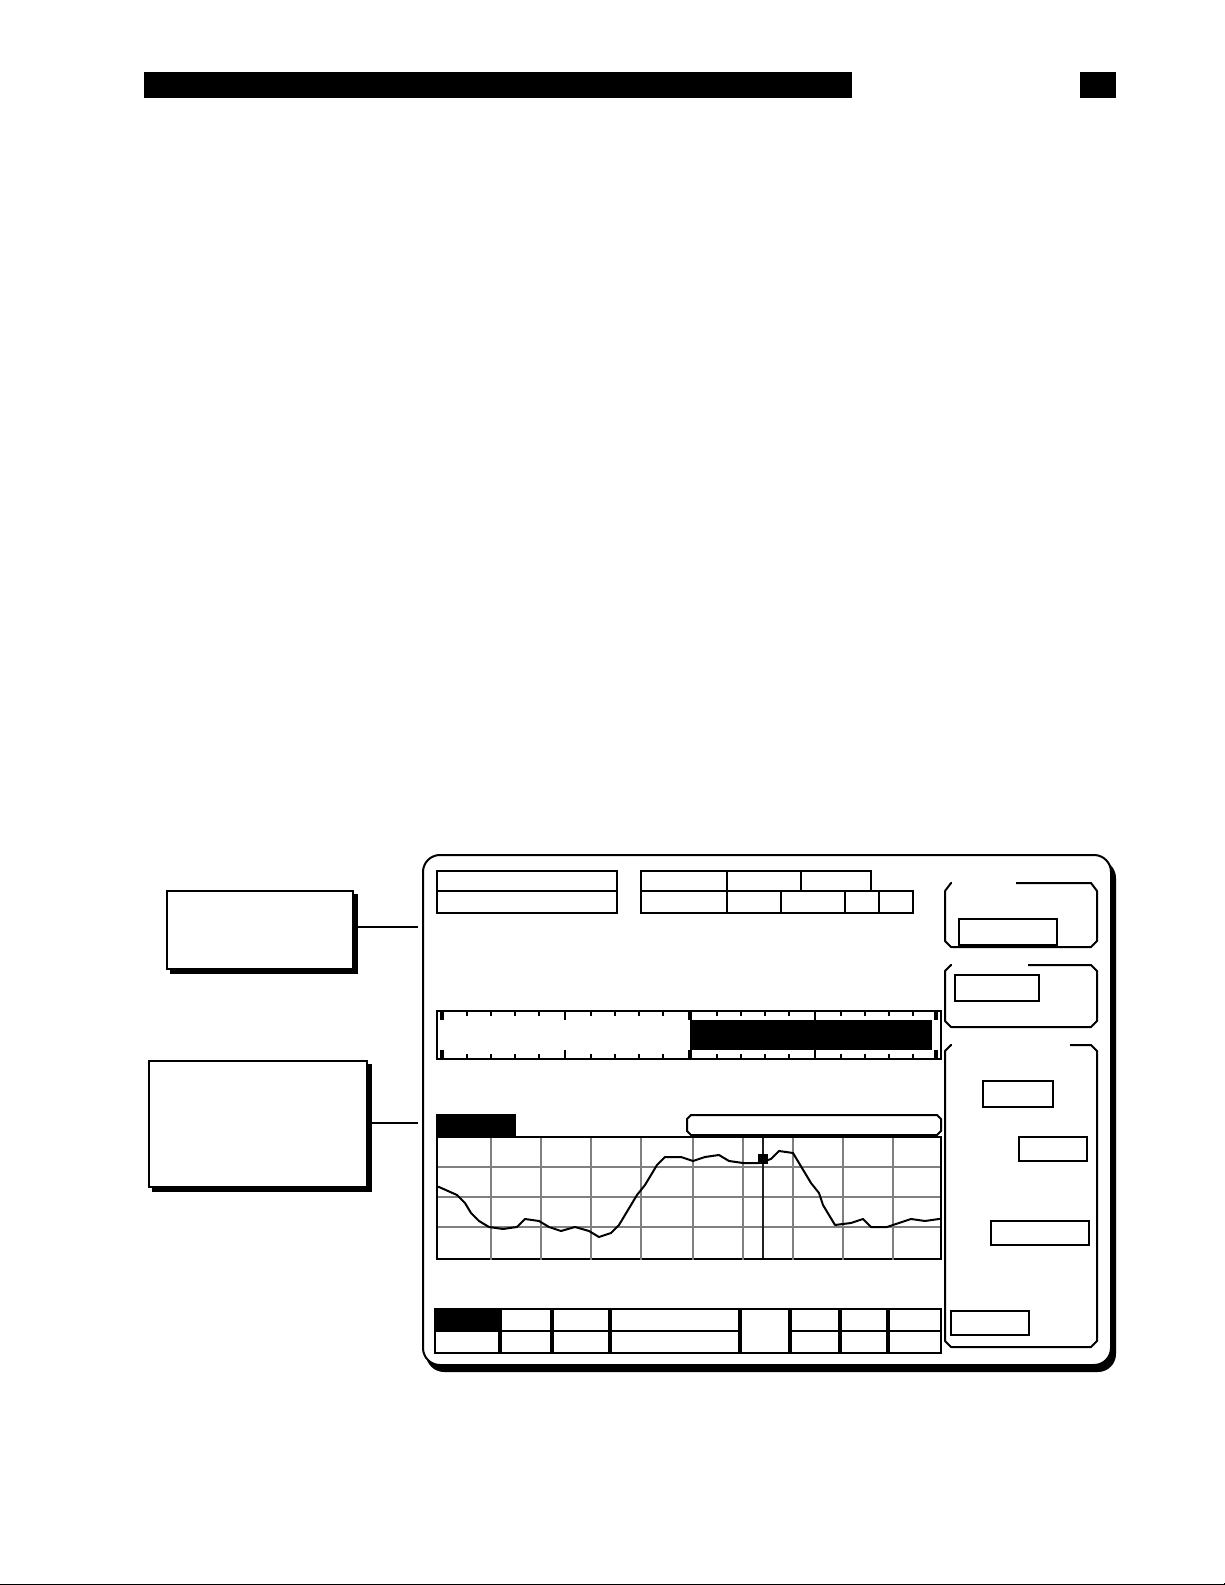
SINGLE and DUAL TRACE DISPLAYS
Screen Display
The screen can be formatted as a single trace
(Single) display or a dual trace (Up/Down) display.
The screen format is selected in the DISPLAY/
SCALE menu. There are three displays which may
be configured, the Single screen display and the
Top and Bottom displays for the split screen. Each
display can show a different trace using a separate display type.
There are three different display types - Bar (with
large numbers), Polar, and Chart (of stored traces
only). The Bar graph resembles a "normal" lock-in
display. The Polar graph plots X and Y on a circular graph to illustrate the signal as a vector relative
to the reference. The Chart displays stored data in
a strip chart form, complete with zooming, panning
and cursor. In order to use the analysis functions
such as curve fitting, the data must be stored in
the buffer and displayed in a strip chart.
The default screen (pg. 4-5) is a dual trace display
where the top display shows Trace 1 (X) and the
bottom display shows Trace 2 (Y). Both displays
are bar graphs.
Remember, only data traces may be displayed.
The traces are defined in the TRACE/SCAN
menu. The choices of which traces are displayed,
and in which formats, are selected in the
DISPLAY/SCALE menu.
A dual trace screen showing both Bar and Chart
displays is shown below. Each display is labelled
with a trace identifier indicating which trace is
being displayed. The trace definition is also
shown. In the screen below, the top display is
showing Trace 1 which is defined to be X.
One of the displays is the active display. The
active display is denoted by displaying the trace
identifier in inverse video (bottom display below).
Certain functions, such Auto Scale and cursor
movement, affect the active display only. The
[ACTIVE DISPLAY] key is used to switch the
active display between the top and bottom displays. A full screen display is always the active
display.
Top display trace
identifier and trace
definition.
Bottom display trace
identifier and trace
definition. Shown in
inverse to indicate the
active display.
Full Scale = 10 mV
Dyn Reserve = 0 dB
Trace 1
X
100 mS
12 dB/oct Line 2xLin AC A
Syncro
X = 9.7284 mV
± 10.000 e-3 0.0 V
Trace 2
Trace 2
center = 0.0 ± 50.00 e-3 V
Stop
Y
10 S /div 0.000 S
Fr= 100.00 HzIntrnlStop
Harmonic= 1 LOCLOCK
36.000 S 58.332 e-3
Format
Single
Up/Down
Monitor
Settings
Input/Output
Display Scale
Full Top
Bottom
Type: Chart
Trace: 2
±
50.0 e-3
@ 0.0
10 S /div
4-7
Page 90

Screen Display
4-8
Page 91
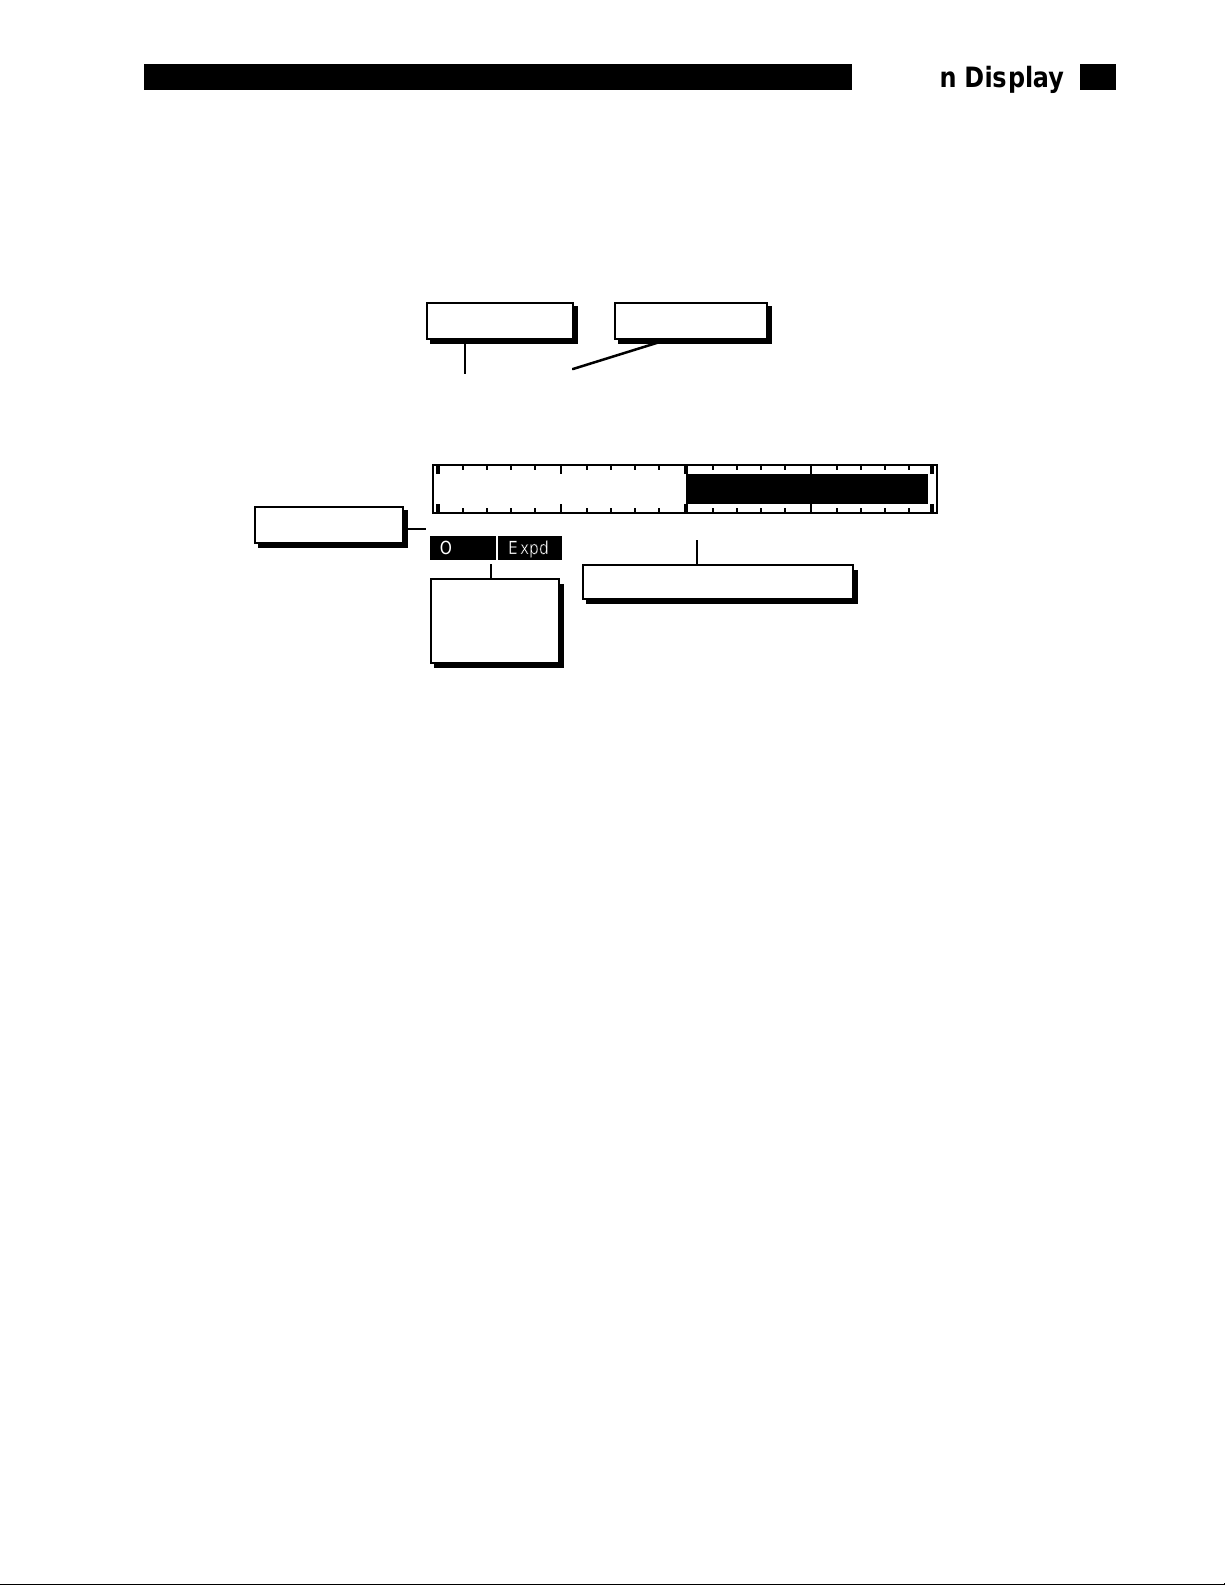
ExpdOffst
Screen Display
BAR GRAPHS
The most commonly used display type is the Bar graph with large numeric readout. This display most closely
resembles a "normal" lock-in. The bar graph display is shown below. The bar graph only occupies half of the
screen, even when the screen format is full height. Thus, it generally makes sense to use the bar graph in
split screen mode and show two bar graphs.
Trace Identifier Trace Definition
Trace 1
X
X = 9.7284 mV
Full scale range
Trace Identifier and Active Display
The bar graph is labelled with a trace identifier
above it. This indicates which trace is being displayed. The trace definition is shown next to the
identifier. If this display is the active display, the
trace identifier will be in inverse. When a bar graph
is the active display, the [AUTO SCALE] key will
scale the bar graph. There is no cursor function for
this display. Pressing the [CURSOR] key will not
activate a cursor.
± 10.000 e-3 0.0 V
Trace Offset
and Expand
Indicators
Center value and Trace Units
graph to expand a portion of the full scale range
around a nominal value. The bar will always be
drawn from the center (nominal value).
For the simple traces, X, Y, and R, changing the
sensitivity will automatically scale the bar graphs
so the range is equal to the sensitivity and zero is
at the center. For other trace definitions, the bar
scaling is not changed when the sensitivity is
changed.
When the trace definition is simple (X, Y, R, θ or F)
the trace definition is displayed in the large numeric readout (X=). If the trace is defined as Xn, Yn,
Rn, AI1, AI2, AI3 or AI4, or involves a product or
ratio (A•B/C where either B or C or both are nonunity), then the large readout simply shows 'T1='
(for Trace 1) instead of the actual parameter(s)
being monitored. The trace definition above the
readout is always displayed fully however.
Bar Range and Center
The graph range and center value are displayed
below the graph. These values are in the units of
the displayed trace.
Bar Scaling
The bar graph scaling can be changed in the
DISPLAY/SCALE menu. Both the center value
and the range can be changed. This allows the bar
Using [AUTO SCALE] will adjust the range to
make the measured output greater than 40% of
the new range. [AUTO SCALE] always returns the
center to zero.
Rate
The bar graph is updated at a rate of about 7 Hz
while the numeric readout changes at about 2 Hz.
When the data is noisy, the bar graph more accurately shows the "noisiness" while with steady
readings, the numeric display is an accurate
measure of the signal.
Offset and Expand
If the trace being shown is affected by a non-zero
offset or a non-unity expand, then the Offst and
Expd alert indicators are turned on.
4-9
Page 92

ExpdOffst
and the resultant vector exceed full scale by √2 (at
Screen Display
POLAR GRAPHS
The polar graph is a convenient way to view magnitude and phase. The signal is represented as a vector on
an X-Y coordinate axes. The full screen polar display is shown below. The split screen polar graph is half as
big.
Y Axis (90°)
Signal Vector
X Axis (0°)
Trace Offset
and Expand
Indicators
Plot of X and Y
The polar graph is not labelled - there is no trace
identifier above it. This is because the polar graph
always plots X and Y as a vector. This display
cannot be changed to display any other traces.
Changes made to X and Y, such as offsets, will
change the vector on the polar graph. Changes
made to R, such as offset, will not.
The [ACTIVE DISPLAY] key will not select this display since there is no cursor associated with it and
it cannot be autoscaled.
Scale
The graph is oriented like a normal X-Y axes.
Positive X is to the right and positive Y is up, and
zero is in the center. The four circles indicate 25%,
50%, 75% and 100% of full scale. The polar graph
is always scaled to the full scale sensitivity. Note
that X and Y can both be full scale in amplitude
Signal Vector
Coherent signals have a steady phase and the
signal vector will have a steady direction. Signals
which are noisy will move around in direction as
well as magnitude. The polar display can quickly
give a feeling for whether a signal is coherent or
not. Signals whose frequencies are close to, but
not synchronous with the reference frequency will
to rotate at the difference frequency between the
signal and reference.
Offset and Expand
If the either X or Y has a non-zero offset or a nonunity expand, then the Offst and Expd alert indicators are turned on. The vector is plots the offset
and expanded quantities X and Y. If X and Y have
unequal expands (differing gains), the signal
vector is generally not meaningful.
45°).
4-10
Page 93

Trace 2
ExpdOffst
Screen Display
STRIP CHARTS
Chart displays are used to view stored traces. Only stored traces have a time history, thus, only stored traces
may be displayed on a chart. The full screen chart display is shown below. If the split screen format is used,
the chart will display half as many vertical divisions but will be the same as the full size display in all other
aspects.
Trace Identifier Trace Definition Cursor Readout
Y 36.000 S 58.332 e-3
Trace Offset
and Expand
Indicators
Trace Identifier and Active Display
The chart is labelled with a trace identifier at the
upper left. This indicates which trace is being displayed. The trace definition is shown next to the
identifier. If this display is the active display, the
trace identifier will be in inverse. When a chart is
the active display, the [AUTO SCALE] key will
scale the chart so all of the displayed data is on
the graph. In addition, when a chart is the active
display, pressing the [CURSOR] key will activate
the cursor.
Chart Scaling
The graph vertical range is the center value plus
and minus the range. The center value is the value
of a data point located at the vertical midpoint of
the graph. The horizontal scale is the number of
seconds per division across the graph. The time
value of the right most point is shown at the
bottom right. When the most recent point is at the
right, the time shown will be 0.000 S.
center = 0.0 ± 50.00 e-3 V
center value
10 S /div
Vertical rangeVertical
Cursor region is
defined by heavy
dashed lines
Cursor is located at
the Min, Max, or
Mean of the data
within the cursor
region
0.000 S
Horizontal scale
The chart scaling can be changed in the
DISPLAY/SCALE menu. Both the vertical scale
(center value and range) and horizontal scale can
be changed. [AUTO SCALE] will automatically
adjust the vertical center and range to display all
of the data within the graph. [AUTO SCALE] will
not change the horizontal scale.
By changing the horizontal scale, the entire trace
buffer can be displayed at once or a small portion
may be expanded. If only a portion of the buffer is
being displayed, use the cursor to pan right and
left within the buffer.
Offset and Expand
If the trace being shown is affected by a non-zero
offset or a non-unity expand, then the Offst and
Expd alert indicators are turned on.
Time value of
right most point
4-11
Page 94

Screen Display
Data Scrolling
The chart display acts like a strip chart recorder
where the pen is drawing the most recent data.
For example, if the sample rate is 1 Hz (1 point
taken per second) and the horizontal scale is
10 S/div, then the graph displays 100 data points
(10 divisions x 10 points per division). As new data
is taken, the old data scrolls to the left at the rate
of 10 S/div. This is because new points are added
at a fixed location (right edge of the graph) just like
a strip recorder. In this case, the time value of the
right most point is 0.000 S meaning the most
recent data point.
The chart displays a fixed window in time which is
10 divisions wide (100 seconds in this case) starting Tright seconds ago (where Tright is the time
value of the right most point). Since the data is
always getting older, it scrolls left continuously
(whenever data is being taken).
desired display (top or bottom). When the cursor
readout is surrounded by this box, the knob
adjusts the position of the cursor region. Moving
the cursor beyond the edge of the graph pans the
display left (showing older data points) and right
(showing more recent data points). Remember,
the time window shown in the graph does not
change with time. As the data points get older, the
data will scroll to the left as new points are taken.
Cursor Display
The cursor readout displays the horizontal position
and the trace data at the cursor. The horizontal
position is displayed as time (from the beginning of
the trace), delay (time from the most recent point),
bin (number of data points since the start), and frequency (if the reference is internally swept). In this
illustration, the cursor point was taken 36 seconds
before the most recent point.
Cursor
The cursor region is the graph region between the
two heavy vertical dashed lines. The cursor region
may be set to 1 division (wide), 1/2 division
(norm), or a single vertical line (spot). The cursor
region does not change with horizontal scaling.
The cursor is the small square which seeks the
minimum, maximum, or mean of the data within
the cursor region. When seeking min or max, the
cursor is located at the position of the data point
which is the min or max. This allows peaks and
valleys in the data to be easily specified. When
seeking the mean, the X position of the cursor is at
the center of the cursor region and the Y position
is the mean of the data within the region. The
cursor type is defined in the CURSOR SETUP
menu.
Often the display is scaled such that there are
many more data points than can be resolved on
the display. The chart display is 496 pixels wide. If
more than that number of data points are being
displayed, then each horizontal position represents multiple data points. In this case, a vertical
line is drawn between the minimum and maximum
data points represented by a single horizontal
location. In this case, even the spot cursor region
represents multiple data points. The cursor will
seek the max, min or mean of these data points.
Pressing the [CURSOR] key will draw a box
around the cursor readout of the active chart display. Use the [ACTIVE DISPLAY] key to select the
Marks
While data is being added to the data buffer,
events may be marked using the [MARK] key.
Pressing [MARK] will tag the next trace buffer
location. A mark will appear on the chart and will
scroll with the data. This is analogous to marking a
real strip chart while it is recording. Marks are
useful for marking when an external event
occurred or when the experimental conditions
changed.
A maximum of eight marks may be placed in the
data buffer. A mark will appear on ALL stored
traces at the same buffer location. The different
mark symbols are shown below.
A mark is always placed at the buffer start to mark
the oldest (first) data point at the start of a scan.
The [EDIT MARK] key allows the mark data to be
viewed. The value of each stored trace and the
time the mark was placed is displayed. The user
can add comments to the mark data to label a specific event.
When trace data is saved to disk, the marks are
saved as well. When a trace is recalled from disk,
the marks are recalled as well. Existing marks are
replaced with the recalled marks.
4-12
Page 95

TRACE SCANS, SWEEPS & ALIASING
Screen Display
Trace and Scan parameters are selected in the
TRACE/SCAN menu.
Trace Storage
Having defined up to four data traces for an experiment, the issue of data storage needs to be
addressed. Only traces that are stored may be
displayed in strip chart form. If a graph or
record of a trace over time is desired, then that
trace's data must be stored. The SR850 can
record up to 64000 data points in memory. The
data buffer can store 64000 points of a single
trace, 32000 points of two traces, or 16000 points
of all four traces. When defining the traces, the
Store or Do Not Store option needs to be decided.
The default is all four traces stored.
Data Points and Bins
Data points stored in a trace are sometimes
referred to by their bin position within the trace
buffer. The oldest data point is bin0, the next point
is bin1, etc. A trace with N points numbers them
from 0 to N-1.
Sample Rate
The Sample Rate can be varied from 512 Hz down
to 62.5 mHz (1 point every 16 sec). The sample
rate sets how often points are added to the storage buffers. All stored traces are sampled at the
same rate (and at the same times).
In addition to the internal sample rates, samples
can be triggered by an external TTL trigger. This
mode is selected by increasing the sample rate
past 512 Hz. In this mode, a sample is recorded
within 2 ms of a rising edge trigger on the rear
panel Trigger input. Triggers which occur faster
than 512 Hz are ignored. When viewing an externally triggered data trace on a chart graph, set the
cursor readout to Bin (in the CURSOR SETUP
menu). This displays the horizontal position of the
cursor as bin or data point number rather than
time (for scaling purposes, the time scale of the
graph is based upon a 1 Hz sample rate - bins and
seconds are equivalent).
Scan Length
The Scan Length is the time duration of a single
scan expressed in seconds. The maximum scan
length is determined by the number of stored
traces (maximum storage buffer length) and the
sample rate. When storing a single trace, the max-
imum scan length is 125 seconds at 512 Hz or 12
days at 62.5 mHz (64000 points). Changing the
sample rate will only change the scan length if the
maximum number of data points is already being
used. Otherwise, the number of data points in the
scan is changed to keep the scan length constant.
The number of points in the buffer can vary from 1
to a maximum of 16000, 32000, or 64000 depending upon the number of traces being stored.
There is only one Scan Length, i.e. the number of
points stored will be the same for all traces being
stored.
Sweep Time
The scan length is the sweep time for frequency
sweeps and Aux Output sweeps. Swept parameters are synchronized with the data acquisition.
For example, if the internal reference is programmed to sweep from 1 kHz to 2 kHz, the
sweep will take a scan length to finish. The frequency will change once per stored point. Thus, if
the sample rate is 1 Hz and the scan length is 100
seconds, the frequency will change 100 times and
move from 1 kHz to 2 kHz in 100 seconds. At each
sample, the trace data is stored before the swept
parameter is changed. The next data point is
taken after one sample interval to allow the outputs to settle as long as possible.
End of Scan
When the scan is complete, data storage can stop
or continue.
The first case is called 1 Shot (data points are
stored for a single Scan Length). At the end of the
scan, data acquisition stops and swept parameters
are held at their final stop values.
The second case is called Loop. In this case, a
new scan is started at the end of each scan.
Scans repeat indefinitely until halted by the user.
The data buffer will store as many points as possible (16000, 32000 or 64000 depending upon the
number of stored traces). The buffer will start filling
at the start and will hold as many scans as will fit.
The buffer always holds at least one complete
scan. If the scan is short, then the buffer will hold
multiple scans of data. When the buffer end is
reached, the buffer starts filling at the beginning
again. The oldest data will be overwritten and lost.
This looping continues indefinitely. In this mode,
4-13
Page 96

Screen Display
the scan length is only meaningful is parameters
are being swept. Once the trace buffer has looped
around, the oldest point (at any time) is at bin#0
and the most recent point is at bin#k where k is
the buffer length (minus 1).
The default mode is Loop.
Default Scan
Upon reset, all four traces are stored for a maximum of 16000 points. The sample rate is 1 Hz, the
scan length is 16000 seconds and the scan mode
is Loop. The trace definitions are X, Y, R and θ for
Traces 1-4.
Starting and Stopping a Scan
The [START/CONT] and [PAUSE/RESET] keys
are used to control data acquisition. Basically, the
[START/CONT] key starts a scan or continues a
paused scan and the [PAUSE/RESET] key pauses
a scan or resets a finished scan. See the discussion of keypad operation later in this section for
details. Scans can also be controlled via the computer interfaces. See the programming section for
an explanation.
In addition, the rear panel Trigger input can be
used to start a scan. To select this mode, set the
Trigger Starts option in the AUX menu. In this
mode, a rising TTL trigger will act the same as the
[START/CONT] key. The sample rate can be
either internal or Triggered. In the first case, the
trigger starts the scan and data is sampled at the
programmed sample rate (up to 512 Hz). In the
latter case, the first trigger will start the scan and
data will be sampled at every subsequent trigger.
Aliasing Effects
In any sampled data stream, it is possible to
sample a high frequency signal such that it will
appear to be a much lower frequency. This is
called aliasing.
The samples represent a sine wave much slower
than 2 Hz that isn't actually present in the output!
The chart display of this trace will show a sine
wave at a very low frequency and will be rather
misleading. In this case, a much higher sampling
rate will solve the problem.
Aliasing occurs whenever the output signal
being sampled contains signals at frequencies
greater than 1/2 the sample rate. The effect is
most noticeable when trying to sample an output
frequency at an integer multiple of the sample rate
(as above). The above aliasing problem will be the
same for a 1 kHz output (500 times the sample
rate) as for the 2 Hz output.
Generally, the highest possible sample rate should
be used given the desired scan length and number
of stored traces. The lock-in time constant and
filter slope should be chosen to attenuate signals
at frequencies higher than 1/2 the sample rate as
much as possible.
Aliasing can occur with the polar and bar graph
displays as well. These displays sample the output
signal at a fixed rate.
For example, suppose the lock-in is detecting a
signal near 1 Hz with a relatively short time constant. The X output will have a DC component and
a 2 Hz component (2xf). If the sample rate is 2 Hz,
then the samples may be taken as illustrated
below.
1 second
4-14
Page 97
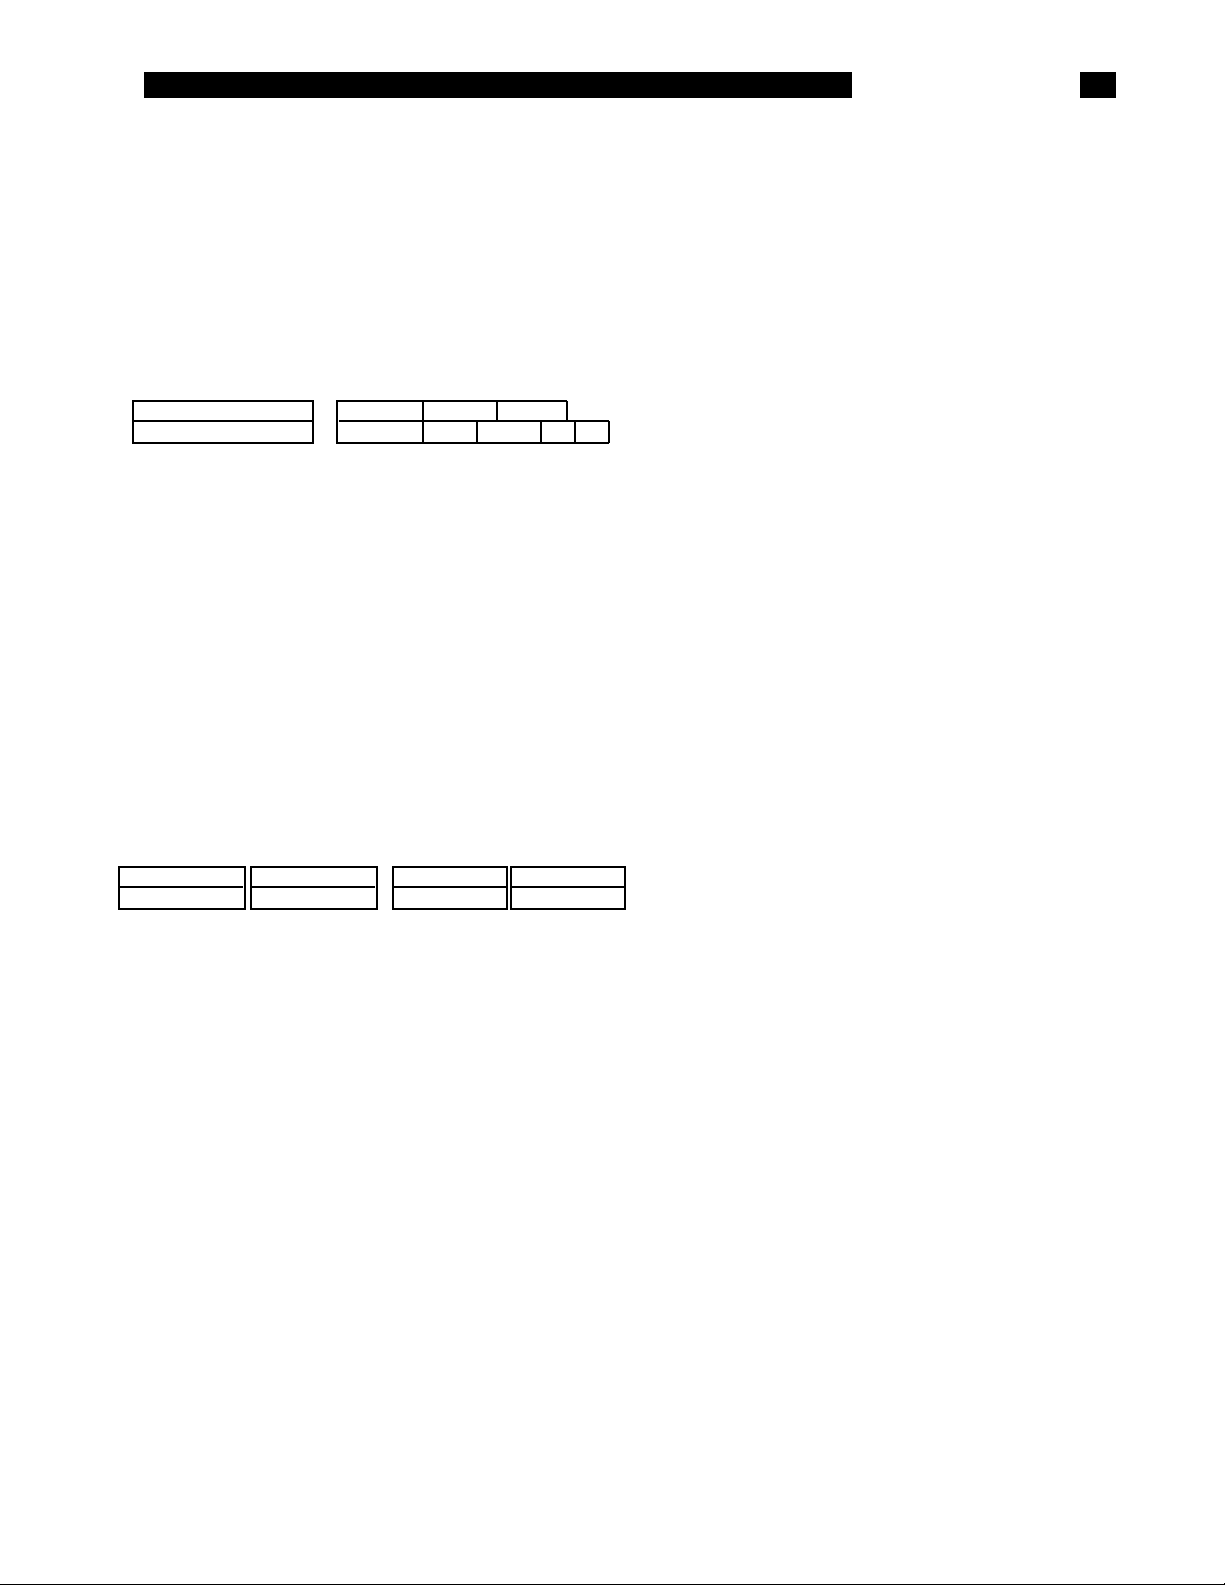
Screen Display
SETTINGS & INPUT/OUTPUT MONITOR
The upper two lines of the screen are the monitor
display (see the screen on pg. 4-5). The lock-in
settings (sensitivity, time constant, etc.) or the
lock-in signal measurements (X, Y, R, θ, and the
Aux Inputs) may be monitored. Use the DISPLAY
menu to select the type of monitor (Settings or
Input/Output).
Full Scale = 10 mV
Dyn Reserve = 40 dB
The Settings Monitor is shown above. The sensitivity, dynamic reserve, time constant and roll-off
are always displayed. When the synchronous
output filter is selected AND the detection frequency is below 200 Hz, then Syncro will be displayed.
If the detection frequency is above 200 Hz, synchronous filtering is not active and Syncro is not
displayed. When the external reference is below
10 Hz, the digital phase lock loop is active and
DigPll is displayed.
100 mS
12 dB/oct Line 2xLin AC A
Syncro DigPll
MENU DISPLAY
The Soft Key menu boxes define the functions of
the 6 soft keys to the right of the screen. The menu
boxes are grouped into menus. Pressing each of
the ten Menu keys will display a different menu of
boxes. Related functions are grouped into a single
menu.
In general, pressing a soft key does one of two
things. One is to toggle between 2 or 3 specific
options. An example is the Filter Slope box illustrated on page 4-5. Pressing the fourth soft key
toggles the slope from 6 to 12 to 18 to 24 and back
to 6 dB/oct.
The second soft key mode is to highlight an entry
field and knob function. An example would be the
Phase Adjust. Pressing this soft key will highlight
the phase setting. The phase may then be adjusted with the knob or entered as a value using the
numeric entry keys. Each menu is described at
length in a following section.
The input filters are shown when they are in, their
display boxes are empty when the corresponding
filter is out. The input coupling and type (A, A-B, or
I) are always shown.
X= 135.23 mV
Y= 22.78 mV
The Input/Output Monitor is shown above. The
values of X, Y, R and θ are shown, regardless of
the trace definitions or displays chosen. In addition, the readings of the rear panel Aux Inputs are
displayed. These readings are updated a few
times a second.
R= 137.14 mV A1= 0.000 V
A2= 0.000 V
A3= 0.000 V
A4= 0.000 V= 9.56 °θ
4-15
Page 98
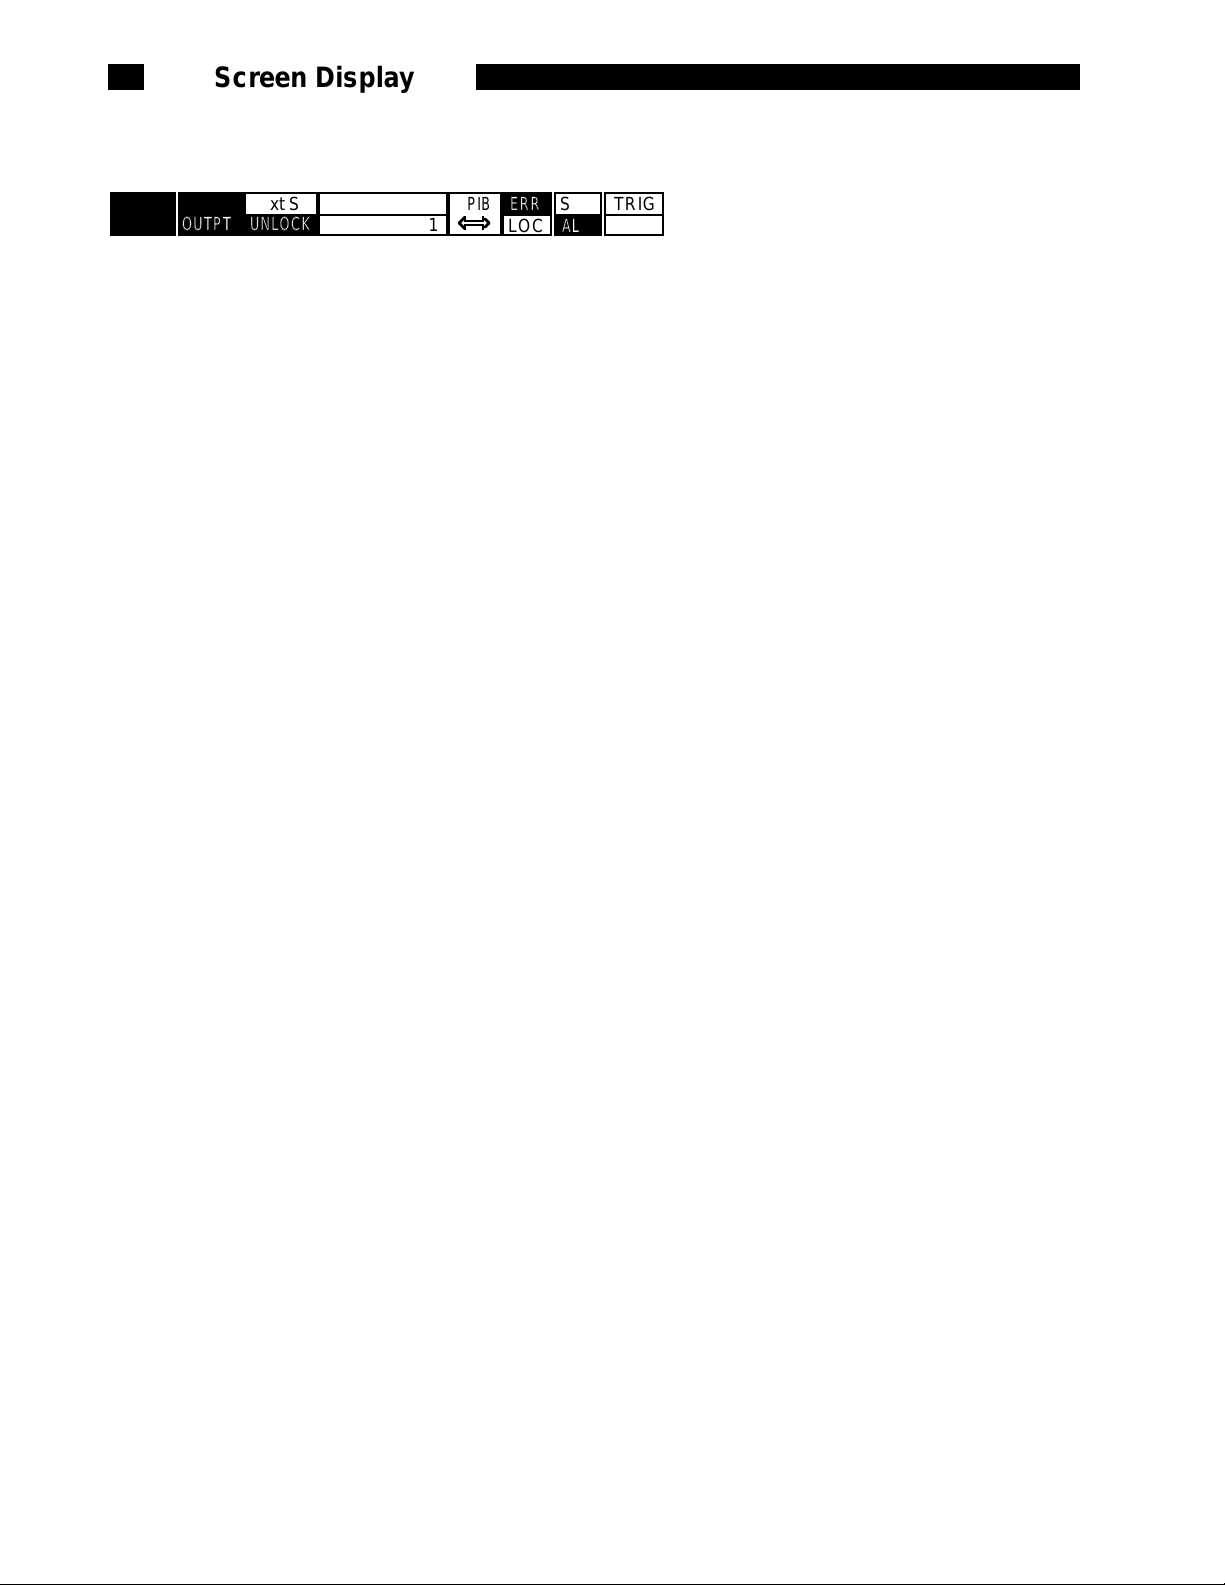
(1MΩ gain) or 100 nA DC or 14 nA AC (100MΩ
ALT
UNLOCK
OUTPT
FILTR
Run
RESRV
SRQ
Harmonic= 1
LOC
TRIG
ERR
Screen Display
STATUS INDICATORS
Fr= 100.00 HzExt S
GPIB
There are a number of status indicators which are
displayed at the bottom of the screen. These
include the scan, unlock, and overload indicators,
the reference frequency and source, and interface
status.
Stop • Run 1 • Run • Pause • Done
When the data buffers are reset (pressing
[PAUSE RESET] while paused or done), then
Stop will be indicated.
When a scan is in progress in the 1 Shot mode,
Run 1 is indicated. The storage of trace data in the
buffer continues until the scan is complete at
which time Done is displayed.
If a Loop scan is in progress, Run is displayed.
The storage of trace data in the buffer may continues indefinitely. When the buffer fills, the oldest
data is written over.
If the scan is paused (with the [PAUSE/RESET]
key for instance), then the Pause indicator will be
on. Pressing [START/CONT] will continue the
scan from a paused state.
RESRV • INPUT
If the analog signal amplifier overloads before the
phase sensitive detector, then RESRV or INPUT is
displayed.
RESRV indicates that the signal amplifier is overloaded. Change the sensitivity or increase the
dynamic reserve.
INPUT indicates that the actual signal input is
overloaded. This occurs for voltage inputs greater
than 1.4Vpk (unless removed by AC coupling) or
current inputs greater than 10 µA DC or 1.4 µA AC
gain). Reduce the input signal level.
FILTR
If an overload occurs in the low pass filters after
the PSD's, then FILTR is displayed. Increase the
time constant or filter roll-off or decrease the
dynamic reserve.
OUTPT
If the output (either X, Y, R or a trace output voltage) is greater than 1.09 times full scale, then
OUTPT is displayed. This can occur if the sensitivity is too low or if the output is expanded such that
the output voltage exceeds 10 V. Note that a trace
output can overload even if it is not being displayed on the screen or output to CH1 or CH2.
Intrnl • Sweep • Ext S • Ext + • Ext -
If the internal reference is being used, then Intrnl is
displayed. If the internal reference frequency is
being swept, then Sweep is displayed. When
using an external reference source, the reference
mode may be set to Sine (Ext S), Rising TTL edge
(Ext +), or Falling TTL edge (Ext -).
LOCK • UNLOCK
The UNLOCK indicator turns on if the SR850 can
not lock to the external reference. LOCK is displayed when the SR850 is successfully locked to
the reference. LOCK is always on when in internal
reference mode.
Fr= XX.YYY Hz
The reference frequency (internal or external) is
displayed continuously.
Harmonic = N
The SR850 can detect synchronous signals at N
times the reference frequency. Generally, N is
equal to 1.
GPIB • RS232
Flashes when there is activity on the computer
interfaces. This does not flash for printer or plotter
activity.
ERR
Flashes whenever there is a computer interface
error such as an illegal command or out of range
parameter is received. This does not flash for a
printer or plotter error.
LOC • REM
REM is on when the front panel is locked out by a
computer interface. No front panel adjustments
may be made. To return the unit to local control (if
4-16
Page 99

allowed), press the [HELP] key. LOC is on whenever local front panel control is allowed (usually
on).
SRQ
This indicator is on whenever a GPIB Service
Request is generated by the SR850. SRQ stays
on until a serial poll is completed.
ALT
Indicates that the ALTERNATE keypad is in use.
The ALTERNATE keypad uses the alphabetic legends printed below each key. To enter the ALT
mode, press the [ALT] key once. Pressing the
keys will now enter letters into the active entry
field. The [0]...[9], [.], [-], [←] and [ALT] have the
same function in the ALTERNATE keypad. To
return to the normal keypad, press the [ALT] key
again.
Screen Display
4-17
Page 100

Screen Display
4-18
 Loading...