

Page 1
SRS
STANFORD RESEARCH SYSTEMS
SR785
Two Channel Dynamic
Signal Analyzer
Page 2
SR785
Two Channel
Dynamic Signal
Analyzer
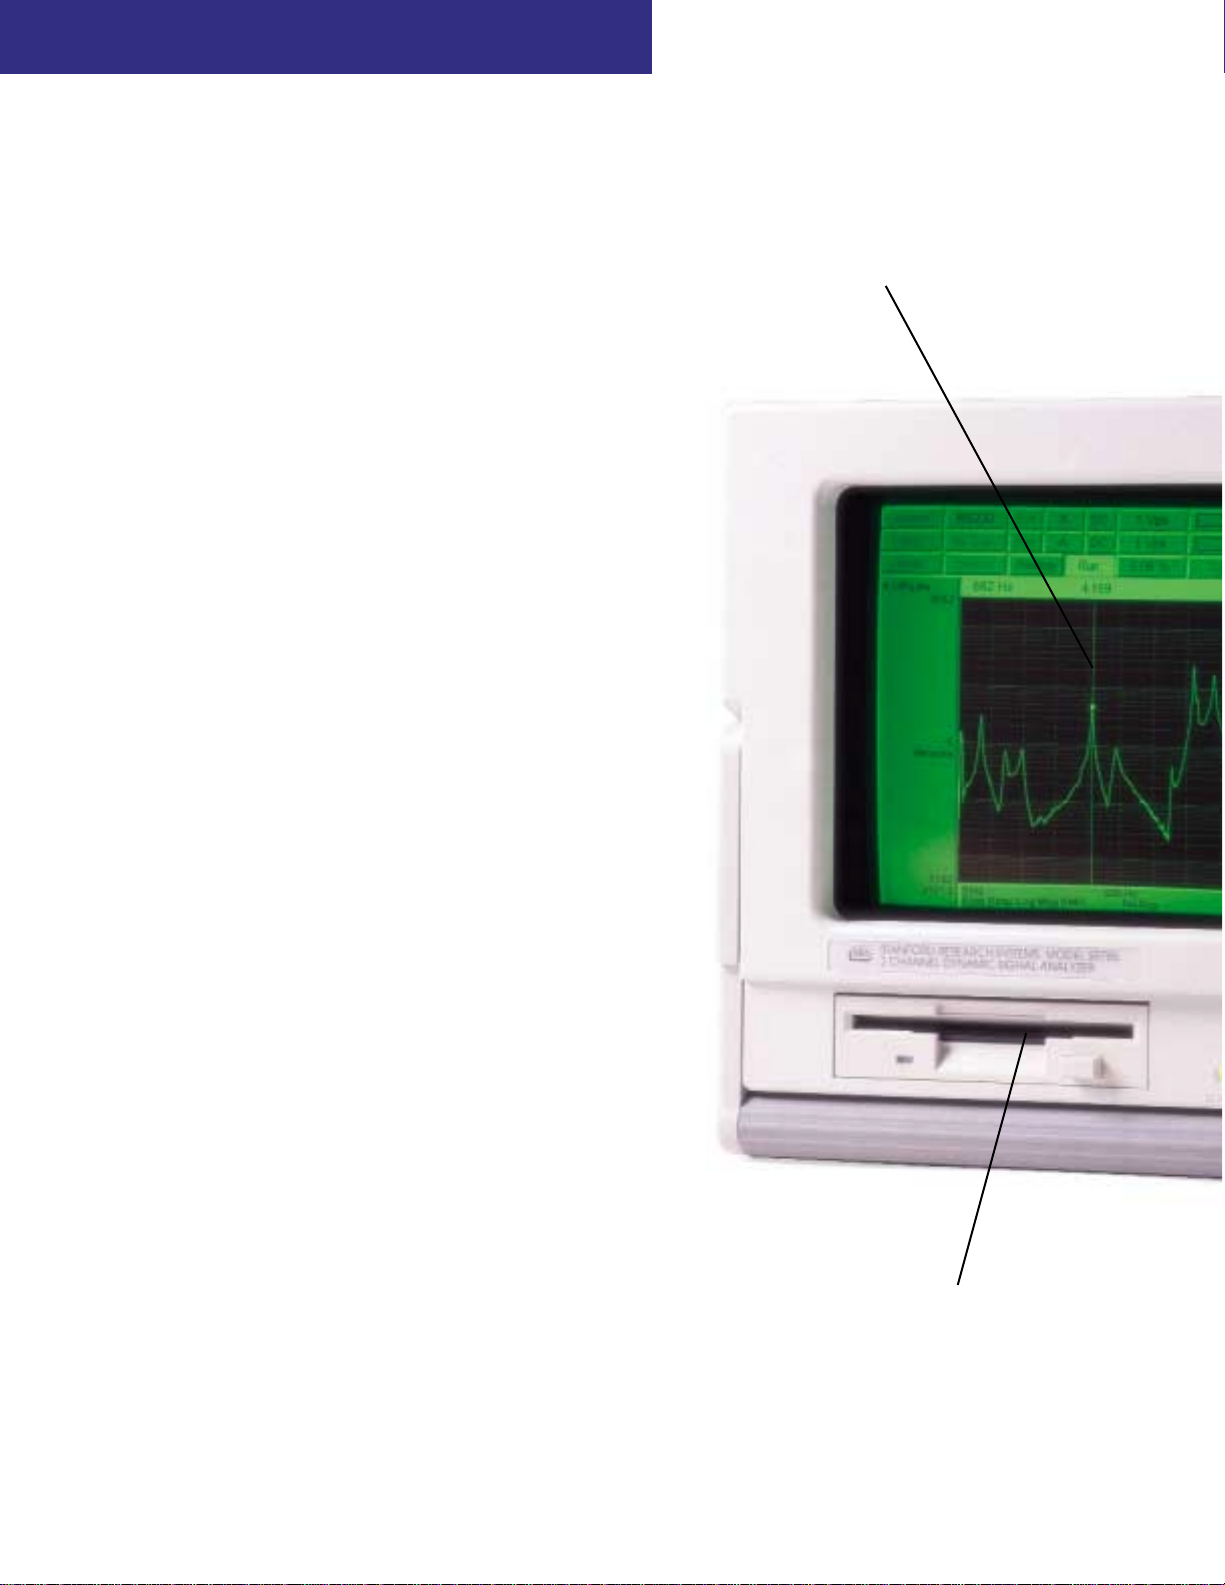
9" High Contrast CRT Display
800H x 600V resolution makes measurement
data easy to read.
$11,950
(U.S. list)
Features
●
FFT, Correlation and Order Tracking Measurements
●
ANSI Standard 1/1, 1/3, 1/12 Octave Analysis
●
Swept-Sine Mode (145 dB dynamic range)
●
20-pole/20-zero Curve Fit and Synthesis
●
Time/Histogram Mode
●
Windows95¨ DataViewer
●
Output to SDF¨, MAT¨, UFF, ASCII, PCX, GIF¨, PCL¨,
¨
Postscript
and HP-GL¨formats
Specifications
●
102.4 kHz frequency range on both channels
●
90 dB dynamic range (16 bit)
●
102.4 kHz real-time bandwidth
●
±0.2 dB accuracy
●
±0.05 dB channel match
●
100, 200, 400, 800 lines of frequency resolution
●
Source type: low distortion (-80 dBc) sine and
two-tone, swept-sine, white and pink noise,
burst noise, chirp, burst and arbitrary
3.5" DOS 1.44 Mbyte Disk Drive
Stores instrument setups, time capture data, waterfall data, trace data, data tables, limit tables, curve
fit/synthesis tables, math functions, arbitrary
source data and plotter/printer output data.
Page 3
Standard Measurement Modes
• FFT
• Swept-Sine
• Octave
• TIme/Histogram
• Order Tracking
• Time Capture
Fast Responsive Marker
• Find Max/Min or track peaks
• THD, THD + N
• Band, sideband, harmonic power
• Waterfall
• Frequency and damping
• Peak find
• Absolute and relative
• Statistics
On-Line Help
Locate information on any
topic, browse specifications,
examine remote commands all from the front panel.
PC (XT) Keyboard Input
Enter text and annotations
quickly and easily.
User Math
Build powerful custom
measurements by directly
entering equations.
Input Channels
• Dual ADCs provide 102.4 kHz bandwidth on both
channels simultaneously.
• -50 dBV max full scale input sensitivity
• Built-in ICP power supply for accelerometers
• Switchable analog A-weighting filters
• Engineering units
Page 4
SR785 Two Channel Dynamic
Signal Analyzer
FFT Spectrum Analysis
The SR785 Two Channel Dynamic Signal Analyzer is a
precision, full-featured signal analyzer that offers
state-of-the-art performance and a wide selection of features
at a price that's less than half that of competitive analyzers.
Building on its predecessor, the SR780, the SR785
incorporates new firmware and hardware that make it the
ideal instrument for analyzing both mechanical and electrical
systems. Whether your measurements involve modal analysis,
machinery diagnostics, vibration testing, servo systems,
control systems, or acoustics, the SR785 has the features and
specifications to get the job done. Standard measurement
groups include FFT, order tracking, octave, swept-sine,
correlation, time capture and time/histogram. The SR785
brings the power of several instruments to your application –
a spectrum analyzer, network analyzer, vibration analyzer,
octave analyzer and oscilloscope.
A unique measurement architecture allows the SR785 to
function as a typical dual channel analyzer with measurements like cross spectrum, frequency response, coherence,
etc. Alternatively, the instrument can be configured so that
each input channel functions as a single channel analyzer with
its own span, center frequency, resolution, and averaging.
This allows you to view a wideband spectrum and
simultaneously zoom in on spectral details.
The same advanced architecture provides storage of all
measurement building blocks and averaging modes. Vector
averaged, RMS averaged, unaveraged and peak hold versions
of all measurements are simultaneously acquired and can be
displayed without re-taking data.
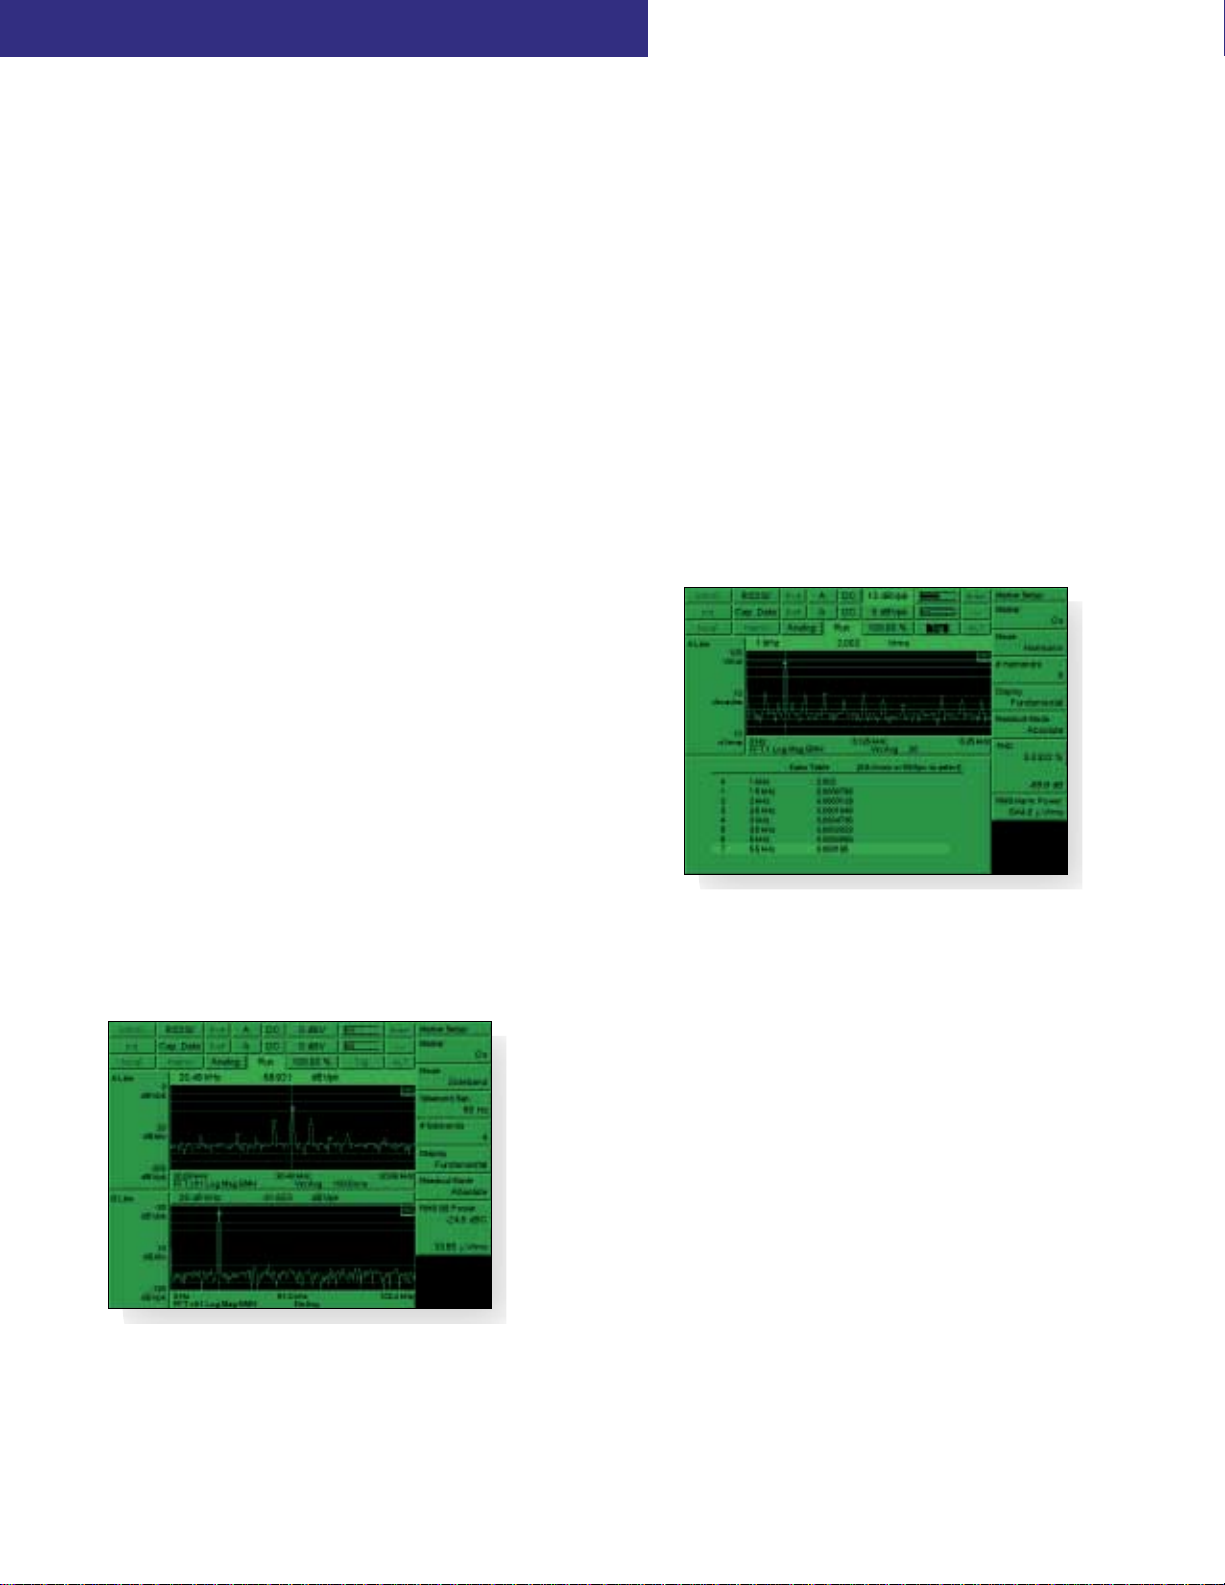
Use the SR785 to monitor the fundamental and
harmonics of your signal. Total harmonic power
and THD are calculated in real-time for fast,
accurate analysis.
Bottom display shows a wideband FFT, while the
top display shows a narrowband FFT of the same
signal. The sideband marker has been selected for
calculation of the total sideband power.
Averaging
The SR785 comes equipped with a wide selection of
averaging techniques to improve your signal to noise ratio.
Choose RMS averaging to reduce signal fluctuations, vector
averaging to actually eliminate noise from synchronous
signals, or peak hold averaging. In the order-tracking
measurement group, time averaging is available. Both linear
and exponential averaging are provided for each mode.
The SR785 is so fast, there's no need for a separate "fast
averaging" mode. Averaging is always fast, and the display
update rate is never sacrificed to increase the averaging rate.
For instance, in a full span FFT measurement with a 4 ms
Page 5
time record, 1000 averages take exactly 4 seconds, during
which the SR785 still operates at its maximum display rate.
For impact testing, the average preview feature allows each
time record or spectrum to be accepted or rejected before
adding it to the measurement.
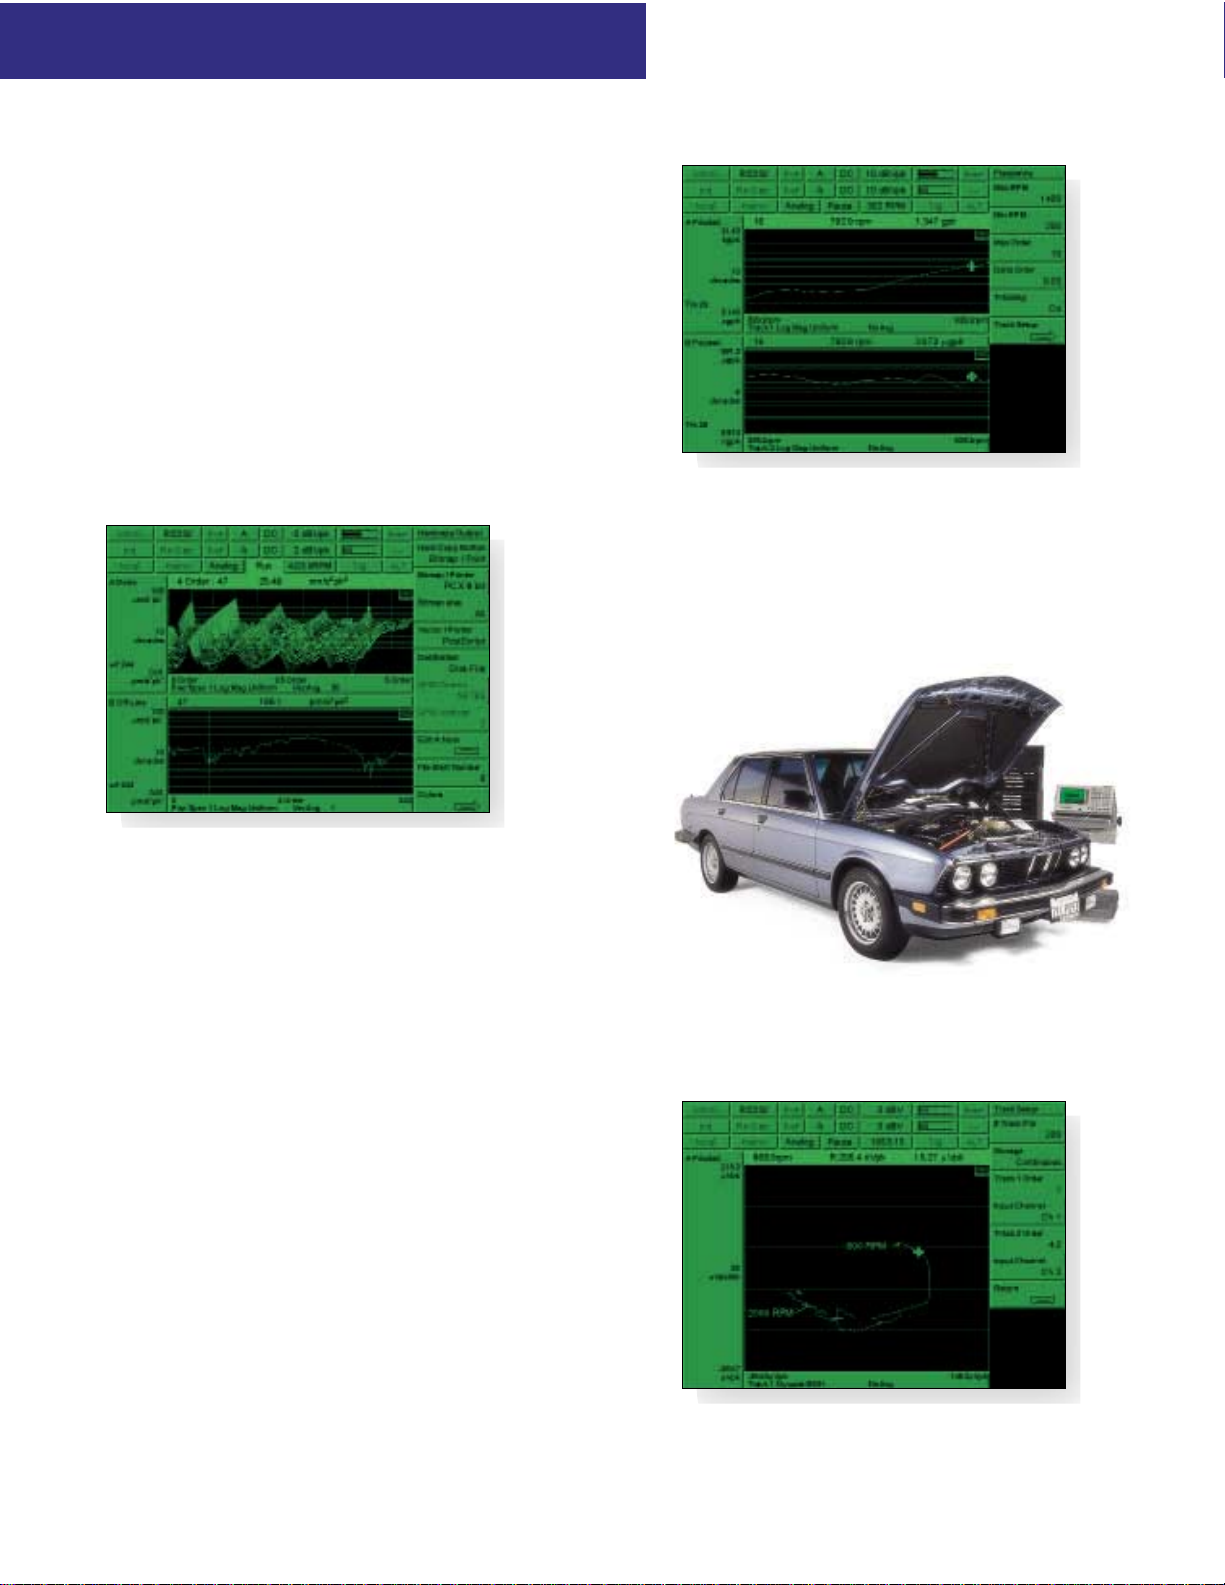
View order maps or track individual orders with the
SR785.
The SR785 tracks up to 400 orders simultaneously.
You can display the amplitude profile of any two
orders in tracked order mode.
Order Tracking
Order tracking is used to evaluate the behavior of rotating
machinery. Measurement data is displayed as a function of
multiples of the shaft frequency (orders), rather than absolute
frequency. Combined with a waterfall plot, the SR785
provides a complete history or "order map" of your data as a
function of time or RPM. Using the slice feature, the amplitude profile of specific orders in the map can be analyzed.
In tracked order mode the intensity of individual orders vs.
RPM is measured. Unlike other analyzers, there’s no need to
track a limited number of orders to ensure full speed
measurements. The SR785’s speed allows simultaneous
tracking of up to 400 orders.
Run-up and run-down measurements are available in both
polar and magnitude/phase formats. RPM profiling is
Run-up and run-down measurements in both polar
and bode formats are available.
Page 6

provided to monitor variations of RPM as a function of time.
And a complete selection of time and RPM triggering modes
is included allowing you to make virtually any rotating
machinery measurement.
Octave Analysis
Real-time 1/1, 1/3, 1/12 octave analysis at frequencies up to
40 kHz (single channel), or 20 kHz (2 channel) is a standard
feature of the SR785. Octave analysis is fully compliant with
ANSI S1.11-1986 (Order 3, type 1-D) and IEC 225-1966.
Switchable analog A-weighting filters as well as A, B and C
weighting math functions are included. Averaging choices
include exponential time averaging, linear time averaging,
peak hold and equal confidence averaging. Broadband sound
level is measured and displayed as the last band in the octave
graph. Total power, impulse, peak hold and Leq are all
available. Exponentially averaged sound power (Leq) is
calculated according to ANSI S1.4-1983, Type 0.
Octave displays can be plotted as waterfalls with a fast 4 ms
storage interval. Once data is stored in the waterfall buffer,
the SR785 can display centile exceedance statistics for each
1/1, 1/3 or 1/12 octave band as well as for Leq.
Swept-sine Bode plot of lowpass filter response. Top
display shows magnitude with an expanded view of
the passband response, while bottom display shows
the phase response.
Expensive options are a thing of the past with the
SR785. Real-time octave analysis is standard on
every unit.
Swept-Sine Measurements
Network analysis using FFT mode produces fast results but
suffers from limited dynamic range and frequency resolution.
Swept-sine mode is ideal for network analysis that involves
high dynamic range or wide frequency spans. Gain is
optimized at each point in the measurement producing up to
145 dB of dynamic range. A frequency resolution of up to
2000 points is also provided. Auto-ranging can be used with
source auto-leveling to maintain a constant input or output
level at the device under test (to test response at a specific
amplitude, for instance).
Auto-resolution ensures the fastest possible sweeps and
adjusts the frequency steps in the scan based on the DUT’s
response. Phase and amplitude changes that exceed
Page 7

user-defined thresholds are measured with high frequency
resolution, while small changes are measured using wider
frequency steps between points. A choice of linear sweeps
with high resolution, or logarithmic sweeps with up to eight
decades of frequency range is provided.
any portion of the signal can be played back in any of the
SR785's measurement groups except swept-sine. The
convenient Auto Pan feature lets you display measurement
results synchronously with the corresponding portion of the
capture buffer to identify important features.
Unit Conversion
Automatic unit conversion makes translating transducer data
easy. Enter your transducer conversion directly in V/EU,
EU/V or dB (1V/EU). The SR785 will display the result in
units of meters, inches, m/sec2, in/sec2, m/s, in/s, mil, g, kg,
lbs., N, dynes, pascals or bars. Built-in ICP®power means
you don’t need an external power supply for your accelerometer. Acoustic measurement results can be displayed in dBSPL,
while electrical units include V, V2, dBV and dBm.
Top display shows a histogram of time data. Bottom
display shows the cumulative density function.
Time/Histogram
Use the time/histogram measurement group to analyze time
domain data. A histogram of the time data vs. signal
amplitude is provided for accurate time domain signal
characterization. Statistical analysis capabilities include both
probability density function (PDF) and cumulative density
function (CDF). The sample rate, number of samples and
number of bins can all be adjusted.
Time Capture
The SR785 comes with 2 Msamples of memory (8 Msamples
optional). Analog waveforms can be captured at sampling
rates of 262 kHz or any binary submultiple, allowing you to
optimize sampling rate and storage for any application. For
example, 8 Msamples of memory will capture 32 seconds of
time domain data at the maximum 262 kHz sample rate, or
about 9 hours of data at a 256 Hz sample rate. Once captured,
Source
The SR785 comes standard with five precision source types.
Generate low distortion (-80 dBc) single or two-tone sine
waves, white noise, pink noise, chirps, and arbitrary
waveforms. The chirp and noise sources can be bursted to
provide activity over a selected portion of the time record for
FFT measurements, or to provide impulse noise for acoustic
measurements. The digitally synthesized source produces
Top display shows the burst noise source. Bottom
display shows an arbitrary waveform downloaded to
the SR785 via the IEEE-488 interface.
Page 8

output levels from 0.1 mV to 5 V and offsets from 0 to ±5 V,
and delivers up to 100 mA of current.
Arbitrary waveform capability is standard with the SR785.
Use the arbitrary source to playback a section of a captured
waveform, play a selected FFT time record or upload your
own custom waveform from your computer.
User Math
Create your own measurement in each of the SR785's
measurement groups using the math menu. Enter any equation
involving RMS averaged, vector averaged or unaveraged time
or frequency data, stored files, constants, or a rich array of
supplied operations including arithmetic functions, FFT,
inverse FFT, jω, d/dω, exp, ln x, and many others. Because all
the averaging modes are available as user math operands,
non-repeatable runout measurements (used in analyzing disk
drives) can be performed in a single pass by entering the
equation MAG(RMS<F1>)-MAG(Vec<F1>). Unlike many
other analyzers, the SR785's measurement rate is virtually
unaffected when user math is selected. For instance, the
function exp(ln(conj(FFT2/FFT1))) can be calculated with a
100 kHz real-time bandwidth.
Two 2k deep waterfall buffers ensure you’ll never
miss important waterfall data.
FFT, octave and order tracking measurements can be stored in
the SR785's waterfall buffer memory. You can choose to save
all measurements and averaging modes or just the current
measurement to conserve memory. Waterfall traces can be
stored every n time records for FFT and order tracking
measurements. For order tracking measurements new records
can be acquired at a specific time interval or change in RPM.
In octave measurements, the storage interval is in seconds (as
fast as every 4 ms). While displaying waterfall plots, you can
adjust the skew angle to reveal important features, or change
the baseline threshold to eliminate low-level clutter. Any
z-axis slice or x-axis record can be saved to disk or displayed
separately for analysis.
The SR785 doesn’t limit you to a few preselected
measurements. With user math you can create an
infinite variety of measurements.
Waterfall
Waterfall plots are a convenient way of viewing a time history
of your data. Each successive measurement record is plotted
along the z-axis making it easy to see trends in the data. All
Analysis
The SR785 includes a wide variety of built-in analysis
features. Marker analysis lets you easily measure the power
contained in harmonics, sidebands or within a given band of
frequencies. Important information such as THD, THD+N,
sideband power relative to a carrier, or total integrated power
are calculated in real-time and displayed on the screen. The
front/back display feature allows you to display live data from
both signal inputs on one graph. You can also simultaneously
display saved traces and live data. The peak-find marker
allows you to quickly locate frequency peaks with the click of
a button. The marker statistics feature calculates the
maximum, minimum, mean and standard deviation of data in
any section of the display. For modal analysis, the cursor can
be configured to display the resonant frequency and damping
of a single selected mode.
Page 9

Use data tables to display up to 100 selected data points in
tabular format. Limit tables allow you to define up to 100
upper and lower limit segments in each display for GO/NO
GO testing. Data and limit table definitions can also be saved
to and recalled from disk for quick setup.
Upper trace shows original frequency response
data. Lower trace shows curve fit to a portion of the
data.
Synthesis reverses the process: enter a model in any of the
above formats and the SR785 synthesizes the required curve.
The curve fit/synthesis menu allows you to change gain, delay
and frequency scale, set pole and zero locations and instantly
see the response of the modeled system.
Output
Curve Fit and Synthesis
The SR785 has a standard 20-pole, 20-zero curve fitter that
can fit frequency domain data from both the FFT and
swept-sine measurement groups. Curve models can be
displayed in pole/zero, pole/residue and polynomial formats.
Enter frequency response models in pole/zero, polynomial, or pole/residue format.
The SR785's built-in 3.5" 1.44 MB disk drive, GPIB and
RS-232 computer interfaces and Centronics printer port
combine to allow almost unlimited flexibility in saving,
printing, plotting or exporting your measurement data.
Displays and setups can be printed or plotted to disk, GPIB,
RS-232 or Centronics port in PCX, GIF, PCL (LaserJet®and
DeskJet®), dot-matrix, Postscript, HP-GL or ASCII formats.
An annotation editor lets you add text, time and date, or
filenames to any portion of the plot. For modal analysis
applications, nodal degree-of-freedom information is stored
with the data files to simplify transfer to external analysis
programs.
Data Conversion Utilities
The SR785 contains a complete suite of data conversion
utilities for both Windows®and DOS®operating systems.
These versatile utilities make data transfer to and from
external programs fast and simple. SR785 files can be
converted to ASCII for use with spreadsheets, or Universal
File Format (UFF) and HP SDF for use with modal analysis
programs. SR785 Files can also be converted to MAT file
format for use with MATLAB. Conversion from external file
types is also supported. Both HP SDF and SR780 files can be
converted to SR785 format.
Page 10

The SRS DataViewer Windows utility enables you to
view SR785 data files graphically and save them in
different formats.
DataViewer
The SRS DataViewer is a Windows 95 program that allows
you to quickly upload SR785 files into a graphical
environment, perform simple editing and cut and paste into
other applications. You can add pointers and text, change
scaling, and perform simple math operations. Graphs can be
saved in PCX, BMP or GIF formats.
Help
Full, context sensitive help screens for all SR785 features
means you will rarely have to refer to the user's manual.
Hypertext links let you quickly switch between related help
pages or instantly reference the remote command corresponding to any function. Use the help index to quickly locate
information on any topic, jump to the on-line troubleshooting
guide, browse a complete listing of the SR785's specifications, or examine a comprehensive description of the SR785's
remote commands ... all from the front panel.
Inside the SR785
The computational heart of the SR785 is an Analog Devices'
ADSP21020 32-bit floating point digital signal processor
which delivers a true 102.4 kHz real-time bandwidth on both
channels simultaneously – there's never a need to trade
bandwidth for number of channels. Two precision 16-bit
ADCs provide 90 dB dynamic range in FFT mode and 145 dB
dynamic range in swept-sine mode – enough for the most
demanding applications. With up to 800 lines of spectral
resolution, the SR785 allows you to zoom in on any portion of
the 476 mHz to 102.4 kHz range.
The Right Choice
The SR785 Two Channel Dynamic Signal Analyzer offers
more useful features and superior performance than
competitive analyzers and is priced considerably lower. For
more details on the SR785 and our other FFT analyzers, call
us at (408)744-9040, or visit our web site at www.srsys.com.
Page 11

SR785 Specifications
Specifications apply after 30 minutes of warm-up and within two
hours of last auto-offset. All specifications are with 400 line FFT
resolution and anti-alias filters enabled unless stated otherwise.
Cross Channel ±0.5 deg (dc to 51.2 kHz)
±1.0 deg (dc to 102.4 kHz)
(frequency response measurement, both
inputs on the same input range, vector
averaged)
Measurement Groups
Standard Groups FFT analysis, Correlation, Time
Histogram, Swept Sine
Optional Group Order Tracking
Frequency
Range 102.4 kHz or 100 kHz (both displays
have the same range).
FFT Spans 195.3 mHz to 102.4 kHz or 191 mHz to
100 kHz. The two displays can have
different spans and start frequencies.
FFT Resolution 100, 200, 400 or 800 lines
Real-Time Bandwidth 102.4 kHz (highest FFT span with con-
tinuous data acquisition and averaging).
Accuracy 25 ppm from 20 ˚C to 40 ˚C
Dynamic Range
Dynamic Range -90 dBfs typical, -80 dBfs guaranteed
(FFT and Octave)
-145 dBfs typical (Swept-Sine)
Includes spurs, harmonics, intermodu-
lation distortion and alias products.
Excludes alias responses at extremes of
span.
Harmonic Distortion <-80 dB (single tone in band)
Intermod. Distortion <-80 dB (two tones in band, each
less than -6.02 dBfs)
Spurious <-80 dBfs
Alias Responses <-80 dBfs (single tone outside of span,
less than 0 dBfs, less than 1 MHz)
Full Span FFT Noise 100 dBfs typical (input grounded, input
Floor range >-30 dBV, Hanning window,
64 RMS averages)
Residual DC Response <-30 dBfs (FFT with Auto Cal on)
Amplitude Accuracy
Single Channel ±0.2 dB (excluding window effects)
Cross Channel ±0.05 dB (dc to 102.4 kHz)
(frequency response measurement, both
inputs on the same input range, RMS
averaged)
Phase Accuracy
Single Channel ±3.0 deg relative to External TTL
trigger (-50 dBfs to 0 dBfs, freq
<10.24 kHz, center of frequency bin,
DC coupled). For Blackman-Harris,
Hanning, Flattop and Kaiser windows,
phase is relative to a cosine wave at the
center of the time record. For Uniform,
Force and Exponential windows, phase
is relative to a cosine wave at the
beginning of the time record.
Signal Inputs
Number of Inputs 2
Full Scale Input Range -50 dBV (3.16 mVpk) to +34 dBV
(50 Vpk) in 2 dB steps
Maximum Input Level 57 Vpk
Input Configuration Single-ended (A) or true differential
(A-B)
Input Impedance 1 MΩ + 50 pF
Shield to Chassis Floating mode: 1 MΩ + 0.01 mF
Grounded mode: 50 Ω
Shields are always grounded in
differential input (A-B)
Maximum Shield Voltage 4 Vpk
AC Coupling -3 dB rolloff at 0.16 Hz
CMRR 90 dB at 1 kHz (in. range <0 dBV)
80 dB at 1 kHz (in. range <10 dBV)
50 dB at 1 kHz (in. range ≥10 dBV)
ICP Signal Conditioning Current Source: 4.8 mA
Open Circuit Voltage: +26 V
A-Weight Filter Type 0 Tolerance, ANSI Standard
S1.4-1983; 10 Hz to 25.6 kHz
Crosstalk <-145 dB below signal (input to input
and source to inputs, 50 Ω receiving
input source impedance)
Input Noise <10 nVrms/√Hz (<-160 dBVrms/√Hz)
above 200 Hz
Trigger Input
Modes Free run, Internal, External, or External
TTL
Internal Level adjustable to ±100% of input
scale, positive or negative slope.
Minimum Trigger Amplitude: 5% of
input range
External Level adjustable to ±5 V in 40 mV
steps, positive or negative slope.
Input impedance: 1 MΩ
Max input: ±5 V
Minimum trigger amplitude: 100 mV
External TTL Requires TTL level to trigger
(low <0.7 V, high >3.0 V)
Post-Trigger Measurement record is delayed up to
100,000 samples after the trigger.
Pre-Trigger Measurement record starts up to 8000
samples prior to the trigger.
Tachometer Input
Pulses Per Revolution 1 to 2048
RPM Accuracy ±50 ppm (typical)
Tach Level Range ±25 V, ±5V, TTL
Tach Level Resolution 20 mV @ ±25 V, 4 mV @ ±5 V
Max. Tach Input Level ±40 Vpk
Min. Tach Pulse Width 100 nSec
Max. Tach Pulse Rate 750 kHz (typical)
Page 12

Transient Capture
Mode Continuous real-time data recording to
memory.
Maximum Rate 262,144 samples/sec for both inputs
Max. Capture Length 2 Msamples (single input)
8 Msamples with optional memory
Octave Analysis
Standards Conforms to ANSI standard
S1.11-1986, Order 3, Type 1-D.
Frequency Range Band centers:
Single Channel
1/1 Octave 0.125 Hz - 32 kHz
1/3 Octaves 0.100 Hz - 40 kHz
1/12 Octaves 0.091 Hz - 12.34 kHz
Two Channels
1/1 Octave 0.125 Hz - 16 kHz
1/3 Octaves 0.100 Hz - 20 kHz
1/12 Octaves 0.091 Hz - 6.17 kHz
Accuracy <0.2 dB (one second stable average,
single tone at band center)
Dynamic Range 80 dB (1/3 octave, two second stable
average) per ANSI S1.11-1986
Sound Level Impulse, Peak, Fast, Slow and Leq per
IEC 651-1979 Type 0
Flatness <0.25 dB pk-pk (typical),
<1.0 dB pk-pk (max), 5000 rms
averages
Pink Noise Source
Bandwidth DC to 102.4 kHz
Flatness <2.0 dB pk-pk, 20 Hz - 20 kHz
(measured using averaged 1/3 octave
analysis)
Chirp Source
Time Record Continuous or Burst
Output Sine sweep across the FFT span
Flatness ±0.25 dB, 1.0 Vpk
Swept Sine Source
Auto Functions Source level, input range and
frequency resolution
Dynamic Range 145 dB
Arbitrary Source
Amplitude Range ±5 V
Record Length 2 Msamples (playback from arbitrary
waveform memory or capture buffer).
Variable output sample rate.
Order Tracking
Resolution Up to 400 lines
Amplitude Accuracy ±1 dB (typ.)
Displays Order map (mag and phase), order
track (mag and phase), orbit
Curve Fit and Synthesis
Type 20-pole/20-zero non-iterative rational
fraction fit.
Output Format Pole-zero, polynomial, or pole-residue
Source Output
Amplitude Range 0.1 mVpk to 5 Vpk
Amplitude Resolution 0.1 mVpk
Offset Adjust ±5 V
Output Impedance <5 Ω, ±100 mA peak output current
Sine-Source
Amplitude Accuracy ±1% of setting, 0 Hz to 102.4 kHz
0.1 Vpk to 5.0 Vpk, high impedance
load
Harmonics, SubHarm. 0.1 Vpk to 5 Vpk
and Spurious Signals <-80 dBc (fundamental <30 kHz)
<-75 dBc (fundamental <102 kHz)
Two Tone Source
Amplitude Accuracy ±1% of setting, 0 Hz to 102.4 kHz,
0.1 Vpk to 5 Vpk, high Z load
Harmonics, SubHarm. <-80 dBc, 0.1 Vpk to 2.5 Vpk
General
Monitor Monochrome CRT, 800H by 600V
resolution, 8.2 inch diagonal display
Interfaces IEEE-488, RS-232 and Printer
interfaces standard.
All instrument functions can be
controlled through the IEEE–488 and
RS-232 interfaces. A PC (XT)
keyboard input is provided for
additional flexibility.
Hardcopy Print to dot matrix and PCL
compatible printers. Plot to HP-GL or
Postscript plotters. Print/Plot to
RS-232 or IEEE–488 interfaces or to
disk file. Additional file formats
include GIF, PCX and EPS.
Disk 3.5" DOS compatible format, 1.44
Mbytes capacity. Storage of displays,
setups and hardcopy data.
Preamp Power Power connector for SRS
preamplifiers.
Power 70 Watts, 100/120/220/240 VAC,
50/60 Hz
Dimensions 17"W x 8.25"H x 24"D
Weight 56 lbs.
Warranty One year parts and labor on materials
and workmanship.
White Noise Source
Time Record Continuous or Burst
Bandwidth DC to 102.4 kHz or limited to span
Page 13

SR785 Features
Auto/Manual Arming, GPIB, RPM Step, Time Step, Pre/Post
Trigger Delay
Instrument Modes
FFT, Time/Histogram, Correlation, Octave, Swept-Sine, Order
Tracking
Frequency Domain Measurements
Frequency Response, Linear Spectrum, Cross Spectrum, Power
Spectrum, Coherence, Power Spectral Density
Time Domain Measurements
Time Record, Cross Correlation, Auto Correlation, Orbit
Amplitude Domain Measurements
Histogram, PDF, CDF
FFT Resolution
100, 200, 400, 800 lines
Views
Linear Magnitude, Log Magnitude, dB Magnitude, Magnitude
Squared, Real Part, Imaginary Part, Phase, Unwrapped Phase,
Nichols, Nyquist, Polar
Units
V, V2, V2/Hz, V/√Hz, meters, meters/sec, meters/sec2, inches,
inches/sec, inches/sec2, mils, g, kg, lbs., N, dynes, pascals, bars,
SPL, user-defined engineering units (EUs)
Source Outputs
Sine, Two-Tone, Swept-Sine, White/Pink Noise, Burst Noise,
Chirp, Burst Chirp, and Arbitrary
Windows
Hanning, Blackman-Harris, Flat Top, Kaiser, Force/Exponential,
User-Defined, +/-T/2, +/-T/4, T/2, Uniform
User Math
+, -, *, /, Conjugate, Magnitude/Phase, Real/Imaginary, Sqrt, FFT,
Inverse FFT, jω, Log, Exp, d/dx, Group Delay, A, B, C
Weighting, x/x-1, Trace 1 – 4, Vector Average, RMS Average,
Peak Hold
Analysis
Harmonic, Band, Sideband, THD, THD + N, Limit Test with
Pass/Fail, Data Table, Exceedance, Statistics, Curve Fit and
Synthesis
Time Capture
Capture Time Data for later analysis (FFT or Octave). Up to 2
Msamples (8 Msamples optional) of data can be saved.
Storage
3.5”, 1.44 Mbyte, DOS formatted disk. Save data, setups and hard
copy data.
Displays
Single, Dual, Front/Back overlay, Waterfall with Skew, Zoom and
Pan, Grid On/Off
Marker Functions
Trace Marker, Dual Trace Linked Marker, Absolute and Relative
Marker, Peak Find, Harmonic Marker, Band and Sideband
Marker, Waterfall Marker, Frequency-Damping Marker
Averaging
RMS, Vector, Peak Hold, Linear, Exponential, Equal Confidence
(Octave), Preview Time Record, % Overlap Averaging, Overload
Reject
Triggering
Continuous, Internal, External (Analog or TTL), Source,
Hard Copy and Interfaces
Print to Dot Matrix or PCL (LaserJet and DeskJet) printers. Plot
to HP-GL or Postscript plotters. Print/Plot on-line (RS-232 serial,
Centronics parallel or IEEE-488) or to disk file. EPS, GIF, PCX
graphic formats also available for disk storage.
Data Conversion Utility
Data, waterfall and capture files can be converted to ASCII. Data
files can also be converted to Universal File Format, SDF format
or MATLAB MAT-File Format. SDF and SR780 files can be
converted to SR785 format.
DataViewer
Windows 95 based graphics program for viewing SR785 files.
Graphs can be pasted to the clipboard or saved in PCX, BMP or
GIF formats.
Page 14

Ordering Information
SR785 Two Channel Dynamic Signal Analyzer . . . $11,950
(includes manual, DataViewer,
disk utilities and power cord)
Option O785OT Order Tracking . . . . . . . . . . . . . . . . . . . . . . . Free (introductory offer)
Option O780RM Rack Mount Kit. . . . . . . . . . . . . . . . . . . . . . . $85
Option O780M1 8 Msample RAM. . . . . . . . . . . . . . . . . . . . . . call for pricing
Option O78012V 12 VDC-115 VAC Converter. . . . . . . . . . . . . $295
CT100 MobileCart . . . . . . . . . . . . . . . . . . . . . . . . . . $495
(All prices U.S. list)
12 VDC Converter
Designed to power the SR785 in the field when AC power is not available.
Specifications
Input Voltage 10 VDC to 15 VDC
Output Voltage 115 VAC true RMS ±5%
Max Cont. Output Power 200 W
Max Peak Output Power 300 W
Input No Load Current 0.34 A
MobileCART
The SRS CT100 MobileCART makes the SR785 truly portable. Its rugged
construction and full rack capacity will free up your valuable work space
and allow you to take the SR785 wherever you need to go.
Specifications
Tray Size 17" x 22" (tray accommodates one
full width rack mount instrument)
Maximum Tray Load 60 lbs.
Maximum Base Load 100 lbs.
Angular Adjustment Horizontal to 60¼
Weight 58 lbs.
SRS
STANFORD RESEARCH SYSTEMS
1290 D Reamwood Avenue ¥ Sunnyvale, CA 94089
Telephone (408)744-9040 ¥ FAX: (408)744-9049
Email: info@srsys.com ¥ WWW: www.srsys.com
Printed in USA ©1998 Stanford Research Systems, Inc. All specifications and prices subject to change (1/98)
All trademarks are the property of their respective owners.
 Loading...